Article

SI-traceable Spectral Irradiance Radiometric Characterization and Absolute Calibration of the TSIS-1 Spectral Irradiance Monitor (SIM)

Laboratory for Atmospheric and Space Physics, University of Colorado, Boulder, CO 80303, USA
*
Author to whom correspondence should be addressed.
Remote Sens. 2020, 12(11), 1818; https://doi.org/10.3390/rs12111818
Submission received: 30 April 2020 / Revised: 25 May 2020 / Accepted: 29 May 2020 / Published: 4 June 2020

Abstract

:
The current implementation for continuous, long-term solar spectral irradiance (SSI) monitoring is the Total and Spectral Solar Irradiance Sensor (TSIS-1) Spectral Irradiance Monitor (SIM) that began operations from the International Space Station (ISS) in March 2018 and nominally provides an SSI spectrum every 12 h. Advances in both instrument design and spectral irradiance calibration techniques have resulted in the TSIS-1 SIM achieving higher absolute accuracy than its predecessor instrument in the wavelength range (200–2400 nm). A comprehensive detector-based Spectral Radiometer Facility (SRF) was developed in collaboration with the US National Institute for Standards and Technology (NIST) to ensure the ties to spectral SI standards in power and irradiance. Traceability is achieved via direct laser calibration of a focal plane electrical substitution radiometer (ESR) against a cryogenic radiometer in power and also irradiance responsivity via calibrated apertures. The SIM accuracy definition followed an absolute sensor approach based on a full radiometric measurement equation where component-level performance characterizations and calibrations were quantified with an associated uncertainty error budget and verified by independent measurements for each parameter. Unit-level characterizations were completed over the full operational envelope of external driving factors (e.g., pointing and temperature ranges) and were allowed for the independent parameterization of sub-assembly performance for expected operating conditions. Validation and final instrument end-to-end absolute calibration in the Laboratory for Atmospheric and Space Physics (LASP)-SRF achieved low combined standard uncertainty (uc < 0.25%, k = 1) in spectral irradiance.

1. Introduction

Knowledge of the absolute solar spectral irradiance (SSI) and its temporal variation as a function of wavelength are critical to understanding the influence of the Sun’s output on the Earth’s atmosphere and climate [1,2]. The current implementation for continuous, long-term SSI monitoring is from the Spectral Irradiance Monitor (SIM) on the Total and Spectral Solar Irradiance Sensor (TSIS-1) mission that began operations from the International Space Station (ISS) in March 2018. The TSIS-1 SIM measurements (covering 200–2400 nm, an integrated region ~ 96% of the total solar irradiance) will secure the SSI data record continuity in the near-term. The Solar Radiation and Climate Experiment (SORCE) mission (passivated in February 2020) overlapped with the TSIS-1 mission for 2 full years. The TSIS-1 SIM instrument is the latest state-of-the-art solar spectral irradiance radiometer developed to meet the demanding long-term measurement requirements to quantify the input solar spectral signal and track SSI variability for the climate record [3].
The solar irradiance Environmental Data Record (EDR) requirements were originally specified in the NPOESS Integrated Operational Requirements Document (IORD) and updated in version II and in the NOAA Climate Sensors Project TSIS Requirements Document (see Table 1) [4,5]. Through these efforts, solar spectral irradiance (along with the total solar irradiance) is now recognized as an essential climate variable to emphasize the importance of accurate, long-term measurements for understanding past and present climate and to distinguish it from the higher latency, lower accuracy requirements of operational weather (short-term) data [6,7]. Solar spectral irradiance is now recognized as a thematic Climate Data Record [8,9]. The utility of this climate data record, developed from irradiance observations prior to the TSIS-1 era, was recently validated by comparisons with total solar irradiance observations over short (~1 month) to multi-decadal (space era) time scales [10]. For solar spectral irradiance, however, validation of the climate data record was only possible over ~1 month time scales for the ultraviolet through the mid-visible wavelengths implying that new satellite observations of sufficient accuracy and stability are necessary to better understand spectral irradiance variability from the visible through the near infrared and at all wavelengths over longer time scales.
To meet these demanding requirements, an extensive and rigorous characterization and calibration program began in the early phases of the SIM instrument definition. Instrument components and sub-assemblies were designed with characterization and calibration as a driving requirement. The SIM development followed that of an absolute sensor methodology where a detailed radiometric measurement equation is refined. Each independent contribution to the SIM measurement equation was quantified with an associated uncertainty error budget and verified (where possible) by direct characterization measurements for each parameter. These individual characterizations allowed for the full propagation of the measurement equation uncertainty, which then allowed for an SI-traceable, end-to-end validation. Not accounted for directly in the measurement equation error propagation were the unknown uncertainties associated with the interactions between subsystems. These uncertainties influence the overall absolute uncertainty of the full SSI radiometric model and were quantified at the full instrument-level end-to-end calibration against a cryogenic radiometer.
This approach offers a number of advantages over an uncorrelated, one-time end-of-assembly calibration transfer [11]. Firstly, unit-level characterization compliance is established by quantifying—through the geo-physical measurement equation—the individual parameter contributions to the uncertainty budget. The identification of areas of concern, where unit-level uncertainty limits may be approached or exceeded, allows for earlier risk mitigation. Furthermore, unit-level characterization compliance over the full operational envelope of external driving factors (e.g., platform induced pointing and temperature ranges) allows for an independent parameterization of on-orbit, sub-assembly performance. Ultimately, these unit-level characterizations minimize possible bias through correction of systematic effects and quantify the individual random measurement uncertainties that can be propagated through the full measurement equation. Finally, the unit-level measurement equation quantification, after validation in the end-to-end calibration, allows for the refinement of a full radiometric calibration model providing a truly SI-traceable uncertainty estimate valid and testable over the complete observational environment [12].
For the TSIS-1 SIM, the twice daily SSI is recorded by a series of photodiode detectors covering the UV to near IR range (200–1650 nm). However, the long-term maintenance of the calibration on-orbit relies on an electrical substitution radiometer (ESR). An ESR is a bolometric detector that compares the heating effect of absorbed optical radiation with that of electrical power heating via an accurate, high stability standard Watt circuit [13,14]. The calibration maintenance approach involves establishing pre-flight the ESR as an absolute detector and then using the Sun as the common calibration source on-orbit to periodically calibrate the photodiode response and track channel-to-channel optical degradation changes. This offers the unique advantage of adhering to the “like-to-like” rule of radiometry in that the solar calibration optical geometry is identical to the measurement optical geometry [15]. The ESR is established as an SI-traceable calibration standard detector by pre-launch spectral calibration against a cryogenic radiometer traceable to the US National Institute for Standards and Technology (NIST) Primary Optical Watt Radiometer (POWR), the principal US standard for radiant power measurements [16].
Rather than rely on calibration lamps (source-based) as accuracy standards [17,18], the SIM characterization and calibration involved developing new, state-of-the-art detector-based calibration facilities, in close partnership with the U.S. National Institute for Standards and Technology (NIST)—achieving and maintaining accurate and traceable measurements to meet the climate data requirements and provide the necessary tie to existing and future SSI data records. For example, recent developments in the techniques used to establish primary spectral radiometer scales make it possible to improve significantly the accuracy and traceability of spectral irradiance measurements and assure quantification of absolute measurement uncertainties near 0.1% [19,20,21]. A comprehensive Spectral Radiometer Facility (SRF) was developed at the Laboratory for Atmospheric and Space Physics (LASP, University of Colorado) in collaboration with NIST to ensure the ties to primary spectral SI standards in power and irradiance [3,21]. The traceability to SI is achieved via direct electrical substitution radiometer (ESR) detector calibration against a cryogenic radiometer either in power (W) responsivity (under-filled aperture) or irradiance (W/m2) responsivity (over-filled aperture). The present LASP-SRF has an absolute uncertainty of 0.018% in power (W) and an end-to-end absolute uncertainty of <0.15% in irradiance (W/m2) for laser illuminated instrument calibrations and validations operating in vacuum and at solar input power levels.

2. Method

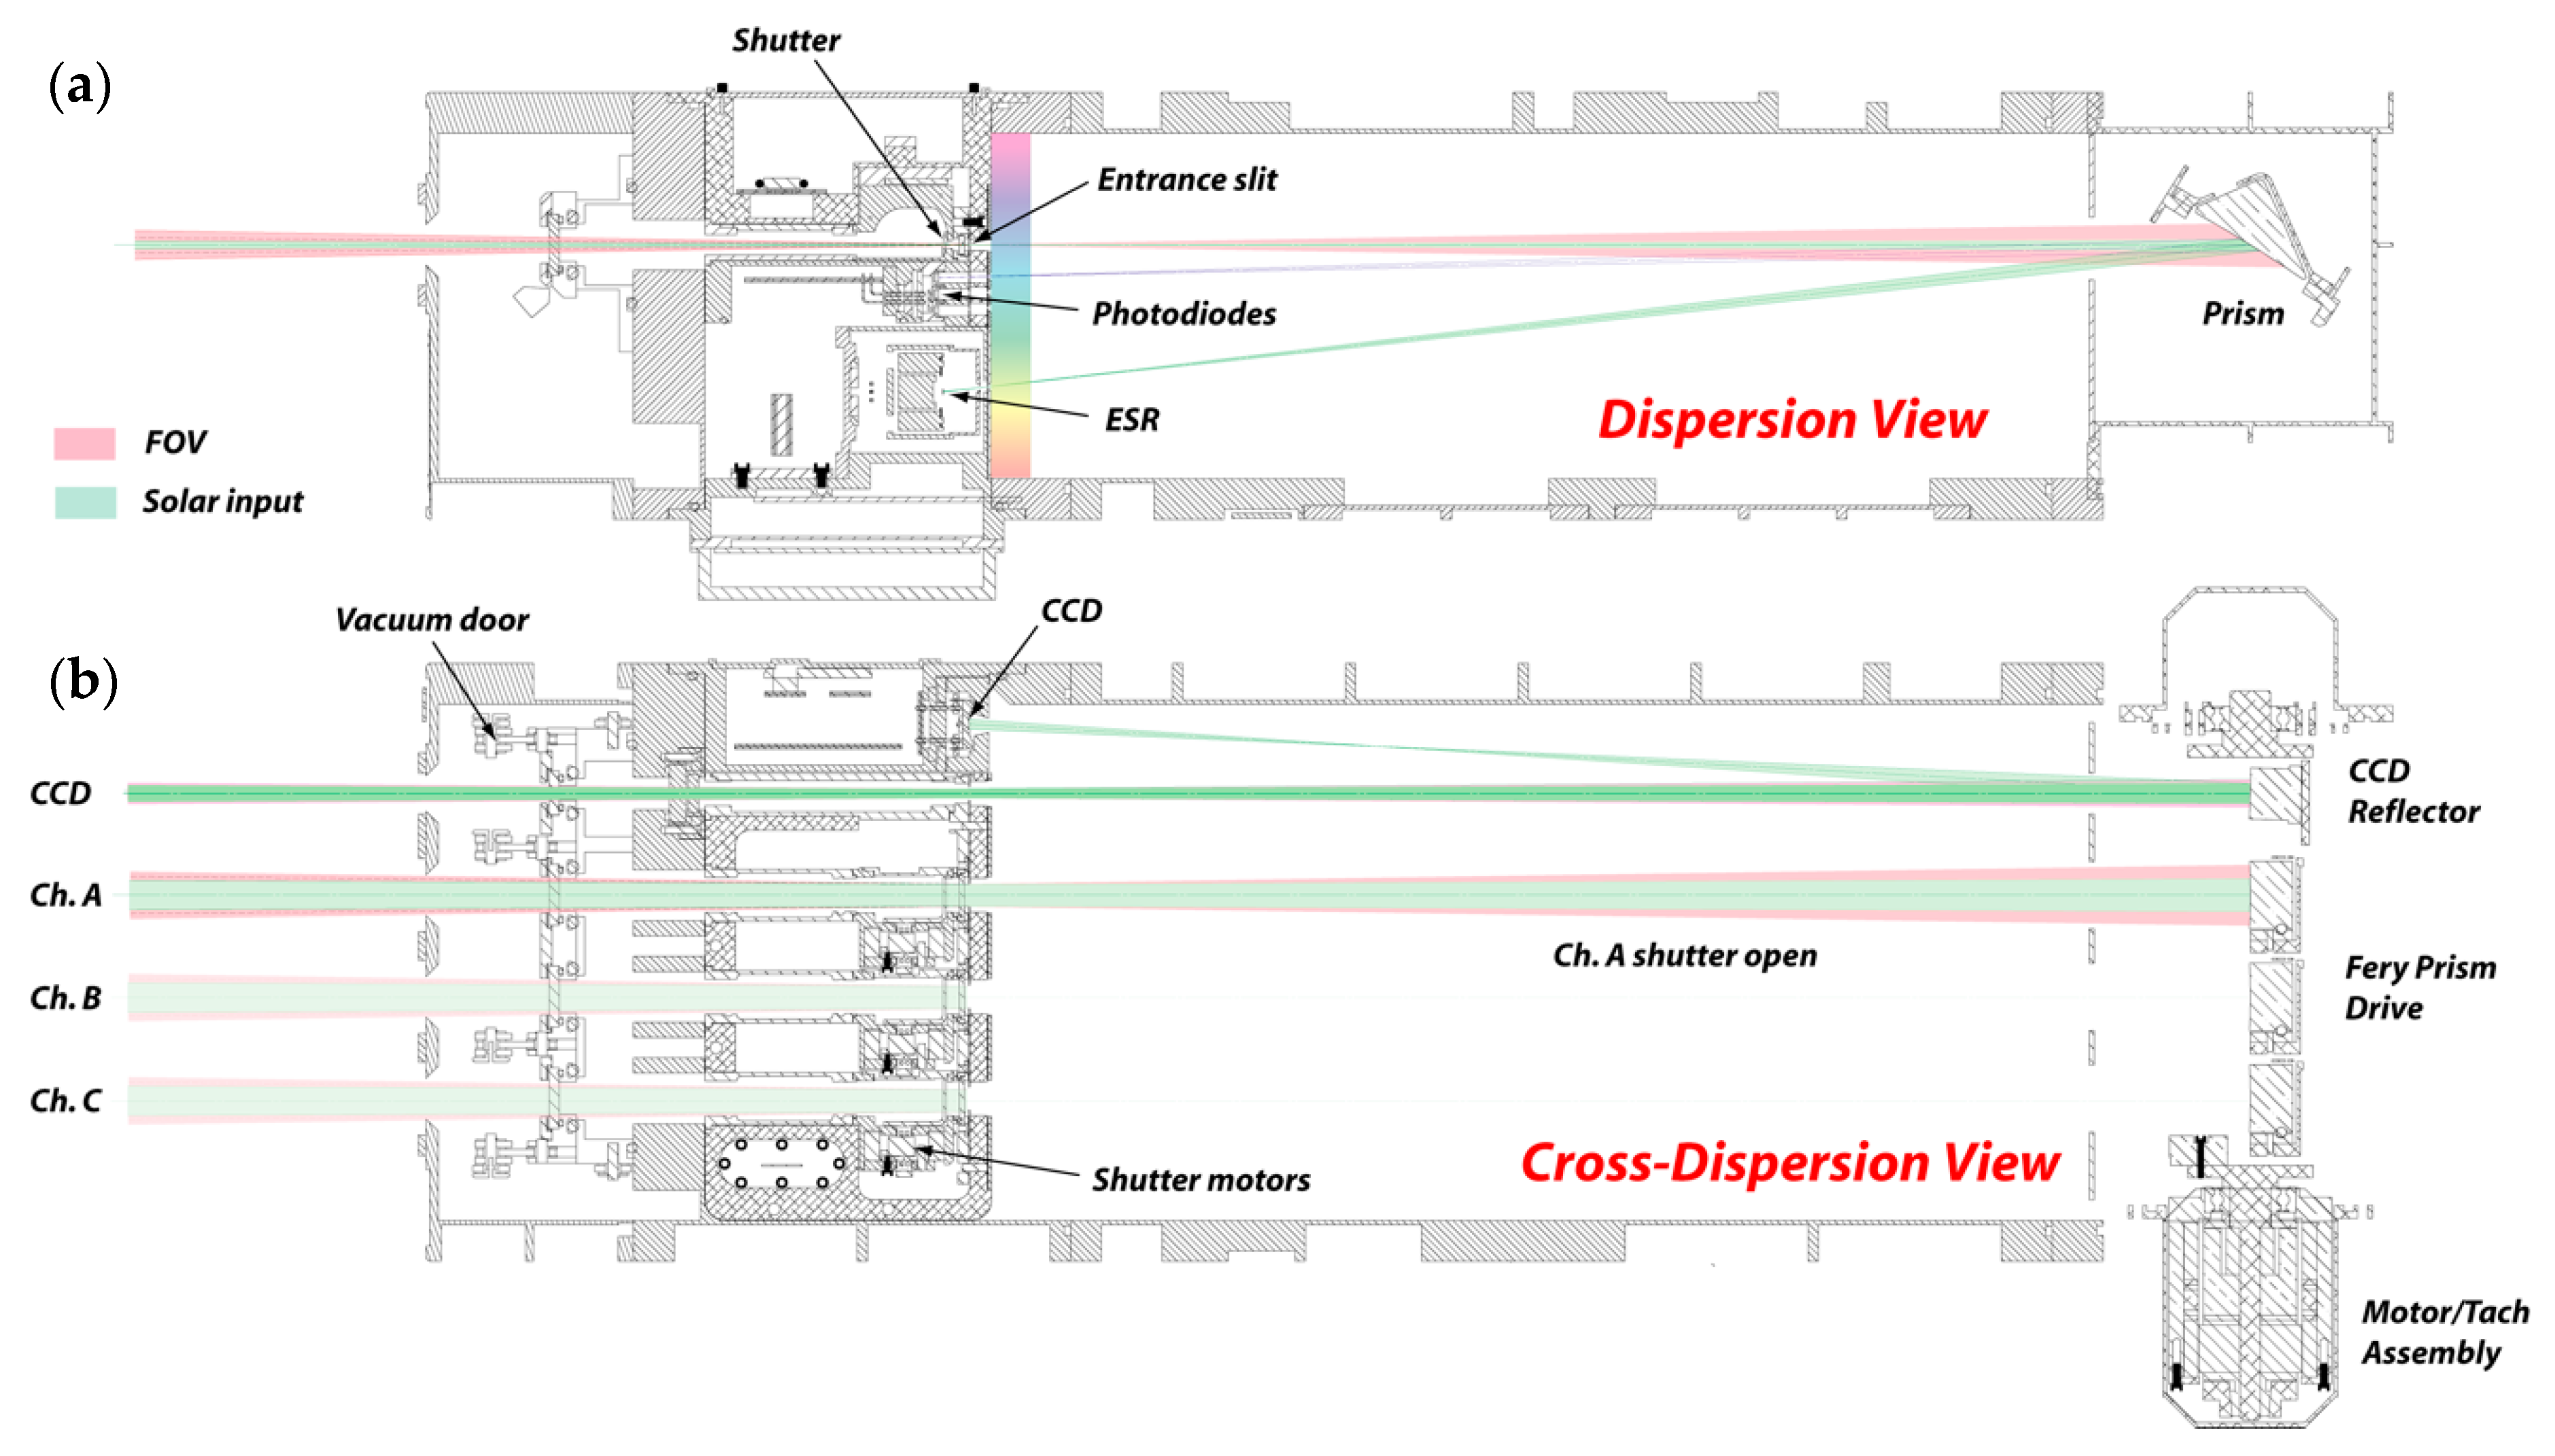
2.1. Spectral Irradiance Monitor (SIM) Overview and Measurement

SIM is a solar spectral irradiance radiometer designed to measure the solar spectral irradiance from 200 nm to 2400 nm. The solar spectral irradiance, E(λ), uses the unit Wm−2 nm−1, which is the more common unit to the SI unit definition from base and derived units, Wm−3. To derive the measurement equation for SIM we follow and quantify the radiation along the full instrument measurement path from source to measured output, as illustrated below. A detailed discussion of the full measurement equation is presented in Appendix A. The full optical path of the spectrometer is shown in Figure 1 for the dispersion view (a) and the cross-dispersion view (b).
The incoming, unfiltered solar radiation first passes through a NIST-calibrated aperture (entrance slit) of area A (mm2) converting the spectral irradiance into spectral power, E(λ)A, units of W nm−1. After passing through the entrance slit, we account for all of the wavelength, λ, and polarization (p)-dependent optical losses that occur along the full optical path of the radiation through the prism, baffles, exit slits, and eventually onto each detector. The primary detector for maintaining the accuracy and long-term stability is a bolometer paired, null balanced Electrical Substitution Radiometer (ESR). These ESR absolute detectors have considerable heritage for total and spectral irradiance measurements [22,23]. They provide accurate optical power detection, exhibit flat spectral response, and have been demonstrated to be robust to on-orbit degradation.
The two dominant optical throughput losses are the system diffraction, D(λ), and the full prism transmission, T(λ,p). The diffraction is dependent upon the entrance slit dimensions and the baffle widths and positions. The total prism transmission includes all Fresnel surface reflections, internal aluminum (second-surface) reflection, and bulk material absorption losses. Other spectral factors that are of concern are the prism surface scattered light and stray light. The SIM prisms are made from Suprasil 3001 optical 3D fused silica [24]. The spherical surfaces of the Féry prisms are super-polished to ~1Å (rms) measured surface roughness and have been shown through independent measurements to suppress surface scattered light contributions to extremely small ratios (<10−6). Stray light contributions are quantified separately at the instrument level and, where necessary, include explicit wavelength corrections from independent measurements.

2.2. SIM Spectral Irradiance Measurement Equation

The measurement equation for the ESR detected spectral power, in W, through the optical system including wavelength and polarization dependencies is
P ( λ , p ) σ ( λ ) = E ( λ ) · A slit · D ( λ ) · T ( λ , p ) Δ λ
In this equation, the detected power, 𝒫(λ,p), is corrected by a unitless spectral efficiency factor α(λ) directly calibrated against a NIST traceable cryogenic radiometer through comparative measurements in optical geometry representative of the ESR configuration at the SIM focal plane—it represents the optical efficiency of the ESR bolometer to collect photons after the exit slit. E(λ) is the incoming solar spectral irradiance, Aslit is the area of the entrance aperture (NIST-calibrated), D(λ) is the full system diffraction loss, T(λ,p) is the total prism transmission loss, and ∆λ is the optical spectral passband for a central wavelength at the ESR. The spectral passband is measured directly and defined by the focal plane convolution of the entrance slit image with the physical exit slit width. All of the polarization dependence in the prism transmission function, T(λ,p), is due to the spectral Fresnel reflection and transmission coefficients associated with the incidence angle and refractive index of the prism. There is also a temperature dependence on the prism transmission due to the change in index of refraction with temperature, affecting both wavelength scale and Fresnel coefficients. This is explicitly calculated in the index correction based on the measured prism temperature.
For incoming solar radiation, we reduce this polarization dependence in the final SSI measurement equation to the polarization average, Tavg(λ), since the full disk integrated incoming solar radiation is non-polarized. However, we will keep the explicit polarization dependence here since the full spectral calibrations involve highly polarized lasers and both polarizations become important in quantifying the full measurement equation to derive Tavg(λ). Additionally, there are external factors that will affect both, D(λ) and T(λ,p) such as pointing, fp(θ,φ), and field-of-view corrections, fFOV. Knowledge of these on-orbit corrections are required because they affect the optical throughput due to changes in optical incidence angle at the prism (Fresnel corrections) and relative changes in optical baffle alignments (diffraction corrections). The fFOV corrections are quantified through analysis and verified with direct off-axis calibration to complete the full SIM radiometric model. For example, pre-launch off-axis calibrations are used to determine the angular cut-off edges for each detector as a function of optic axis pointing. After launch, during early commissioning activities, these cut-off edge positions are directly measured during solar off-pointing scans and correlated to the pre-launch values where corrections can be applied based on the calibrated pre-launch off-axis measurements. After launch, three additional time-dependent factors become important, the 1 AU Earth–Sun distance correction, f1AU(t), the line-of-sight Doppler velocity correction, fDopp(λ,t), and the spectral degradation correction, fdeg(λ, t). These factors are discussed in more detail later.
The detected power of the ESR, can be expressed in data numbers (DN) through the ESR-specific measurement equation (Equation (2)).
P E S R ( D N ) = V r e f 2 · R H ( R H + R S ) 2 · D N 64000
This DN value is directly related to optical power through the ESR standard Watt circuit involving the replacement heater and the precision voltage reference and precision resistors. The replacement power is applied through a Pulse Width Modulated (PWM) duty-cycled circuit that linearly changes from 0% (DN = 0) to 100% (DN = 64000).
Details of this specific ESR technique have been discussed previously [22,23]. Briefly, when power is applied to the bolometer heater resistor, a +7.1 V voltage reference is applied to the series combination of the precision set resistor, Rs, and the bolometer serpentine heater resistor, RH. The bolometer heater is 100 kΩ, therefore the maximum power applied to the ESR is ~126 μW. The ESR balance of this heater power is maintained by pulse-width modulation (PWM): the applied voltage, rather than DC, is a 100 Hz square wave with linearly variable duty cycle. To apply full power, the duty cycle is 100%. To apply half-power, or about 63 μW, the duty cycle is adjusted to 50%. There are two significant benefits to this technique. First, the duty cycle can be controlled by adjusting the duty cycle of a TTL signal, and therefore controlled digitally. Digital timing control is very accurate so fine adjustments of the duty cycle are straightforward. The second advantage of this technique is that the applied power is linear with respect to duty cycle. This allows the gain of the closed loop servo system to remain constant over the full power range. The applied power output change per DN is
d P E S R d   D N = V r e f 2 64000 · R H ( R H + R S ) 2 1.96   nW / DN
As shown in Appendix A, the final measurement equation for the ESR detector for the SIM ESR measured spectral solar irradiance, ε(λ), in W m−2 nm−1 is expressed as
ε ( λ ) c = E ( λ ) σ ( λ , c ) d λ = D N ( c ) A · D ¯ ( λ ( c ) ) · T ¯ ( λ ( c ) ) · G ¯ ( λ ( c ) ) · W ( λ )
where here the index c denotes a focal plane encoder position that determines the prism incidence angle to a resolution of ~0.5 arc-sec [14]. The prism angle therefore defines (through the refraction ray-trace) the central wavelength for a given detector position. In the denominator, W is the passband term defined by the physical exit slit width in terms of wavelength coordinates at the focal plane, determined by the directly measured spectral response functions (to be discussed). The term G contains all of the static and spectrally dependent corrections, including α(λ), used to convert the measured DN to ESR detected power discussed in Equation (2) as discussed.
The final measurement equation is the basis for developing and maintaining the full spectral radiometric model that includes time-dependent performance corrections. The full calibration tie to SI-traceability is maintained by the periodic verification of the spectral radiometric model during the pre-launch timeframe. For completeness, the corresponding measurement equation for the higher cadence photodiode detectors is the following
ε ( λ ) c = 1 R f [ V ( λ ( c ) ) S u n V ( λ ( c ) ) D a r k ] A · R ¯ ( λ ( c ) ) · T ¯ ( λ ( c ) ) · D ¯ ( λ ( c ) ) · W ( λ )
where V/Rf is the measured solar photocurrent and R(λ) is the detector radiant sensitivity in units of A/W. All photodiode radiant sensitivities are calibrated, pre-launch, directly against the CR in power mode and then recalibrated periodically, on-orbit, with the ESR.
As mentioned previously, once on-orbit there are several efficiency correction factors to the measured irradiance that relate to operational spacecraft ephemeris parameters (distance and velocity), field-of-view corrections (FOV), and solar exposure-related optical transmission degradations. On-orbit, the final SSI involves correction factors, as follows:
E S u n ( λ , t ) = ε λ ( λ s , t ) f 1 A U ( t ) · f D o p p ( λ , t ) · f F O V ( λ , t ) · f D e g ( λ , t )

3. Results

3.1. Irradiance Traceability through the LASP SRF

For the SIM instrument, we rely on a measurement equation approach that allows for the complete quantification of measurements by detailed characterization and calibration of the unit-level uncertainty contributions. To validate this and establish the total system uncertainty compliance, we perform a direct comparison in the SRF to an L-1 Standards & Technology, Inc. cryogenic radiometer (CR), a detector-based primary standard. The L-1 CR scale is traceable to the NIST Primary Optical Watt Radiometer though periodic NIST-calibrated Si trap transfer standards. For the LASP-SRF irradiance implementation, a NIST-calibrated entrance slit of identical dimensions to the SIM entrance slit is mounted directly ahead of the L-1 CR active cavity. This allows for a direct irradiance measurement (W/m2) of the stabilized laser light. These Si trap calibrations are done periodically throughout the span of the 5-year pre-flight characterizations and calibrations. In the SRF, the L-1 CR is coupled to a large vacuum enclosure that allows for direct comparison to the instrument. The instrument (SIM) is mounted on a precision 5-axis manipulator that allows for independent pitch, roll and yaw control (full FOV mapping) as well as × and y axis (dispersion and cross-dispersion) alignment positioning (z-axis is the optic axis).
A laser system provides light stabilized in frequency and intensity from 206 nm through 3000 nm. This laser system is based on the NIST Spectral Irradiance and Radiance Responsivity Calibrations with Uniform Sources (SIRCUS) approach that utilizes a main Ti:Sapphire laser with frequency doubling, tripling, and quadrupling crystals for generating shorter wavelengths as well as an optical parametric oscillator system (OPO) to coherently down-convert pump frequencies to generate tunable near and shortwave IR light. [21]. For the LASP-SRF laser systems, the common pump laser is an 18W 532 nm output Nd:YVO4 pump laser (Coherent Verdi V-series). This laser pumps a mode-locked Ti:Sapphire laser that can be operated in picosecond (ps) or femtosecond (fs) mode. The repetition rate is 75 MHz and generates <130 fs pulses in femtosecond mode-lock or < 2 ps pulses in picosecond mode-lock. Mode locking is required for generating harmonic UV conversion or IR OPO down conversion because of the non-linear optical efficiency dependence on pulse peak power; these ultra-short pulses generate the high instantaneous peak power required for efficient optical conversion. Because of the large transform-limited spectral linewidth of femtosecond mode-locking, all of the SRF measurements requiring non-linear mixing frequencies are completed in picosecond mode [25]. In picosecond mode-locking, the laser linewidth is approximately a factor of 10 narrower than the SIM spectral resolution.
Figure 2 shows an overview diagram of the LASP SRF system in laser irradiance calibration mode (a) where the laser spectral irradiance is measured directly by the CR and in instrument calibration mode and (b) where this calibrated laser irradiance is directed into the instrument for direct measurement. No additional optics are introduced between the CR measurement and the instrument measurement; the single vacuum window is common to both measurement configurations. A single ±45° turning mirror on a rotation stage (rotation accuracy of 0.006° and rotational repeatability of 0.003°) is the vacuum optic that allows for rapid conversion between measurement modes. Responsivity differences due to the mirror position for these two measurement modes were directly calibrated based on trap comparisons and found to be < 200 ppm (±40 ppm).
The turning mirror is 50 mm in diameter and UV enhanced aluminum coated to cover the full 200–2400 nm region [26]. It is controlled by a high-resolution rotation stage (stage accuracy is 0.023°) that accurately rotates to +/- 45.00° [27]. The reflection sensitivity at the 45° incidence angle is ~0.15% per degree and with a stage accuracy of 0.023° this results in a CR-to-SIM optical path power difference from the mirror of 35 ppm. The fabrication and assembly of the mirror to the rotation stage to tight tolerances ensures the surface of the mirror is coincident with the axis of rotation to < 50 µm—this corresponds to a rotation induced laser optical path translation at the mirror surface of < 100 µm.
Figure 3 shows details of the laser control and stabilization optics prior to entrance to the SRF vacuum chamber through the common-mode fused silica vacuum window. All laser frequencies, intensities and polarization stability are monitored and maintained throughout all measurements in both CR and SIM mode configurations. Typical measurement times take several hours and include instrument on-axis and off-axis (dispersion and cross-dispersion FOV) measurement scans. For a complete measurement cycle per wavelength, the CR measurements bracket these SIM instrument scans.

3.2. Cryogenic Radiometer to NIST Si Trap Calibration Transfer

To ensure the power traceability of the SRF CR to primary detector-based scales, we utilized NIST-calibrated Si trap secondary transfer standards. To perform this CR to Si trap calibration, we use the SRF facility as shown in Figure 2 above with the traps located on a positional stage at the SIM instrument location. The procedure involves several alignments that first center the stabilized laser beam on the CR by finding the half-power points on the vertical and horizontal edges of the 5-mm diameter aperture. The angular alignment of the trap was performed by ensuring the trap alignment mirror (mounted on the trap housing) was normal to the in-coming beam. The trap was then positioned so that its aperture was centered on the beam, again by finding the half-power points in vertical and horizontal axes.
Power measurements with the CR are completed using both s- and p-laser polarizations, and these are then completed with the trap through rotation of the transfer mirror. These CR bracketed measurements are performed, with occasional laser re-centering, for three power levels: ~100, 200, and 420 µW. We then translate to the other trap and repeat the whole measurement. The plots shown in Figure 4 summarize the results of the CR to Si trap measurements spanning three separate calibration campaigns, including an initial transfer to a NIST CR secondary standard initially installed in the LASP-SRF in 2012.
The combined value is the weighted average of the four measurements of two traps (one and three) and both s- and p-polarizations (zero and one). The combined uncertainty is the standard deviation of the four measurements. Table 2 summarizes the results spanning four years.

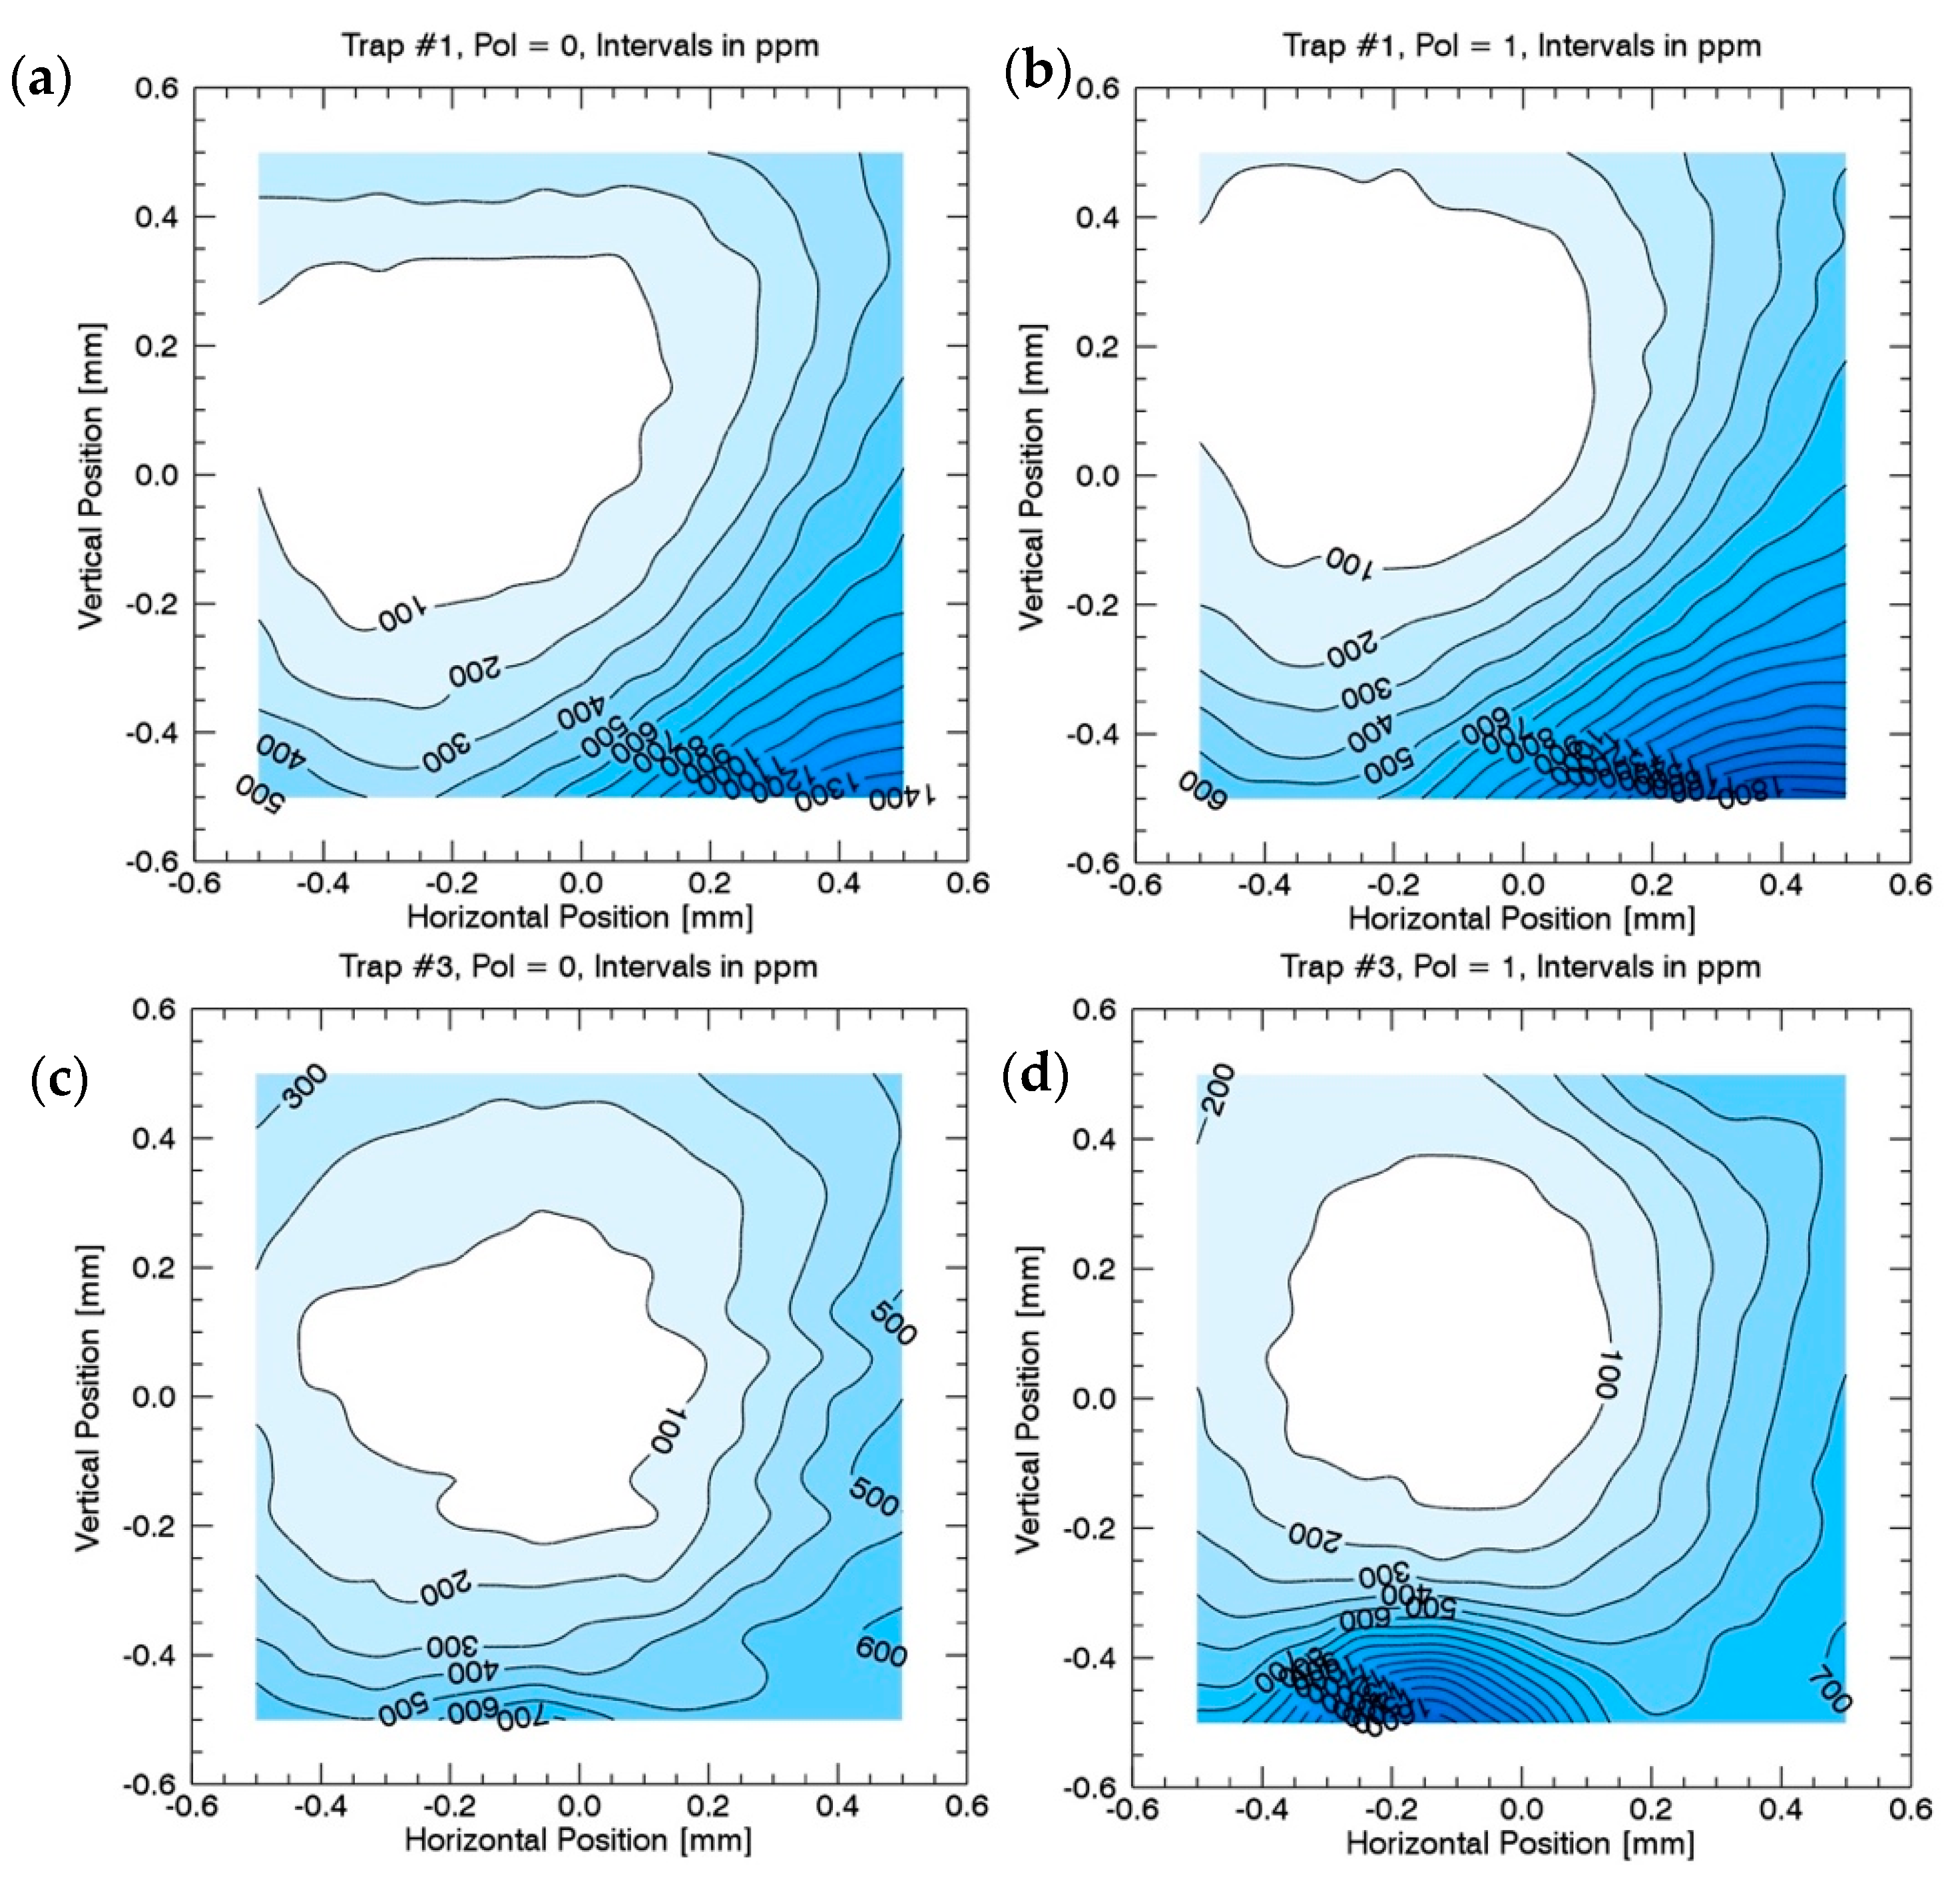
3.3. Si Trap Uniformity

In order to understand the sensitivity of our CR transfer-to-trap alignment we measured the spatial and angular response uniformity maps of the Si traps. The center of the trap was defined by center of the 5-mm aperture. The angular normal (or center) was defined by an alignment mirror fixed to the front surface of the trap assembly. The laser beam remained stationary and the positional manipulator moved the traps. These positional maps were all performed in a vacuum.
The spatial mappings for both laser polarizations are shown in Figure 5 and they were used to determine the final alignment positions to perform a 100-ppm uniformity measurement. To characterize the maximum uncertainty associated with a positioning accuracy, an analysis was performed on the maps, where the maximum error for a given displacement was determined.

3.4. Cryogenic Radiometer Standard Watt

Both the NIST and LASP-SRF CR are L-1 Technologies radiometers and were used to perform the absolute optical power measurements. The internal CR power linearity and uncertainty are verified against a commercial KeySight Technologies 3458A digital multimeter that has 8-ppm 1-year direct current voltage (DCV) accuracy [28]. Table 3 summarizes the power calibration scale linearity and standard Watt uncertainty over a range of 1 µW to 2 mW; these power levels span the SIM detected solar power levels (with the exception of the shortest UV wavelengths). The typical direct power uncertainties of the SRF CR measurements are 150 ppm.

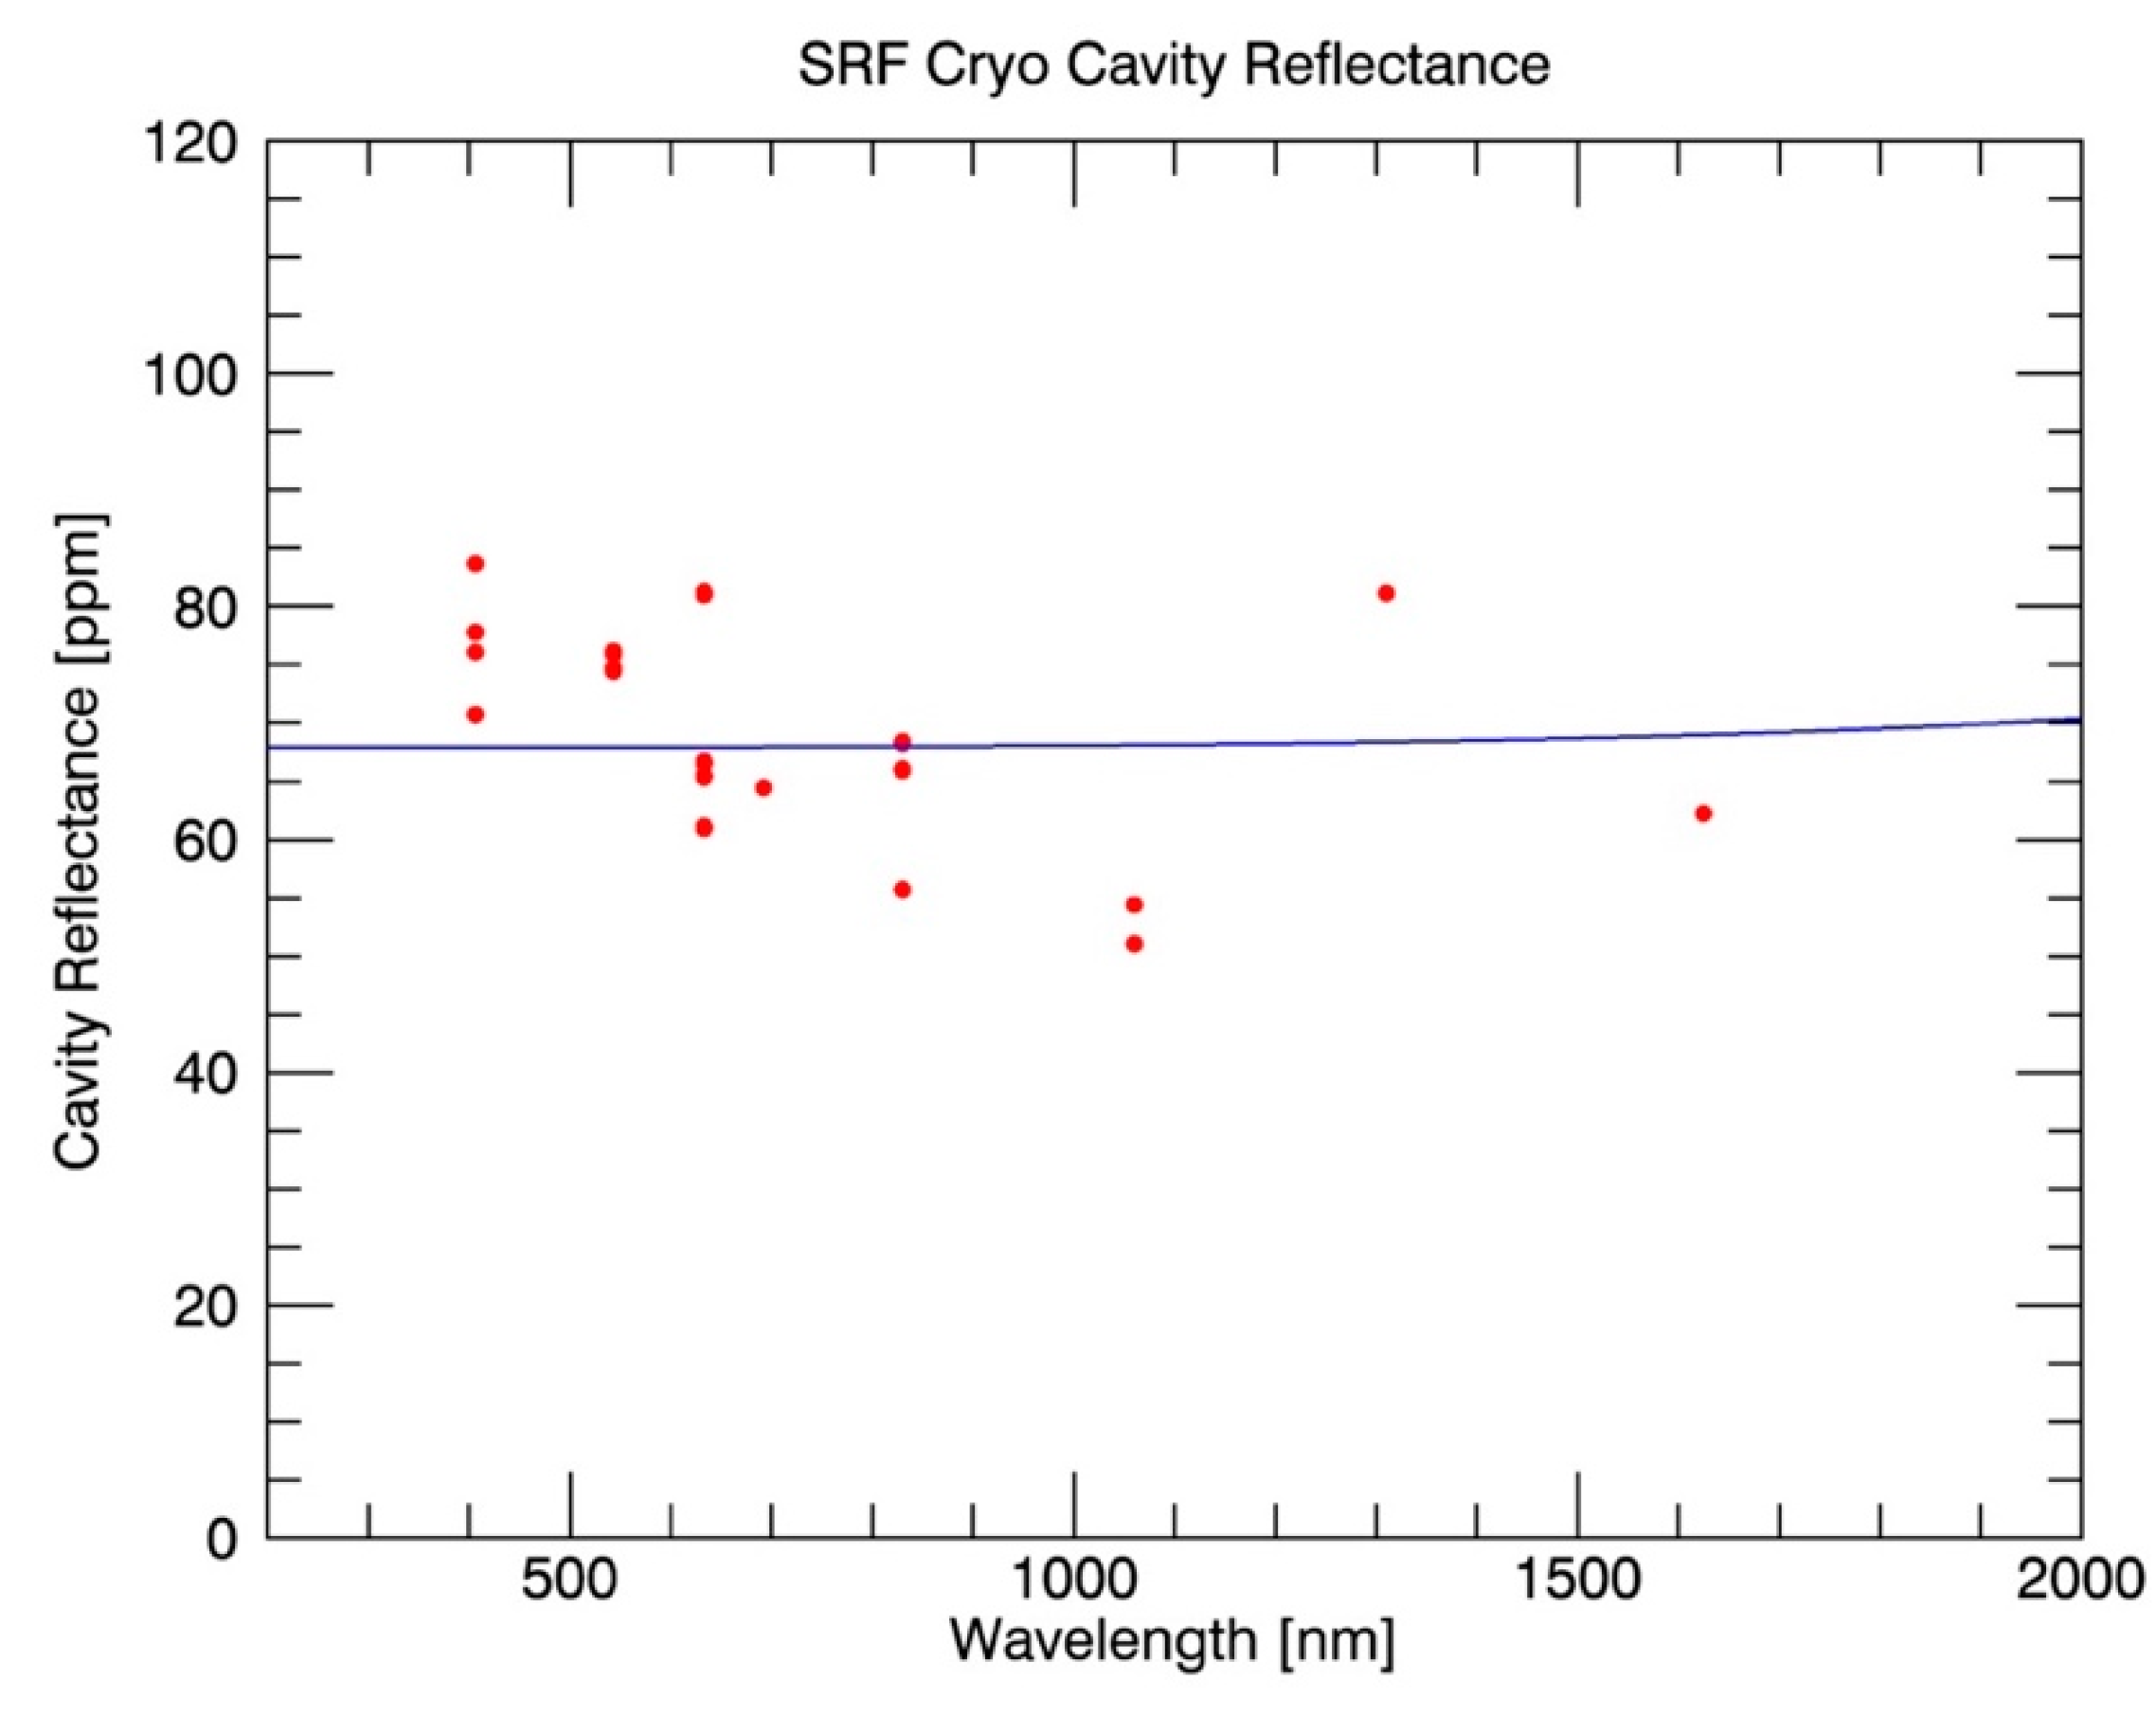
3.5. Cavity Reflectance Uncertainty

The cavity spectral absorptivity was quantified using the LASP cavity characterization facility for TSI radiometer cone cavity measurements [29]. These characterizations are performed by direct cavity reflectance measurements (spatially averaged) from the UV through the near-IR range. Figure 6 shows the results of the cavity reflectance for the L-1 SRF CR cone cavity. For the 532-nm laser transfer wavelength, the cavity reflectance is approximately 70 ppm with an uncertainty of 40 ppm.

3.6. Full Transfer Uncertainty

The final transfer uncertainty to the NIST CR is determined by the complete LASP-SRF uncertainty budget for the laser Si trap to L-1 CR transfer. Table 4 shows the full uncertainty budget resulting in a combined standard transfer uncertainty, uc, of 286 ppm (k = 1). Therefore, based on the direct Si trap transfer calibration measurements shown in Figure 4, the difference between the NIST cryogenic radiometer and the SRF L-1 cryogenic radiometer is −106 (286) ppm.

3.7. NIST-Calibrated Aperture Measurements and Uncertainties

All critical apertures were calibrated at the NIST Aperture Measurement Facility (AMF) where the aperture area is determined using non-contact video microscopy [30]. Briefly, the apertures are mounted on a custom fabricated, temperature-stabilized smooth plate that is integrated on a high accuracy X-Y translation stage with interferometric feedback for dimensional positioning. A microscope objective coupled to a CCD camera on a vertical Z-axis stage locates the edge points. Location of the aperture edge points are sampled at periodic intervals with a minimum of 78 points for full edge coverage. Four sets of complete measurements are performed for each aperture. Subsequent runs start at different edge locations to sample different sets of edge points and the spatial sampling interval is decreased successively to acquire an increasing number of edge coordinate locations. The systematic uncertainty in the stage positions is estimated to be 2.6 × 10⁻⁶ mm mm−1 of axis travel.
The Cartesian coordinates of the edge locations are used to determine the four linear sides of the aperture. Orthogonal distance regression analysis of the coordinate locations for each of the four-line segments defining the quadrilateral is used to determine the best-fit edge lines and their intersections. The random contribution on a single coordinate pair measurement is 15 nm (rms), but contributes significantly less to the overall uncertainty due to the large sample of coordinate measurements performed. The final aperture area is determined for the cross product of the two pairs of adjacent sides. The temperature of the apertures for all measurements was 20.4 ± 0.1 °C; however, all areas are adjusted to a reference temperature of 20 °C using the known coefficient of thermal expansion (CTE) for nickel (1.30 × 10⁻⁵/°C) due to dimensional changes of ~5 ppm. The results for the SRF CR aperture as well as each SIM entrance aperture are summarized in Table 5.

3.8. LASP-SRF Combined Uncertainty in Irradiance

The final LASP-SRF uncertainty in irradiance mode (W/m2) combines the CR traceable power uncertainty with all of the uncertainties related to introducing a calibrated aperture into the CR laser optical input path. Table 6 summarizes the full uncertainty budget for all of these effects related to operating the SRF CR in irradiance at 532 nm. Both power calibration and cone reflectivity are direct measurements and are ultimately traceable through standard NIST trap standards. The dominant uncertainties occur due to the introduction of the precision entrance aperture (slit). Of the uncertainty budget contributions, the NIST reported uncertainty in the area determination and the coefficient of thermal expansion (CTE) uncertainty of the nickel-plated brass slit is the largest single source of uncertainty. The percent effect numbers reflect the degree to which the absolute measurement would be off if we ignored this parameter in the budget. The relative combined standard uncertainty of the SRF L-1 CR operating in irradiance is 700 ppm (k = 1).

3.9. SIM Measurement Equation Uncertainties

Based on the measurement equation for spectral solar irradiance described above, we require many component and unit level characterizations and calibrations. These direct measurements or analyses and the allocated uncertainties allow us to build an uncertainty budget for the SSI absolute scale. This budget is shown in Table 7 for the component and instrument level contributions. For completeness, we include here the spacecraft ephemeris uncertainty analysis. The target absolute uncertainty goal is 0.2% (k = 1) and establishes the individual term contribution uncertainties as a maximum allowable limit to achieve this overall uncertainty. This budget establishes the compliance criteria for the component or instrument derived measurement equation value. For example, parameters that contribute 100% effect to the measurement equation carry larger weight in the overall budget. As discussed before, the percent effect numbers reflect the degree to which the measurement will be wrong if we ignore this parameter in the measurement equation calculation. To illustrate, if we completely omit the diffraction correction term from the calculation, then the measurement will be off by at least 0.5%–8.2% (depending on wavelength), since this is the amount of light that is not detected due to diffractive losses. However, if we omit the aperture area, then we will be 100% off in the measurement, since this is a base unit for the measurand.
The individual parameters listed in Table 7 represent the known direct inputs to the measurement equation in absolute base or derived SI-units or in relative (dimensionless) correction factors. Several of these are wavelength-dependent parameters and therefore have spectrally dependent uncertainties.
The budget shown in Table 7 for these spectral terms represents a limit to a functional model fit uncertainty that is constrained by individual component characterizations and calibrations at the unit- or sub-component level and are tied to direct 532 nm unit level measurements. Both systematic corrections and random uncertainties are included here. Based on this approach, we propagate the uncertainties to obtain the overall combined standard relative uncertainty of the irradiance as follows
σ ε 2 = ε 2 · [ σ P 2 P 2 + σ A 2 A 2 + σ Δ λ 2 Δ λ 2 + σ α 2 α 2 + σ T 2 T 2 + σ D 2 D 2 + σ C D a r k 2 C D a r k 2 + σ C S L 2 C S L 2 ]
where possible, systematic corrections are calibrated directly against known standards traceable to the unit definition. For example, the ESR power responsivity is spectrally calibrated directly against a cryogenic radiometer (in W) and the resulting spectral dependence correction, α(λ), is functionally fit to the full spectral data with an overall fit uncertainty reflected in the budget. For this unit-level efficiency calibration the measurement geometry of the ESR is mounted in the same geometrical configuration relative to the optic axis that it will experience in the instrument and thus represents a direct comparison to the instrument level implementation.
Absolute wavelength scale calibrations rely on the direct SRF frequency stabilized laser measurements. The absolute determination of the laser wavelength is established by use of a commercial scanning Michelson interferometer-based wavemeter [31]. The wavemeter measurement is maintained continuously by comparison of the interference fringe pattern with that of an internally stabilized, single-frequency, HeNe laser with a wavelength known to better than 0.025 ppm uncertainty. The full refractive optical geometry is optimized across the continuous spectral range and parameterized against the prism incidence angle. Figure 7 shows the results of the prism angle to wavelength determination for the ESR detector position in the SIM refractive measurement geometry including the Suprasil 3001 prism geometry and Sellmeier index of refraction coefficients. Figure 8 shows a summary of the measured spectral response functions used to refine the spectral model including the wavelength scale (spectral centroid) and spectral resolution (spectral width) of the individual response functions. These spectral profile measurements were also performed as a function of pointing angle (upto ±20 arc-min in dispersion and cross-dispersion) to provide wavelength shift analysis for full FOV optical model refinement.
Prism transmission measurements provide a unit level measurement of the clear aperture transmission. Because of the complexity of the set-up, these measurements were made in air. Therefore, corrections were made to convert both refraction and Fresnel corrections based on air-to-vacuum refractive index corrections [32]. Since these direct measurements were made at the unit level, all efforts were made to duplicate the prism geometry for the ESR detector measurement geometry for the full SIM optical path. The transmission measurements are the ratio of measured laser intensity at the ESR exit slit location after refraction and reflection, I, to the measured laser intensity just prior to the prism, Io. Figure 9 shows the ESR measurement geometry and the corresponding prism spatial transmission mapping of the clear aperture of the prism. For each wavelength, a total of 81 individual measurements were made for each laser polarization.
The central elongated oval shape outlines the solar light image of the entrance slit for the on-axis view. The mapping covers a clear aperture that accounts for both dispersion and cross-dispersion pointing angles across the full disk of the Sun (±15 arc-mins.). A typical full-spectrum transmission measurement is shown in Figure 10 a for both vertically polarized (s) and horizontally polarized (p) laser light. Notice that the p-polarized transmission is much greater than the s-polarized transmission due to the increased Fresnel reflection of the s-polarized light for the prism incidence angle range of 57–64°, an operational angle range very near the Brewster angle. From the derived p-polarization transmission measurement we can separate out the transmission loss due solely to the Fresnel surface reflection (both external and internal) and derive the second surface (internal) aluminum reflectivity. This reflectivity includes any surface scatter and bulk absorption contribution of the Suprasil 3001.
Figure 10b shows the results of the measured internal aluminum reflectivity and a comparison to the model calculated result based on reflection coefficients calculated for the Suprasil and aluminum refractive index values. Ultimately, due to the un-polarized nature of full disk integrated solar light measured by SIM, the prism transmission is the average of both s- and p-polarizations. The prism transmission correction in the measurement equation is the single largest contribution (between 15%–50% from IR to UV, respectively) and therefore will represent the largest contribution to the spectral uncertainty (especially in the UV) in the adjustment of unit-level to instrument-level transmission values.
Finally, Figure 11 shows the dominant contributions from the individual spectral corrections to the SIM spectral irradiance measurement equation from 200–2400 nm. Here the prism transmission correction is the polarization average result required to correctly quantify the incoming unpolarized solar radiation. The diffraction correction is optimized through analysis of entrance slit dimensions and baffle locations and refined at the focal plane through direct measurements of the image intensity distribution through the ESR exit slit. In the IR, the diffraction uncertainty becomes the single largest contributor to the combined uncertainty budget, potentially exceeding 0.5% at these longer wavelengths based on model fit uncertainties to the limited individual diffraction measurements. To this end, we rely on the direct end-to-end SRF measurements to both validate the SIM measurement equation results and ultimately provide the lower uncertainty spectral calibration corrections tied to the SRF CR irradiance results.

4. Discussion

4.1. End-to-End Validation of SIM Measurement Equation Uncertainties

The final LASP-SRF to SIM end-to-end validation uncertainty budget and resulting combined standard uncertainty is tabulated in Table 8. As can be seen, this final uncertainty is dominated by the integral of the SIM spectral point-spread function (PSF). This is largely due to the spectral sampling of the measurement in the SRF SIM ESR spectral scan and the resulting interpolation errors in generating the final integral for the CR end-to-end comparison.
Figure 12a shows an example of a 532 nm laser power measurement (overfilled through the calibrated aperture) with the closed-loop active cavity cryogenic radiometer replacement power control. The laser is shuttered at 50% duty cycle with a 100-s period (50 s open, 50 s closed). With the shutter open, the replacement power to the cavity is reduced to maintain balance and thus provides a direct measurement of the incident laser power. For this case, the measured power is 30.882 ± 0.034 µW (k = 1).
After accounting for the CR slit area as well as the diffraction and cavity absorptance corrections detailed in Table 6, the measured laser irradiance for the cryogenic radiometer here is 15.958 ± 0.038 Wm−2 (k = 1). During the entire measurement, the laser is intensity stabilized to ≤600 ppm and monitored continuously for post measurement corrections. Immediately after the CR measurement the same stabilized laser is then directed into the SIM instrument via the precision turning mirror (see Figure 2).
For the SIM laser irradiance measurement, the prism must be scanned across the full wavelength bandwidth of the instrument response for the ESR detector. Like the CR, the ESR directly measures the incident power as a function of the prism angle defined wavelength across the band centered at the fixed laser wavelength. Figure 12b shows the result the ESR measured signal (in DN) as a function of prism incidence angle across the full response function. Like the CR measurement the laser is shuttered 50% duty cycled to provide a full closed-open cycle per prism angle with 60-s period. We convert the measured DN as a function of prism angle into the derived spectral irradiance (Wm−2 nm−1) as a function of prism wavelength using the ESR measurement equation to generate the spectral irradiance instrument response profile at the central laser wavelength. This is shown in Figure 13. Integrating this response profile over wavelength allows for a direct laser irradiance comparison (Wm−2) with the cryogenic radiometer measurement. This measurement is completed for both s- and p- laser polarizations to obtain a polarization average value.
Figure 14a shows the result of the linear quadratic difference in the spectral interpolation of the 532 nm measured signal based on the prism scan step size sampling used to fully quantify the instrument response functions. For this example, the uncertainty in the interpolation is 0.12%. Figure 14b shows the power integral error due to this interpolation uncertainty across the spectrum (236–2700 nm) for all measured instrument line shape functions covering both laser polarizations and several FOV acceptance angles. Prior to launch, these measurements spanned five calibration campaigns over 5 years from 2012 to 2016. For the majority of the measurements, the spectral power integral error is less than 1000 ppm (0.1%) with some exceedances in the UV and the near IR mostly due to early laser stability issues producing intensity variations during a full scan over the complete instrument response function.
For each wavelength, the integral of the power profile over the full passband is used in the complete measurement equation for deriving the laser irradiance in Wm−2 in Equation (8) for direct comparison to the SRF CR measured irradiance
E λ 0 [ W   m 2 ] = Δ λ P ( λ ) d λ A · D ¯ λ 0 · T ¯ λ 0 · α ¯ λ 0 · W λ 0
The wavelength specific correction terms in the denominator are those shown in Figure 11 and represent the average values over the width of the exit slit. As discussed in Appendix A, by intensity stabilizing a fixed wavelength laser, we can make use of the spectral reciprocity to convert from index of refraction coordinates (through the angle of the prism) to dispersion coordinates (in wavelength). Both produce the same index of refraction mapping solution across the exit slit at the focal plane. Therefore, we can map the wavelength coordinates at the focal plane through the refractive index solution as a function of prism incidence angle.
Like the entrance slit, the ESR exit slit width at the focal plane is 300 µm. Based on the Féry prism optical geometry, this exit slit width corresponds to 72 arc-sec (~0.02°) of prism rotation. Over this very narrow angular range the spectral dispersion is essentially linear with prism angle across the exit slit dimension. Figure 15 shows four regions from the UV to the near IR, chosen to include large gradients in the spectral correction factors as well as the wavelength of the poorest spectral resolution (largest spectral width) at 1345 nm. As can be seen for the right axis, all spectral correction factors are linear with wavelength over the full 0.02° prism angle scan, thus allowing for the definition of the average correction factor (total correction function shown in Figure 11) for each central wavelength. Therefore, for each detector, the slit scattering function, Is(λ,c), is a symmetric function, such that
I S [ λ 1 , c ( λ 2 ) ] = I S [ λ 2 , c ( λ 1 ) ]
It establishes the spectral reciprocity between a direct Is determination (fixed prism angle at c(λo), scanned laser λ) and indirect Is determination (fixed laser λo, scanned prism angle c(λ)) provided that all wavelength-dependent factors are correctly quantified in the full profile scan. [33]. This wavelength dependence is accounted for explicitly in the total correction function over the average component products in the denominator of Equation (8). Recall that each of the spectral scan measurements used to derive the SIM measured irradiance is bracketed by direct cryogenic radiometer irradiance measurements. This allows for an absolute validation of the SIM measurement equation result against the CR in irradiance at the low uncertainty of Table 8.
Figure 16a shows the results of the spectral irradiance validation as the fractional difference of the SIM measurement equation-derived irradiance (via Equation (8)) from the CR-measured values. This was completed for all three redundant SIM measurement channels independently. As can be seen, agreement with the CR irradiance is better than ±1% over the full spectrum, with some channel-to-channel variations above that level at the shortest UV wavelength. For these shortest wavelengths, the spectral correction factor is dominated by the rapidly changing prism transmission with small wavelength change (see Figure 11). The overall level of agreement here is actually remarkable given that the magnitude of the correction gradient spanned tens of percent in the shortest UV regions. Of particular note is the common shape of the systematic differences for all three measurement channels. This is indicative of a common systematic error in a unit-level calibration. Given the dominance of the prism transmission correction and the dispersion sensitivity to the prism angular dispersion relationships, it is likely that there was a larger prism angle error contribution to the transmission uncertainty at the shorter UV wavelength during the unit level prism transmission calibrations.

4.2. End-to-End Spectral Irradiance Calibraton of SIM

Treating this as a common systematic spectral error in the final spectral irradiance, we can use the low uncertainty CR measurement to apply a spectral bias correction to the final SIM spectral irradiance measurement equation result. Figure 16b shows the final end-to-end calibration result tying the SIM spectral irradiance to the SI-traceable CR irradiance. The final fit uncertainties here include the SRF absolute irradiance uncertainty (See Table 8), such that σ c a l 2 = σ d i s t . 2 + σ S R F 2 to reflect the SRF bias correction uncertainty in the final calibrated distribution. For example, treating the full spectral distribution uniformly for SIM channel A (the primary SSI measurement channel) results in a combined standard deviation of ±0.18% when tied to the SRF CR in irradiance. Notably, while there are still residual biases that appear common to all channels, the distribution fractional differences from the SRF CR are much smaller for wavelengths from 500 to 2400 nm. On the other hand, for UV regions < 500 nm, there is a larger channel-to-channel spread. Treating the standard deviation as a uniform uncertainty for all of the channels taken together will be influenced more heavily by the UV uncertainties. Therefore, we define two separate spectral distributions to derive the full three channel combined calibration uncertainty to the traceability to the SRF CR irradiance standard. For the calibration data measured, this results in a combined standard deviation of ±0.24% for 500–2400 nm and ±0.41% for the data shown with wavelengths < 500 nm. Again, we rely on the SIM channel A as the primary measurement channel with a lower calibration distribution uncertainty; however, there is no way to validate this on-orbit by any direct method of post launch calibration. Treating all channels collectively provides for an indirect validation based on simultaneous solar channel-to-channel spectral measurement comparisons on-orbit.

5. Conclusions

The TSIS-1 SIM development involved an extensive and rigorous characterization and calibration program that began in the early phases of the instrument definition. Instrument components and sub-assemblies were designed with calibration as a driving requirement. Based on an absolute measurement equation approach, each independent contribution was quantified with an associated uncertainty limit and verified by characterization and, where possible, by direct calibration measurements for each parameter.
These individual characterizations allowed for the full measurement equation uncertainty propagation to be confirmed against an SI-traceable, end-to-end spectral irradiance validation. The final validation of the spectral measurement equation results against the cryogenic radiometer in irradiance showed less than ±1% systematic bias—common to all three SIM channels. Based on the calibration accuracy of the SRF in irradiance (0.15%, k = 1), we applied a spectral functional calibration correction to achieve an instrument absolute irradiance calibration uncertainty from the cryogenic radiometer values at the 0.2%–0.5% level. This detector-based SI-traceable irradiance calibration approach represents a significant improvement over previous SSI sensor calibrations that were based on source-based radiance standards (e.g., HTBB and FEL lamps); the previous SSI absolute uncertainties were > 2% on average across the spectrum in the 300–2400 nm range [34,35,36].
Finally, for the TSIS-1 SIM, the long-term maintenance of the calibration relies on an on-board, detector-based reference electrical substitution radiometer (ESR) that has been established as an SI-traceable power calibration standard detector by pre-launch spectral calibration against an absolute cryogenic radiometer traceable to the NIST Primary Optical Watt Radiometer (POWR). Verifying the invariance of the ESR calibration over time is a key foundation to maintaining on-orbit stability. By utilizing the three independent SIM channels in a solar exposure duty-cycling mode, it is possible to quantify and correct, on-orbit, the long-term exposure-related degradation changes in the final irradiance data products. Sophisticated radiometric models, maintained and continually updated throughout mission life, are important components of the on-orbit recalibration procedure.

Author Contributions

E.R. is instrument scientist and directed the methodology, results analysis, validation, and prepared the manuscript. D.H. is calibration lead and designed and constructed facilities, performed all measurements, calibrations and processing analysis and interpretation. O.C. provided analysis of final calibration results and bias corrections. G.D., J.R., and M.T. provided significant instrument and calibration contributions including analysis of component-level test results. P.P. and T.W. mission principal investigator, project science and administration, draft preparation, and review and editing. All authors have read and agreed to the published version of the manuscript.

Funding

The material is based upon work supported by NASA under Contract #80GSFC19C0069 issued through the NASA Goddard Space Flight Center (GSFC) Earth Science Projects Division.

Acknowledgments

The authors appreciate the support and talents of many LASP design and calibration engineers through this program. The authors also wish to that the NIST Detectors and Laser Calibration groups, including Joseph Rice, Steve Brown, and the late Keith Lykke for all of their collective efforts to support the LASP SRF laser and CR development and calibrations. We also thank an anonymous reviewer for critical comments that improved the manuscript.

Conflicts of Interest

The authors declare no conflict of interest. The funders had no role in the design of the study; in the collection, analyses, or interpretation of data; in the writing of the manuscript, or in the decision to publish the results.

Appendix A

Here, we account in more detail the full measurement equation derivations for the fraction of the spectral power that is collected by a given detector (this applies to the ESR as well as the photodiodes). For a given measurement at a specified wavelength, the prism incidence angle is fixed (through a selected angle encoder position, denoted here as a selected sub-pixel, cs) such that the chief optic ray for that wavelength is centered on the exit slit (of width w). At a given selected central wavelength, the full passband of the dispersed transmitted solar radiation reaching the detector through the exit slit will occupy a range of focal-plane sub-pixels across the full width of the exit slit. We define a function that describes the relative slit function intensity per sub-pixel as Is(λ,c), such that
I S ( λ , c ) d c = 1
where c is the angle encoder sub-pixel defining the prism incidence angle. There is a one-to-one correspondence between encoder sub-pixel and prism incidence angle, and therefore, through the wavelength-refraction dependence on incidence angle, there is a one-to-one relationship between encoder sub-pixel and wavelength. This sub-pixel to wavelength relationship is non-linear (due to the non-linear behavior of the fused silica index of refraction with wavelength). However, over the very narrow (300 µm) width of the exit slit, the dispersion is essentially linear with sub-pixel over this narrow range.
There are two approaches to displace the image of the entrance slit across the exit slit that defines the spectral passband. One can fix the prism angle and scan the wavelength, thereby displacing the image across the exit slit by a changing index of refraction for each wavelength with a fixed incidence angle. Or one can fix the wavelength and scan the prism incidence angle and displace the image across the exit slit, producing the same index of refraction solution for each prism incidence angle with a fixed wavelength. In either case, the focal plane mapping of the index of refraction solution is the same. Therefore, for each detector over the narrow exit slit, I S ( λ , c ) is a symmetric function, such that
I S [ λ 1 , c ( λ 2 ) ] = I S [ λ 2 , c ( λ 1 ) ]
This is a very important spectral property of the relative slit intensity. It establishes the spectral reciprocity between a direct (laser scan) and indirect (angle scan) determination of the relative spectral response function provided that all wavelength dependent factors are correctly quantified in the full profile scan [33].
Ideally, we wish to determine the complete spectral profile integral that includes all wavelength dependent factors affecting the system spectral transmission within a given exit slit passband, namely
Δ λ D ( λ ) · T ( λ , p ) · I S ( λ , c S ) d λ
The integral here covers the full range of wavelengths that pass through the exit slit and reach the detector at a given fixed prism angle (set by cs). This quantifies the full wavelength dependence of the spectral power measured by the detector at the selected sub-pixel, cs. Contained within I S ( λ , c S ) is the wavelength dependent responsivity of the detector itself. For the photodiode detectors this is the spectral radiant sensitivity, ( λ , T ) (AW−1) and for the ESR bolometer this is spectral absorptance, α(λ) (unitless spectral correction factor that accounts for the inefficiency of the bolometer to collect and convert 100% of the photons into measured power). These factors will be accounted for later in a detector spectral gain factor. In practice, the “direct” determination of the spectral response profile is very difficult to perform, requiring the wavelength scanning of an intensity stabilized laser over the full non-zero region of the profile for fixed cs, (typically a focal plane distance twice the exit silt width). It is generally difficult to maintain a stable, constant laser power over the full wavelength range required to determine the complete response function at a given prism setting, i.e., fixed prism angle.
We can make use of the spectral reciprocity to determine the relative spectral response function indirectly by fixing the laser (in wavelength and intensity) and scanning the encoder sub-pixels (i.e., rotate the prism) over the non-zero response regions. The laser can be both frequency and intensity stabilized (typ. <0.05% rms) throughout the measurement. Recall that spectral slit function is dependent on the physical position of the optical image of the entrance slit on the focal plane relative to the exit slit position. However, for the indirect (fixed wavelength) scan since we are only dealing with a single wavelength, all of the wavelength dependence must be accounted for separately in order to correctly quantify the full profile integral. This requires full quantification and inclusion of the prism transmission, the system diffraction, as well as the detector specific terms of the radiant sensitivity (photodiodes) and efficiency correction for power (ESR).
These functions are then explicitly included in the full definition of the solar spectral profile at each prism angle (focal plane subpixel location). By integrating the spectral power over the slit image, we obtain the measured spectral power as a function of sub-pixel (W subpix−1)
A · E ( λ ) D ( λ ) · T ( λ , p ) · I S ( λ , c ) d λ
This is now the expression for spectral power per sub-pixel as a function of sub-pixel (recall that the sub-pixel is the linear displacement in the dispersion direction at the focal plane). Obtaining the total power passing through the exit slit (and completely collected by the detector) requires integrating the spectral power per sub-pixel across the full width of the exit slit defined by sub-pixel coordinates. To accomplish this, we define an exit slit image mask, M(c), that is unity within the sub-pixel limits of the exit slit and zero outside of the limits
M ( c ) = { 1 i f c c E S 0 i f c c E S
where cES are the sub-pixel displacement limits of the exit slit. The total power (in Watts) passing through the exit slit and collected by the detector is then
A · E ( λ ) D ( λ ) T ( λ , p ) I S ( λ , c ) M ( c c ) d λ d c
Finally, we must consider the detector response and gain, G, to optical power and the ultimate conversion into data numbers (DN W−1). The gain will be a function of many factors including wavelength (λ), polarization (p), temperature (T), pointing ([θ,φ], FOV (β) and, in the case of the ESR, the shutter frequency (f). Therefore, for a given detector, we separately account for all the contributions to the gain, but for simplification purposes here we will consider it a wavelength and polarization dependent average over external correction factors, namely G ( λ , p , T , [ θ , ϕ ] , β F O V ) = G ¯ ( λ , p ) .
The measured DNs as a function of prism angle (defined by c) can therefore be expressed as
D N ( c ) = A · E ( λ ) D ( λ ) T ( λ , p ) G ¯ ( λ , p ) I S ( λ , c ) M ( c c ) d λ d c
For the original measurement equation above with solar spectral irradiance, the diffraction, D(λ), transmission, T(λ,p) and gain, G ¯ ( λ , p ) , are all smooth functions of wavelength and are over the non-zero argument of the integral and therefore can be assumed constant over this narrow range (see examples in Figure 15); thus, the measurement equation simplifies to
D N ( c ) A · D ( λ ( c ) ) T ( λ ( c ) , p ) G ¯ ( λ ( c ) , p ) E ( λ ) I S ( λ , c ) M ( c c ) d λ d c
We now define a new quantity, σ ( λ , c ) , the spectral response function, such that
σ ( λ , c ) = I S ( λ , c ) M ( c c ) d c M ( c ) d c = [ I S ( λ ) M ] ( c ) M ( c ) d c
By definition, the spectral response function has unit area such that
σ ( λ , c ) d c = 1
Therefore, rearranging Equation (A9) yields the following expression for the spectral response
[ I S ( λ ) M ] ( c ) = σ ( λ , c ) M ( c ) d c
Finally, the measurement equation in terms of DN as a function of the sub-pixel can now be written as
D N ( c ) A · D ( λ ( c ) ) T ( λ ( c ) , p ) G ¯ ( λ ( c ) , p ) E ( λ ) [ I S ( λ ) M ] ( c ) d λ
D N ( c ) A · D ( λ ( c ) ) T ( λ ( c ) , p ) G ¯ ( λ ( c ) , p ) M ( c ) d c E ( λ ) σ ( λ , c ) d λ
ε ( λ ) c = E ( λ ) σ ( λ , c ) d λ = D N ( c ) A · D ¯ ( λ ( c ) ) · T ¯ ( λ ( c ) ) · G ¯ ( λ ( c ) ) · W ( λ )
By definition, in Equation (A5), the integral of M(c) in the denominator of Equation (A9) is just the physical width of the exit slit in sub-pixel coordinates converted to a spectral width, W(λ). Equation (A14) expresses the measured solar spectral irradiance (Wm−2 nm−1) at a given sub-pixel in terms of the measured DN value at that sub-pixel divided by the known correction and conversion factors within the exit slit passband. Moreover, note that the correction factors are all functions of wavelength and therefore accurate wavelength to sub-pixel knowledge is critical.

References

  1. Haigh, J. The impact of solar variability on climate. Science 1996, 272, 981–984. [Google Scholar] [CrossRef] [PubMed]
  2. Gray, L.; Beer, J.; Geller, M.; Haigh, J.; Lockwood, M.; Matthes, K.; Cubasch, U.; Fleitmann, C.; Harrison, G.; Hood, L.; et al. Solar influences on climate. Rev. Geophys. 2010, 48, 1–53. [Google Scholar] [CrossRef]
  3. Richard, E.; Harber, D.; Rutkowski, J.; O’Malia, K.; Triplett, M.; Drake, G.; Harder, J.; Pilewskie, P.; Brown, S.; Smith, A.; et al. Future Long-term Measurements of Solar Spectral Irradiance by the TSIS Spectral Irradiance Monitor: Improvements in Measurement Accuracy and Stability. In Proceedings 11th International Conference on New Developments and Applications in Optical Radiometry, Maui, HI, USA, 18–23 September 2012; Ikonen, E., Park, S., Eds. 2012, 49, 5–6. [Google Scholar]
  4. NPOESS (National Polar-Orbiting Operational Environmental Satellite System). Technical Requirements Document; NPOESS-Integrated Program Office (IPO): Silver Springs, MD, USA, 2007. [Google Scholar]
  5. NOAA (National Oceanic and Atmospheric Administration). Total and Spectral Solar Irradiance Sensor (TSIS) Requirements Document; NOAA: Silver Springs, MD, USA, 2010.
  6. Bojinski, S.; Verstraete, M.; Peterson, T.C.; Richter, C.; Simmons, A.; Zemp, M. The concept of essential climate variables in support of climate research, applications, and policy. Bull. Amer. Meteor. Soc. 2014, 95, 1431–1443. [Google Scholar] [CrossRef]
  7. NRC. Climate Data Records from Environmental Satellites: Interim Report; National Academies Press: Washington, DC, USA, 2004. [Google Scholar]
  8. Bates, J.J.; Privette, J.L. A maturity model for assessing the completeness of climate data records. Eos. Trans. Amer. Geophys. Union. 2012, 93, 441. [Google Scholar] [CrossRef]
  9. Coddington, O.; Lean, J.L.; Pilewskie, P.; Snow, M.; Lindholm, D. A solar irradiance climate data record. Bull. Am. Meteorol. Soc. 2016. [Google Scholar] [CrossRef]
  10. Coddington, O.; Lean, J.; Pilewskie, P.; Snow, M.; Richard, E.; Kopp, G.; Lindholm, C.; DeLand, M.; Marchenko, S.; Haberreiter, M.; et al. Solar Irradiance variability: Comparisons of models and measurements. Earth Space Sci. 2019, 6, 2525–2555. [Google Scholar] [CrossRef]
  11. Ohring, G.; Wielicki, B.; Spencer, R.; Emery, B.; Datla, R. Satellite Instrument Calibration for Measuring Global Climate Change: Report of a Workshop. Bull. Amer. Meteor. Soc. 2005, 86, 1303–1313. [Google Scholar] [CrossRef]
  12. Fox, N.P. Validated Data and Removal of Bias through Traceablility to SI, Post-Launch Calibration of Satellite Sensors. In Proceedings of the International Workshop on Radiometric and Geometric Calibration, Gulfport, MS, USA, 2–5 December 2003; ISPRS Book Series, 1st Ed.. pp. 29–42. [Google Scholar]
  13. Hengstberger, F. Absolute Radiometry; Academic Press: San Diego, CA, USA, 1989. [Google Scholar]
  14. Harder, J.; Lawrence, G.; Fontenla, J.; Rottman, G.; Woods, T. The spectral irradiance monitor: Scientific requirements, instrument design, and operation modes. Sol. Phys. 2005, 230, 141–167. [Google Scholar] [CrossRef]
  15. Johnson, B.C.; Brown, S.W.; Rice, J.P. Metrology for remote sensing radiometry, Post-Launch Calibration of Satellite Sensors. In Proceedings of the International Workshop on Radiometric and Geometric Calibration, Gulfport, MS, USA, 2–5 December 2003; ISPRS Book Series, 1st Ed.. pp. 7–16. [Google Scholar]
  16. Houston, J.M.; Rice, J.P. NIST reference cryogenic radiometer designed for versatile performance. Metrologia 2006, 43, 31–35. [Google Scholar] [CrossRef]
  17. Walker, J.H.; Saunders, R.D.; Jackson, J.K.; McSparron, D.A. Spectral Irradiance Calibrations; NIST Special Publication SP250-20; NIST: Gaithersburg, MD, USA, 1987.
  18. Yoon, H.W.; Gibson, C.E. Spectral Irradiance Calibrations; NIST Special Publication SP250-89; NIST: Gaithersburg, MD, USA, 1987.
  19. Brown, S.W.; Eppeldauer, G.P.; Lykke, K.R. NIST facility for spectral irradiance and radiance responsivity calibrations with uniform sources. Metrologia 2000, 37, 579–582. [Google Scholar] [CrossRef]
  20. Yoon, H.W.; Gibson, C.E.; Barnes, P.Y. Realization of the National Institute of Standards and Technology detector based spectral irradiance scale. Appl. Opt. 2002, 41, 5879–5890. [Google Scholar] [CrossRef] [PubMed]
  21. Brown, S.; Eppeldauer, G.; Rice, J.; Zhang, J.; Lykke, K. Spectral Irradiance and Radiance Responsivity Calibrations Using Uniform Sources (SIRCUS) Facility at NIST. Proc. SPIE 2004, 5542, 363–368. [Google Scholar]
  22. Kopp, G.; Lawrence, G. The total irradiance monitor: Instrument design. Sol. Phys. 2005, 230, 91–109. [Google Scholar] [CrossRef]
  23. Harder, J.; Fontenla, J.; Lawrence, G.; Woods, T.; Rottman, G. The spectral irradiance monitor: Measurement equations and calibration. Sol. Phys. 2005, 230, 169–204. [Google Scholar] [CrossRef]
  24. Heraeus Optics, LLC, “Quartz Glass for Optics Data and Properties”. Available online: https://www.heraeus.com/en/hca/fused_silica_quartz_knowledge_base_1/properties_1/properties_hca.html (accessed on 3 June 2008).
  25. Harvey, J.D.; Dudley, J.M.; Curley, P.F.; Spielmann, C.; Krausz, F. Coherent effects in a self-mode-locked Ti:sapphire laser. Opt. Lett. 1994, 94, 972–974. [Google Scholar] [CrossRef]
  26. Available online: https://www.edmundoptics.com/p/50mm-diameter-deep-uv-enhanced-mirror/8815/) (accessed on 5 October 2010).
  27. Available online: https://www.newport.com/p/URS75BCC (accessed on 2 February 2011).
  28. KeySight Technologies. Available online: https://www.keysight.com/en/pdx-2905513-pn-3458A/ (accessed on 6 June 2012).
  29. Heuerman, K. Calibration of the absorptance cavities for the spaceflight solar radiometer TIM. Earth Obs. Syst. XI Proc. SPIE 2006, 6296, 62961. [Google Scholar]
  30. Fowler, J.; Litorja, M. Geometric Area Measurements of Circular Radiometric Apertures at NIST. Metrologia 2002, 40, 9. [Google Scholar] [CrossRef] [Green Version]
  31. Bristol Instruments, 671 Series Laser Wavelength Meter. Available online: https://www.bristol-inst.com/bristol-instruments-products/wavelength-meters-scientific/ (accessed on 8 August 2013).
  32. Edlen, B. The Dispersion of Standard Air. J. Opt. Soc. Am. 1953, 43, 339. [Google Scholar] [CrossRef]
  33. Kostkowski, H.J. The Relative Spectral Responsivity and Slit-Scattering Function of a Spectro-radiometer. Self Study Man. Opt. Radiat. Meas. Natl. Bur. Stand. 1979, 910–914, 2–34. [Google Scholar]
  34. Thuillier, G.; Hersé, M.; Labs, D.; Foujols, T.; Peetermans, W.; Gillotay, D.; Simon, P.C.; Mandel, H. The Solar Spectral Irradiance from 200 to 2400 nm as Measured by the SOLSPEC Spectrometer from the ATLAS and EURECA Missions. Sol. Phys. 2003, 214, 1–22. [Google Scholar] [CrossRef]
  35. Chance, K.; Kurucz, R. An Improved High-Resolution Solar Reference Spectrum for Earth’s Atmosphere Measurements in the Ultraviolet, Visible, and Near Infrared. J. Quant. Spect. Rad. Transf. 2010, 111, 1289–1295. [Google Scholar] [CrossRef]
  36. Meftah, M.; Damé, L.; Bolsée, D.; Hauchecorne, A.; Pereira, N.; Sluse, D.; Cessateur, G.; Irbah, A.; Bureau, J.; Weber, M.; et al. SOLAR-ISS: A new reference spectrum based on SOALR/SOLSPEC observations. Astro. Asrophys. 2018, 611. [Google Scholar] [CrossRef]
Figure 1. Overview of the Total and Spectral Solar Irradiance Sensor (TSIS-1) Spectral Irradiance Monitor (SIM). The SIM is a constant-deviation monochromator that is based on the Féry prism for spectral dispersion and image quality control. (a) The dispersion view, where the prism is the only optical element. Focal plane detectors include three separate photodiode detectors for rapid scan solar measurements and an Electrical Substitution Radiometer (ESR) for long-term SSI calibration maintenance. (b) Cross-dispersion view showing three separate, but redundant, measurement channels used for long-term degradation corrections. The CCD system is a closed loop optical encoder mechanism to actively control the prism incidence angle to ~0.5 arc-s rotational resolution.
Remotesensing 12 01818 g001
Figure 2. Overview of the Laboratory for Atmospheric and Space Physics (LASP) Spectral Radiometer Facility (SRF) showing the cryogenic radiometer irradiance (a) and the SIM irradiance (b) measurement configuration. After laser stability and conditioning optics, the light passes through a common vacuum window into a common vacuum instrument chamber. A single, high rotational precision 45° reflection mirror directs the laser into the cryogenic radiometer (CR) or SIM path. For this measurement, the laser was both frequency and intensity stabilized (<0.05% rms variability).
Remotesensing 12 01818 g002
Figure 3. Details of the laser stabilization and beam conditioning optics. A single-mode fiber inputs the selected wavelength to a reflective fiber collimator. Polarization control and intensity stability feedback are accomplished prior to a fast steering mirror. For irradiance mode calibrations, the laser pattern is scanned by the fast steering mirror to generate a uniform intensity field that overfills the critical aperture (either the cryogenic radiometer or SIM entrance slit).
Remotesensing 12 01818 g003
Figure 4. Power transfer calibrations of two NIST Si trap detectors to both the SRF L-1 CR as well as an original NIST secondary standard CR during the initial LASP SRF development. These measurements bracket the full 5-year campaign of the TSIS-1 SIM calibrations.
Remotesensing 12 01818 g004
Figure 5. Panels (a,b) show the response uniformity maps for the Si trap #1 for both laser polarizations, s and p, and (c,d) are the results for Si trap #3. Positional maps are shown with 100 ppm responsivity contours against the CR. Both the positional offset and angular acceptance range were established to ensure a trap response uniformity to allow for a <200-ppm repeatability transfer measurement.
Remotesensing 12 01818 g005
Figure 6. The L-1 CR cone cavity reflectance measurements from 400–1620 nm. All NIST Si trap measurements were completed at 532 nm, where reflectance was quantified at 70 ± 40 ppm (k = 1).
Remotesensing 12 01818 g006
Figure 7. Spectral wavelength definition for prism angle refractive geometry at the ESR detector focal plane position. The full instrument refractive model is optimized based on direct laser measurements to the centroid of the individually measured spectral response functions (shown below in Figure 8). The global standard deviation of the wavelength fit here is <0.1%.
Remotesensing 12 01818 g007
Figure 8. Full spectrum measurement of the SIM spectral response functions from the UV (206 nm) out to the shortwave IR (2700 nm). The instrument function for each wavelength was measured for both laser polarizations (orthogonal s and p), and nine separate field of view (FOV) angles (on-axis, and ±10, ±20 arc-min in both dispersion and cross-dispersion directions). These provided a direct measurement of the spectral resolution and allowed for further refinement of the full optical refraction model, including FOV and off-axis pointing optical model definitions.
Remotesensing 12 01818 g008
Figure 9. Measurement geometry for the determination of the prism transmission for the ESR detector. The ESR exit slit is located at yi = −45 mm resulting in a refraction angle of 6.42°. The complete clear aperture of the prism is mapped for I/Io measurements and include a 9 × 9 grid of points (both laser polarizations). Average and standard deviation values are computed for the central area (elongated oval shown) to derive the transmission for the full solar image area on the prism. Note, the semicircular occultation (blue) in the lower portion of the figure is from the ball-in-cone mount for each of the prisms, which is clear of the solar view transmission region.
Remotesensing 12 01818 g009
Figure 10. (a) Results of polarization-dependent prism transmission measurements for s- and p-polarized laser light. (b) Second-surface aluminum reflectivity derived from the p-polarized transmission data and removal of the calculated Fresnel reflection contributions (see text).
Remotesensing 12 01818 g010
Figure 11. Plot of the measurement equation spectrally dependent corrections. These represent the known “photon-loss” factors that must be accounted for in deriving the true SSI from the measured detected power at the ESR (see text).
Remotesensing 12 01818 g011
Figure 12. (a) SRF CR power measurement (through overfilled calibrated aperture) for stabilized 532 nm laser showing ~30 µW of power. This power is chosen to closely match the solar power level detected by SIM at 532 nm so as to closely match the true dynamic rage of the SSI measurement. (b) Immediately after CR power measurement, the stabilized laser, if directed (via turning mirror in Figure 2) into the SIM (overfilling entrance slit), and the prism are scanned across the full spectral passband to generate the spectral instrument response at 532 nm. For these measurements, the shutter opens and closes for each prism angle position to acquire a light and dark measured signal, respectively.
Remotesensing 12 01818 g012
Figure 13. The result of the conversion of the raw data number (DN) vs. sub-pixel data shown in Figure 12 using the SIM measurement equation (Equation (4)). The conversion results in the spectral irradiance (Wm−2 nm−1) as a function of wavelength, the spectral response function, for SIM at 532 nm central wavelength. Integrating this spectrum with wavelength allows for a direct irradiance comparison (Wm−2) with the cryogenic radiometer. For this measurement, SIM yields an irradiance of 15.969 ± 0.024 Wm−2 (k = 1) (~700 ppm higher than the cryogenic radiometer value of 15.958 Wm−2, validating the measurement equation at the 0.1% level for 532 nm.).
Remotesensing 12 01818 g013
Figure 14. (a) Measured spectral instrument profile for 532 nm prism scan plotted as a function of linear focal plane positional coordinates (sub-pixels, c) that defines prism angle relative to the central wavelength angle. Prism angle sampling size reflects operational step size used for SSI measurements. Shown are two separate interpolation methods (linear and quadradic) used to provide numerical power integration of the full profile shown in Figure 13. (b) The relative integral error based on these two separate interpolation methods. The results are shown for the full set of spectral instrument profiles covering 236 nm through 2700 nm over five years of separate calibration campaigns. The final 2016 pre-launch calibration is used for the uncertainty budget and show relative integral uncertainties less than 1000 ppm (0.1%) for the majority of the spectrum (with shortest UV wavelengths showing integrated uncertainties in the 0.1–0.3% range).
Remotesensing 12 01818 g014
Figure 15. Four specific wavelength regions (UV to near-IR) showing the linearity of the full spectral correction factors over the exit slit width (covered by 0.02° prism angle rotation) at the focal plane. Prism angle shown represent scans centered at 233.5 nm, 354 nm, 550 nm, and 1345 nm for panels (ad), respectively. Correction factors (right axis) include the spectrally dependent terms representing all wavelengths covered by the prism scans across the passband defined by the central laser wavelength (see Figure 11—total correction curve).
Remotesensing 12 01818 g015
Figure 16. (a) Full SIM spectral irradiance measurement equation validation results compared against the cryogenic radiometer in irradiance. Shown here are all SIM channels with linear fit offsets and standard deviations. Common systematic effect is present in the results and indicates a common uncertainty in the unit level characterizations. The functional removal of this common bias is applied in (b), where spectral data have been directly calibrated against the CR measured irradiance.
Remotesensing 12 01818 g016
Table 1. Solar spectral irradiance (SSI) Level-1 Requirements.
ParameterSSI Requirements
GoalThreshold
Spectral Range200–2400 nm
Uncertainty0.2%1%
Stability0.05%/yr (≤400 nm)
0.01%/yr (>400 nm)
0.1%/yr (≤400 nm)
0.02%/yr (>400 nm)
Spectral Resolution2 nm: (<280 nm)
5 nm: (280 nm to 400 nm)
45 nm: (>400 nm)
Reporting Frequency2 spectra per day
Table 2. NIST to LASP SRF Cryogenic Radiometer Transfer.
Transfer TrapNIST Cryo to SRF Cryo (ppm)SRF Cryo (ppm)
2013 to 2017
20132017
Trap 1, Pol 0−142 (39)−479 (23)−333 (33)
Trap 1, Pol 1−78 (20)−555 (32)−474 (37)
Trap 3, Pol 0−188 (84)−340 (76)−153 (40)
Trap 3, Pol 1−94 (66)−455 (77)−359 (55)
Combined Std. Unc. (k = 1)−106 (50)−489 (89)−330 (133)
Table 3. L-1 cryogenic radiometer standard Watt.
Target Power (µW)CR Power (µW)3458A Power (µW)Error (ppm)
10.999971.00009−122
22.000092.00035−128
55.000755.00119−87
1010.000510.0016−114
2020.000320.0028−125
5050.002450.0091−135
100100.074100.075−8
200200.019200.050−155
500500.037500.108−143
10001000.071000.22−143
20002000.112000.41−149
Table 4. Full trap transfer uncertainty budget.
Budget ParameterUnc. ppm (k = 1)
Trap Spatial Uniformity62
Trap Angular Uniformity10
Trap I to V Conv.59
Trap Voltage Meas.47
NIST Cryo Std. Watt150
NIST Cryo Cavity Refl.40
NIST Cryo Non-equiv.100
SRF Cryo Std. Watt150
SRF Cryo Cavity Refl.40
SRF Cryo Non-equiv.100
Turning Mirror35
Statistical50
Combined Std. Unc.286
Table 5. SRF cryogenic radiometer and TSIS SIM entrance slit measurements from NIST AMF.
SlitLength1 (mm)Width1 (mm)Area
(mm2)
NIST AMF unc. (k = 1)
(mm2)(ppm)
Cryogenic radiometer6.500210.299521.946923.2x10−4164
SIM Channel A6.501320.299041.944163.2x10−4167
SIM Channel B6.498220.299241.944503.0x10−4154
SIM Channel C6.500510.296531.927561.8x10−493
1 Length and width represent results of best fit rectangle to direct edge measurements around perimeter of slit.
Table 6. CR uncertainty budget operating in irradiance (W/m2) at 532 nm.
ParameterUnit% Effect% Unc. (k = 1)
PowerW1000.015
Power Transfer unc.--0.03
Cavity Reflectance-0.010.004
Cavity Non-Equivalence-00.01
Slit area: Measuredm21000.017
Slit area: CTE1-0.650.04
Slit area: Cosine effect-0.020.01
Slit diffraction loss-0.130.02
Rel. combined std. unc. 0.07
1 Represents calibration of thermal contraction from room temperature to LN2 temp.
Table 7. TSIS-1 SIM uncertainty budgets and allocations.
ParameterUnitOrigin% Effect% Unc. (k = 1)
Distance (1AU correction)mAnalysis3.35<0.001
Velocity (Doppler correction)m/sAnalysis0.004<0.001
Pointing (FOV correction)-Analysis00.002
Slit aream2Component1000.02
Prism transmission-Component16–450.1
ESR power calibration1-Component1.50.1
Wavelength scale calibrationnmInstrument1000.08
Diffraction-Instrument0.5–8.20.05
Dark signal-Instrument00.01
Stray light-Instrument00.02
Noise-Instrument-0.01
Spectral line shape integralWInstrument1000.12
Rel. combined std. unc. 0.21
1 Direct power (W) calibration against the cryogenic radiometer for full ESR in focal plane geometry.
Table 8. SRF end-to-end uncertainty budget in irradiance (W/m2).
ParameterUnit% Effect% Unc. (k = 1)
CR IrradianceW/m21000.07
Tuning mirror repeatability-00.004
Laser intensity stability-00.06
Laser pattern uniformity-00.023
Laser pathlength correction--0.0005
SIM spectral PSF integralW/m21000.12
Rel. combined std. unc. 0.15

