Spatiotemporal Variations of Precipitation over Iran Using the High-Resolution and Nearly Four Decades Satellite-Based PERSIANN-CDR Dataset

 , , and
Abstract
:
1. Introduction
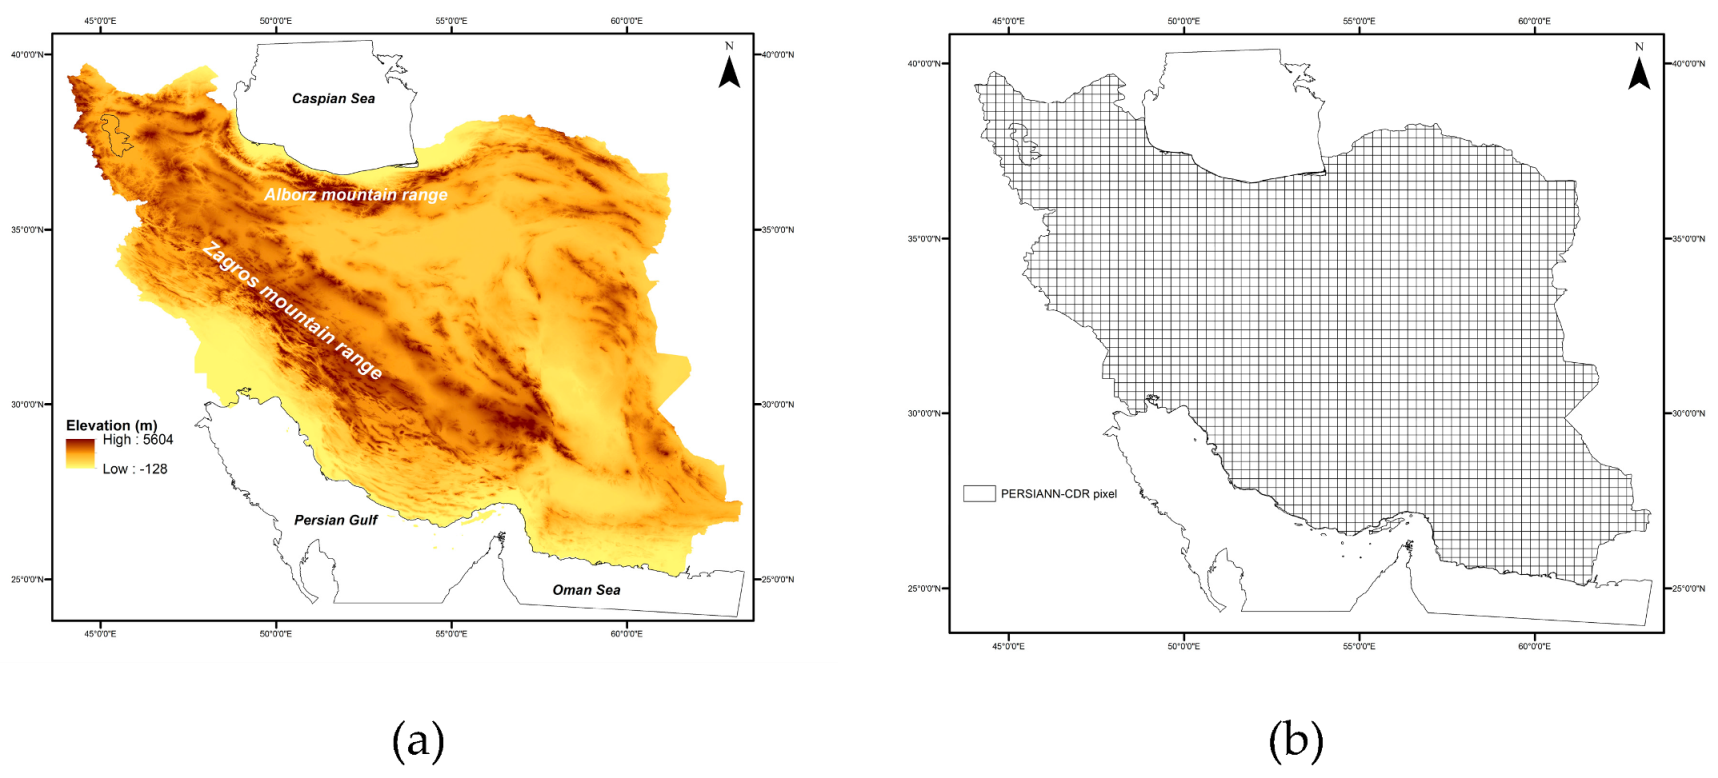
2. Study Area
3. Data and Methodology
3.1. Data
3.2. Data Processing
3.3. Trend Analysis
4. Results and Discussion
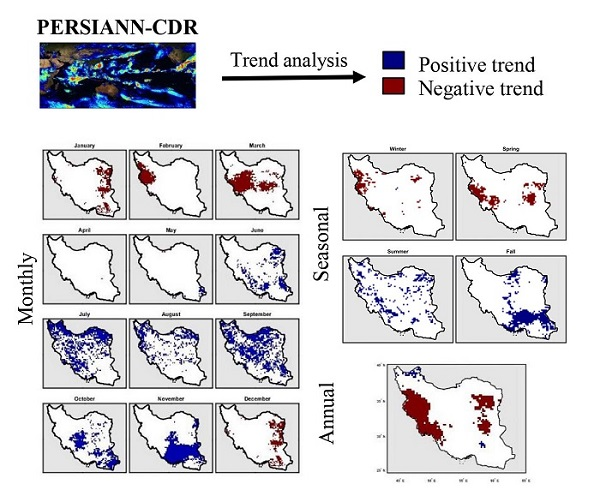
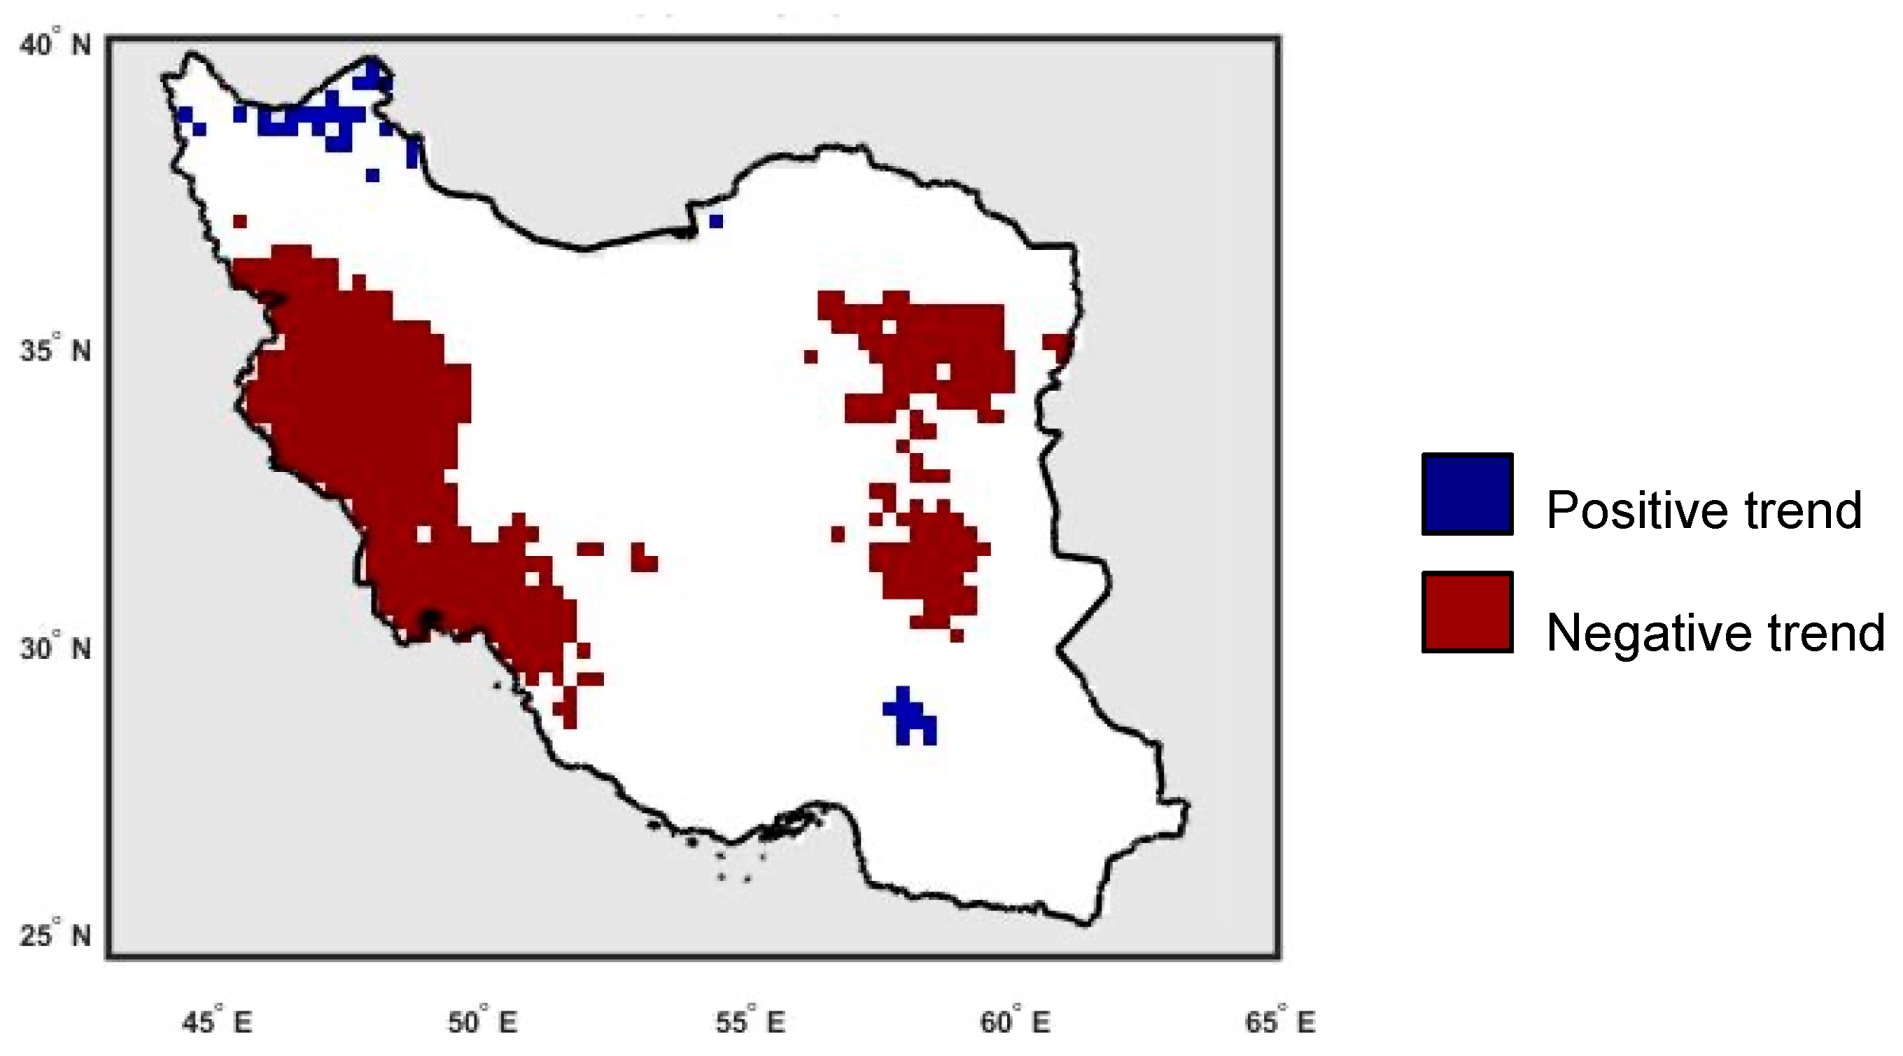
4.1. Annual Trend Analysis
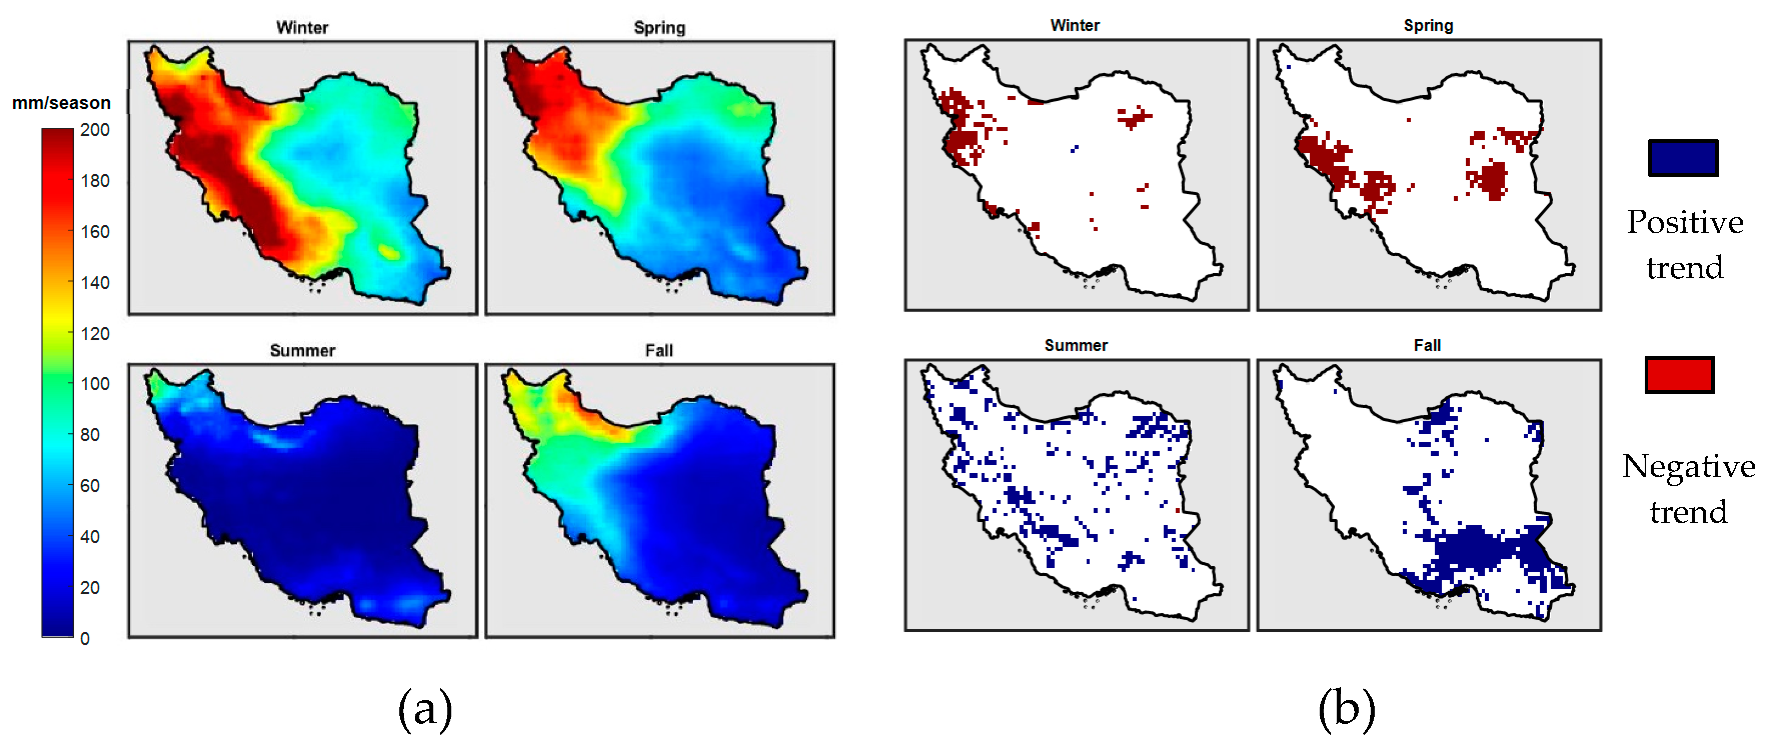
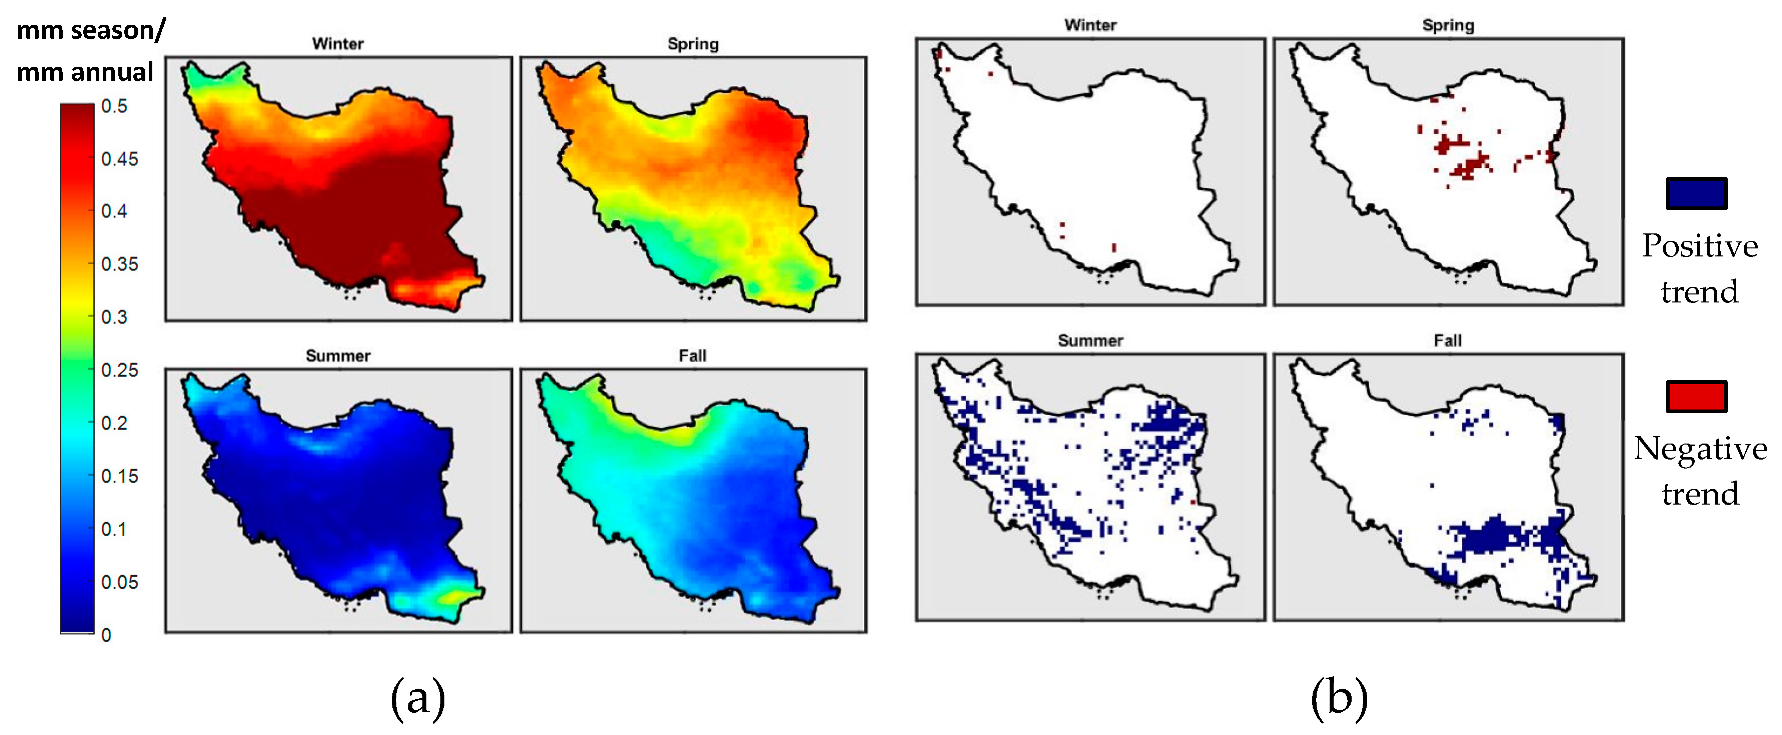
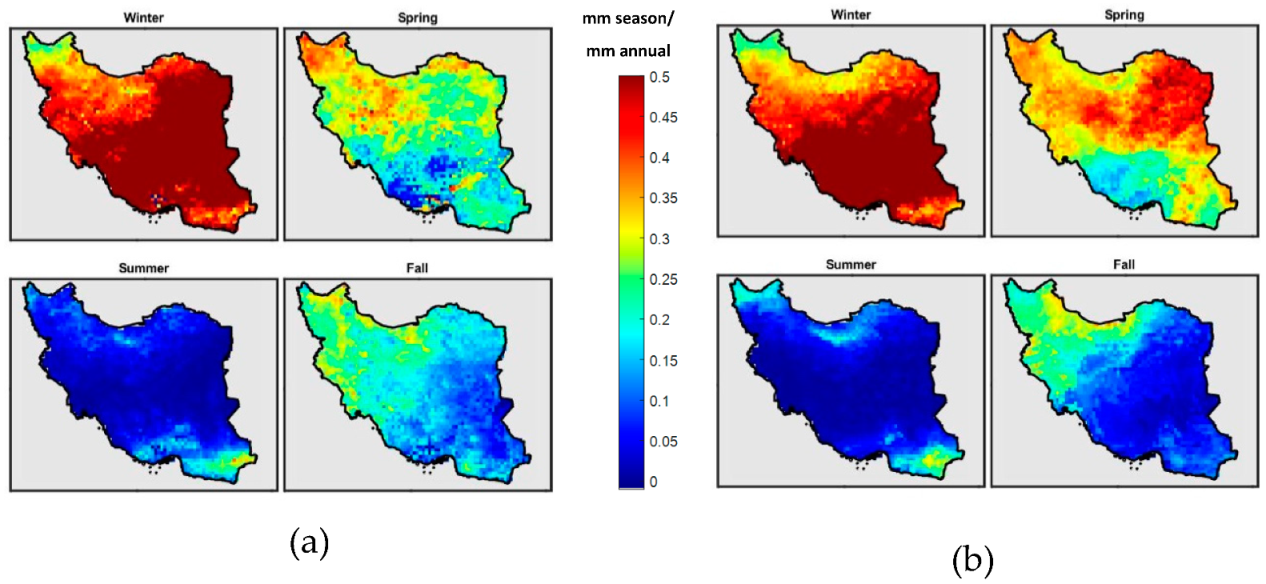
4.2. Seasonal Trend Analysis
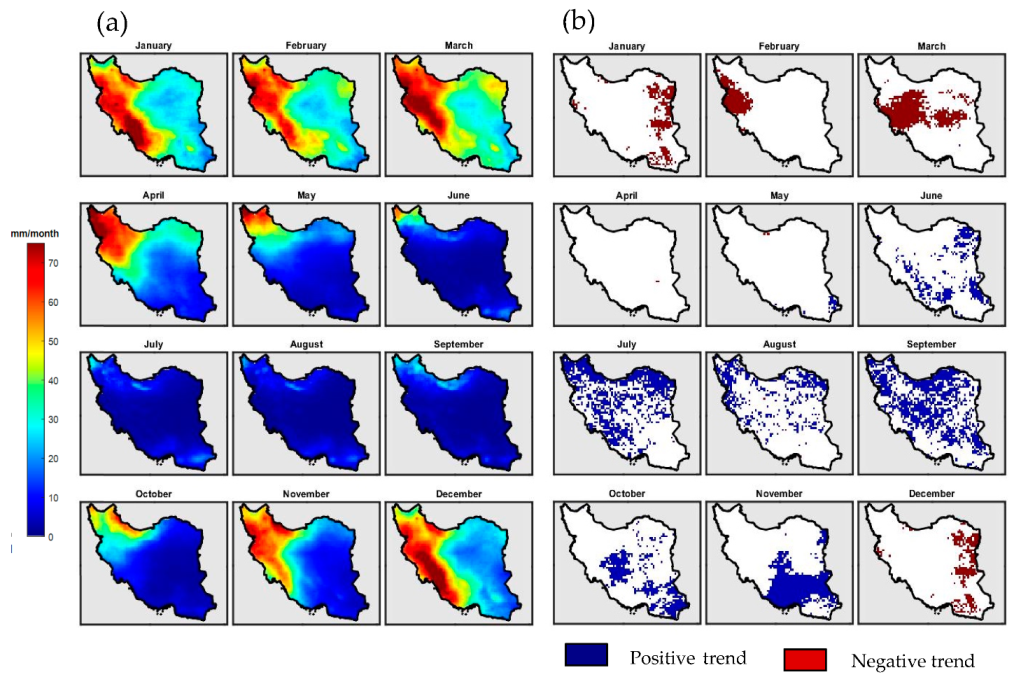
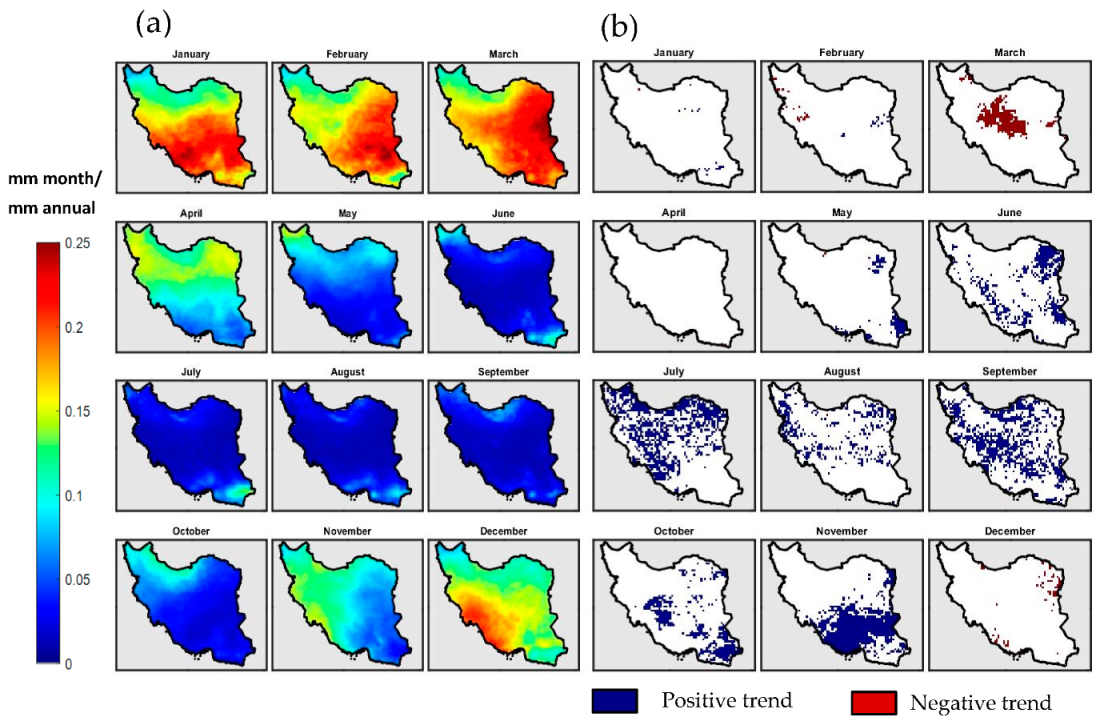
4.3. Monthly Trend Analysis
5. Discussion
6. Conclusions
Author Contributions
Funding
Acknowledgments
Conflicts of Interest
References
- Wu, P.; Christidis, N.; Stott, P. Anthropogenic impact on Earth’s hydrological cycle. Nat. Clim. Chang. 2013, 3, 807–810. [Google Scholar] [CrossRef]
- Tabari, H.; Aghajanloo, M.B. Temporal pattern of aridity index in Iran with considering precipitation and evapotranspiration trends. Int. J. Climatol. 2013, 33, 396–409. [Google Scholar] [CrossRef]
- Madani, K.; AghaKouchak, A.; Mirchi, A. Iran’s socio-economic drought: Challenges of a water-bankrupt nation. Iran. Stud. 2016, 49, 997–1016. [Google Scholar] [CrossRef]
- Vaghefi, S.A.; Keykhai, M.; Jahanbakhshi, F.; Sheikholeslami, J.; Ahmadi, A.; Yang, H.; Abbaspour, K.C. The future of extreme climate in Iran. Sci. Rep. 2019, 9, 1–11. [Google Scholar] [CrossRef] [PubMed] [Green Version]
- Dore, M.H. Climate change and changes in global precipitation patterns: What do we know? Environ. Int. 2005, 31, 1167–1181. [Google Scholar] [CrossRef]
- Greve, P.; Orlowsky, B.; Mueller, B.; Sheffield, J.; Reichstein, M.; Seneviratne, S.I. Global assessment of trends in wetting and drying over land. Nat. Geosci. 2014, 7, 716–721. [Google Scholar] [CrossRef]
- Nguyen, P.; Thorstensen, A.; Sorooshian, S.; Hsu, K.; Aghakouchak, A.; Ashouri, H.; Tran, H.; Braithwaite, D. Global precipitation trends across spatial scales using satellite observations. Bull. Am. Meteorol. Soc. 2018, 99, 689–697. [Google Scholar] [CrossRef]
- Ma, Z.; Xu, Y.; Peng, J.; Chen, Q.; Wan, D.; He, K.; Shi, Z.; Li, H. Spatial and temporal precipitation patterns characterized by TRMM TMPA over the Qinghai-Tibetan plateau and surroundings. Int. J. Remote Sens. 2018, 39, 3891–3907. [Google Scholar] [CrossRef]
- Belay, A.S.; Fenta, A.A.; Yenehun, A.; Nigate, F.; Tilahun, S.A.; Moges, M.M.; Dessie, M.; Adgo, E.; Nyssen, J.; Chen, M. Evaluation and Application of Multi-Source Satellite Rainfall Product CHIRPS to Assess Spatio-Temporal Rainfall Variability on Data-Sparse Western Margins of Ethiopian Highlands. Remote Sens. 2019, 11, 2688. [Google Scholar] [CrossRef] [Green Version]
- Raja, N.B.; Aydin, O. Trend analysis of annual precipitation of Mauritius for the period 1981–2010. Meteorol. Atmos. Phys. 2019, 131, 789–805. [Google Scholar] [CrossRef]
- Banerjee, A.; Chen, R.; E Meadows, M.; Singh, R.; Mal, S.; Sengupta, D. An Analysis of Long-Term Rainfall Trends and Variability in the Uttarakhand Himalaya Using Google Earth Engine. Remote Sens. 2020, 12, 709. [Google Scholar] [CrossRef] [Green Version]
- Sadeghi, M.; Asanjan, A.A.; Faridzad, M.; Nguyen, P.; Hsu, K.; Sorooshian, S.; Braithwaite, D. PERSIANN-CNN: Precipitation Estimation from Remotely Sensed Information Using Artificial Neural Networks–Convolutional Neural Networks. J. Hydrometeorol. 2019, 20, 2273–2289. [Google Scholar] [CrossRef]
- Guo, B.; Zhang, J.; Meng, X.; Xu, T.; Song, Y. Long-term spatio-temporal precipitation variations in China with precipitation surface interpolated by ANUSPLIN. Sci. Rep. 2020, 10, 1–17. [Google Scholar] [CrossRef] [PubMed]
- Ashouri, H.; Hsu, K.-L.; Sorooshian, S.; Braithwaite, D.K.; Knapp, K.R.; Cecil, L.D.; Nelson, B.R.; Prat, O.P. PERSIANN-CDR: Daily precipitation climate data record from multisatellite observations for hydrological and climate studies. Bull. Am. Meteorol. Soc. 2015, 96, 69–83. [Google Scholar] [CrossRef] [Green Version]
- Hsu, K.-l.; Gao, X.; Sorooshian, S.; Gupta, H.V. Precipitation estimation from remotely sensed information using artificial neural networks. J. Appl. Meteorol. 1997, 36, 1176–1190. [Google Scholar] [CrossRef]
- Sorooshian, S.; Hsu, K.-L.; Gao, X.; Gupta, H.V.; Imam, B.; Braithwaite, D. Evaluation of PERSIANN system satellite-based estimates of tropical rainfall. Bull. Am. Meteorol. Soc. 2000, 81, 2035–2046. [Google Scholar] [CrossRef] [Green Version]
- Sadeghi, M.; Akbari Asanjan, A.; Faridzad, M.; Afzali Gorooh, V.; Nguyen, P.; Hsu, K.; Sorooshian, S.; Braithwaite, D. Evaluation of PERSIANN-CDR Constructed Using GPCP V2. 2 and V2. 3 and A Comparison with TRMM 3B42 V7 and CPC Unified Gauge-Based Analysis in Global Scale. Remote Sens. 2019, 11, 2755. [Google Scholar] [CrossRef] [Green Version]
- Arvor, D.; Funatsu, B.M.; Michot, V.; Dubreuil, V. Monitoring rainfall patterns in the southern amazon with PERSIANN-CDR data: Long-term characteristics and trends. Remote Sens. 2017, 9, 889. [Google Scholar] [CrossRef] [Green Version]
- Chen, F.; Gao, Y. Evaluation of precipitation trends from high-resolution satellite precipitation products over Mainland China. Clim. Dyn. 2018, 51, 3311–3331. [Google Scholar] [CrossRef]
- Sobral, B.S.; de Oliveira-Júnior, J.F.; Alecrim, F.; Gois, G.; Muniz-Júnior, J.G.; de Bodas Terassi, P.M.; Pereira-Júnior, E.R.; Lyra, G.B.; Zeri, M. PERSIANN-CDR based characterization and trend analysis of annual rainfall in Rio De Janeiro State, Brazil. Atmos. Res. 2020, 238, 104873. [Google Scholar] [CrossRef]
- Guo, H.; Bao, A.; Liu, T.; Chen, S.; Ndayisaba, F. Evaluation of PERSIANN-CDR for meteorological drought monitoring over China. Remote Sens. 2016, 8, 379. [Google Scholar] [CrossRef] [Green Version]
- Zambrano, F.; Wardlow, B.; Tadesse, T.; Lillo-Saavedra, M.; Lagos, O. Evaluating satellite-derived long-term historical precipitation datasets for drought monitoring in Chile. Atmos. Res. 2017, 186, 26–42. [Google Scholar] [CrossRef]
- Lai, C.; Zhong, R.; Wang, Z.; Wu, X.; Chen, X.; Wang, P.; Lian, Y. Monitoring hydrological drought using long-term satellite-based precipitation data. Sci. Total Environ. 2019, 649, 1198–1208. [Google Scholar] [CrossRef] [PubMed]
- Zhao, H.; Ma, Y. Evaluating the Drought-Monitoring Utility of Four Satellite-Based Quantitative Precipitation Estimation Products at Global Scale. Remote Sens. 2019, 11, 2010. [Google Scholar] [CrossRef] [Green Version]
- Bai, X.; Wu, X.; Wang, P. Blending long-term satellite-based precipitation data with gauge observations for drought monitoring: Considering effects of different gauge densities. J. Hydrol. 2019, 577, 124007. [Google Scholar] [CrossRef]
- Bai, X.; Shen, W.; Wu, X.; Wang, P. Applicability of long-term satellite-based precipitation products for drought indices considering global warming. J. Environ. Manag. 2020, 255, 109846. [Google Scholar] [CrossRef]
- Katiraie-Boroujerdy, P.-S.; Ashouri, H.; Hsu, K.-l.; Sorooshian, S. Trends of precipitation extreme indices over a subtropical semi-arid area using PERSIANN-CDR. Theor. Appl. Climatol. 2017, 130, 249–260. [Google Scholar] [CrossRef] [Green Version]
- Alijanian, M.; Rakhshandehroo, G.R.; Mishra, A.K.; Dehghani, M. Evaluation of satellite rainfall climatology using CMORPH, PERSIANN-CDR, PERSIANN, TRMM, MSWEP over Iran. Int. J. Climatol. 2017, 37, 4896–4914. [Google Scholar] [CrossRef]
- Khalighi-Sigaroodi, S.; Ghaljaee, E.; Moghaddamnia, A.; Malekian, A.; Zhang, F. Evaluation of TRMM-3B42v7 and PERSIANN-CDR daily-precipitation products for the southern slopes of Alborz mountains, Iran. In Proceedings of the International Archives of the Photogrammetry, Remote Sensing & Spatial Information Sciences, Karaj, Iran, 12–14 October 2019. [Google Scholar]
- Salmani-Dehaghi, N.; Samani, N. Spatiotemporal assessment of the PERSIANN family of satellite precipitation data over Fars Province, Iran. Theor. Appl. Climatol. 2019, 138, 1333–1357. [Google Scholar] [CrossRef]
- Fallah, A.; Rakhshandehroo, G.R.; Berg, P.O.S.; Orth, R. Evaluation of precipitation datasets against local observations in Southwestern Iran. Int. J. Climatol. 2019. [Google Scholar] [CrossRef] [Green Version]
- Mosaffa, H.; Shirvani, A.; Khalili, D.; Khalili, D.; Sorooshian, S. Post and near real-time satellite precipitation products skill over Karkheh River Basin in Iran. Int. J. Remote Sens. 2020. [Google Scholar] [CrossRef]
- Miri, M.; Masoudi, R.; Raziei, T. Performance Evaluation of Three Satellites-Based Precipitation Data Sets Over Iran. J. Indian Soc. Remote Sens. 2019, 47, 2073–2084. [Google Scholar] [CrossRef]
- Hosseini-Moghari, S.M.; Araghinejad, S.; Ebrahimi, K. Spatio-temporal evaluation of global gridded precipitation datasets across Iran. Hydrol. Sci. J. 2018, 63, 1669–1688. [Google Scholar] [CrossRef]
- Alijanian, M.; Rakhshandehroo, G.R.; Mishra, A.; Dehghani, M. Evaluation of remotely sensed precipitation estimates using PERSIANN-CDR and MSWEP for spatio-temporal drought assessment over Iran. J. Hydrol. 2019, 579, 124189. [Google Scholar] [CrossRef]
- Raziei, T.; Daryabari, J.; Bordi, I.; Modarres, R.; Pereira, L.S. Spatial patterns and temporal trends of daily precipitation indices in Iran. Clim. Chang. 2014, 124, 239–253. [Google Scholar] [CrossRef]
- Balling, R.C.; Keikhosravi Kiany, M.S.; Sen Roy, S.; Khoshhal, J. Trends in extreme precipitation indices in Iran: 1951–2007. Adv. Meteorol. 2016, 2016, 2456809. [Google Scholar] [CrossRef] [Green Version]
- Khalili, K.; Tahoudi, M.N.; Mirabbasi, R.; Ahmadi, F. Investigation of spatial and temporal variability of precipitation in Iran over the last half century. Stoch. Environ. Res. Risk Assess. 2016, 30, 1205–1221. [Google Scholar] [CrossRef]
- Modarres, R.; da Silva, V.d.P.R. Rainfall trends in arid and semi-arid regions of Iran. J. Arid Environ. 2007, 70, 344–355. [Google Scholar] [CrossRef]
- Tabari, H.; Talaee, P.H. Temporal variability of precipitation over Iran: 1966–2005. J. Hydrol. 2011, 396, 313–320. [Google Scholar] [CrossRef]
- Kousari, M.R.; Ekhtesasi, M.R.; Tazeh, M.; Naeini, M.A.S.; Zarch, M.A.A. An investigation of the Iranian climatic changes by considering the precipitation, temperature, and relative humidity parameters. Theor. Appl. Climatol. 2011, 103, 321–335. [Google Scholar] [CrossRef]
- Tabari, H.; Somee, B.S.; Zadeh, M.R. Testing for long-term trends in climatic variables in Iran. Atmos. Res. 2011, 100, 132–140. [Google Scholar] [CrossRef]
- Some’e, B.S.; Ezani, A.; Tabari, H. Spatiotemporal trends and change point of precipitation in Iran. Atmos. Res. 2012, 113, 1–12. [Google Scholar]
- Soltani, S.; Saboohi, R.; Yaghmaei, L. Rainfall and rainy days trend in Iran. Clim. Chang. 2012, 110, 187–213. [Google Scholar] [CrossRef]
- Zarenistanak, M.; Dhorde, A.G.; Kripalani, R. Trend analysis and change point detection of annual and seasonal precipitation and temperature series over southwest Iran. J. Earth Syst. Sci. 2014, 123, 281–295. [Google Scholar] [CrossRef]
- Shirvani, A. Change in annual precipitation in the northwest of I ran. Meteorol. Appl. 2017, 24, 211–218. [Google Scholar] [CrossRef] [Green Version]
- Zarei, A.R.; Masoudi, M. Trend assessment of climate changes in Iran. EQA-Int. J. Environ. Qual. 2019, 34, 1–16. [Google Scholar]
- Knapp, K.R. Scientific data stewardship of International Satellite Cloud Climatology Project B1 global geostationary observations. J. Appl. Remote Sens. 2008, 2, 023548. [Google Scholar] [CrossRef]
- Rossow, W.B.; Schiffer, R.A. ISCCP cloud data products. Bull. Am. Meteorol. Soc. 1991. [Google Scholar] [CrossRef]
- Fulton, R.A.; Breidenbach, J.P.; Seo, D.-J.; Miller, D.A.; O’Bannon, T. The WSR-88D rainfall algorithm. Weather Forecast. 1998, 13, 377–395. [Google Scholar] [CrossRef]
- Lin, Y.; Mitchell, K.E. 1.2 the NCEP stage II/IV hourly precipitation analyses: Development and applications. In Proceedings of the 19th Conference Hydrology, American Meteorological Society, San Diego, CA, USA, 9–13 January 2005. [Google Scholar]
- Nguyen, P.; Shearer, E.J.; Tran, H.; Ombadi, M.; Hayatbini, N.; Palacios, T.; Huynh, P.; Braithwaite, D.; Updegraff, G.; Hsu, K. The CHRS Data Portal, an easily accessible public repository for PERSIANN global satellite precipitation data. Sci. Data 2019, 6, 1–10. [Google Scholar] [CrossRef] [Green Version]
- McKee, T.B.; Doesken, N.J.; Kleist, J. The relationship of drought frequency and duration to time scales. In Proceedings of the 8th Conference on Applied Climatology, Anaheim, CA, USA, 17–22 January 1993; pp. 179–183. [Google Scholar]
- Mann, H.B. Nonparametric tests against trend. Econom. J. Econom. Soc. 1945, 13, 245–259. [Google Scholar] [CrossRef]
- Kendall, M. Rank Correlation Measures; Charles Griffin: London, UK, 1975; Volume 202, p. 15. [Google Scholar]


| References | # Weather Stations | Study Period | Study Area | Key results |
|---|---|---|---|---|
| Annual precipitation | ||||
| [39] | 20 | 1955–2000 | Arid and semi-arid regions | Significant trend in two stations |
| [40] | 41 | 1966–2005 | Throughout Iran | Significant negative trend in seven stations, which occurred mostly in the northwest |
| [41] | 26 | 1951–2005 | Throughout Iran | Significant negative trend in three stations, which observed in the northwest |
| [42] | 13 | 1966–2005 | West, South and southwest | Significant negative trend in only one station |
| [43] | 28 | 1967–2006 | East, central, and north | Significant negative trend in three stations, which happened mainly in the northwest |
| [44] | 33 | 1951–2005 | Throughout Iran | Significant negative trend in five stations |
| [45] | 50 | 1950–2007 | Southwestern | Significant positive trend in seven stations |
| [38] | 34 | 1961–2010 | Throughout Iran | Significant negative trend in eight stations |
| [46] | 18 | 1951–2010 | Throughout Iran | Significant negative trend in five stations |
| [47] | 40 | 1967–2014 | Throughout Iran | 30.5% of the country has been significant decreased |
| Seasonal precipitation | ||||
| [40] | 41 | 1966–2005 | Throughout Iran | No significant trend in autumn |
| [43] | 28 | 1967–2006 | East, central, and north | Significant negative trends in five stations in the winter observed mostly in northern |
| [45] | 50 | 1950–2007 | Southwestern | No significant trends were detected in summer |
| [38] | 34 | 1961–2010 | Throughout Iran | Significant negative trend spring and winter in six stations, one station in summer |
| Monthly precipitation | ||||
| [39] | 20 | 1955–2000 | Arid and semi-arid regions | Four stations with significant positive trends in March and significant negative trends in April in four stations |
| [41] | 26 | 1951–2005 | Throughout Iran | The significant negative trends in most part of Iran in months (June, July, and August) |
| [44] | 33 | 1951–2005 | Throughout Iran | Most negative significant trends were detected in April in six stations |
© 2020 by the authors. Licensee MDPI, Basel, Switzerland. This article is an open access article distributed under the terms and conditions of the Creative Commons Attribution (CC BY) license (http://creativecommons.org/licenses/by/4.0/).
Share and Cite
Mosaffa, H.; Sadeghi, M.; Hayatbini, N.; Afzali Gorooh, V.; Akbari Asanjan, A.; Nguyen, P.; Sorooshian, S. Spatiotemporal Variations of Precipitation over Iran Using the High-Resolution and Nearly Four Decades Satellite-Based PERSIANN-CDR Dataset. Remote Sens. 2020, 12, 1584. https://doi.org/10.3390/rs12101584
Mosaffa H, Sadeghi M, Hayatbini N, Afzali Gorooh V, Akbari Asanjan A, Nguyen P, Sorooshian S. Spatiotemporal Variations of Precipitation over Iran Using the High-Resolution and Nearly Four Decades Satellite-Based PERSIANN-CDR Dataset. Remote Sensing. 2020; 12(10):1584. https://doi.org/10.3390/rs12101584
Chicago/Turabian StyleMosaffa, Hamidreza, Mojtaba Sadeghi, Negin Hayatbini, Vesta Afzali Gorooh, Ata Akbari Asanjan, Phu Nguyen, and Soroosh Sorooshian. 2020. "Spatiotemporal Variations of Precipitation over Iran Using the High-Resolution and Nearly Four Decades Satellite-Based PERSIANN-CDR Dataset" Remote Sensing 12, no. 10: 1584. https://doi.org/10.3390/rs12101584