Article

A Remote Sensing-Based Application of Bayesian Networks for Epithermal Gold Potential Mapping in Ahar-Arasbaran Area, NW Iran

by
Seyed Mohammad Bolouki
1,
Hamid Reza Ramazi
1,
Abbas Maghsoudi
1,*,
Amin Beiranvand Pour
2,3 and
Ghahraman Sohrabi
4
1
Department of Mining and Metallurgical Engineering, Amirkabir University of Technology (Tehran Polytechnic), Tehran 1591634311, Iran
2
Korea Polar Research Institute (KOPRI), Songdomirae-ro, Yeonsu-gu, Incheon 21990, Korea
3
Institute of Oceanography and Environment (INOS), University Malaysia Terengganu (UMT), 21030 Kuala Nerus, Terengganu, Malaysia
4
Department of Geology, University of Mohaghegh Ardabili, Ardabil 5619911367, Iran
*
Author to whom correspondence should be addressed.
Remote Sens. 2020, 12(1), 105; https://doi.org/10.3390/rs12010105
Submission received: 19 November 2019 / Revised: 19 December 2019 / Accepted: 23 December 2019 / Published: 27 December 2019

Abstract

:
Mapping hydrothermal alteration minerals using multispectral remote sensing satellite imagery provides vital information for the exploration of porphyry and epithermal ore mineralizations. The Ahar-Arasbaran region, NW Iran, contains a variety of porphyry, skarn and epithermal ore deposits. Gold mineralization occurs in the form of epithermal veins and veinlets, which is associated with hydrothermal alteration zones. Thus, the identification of hydrothermal alteration zones is one of the key indicators for targeting new prospective zones of epithermal gold mineralization in the Ahar-Arasbaran region. In this study, Landsat Enhanced Thematic Mapper+ (Landsat-7 ETM+), Landsat-8 and Advanced Spaceborne Thermal Emission and Reflection Radiometer (ASTER) multispectral remote sensing datasets were processed to detect hydrothermal alteration zones associated with epithermal gold mineralization in the Ahar-Arasbaran region. Band ratio techniques and principal component analysis (PCA) were applied on Landsat-7 ETM+ and Landsat-8 data to map hydrothermal alteration zones. Advanced argillic, argillic-phyllic, propylitic and hydrous silica alteration zones were detected and discriminated by implementing band ratio, relative absorption band depth (RBD) and selective PCA to ASTER data. Subsequently, the Bayesian network classifier was used to synthesize the thematic layers of hydrothermal alteration zones. A mineral potential map was generated by the Bayesian network classifier, which shows several new prospective zones of epithermal gold mineralization in the Ahar-Arasbaran region. Besides, comprehensive field surveying and laboratory analysis were conducted to verify the remote sensing results and mineral potential map produced by the Bayesian network classifier. A good rate of agreement with field and laboratory data is achieved for remote sensing results and consequential mineral potential map. It is recommended that the Bayesian network classifier can be broadly used as a valuable model for fusing multi-sensor remote sensing results to generate mineral potential map for reconnaissance stages of epithermal gold exploration in the Ahar-Arasbaran region and other analogous metallogenic provinces around the world.

Graphical Abstract

1. Introduction

Hydrothermal alteration minerals such as iron oxide/hydroxides, Al-OH, Fe,Mg-OH, S-O, Si-OH and carbonate minerals show indicative spectral absorption signatures in the visible near-infrared (VNIR) and the shortwave infrared (SWIR) regions [1,2,3,4,5]. Multispectral and hyperspectral satellite imagery with appropriate spatial and spectral resolution is capable of recording the spectral absorption signatures of alteration minerals in the VNIR and SWIR spectral bands, which can be utilized to map and remotely detect hydrothermal alteration mineral zones associated with ore mineraliztions [6,7,8,9]. Recently, the identification of alteration mineral zones using remote sensing sensors is effectively and extensively used for prospecting porphyry copper, epithermal gold, uranium and massive sulfide deposits in metallogenic provinces around the world [10,11,12,13,14,15,16,17,18,19,20].
The Landsat-7 ETM+ imagery was used for mapping hydrothermal alteration zones related to epithermal gold and porphyry copper deposits in the reconnaissance stages of copper/gold exploration. The VNIR spectral bands of Landsat-7 ETM+ were utilized to map iron oxides/hydroxide minerals (gossan), while, SWIR spectral bands were used to detect hydroxyl-bearing minerals and carbonates [21,22,23,24]. Band ratio of 3/1 is able to identify iron oxides/hydroxide minerals (hematite, jarosite and limonite) due to strong reflectance in band 3 (0.63–0.69 μm) and absorption features in band 1 (0.45–0.52 μm) [23]. Band ratio of 5/7 is sensitive to hydroxyl-bearing minerals and carbonates because of reflectance features in band 5 (1.55–1.75 μm) and strong absorption in band 7 (2.09–2.35 μm) [23,25,26,27]. Equivalent bands of Landsat-8, bands 2 and 4 responsive to iron oxides/hydroxides and bands 6 and 7 sensitive to hydroxyl-bearing minerals and carbonates, were also extensively used for hydrothermal alteration mineral mapping in metallogenic provinces [12,16,18,19,28]. Discrimination of particular alteration zones and minerals (i.e., argillic, phyllic propylitic zones and muscovite, chlorite and kaolinite) using Landsat-7 ETM+ and Landsat-8 VNIR and SWIR spectral bands is challenging due to position, number and the broad extent of the bands [28,29].
Distinguishing hydrothermal alteration zones or specific mineral assemblages as an indicator of high-economic potential zones for exploring ore mineralizations is significant [30,31]. For instance, discriminating phyllic zone within the inner shell of mineralization for porphyry copper exploration is important and identification of advanced argillic zone situated near to hydrothermal mineralization system for epithermal gold exploration is essential [32,33,34]. ASTER multispectral satellite imagery is particularly useful for discriminating hydrothermal alteration zones associated with ore mineralizations [6,35,36,37]. Three VNIR spectral bands of ASTER (0.52 to 0.86 μm) are used for detecting iron oxide/hydroxide minerals [6,35]. Phyllic, argillic and propylitic zones are recognizable using six SWIR spectral bands of ASTER (1.6 to 2.43 μm) [35]. The phyllic zone containing illite/muscovite (sericite) and strong Al-OH absorption feature at 2.20 μm is detectable by band 6 of ASTER. The argillic zone (kaolinite/alunite) has Al-OH absorption feature at 2.17 μm, which is coincident with band 5 of ASTER. The propylitic zone comprising epidote, chlorite and calcite shows absorption features around 2.35 μm, which is corresponded with band 8 of ASTER [35,36,37,38,39].
Obtaining information from multi-sensor remote sensing satellite data can produce relevant results for detailed mapping of hydrothermal alteration zones [12]. The integration of the multi-sensor remote sensing results using geostatistical techniques can quickly produce a mineral potential map, which indicates the high potential zones of hydrothermal ore mineralizations [40]. Mineral potential map of a region is generally realized as the predictive classification of each spatial unit contains a particular combination of spatially coincident predictor patterns as mineralized or barren zones [41,42]. A Bayesian network is a type of statistical model (probabilistic graphical model), which represents a set of variables and their conditional dependencies through a Directed Acyclic Graph (DAG) [41,43,44]. It predicts the likelihood that anyone of several possible known causes was the contributing factor [45]. Therefore, the Bayesian network is a suitable model for fusing thematic layers derived from multi-sensor remote sensing satellite data to generate a mineral potential map.
In this study, Landsat-7 ETM+, Landsat-8 and ASTER multispectral remote sensing datasets were used to identify hydrothermal alteration zones associated with epithermal gold mineralization and producing thematic layers, which were afterward synthesized in the Bayesian networks for mineral potential mapping in the Ahar-Arasbaran region, NW Iran (Figure 1). This region is a well-endowed terrain hosting numerous known epithermal gold deposits, several porphyry and skarn Cu-Mo deposits, Fe skarn deposits, Cu-Au porphyry deposits and many other Cu-Mo-Au vein mineralizations [46,47,48,49,50]. The deposits are associated with extensive hydrothermal alteration mineral zones such as iron oxide/hydroxides, advanced argillic, argillic, phyllic and propylitic [48,51,52]. The Ahar-Arasbaran region has a high potential for exploring new prospective zones of epithermal gold and many other ore mineralizations. Pazand et al. [52] used ASTER satellite data for hydrothermal alteration mapping in the Ahar area, NW Iran. Some geo-referenced hydrothermal alteration maps were produced using RBD (relative absorption band depth), principal component analysis (PCA), minimum noise fraction (MNF) and matched filtering (MF) image processing techniques for reconnaissance stages of porphyry copper exploration in the Ahar area. Furthermore, Pazand and Hezarkhani [48] generated a favorability map for Cu porphyry mineralization using fuzzy modeling in the Ahar–Arasbaran zone, NW Iran. There is no comprehensive remote sensing research available for mapping hydrothermal alteration zones in the Ahar-Arasbaran region using multi-sensor satellite imagery at a regional scale. This study characterizes an extensive remote sensing analysis using Landsat-7 ETM+, Landsat-8 and ASTER datasets, detailed fieldwork and laboratory analysis for mineral potential mapping. Therefore, the primary purposes of the research are: (1) to map hydrothermal alteration mineral zones using Landsat-7 ETM+, Landsat-8 and ASTER datasets by implementing the band ratio, PCA, RBD and selective PCA image processing techniques; (2) to generate mineral potential map by fusing the alteration thematic layers using the Bayesian networks; and (3) to verify the high potential zones by checking the detailed global positioning system (GPS) surveying in the field and analyzing several microphotographs of hydrothermal alteration minerals and gold mineralization and X-ray diffraction (XRD) analysis of collected rock samples from alteration zones.

2. Geology of the Ahar-Arasbaran Region

The Ahar-Arasbaran region covers an area (approximately 5000 km2), which is located between latitudes 38°07′N and 38°52′N and longitudes 46°15′E and 47°30′E (Figure 1). This zone is a part of Lesser Caucasus metallogenic zone and corresponding to tectono-magmatism activity from Jurassic to Quaternary [46,47,53,54]. The volcano-plutonic belt of Arasbaran-Lesser Caucasus is a mountainous and uplifted region that trending NW-SE from Georgia (Republic of Azerbaijan) to the Talesh region (Iran) [50]. Magmatic rocks in the Ahar-Arasbaran region containing tholeiitic, calc-alkaline, high calcium calc-alkaline, shoshonitic, adakitic, alkaline sodic and potassic rocks, which are formed in a continental margin of a subduction zone (subduction to post-collision stages) [50]. Cretaceous units (limestone and shale), flysch deposits, Paleocene and Eocene volcanic rocks are also exposed in the study area (Figure 1). Several intrusive bodies having different sizes are penetrated in the Eocene and Cretaceous volcanic-sedimentary rocks and caused folding, alteration and mineralization [49,51]. Structural trends of folds, faults, dykes and veins are mostly NW-SE, E-W and NE-SW, which show the main stresses that affected the study area [50,51].
The intrusion of the Oligo-Miocene batholiths into the Cretaceous to Eocene sedimentary and volcano-sedimentary deposits along with hydrothermal fluids is formed intensive alteration halos in the Eocene volcanic rocks [55]. The alteration zones such as argillic, silica and alunite are associated with Cu, Au, Mo, Ag, Pb and Zn mineralizations [49]. Moreover, several skarn zones are formed in the contact zone of intrusive masses with Cretaceous limestone [51]. A variety of ore mineralization zones were identified in the Ahar-Arasbaran region, including Fe, Cu, Pb-Zn, Cu-Au, Cu-Mo, Au-Ag, Fe-Au, which occurred in the form of sprains, veins, stokes and in relation to the skarn zones [49,51]. The gold mineralization in the study area is observed in the form of epithermal veins [55]. The Masjed Daghi (Siahrood) and AliJavad valley (Anjerd) are considered to be Au-Cu porphyry deposits. The Sharaf-abad, Hize-jan, Nabi-jan, Zailig, Miveh-roud, Safi-Khanloo, Noqdouz, Anniqh and Khoyneh-roud are known as epithermal gold deposits in the study area [55].

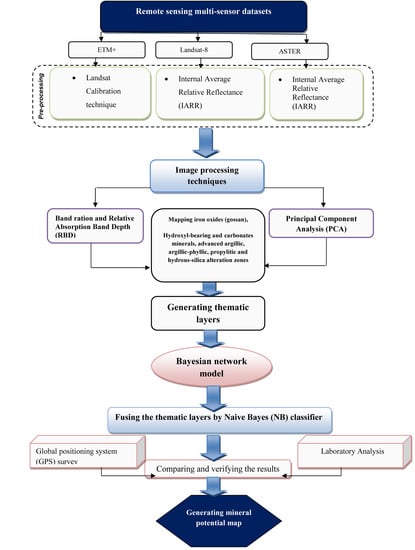
3. Materials and Methods

3.1. Remote Sensing Data and Pre-Processing

The Landsat-7 ETM+, Landsat-8 and ASTER satellite remote sensing datasets were used in this study. Technical characteristics of Landsat-7 ETM+, Landsat-8 and ASTER remote sensing sensors are summarized in Table 1.
A Landsat-7 ETM+ scene (Path/Raw: 168/33) covering the Ahar-Arasbaran region was acquired on 15 June 2001. A level 1T (terrain corrected) Landsat 8 scene (Path/Raw: 168/33) was also acquired on 10 June 2016 for the study area. Seven level 1B ASTER scenes covering the study area were acquired from 8 to 29 June 2002–2004. The data were obtained from the U.S. Geological Survey’s Earth Resources Observation System (EROS) Data Center (EDC) (https://earthexploere.usgs.gov/ and https://glovis.usgs.gov). The scenes were cloud-free and have been already georeferenced to the UTM zone 38 North projection using the WGS-84 datum. For converting Landsat-7 ETM+ digital numbers to spectral radiance or exoatmospheric reflectance (reflectance above the atmosphere), the Landsat Calibration technique was adopted from Chander et al. [60]. This technique uses the published post-launch gain and offset values [61,62]. The mathematical details of the technical performance can be found in Chander et al. [60]. For Landsat 8 and ASTER datasets, Internal Average Relative Reflectance (IARR) was utilized. The IARR calibration method normalizes images to a scene average spectrum [61,63]. This is particularly effective for reducing imaging spectrometer data to relative reflectance in an area where no ground measurements exist and little is known about the scene [61,63]. It works best for arid areas with no vegetation. The IARR calibration is performed by calculating an average spectrum for the entire scene and using this as the reference spectrum. Apparent reflectance is calculated for each pixel of the image by dividing the reference spectrum into the spectrum for each pixel. The atmospheric correction was implemented to ASTER data after Crosstalk correction [64]. Moreover, the 15 m VNIR bands of ASTER were resampled to the 30 m SWIR bands using the cubic convolution technique. A masking procedure was applied to the remote sensing datasets for removing the effects of vegetation and Quaternary deposits. Normalized Difference Vegetation Index (NDVI) was calculated for the remote sensing datasets. As a result, a masking procedure was executed to the remote sensing datasets for eliminating the influences of sparse vegetation in the study area. For Quaternary deposits, we used geological map of the study area to identify the location of the Quaternary units, then a masking procedure was implemented to the remote sensing datasets. The ENVI (Environment for Visualizing Images, http://www.exelisvis.com) version 5.2 and ArcGIS version 10.3 (Esri, Redlands, CA, USA) software packages were employed for processing Landsat-7 ETM+, Landsat-8 and ASTER data.

3.2. Image Processing Techniques

The main objective of image processing techniques implemented in this analysis is to map hydrothermal alteration zones for generating thematic layers from multi-sensor remote sensing satellite datasets. Then, the thematic layers are fused using a Bayesian network model for producing a mineral potential map of the Ahar-Arasbaran region. Fieldwork and laboratory analysis are used to verify the results. A view of the methodological flowchart applied in this study is shown in Figure 2.

3.2.1. Band Ratio

The band ratio technique is one of the most applicable image processing techniques for mapping hydrothermal alteration minerals and zones such muscovite, jarosite, gossan, advanced argillic, argillic-phyllic, propylitic and hydrous silica-affected zones [23,39,65,66]. The digital number (DN) value of a band is partitioned by the DN value of other band, which highlights particular spectral features related to minerals or materials that planned to map [23]. Relative Absorption Band Depth (RBD) uses three-point ratio formulation for detecting typical absorption features related to a specific mineral or alteration zone [67]. For a specific absorption characteristic, the numerator is the sum of the bands demonstrating the shoulders and the denominator is the band positioned adjoining the absorption feature minimum [67]. Therefore, the absorption intensities attributed to Al-OH, Fe,Mg-OH, Si-OH and CO3 can be formulated for mapping advanced argillic, argillic-phyllic, propylitic and hydrous-silica alteration zones [35].
In this study, iron oxide-bearing minerals (gossan) were mapped using Landsat-7 ETM+ band ratio of band 3/band 1, Landsat-8 band ratio of band 4/band 2 and ASTER band ratio of band 2/band 1, respectively [23,39,68]. As mentioned before, iron oxide/hydroxide minerals contain diagnostic spectral characteristics coincident with selected bands of different sensors [19,23,28,35]. Hydroxyl-bearing (Al-OH and Fe,Mg-OH) and carbonates minerals were typically identified in the study region through Landsat-7 ETM+ band ratio of band 5/band 7, Landsat-8 band ratio of band 6/band 7 and ASTER band ratio of band 4/band 9, respectively [23,28,29,68]. The advanced argillic alteration (alunite and kaolinite) contain strong absorption about 2.17 μm (corresponding band 5 of ASTER) [35], thus, ASTER band ratio of band 4/band 6 was used to highlight the advanced argillic alteration zone [69] in the study area. The argillic-phyllic alteration zone is mostly dominated by sericite (muscovite/illite), which shows high absorption feature at 2.20 μm (equivalent to band 6 of ASTER) [35,36]. This alteration zone was detected by applying ASTER band ratio of band 5/band 6 [36]. Moreover, the propylitic alteration zone was mapped using ASTER band ratio of band 5/band 8 [35,36] in this analysis.
For detailed mapping of advanced argillic, argillic-phyllic, propylitic and hydrous silica-affected alteration zones, four RBDs were adopted using SWIR bands of ASTER (Table 2). The RDB1 = (band 4 + band 6)/band 5 for detecting advanced argillic zone, the RDB2 = (band 5 + band 7)/band 6 for identifying argillic-phyllic zone [38,39], the RDB3 = (band 6 + band 9)/(band 7+ band 8) for discriminating propylitic zone and RDB4 = (band 5 + band 8)/(band 6 + band 7) for mapping hydrous silica zone [70] were implemented.

3.2.2. Principal Component Analysis

Principal Component Analysis (PCA) is a statistical approach that broadly and successfully used for decorrelation and enhancing the spectral contrast in remote sensing imagery [71]. This method transforms a number of correlated variables into several uncorrelated variables that termed PCs [72]. The eigenvector loadings (uncorrelated linear combinations) of variables were selected in a consistent way that each PC contains a smaller variance of extracted linear combination, sequentially [71,73]. The eigenvector loadings include key information linked to spectral features, which are anticipated from spectral bands of a remote sensing sensor [74]. For instance, a PC contains strong eigenvector loadings for indicative bands (reflection and absorption bands) of an alteration mineral with opposite signs enhances that mineral as bright pixels (if loading is positive in reflection band) or dark pixels (if loading is negative in reflection band) in the PC image [74,75].
In this study, the PCA method was implemented to some selected bands of Landsat-7 ETM+, Landsat-8 and ASTER using a covariance matrix for mapping hydrothermal alteration minerals. For identifying iron oxide-affected zones (gossan), bands 1, 3, 4 and 5 of Landsat-7 ETM+, bands 2, 4, 5 and 6 of Landsat-8 and bands 1, 2, 3 and 4 of ASTER were selected. The selected bands cover the iron oxide/hydroxide spectral properties in the VNIR region [3,4,5]. The eigenvector matrix for the selected bands and satellite sensors for mapping iron oxide/hydroxides are shown in Table 3A–C. Bands 1, 4, 5 and 7 of Landsat-7 ETM+, bands 2, 5, 6 and 7 of Landsat-8 and bands 1, 3, 4 and 6 of ASTER were used for detecting hydroxyl-bearing minerals. These bands cover the reflectance and absorption features of OH-minerals in the VNIR and SWIR regions [1,2]. Table 4A–C shows the eigenvector matrix for the selected bands and satellite sensors for mapping hydroxyl-bearing minerals. The reflectance properties and absorption intensities related to Al-OH, Fe,Mg-OH and CO3 can be mapped by ASTER VNIR+SWIR bands [23,35,38]. Bands 1, 4, 6 and 7 of ASTER were utilized for mapping advanced argillic zone. Bands 1, 3, 5 and 6 of ASTER were executed to detect argillic-phyllic zone. Bands 1, 3, 5 and 8 of ASTER were performed for discriminating propylitic alteration zone. Table 5A–C shows eigenvector matrix for the selected bands of ASTER for mapping advanced argillic, argillic-phyllic and propylitic alteration zones. After implementing the algorithms for all band ratios and PCAs, firstly the obtained DN values were normalized, then the X+3S was used to obtain definite anomaly. It means all the DN values showing the number more than the X+3S have been considered as target alteration minerals and zones.

3.3. Bayesian Networks Model

A Bayesian network is an interpreted directed acyclic graph (DAG), which is able to model uncertain relationships between variables in a complex system [76,77,78,79]. The mathematical concepts of the Bayesian networks model can be summarized as follows [43,77]. The subclass x belongs to a class of a set of classes ω1, ω2, …, ωn, if a class is defined by the highest conditional probability. The conditional probability is calculated using Equation (1):
P ( ω i | x ) = P ( ω i | x ) P ( ω i ) P ( x ) ,
where P(x) is the non-conditional probability and P(ωi) is the prior probability of each class. The prior probability is calculated by dividing the number of samples in each class by the total number of samples [43]. In this method, a probability distribution function (PDF) is assigned for each class. Then, the training data is exploited to estimate the parameters involved in the PDF. The covariance matrix and the mean vector are calculated as the parameters of a Gaussian probability function provided that the data is normally distributed [76]. In other words, it is mathematically formulated as follows:
g i x = 1 ( 2 π ) m 2 i 1 2 exp 1 2 x μ i T i 1 x μ i × P ( ω i ) i = 1 , 2 , , c
In this equation (Equation (2)), m is the number of variables, which is added to μi and Σi of the mean vector and an m*m covariance matrix of the ith class that calculated using Equations (3) and (4):
μ i = 1 n i j = 1 n i x j i
i = 1 n i j = 1 n i x j i μ i x j i μ i T .
Bayesian networks model uses a structural graph known as a DAG to represent the knowledge about different domains or random variables [41]. The DAG is defined by the nodes and the directed edges. The former and the latter represent random variables and the relationship among variables, respectively, as it is shown in Figure 3. As can be seen from the direction of the arrow in Figure 3, there is a direct relationship between xi and xj. The xi (known as the parent node) is a dependent variable of the xj (known as an offspring node) [43].
There are different forms of Bayesian networks (See Reference [41] and references therein). One of the most popular forms of Bayesian networks is Naive Bayes (NB) classifier [80,81]. It is a simple structured algorithm with a single parent node and a number of offspring nodes [76,79,80]. A typical NB classifier diagram is shown in Figure 4. It is not only straightforward and easy to construct but also, no training procedure is required in the NB classifier [81]. The NB classifier undertakes comprehensive conditional independence between characteristics, which is impracticable for several predictor patterns utilized in mineral potential mapping [41]. In this study, the NB classifier was used for fusing the thematic layers derived from Landsat-7 ETM+, Landsat-8 and ASTER satellite sensors for generating a mineral potential map for the Ahar-Arasbaran region.

3.4. Fieldwork Data and Laboratory Analysis

The locations of hydrothermal alteration zones and their spatial relation with epithermal gold mineralization were systematically investigated using Global positioning system (GPS) survey in the study area (several field campaigns from June to August 2018). A handheld GPS (Garmin, Etrex Vista Hcx), with an average accuracy of 7 m, was used to record the hydrothermal alteration locations. Numerous field photographs and rock samples (120 samples) were collected from the alteration zones and ore mineralization. Rock samples were utilized for laboratory analysis to prepare thin and polished sections of altered rocks and ore mineralization as well as X-ray diffraction (XRD) analysis. Mineralogical compositions were analyzed using an Asenware AW-XDM 300 X-ray diffractometer (voltage: 40 Kv, current: 30 mA, step time: 1s and step size: 0.05° 2θ) at the Zarazma Mineral Studies Company, Tehran, Iran. Besides, the confusion matrix (error matrix) and Kappa Coefficient were calculated for hydrothermal alteration mineral mapping derived from remote sensing analysis versus field data.

4. Results

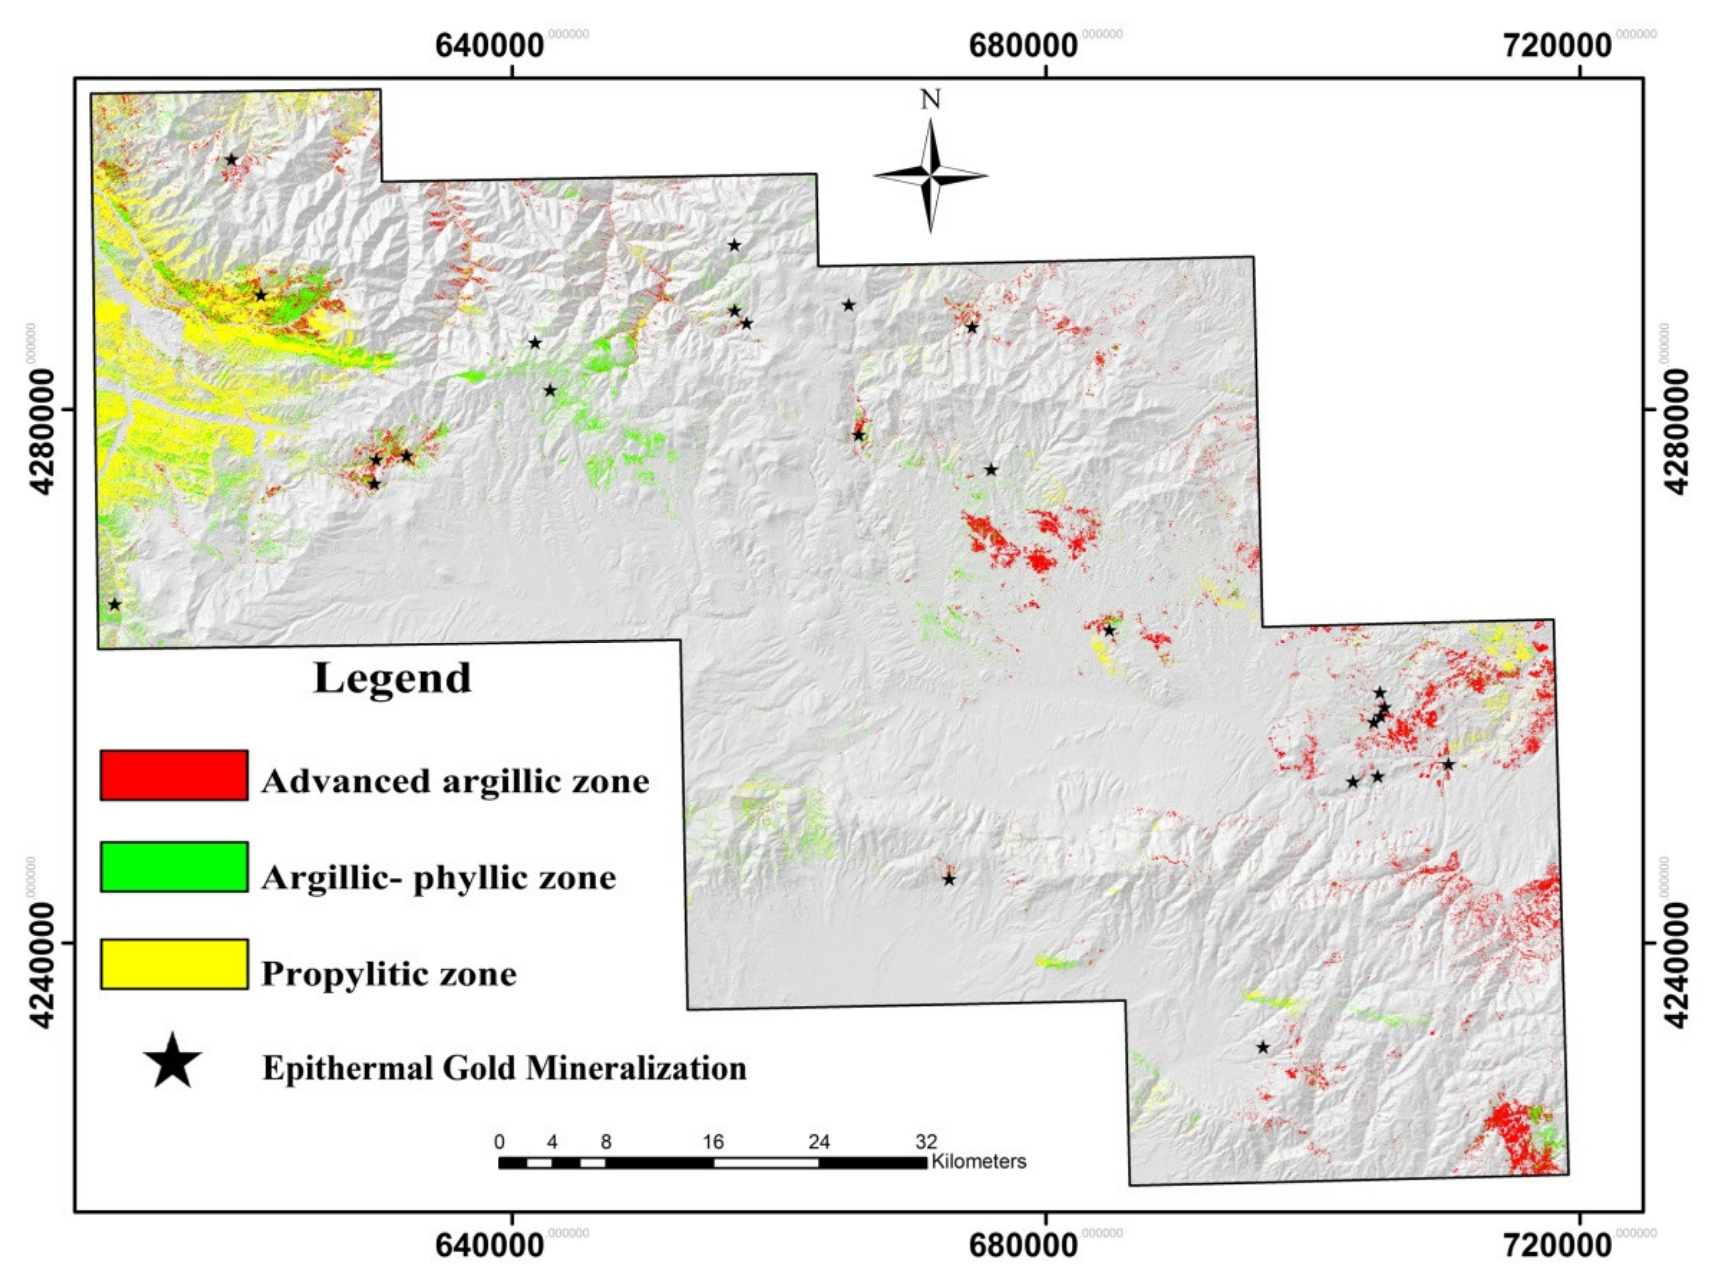
4.1. Generating Thematic Layers Using Multi-Sensor Remote Sensing Data

Figure 5A–C shows iron oxide/hydroxide zones (gossan) derived from 3/1 band ratio of Landsat-7 ETM+, 4/2 band ratio of Landsat-8 and 2/1 band ratio of ASTER, respectively. Figure 5A shows the spatial distribution of iron oxide/hydroxide minerals derived from the Landsat-7 ETM+ band ratio as red pixels. Most of the documented gold mineralizations are associated with iron oxide/hydroxide zones (gossan), especially in the northern and northeastern parts of the study area. The spatial distribution of iron oxide/hydroxide minerals in the Landsat-8 band ratio image (Figure 5B) is almost similar to Landsat-7 ETM+ resultant image. But, it is extensive in some locations in the northwestern and southeastern parts of the selected subset scene. Figure 5C shows the ASTER band ratio resultant image. The surface abundance of iron oxide/hydroxides in this image is lower compared to the Landsat-7 ETM+ and Landsat-8 results. However, the high concentration of iron oxide/hydroxides was mapped in the northwestern part of the study area using the ASTER band ratio (Figure 5C). Regarding the geological map of the Ahar-Arasbaran region (see Figure 1), iron oxide/hydroxide minerals were mapped along with geological lineament features and igneous rocks (granite, granodiorite, biotite granite, andesite, dasite and basalt), volcano sedimentary units and massive and bedded limestone.
Typically, hydroxyl-bearing (Al-OH and Fe,Mg-OH) minerals and carbonates zones were mapped in Figure 6A–C using the 5/7 band ratio of Landsat-7 ETM+ (A), 6/7 band ratio of Landsat-8 (B) and 4/9 band ratio of ASTER (C). The green pixels depict OH-alteration and carbonates, which are normally concentrated in igneous rock (granite, granodiorite, biotite granite, andesite and dasite), volcano sedimentary units and limestone. The OH-alteration minerals are more strongly mapped in the Landsat-8 and ASTER resultant images compared to Landsat-7 ETM+ image (Figure 6A–C). Almost all of the documented gold occurrences have an adjoining spatial relationship with hydroxyl-bearing alteration minerals; it is particularly observable in the Landsat-8 resultant image (Figure 6B). It may be due to the high signal to noise radiometer performance of Landsat-8 data, which allows detecting subtle variation in surface conditions [58].
ASTER band ratios were used to specifically map the surface distribution of hydrothermal alteration zones in the study area. Figure 7A–C shows the advanced argillic alteration zone derived from 4/6 (A), the argillic-phyllic alteration zone derived from 5/6 (B) and the propylitic alteration zone derived from 5/8 (C), respectively. Concerning the geology map of the study area (see Figure 1), the advanced argillic alteration zone is corresponded to igneous, volcano sedimentary units and limestone; the argillic-phyllic alteration zone is associated with granite, granodiorite, andesite, dasite, rhyolite, trachyte, limestone units and sedimentary rocks; the propylitic alteration zone is typically concentrated with andesite, dasite, volcano sedimentary units and limestone (Figure 7A–C). The high surface abundance of argillic-phyllic and propylitic alteration zones was mainly mapped in the northwestern part of the study area. The spatial distribution of the advanced argillic alteration zone (Figure 7A) is intensely matched with hydroxyl-bearing mineral zones that mapped by Landsat-7 ETM+ and Landsat-8 band ratio images (Figure 6A,B). The documented gold mineralizations have closer spatial relationship with the advanced argillic alteration zone compared to the argillic-phyllic and propylitic alteration zones in the study area.
Detailed mapping of advanced argillic, argillic-phyllic, propylitic and hydrous silica-affected alteration zones was obtained using the RDB1 (4 + 6/5), RDB2 (5 + 7/6), RDB3 (6 + 9/7 + 8) and RDB4 (5 + 8/6 + 7) of ASTER (Figure 8). Red pixels show advanced argillic zones, which are mostly distributed in the eastern and southeastern parts of the selected subset scene. Comparison to the geological map of the study area (see Figure 1), suggests that the advanced argillic zones are typically associated with granite and granodiorite rocks. Some of the documented gold mineralizations show close spatial relationship with the advanced argillic zones, especially in the eastern part of the study area (Figure 8). Argillic-phyllic alteration zone depict as green pixels. This alteration zone is distributed in many parts of the study area, which are normally associated with andesite, dasite, volcano sedimentary units and sedimentary rocks (e.g., sandstone, siltstone, marl and conglomerates). Due to high content of detrital clays (montmorillonite, illite and kaolinite) in the sedimentary units, argillic-phyllic alteration zone could also be mapped with exposures of sedimentary rocks [35]. The surface abundance of hydrous silica-affected alteration zone (blue pixels) is low and mostly detected in the southwestern and northwestern parts of the study zone (Figure 8). The hydrous silica zone was commonly identified with sedimentary units (conglomerates and sandstone), although this alteration zone is correspondingly adjacent to some of the gold mineralization zones in the northwestern part of the study area. Propylitic zone (yellow pixels) was strongly mapped in the selected subset scene (Figure 8). With regard to the geology map of the study area (see Figure 1), the spatial distribution of the propylitic zone typically corresponds with massive and bedded limestone, volcano sedimentary units and intermediate to mafic igneous rocks. It is because carbonates and alteration products of mafic minerals contain the strong contribution of CO3 and Fe,Mg-OH mineral groups, which produce similar spectral features to propylitic alteration zone. However, this alteration zone is one of the dominant mineral assemblages that mapped near to the gold mineralization zones, especially in the northwestern and northern parts of the study area (Figure 8).
Table 3 shows the eigenvector loadings derived from PCA for mapping iron oxide/hydroxides (gossan) using bands 1, 3, 4 and 5 of Landsat-7 ETM+, bands 2, 4, 5 and 6 of Landsat-8 and bands 1, 2, 3 and 4 of ASTER. Analyzing the eigenvector loadings for Landsat-7 ETM+ selected bands (1, 3, 4 and 5) indicates that the PCA3 contains unique contribution (magnitude and sign of eigenvector loadings) of iron oxide/hydroxide minerals. The PCA3 has moderate loadings of band 1 (0.420) and strong loadings of band 5 (−0.780) with opposite signs (Table 3A). Band 1 (0.45–0.52 µm) of Landsat-7 ETM+ is positioned at absorption features of iron oxide/hydroxides (band 1 is considered an absorption band herein), while band 5 (1.55–1.75 µm) of Landsat-7 ETM+ is positioned at reflectance properties of iron oxide/hydroxides (band 5 is considered a reflection band herein). Thus, iron oxide/hydroxide minerals appear as dark pixels in the PCA3 due to negative sing in the reflection band (band 5), which were subsequently converted to bright pixels by negation. Figure 9A shows the resultant PCA3 image. Iron oxide/hydroxide minerals (red pixels) are mainly represented in the northern and northwestern parts of the study area, which are associated with some of the gold occurrences. However, a number of epithermal gold mineralizations do not show the spatial relationship with high abundance of iron oxide/hydroxide minerals, which are located in the southern and western parts of the study area.
Analysis of the eigenvector loadings of Landsat-8 selected bands (2, 4, 5 and 6) shows that the PCA2 can be used for mapping oxide/hydroxide minerals. The PCA2 contains moderate to strong contribution of bands 2 (−0.374) and 5 (−0.555) as absorption bands and strong contribution of band 6 (0.741) with a positive sign as reflection band (Table 3B). As a result, iron oxide/hydroxide minerals manifest as bright pixels in the PCA2 image (Figure 9B). The spatial distribution of iron oxide/hydroxide minerals (red pixels) in Landsat-8 results is identical with Landsat-7 ETM+ PCA3 image but it is stronger in some parts, mainly in the southern and western sectors. Iron oxide/hydroxide minerals can be detected using the PCA3 derived from ASTER selected bands (1, 2, 3 and 4). The PCA3 shows moderate to strong loadings in absorption bands, including band 1 (−0.396), band 2 (−0.539) and band 3 (−0.259) with a negative sign and strong and positive loading in band 4 (0.695) as reflection band (Table 3C). Hence, iron oxide/hydroxide minerals represent bright pixels (Figure 9C). A higher abundance of iron oxide/hydroxide minerals was mapped in the ASTER PCA2 image compared to Landsat-7 ETM+ and Landsat-8 PCA images, which is typically matched with most of the gold mineralizations.
The pixels contain iron oxide/hydroxide minerals mapped by PCA images show a better spatial relationship with the gold mineralization zones compared to band ratio images (see Figure 5A–C). It indicates that the selective PCA can specially detect the alteration pixels in the spatial domain. Table 4 shows the eigenvector loadings derived from PCA for mapping hydroxyl-bearing minerals using bands 1, 4, 5 and 7 of Landsat-7 ETM+, bands 2, 5, 6 and 7 of Landsat-8 and bands 1, 3, 4 and 6 of ASTER. Considering the eigenvector loadings contain unique contribution of hydroxyl-bearing minerals in the absorption and reflection bands, it is discernible that the PCA4 includes the unique contribution of OH-minerals for all selected datasets (Table 4A–C). The PCA4 derived from Landsat-7 ETM+ selected bands (1, 4, 5 and 7) shows a strong negative loading in band 5 (−0.599) and a strong positive loading in band 7 (0.692) (Table 4A). Because of negative loading in the reflection band (band 5), the hydroxyl-bearing minerals are represented as dark pixels in the PCA4, which are inverted to bright pixels by multiplication to −1, subsequently (Figure 10A). Surface distribution of hydroxyl-bearing minerals (green pixels) depicts in the PCA4 image of Landsat-7 ETM+. The PCA4 derived from Landsat-8 selected bands (2, 5, 6 and 7) contains a strong negative loading of band 6 (−0.643) (the reflection band) and a strong positive loading of band 7 (0.694) (the absorption band) (Table 4B). Therefore, the PCA4 image was negated to depict the OH-minerals as bright pixels. Figure 10B shows the resultant image. For ASTER selected bands (1, 3, 4 and 6), the PCA4 has a strong positive contribution of band 4 (0.567) and a strong negative contribution of band 6 (−0.649) (Table 4C). Hence, the hydroxyl-bearing minerals appear as bright pixels in the PCA4 image. Figure 10C manifests the spatial distribution of the OH-minerals as green pixels in the PCA4 image of ASTER. Comparison of the PCA images to the band ratio images (see Figure 6A–C) suggests that the pixels detected in the selective PCA method show a closer spatial relationship to the gold mineralization zones and have a stronger manifestation in the image-maps.
Table 5 shows the eigenvector loadings for mapping advanced argillic, argillic-phyllic and propylitic alteration zones using ASTER bands such as bands 1, 4, 6 and 7 for the advanced argillic zone, bands 1, 3, 5 and 6 for the argillic-phyllic zone and bands 1, 3, 5 and 8 for the propylitic zone. Considering the magnitude and sign of eigenvector loadings for mapping advanced argillic zone (Table 5A), it is evident that the PCA3 contains spectral information to map advanced argillic zone due to a strong negative loading in band 4 (−0.549) and a strong positive loading in band 6 (0.509). Dark pixels depict the alteration zone due to a negative sign in the reflection band (band 4), which are afterward converted to bright pixels. The analysis of eigenvector loadings for mapping argillic-phyllic zone indicates that the PCA4 can mainly detect argillic-phyllic zone because of the strong contribution of bands 5 (−0.733) and 6 (0.679) with inverse signs (Table 5B). Muscovite (as a typical and dominant mineral in the phyllic zone) shows strong absorption in band 6 of ASTER, while lower absorption in band 5 of ASTER [35,37]. Thus, band 5 is assumed to be a reflection band and band 6 is considered as a strong absorption band herein. As a result, argillic-phyllic zone manifests as dark pixels due to negative sign in the band 5 (reflection band). Then, dark pixels were inverted to bright pixels by negation. Propylitic alteration zone can be mapped in the PCA4 image because of strong eigenvector loadings in band 5 (−0.712) and band 8 (0.696) with opposed signs (Table 5C). Herein, band 5 is pondered as reflection band and band 8 is deliberated as absorption band. Fe,Mg-OH and CO3 mineral groups (propylitic zone: chlorite, epidote and calcite) have high absorption properties in band 8 (2.295–2.365 µm) and reflection (very low absorption) features in band 5 (2.145–2.185 µm) of ASTER [35,39]. Accordingly, propylitic alteration zone appears as dark pixels that were negated to bright pixels in the PCA4 image.
Figure 11 shows PCA image-map derived from the PCA3 image for advanced argillic mapping, the PCA4 image for argillic-phyllic zone mapping and the PCA4 image for propylitic zone mapping.
The spatial distribution of advanced argillic zones is stronger in the northeastern parts and weaker in southeastern part of the study area compared to RDBs image-map (see Figure 8). The advanced argillic zone resulting from PCA shows remarkable vicinity to the gold mineralization (Figure 11). The argillic-phyllic zone shows nearly similar surface distribution to RDBs image-map. However, the high concentration of propylitic zone was mapped in the northwestern part of the study area in the PCA image-map compared to RDBs image-map (see Figure 8). On the other hand, the propylitic zone shows lower spatial distribution in the northeastern and southeastern parts of the PCA image-map (Figure 11).

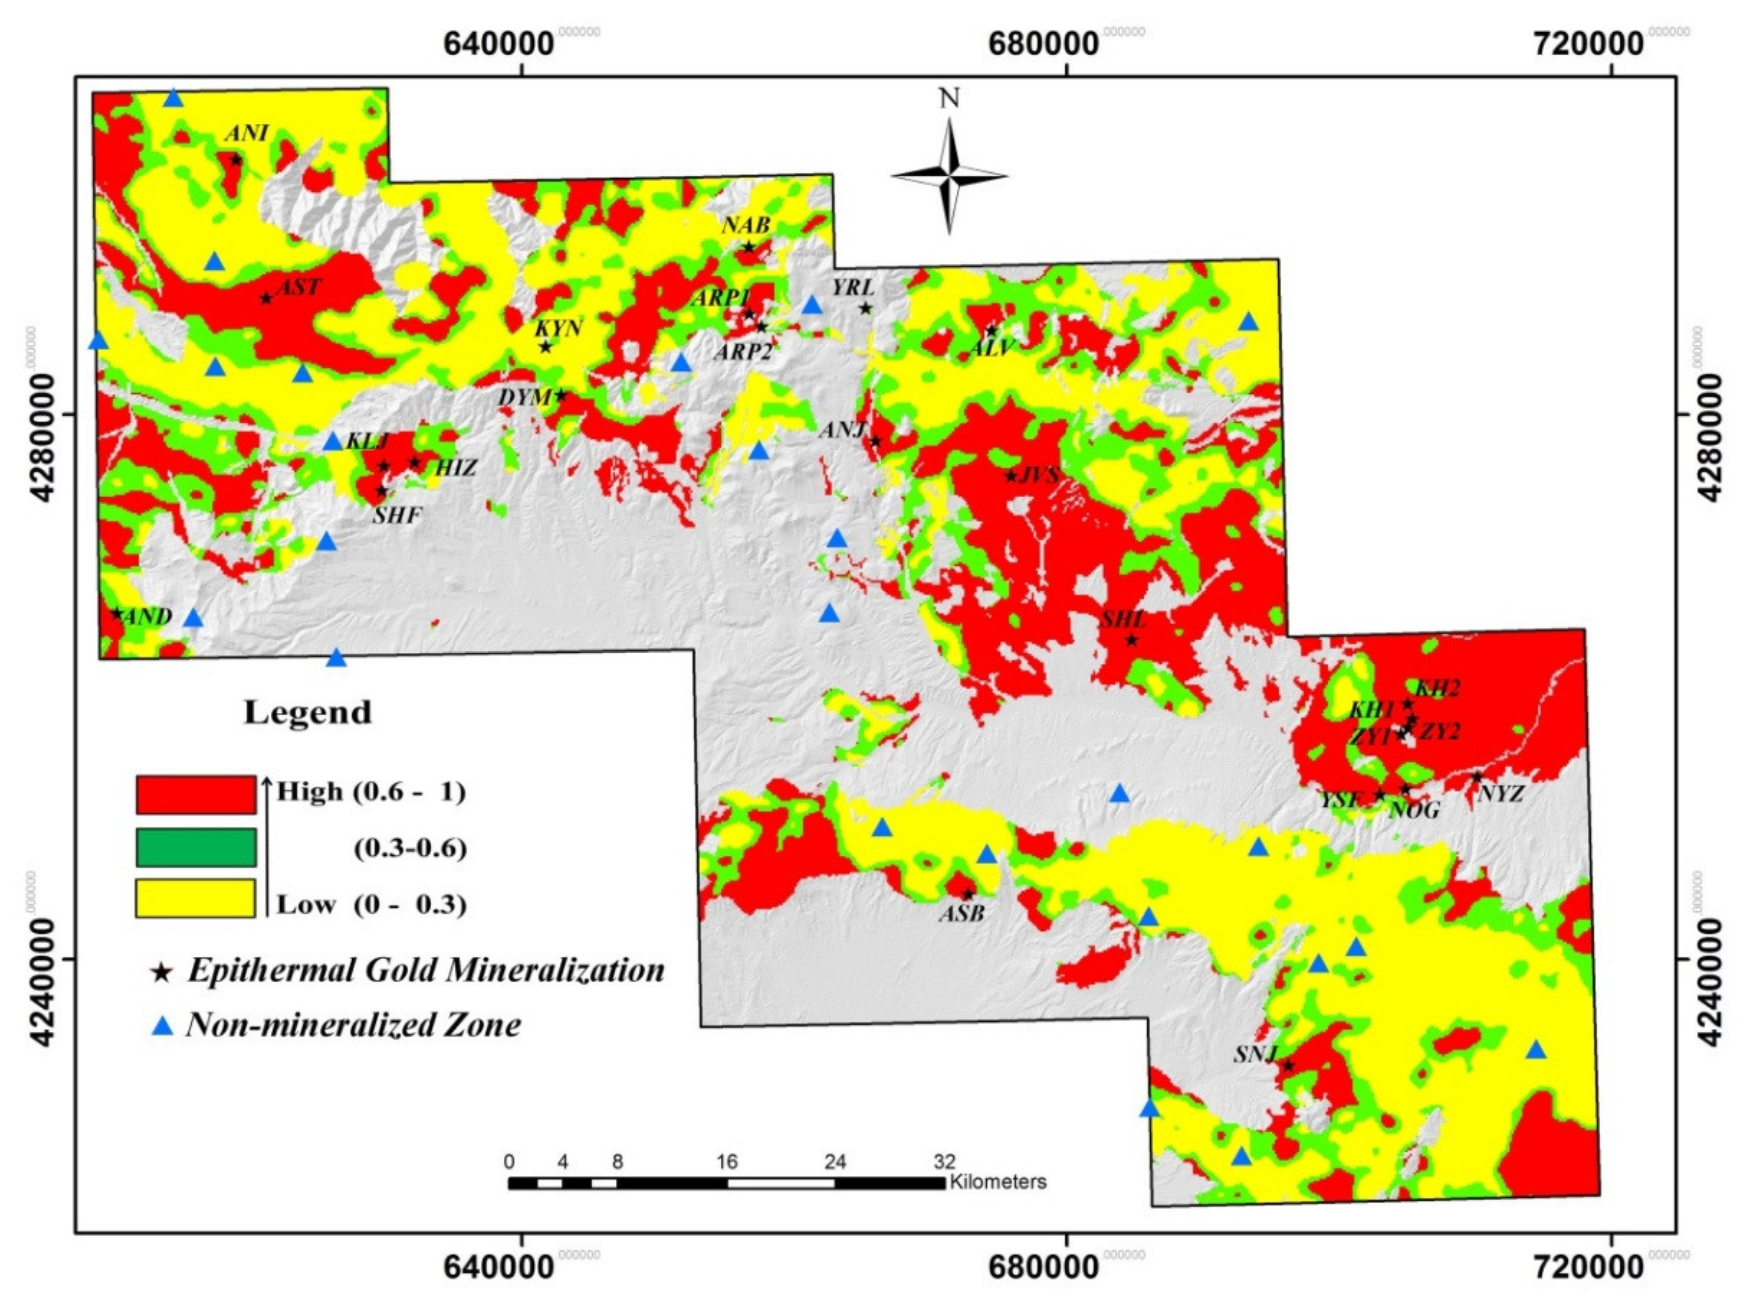
4.2. Fusing Thematic Layers Using Naive Bayes (NB) Classifier

The thematic layers of hydrothermal alteration zones derived from Landsat-7 ETM+, Landsat-8 and ASTER datasets were fused using the NB classifier to generate a mineral potential map for the Ahar-Arasbaran region. A DAG was designed for the thematic layers produced by image processing techniques in this study (Figure 12). Eight distinct layers were employed as independent predictive layers, including iron oxide minerals derived from Landsat-7 ETM+, hydroxyl-bearing minerals derived from Landsat-7 ETM+, iron oxide minerals derived from Landsat-8, hydroxyl-bearing minerals derived from Landsat-8, iron oxide minerals derived from ASTER, advanced argillic alteration derived from ASTER, argillic-phyllic alteration derived from ASTER and propylitic alteration derived from ASTER.
The DAG was used to integrate the predictor variables. It yields a posterior probability map showing the probability of gold mineralization occurrences. Subsequently, the following steps were taken to generate the posterior probability map. To train the DAG, 25 known gold mineralizations in the study area were selected as positive sites and 26 non-mineralized locations were selected as non-deposit (negative) sites, which have already been verified by field survey. In the next stage, the thematic layers (alteration image-maps) were resampled to a cell size of 150 * 150 m and a buffer zone of 300 m was considered around the positive and negative sites. The training data, the pixels superimposed by the positive and negative sites, containing a total of 468 pixels. Each pixel was considered as a vector of 8 arrays, including the values of 8 thematic (alteration) layers. To train the model, 70% of these pixels were used, while 30% of the pixels were used to validate the model generated. The calculation of the confusion matrix shows a total accuracy of 85.1%, which indicates that the model has been hypothesized and established. Having the trained NB model, all the data were used as the input of the model to generate the posterior probability map. However, the map is also required subsequent classification; thus the natural breaks algorithm [81] was used for classification of the posterior probability map. Three threshold values (produced by the foregoing algorithm) were used to generate a four-class map showing the probability of epithermal gold occurrences. The classes are highly probable (red), probable (green), moderately probable (yellow) and improbable (gray). As a result, a mineral potential map for the Ahar-Arasbaran region was produced (Figure 13). Most of the known gold mineralizations are located in the highly probable (red) zone, although a small number of the gold occurrences can be seen in the probable (green) and moderately probable (yellow) zones. Many high probable zones in the northwestern, northern, northeastern, southeastern and southwestern parts of the study area contain high potential for undiscovered epithermal gold mineralizations (Figure 13).

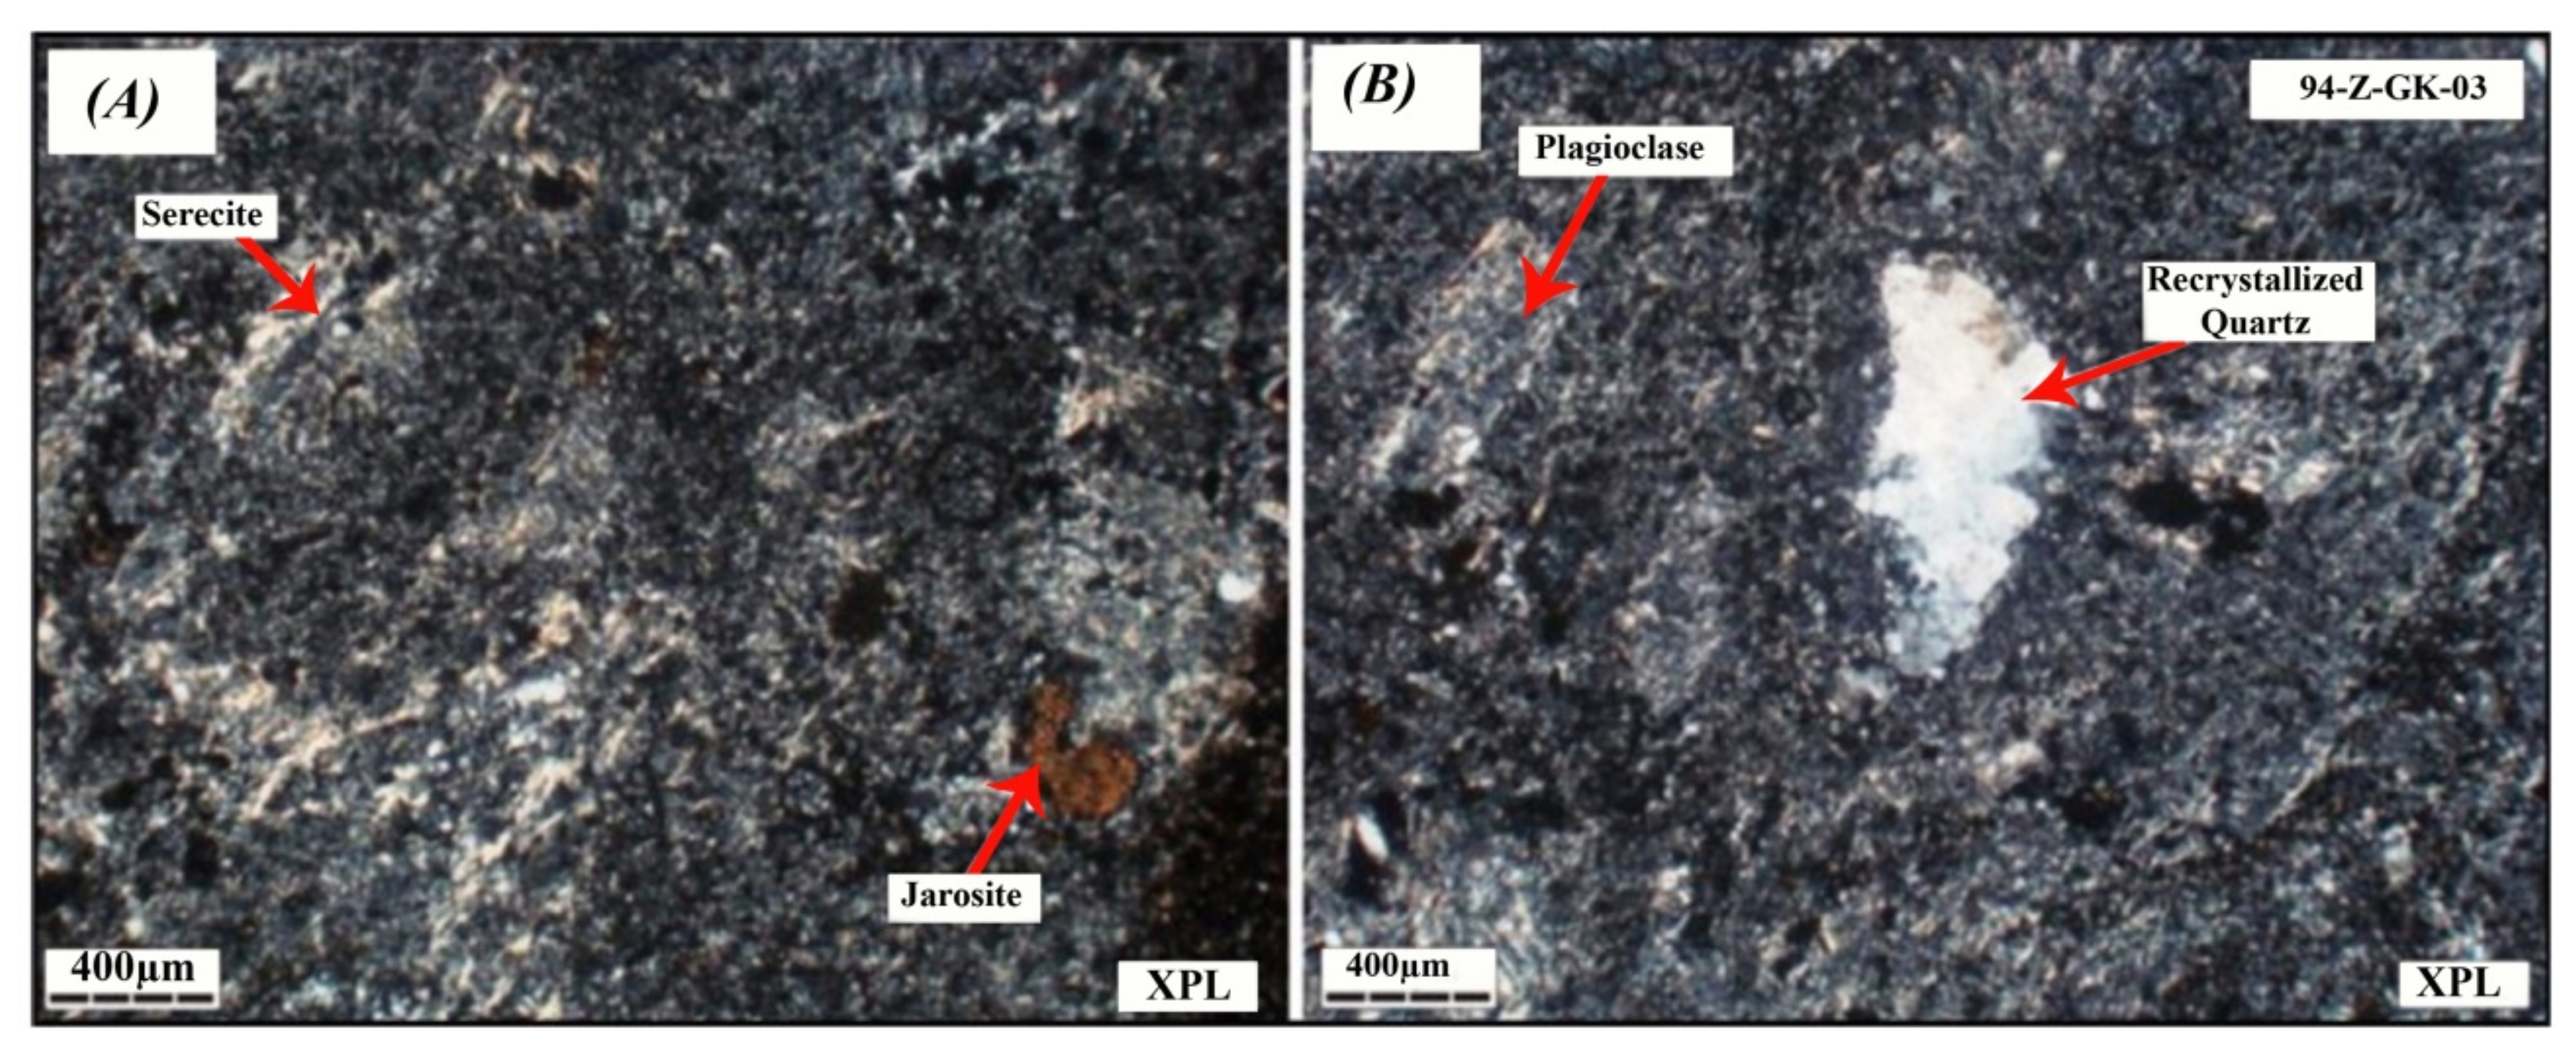
4.3. Verifying the Results Using Field Data and Laboratory Analysis

Several GPS surveys were carried out in different parts of the Ahar-Arasbaran region for verifying the mineral potential map and discovering new prospective zones of epithermal gold mineralizations, especially in highly probable zones. Numerous field photographs and rock samples were collected from different types of alteration zones related to gold mineralization such as advanced argillic, argillic-phyllic, propylitic and hydrous silica. In this investigation, some of the gold mineralization areas (highly probable zone), such as Zailig, Noghdouz, Javan-Sheikh, Nabi-Jan and Sonajil, were selected for a detailed field excursion, petrographic study and XRD analysis. The advanced argillic alteration, argillic-silica alteration, silica alteration and propylitic alteration were identified in the Zailig area (Figure 14A–D). The advanced argillic alteration is the most extensive alteration zone in the vicinity of gold mineralizations in the Zailig area (Figure 14A,B). The silica alteration is identified in the form of silica major clasts along with iron oxides (Figure 14C). The other type of alteration zones is argillic-silica alteration, which is placed around the silica veins associated with gold mineralization (Figure 14D). Figure 15A,B) shows microphotographs of argillic-silica alteration. Primary plagioclase replaced by sericite, clay minerals and jarosite (Figure 15A). Recrystallized quartz and relics of plagioclase are surrounded by clay minerals (Figure 15B). Propylitic alteration zone were also found as distal alteration zone in the Zailig area (Figure 16A–D). Secondary minerals for instance, chlorite, epidote and calcite replaced original mineralogy (feldspars) as vesicular and amygdaloidal textures in the propylitic zone (Figure 16B). Microphotographs of the propylitic zone show that the phenocrysts of plagioclase are replaced by chlorite, epidote and calcite (Figure 16C,D). Quartz is phenocrystalline and anhedral in the background, while plagioclase is euhedral and partially replaced by epidote (Figure 16C). The amygdaloidal texture is observable in Figure 16D, which amygdales are filled with calcite and quartz.
Some typical silicified and breccia (quartz veins) zones occur in altered granitic and andesitic rocks in the Noghdouz gold mineralization area (Figure 17 and Figure 18). The specimens of silicified zone show breccia and clastic textures. The cement and major clasts of the breccia textures are composed of silicate minerals (Figure 17A–C). Epithermal gold mineralization occurs in the breccia zone (quartz veins) in the altered granitic host rocks. This mineralization is also associated with advanced argillic alteration (Figure 18A,B).
Iron oxide alteration zone (limonitic-hematite rocks) and oxidized breccia with banded chalcedonic quartz are identified in Javan-Sheikh gold mineralization area (Figure 19A,B). The well-developed gossan covers (limonitic-hematite-silicic rocks) show rough and geologic relief features compared to surrounding altered rocks (Figure 19A). The size of gossan covers are around 200 to 300 m that are surrounded by more extensive zones of propylitic and phyllic-argillic alteration zones. Although, silicified zone is also associated with the gossan covers, partially. The epithermal gold mineralization of the Nabi-Jan area is located in quartz-sulfide veins and developed at the top of an intrusive body of granodiorite (Figure 20A,B). Gold mineralization is typically in the zones where intensely silicified and located in the advanced argillic alteration. In the Nabi-Jan area, the distal alteration zone is also propylitic alteration. The Sonajil gold mineralization occurs as a stock-work of thin quartz veins in granitoid rocks. The development of the argillic-phyllic alteration zone along with the siliceous zones and iron oxides were identified in the Kalijan area. Sphalerite, galena, chalcopyrite and pyrite are main sulfide mineralization associated with native gold mineralization (Figure 21A–E). Quartz, iron oxide/hydroxide and minor calcite are gangue minerals.
Mineralogical compositions of hydrothermal alteration zones were investigated by XRD analysis. Thirty samples from different hydrothermal alteration zones were analyzed for this study. Representative XRD analysis of samples collected from the iron oxide/hydroxide alteration (gossan covers), advanced argillic alteration, argillic-phyllic alteration, propylitic alteration and hydrous silica alteration (silicified zone) are shown in this paper (Figure 22A–E). Goethite, jarosite, gypsum and quartz are mineral phases that detected in the gossan cover (Figure 22A). In the advanced argillic alteration (Figure 22B), muscovite, illite, kaolinite, gypsum, orthoclase, albite and quartz are main mineralogical phases. The predominant minerals detected in the argillic-phyllic alteration are kaolinite, muscovite, illite, jarosite, albite and quartz (Figure 22C). Epidote, chlorite, calcite, albite and quartz are identified in the propylitic alteration (Figure 22D). Quartz, albite, jarosite, goethite, calcite, chlorite, gypsum and dolomite are observed in the silicified alteration zone (Figure 22E).
In this analysis, confusion matrix and Kappa Coefficient [82,83,84,85,86] were used for assessing the accuracy of alteration mineral mapping derived from remote sensing analysis versus systematic GPS surveys collected from different alteration zones during fieldwork in the study area. Thirty representative GPS points were used for calculating the confusion matrix and Kappa Coefficient in this paper. Table 6 shows the locations of hydrothermal alteration zones recorded by a systematic GPS survey. Table 7 shows the confusion matrix for alteration mineral mapping versus field data. The results show the overall accuracy of 76.66% and Kappa Coefficient of 0.71. The advanced argillic alteration, argillic-phyllic and propylitic classes show the producer’s accuracy of 83%, while the producer’s accuracy for the iron oxide/hydroxide and hydrous silica classes is 67%. The highest user’s accuracy is achieved for the argillic-phyllic and propylitic classes (100%), whereas the lowest user’s accuracy is recorded for the iron oxide/hydroxide class (50%). The advanced argillic has the user’s accuracy of 83% and hydrous silica class shows the user’s accuracy of 67% (Table 7). Accordingly, the accuracy assessment results indicate that the alteration mineral mapping has appropriate match (overall accuracy: 76.66%) and very good degree of agreement (Kappa Coefficient: 0.71) with field data. However, some spectral mixing and confusion between alteration classes are also distinguishable. The iron oxide/hydroxide and hydrous silica classes show the highest feasibility for spectral mixing and confusion compared to other classes. The propylitic and argillic-phyllic classes contain the lowest spectral mixing and confusion. The advanced argillic class has some spectral mixing and confusion with the argillic-phyllic class.

5. Discussion

Hydrothermal alteration mineral assemblages associated with gold mineralization that formed under low to medium temperatures (≤150 °C~300 °C) are deliberated as one of the most significant indicators for epithermal gold exploration [33,34,87,88,89]. Remote sensing satellite imagery is extensively and successfully used for mapping hydrothermal alteration zones for gold minerals exploration in many metallogenic provinces around the world [7,12,15,17,18,19,20,36,38,90,91,92,93,94]. In the Ahar-Arasbaran region, NW Iran, a variety of ore mineralizations such as Au, Cu-Au, Au-Ag, Fe-Au, Cu-Mo, Fe, Cu, Pb-Zn are identified, which are associated with widespread hydrothermal alteration minerals [47,49,51,95,96,97]. In this investigation, Landsat-7 ETM+, Landsat-8 and ASTER multi-sensor remote sensing satellite imagery was used to map hydrothermal alteration zones associated with epithermal gold mineralization in the Ahar-Arasbaran region. A Bayesian network model was subsequently used to fuse thematic layers of hydrothermal alteration zones derived from the multi-sensor satellite imagery for producing a mineral potential map of the study area.
Iron oxide/hydroxide zones (gossan cover), hydroxyl-bearing (Al-OH and Fe,Mg-OH) minerals and carbonates zones, advanced argillic, argillic-phyllic, propylitic and hydrous silica (silicified zone) alteration zones were mapped using band ratio, RBD and selective PCA image processing techniques. Using band ratios of 3/1 (Landsat-7 ETM+), 4/2 (Landsat-8) and 2/1 (ASTER) identify the spatial distribution of iron oxide/hydroxide zones, which are mainly associated with lineament features and igneous rocks, volcano sedimentary units and massive and bedded limestone (See Figure 5A–C). The documented epithermal gold occurrences mostly show close spatial locations with detected iron oxide/hydroxide zones. The PCA3 image of Landsat-7 ETM+ selected bands (1, 3, 4 and 5), the PCA2 image of Landsat-8 selected bands (2, 4, 5 and 6) and the PCA3 image of ASTER selected bands (1, 2, 3 and 4) were also represented iron oxide/hydroxide spatial distribution in the study area (see Figure 9A–C). The identified iron oxide/hydroxide zones using PCA are characteristically better matched with most of the gold mineralizations compared to band ratio images. Using band ratios of 5/7 (Landsat-7 ETM+), 6/7 (Landsat-8) and 4/9 (ASTER) detect the hydroxyl-bearing minerals and carbonates zones (see Figure 6A–C), which are generally matched with igneous rock, volcano sedimentary units and limestone. The gold mineralizations are typically located in the high abundance zones of hydroxyl-bearing/carbonate minerals. The advanced argillic, argillic-phyllic and propylitic alteration zones are mapped using ASTER band ratios of 4/6 (advanced argillic), 5/6 (argillic-phyllic), 5/8 (propylitic), respectively (see Figure 7A–C). The advanced argillic alteration shows closer spatial location with the gold mineralizations in comparison with the argillic-phyllic and propylitic alteration zones. The PCA4 image of Landsat-7 ETM+ selected bands (1, 4, 5 and 7), Landsat-8 selected bands (2, 5, 6 and 7) and ASTER selected bands (1, 3, 4 and 6) detects the surface distribution of hydroxyl-bearing minerals in the study area (see Figure 10A–C). The pixels detected in the PCA images show a stronger manifestation of OH-minerals compared to band ratio images and closer spatial relationship to the documented gold mineralization zones.
Implementing the RDB1 (4 + 6/5), RDB2 (5 + 7/6), RDB3 (6 + 9/7 + 8) and RDB4 (5 + 8/6 + 7) of ASTER reveal the advanced argillic, argillic-phyllic, propylitic and hydrous silica-affected alteration zones in the study area, comprehensively (see Figure 8). Some of the gold mineralizations in the eastern part of the study area are mainly situated in the advanced argillic zones. The hydrous silica zone was also mapped near some of the gold mineralization zones in the northwestern part of the study area. The propylitic zone is one of the main mineral assemblages associated with gold mineralization zones in the northern and northwestern parts of the study area. Only few gold occurrences were identified in the argillic-phyllic alteration zone. The PCA3 image derived from ASTER bands 1, 4, 6 and 7 for advanced argillic mapping, the PCA4 image derived from ASTER bands 1, 3, 5 and 6 for argillic-phyllic zone mapping and the PCA4 image derived from ASTER bands 1, 3, 5 and 8 for propylitic zone mapping show surface abundance of advanced argillic, argillic-phyllic and propylitic zone with some spatial discrepancies (see Figure 11) compared to RDBs image-map (see Figure 8). Notable vicinity to the documented gold mineralizations was mapped in the advanced argillic zone, which is detected with the PCA technique.
The produced thematic layers (see the DAG diagram in Figure 12) derived from band ratio and PCA image processing techniques are fused using the NB classifier. Consequently, a mineral potential map for the Ahar-Arasbaran region is produced (see Figure 13), which includes four classes such as highly probable, probable, moderately probable and improbable. Maximum numbers of the known gold occurrences are situated in highly probable class, while some of the gold mineralizations are located in the probable and moderately probable classes. Accordingly, several parts of the study area, such as the northwestern, northern, northeastern, southeastern and southwestern sectors, can be considered to be highly prospective zones for epithermal gold mineralizations and may contain undiscovered Au deposits (see Figure 13).
Detailed field expedition, petrographic study and XRD analysis in some of the prospective areas located in the highly probable zone show the presence of hydrothermal alteration zones associated with gold mineralizations. Extensive alteration mineral assemblages of the advanced argillic and argillic-silica alteration zones are found in the vicinity of gold mineralizations in the Zailig area (see Figure 14A–D). Microphotographs of argillic-silica alteration show that primary plagioclase replaced by sericite, clay minerals and jarosite and relics of plagioclase are surrounded by clay minerals. The distal alteration zone in the Zailig area is propylitic alteration zone, which contains chlorite, epidote and calcite that replaced original mineralogy (feldspars) as vesicular and amygdaloidal textures (see Figure 16A–D). In the Noghdouz area, gold mineralization is occurred in the breccia zone (quartz veins) in the altered granitic host rocks, which is associated with advanced argillic alteration (see Figure 17A–C and Figure 18A,B). Limonitic-hematite rocks and oxidized breccia with banded chalcedonic quartz are identified in Javan-Sheikh gold mineralization area (see Figure 19A,B), which are surrounded by propylitic and phyllic-argillic alteration zones. In the Nabi-Jan area, gold mineralization is associated with quartz-sulfide veins hosted by granodiorite (see Figure 20A,B), which strongly silicified and placed in advanced argillic alteration. Development of the argillic-phyllic alteration zone associated with the siliceous zones and iron oxides in granitoid rocks were identified with gold mineralization in the Sonajil area. Native gold mineralization is associated with sphalerite, galena, chalcopyrite and pyrite (see Figure 21A–E).
The XRD analysis of rock samples collected from different alteration zones is verified the presence of hydrothermal alteration minerals, including (i) goethite, jarosite, gypsum and quartz in the gossan cover; (ii) muscovite, illite, kaolinite, gypsum, orthoclase, albite and quartz in the advanced argillic alteration, (iii) kaolinite, muscovite, illite, jarosite, albite and quartz in the argillic-phyllic alteration; (iv) epidote, chlorite, calcite, albite and quartz in the propylitic alteration (see Figure 22A–E). The accuracy assessment results show the overall accuracy of 76.66% and Kappa Coefficient of 0.71 for hydrothermal alteration mapping using remote sensing datasets. It indicates that the alteration mineral mapping contains a suitable match and a very good degree of agreement with field data. Analyzing the producer’s accuracy and user’s accuracy shows that some spectral mixing and confusion between alteration classes are also feasible, especially for iron oxide/hydroxide and hydrous silica alteration groups and the advanced argillic and the argillic-phyllic alteration groups. Accordingly, the mineral potential map produced in this study using multi-sensor remote sensing imagery and Bayesian network model is viable and can be broadly applicable for epithermal gold exploration in the Ahar-Arasbaran region.

6. Conclusions

This investigation was accomplished to produce a mineral potential map for prospecting epithermal gold mineralization in the Ahar-Arasbaran region, NW Iran using multi-sensor remote sensing satellite imagery (e.g., Landsat-7 ETM+, Landsat-8 and ASTER) and the Bayesian network model. Iron oxide/hydroxide zones, hydroxyl-bearing minerals and carbonates zones, advanced argillic, argillic-phyllic, propylitic and silicified alteration zones were mapped in the Ahar-Arasbaran region using band ratio, RBD and selective PCA image processing techniques. The NB classifier was successfully implemented to fuse the thematic layers of hydrothermal alteration zones derived from the multi-sensor satellite imagery. As a result, a mineral potential map for the Ahar-Arasbaran region was produced, which highlighted the prospective zones as highly probable, probable and moderately probable zones. The northwestern, northern, northeastern, southeastern and southwestern parts of the study area were considered high potential zones for epithermal gold mineralizations, which might have undiscovered epithermal gold deposits. The high potential zones were verified by field and laboratory analysis such as systematic GPS surveying, analyzing several microphotographs of hydrothermal alteration minerals and ore mineralization and XRD analysis of collected rock samples from alteration zones. The advanced argillic and argillic-silica alteration zones were typically found in the vicinity of gold mineralizations. However, limonitic-hematite rocks, oxidized breccia and propylitic alteration zones were also documented as high potential zones in the study area. The field and laboratory results verified that the mineral potential map of the Ahar-Arasbaran region successfully indicates the known epithermal gold mineralizations and several new high prospective zones in the study area. The approach developed in this study is a cost-effective technique that can be used for epithermal gold exploration in metallogenic provinces before costly geophysical and geochemical studies. Briefly, this study suggests that geostatistical techniques (e.g., Bayesian network model, Fuzzy model, Artificial Neural Network Model etc.) are valuable approaches to fuse thematic layers of the multi-sensor imagery for generating the remote sensing-based mineral potential map for metallogenic provinces. The mineral exploration community and mining companies can consider the remote sensing-based mineral potential map as an economical and cost-effective tool for mineral prospecting before pricey geophysical and geochemical surveys in the metallogenic provinces.

Author Contributions

S.M.B. writing—Original draft preparation, software, analysis, validation; H.R.R. and A.M. supervision and conceptualization; A.B.P. writing, reconstructing—Review, editing and supervision; G.S. data curation and resources. All authors have read and agreed to the published version of the manuscript.

Funding

Publication fees are waived by Remote Sensing as A.B.P is guest editor of the Special Issue (Multispectral and Hyperspectral Remote Sensing Data for Mineral Exploration and Environmental Monitoring of Mined Areas).

Acknowledgments

Department of Mining and Metallurgical Engineering, Amirkabir University of Technology (Tehran Polytechnic) for providing all the facilities for this investigation. The Korea Polar Research Institute (KOPRI) for assigned time and providing the computer is also acknowledged.

Conflicts of Interest

The authors declare no conflict of interest.

References

  1. Clark, R.N. Spectroscopy of rocks and minerals, and principles of spectroscopy. In Manual of Remote Sensing; Rencz, A., Ed.; Wiley and Sons Inc.: New York, NY, USA, 1999; Volume 3, pp. 3–58. [Google Scholar]
  2. Bishop, J.L.; Lane, M.D.; Dyar, M.D.; Brwon, A.J. Reflectance and emission spectroscopy study of four groups of phyllosilicates: Smectites, kaolinite-serpentines, chlorites and micas. Clay Miner. 2008, 43, 35–54. [Google Scholar] [CrossRef]
  3. Sherman, D.M.; Waite, T.D. Electronic spectra of Fe3+ oxides and oxide-hydroxides in the near IR to near UV. Am. Mineral. 1985, 70, 1262–1269. [Google Scholar]
  4. Hunt, G.R. Spectral signatures of particulate minerals in the visible and near-infrared. Geophysics 1977, 42, 501–513. [Google Scholar] [CrossRef] [Green Version]
  5. Hunt, G.R.; Ashley, R.P. Spectra of altered rocks in the visible and near-infrared. Econ. Geol. 1979, 74, 1613–1629. [Google Scholar] [CrossRef]
  6. Abrams, M.; Hook, S.J. Simulated ASTER data for geologic studies. IEEE Trans. Geosci. Remote Sens. 1995, 33, 692–699. [Google Scholar] [CrossRef]
  7. Kruse, F.A.; Perry, S.L. Regional mineral mapping by extending hyperspectral signatures using multispectral data. IEEE Trans. Geosci. Remote Sens. 2007, 4, 1–14. [Google Scholar]
  8. Boardman, J.W.; Kruse, F.A. Automated spectral analysis: A geologic example using AVIRIS data, north Grapevine Mountains, Nevada. In Proceedings of the Tenth Thematic Conference on Geologic Remote Sensing, Environmental Research Institute of Michigan, Ann Arbor, MI, USA, 9–12 May 1994; pp. 407–418. [Google Scholar]
  9. Kruse, F.A.; Bordman, J.W.; Huntington, J.F. Comparison of airborne hyperspectral data and EO-1 Hyperion for mineral mapping. IEEE Trans. Geosci. Remote Sens. 2003, 41, 1388–1400. [Google Scholar] [CrossRef] [Green Version]
  10. Sheikhrahimi, A.; Pour, B.A.; Pradhan, B.; Zoheir, B. Mapping hydrothermal alteration zones and lineaments associated with orogenic gold mineralization using ASTER remote sensing data: A case study from the Sanandaj-Sirjan Zone, Iran. Adv. Space Res. 2019, 63, 3315–3332. [Google Scholar] [CrossRef]
  11. Noori, L.; Pour, B.A.; Askari, G.; Taghipour, N.; Pradhan, B.; Lee, C.-W.; Honarmand, M. Comparison of different algorithms to map hydrothermal alteration zones using ASTER remote sensing data for polymetallic vein-type ore exploration: Toroud–Chahshirin Magmatic Belt (TCMB), North Iran. Remote Sens. 2019, 11, 495. [Google Scholar] [CrossRef] [Green Version]
  12. Pour, A.B.; Park, T.S.; Park, Y.; Hong, J.K.; Zoheir, B.; Pradhan, B.; Ayoobi, I.; Hashim, M. Application of multi-sensor satellite data for exploration of Zn-Pb sulfide mineralization in the Franklinian Basin, North Greenland. Remote Sens. 2018, 10, 1186. [Google Scholar] [CrossRef] [Green Version]
  13. Pour, A.B.; Hashim, M.; Park, Y.; Hong, J.K. Mapping alteration mineral zones and lithological units in Antarctic regions using spectral bands of ASTER remote sensing data. Geocarto Int. 2018, 33, 1281–1306. [Google Scholar] [CrossRef]
  14. Pour, B.A.; Hashim, M. The application of ASTER remote sensing data to porphyry copper and epithermal gold deposits. Ore Geol. Rev. 2012, 44, 1–9. [Google Scholar] [CrossRef] [Green Version]
  15. Pour, A.B.; Park, Y.; Crispini, L.; Läufer, A.; Hong, J.K.; Park, T.-Y.S.; Zoheir, B.; Pradhan, B.; Muslim, A.M.; Hossain, M.S.; et al. Mapping listvenite occurrences in the damage zones of northern victoria land, Antarctica using ASTER Satellite Remote Sensing Data. Remote Sens. 2019, 11, 1408. [Google Scholar] [CrossRef] [Green Version]
  16. Pour, A.B.; Hashim, M.; Hong, J.K.; Park, Y. Lithological and alteration mineral mapping in poorly exposed lithologies using Landsat-8 and ASTER satellite data: North-eastern Graham Land, Antarctic Peninsula. Ore Geol. Rev. 2019, 108, 112–133. [Google Scholar] [CrossRef]
  17. Sun, L.; Khan, S.; Shabestari, P. Integrated hyperspectral and geochemical study of sediment-hosted disseminated gold at the Goldstrike District, Utah. Remote Sens. 2019, 11, 1987. [Google Scholar] [CrossRef] [Green Version]
  18. Zoheir, B.; Emam, A.; Abdel-Wahed, M.; Soliman, N. Multispectral and radar data for the setting of gold mineralization in the South Eastern Desert, Egypt. Remote Sens. 2019, 11, 1450. [Google Scholar] [CrossRef] [Green Version]
  19. Zoheir, B.; El-Wahed, M.A.; Pour, A.B.; Abdelnasser, A. Orogenic gold in transpression and transtension zones: Field and remote sensing studies of the barramiya–mueilha sector, Egypt. Remote Sens. 2019, 11, 2122. [Google Scholar] [CrossRef] [Green Version]
  20. Guha, A.; Yamaguchi, Y.; Chatterjee, S.; Rani, K.; Vinod Kumar, K. Emittance spectroscopy and broadband thermal remote sensing applied to phosphorite and its utility in geoexploration: A study in the parts of Rajasthan, India. Remote Sens. 2019, 11, 1003. [Google Scholar] [CrossRef] [Green Version]
  21. Rowan, L.C.; Goetz, A.F.H.; Ashley, R.P. Discrimination of hydrothermally altered and unaltered rocks in visible and near infrared multispectral images. Geophysics 1977, 42, 522–535. [Google Scholar] [CrossRef]
  22. Crosta, A.; Moore, J. Enhancement of Landsat Thematic Mapper imagery for residual soil mapping in SW Minais Gerais State, Brazil: A prospecting case history in Greenstone belt terrain. In Proceedings of the 7th ERIM Thematic Conference on Remote Sensing for Exploration Geology, Calgary, AL, Canada, 2–6 October 1989; pp. 1173–1187. [Google Scholar]
  23. Sabins, F.F. Remote sensing for mineral exploration. Ore Geol. Rev. 1999, 14, 157–183. [Google Scholar] [CrossRef]
  24. Abdelsalam, M.G.; Stern, R.J.; Woldegabriel, G.B. Mapping gossans in arid regions with Landsat TM and SIR-C images, the Beddaho Alteration Zone in northern Eritrea. J. Afr. Earth Sci. 2000, 30, 903–916. [Google Scholar] [CrossRef]
  25. Kusky, T.M.; Ramadan, T.M. Structural controls on Neoproterozoic mineralization in the South Eastern Desert, Egypt: An integrated field, Landsat TM, and SIR-C/X SAR approach. J. Afr. Earth Sci. 2002, 35, 107–121. [Google Scholar] [CrossRef]
  26. Aydal, D.; Ardal, E.; Dumanlilar, O. Application of the Crosta technique for alteration mapping of granitoidic rocks using ETM+ data: Case study from eastern Tauride belt (SE Turkey). Int. J. Remote Sens. 2007, 28, 3895–3913. [Google Scholar] [CrossRef]
  27. Rajesh, H.M. Mapping Proterozoic unconformity-related uranium deposits in the Rockole area, Northern Territory, Australia using Landsat ETM+. Ore Geol. Rev. 2008, 33, 382–396. [Google Scholar] [CrossRef]
  28. Pour, A.B.; Hashim, M. Hydrothermal alteration mapping from Landsat-8 data, Sar Cheshmeh copper mining district, south-eastern Islamic Republic of Iran. J. Taibah Univ. Sci. 2015, 9, 155–166. [Google Scholar] [CrossRef]
  29. Pour, A.B.; Park, Y.; Park, T.S.; Hong, J.K.; Hashim, M.; Woo, J.; Ayoobi, I. Evaluation of ICA and CEM algorithms with Landsat-8/ASTER data for geological mapping in inaccessible regions. Geocarto Int. 2019, 34, 785–816. [Google Scholar] [CrossRef]
  30. Lowell, J.D.; Guilbert, J.M. Lateral and vertical alteration-mineralization zoning in porphyry ore deposits. Econ. Geol. Bull. Soc. Econ. Geol. 1970, 65, 373–408. [Google Scholar] [CrossRef]
  31. Dilles, J.H.; Einaudi, M.T. Wall-rock alteration and hydrothermal flow paths about the Ann-Mason porphyry copper deposit, Nevada-a 6-km vertical reconstruction. Econ. Geol. 1992, 87, 1963–2001. [Google Scholar] [CrossRef]
  32. Sillitoe, R.H. Porphyry Copper Systems. Econ. Geol. 2010, 105, 3–41. [Google Scholar] [CrossRef] [Green Version]
  33. Goldfarb, R.J.; Taylor, R.D.; Collins, G.S.D.; Goryachev, N.A.; Orlandini, O.F. Phanerozoic continental growth and gold metallogeny of Asia. Gondwana Res. 2014, 25, 48–102. [Google Scholar] [CrossRef]
  34. Hedenquist, J.W.; Arribas, A.R.; Gonzalez-Urien, E. Exploration for epithermal gold deposits. SEG Rev. 2000, 13, 245–277. [Google Scholar]
  35. Mars, J.C.; Rowan, L.C. Regional mapping of phyllic-and argillic-altered rocks in the Zagros magmatic arc, Iran, using Advanced Spaceborne Thermal Emission and Reflection Radiometer (ASTER) data and logical operator algorithms. Geosphere 2006, 2, 161–186. [Google Scholar] [CrossRef]
  36. Mars, J.C.; Rowan, L.C. ASTER spectral analysis and lithologic mapping of the Khanneshin carbonate volcano, Afghanistan. Geosphere 2011, 7, 276–289. [Google Scholar] [CrossRef] [Green Version]
  37. Rowan, L.C.; Hook, S.J.; Abrams, M.J.; Mars, J.C. Mapping hydrothermally altered rocks at Cuprite, Nevada, using the Advanced Spaceborne Thermal Emission and Reflection Radiometer (ASTER), a new satellite-imaging system. Econ. Geol. 2003, 98, 1019–1027. [Google Scholar] [CrossRef]
  38. Pour, B.A.; Hashim, M. Identification of hydrothermal alteration minerals for exploring of porphyry copper deposit using ASTER data, SE Iran. J. Asian Earth Sci. 2011, 42, 1309–1323. [Google Scholar] [CrossRef]
  39. Pour, A.B.; Park, Y.; Park, T.S.; Hong, J.K.; Hashim, M.; Woo, J.; Ayoobi, I. Regional geology mapping using satellite-based remote sensing approach in Northern Victoria Land, Antarctica. Polar Sci. 2018, 16, 23–46. [Google Scholar] [CrossRef]
  40. Carranza, E.J.M. Geocomputation of mineral exploration targets. Comput. Geosci. 2011, 37, 1907–1916. [Google Scholar] [CrossRef]
  41. Porwal, A.; Carranza, E.J.M.; Hale, M. Bayesian network classifiers for mineral potential mapping. Comput. Geosci. 2006, 32, 1–16. [Google Scholar] [CrossRef]
  42. Skabar, A. Mineral potential mapping using Bayesian learning for multilayer perceptrons. Math. Geol. 2007, 39, 439–451. [Google Scholar] [CrossRef]
  43. Jensen, F.V. An Introduction to Bayesian Networks; UCL Press: London, UK, 1996; Volume 210, pp. 1–178. [Google Scholar]
  44. Friedman, N.; Geiger, D.; Goldszmidt, M. Bayesian network classifiers. Mach. Learn. 1997, 29, 131–163. [Google Scholar] [CrossRef] [Green Version]
  45. Scanagatta, M.; de Campos, C.P.; Corani, G.; Zaffalon, M. Learning bayesian networks with thousands of variables. In Proceedings of the NIPS’15 28th International Conference on Neural Information Processing Systems, Montreal, QC, Canada, 7–12 December 2015; Volume 28, pp. 1855–1863. [Google Scholar]
  46. Jamali, H.; Dilek, Y.; Daliran, F.; Yaghubpur, A.; Mehrabi, B. Metallogeny and tectonic evolution of the Cenozoic Ahar–Arasbaran volcanic belt, northern Iran. Int. Geol. Rev. 2010, 52, 608–630. [Google Scholar] [CrossRef]
  47. Maghsoudi, A.; Yazdi, M.; Mehrpartou, M.; Vosoughi, M.; Younesi, S. Porphyry Cu–Au mineralization in the Mirkuh Ali Mirza magmatic complex, NW Iran. J. Asian Earth Sci. 2014, 79, 932–941. [Google Scholar] [CrossRef]
  48. Pazand, K.; Hezarkhani, A. Predictive Cu porphyry potential mapping using fuzzy modelling in Ahar–Arasbaran zone, Iran. Geol. Ecol. Landsc. 2018, 2, 229–239. [Google Scholar] [CrossRef] [Green Version]
  49. Kouhestani, H.; Mokhtari, M.A.A.; Chang, Z.; Stein, H.J.; Johnson, C.A. Timing and genesis of ore formation in the Qarachilar Cu-Mo-Au deposit, Ahar-Arasbaran metallogenic zone, NW Iran: Evidence from geology, fluid inclusions, O–S isotopes and Re–Os geochronology. Ore Geol. Rev. 2018, 102, 757–775. [Google Scholar] [CrossRef]
  50. Sohrabi, G. Metallogenic and Geochemical Investigations of Molybdenum Reservoirs in Karad-e Ghad-e Sharidagh, East Azarbaijan, Northwest of Iran. Ph.D. Thesis, Tabriz University, Tabriz, Iran, 2015. (In Persian). [Google Scholar]
  51. Parsa, M.; Maghsoudi, A.; Yousefi, M. Spatial analyses of exploration evidence data to model skarn-type copper prospectivity in the Varzaghan district, NW Iran. Ore Geol. Rev. 2018, 92, 97–112. [Google Scholar] [CrossRef]
  52. Pazand, K.; Sarvestani, J.F.; Ravasan, M.R. Hydrothermal alteration mapping using ASTER data for reconnaissance porphyry copper mineralization in the Ahar area, NW Iran. J. Indian Soc. Remote Sens. 2013, 41, 379–389. [Google Scholar] [CrossRef]
  53. Hassanpour, S. The alteration, mineralogy and geochronology (SHRIMP U–Pb and 40 Ar/39 Ar) of copper-bearing Anjerd skarn, north of the Shayvar Mountain, NW Iran. Int. J. Earth Sci. 2013, 102, 687–699. [Google Scholar] [CrossRef]
  54. Aghazadeh, M.; Hou, Z.; Badrzadeh, Z.; Zhou, L. Temporal–spatial distribution and tectonic setting of porphyry copper deposits in Iran: Constraints from zircon U–Pb and molybdenite Re–Os geochronology. Ore Geol. Rev. 2015, 70, 385–406. [Google Scholar] [CrossRef]
  55. Hassanpour, S. Metallogeny and Mineralization of Copper and Gold in Arasbaran Zone (Eastern Azerbaijan). Ph.D. Thesis, Shahid Beheshti University, Tehran, Iran, 2010. (In Persian with English abstract). [Google Scholar]
  56. Maghsoudi, A.; Rahmani, M.; Rashidi, B. Gold Deposits and Indications of Iran; Pars Arain Zamin Geology Research Centre: Tehran, Iran, 2005. [Google Scholar]
  57. Irons, J.R.; Dwyer, J.L.; Barsi, J.A. The next Landsat satellite: The Landsat Data Continuity Mission. Remote Sens. Environ. 2012, 145, 154–172. [Google Scholar] [CrossRef] [Green Version]
  58. Roy, D.P.; Wulder, M.A.; Loveland, T.A.; Woodcock, C.E.; Allen, R.G.; Anderson, M.C.; Helder, D.; Irons, J.R.; Johnson, D.M.; Kennedy, R.; et al. Landsat-8: Science and product vision for terrestrial global change research. Remote Sens. Environ. 2014, 145, 154–172. [Google Scholar] [CrossRef] [Green Version]
  59. Abrams, M.; Tsu, H.; Hulley, G.; Iwao, K.; Pieri, D.; Cudahy, T.; Kargel, J. The Advanced Spaceborne Thermal Emission and Reflection Radiometer (ASTER) after fifteen years: Review of global products. Int. J. Appl. Earth Obs. Geoinf. 2015, 38, 292–301. [Google Scholar] [CrossRef]
  60. Chander, G.; Markham, B.; Helder, D. Summary of current radiometric calibration coefficients for Landsat MSS, TM, ETM+, and EO-1 ALI sensors. Remote Sens. Environ. 2009, 113, 893–903. [Google Scholar] [CrossRef]
  61. Research Systems, Inc. ENVI Tutorials; Research Systems, Inc.: Boulder, CO, USA, 2008. [Google Scholar]
  62. NASA Goddard Space Flight Centre. Landsat 7 Science Data Users Handbook. Updated March 2011. Available online: http://landsathandbook.gsfc.nasa.gov/inst_cal/prog_sect8_2.html (accessed on 12 October 2019).
  63. Ben-Dor, E.; Kruse, F.A.; Lefkoff, A.B.; Banin, A. Comparison of three calibration techniques for utilization of GER 63-channel aircraft scanner data of Makhtesh Ramon, Nega, Israel. Int. J. Rock Mech. Min. Sci. Geomech. Abstr. 1995, 32, 164A. [Google Scholar]
  64. Iwasaki, A.; Tonooka, H. Validation of a crosstalk correction algorithm for ASTER/SWIR. IEEE Trans. Geosci. Remote Sens. 2005, 43, 2747–2751. [Google Scholar] [CrossRef]
  65. Goetz, A.F.; Rock, B.N.; Rowan, L.C. Application of remote sensing in exploration. Econ. Geol. 1975, 79, 644–711. [Google Scholar]
  66. Inzana, J.; Kusky, T.; Higgs, G.; Tucker, R. Supervised classifications of Landsat TM band ratio images and Landsat TM band ratio image with radar for geological interpretations of central Madagascar. J. Afr. Earth Sci. 2003, 37, 59–72. [Google Scholar] [CrossRef]
  67. Crowley, J.K.; Brickey, D.W.; Rowan, L.C. Airborne imaging spectrometer data of the Ruby Mountains, Montana: Mineral discrimination using relative absorption band-depth images. Remote Sens. Environ. 1989, 29, 121–134. [Google Scholar] [CrossRef]
  68. Abubakar, A.J.A.; Hashim, M.; Pour, A.B. Remote sensing satellite imagery for prospecting geothermal systems in an aseismic geologic setting: Yankari Park, Nigeria. Int. J. Appl. Earth Obs. Geoinf. 2019, 80, 157–172. [Google Scholar] [CrossRef]
  69. Van der Meer, F.D.; Van der Werff, H.M.; Van Ruitenbeek, F.J.; Hecker, C.A.; Bakker, W.H.; Noomen, M.F.; Van Der Meijde, M.; Carranza, E.J.M.; De Smeth, J.B.; Woldai, T. Multi-and hyperspectral geologic remote sensing: A review. Int. J. Appl. Earth Obs. Geoinf. 2012, 14, 112–128. [Google Scholar] [CrossRef]
  70. Kalinowski, A.; Oliver, S. ASTER Mineral Index Processing Manual. Technical Report; Geoscience Australia. 2004. Available online: http://www.ga.gov.au/image_cache/GA7833.pdf (accessed on 1 June 2019).
  71. Cheng, Q.; Jing, L.; Panahi, A. Principal component analysis with optimum order sample correlation coefficient for image enhancement. Int. J. Remote Sens. 2006, 27, 3387–3401. [Google Scholar]
  72. Gupta, R.P.; Tiwari, R.K.; Saini, V.; Srivastava, N. A simplified approach for interpreting principal component images. Adv. Remote Sens. 2013, 2, 111–119. [Google Scholar] [CrossRef] [Green Version]
  73. Singh, A.; Harrison, A. Standardized principal components. Int. J. Remote Sens. 1985, 6, 883–896. [Google Scholar] [CrossRef]
  74. Crosta, A.P.; Souza Filho, C.R.; Azevedo, F.; Brodie, C. Targeting key alteration minerals in epithermal deposits in Patagonia, Argentina, Using ASTER imagery and principal component analysis. Int. J. Remote Sens. 2003, 24, 4233–4240. [Google Scholar] [CrossRef]
  75. Crosta, A.P.; Filho, C.R. Searching for gold with ASTER. Earth Obs. Mag. 2003, 12, 38–41. [Google Scholar]
  76. Gelman, A.; Carlin, J.B.; Stern, H.S.; Rubin, D.B. Bayesian Data Analysis; Chapman & Hall: London, UK, 1995. [Google Scholar]
  77. Neal, R.M. Bayesian Learning for Neural Networks; Springer: Berlin, Germany, 1996. [Google Scholar]
  78. Antal, P.; Fannes, G.; Timmerman, D.; Moreau, Y.; Moor, B.D. Bayesian applications of belief networks and multilayer perceptrons for ovarian tumor classification with rejection. Artif. Intell. Med. 2003, 29, 39–60. [Google Scholar] [CrossRef]
  79. Duda, R.O.; Hart, P.E. Pattern Classification and Scene Analysis; John Wiley and Sons: New York, NY, UK, 1973; p. 482. [Google Scholar]
  80. Langley, P.; Sage, S. Induction of selective Bayesian classifiers. In Proceedings of the Tenth Conference on Uncertainty in Artificial Intelligence (UAI ’94), Seattle, WA, USA, 29–31 July 1994; Kaufmann, M., de Mantars, L., Poole, D., Eds.; Morgan Kaufmann: Burlington, MA, USA, 1994; pp. 399–406. [Google Scholar]
  81. Jenks, G.F. The data model concept in statistical mapping. Int. Yearb. Cartogr. 1967, 7, 186–190. [Google Scholar]
  82. Story, M.; Congalton, R. Accuracy assessment: A user’s perspective. Photogramm. Eng. Remote Sens. 1986, 52, 397–399. [Google Scholar]
  83. Congalton, R.G. A review of assessing the accuracy of classification of remotely sensed data. Remote Sens. Environ. 1991, 37, 35–46. [Google Scholar] [CrossRef]
  84. Lillesand, T.; Kiefer, R. Remote Sensing and Image Interpretation; John Wiley & Sons, Inc.: New York, NY, USA, 1994; Chapter 7. [Google Scholar]
  85. Kruse, F.; Perry, S. Mineral mapping using simulated Worldview-3 short-wave infrared imagery. Remote Sens. 2013, 5, 2688–2703. [Google Scholar] [CrossRef] [Green Version]
  86. Monserud, R.A.; Leemans, R. Comparing global vegetation maps with the Kappa-statistic. Ecol. Model. 1992, 62, 275–293. [Google Scholar] [CrossRef]
  87. Goldfarb, R.J.; Phillips, G.N.; Nokleberg, W.J. Tectonic setting of synorogenic gold deposits of the Pacific Rim. Ore Geol. Rev. 1998, 13, 185–218. [Google Scholar] [CrossRef]
  88. Goldfarb, R.J.; Groves, D.I. Orogenic gold: Common or evolving fluid and metal sources through time. Lithos 2015, 233, 2–26. [Google Scholar] [CrossRef]
  89. White, N.C.; Hedenquist, J.W. Epithermal gold deposits: Styles, characteristics and exploration. SEG Newsl. 1995, 23, 9–13. [Google Scholar]
  90. Pour, B.A.; Hashim, M. Structural mapping using PALSAR data in the Central Gold Belt, Peninsular Malaysia. Ore Geol. Rev. 2015, 64, 13–22. [Google Scholar] [CrossRef] [Green Version]
  91. Pour, B.A.; Hashim, M.; Makoundi, C.; Zaw, K. Structural mapping of the bentong-raub suture zone using PALSAR remote sensing data, Peninsular Malaysia: Implications for sediment-hosted/orogenic gold mineral systems exploration. Resour. Geol. 2016, 66, 368–385. [Google Scholar] [CrossRef]
  92. Pour, B.A.; Hashim, M.; Marghany, M. Exploration of gold mineralization in a tropical region using Earth Observing-1 (EO1) and JERS-1 SAR data: A case study from Bau gold field, Sarawak, Malaysia. Arab. J. Geosci. 2014, 7, 2393–2406. [Google Scholar] [CrossRef]
  93. Pour, B.A.; Hashim, M. Evaluation of Earth Observing-1 (EO1) Data for Lithological and Hydrothermal Alteration mapping: A case study from Urumieh-Dokhtar Volcanic Belt, SE Iran. Indian Soc. Remote Sens. 2015, 43, 583–597. [Google Scholar] [CrossRef]
  94. Testa, F.J.; Villanueva, C.; Cooke, D.R.; Zhang, L. Lithological and hydrothermal alteration mapping of epithermal, porphyry and tourmaline breccia districts in the Argentine Andes using ASTER imagery. Remote Sens. 2018, 10, 203. [Google Scholar] [CrossRef] [Green Version]
  95. Parsa, M.; Maghsoudi, A.; Yousefi, M.; Sadeghi, M. Recognition of significant multi-element geochemical signatures of porphyry Cu deposits in Noghdouz area, NW Iran. J. Geochem. Explor. 2016, 165, 111–124. [Google Scholar] [CrossRef]
  96. Parsa, M.; Maghsoudi, A.; Yousefi, M. An improved data-driven fuzzy mineral prospectivity mapping procedure; cosine amplitude-based similarity approach to delineate exploration targets. Int. J. Appl. Earth Obs. Geoinf. 2017, 58, 157–167. [Google Scholar] [CrossRef]
  97. Parsa, M.; Maghsoudi, A.; Yousefi, M. A receiver operating characteristics-based geochemical data fusion technique for targeting undiscovered mineral deposits. Nat. Res. Res. 2018, 27, 15–28. [Google Scholar] [CrossRef]
Figure 1. Geological map of the Ahar-Arasbaran region. Modified from five 1:100,000 geological map sheet provided by the Geological Survey of Iran [56]. Abbreviation to epithermal gold mineralization: ANI = Annigh; AST = Astamal; AND = Andiryan; KLJ = Kalijan; SHF = Sharaf-abad; HIZ = Hize-jan; KYN = Khoyneh-roud; DYM = Day-mamagh; NAB = Nabi-jan; ARP1 = Arpaligh1; ARP2 = Arpaligh2; YRL = Yaralojeh; ANJ = Anjerd; ALV = Alavigh; JVS = Javan-sheykh; SHL = Shaleh-boran; ASB = Asb-abad; SNJ = Sonajil; YSF = Yosoufloo; NOG = Noghdouz; NYZ = Niyaz; ZY1 = Zailigh1; ZY2 = Zailigh2; KH1 = Khiarloo1; KH2 = Khiarloo1.
Remotesensing 12 00105 g001
Figure 2. An overview of the methodological flowchart applied in this analysis.
Remotesensing 12 00105 g002
Figure 3. A schematic diagram depicting a general Bayesian network model [43].
Remotesensing 12 00105 g003
Figure 4. A typical Naive Bayes classifier diagram [79].
Remotesensing 12 00105 g004
Figure 5. Spatial distribution of iron oxide/hydroxide zones (gossan) in the study area overlaid on hill shade. (A) The 3/1 band ratio image of Landsat-7 ETM+; (B) the 4/2 band ratio image of Landsat-8; (C) the 2/1 band ratio image of ASTER.
Remotesensing 12 00105 g005
Figure 6. Spatial distribution of hydroxyl-bearing minerals and carbonates in the study area overlaid on hill shade. (A) The 5/7 band ratio image of Landsat-7 ETM+; (B) the 6/7 band ratio image of Landsat-8; (C) the 4/9 band ratio image of ASTER.
Remotesensing 12 00105 g006
Figure 7. Spatial distribution of hydrothermal alteration zones in the study area overlaid on hill shade. (A) The advanced argillic alteration zone (4/6 band ratio image of ASTER); (B) the argillic-phyllic alteration zone (5/6 band ratio image of ASTER); (C) the propylitic alteration zone (5/8 band ratio image of ASTER).
Remotesensing 12 00105 g007
Figure 8. The RDB1(4 + 6/5), RDB2 (5 + 7/6), RDB3 (6 + 9/7 + 8) and RDB4 (5 + 8/6 + 7) of ASTER shows advanced argillic, argillic-phyllic, propylitic and hydrous silica-affected alteration zones in the study area overlaid on hill shade.
Remotesensing 12 00105 g008
Figure 9. The PCA images derived from Landsat-7 ETM+, Landsat-8 and ASTER selected bands for mapping iron oxide/hydroxide zones (gossan) in the study area overlaid on hill shade. (A) The PCA3 image of Landsat-7 ETM+; (B) the PCA2 image of Landsat-8; (C) the PCA3 image of ASTER.
Remotesensing 12 00105 g009
Figure 10. The PCA images derived from Landsat-7 ETM+, Landsat-8 and ASTER selected bands for mapping hydroxyl-bearing minerals in the study area overlaid on hill shade. (A) The PCA4 image of Landsat-7 ETM+; (B) the PCA4 image of Landsat-8; (C) the PCA4 image of ASTER.
Remotesensing 12 00105 g010
Figure 11. The PCA image-map derived from ASTER selected PCAs for mapping advanced argillic, argillic-phyllic and propylitic alteration zones in the study area that overlaid on hill shade.
Remotesensing 12 00105 g011
Figure 12. The DAG diagram used in this study for the fusing the thematic layers produced by image processing techniques.
Remotesensing 12 00105 g012
Figure 13. Mineral potential map of the Ahar-Arasbaran region produced using the NB classifier. For abbreviation to epithermal gold mineralizations, refer to Figure 1.
Remotesensing 12 00105 g013
Figure 14. Field photographs of typical hydrothermal alteration zones in the Zailig area. (A) View of argillic alteration zone close to the quartz veins; (B) Regional view of advanced argillic alteration zone; (C) View of silicification alteration zone with iron oxides, (D) Close view of argillic-silica alteration and a sample of crustiform and colloform banded chalcedonic gold-quartz vein.
Remotesensing 12 00105 g014
Figure 15. Microphotographs of argillic-silica alteration. (A) Original mineralogy (feldspars) replaced by sericite, jarosite and clay minerals; (B) Recrystallized large-grained quartz and relics of plagioclase in the background of clay minerals.
Remotesensing 12 00105 g015
Figure 16. Propylitic alteration zone in the Zailig area. (A) View of Propylitic alteration zone; (B) Vesicular and amygdaloidal textures in a hand specimen of propylitic zone; (C) Microphotographs of plagioclase that is partially replaced by epidote and recrystallized large-grained quartz in the background; (D) Microphotographs of amygdaloidal texture in the propylitic zone that amygdales are filled with calcite, chlorite and quartz.
Remotesensing 12 00105 g016
Figure 17. Silicified zone in the Noghdouz gold mineralization area. (A) Regional view of Silicified zone; (B) Close view of breccia textures in a hand specimen of the andesitic host rock; (C) View of silica clasts in a hand specimen of the breccia textures.
Remotesensing 12 00105 g017
Figure 18. Breccia zone (quartz veins) in the granitic host rocks in the Noghdouz gold mineralization area. (A) View of breccia zone (quartz veins) in the granitic host rocks (Ahar-Meshkinshahr road); (B) Close view of quartz veins in the breccia zone and advanced argillic alteration.
Remotesensing 12 00105 g018
Figure 19. The iron oxides (limonitic-hematite rocks) in Javan-Sheikh area. (A) View of limonitic-hematite rocks; (B) View of oxidized breccia with banded chalcedonic quartz infill.
Remotesensing 12 00105 g019
Figure 20. Gold mineralization in the Nabi-Jan area. (A) View of quartz-sulfide veins that developed at the top of an intrusive body of granodiorite; (B) Close view of quartz-sulfide gold mineralization in a hand specimen.
Remotesensing 12 00105 g020
Figure 21. Microphotographs of sulfide mineralization in the Kalijan area (polished section). (A) Coarse anhedral sphalerite (Sp) in concordance with galena (Gn) and chalcopyrite (Chpy) (magnification: 10XPL); (B) Coarse anhedral sphalerite (Sp) intergrowth with galena (Gn) (white) and chalcopyrite (Chpy) (yellow) in quartz gangue (magnification: 10XPL); (C) Large anhedral form of chalcopyrite (Chpy), pyrite (Py) and sphalerite (Sp) (magnification: 20XPL); (D) Gold (Au) detected as an insulator inside the sphalerite (Sp) fracture (glossy yellow) (magnification: 20XPL); (E) Gold (Au) mineralization with a particle size of 10 microns along with an iron hydroxide (Lim) crystal surrounded by sphalerite (Sp) (magnification: 20XPL).
Remotesensing 12 00105 g021
Figure 22. Representative XRD analysis of samples collected from hydrothermal alteration zones in the study area. (A) Iron oxide/hydroxide alteration (gossan covers); (B) Advanced argillic alteration; (C) Argillic-phyllic alteration; (D) Propylitic alteration; (E) Hydrous silica alteration (silicified zone).
Remotesensing 12 00105 g022aRemotesensing 12 00105 g022b
Table 1. Technical characteristics of the Landsat-7 ETM+, Landsat-8 and ASTER remote sensing sensors [23,57,58,59].
Landsat 7
Enhanced Thematic Mapper Plus (Landsat-7 ETM+)
BandsWavelength (µm)Resolution (m)
Band 1—Blue0.45–0.5230
Band 2—Green0.52–0.6030
Band 3—Red0.63–0.6930
Band 4—Near Infrared (NIR)0.77–0.9030
Band 5—Shortwave Infrared (SWIR) 11.55–1.7530
Band 6—Thermal10.40–12.5060 * (30)
Band 7—Shortwave Infrared (SWIR) 22.09–2.3530
Band 8—Panchromatic0.520–0.90015
Landsat 8
Operational Land Imager (OLI) and Thermal Infrared Sensor (TIRS)
BandsWavelength (µm)Resolution (m)
Band 1—Ultra Blue (coastal/aerosol)0.435 –0.45130
Band 2—Blue0.452–0.51230
Band 3—Green0.533–0.59030
Band 4—Red0.636–0.67330
Band 5—Near Infrared (NIR)0.851–0.87930
Band 6—Shortwave Infrared (SWIR) 11.566–1.65130
Band 7—Shortwave Infrared (SWIR) 22.107–2.29430
Band 8—Panchromatic0.503–0.67615
Band 9—Cirrus1.363–1.38430
Band 10—Thermal Infrared (TIRS) 110.60–11.19100 * (30)
Band 11—Thermal Infrared (TIRS) 211.50–12.51100 * (30)
ASTER
Advanced Space borne Thermal Emission and Reflection Radiometer
BandLabelWavelength (µm)Resolution (m)Description
B1VNIR_Band10.520–0.6015Visible green/yellow
B2VNIR_Band20.630–0.69015Visible red
B3NVNIR_Band3N0.760–0.86015Near infrared
B3BVNIR_Band3B0.760–0.86015
B4SWIR_Band41.600–1.70030Short-wave infrared
B5SWIR_Band52.145–2.18530
B6SWIR_Band62.185–2.22530
B7SWIR_Band72.235–2.28530
B8SWIR_Band82.295–2.36530
B9SWIR_Band92.360–2.43030
B10TIR_Band108.125–8.47590Long-wave infrared or thermal IR
B11TIR_Band118.475–8.82590
B12TIR_Band128.925–9.27590
B13TIR_Band1310.250–10.95090
B14TIR_Band1410.950–11.65090
* The 60 m thermal band of Landsat-7 ETM+ is resampled and co-registered to the 30 m VNIR and SWIR bands. The 100 m TIRS bands are resampled and co-registered to the 30 m OLI bands.
Table 2. The RBD indices applied for hydrothermal alteration mapping in the study area using ASTER imagery.
Alteration ZoneMineral AssemblagesRBD Band
Advanced ArgillicAlunite-Kaolinite-Pyrophyllite(4 + 6)/5
Argillic-PhyllicSericitic-Illite-Smectite(5 + 7)/6
PropyliticEpidote-Chlorite-Amphibole-Biotite(6 + 9)/(7 + 8)
Hydrous SilicaHydrous Silica-Jarosite-Sericite(5 + 8)/(6 + 7)
Table 3. The Eigenvector matrix values derived from principal component analysis (PCA) for mapping iron oxide/hydroxides. (A) Bands 1, 3, 4 and 5 of Landsat-7 ETM+; (B) Bands 2, 4, 5 and 6 of Landsat-8; and (C) Bands 1, 2, 3 and 4 of ASTER.
(A)
EigenvectorBand 1Band 3Band 4Band 5
PCA 10.4420.5360.3860.605
PCA 20.0950.616−0.771−0.123
PCA 30.4200.2580.383−0.780
PCA 40.786−0.515−0.3280.091
(B)
EigenvectorBand 2Band 4Band 5Band 6
PCA 10.3990.4440.5440.587
PCA 2−0.3740.037−0.5550.741
PCA 3−0.566−0.5100.6140.201
PCA 40.616−0.734−0.1260.253
(C)
EigenvectorBand 1Band 2Band 3Band 4
PCA10.3200.3600.5620.671
PCA20.2650.506−0.7790.253
PCA3−0.396−0.539−0.2590.695
PCA40.817−0.567−0.092−0.008
Table 4. The Eigenvector matrix values derived from PCA for mapping hydroxyl-bearing minerals. (A) Bands 1, 4, 5 and 7 of Landsat-7 ETM++; (B) Bands 2, 5, 6 and 7 of Landsat-8; and (C) Bands 1, 3, 4 and 6 of ASTER.
(A)
EigenvectorBand 1Band 4Band 5Band 7
PCA 10.4550.4010.6290.484
PCA 2−0.002−0.8390.1290.528
PCA 30.865−0.130−0.475−0.086
PCA 4−0.2080.343−0.5990.692
(B)
EigenvectorBand 2Band 5Band 6Band 7
PCA 10.3880.5290.5730.490
PCA 20.2940.698−0.410−0.506
PCA 30.841−0.426−0.2980.142
PCA 4−0.2320.223−0.6430.694
(C)
EigenvectorBand 1Band 3Band 4Band 6
PCA10.2840.4980.5990.558
PCA20.062−0.8390.2020.499
PCA30.8390.011−0.5270.127
PCA40.457−0.2150.567−0.649
Table 5. The Eigenvector matrix values derived from PCA for mapping advanced argillic, argillic-phyllic and propylitic alteration zones using ASTER VNIR+SWIR bands. (A) Bands 1, 4, 6 and 7 for advanced argillic zone mapping; (B) Bands 1, 3, 5 and 6 for argillic-phyllic zone mapping; and (C) Bands 1, 3, 5 and 8 for propylitic zone mapping.
(A)
EigenvectorBand 1Band 4Band 6Band 7
PCA1−0.28−0.593−0.553−0.514
PCA2−0.7870.589−0.08−0.166
PCA3−0.543−0.5490.5090.382
PCA4−0.0890.003−0.6550.75
(B)
EigenvectorBand 1Band 3Band 5Band 6
PCA10.2970.5120.5510.586
PCA20.01−0.8450.3660.389
PCA30.954−0.15−0.154−0.207
PCA40.027−0.004−0.7330.679
(C)
EigenvectorBand 1Band 3Band 5Band 8
PCA10.3070.5280.5680.552
PCA20.014−0.8320.3410.438
PCA30.95−0.154−0.233−0.142
PCA4−0.0590.073−0.7120.696
Table 6. Locations of representative hydrothermal alteration zones recorded by systematic GPS survey during fieldwork in the study area.
Alteration ZonesCoordinates
1Advanced argillic38°26.324′N–47°21.279′E
2Advanced argillic38°11.796′N–47°15.995′E
3Advanced argillic38°20.514′N–46°58.566′E
4Advanced argillic38°32.717′N–47°03.374′E
5Advanced argillic38°49.398′N–46°16.417′E
6Advanced argillic38°43.269′N–47°00.223′E
7Iron oxide minerals38°30.095′N–47°07.023′E
8Iron oxide minerals38°44.378′N–46°23.321′E
9Iron oxide minerals38°08.975′N–47°27.312′E
10Iron oxide minerals38°40.687′N–46°42.420′E
11Iron oxide minerals38°43.525′N–46°48.243′E
12Iron oxide minerals38°37.564′N–46°29.257′E
13argillic-phyllic38°10.102′N–47°28.384′E
14argillic-phyllic38°24.794′N–47°24.250′E
15argillic-phyllic38°36.792′N–46°43.712′E
16argillic-phyllic38°37.814′N–46°22.895′E
17argillic-phyllic38°21.812′N–46°51.621′E
18argillic-phyllic38°35.575′N–47°00.520′E
19Hydrous silica38°41.894′N–46°41.574′E
20Hydrous silica38°25.525′N–47°20.882′E
21Hydrous silica38°44.511′N–46°46.563′E
22Hydrous silica38°36.700′N–46°51.888′E
23Hydrous silica38°36.931′N–46°31.907′E
24Hydrous silica38°43.265′N–46°25.118′E
25Propylitic38°37.090′N–46°28.190′E
26Propylitic38°50.119′N–46°22.157′E
27Propylitic38°45.696′N–46°49.787′E
28Propylitic38°25.034′N–47°24.969′E
29Propylitic38°40.665′N–46°22.871′E
30Propylitic38°31.197′N–46°17.014′E
Table 7. Confusion matrix for alteration mineral mapping versus field data.
ClassAdvanced ArgillicIron Oxide/
Hydroxides
Argillic-PhyllicHydrous SilicaPropyliticTotals (Field Data)User’s Accuracy
Advanced argillic50100683%
Iron oxide/hydroxides04021850%
Argillic-phyllic105005100%
Hydrous silica02040667%
Propylitic000055100%
Totals (Remote sensing analysis)6666630
Producer’s Accuracy83%67%83%67%83%
Overall accuracy = 76.66% Kappa Coefficient = 0.71

