Article

Monitoring 40-Year Lake Area Changes of the Qaidam Basin, Tibetan Plateau, Using Landsat Time Series

1
College of Earth Sciences, Jilin University, Changchun 130061, China
2
Key Laboratory of Wetland Ecology and Environment, Northeast Institute of Geography and Agroecology, Chinese Academy of Sciences, Changchun 130102, China
3
Department of Geography, University of South Carolina, Columbia, SC 29208, USA
*
Author to whom correspondence should be addressed.
Remote Sens. 2019, 11(3), 343; https://doi.org/10.3390/rs11030343
Submission received: 27 December 2018 / Revised: 31 January 2019 / Accepted: 2 February 2019 / Published: 9 February 2019

Abstract

:
Areal changes of high-altitude inland lakes on the Qaidam Basin (QB) of the Tibetan Plateau are reliable indicators of climate change and anthropogenic disturbance. Due to the physical difficulties to access, our knowledge of the spatial patterns and processes of climatic and human impacts on the Basin has been limited. Focusing on lake area changes, this study used long-term Landsat images to map the patterns of lakes and glaciers in 1977, 1990, 2000, and 2015, and to monitor the spatially explicit changes of lakes between 1977 and 2015. Results revealed that the total number of lakes (area > 0.5 km2) increased by 18, while their total area expanded by 29.8%, from 1761.5 ± 88.1 km2 to 2285.9 ± 91.4 km2. Meanwhile, glaciers have decreased in area by 259.16 km2 in the past four decades. The structural equation model (SEM) was applied to examine the integrative effects of natural and anthropogenic factors on lake area. Precipitation change exhibited the most significant influence on lake area in the QB from 1977 to 2000, while human activities also played an important role in the expansion of lakes in the QB in the period 2000–2015. In particular, extensive exploitation of salt lakes as mining resources resulted in severe changes in lake area and landscape. The continuously expanding salt lakes inundated the road infrastructure nearby, posing great threats to road safety. This study shed new light on the impacts of recent environmental changes and human interventions on lakes in the Qaidam Basin, which could assist policy-making for protecting the lakes and for strengthening the ecological improvement of this vast, arid basin.

Graphical Abstract

1. Introduction

Lakes distributed worldwide can act as indicators of global climate change in many different geographic conditions and climatic regions [1]. The Tibetan Plateau (TP) in central Asia, with an average elevation higher than 4000 m, boasts the highest concentration of high-altitude inland lakes in the world and holds the most extensive store of ice except the Arctic and Antarctic [2,3]. The high-altitude lakes and alpine glaciers thus serve as essential water resources and are sensitive to climate changes and human activities [1,4]. Considerable evidences have shown that the TP has been experiencing significant climate change (e.g., warming, glacier retreat, and permafrost melting) [5,6,7,8], and the high-altitude lakes respond rapidly to these changes [9]. Over the past 40 years, climate change has been an important factor in the evolution of high-altitude lakes [10] as the water cycle in drainage basins has been changed with respect to rainfall, evaporation, and meltwater from glacier and snow [11]. Therefore, long-term monitoring and mapping lakes and glaciers can provide reliable guidance of climate change, and further facilitate our understanding of water resource changes and eco-environmental effects on the Tibetan Plateau [12].
Due to the limited accessibility of the TP, remote sensing becomes the most feasible method for monitoring and analyzing long-term time series of lake extent changes [13,14,15]. Optical remote sensing is a commonly used dataset for dynamic monitoring of changes in water surface areas [16]. The Landsat series have provided a nearly continuous, medium-resolution data record of the Earth’s surface from the early 1970s to the present [17]. The open resource of the full historical Landsat archive and the launch of Landsat-8 have secured the capability of lake monitoring on the TP with a reliable temporal resolution for the past, present, and future [18]. With Landsat image series, numerous studies have been conducted to investigate the distribution and spatial-temporal changes of high-altitude lakes within the entire TP [2,6,14] and its sub-basins such as the Himalaya [15,19], Pumqu River Basin [20], Namco Basin [21], and Yamzhog Yumco Basin [22]. These investigations revealed that lakes on the TP showed a strong spatiotemporal variability from the 1970s to the present. Some lake groups in the central TP showed a more rapid growth rate than those in the rest of the TP [2]. The glacial lakes in the Himalaya showed a continuous increase in lake area over the past decades [15]. Some lakes in the Qiangtang Plateau experienced shrinkage from the early 1970s to the late 1990s, then a rapid expansion after 2000 [23]. However, most of the lakes in the southern and eastern TP have shrunk remarkably during the past decades [24].
The Qaidam Basin (QB) on the northern edge of the TP, known as the “Treasure Bowl”, is one of the largest hyper-arid intermontane basins on the Earth [23]. Ringed by mountains, this basin was uplifted by the formation of the TP to over 2600 m above sea level, lower than the rest of the plateau stretching far to the south, west, and east [24]. The basin is rich in salt lake resources, including lithium, salt, potash, magnesium, and minerals from ores such as zinc, gold, oil, and gas [25], and has therefore been recognized as a treasure house for China’s industry and economy. The unique topography, climate, and mining activities have led to a fragile ecological environment of the lakes in the QB [26]. In the past, research has mainly focused on the popular regions of the TP with abundant lakes and the influences of dramatic climate changes. Very limited studies have been conducted in the QB to make a systematic investigation of its current status of the lakes. Assisted with Landsat images and meteorological data, this study aims to examine the area change of lakes as a response of this basin to the changing climate and human intervention from 1977 to 2015. With improved spatial and temporal details, the findings in this study could serve as the base information for long-term ecological monitoring and environmental policy-making for the Qaidam Basin.

2. Materials and Methods
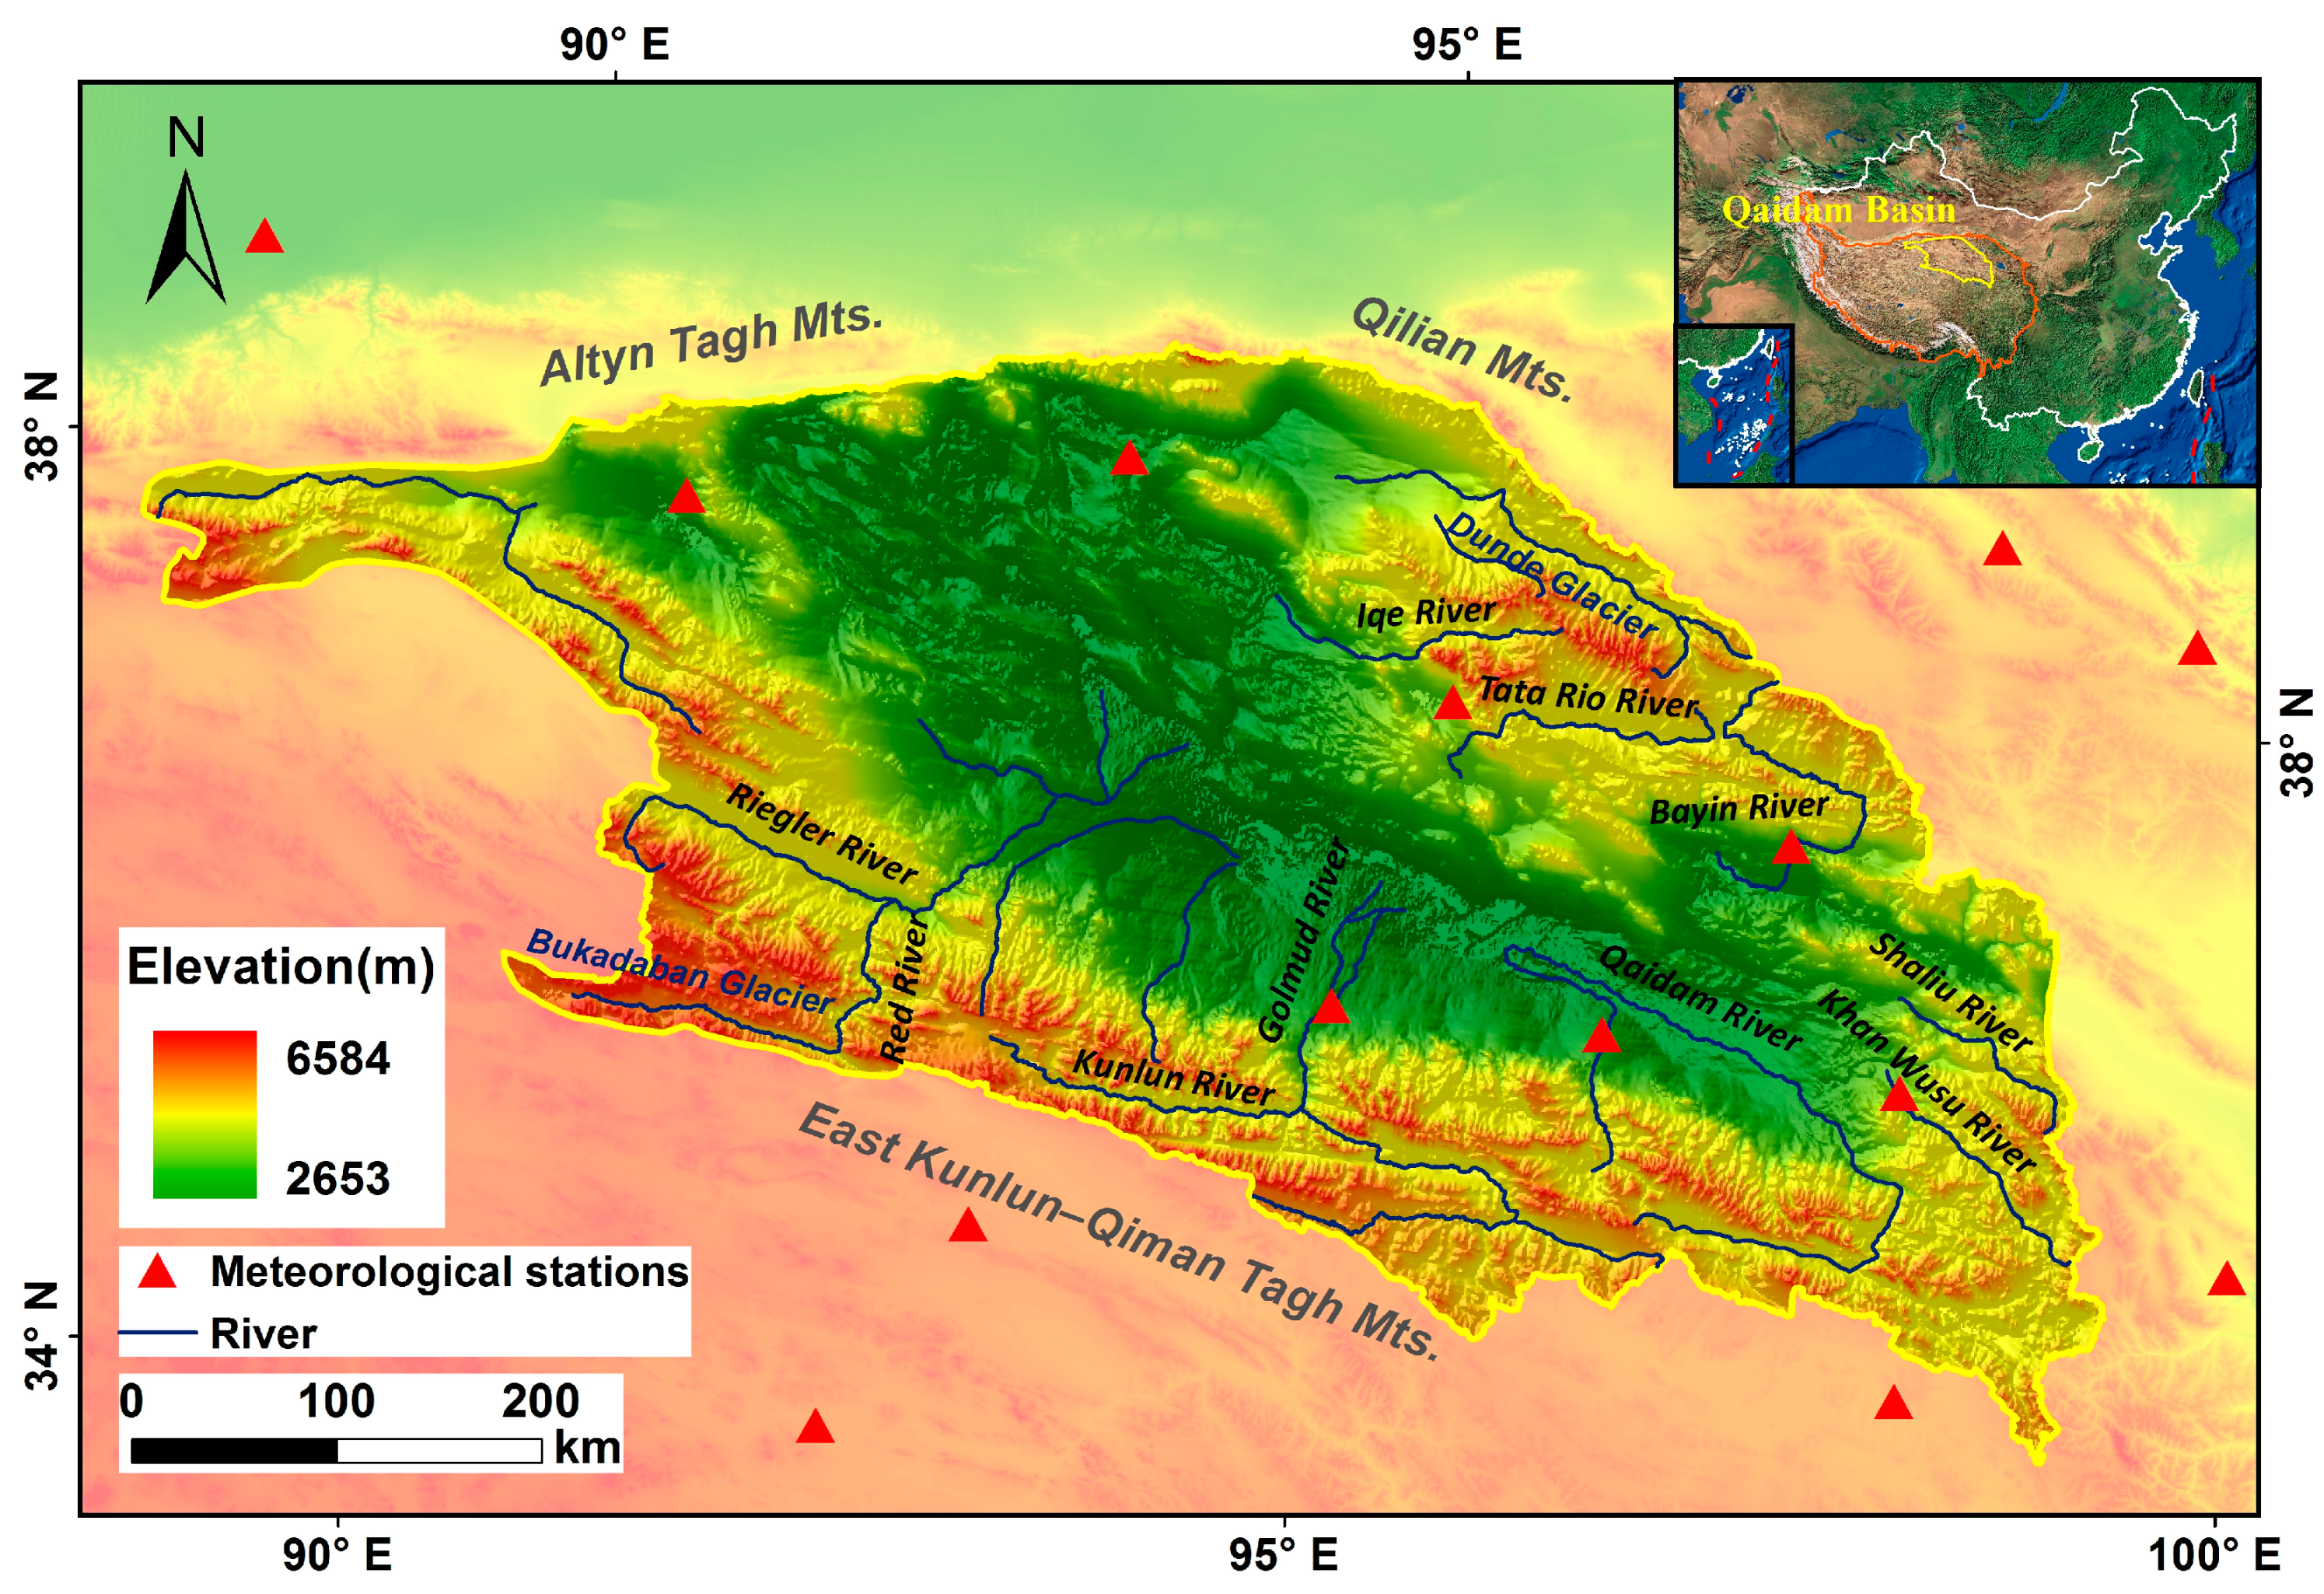
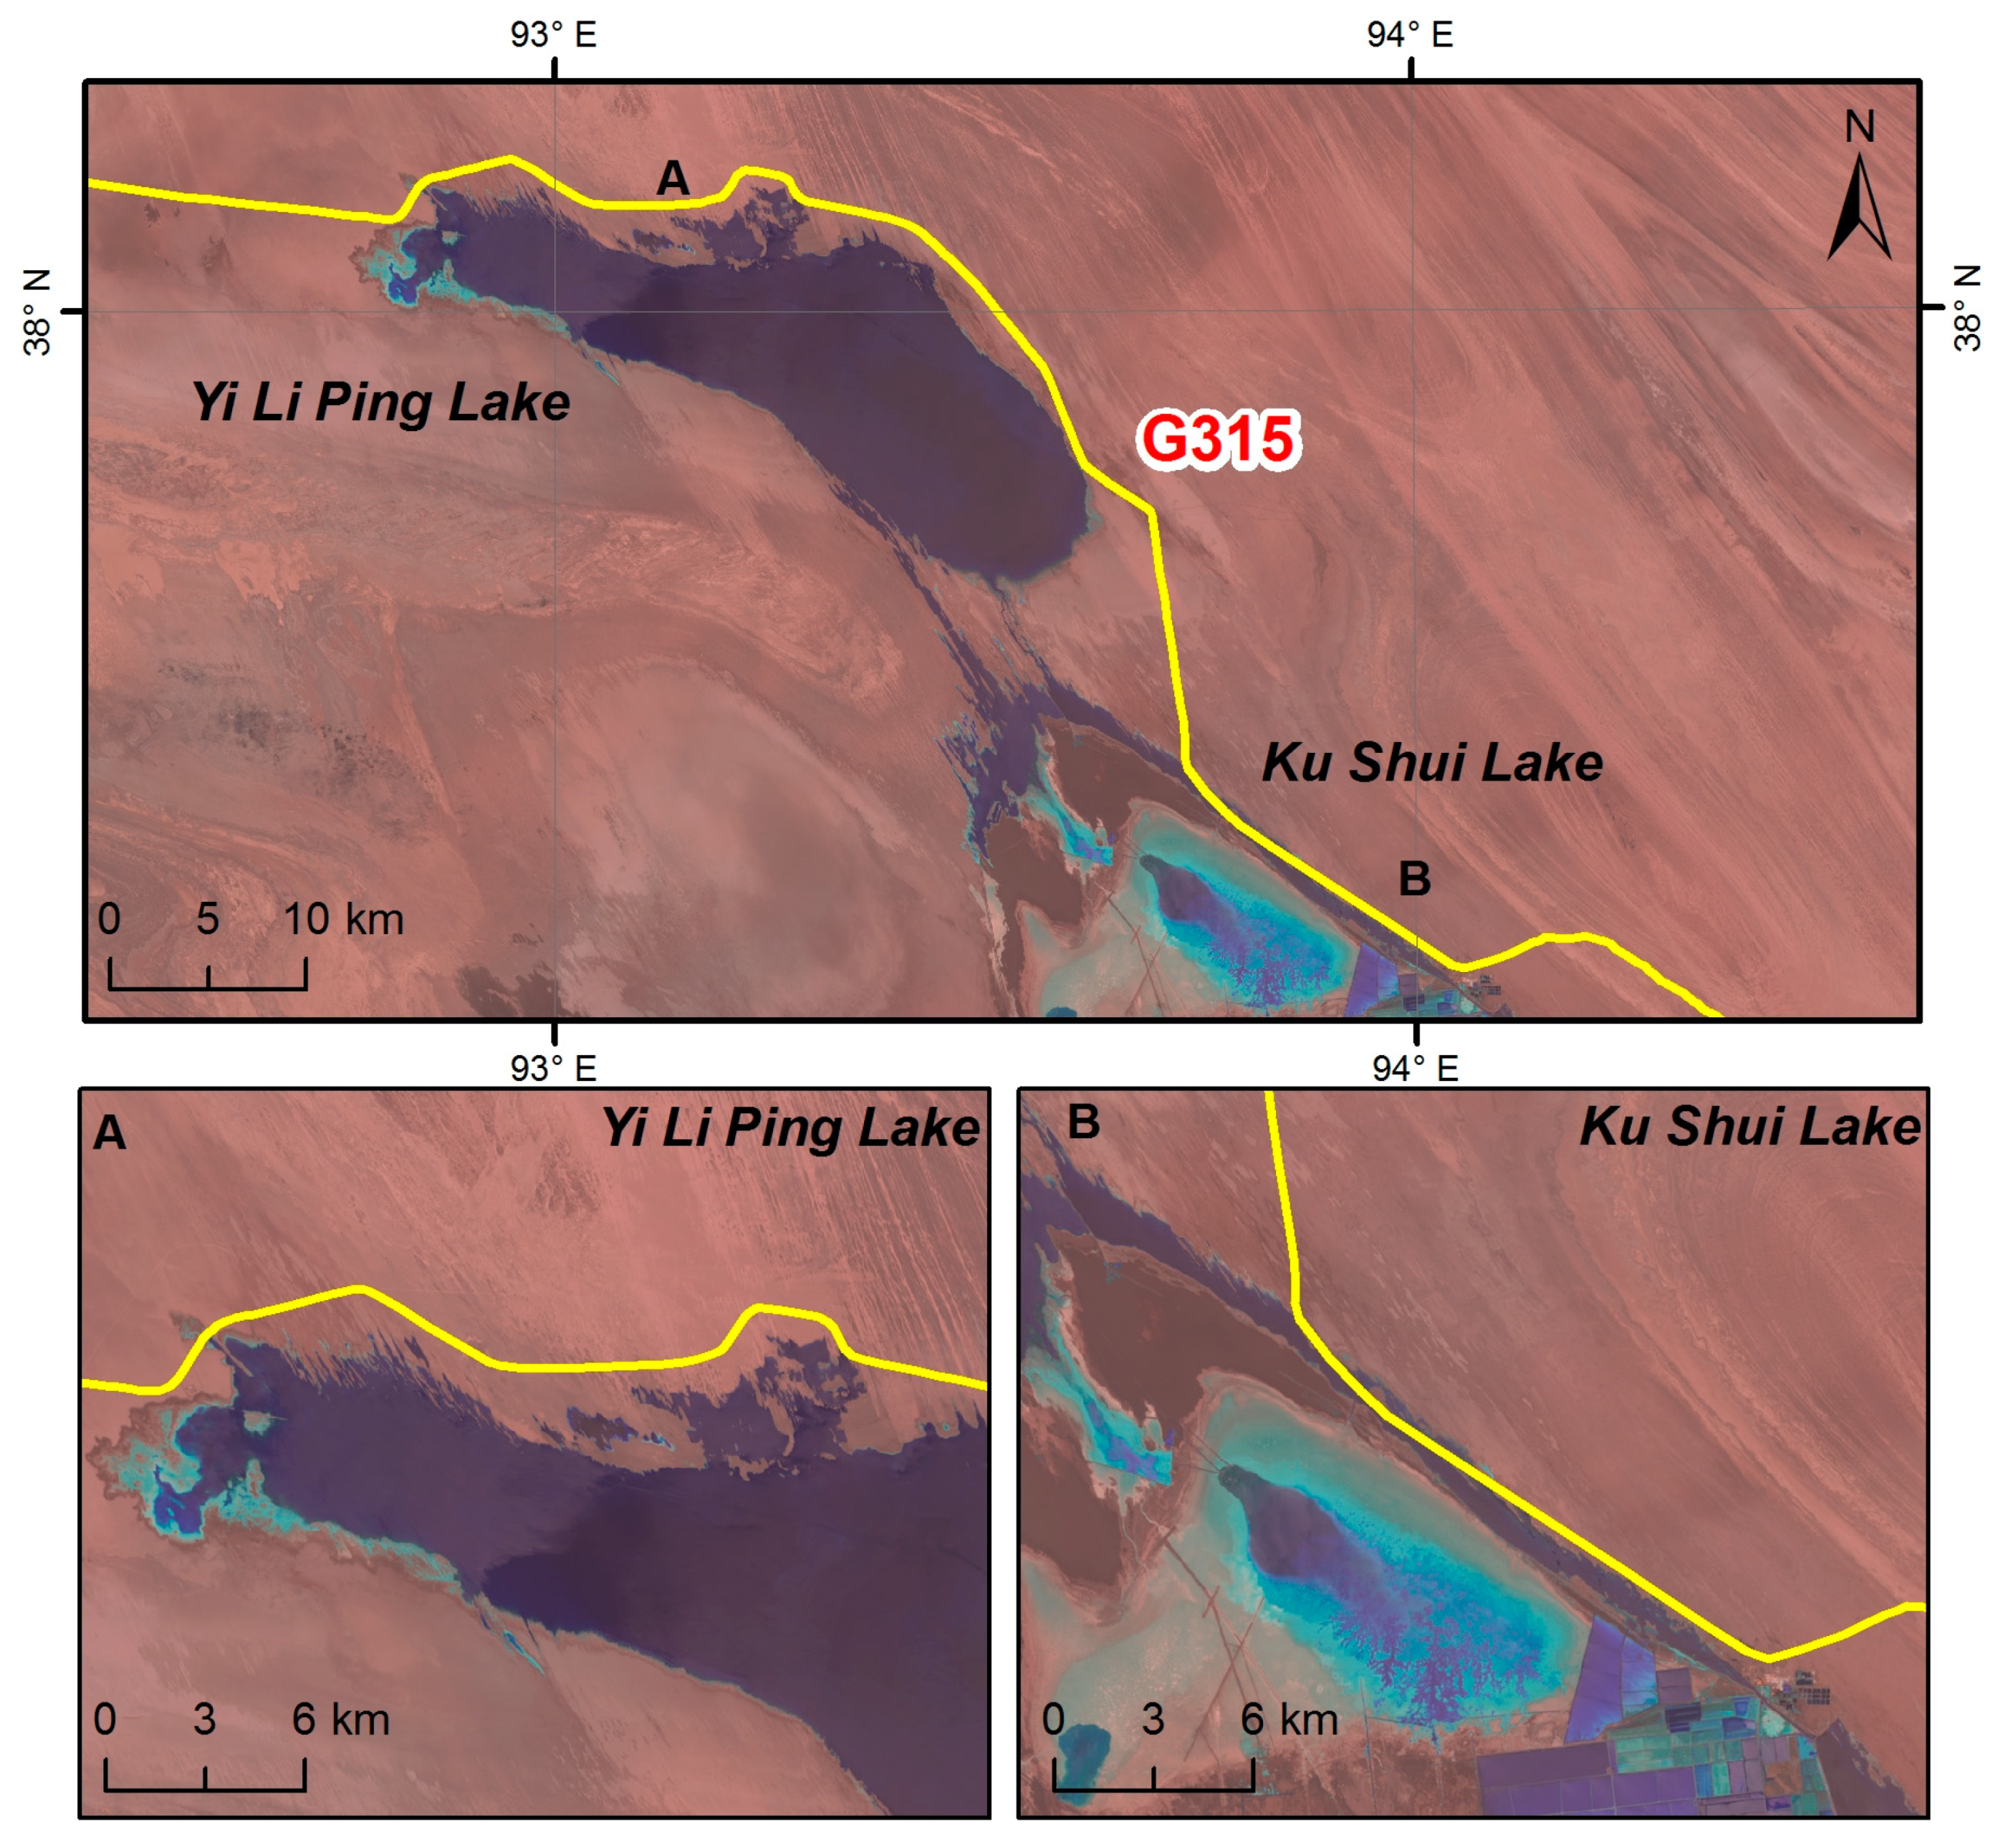
2.1. Study Area

The Qaidam Basin (87°49′–99°20′ E, 35°0′–37°41′ N) is located at the northeast of the Tibet Plateau, covering approximately 275,000 km2, with the elevation ranging from 2600 m to 6500 m above sea level [27]. The QB is the largest sedimentary basin in the TP, the third largest inland basin of China, and the highest desert on the Earth [28]. It is delineated by the Qilian orogenic belt to the northeast, the East Kunlun–Qiman Tagh orogenic belt to the south–southwest, and the Altyn Tagh Fault to the northwest (Figure 1). A typical plateau continental climate prevails the basin with the mean annual air temperature below 5 °C. Its mean annual precipitation is less than 200 mm but the mean annual evaporation capacity is 2000–3000 mm [29]. The particular geographical location and climatic characteristics make the QB a poorly gauged, hyper-arid basin. Under the threat of global warming, it has become a vulnerable and sensitive region responding to climate change.

2.2. Datasets

For lake extent mapping in the basin, a total of 66 Landsat top-of-atmosphere (TOA) reflectance images acquired by Multispectral Scanner (MSS), Thematic Mapper (TM), Thematic Mapper Plus (ETM+), and Landsat Operational Land Imager (OLI) were downloaded, at decadal intervals, from the United States Geological Survey (USGS) Data Clearinghouse (Earth Explorer) and China Geospatial Data Cloud (http://www.giscloud.cn/). The year 1977 is the earliest time from which we can acquire abundant high-quality images covering the whole study area and 2015 was the latest year when we started with this research. The years of 1990 and 2000 were chosen for decadal analysis. To cover the entire lakes in the QB, 18 Landsat MSS images in 1977, and 17, 15, and 16 Landsat TM/ETM+/OLI images in 1990, 2000, and 2015 were acquired, respectively. Most images were acquired in September to October, when Tibetan lakes reach the maximum extent with the least ice cover [23]. For a specific tile, when the image in one specific year was not available due to cloud cover, those in adjacent years (within ±1 year) were selected as substitutes. Only images with 100% cloud-free cover in areas of lakes were selected. Glaciers are often considered the primary water source for high-altitude lakes on the TP [23]. Therefore we also interpreted glacier changes in the basin.
For glacial mapping, 36 Landsat MSS images and 43, 42, and 40 Landsat TM/ETM+/OLI images were acquired for the years 1970, 1990, 2000, and around 2015, respectively. Similarly, images acquired in the time from July to October are used to eliminate the interference of seasonal snow and mountain shadows on glacier identification. In addition, Shuttle Radar Topography Mission Digital Elevation Model (SRTM DEM) with a 1-arc second (30 m) resolution obtained from USGS (https://www.usgs.gov/) was employed in topographic analysis.
Image preprocessing was performed before interpretation. The 79-m MSS images were a match the rest of Landsat images. Resampling from lower resolution images to higher resolution images carried no substantial impact on the analyzing process but uniformed the spatial resolution [30]. All Landsat images were geo-rectified using the 1:50,000 topographic maps. An average root mean square error (RMSE) of less than 0.5 pixels was obtained for all co-registered images. The FLAASH module in ENVI 4.8 was applied to perform atmospheric correction of all Landsat images. The parameters of average elevation, scene center coordinates sensor type, flight date and time, atmospheric model, and information about aerosol distribution, visibility and water vapor conditions were used for atmospheric correction.
Meteorological data from 14 meteorological stations located within and around the QB (marked in Figure 1) were acquired from the China Meteorological Data Sharing Service System (http://cdc.cma.gov.cn/index.jsp). Spatial patterns of mean annual air temperature (MAAT) and mean annual precipitation (MAP) were extracted from meteorological records with the Anusplin software [31] in light of the elevation differences. The programs SPLINA and LAPGRD were used to interpolate the MAAT and MAP. Daily climatic records, including mean wind speed, maximum and minimum air temperature, relative humidity, and sunshine hours for the 14 meteorological stations were acquired. Potential evapotranspiration (PET) was estimated using these daily data and the Food and Agriculture Organization (FAO) Penman–Monteith method [32]. The estimated datasets were summed to annual products and were further interpolated to raster-based data formats covering the whole study area by means of an ordinary Kriging method in the ArcMap 10.2 software.
A stratified random sampling strategy was used to obtain reference samples. For the periods of 2000 and 2015, we collected reference data from high-resolution images available on Google Earth. For the periods of 1970 and 1990, we selected samples from historic topographic maps. As the focus of this study is the spatial-temporal dynamics of lakes and glaciers, the reference samples consisted of lake, glacier, and others (e.g. land). Detailed information of reference samples is given in Table 1.

2.3. Methods

2.3.1. Extracting Lake Extents

In this study, we focused on lakes with an area larger than 0.5 km2, since the European Water Framework Directive imposed a minimum size of 0.5 km2 to be defined as a lake [33]. Lake extents of the QB in 1977, 1990, 2000, and 2015 were extracted using the object-oriented classification method in the eCognition software version 8.64 (Definiens Imaging, Munich, Germany). The first step of the object-oriented method was segmentation, which is the process of segmenting a multi-band image into groups of homogeneous pixels in order to minimize the variability in the object [30]. In this step, three parameters need to be determined: scale, shape, and compactness. The Landsat TM/ETM+ and OLI images have the same spatial resolution, but different spectral and radiometric resolutions result in diverse segmentation scales. In this study, the segmentation scales of 10 (MSS), 30 (TM/ETM+), and 60 (OLI) were found to be the most appropriate for the characteristics of the lakes. The shape parameter was set to 0.1 to maximize the impact of spectral information. The compactness was set to 0.8 to control the final shape of the image object.
The second step of the approach was to classify lake objects from the segmented image in eCognition. Unlike other land cover types, water absorbs much more light in the NIR band than in the visible band. The normalized difference water index (NDWI) was adopted to derive the water extent, which has been successfully employed in water feature extraction from remote sensing data [34,35,36]. It is calculated as in Reference [37]:
N D W I = B a n d N I R B a n d G r e e n B a n d N I R + B a n d G r e e n
where BandNIR and BandGreen are an image’s spectral bands in near infrared and green regions. For the Landsat images we used, the MSS band 1 (0.50–0.60 μm), TM band 2 (0.52–0.60 μm), ETM+ band 2 (0.52–0.60 μm), and OLI band 3 (0.53–0.59 μm) are green bands, whilst MSS band 3 (0.70–0.80 μm), TM band 4 (0.76–0.90 μm), ETM+ band 4 (0.77–0.90 μm), and OLI band 5 (0.85–0.88 μm) are NIR bands.
The NDWI index was built in eCognition and an optimal threshold was determined to delineate water surfaces from other land covers by adjusting the range of NDWI manually. With this threshold, objects of water bodies and land covers were classified based on the fuzzy membership function in eCognition [38]. By defining the length/width index and rectangular fit index [39] built in the software, rivers and artificial ponds were removed.
Finally, the extracted water surfaces were visually interpreted to manually modify the misclassified objects and exclude reservoirs using the database from the China National Land Cover Dataset [40]. Each lake was also inspected according to Landsat images and high-resolution images such as Google Earth images, when available.

2.3.2. Extracting Glaciers

In order to investigate the responses of lakes to glacier retreat, we mapped the glacier distribution in the QB. Snow/ice generally has high reflection in the green band whilst is low in the shortwave infrared (SWIR). The normalized difference snow index (NDSI) [41], known for its ability to differentiate snow/ice from other image features, was used for recognizing glaciers:
N D S I = B a n d G r e e n B a n d S W I R B a n d G r e e n + B a n d S W I R
The object-oriented image segmentation method used in Section 2.3.1 was also applied to extract glacier areas based on multi-temporal Landsat images. A NDSI histogram was generated for each image and an optimal threshold value was determined to delineate snow/ice boundaries. Glaciers in the QB are mainly located in the highest area with the altitude more than 4000 m, and partial glaciers were not detectable due to the shadows of mountains. Mountain shadows of each image can be identified by topographic models with SRTM DEM and some parts of the glaciers in shadow regions can be identified.
Seasonal snow has similar spectral characteristics to glaciers, which is a complicating factor in glacier inventory from satellite images. The ice/snow boundaries extracted from multi-temporal images of each period were intersected to remove the interferences of snow and get the minimum ideal glacier extents [42]. To reduce the effects of mountain shadows on glaciers, in each period, the following processes were performed to obtain the total glacier area via spatial overlay analysis:
  • The sum mountain shadow area M S was determined by the union of the mountain shadows in multi-temporal images with varying sun angles.
    M S = i = 1 N M ( i )
    where N is the number of the multi-temporal images, M(i) represents the area of mountain shadows in image i, i [1,N].
  • The glacier area G m ( i ) located in mountain shadows of image i is calculated by:
    G m ( i ) = G t ( i ) M S
    where G t ( i ) is the glacier extent in temporal i image.
  • The glaciers in the total mountain shadows G m can be delineated by:
    G m = i = 1 N [ G m ( i ) M ( i ) ]
The total glacier area G ( i ) in image i and the minimum glacier area G S of the multi-temporal glacier boundaries were calculated as follows:
G ( i ) = G t ( i ) G m
i = 1 N G ( i )
Again, visual interpretation was performed to edit glacier boundaries if needed.

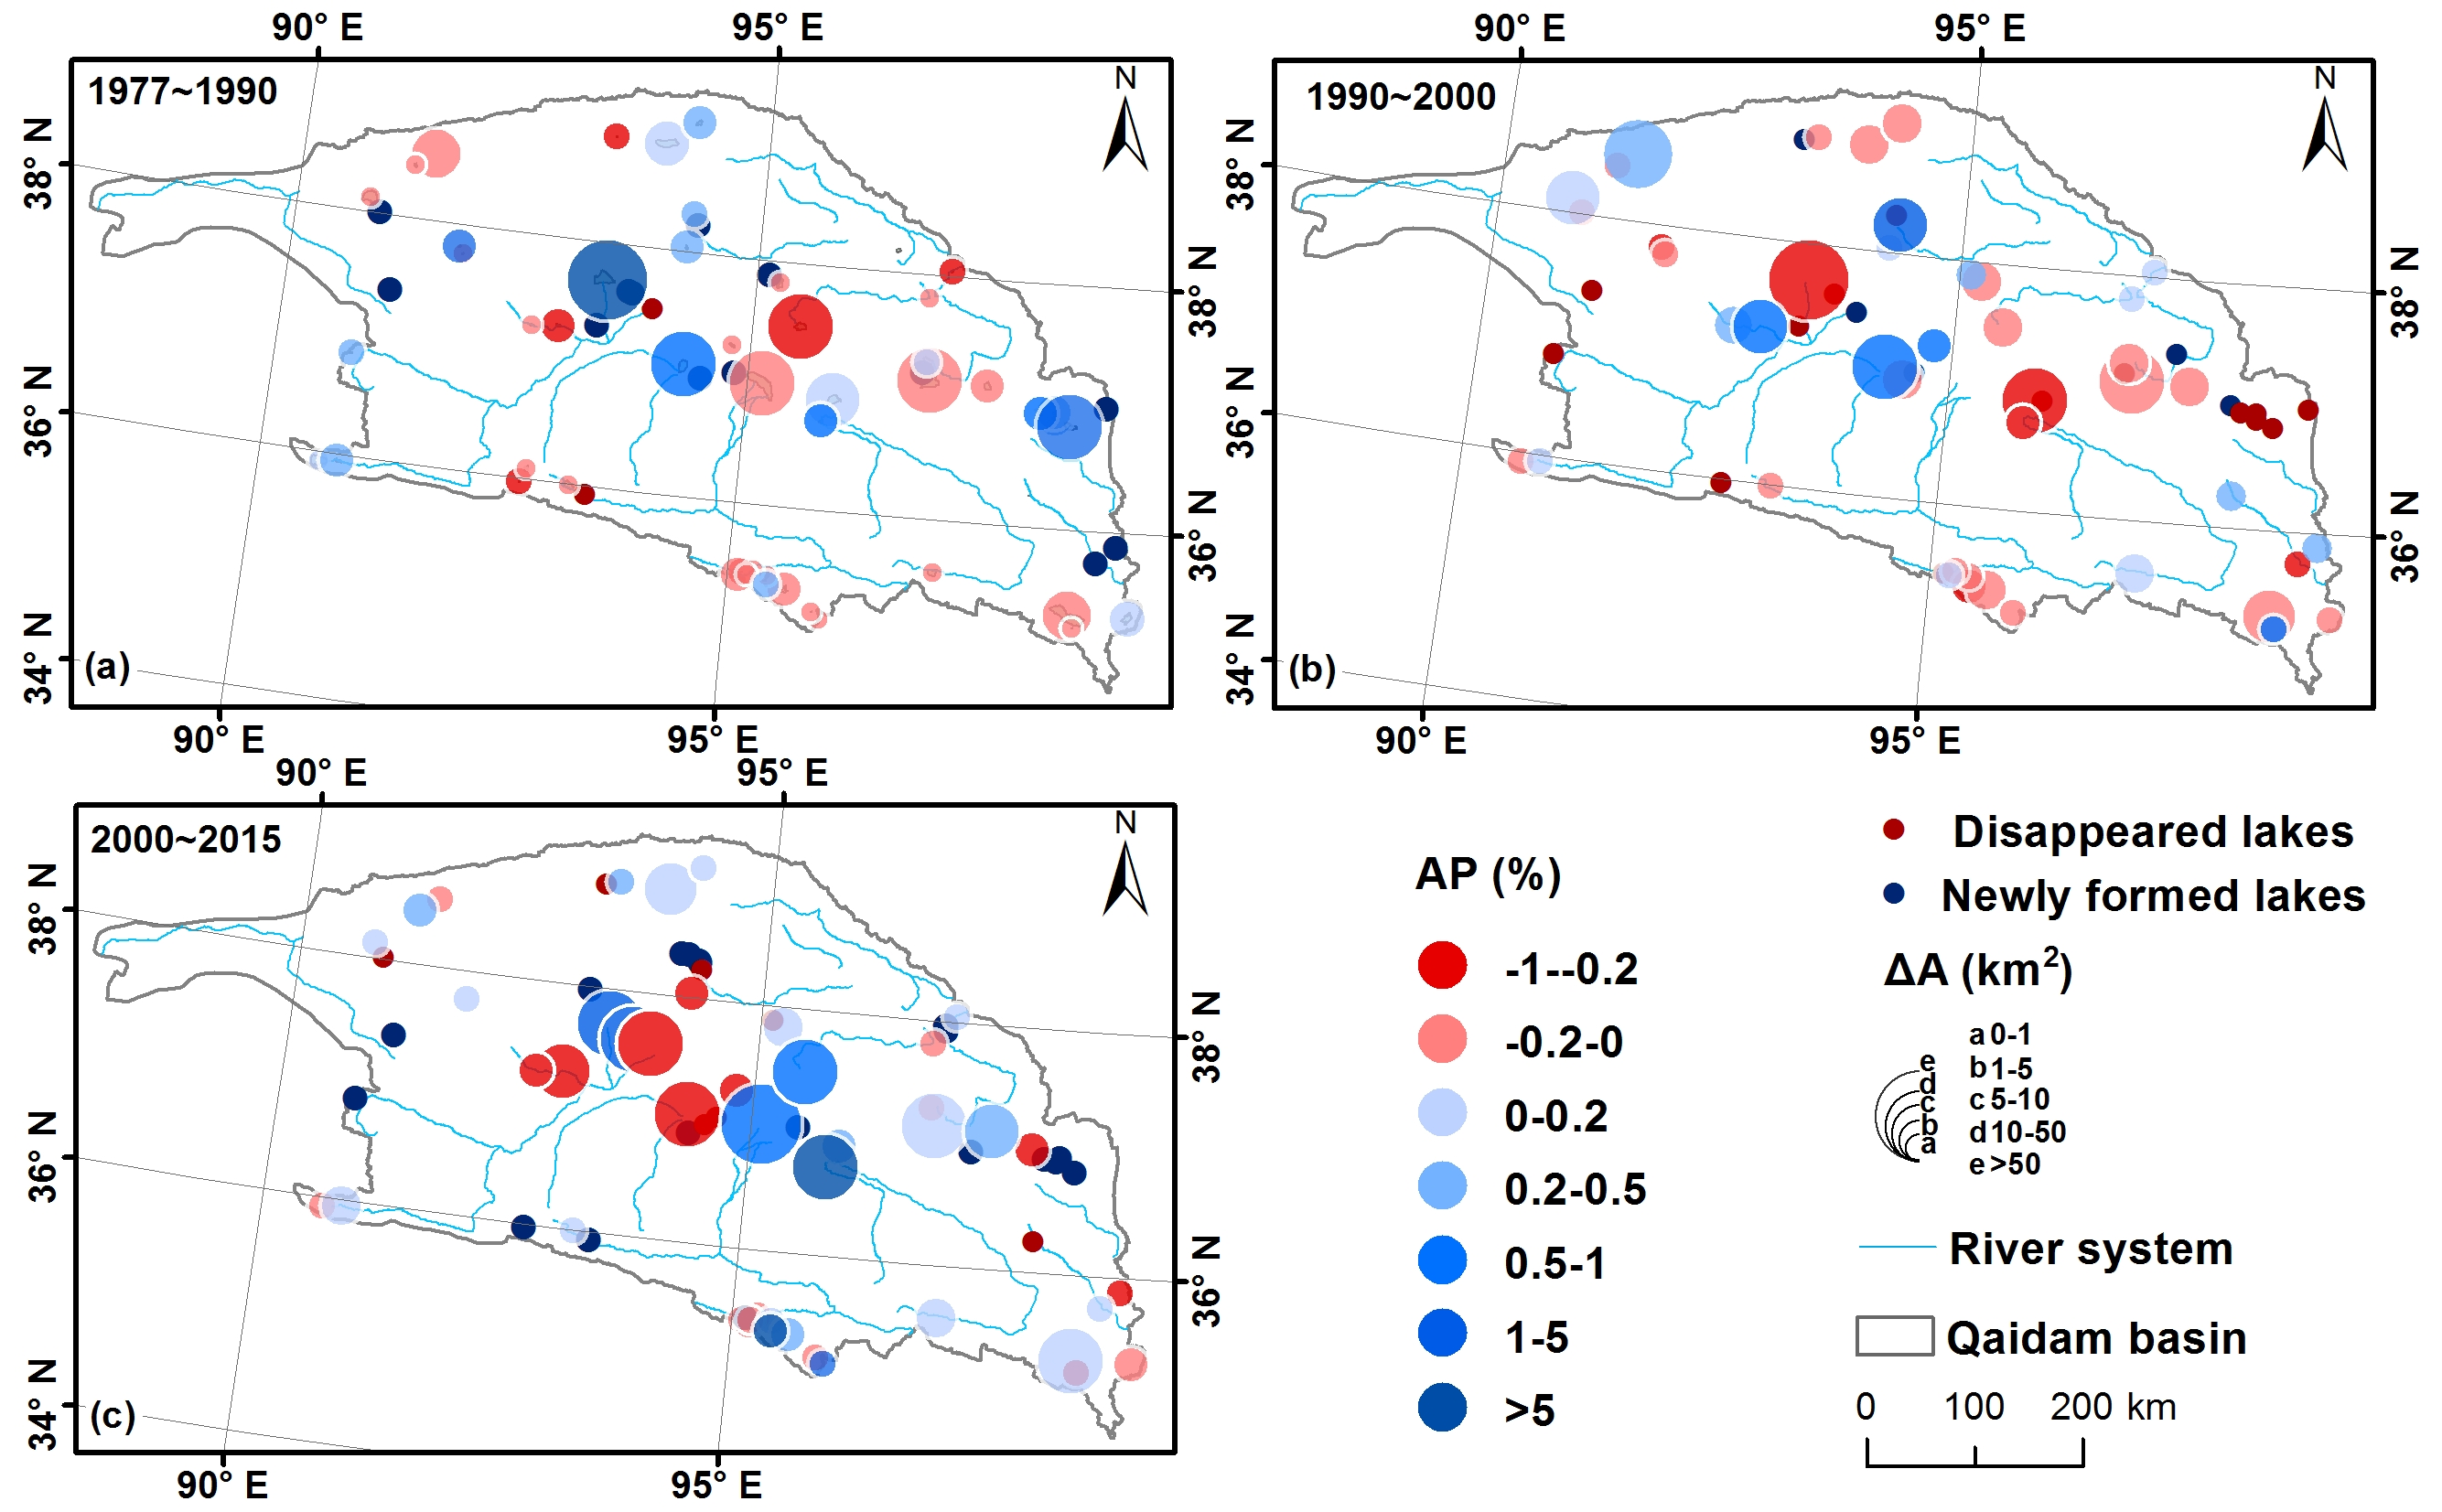
2.3.3. Area Change Analysis

Lake and glacier area changes were analyzed in total area change (ΔA in unit of km2), percentage of area change (AP in %), and an annual change rate (AR in km2 a−1):
Δ A = A 1 A 0
A P = Δ A A 0 × 100
A R = Δ A Δ T .  
where A0 and A1 are the areas of lakes or glaciers between any two consecutive stages; AP represents the lake or glacier area change ratio; AR represents the annual change; and ∆T is the time in years.

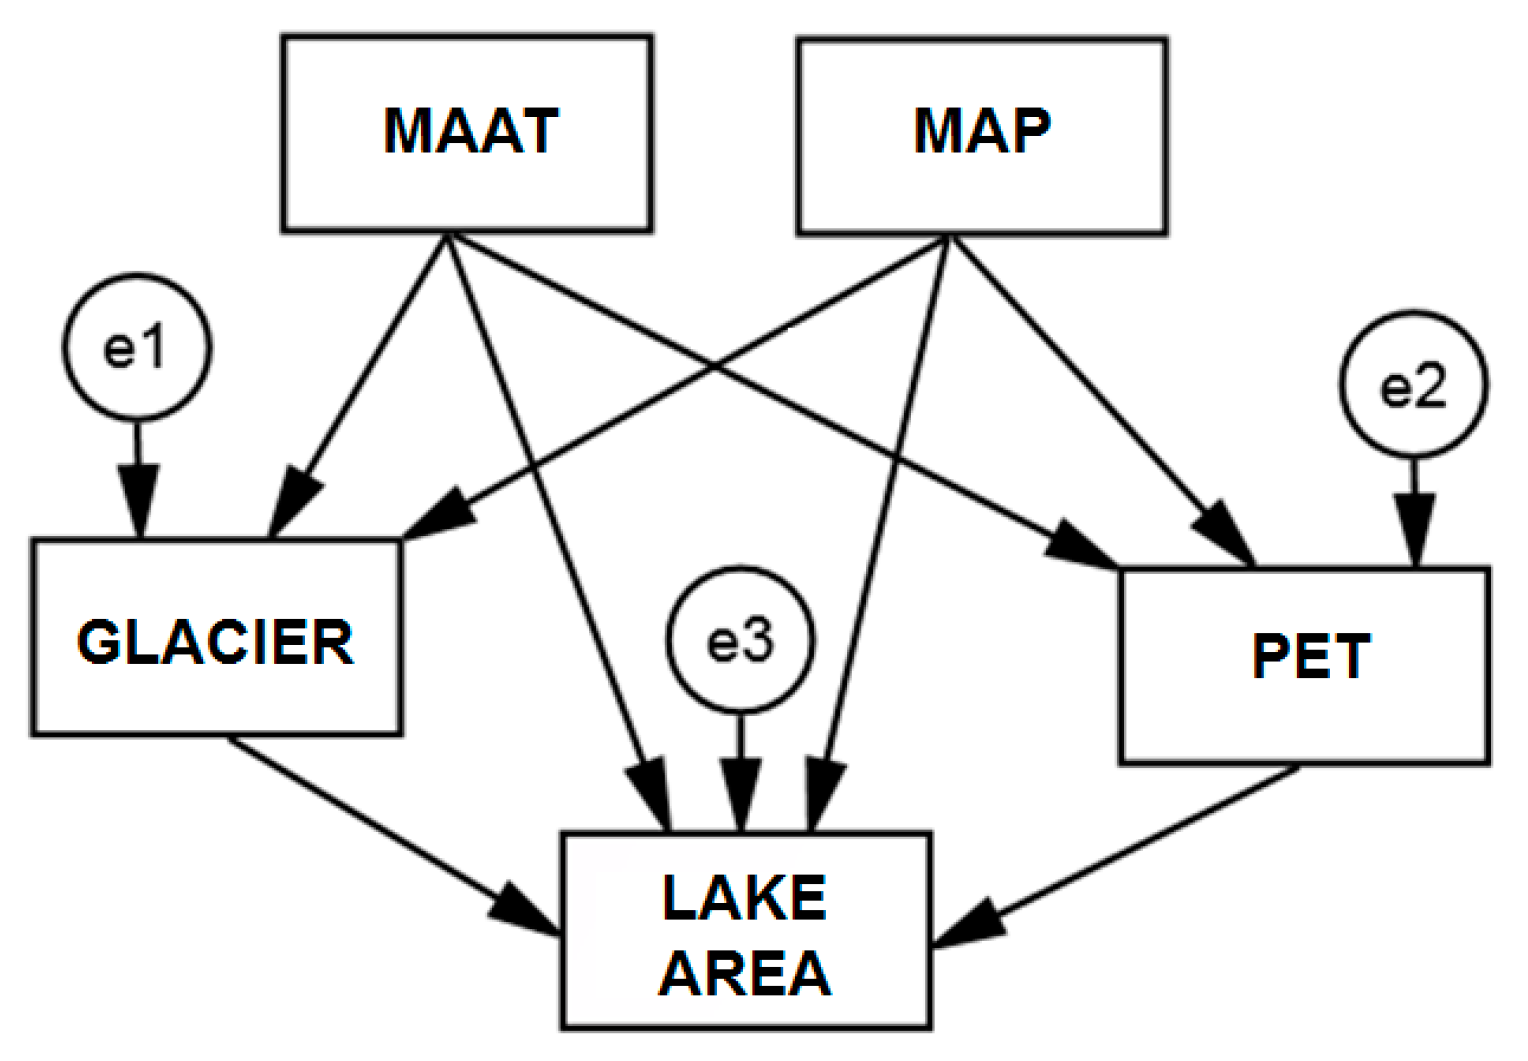
2.3.4. Correlation Analysis

To investigate the potential influences on lake variations, we applied structural equation modeling (SEM) for correlation analysis between lake area changes and environmental variables (climate and glacier). SEM is a multivariate technique that combines aspects of multiple regression and factor analysis to estimate a series of interrelated dependence relationships simultaneously [43].
SEM was applied based on the buffer areas of the extracted lakes in the QB. Different from traditional exploratory factor analysis, SEM utilizes a hypothesized structural model and absolute fit indices to determine how well the model fits the sample data [44]. The hypothesized model formulated in the statistical software AMOS 22.0 [45] is shown in Figure 2. The independent variables were MAAT change, MAP change, PET change, and glacier area change, and the dependent variable was lake area change. Associated with each dependent variable is an error term (residual variances) described by e1, e2, and e3. The single-headed arrows between variables represent the structural relationship between two variables. After the model runs, regression coefficients will be marked along the single-headed arrows indicating a hypothesized impact of one variable on another.
After the estimates were obtained, the most widely reported fit indices were used to test the fitness of the design model. Here we listed the absolute fit indices used in this study and recommended values which indicate a good fit (Table 2).

3. Results and Discussion

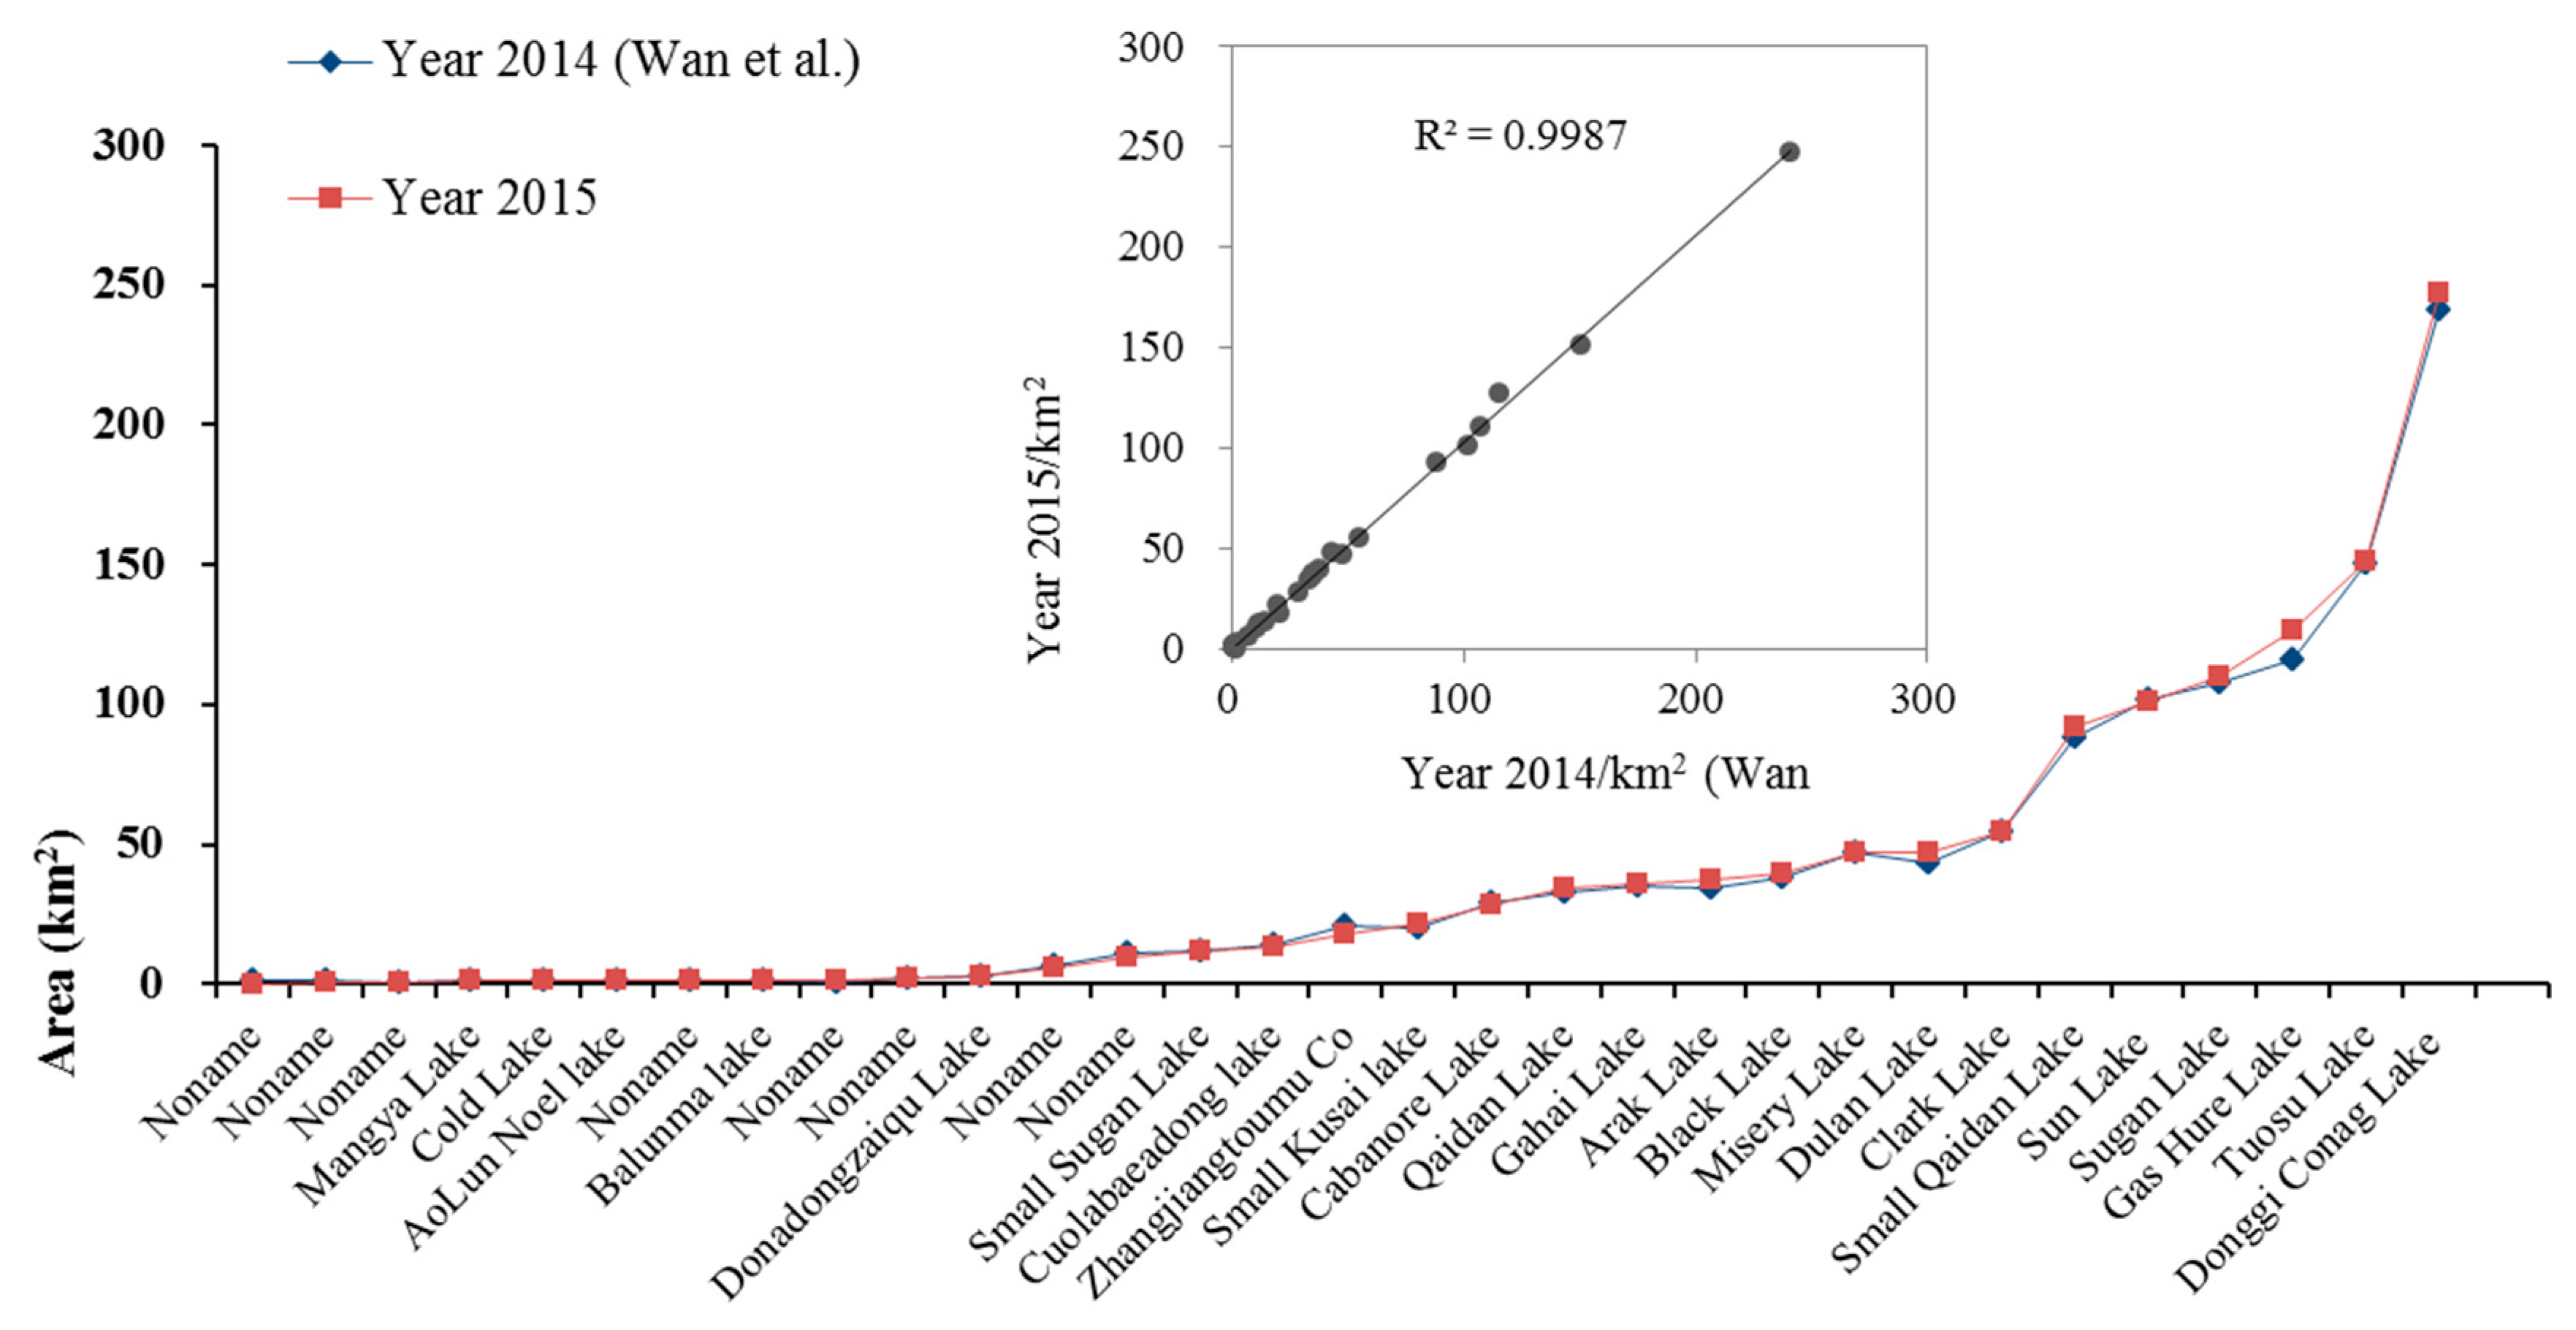
3.1. Accuracy Assessment

As shown in Table 3, accuracies of the classified lakes and glaciers in 1977, 1990, 2000, and 2015 were calculated using ground reference samples. The lake and glacier maps in these periods all had decent accuracies, with overall accuracies of 86–93%. Errors were mainly caused by misclassification between lakes and cloud shadows and between glaciers and mountain shadows. The results of the accuracy assessment show that the extraction results of lakes and glaciers are consistent with the ground truth.

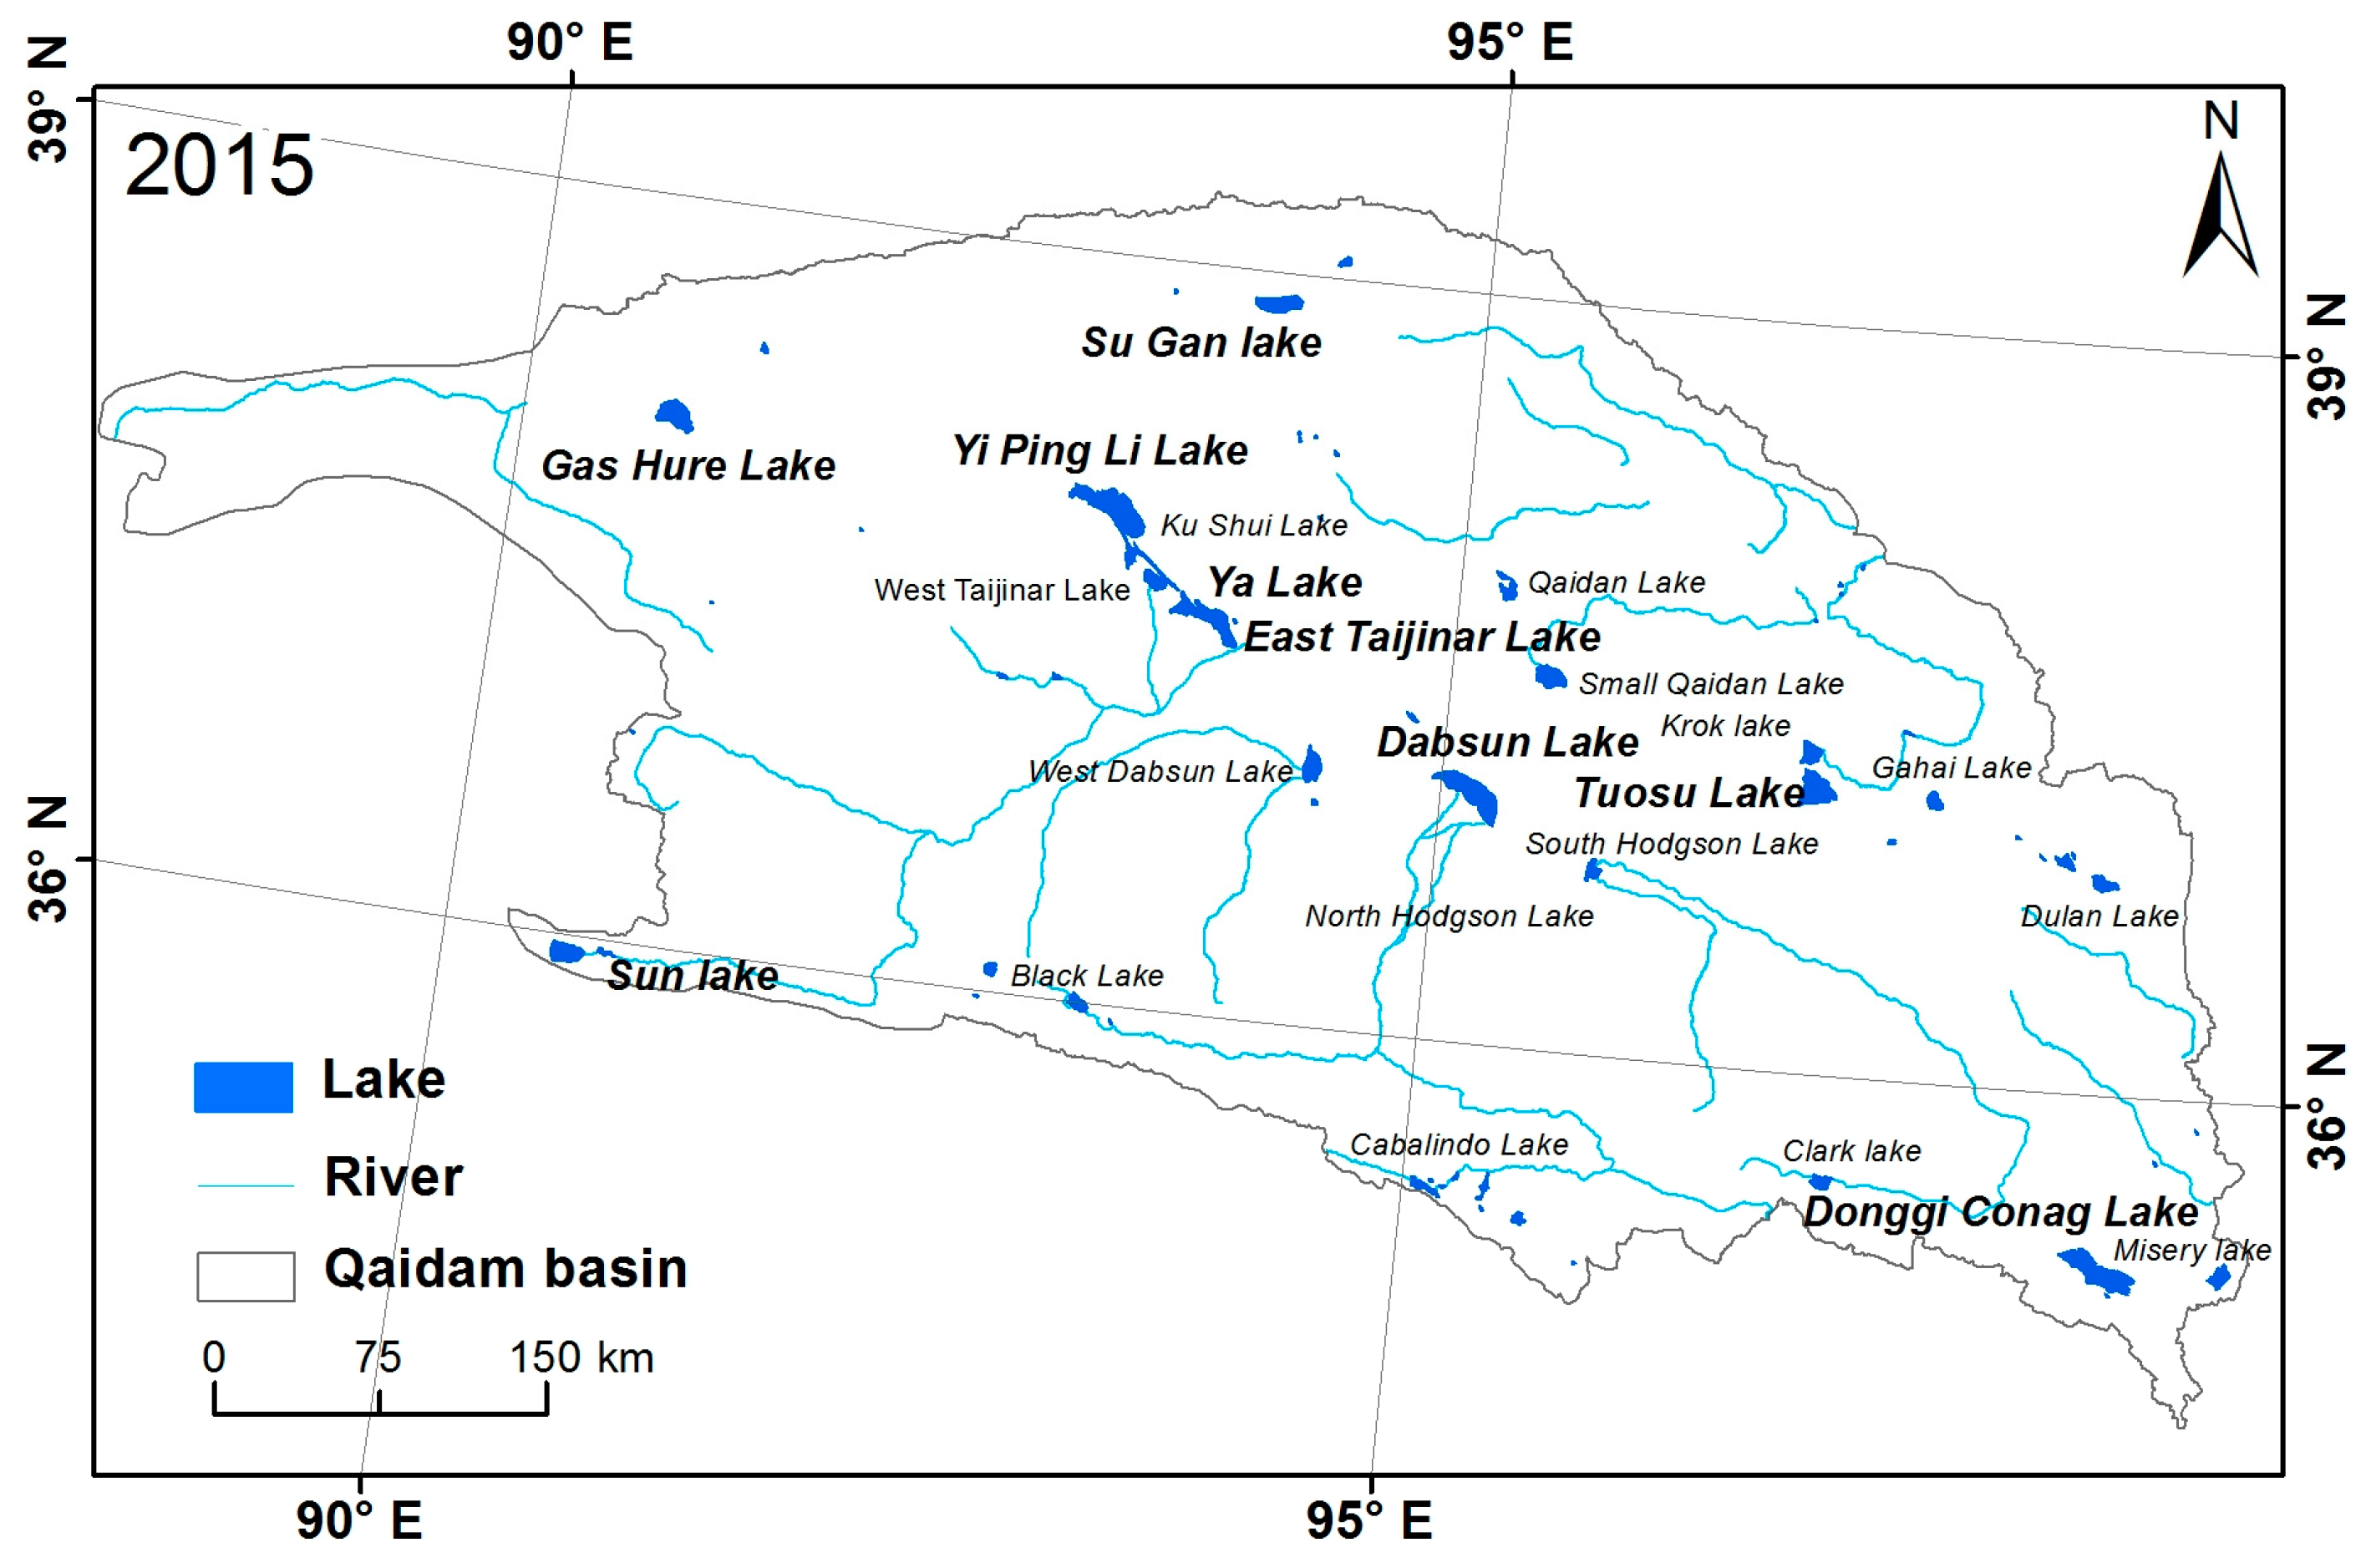
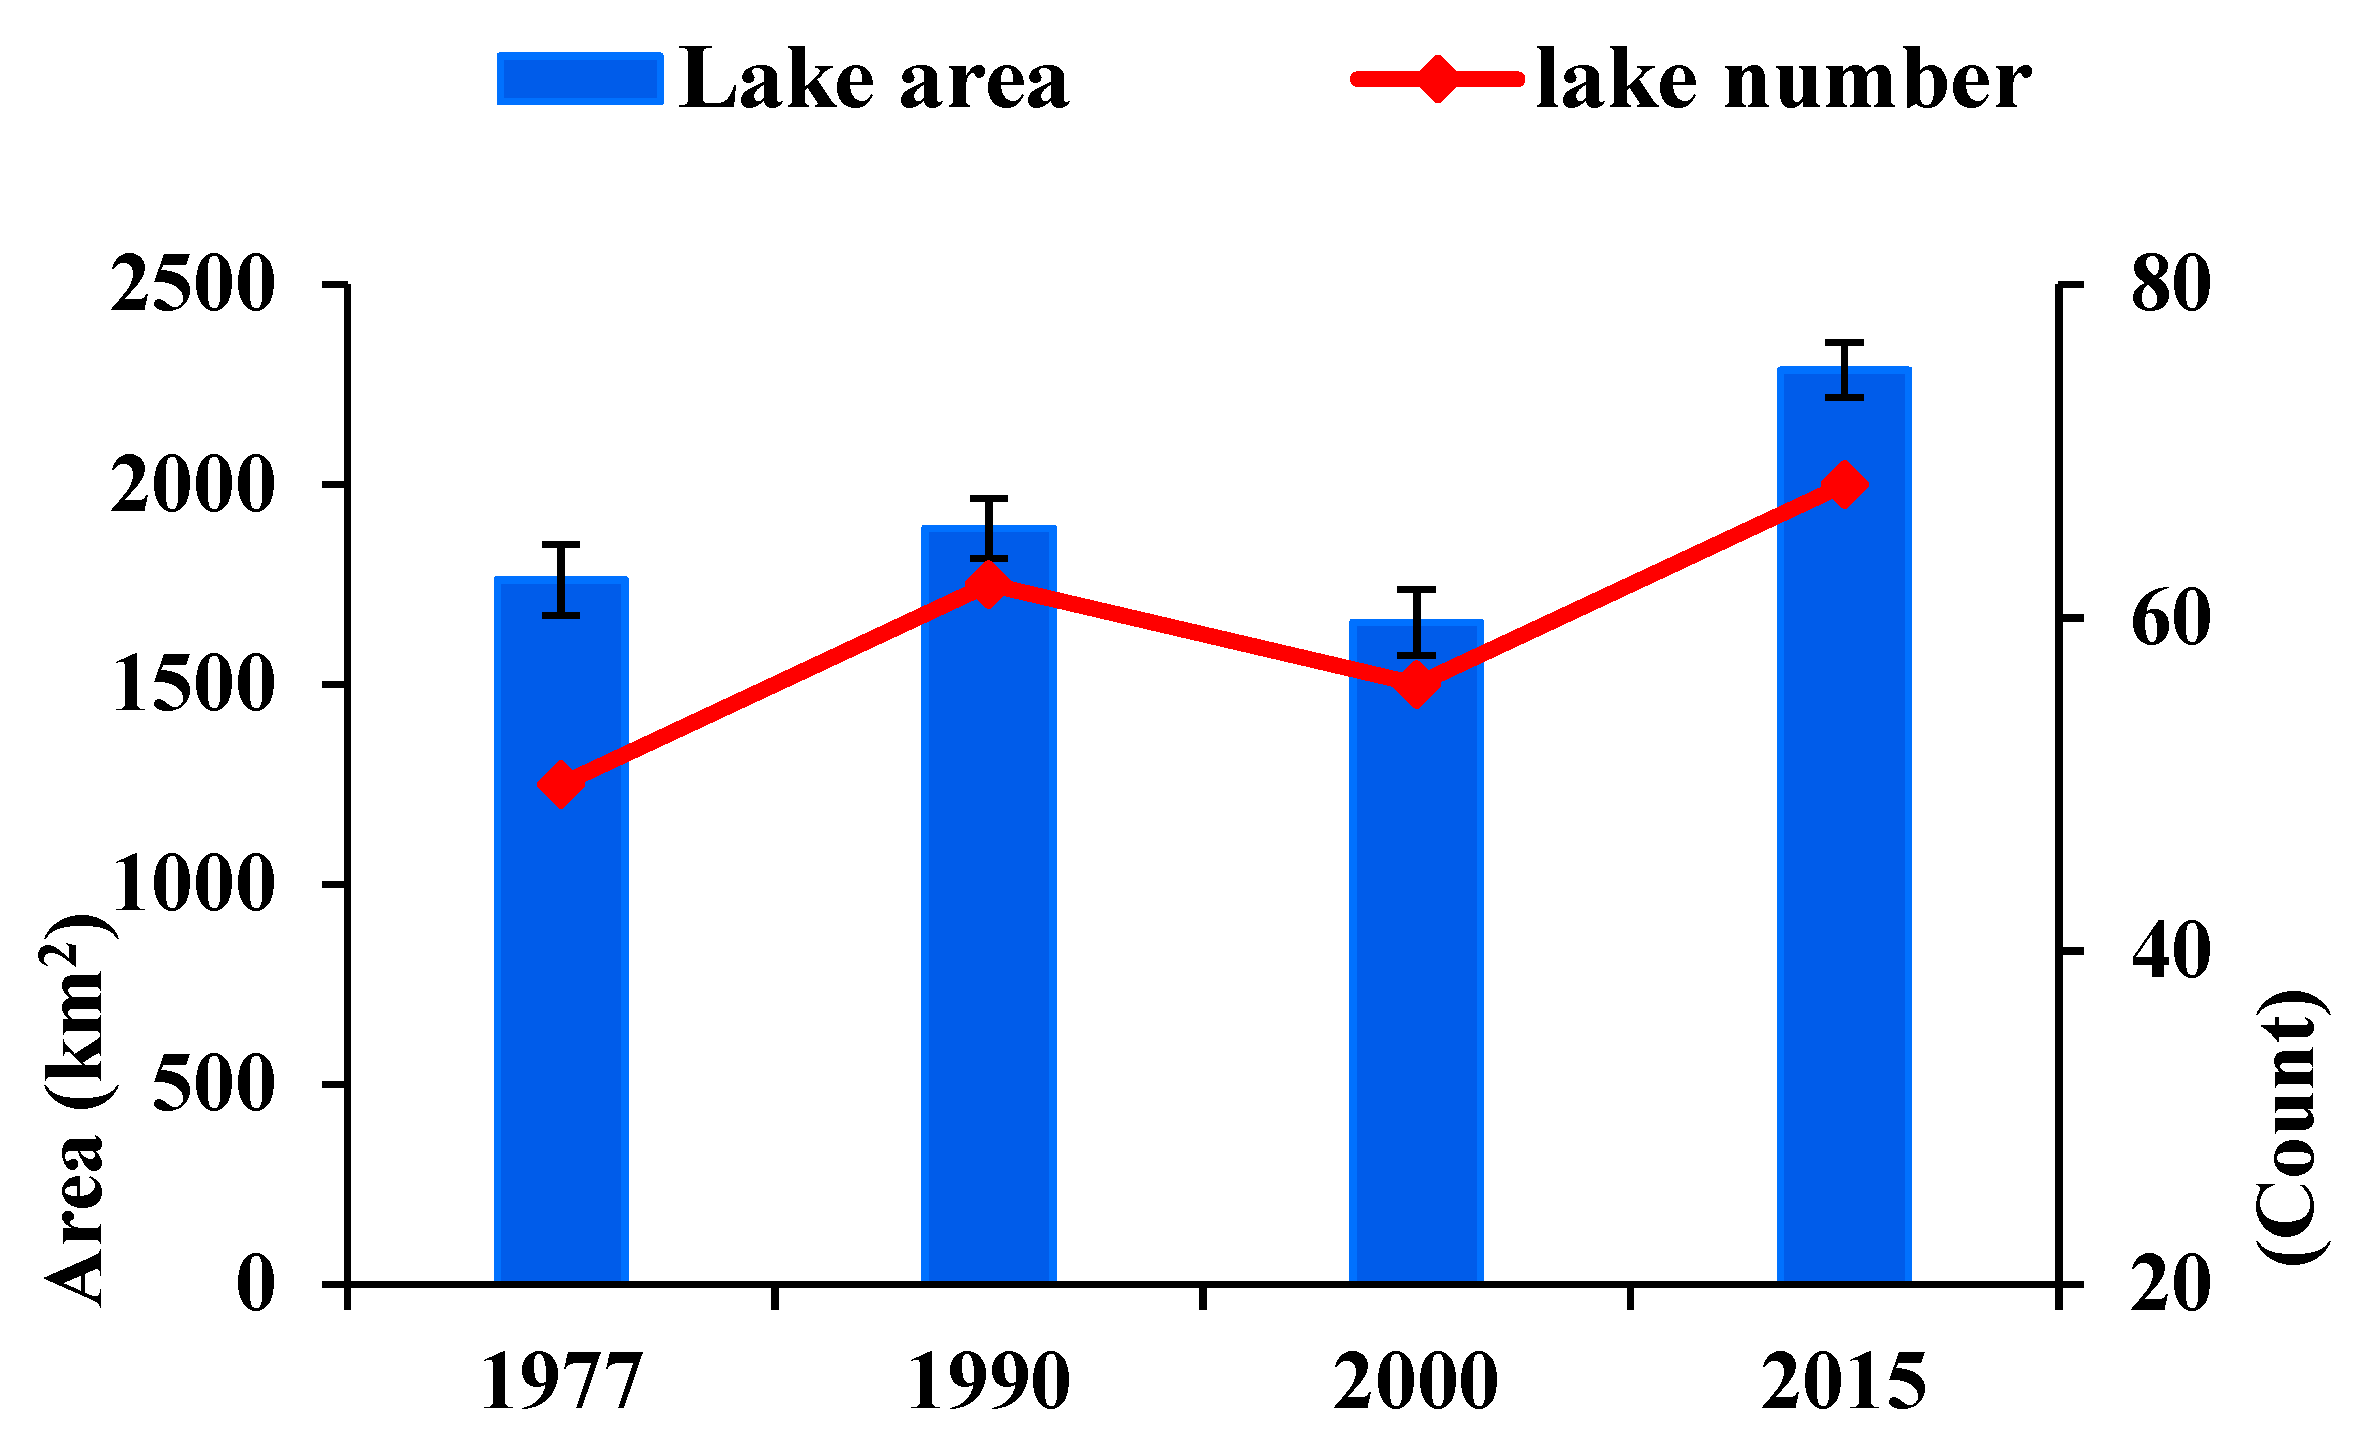
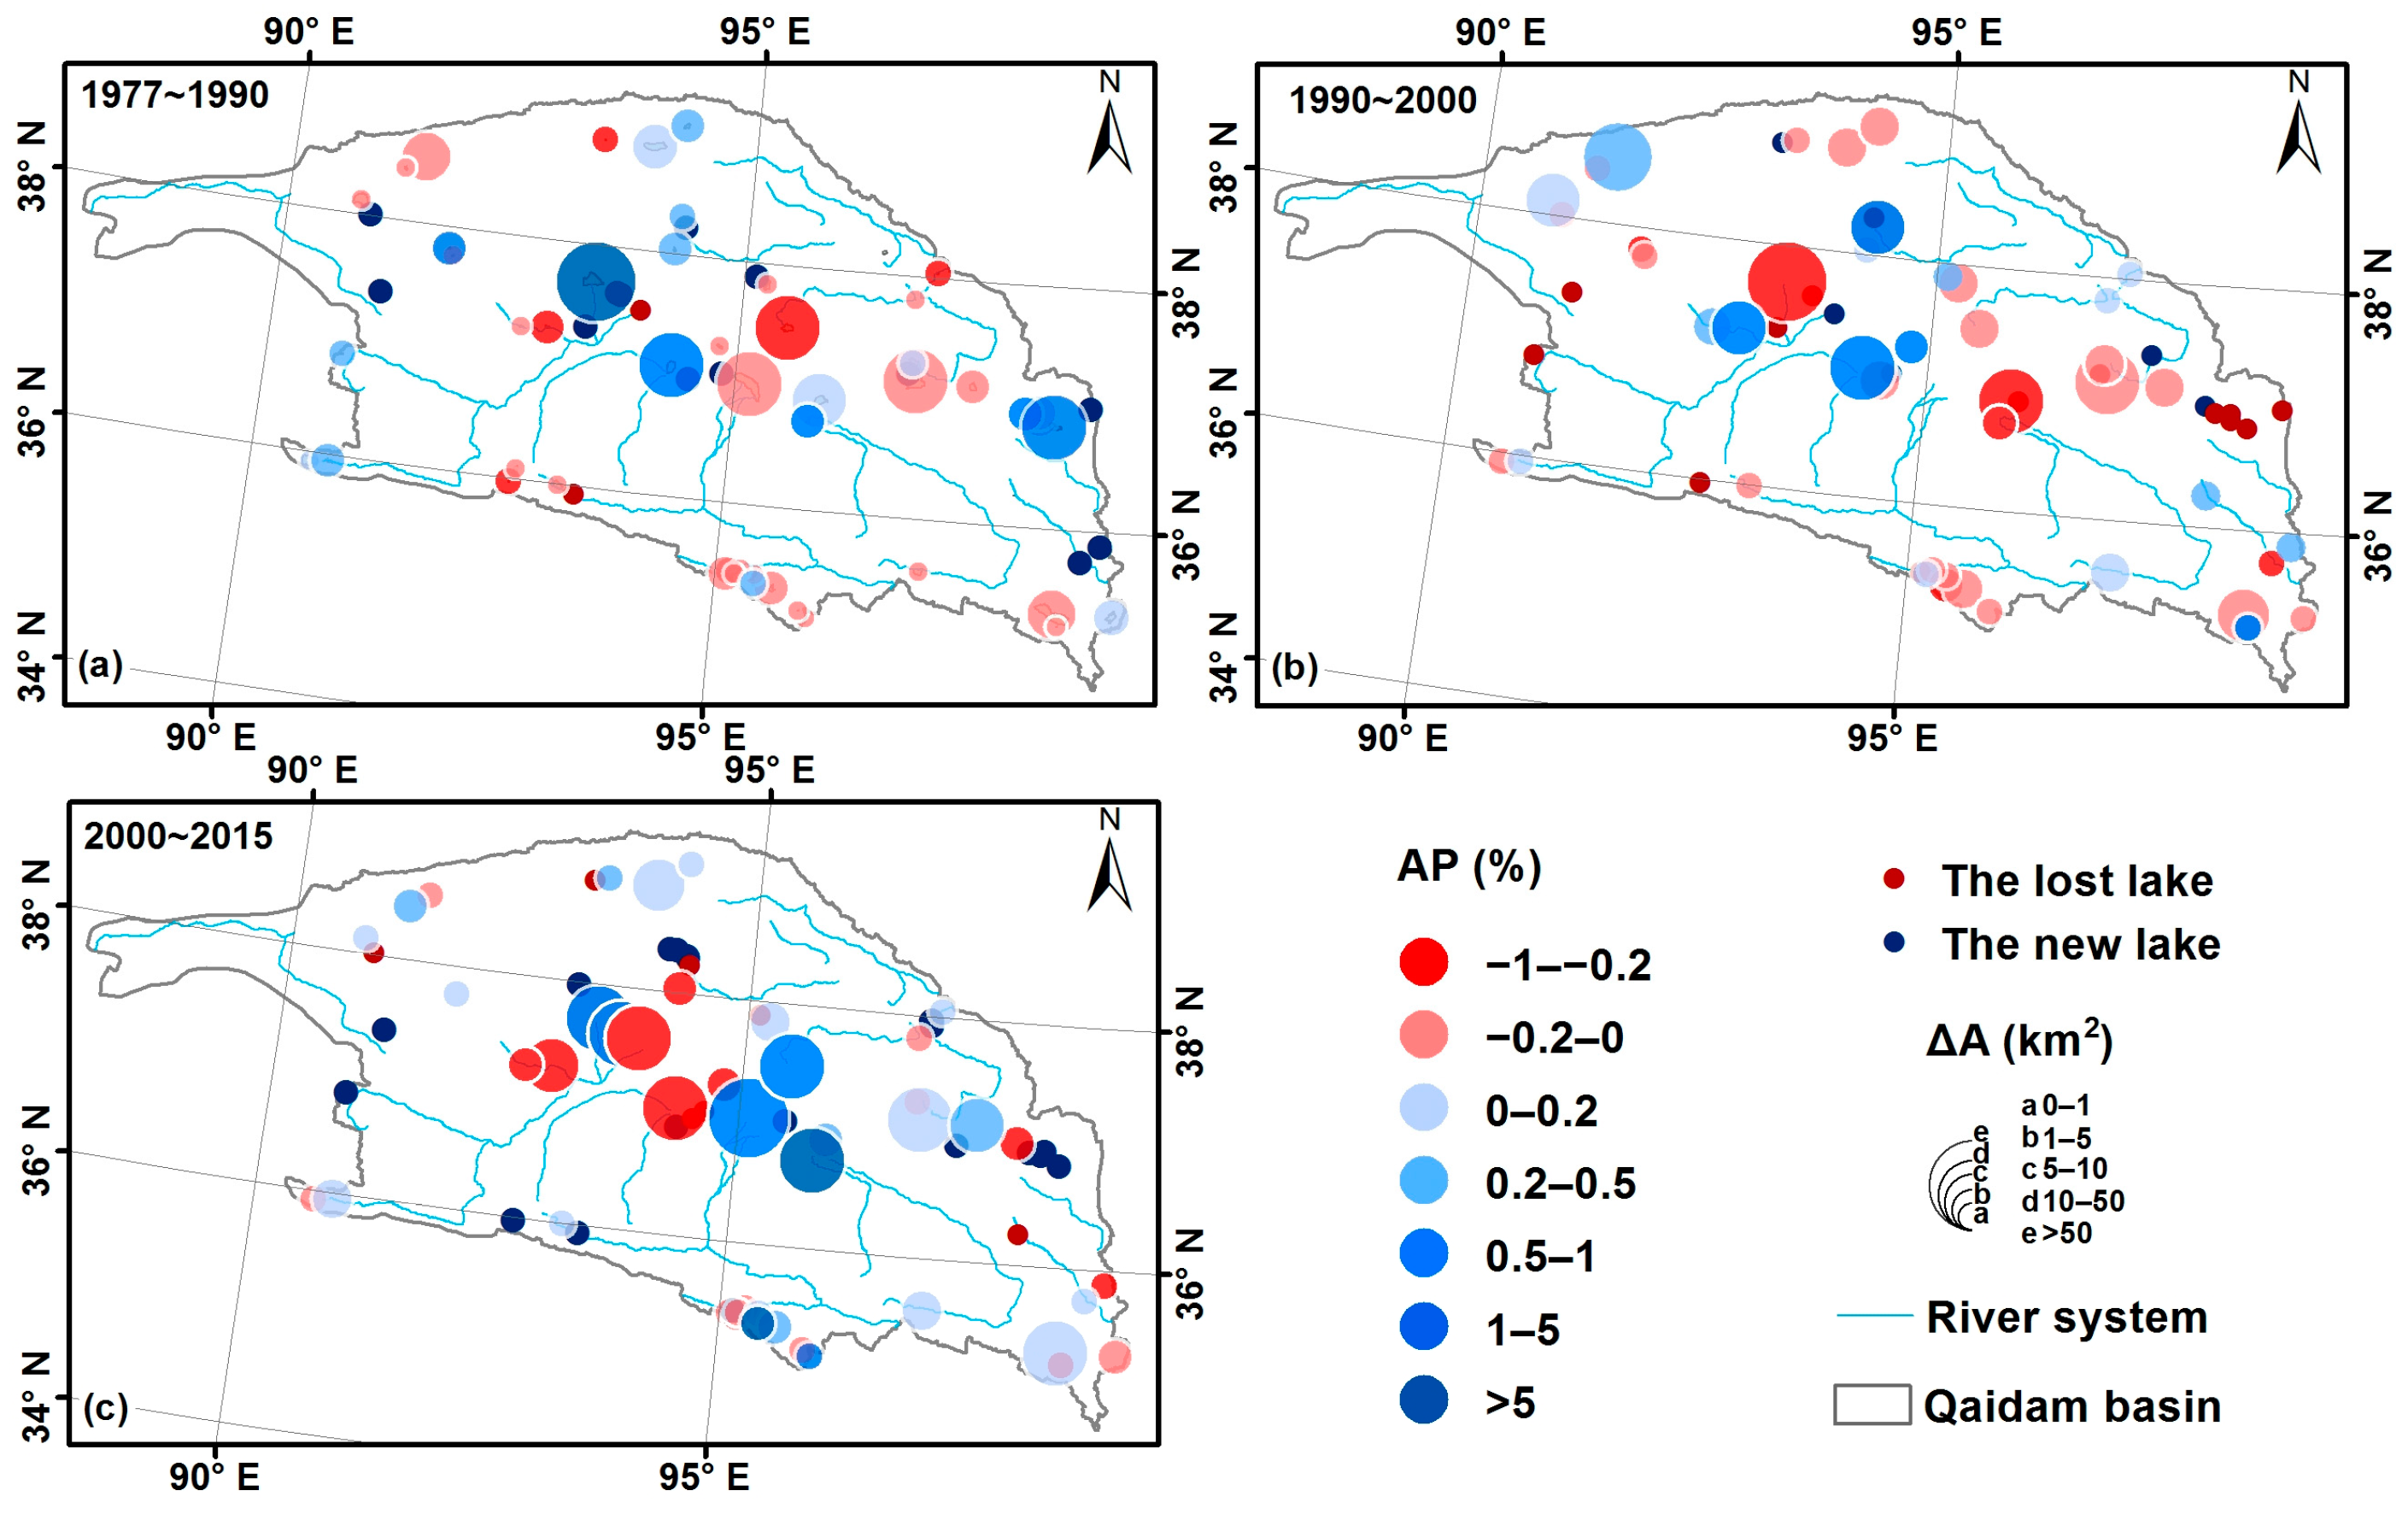
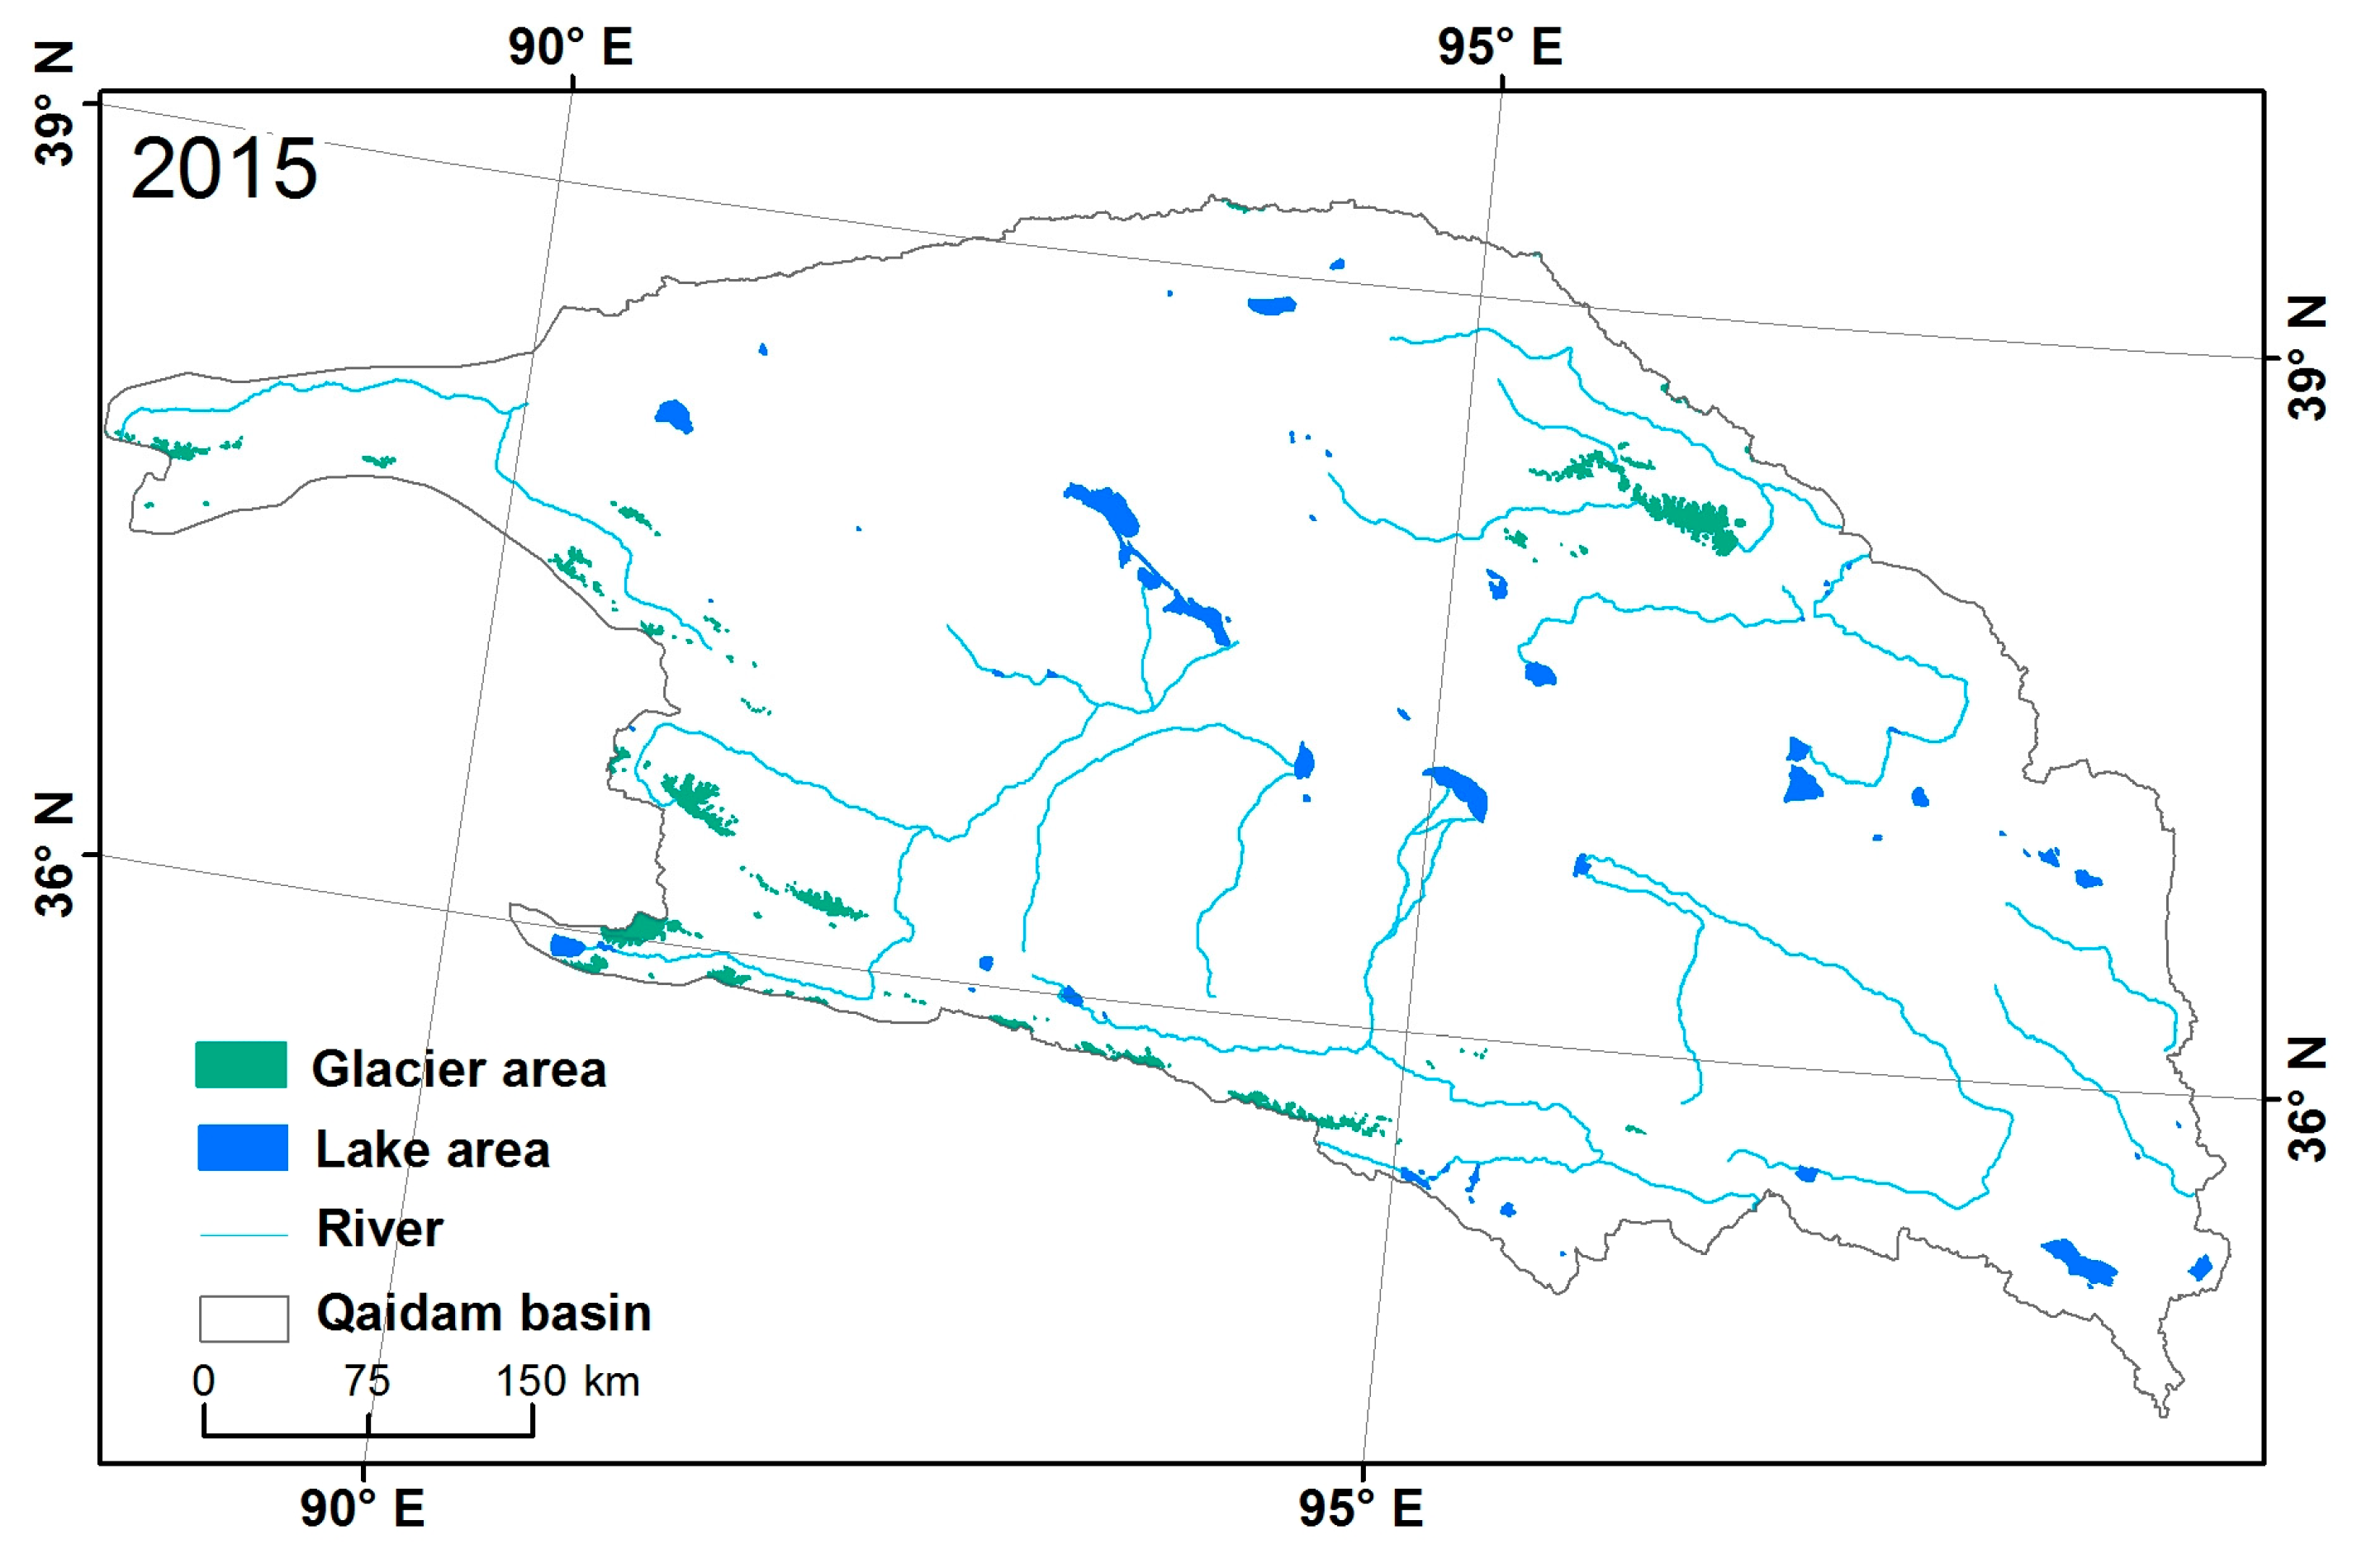
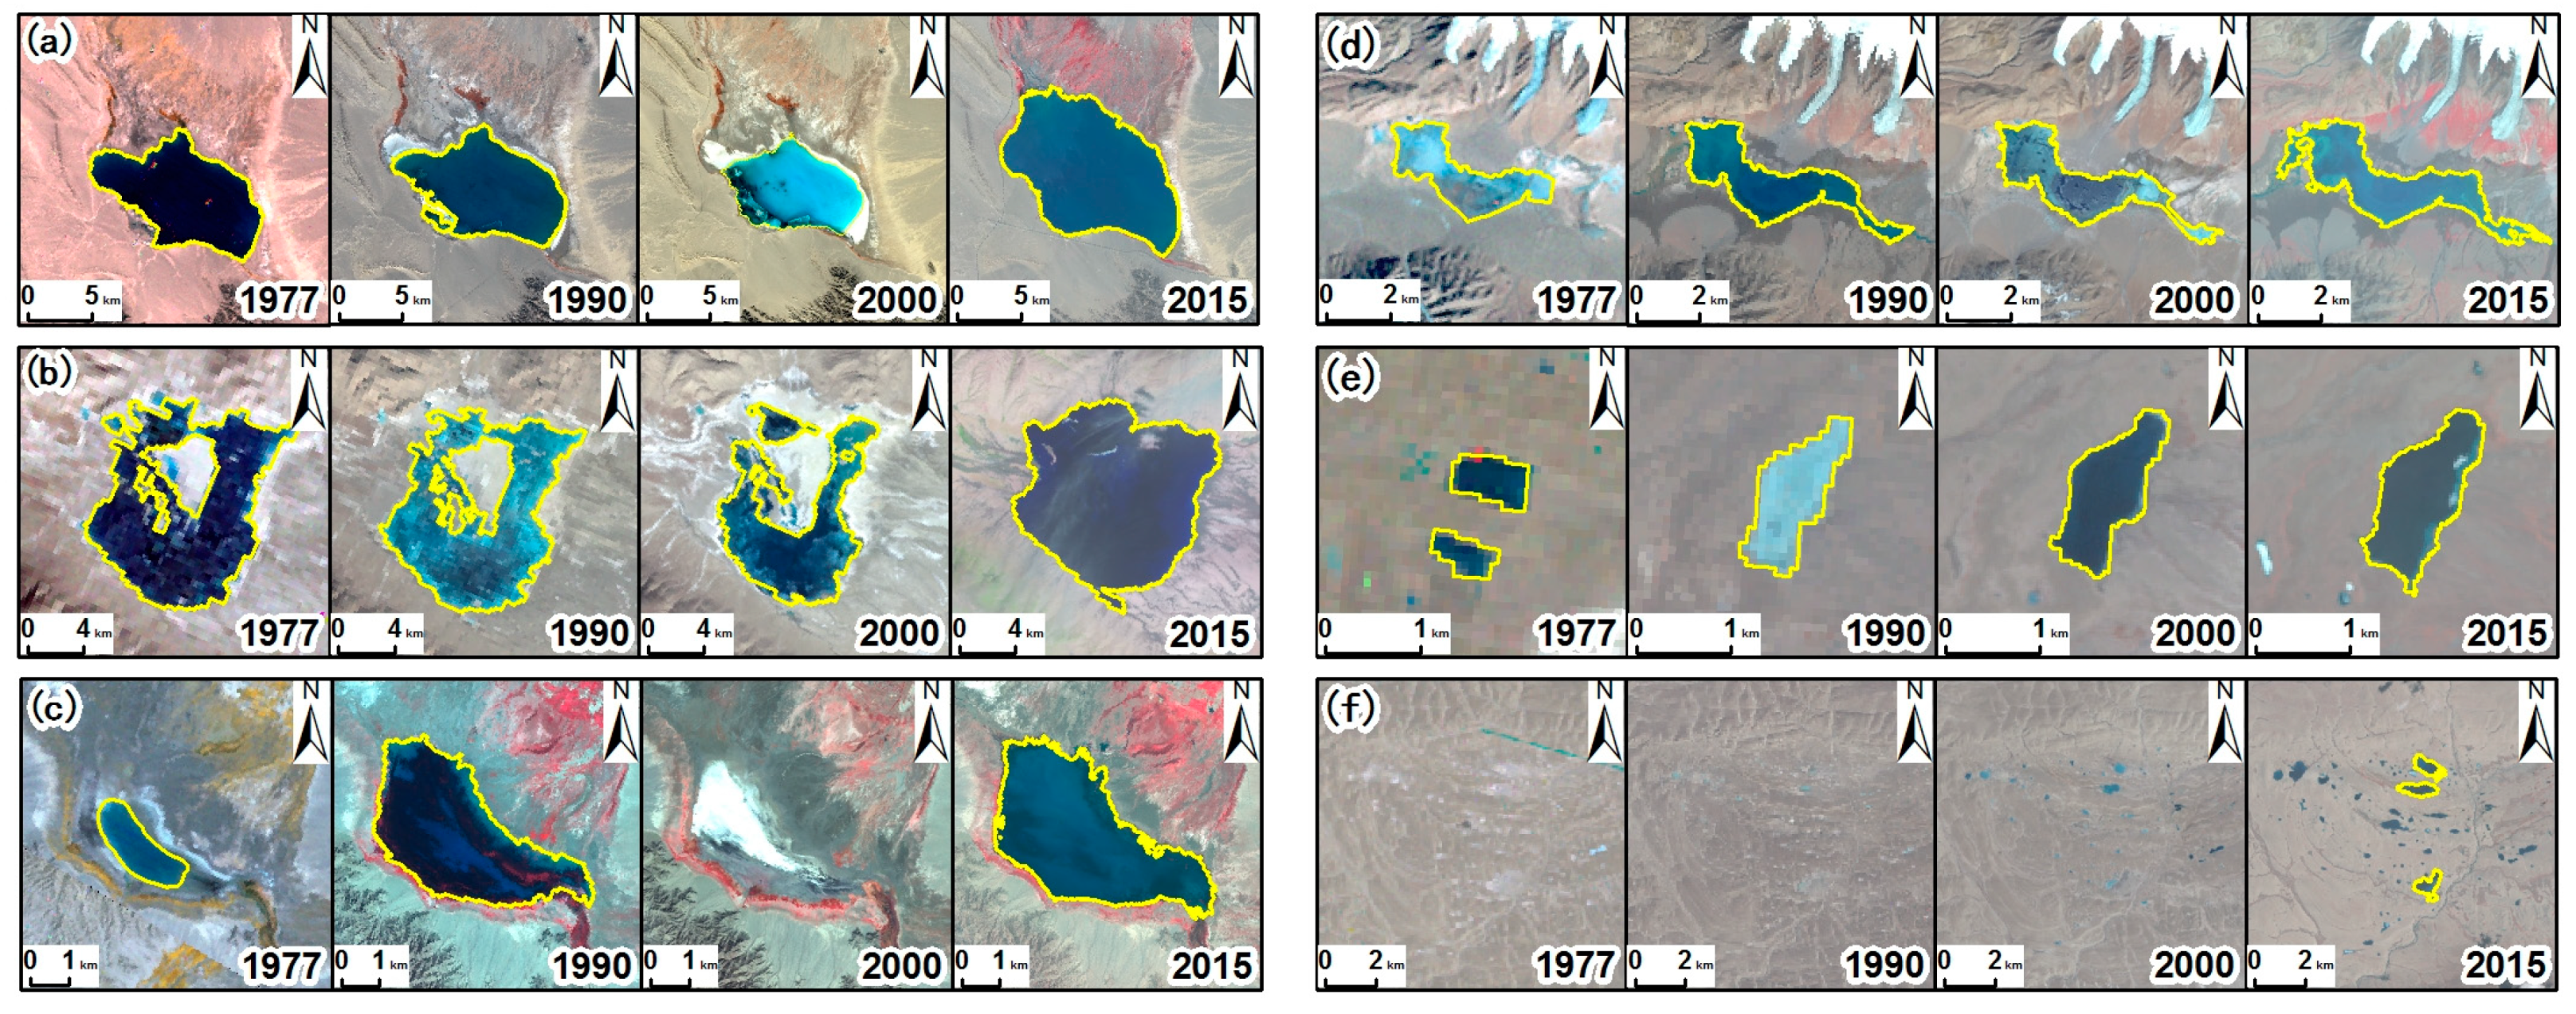
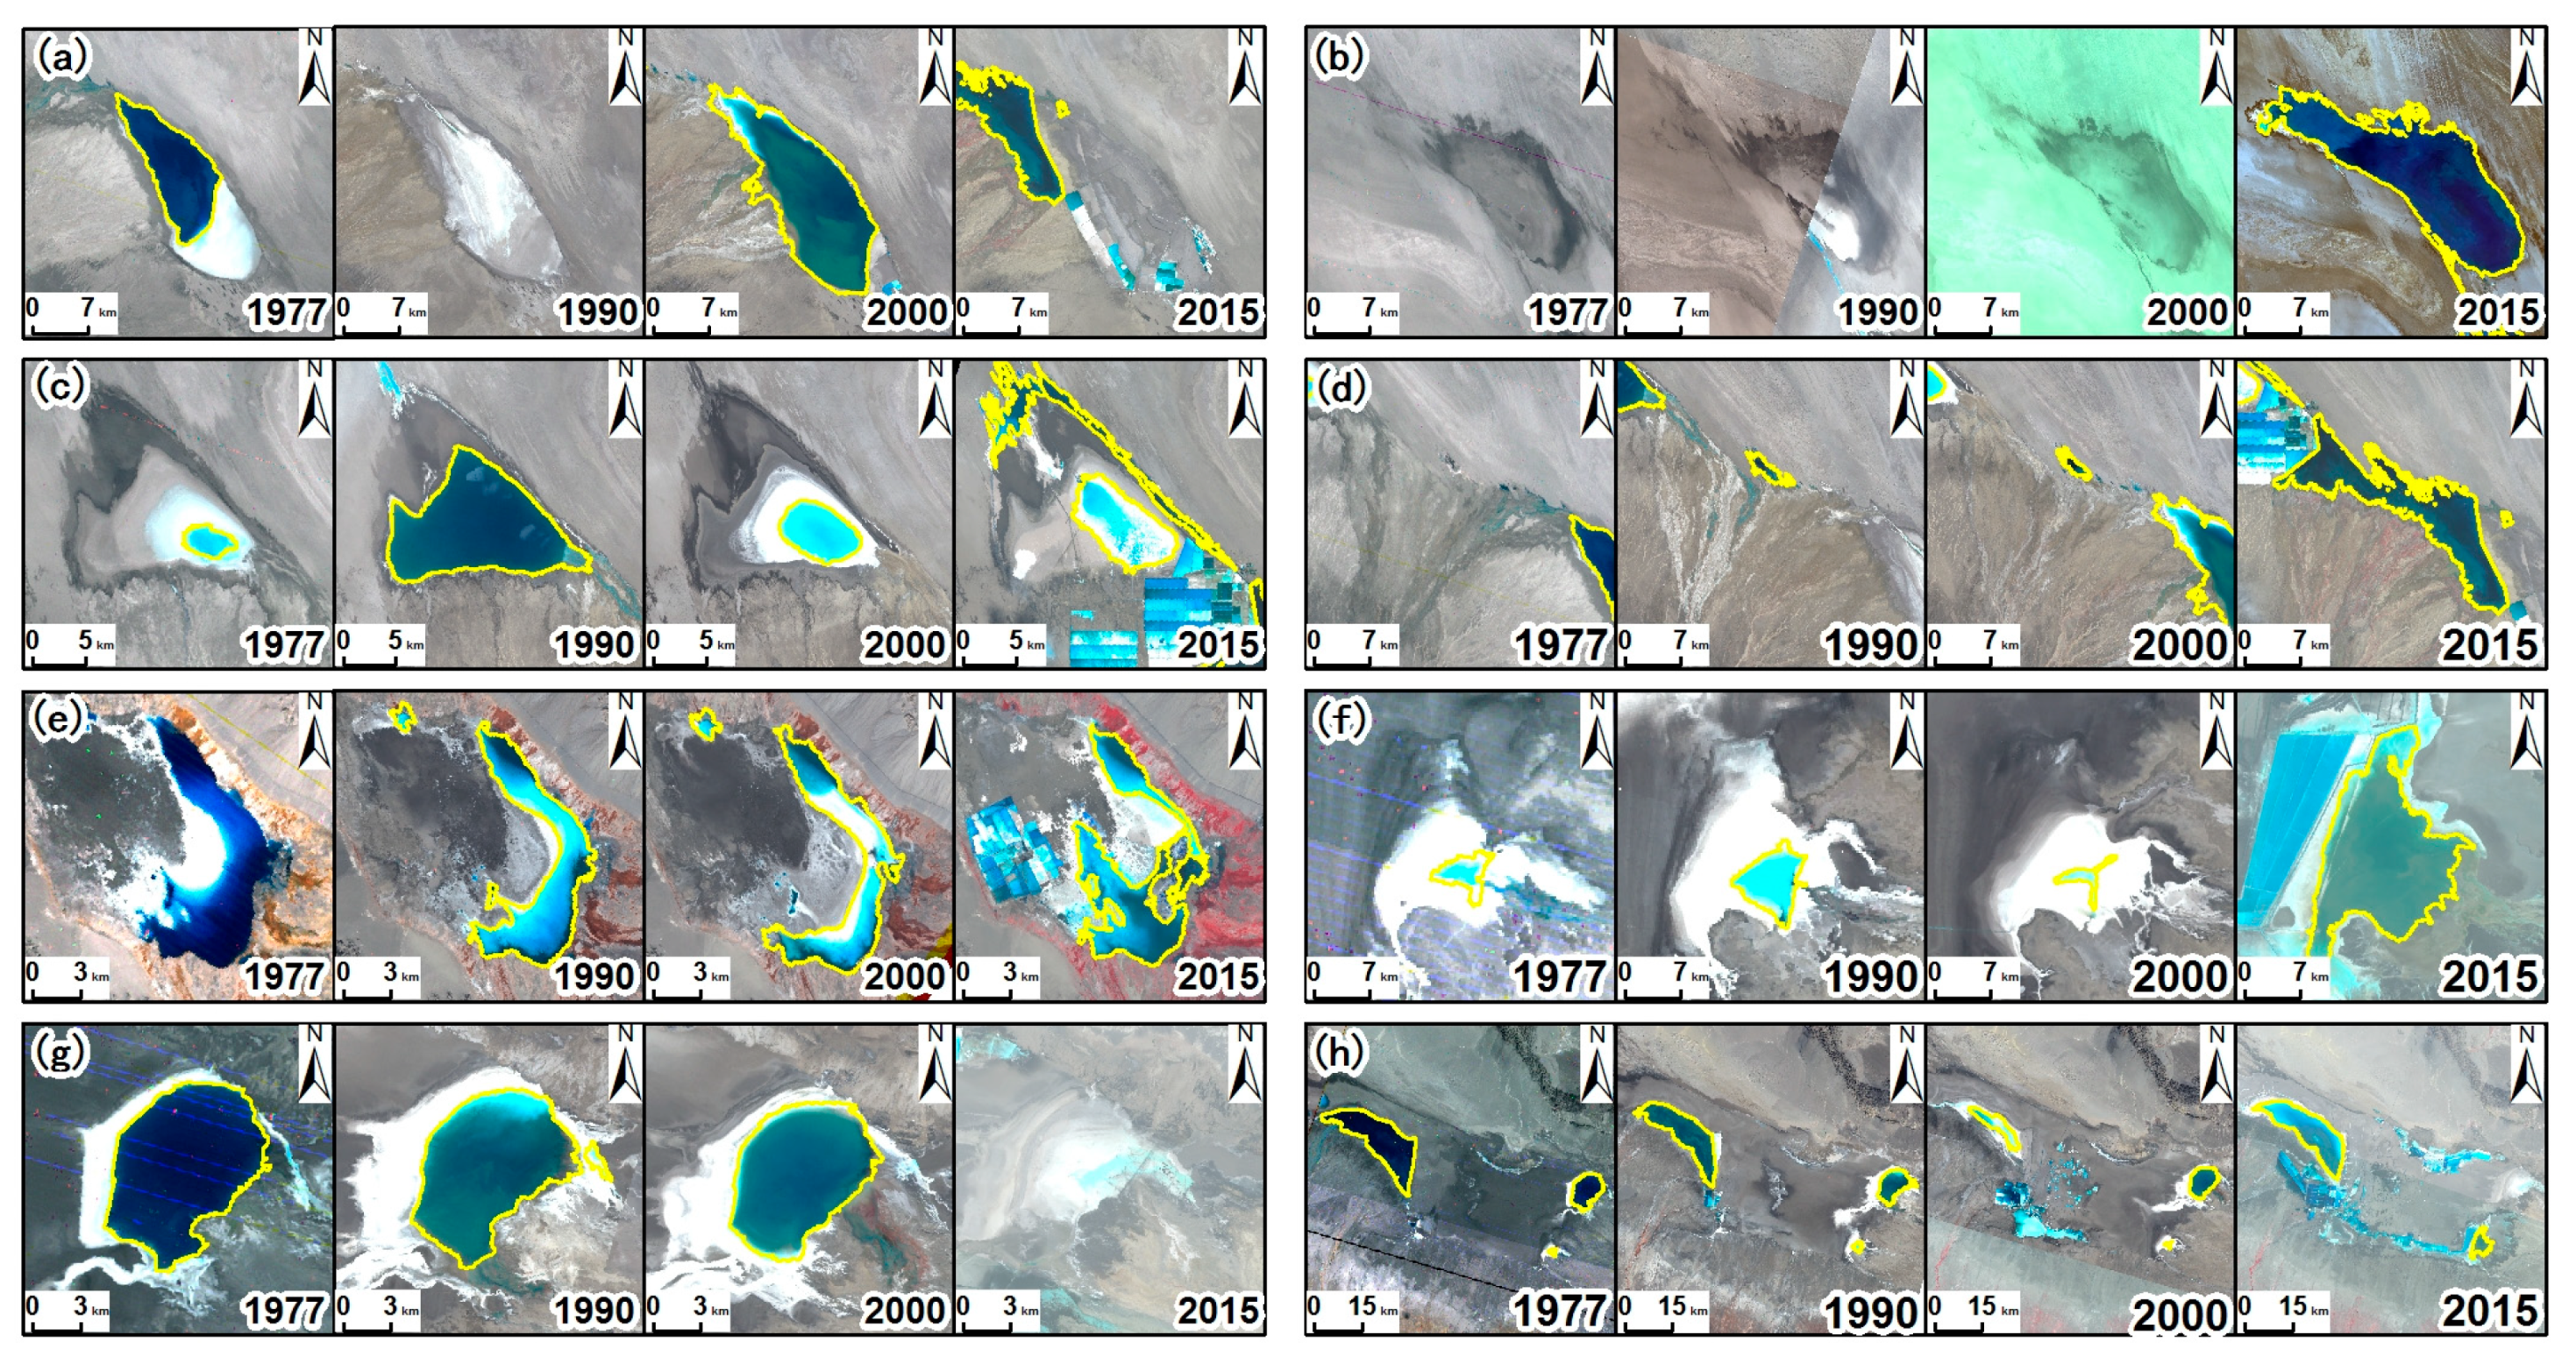
3.2. Distribution of Lakes in 2015 and the 40-year Lake Changes on the Qaidam Basin

Figure 3 demonstrates the lake distributions in 2015 all over the Qaidam Basin. A total of 68 lakes were extracted from satellite images in 2015 with a total area of 2285.9 km2. Most of the big lakes were concentrated in the central region with a lower elevation. A small number of lakes were located along the East Kunlun–Qiman Tagh Mountain to the south–southwest of the study region. From 1977 to 2015, both the number of lakes and the total lake area in the QB were substantially increased (Figure 4). The total number of lakes increased by 18 from the original 50, while their total area increased by 29.8%, from 1761.5 ± 88.1 km2 to 2285.9 ± 91.4 km2. Both the number and area of lakes of the QB increased in the period of 1977–1990, while apparently, they reduced during the period 1990–2000. However, the lakes expanded the most significantly during 2000–2015.
To further analyze the changes, all lakes were graded into five categories based on their area: 0.5–1 km2, 1–10 km2, 10–50 km2, 50–100 km2, and larger than 100 km2. The detailed lake changes in each category are shown in Table 4. Lakes ranging from 1–10 km2 had the most substantial number (18) in 1977, accounting for 33% of the total lake number. However, the total area of these lakes took only 4.0% of the lake surface area in the QB, while the sum area of only 10 lakes (the area larger than 50 km2) accounted for 78.1% of the total lake area. During the period 1977 to 1990, the significant expansion of small and medium-sized (10 km2–50 km2) lakes resulted in an increase of the overall lake area in the QB. All the categories of lakes shrank in the period from 1990 to 2000, especially those lake areas ranging in 50 km2–100 km2. On the contrary, all five categories of lakes expanded in the period of 2000 to 2015. The large size lakes (area >100 km2) had the most intense changes in area, resulting in a sharp increase during this decade.
Spatial heterogeneity of lake area changes was also investigated across the QB. Figure 5 reveals that the lakes in the central region have experienced the largest variations, both in area change and area change rate. From 1977 to 1990 (Figure 5a), a total of 13 new lakes emerged mainly in the high elevation glacier area located in the western and eastern study regions, whilst two lakes vanished. Most of the expanded lakes were distributed in the northern and central parts of the QB. However, the shrunken lakes were mainly distributed in the central and southern QB. From 1990 to 2000 (Figure 5b), among the lakes that dramatically shrank, about 15 lakes in the central or eastern QB disappeared with an area of 78.41 km2. The characteristic of lake shrinkage was quite significant in the study area during the second period (Figure 5b). Figure 5c shows that, after the year 2000, the majority of existed lakes more or less expanded, and 20 small lakes newly emerged in the marginal area with higher elevation. It is noteworthy that the lake areas grew the most significantly in the period 2000 to 2015 compared to the other periods. The dramatic expansion and shrinkage of lakes occurred simultaneously in the central region of the QB.

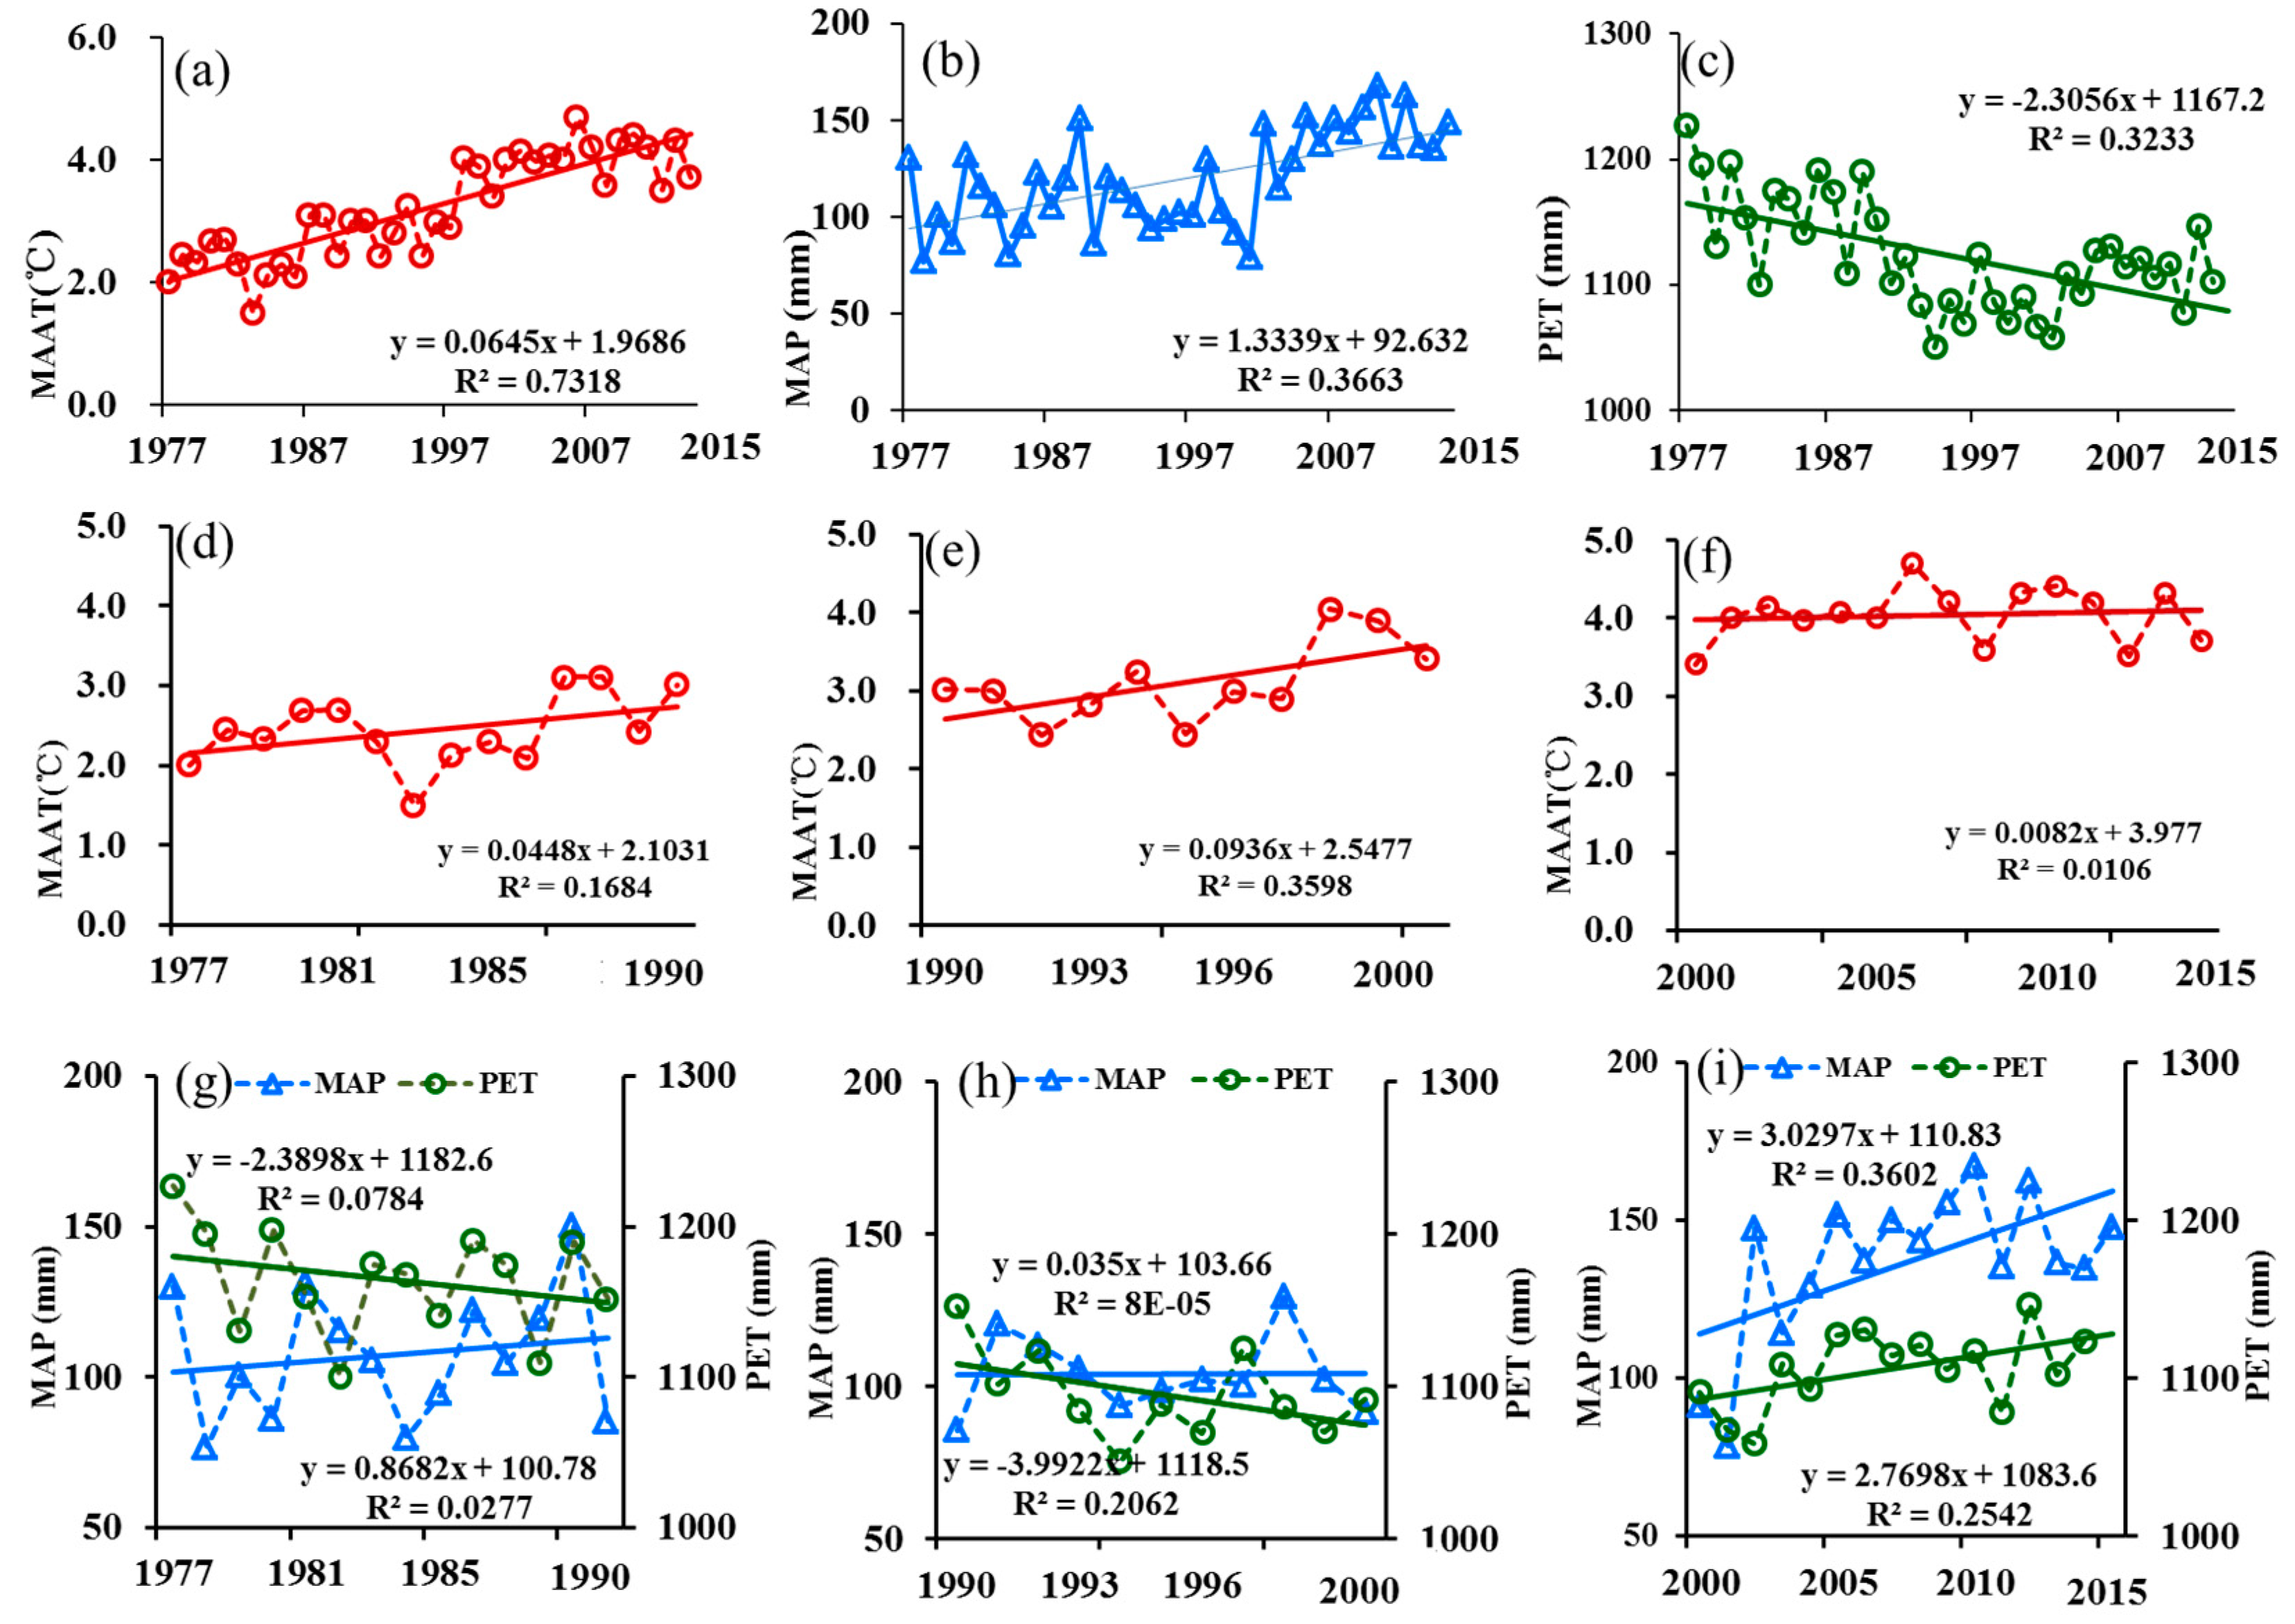
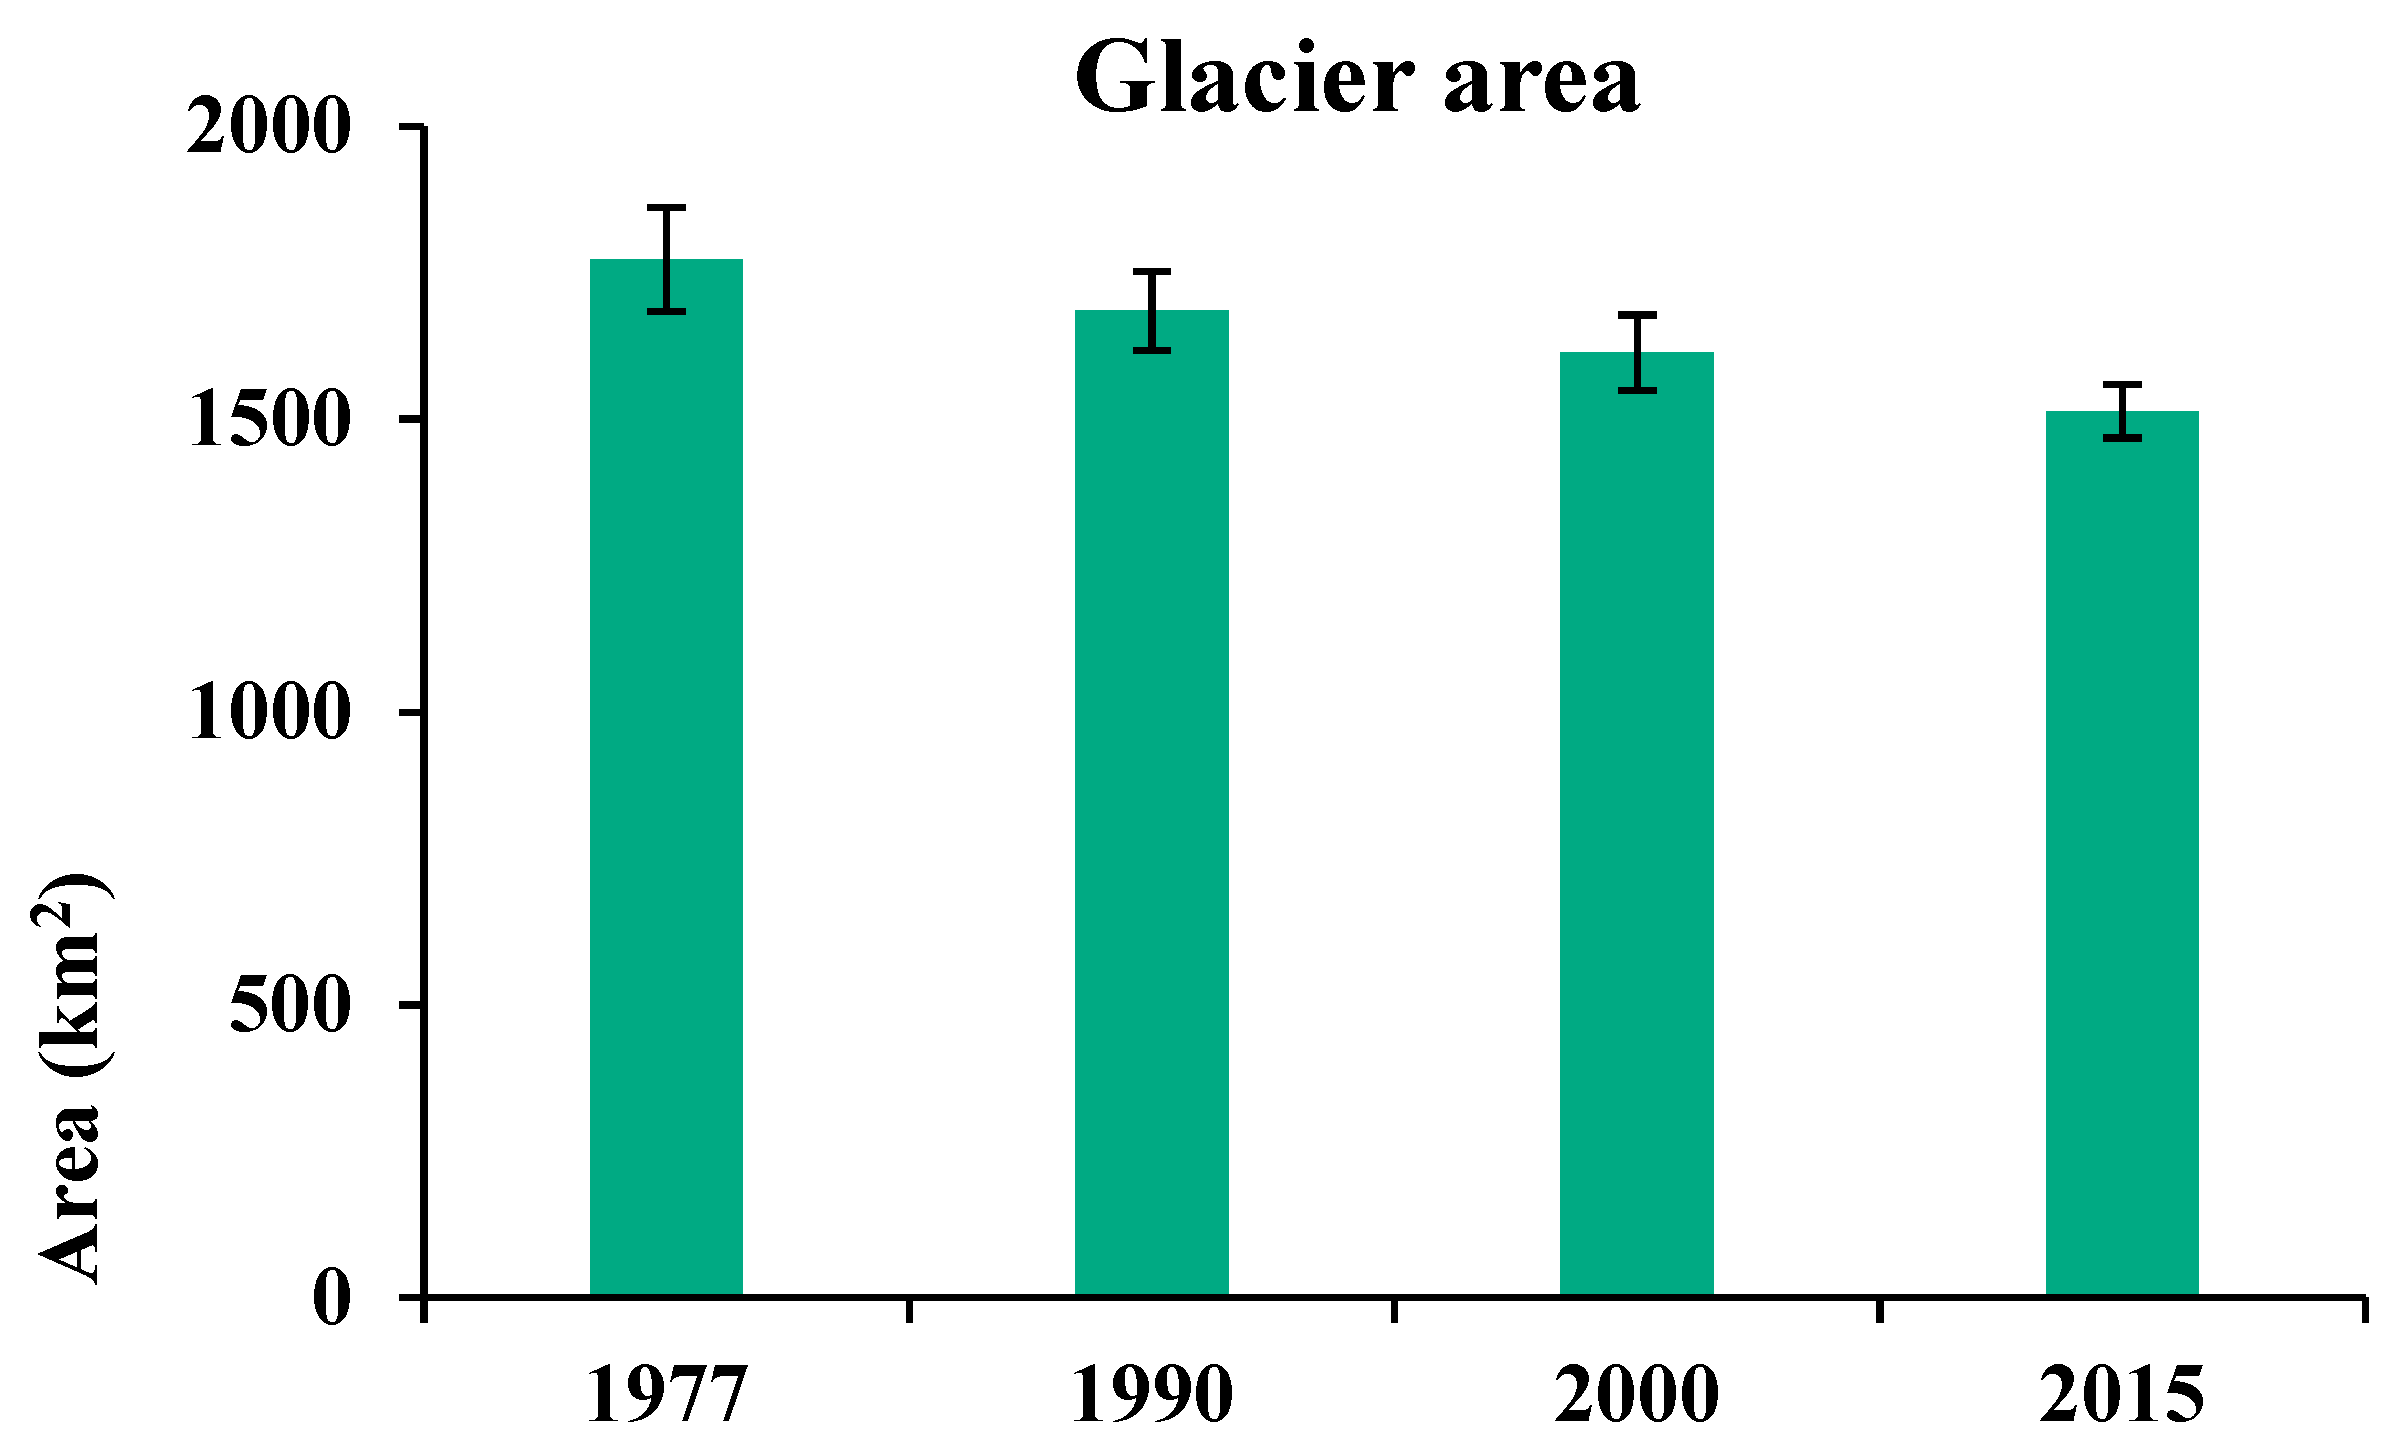
3.3. Climate Changes and Glaciers in the QB

From 1977 to 2015, a noticeable increase in MAAT and MAP and a decline in PET demonstrated a progressively warmer and wetter climate throughout the QB (Figure 6). Over the past decades, the MAAT in the QB has been increasing, with an average rate of 0.65 °C per decade (Figure 6a). The average MAP of the QB was 116.19 mm, and the annual precipitation tendency rate was 10.03 mm per decade (Figure 6b). The mean annual potential evapotranspiration decreased in fluctuation with an average rate of 23.06 mm/10 yr (Figure 6c).
During 1977 to 1990, the MAAT exhibited increases of between 0.02 and 0.12 °C/yr. across the QB, with an average rate of 0.04 °C/yr (Figure 6d). An evident decline in PET and a visible increase in MAP resulted in a warmer and wetter climate in the QB during this period (Figure 6g). From 1990 to 2000, the MAAT increased considerably, with an average rate of 0.094 °C/yr, much higher than that of the first period (Figure 6e). However, the MAP declined slightly at an average rate of 1.18 mm/yr in the meantime (Figure 6h). These changes indicated that the study region experienced a relatively more arid and hotter climate during this decade. In the later 2000–2015 period, the increase rate of MAAT was less than that in the previous two periods (Figure 6f). MAP increased remarkably during this time and was far higher than that of the second period (Figure 6i). It is noteworthy that PET rose slightly between 2000 and 2015 instead of the continuous decline in the other two periods.
Glaciers of the QB are mainly located in the high alpine region along the southwestern and northeastern borders of the basin (Figure 7). The glaciers are sensitive to climate change and have experienced extremely intense glacial retreat. Over nearly 40 years, the area of glaciers decreased from 1772.2 ± 88.6 km2 in 1977 to 1684.6 ± 67.4 km2 in 1990, 1613.0 ± 64.52 km2 in 2000, and further to 1513.04 ± 45.4 km2 in 2015 (Figure 8). The mean rate of glacier melt during the several decades was 4.6 ± 0.2 km2/yr. The results indicated that glaciers in the study area have been facing a constant loss issue under the threat of global warming.

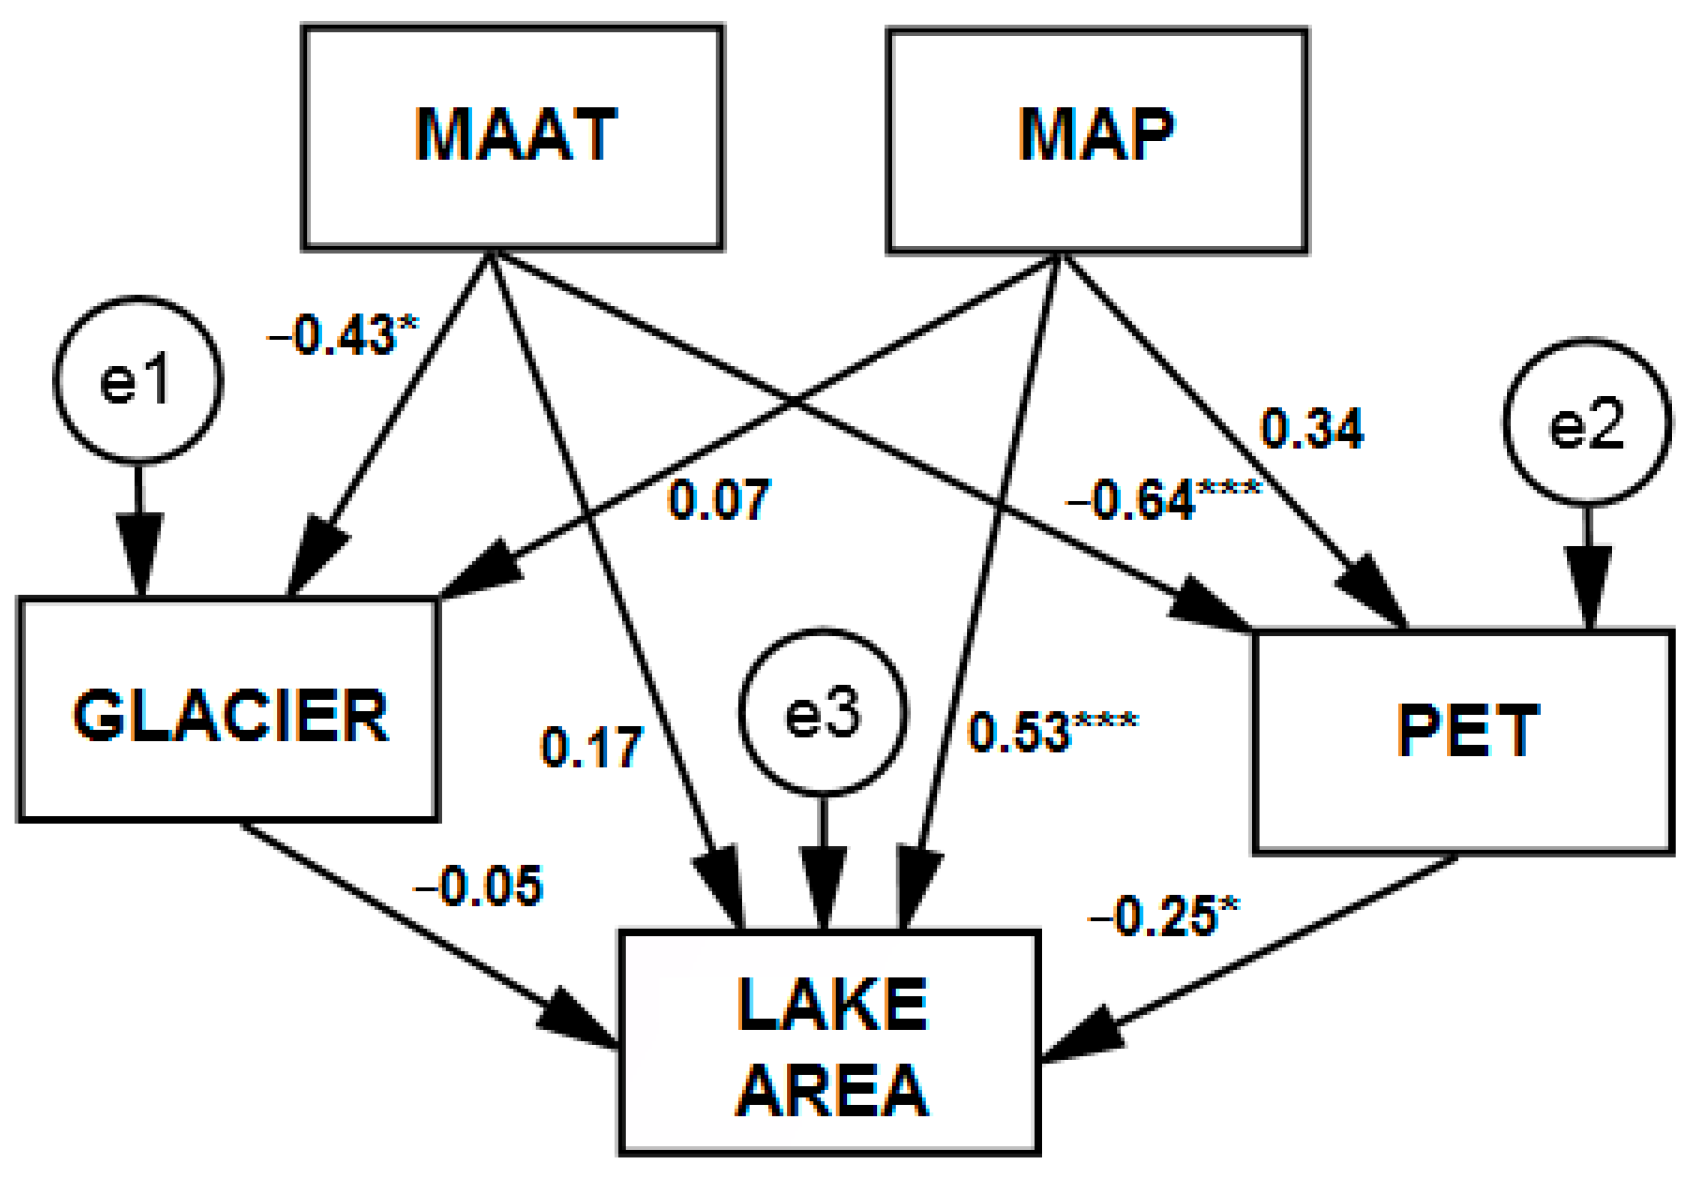
3.4. Environmental impacts on Lake Area Changes

The selected indices to evaluate for overall fitness of the SEM are shown in Table 5. In the case of 1977 to 2000, χ2/df = 1.53 (smaller than three as suggested), GFI = 0.989, NFI = 0.951, CFI = 0.962 (greater than 0.90 as recommended), and RMSEA = 0.071 (less than 0.08 as suggested) showed a satisfactory fit between the structural model and the data. In the long period from 1977 to 2015, however, the SEM did not statically fit the input data. It is suggested that climate variables were the main contributors to the lake variations during 1977 to 2000, but not after 2000. Other impacts beyond the climate influence thus need to be examined.
The estimated correlation among all independent and dependent variables during the period 1977 to 2000 is shown in Figure 9. Lake area change showed positive correlations with MAP and MAAT change, while negative ones showed positive correlations with PET and glacier change. Not all relationships were statistically significant. The MAP change exhibited the most significant influence (p < 0.01) on lake area change, with a correlation coefficient of 0.53. In addition, consistent with the precipitation change trend, most lakes without human intervention in the QB experienced a change process of expansion–shrinkage–expansion in the past 40 years (Figure 10a–c). In contrast to the strong impact of MAP change on lake variations, PET (p < 0.1) played a relatively weaker role in influencing the changes of lake area in the QB. Given the limited number of lakes spatially associated with glaciers, lake area change was not significantly correlative with glacier area changes (p > 0.1). Though MAAT barely had a direct relationship with lake area change (p>0.1), it had negative correlations with PET change (p < 0.1) and glacier area (p < 0.1), then further affected lake area variations indirectly.
Although the contribution of glacial melt water to lake area change was not obvious at the basin level, a small number of lakes linked to glaciers still expanded constantly due to glacier melt water supply. The glacier lake (shown in Figure 10d), located in the south of the Bukadaban Glacier, expanded from 6.74 km2 in 1977 to 9.97 km2 in 2015 with an increase of 47.9%. The glacier lakes supplied by Dunde Glacier melt water also had a remarkable expansion in the past decades (Figure 10e). A group of emerged lakes could be recognized in the most recent images, some of which were larger than 0.5 km2 and expected to continually expand (Figure 10f). Therefore, climate factors such as precipitation, temperature, evapotranspiration change, as well as glacier melting were considered as the potential drivers for lake area changes over the past decades in the QB, especially from 1977 to 2000.

3.5. Human Impacts on Lake Area Changes

China reserves the second highest lithium resources in the world, 80% of which is salt lake brine and is mainly located in the Tibetan Plateau [52]. After 2000, salts from the salt lakes in the QB began to be dramatically mined and industrialized. The salt lakes have been extensively exploited during the past decade, resulting in immediate and severe change to lake areas, lake function, and landscape [53]. Along with the synergistic effect of climate change and human interventions, lakes in the QB have been significantly changed in the period from 2000 to 2015 (as shown in Figure 4).
More specifically, Figure 11 demonstrates the expansion of lakes exposed to extensive exploitation of lithium resources. Previous studies have demonstrated that salt lake exploitations may lead to significant expansions of salt lakes, especially for the large salt lakes [54,55]. Building dams shifted the water from one place to another, turning a small lake into a dry salt lake while a larger lake newly formed. The Riegler River is the largest river in the QB, which flowed into the East Taijinar Lake and West Taijinar Lake in the last century. Since 2003, three enterprises engaging in salt lake exploitation have settled in and built two dams to stop the river flowing into the two lakes. The upstream has been forced to redistribute into the Ya Lake, Ku Shui Lake, and farther downstream to the Yi Ping Li Lake [55]. East Taijinar Lake and West Taijinar Lake (Figure 11a) were changed into dry salt lakes, while Yi Ping Lake (Figure 11b) became the largest lake (290.2 km2) in the QB in 2015. The Ya Lake (Figure 11d) and Ku Shui Lake (Figure 11c) expanded by 156.86 km2 and 38.58 km2, respectively, from 2000 to 2015. A similar process occurred at Qarhan Lake (Figure 11h), which is the largest salt lake area in China (covering 5800 km2) [52]. The lake is a playa with water only occasionally, which contains nine smaller but more permanent shallow salt lakes, including Dabsun Lake, South Hodgson Lake, and North Hodgson Lake [53]. From 2000 to 2015, Dabsun Lake (Figure 11h) and South Hodgson Lake (Figure 11f) expanded by 188.85 km2 and 30.37 km2, respectively, while North Hodgson Lake (Figure 11g) was turned into a dry lake due to the influence of dams constructed by state owned enterprises such as the Qinghai Salt Lake Industry Group Company Limited [55]. Sometimes, dams also led to lake expansion by preventing lake water discharge. Extensive salt lake exploitations have spawned a host of complex resource use conflicts and environmental issues in the salt lake regions. Due to the vulnerabilities of the lake environment in the QB as well as human intervention, the environmental processes of the lakes have been greatly influenced.

4. Discussion

4.1. Uncertainties

Our analysis focused on areal changes of high-altitude inland lakes in the Qaidam Basin over 40 years. It is very important to keep spatial coherence of classification maps interpreted from multi-temporal images. However, unbiased maps of lakes and glaciers are not available due to the uncertainties from the sensors. Different data sources are the primary factor causing inconsistent results, especially between the coarse resolution images and the medium–high satellite images. For example, the value and range ability in the lake area of QB based on MODIS data sets [56] were different from that in this study (Table 4) and other studies [55]. It seems that the lake extents derived from coarse resolution images showed stronger inter-annual variability due to the misclassification of mixed pixels [23]. The most significant limitation comes from the different spatial resolutions of remotely sensed data acquired in different stages, which leads to the spatial inconsistency of initial classification results. The patches derived from MSS images contained many mixed pixels, resulting in a lower mapping accuracies and a higher uncertainty of the lake and glacier extent in 1977 (Table 3). With the limited resolution of MSS images in 1977, the smallest unit of objects identified from the image segmentation was determined as 0.036 km2, indicating that the lakes smaller than 0.036 km2 failed to be captured in 1977. However, we focused on the lakes larger than 0.05 km2, meaning that the coarser spatial resolution has no substantial influence on the statistical analysis of lake number.
Landsat images are constantly improving due to new generations of satellites being launched with enhanced sensors [34]. The improvements are mainly manifested in the richness of spectral, spatial and radiometric resolution [57]. Plenty of studies have reported result comparisons of different Landsat images in land cover classification [58]. Landsat TM images were proved to be superior to Landsat MSS images and Landsat ETM+ images were superior to Landsat TM. Recent studies indicated Landsat OLI performed better than all the previous version of Landsat images. The findings in these studies were quite consistent with our results (Table 3). In addition, minor differences in wavelength exist between the same bands from different Landsat sensors, which might result in inconsistent threshold values of NDWI in different time periods and might further impact on the lake extraction results in this study.
In this study, a more accurate approach, the object-based information analysis (OBIA), was used to perform lake and glacier extractions, resulting in satisfactory overall accuracies of lake mapping over 90%. However, classification errors still existed, since the semi-automatic method NDWI demanded to empirically set a threshold to segment water body and lake shore, which could induce more or less mis-estimation. In addition, topographical shadows, snow cover, and clouds in high-altitude regions also had influences on glacier mapping accuracy. The extracted water surfaces and glaciers were visually interpreted to manually modify the misclassified objects, and the accuracy greatly depended on personal experience.

4.2. Comparison between This Study and Previous Studies on the TP

Previous studies indicated that lake changes across the whole plateau were characterized by strong spatiotemporal heterogeneity [59]. Considerable meteorological analysis concluded that water vapor exchange between the TP and the Asian monsoon area might have been weakened by the declines in wind speed on the TP over the past decades, resulting in less precipitation in the monsoon-influenced southern and eastern TP [60]. By contrast, more convective precipitation generated by the warmer and moister conditions, the decreased evaporation due to solar dimming, and enhanced glacier melting have contributed to the expansion of lakes in the central TP [2,10]. The QB located at the northern margin of the TP is mainly influenced by the westerly flow. Some studies indicated that the westerly has transported more water vapor to northwest China since 1980, resulting in precipitation increase [61], which in turn led to the dramatic growing in lake area during the period 1977–1990, while the decreased precipitation is a key factor that should be responsible for lake shrinkage in the QB in 1990–2000 (Figure 6, Table 4). Results in this study indicated that precipitation change had a significant positive influence on lake area change, and only several lakes linked to glaciers expanded constantly due to glacier melt water supply. It can be concluded that the amount of precipitation plays a dominant role in lake changes in the basins without a large fraction of glaciers. Moreover, this study revealed that, different from other alpine areas in the plateau, the QB has been extensively exploited for salt lake resources since 2000, resulting in severe areal changes of lakes (Figure 11).
We further compared our results with other publicly released data sets, i.e., the Global Lakes and Wetlands Database (GLWD) [62] and regional data sets created by Wan [63] and Duan [55] (Table 6). The GLWD was developed based on multi-data sources gathered latest to 2001. All GLWD lakes graded in level 1 (>10 km2) and level 2 (1–10 km2) were extracted using the QB boundary. There are 44 lakes with an aggregated area of 1699.2 km2 for the GLWD, which is very close to the result in this study (Table 4). It is reasonable for the inconformity between the two data sets, since multi-data sources ranging from 1991 to 2001 were used to extract lakes for the GLWD. We overlaid the vector files of the GLWD and the data sets produced in this study with the 2000 Landsat images. We found that some lakes of the GLWD lakes were not shown in the images from 2000, and some small lakes were neglected. We checked the lakes in our datasets individually and cross-referenced to the GLWD data. Despite all small issues discussed above, we believe that both the data sets developed in this study and the GLWD show reliable quality.
A long-term data set of lakes over the TP region was created by Wan et al. [63] using remote sensing imagery. The data set provides certain useful information for revealing lake changes in the TP region. A total of 32 lakes, included in both of the two datasets, was selected and used for comparison. Figure 12 shows the area of the target lakes in 2014 (Wan et al., in blue) and 2015 (this study, in red), respectively. Note that for the area of each selected lake, the 2014 (Wan) data and the 2015 data are consistent (R2 = 0.9987). However, there were only 32 lakes with an aggregated area of 1242.4 km2 in the data set of Wan’s (2014), which was much lower than that in this study (2015, Table 4). The comparison was performed once again by overlaying the two datasets. Despite the 13 lakes smaller than 1 km2 were ignored, nearly 20 lakes mainly located in the central basin were overlooked in Wan’s study, including 3 famous lakes larger than 100 km2 (Yi Ping Li Lake, 290.2 km2; Dubsun Lake, 244.0 km2; Ya Lake, 170.3 km2). Our study not only confirmed the findings by Wan et al. (2014), but corrected its missing information in terms of lake analysis.
In addition, to evaluate our glacier inventory, we compared the glacier areas in this study and global Randolph Glacier Inventory (RGI) Version 5.0 [64] across the QB, focusing on glaciers > 0.05 km2. The total area of the QB’s glaciers in 2015 (1513.04 km2) from this study is very close to that of RGI (1581.4) in the same year, which certainly confirmed the reliability of the glacier classification results in this study.
The majority of previous studies concerning lake variations in the QB have been conducted within a merely short term, using pixel-based classification of coarse resolution imageries. This study showed more advanced and detailed spatiotemporal analysis compared to previous findings. Duan et al. (2018) performed a long-term study of lake area change in the QB based on optical satellite imagery analysis. The findings in Duan’s study also concurred with our results. However, like the majority of previous studies, Duan’s study only dealt with qualitative analyses of the correlations between climatic change and lake area variations, and also neglected the influences of glacier retreat on lake areas in the QB. In this study, we firstly applied SEM for correlation analysis between lake area changes and climate variables (Table 5, Figure 9). Based on image interpretation and statistical analysis, we concluded that precipitation played the most significant role on lake area change in the QB, while glacier treating played a relative weaker one (Figure 9). In addition, our modeling analysis also indicated that human activities may be the dominant factor resulting in the expansion of lakes in the QB from 2000 to 2015 (Table 5). The results in this study were also consistent with the findings in the study of Jiao’s [65], which indicated that the water storage in the QB increased during 2002–2013, while our study found that the lakes expanded significantly during the same time. The sparse population in the QB makes it impossible for us to obtain the specific domestic information concerning the mining activities. Given this challenge, we qualitatively explained the findings using a visual presentation. However, some direct image evidences demonstrated the importance of human activities in shaping the lake changes in the QB during the last decade (Figure 9).

4.3. Environmental Degradations in Lakes of the QB

Qinghai Province has been keen on industrialization to mitigate its poverty [66]. Given its remoteness and extreme climate, however, land-use controls and environmental regulations are poorly implemented over the QB. Extensive exploitation has caused considerable damages to salt lake environments and potential issues in the QB, such as flood hazards, resource waste, and water pollution. Enterprises built dams to control water flowing into the lakes instead of natural discharge, which increases the flood risks [67]. These dams have changed water flow, created new lakes, disturbed local ecosystems, and significantly impacted downstream, including carrying less silt, which is necessary for fertile agricultural lands [68]. A recent study indicated that the significant expansion of salt lakes formed a threat to ecological environments and major engineering facilities in the Hoh Xil region of the TP [69]. Unregulated emissions of brine have also caused overflows in the downstream region at the Qarhan Lake area [55] in the QB. Continuous expansions of salt lakes have also led to damages in the infrastructures surrounding them. The high salinity lakes, such as Yi Li Ping Lake and Ku Shui Lake, expanded dramatically in the last period and even inundated the national highway G315 in 2015 (Figure 13). Overflowed salt water eroded the road and threatened road safety. Industrial factories with large-area salterns, rectangular pools for processing the salts, occupy the land around the salt lakes (Figure 11a,c–f,h) and discharge effluents into rivers. Industrial pollution under inappropriate governing has contaminated and degraded salt lakes [25]. Abundant toxic solvents were employed to separate lithium from naturally crystallized salts, and were known to trigger cancer [70]. The toxicity of lithium emitted in rivers has been scientifically proven to potentially threaten water quality, health of residents, and fragile local environments [71]. High-polluting and wanton extractive business activities without regard to local environment and religious significance have spread anguish and disaster for the local people in the QB [72]. Lacking the requirements of a scientific outlook on development and violating the principles for sustainable development, enterprises neglect the environmental costs to create economic profits, which is seriously degrading environmental conditions and hurting religious beliefs of the local residents in the QB.

5. Conclusions

The impacts of climate and human disturbances on lakes on the Qaidam Basin, Tibetan Plateau, were investigated based on the integration of satellite image series and meteorological records. Over nearly 40 years, the total area and number of lakes (area > 0.5 km2) increased by 524.4 km2 and 18, respectively. The SEM analysis revealed that precipitation played the most significant role on lake area change in the QB. Only a small number of lakes linked to glaciers expanded constantly due to glacier melt water supply. Without a large fraction of glaciers, as in other parts of the TP, precipitation is the dominant environmental influence for lake changes in the basin. With extensive mining exploitation of salt lakes since 2000, human activities directly contribute to the expansion of lakes during the period 2000–2015. Continuous expansions of high salinity salt lakes caused the national highway to be inundated and seriously threatened on the road safety. Therefore, continued scientific research combined with long-term monitoring will be vital for assessing the future responses of the lakes and the vulnerable lake environments in the QB. Environmental policies should be implemented to strengthen ecological improvement and environmental protection, promoting the sustainable development of regional economy and society in the basin.

Author Contributions

H.L. and D.M. designed the analytical framework of this study. H.L. performed the data analysis and drafted the manuscript. Z.W. provided methodological advice. X.L. assisted in collecting and processing data and provided both GIS and RS analysis. X.L. and C.W. made major revisions of the manuscript.

Funding

This research was jointly supported by the Strategic Priority Research Program of the Chinese Academy of Sciences (XDA19040500), the National Key R&D Program of China (2016YFC0500201) and the Youth Innovation Promotion Association of Chinese Academy of Sciences (2017277, 2012178). This work was also supported by China Scholarship Council (NO. 201706170175).

Acknowledgments

The authors would like to thank Huixuan Li, Xiao Huang and the anonymous reviewers.

Conflicts of Interest

The authors declare no conflict of interest.

References

  1. Adrian, R.; O’Reilly, C.M.; Zagarese, H.; Baines, S.B.; Hessen, D.O.; Keller, W.; Livingstone, D.M.; Sommaruga, R.; Straile, D.; Donk, E.V.; et al. Lakes as sentinels of climate change. Limnol. Oceanogr. 2009, 54, 2283–2297. [Google Scholar] [CrossRef] [PubMed] [Green Version]
  2. Lei, Y.; Yao, T.; Bird, B.W.; Yang, K.; Zhai, J.; Sheng, Y. Coherent lake growth on the central Tibetan Plateau since the 1970s: Characterization and attribution. J. Hydrol. 2013, 483, 61–67. [Google Scholar] [CrossRef]
  3. Qiu, J. China: The third pole. Nature 2008, 454, 393–396. [Google Scholar] [CrossRef] [PubMed] [Green Version]
  4. Kääb, A.; Berthier, E.; Nuth, C.; Gardelle, J.; Arnaud, Y. Contrasting patterns of early twenty-first-century glacier mass change in the Himalayas. Nature 2012, 488, 495–498. [Google Scholar] [CrossRef] [PubMed]
  5. Chen, S.; Liu, Y.; Axel, T. Climatic change on the Tibetan Plateau: Potential evapotranspiration trends from 1961–2000. Clim. Chang. 2006, 76, 291–319. [Google Scholar]
  6. Liu, J.; Wang, S.; Yu, S.; Yang, D.; Zhang, L. Climate warming and growth of high-elevation inland lakes onthe Tibetan Plateau. Glob. Planet. Chang. 2009, 67, 209–217. [Google Scholar] [CrossRef]
  7. Xue, X.; Guo, J.; Han, B.; Sun, Q.; Liu, L. The effect of climate warming and permafrost thaw on desertification in the Qinghai–Tibetan Plateau. Geomorphology 2009, 108, 182–190. [Google Scholar] [CrossRef]
  8. Yao, T.; Thompson, L.; Yang, W.; Yu, W.; Gao, Y.; Guo, X.; Yang, X.; Duan, K.; Zhao, H.; Xu, B.; et al. Different glacier status with atmospheric circulations in Tibetan Plateau and surroundings. Nat. Clim. Chang. 2012, 2, 663–667. [Google Scholar] [CrossRef]
  9. Ragettli, S.; Immerzeel, W.W.; Pellicciotti, F. Contrasting climate change impact on river flows from high-altitude catchments in the Himalayan and Andes Mountains. Proc. Natl. Acad. Sci. USA 2016, 113, 9222–9227. [Google Scholar] [CrossRef]
  10. Lei, Y.; Yang, K.; Wang, B.; Sheng, Y.; Bird, B.W.; Zhang, G.; Tian, L. Response of inland lake dynamics overthe Tibetan Plateau to climate change. Clim. Chang. 2014, 125, 281–290. [Google Scholar] [CrossRef]
  11. Fang, Y.; Cheng, W.; Zhang, Y.; Wang, N.; Zhao, S.; Zhou, C.; Chen, X.; Bao, A. Changes in inland lakes on the Tibetan Plateau over the past 40 years. J. Geogr. Sci. 2016, 26, 415–438. [Google Scholar] [CrossRef] [Green Version]
  12. Beniston, M.; Diaz, H.F.; Bradley, R.S. Climatic change at high elevation sites: An overview. Clim. Chang. 1997, 36, 233–251. [Google Scholar] [CrossRef]
  13. Sidjak, R.W. Glacier mapping of the Illecille-waet icefield, British Columbia, Canada, using Landsat TM and digital elevation data. Int. J. Remote Sens. 1999, 20, 273–284. [Google Scholar] [CrossRef]
  14. Liao, J.; Shen, G.; Li, Y. Lake variations in response to climate change in the Tibetan Plateau in the past 40 years. Int. J. Digit. Earth. 2013, 6, 534–549. [Google Scholar] [CrossRef]
  15. Nie, Y.; Sheng, Y.; Liu, Q.; Liu, L.; Liu, S.; Zhang, Y.; Song, C. A regional-scale assessment of Himalayan glacial lake changes using satellite observations from 1990 to 2015. Remote Sens. Environ. 2017, 189, 1–13. [Google Scholar] [CrossRef]
  16. Tian, H.; Li, W.; Wu, M.; Huang, N.; Li, G.; Li, X.; Niu, Z. Dynamic monitoring of the largest freshwater lake in China using a new water index derived from high spatiotemporal resolution Sentinel-1A data. Remote Sens. 2017, 9, 521. [Google Scholar] [CrossRef]
  17. Lyons, E.; Sheng, Y. LakeTime: Automated Seasonal Scene Selection for Global Lake Mapping Using Landsat ETM+ and OLI. Remote Sens. 2018, 10, 54. [Google Scholar] [CrossRef]
  18. Roy, D.P.; Wulder, M.A.; Loveland, T.R.; Woodcock, C.E.; Allen, R.G.; Anderson, M.C.; Helder, D.; Irons, J.R.; Johnson, D.M.; Kennedy, R.; et al. Landsat-8: Science and product vision for terrestrial global change research. Remote Sens. Environ. 2014, 145, 154–172. [Google Scholar] [CrossRef] [Green Version]
  19. Nie, Y.; Liu, Q.; Liu, S. Glacial lake expansion in the central Himalayas by Landsat images, 1990–2010. PLoS ONE 2013, 8, e83973. [Google Scholar] [CrossRef]
  20. Jin, R.; Xin, L.; Che, T.; Wu, L.; Mool, P. Glacier area changes in the Pumqu river basin, Tibetan Plateau between the 1970s and 2001. J. Glaciol. 2005, 51, 607–610. [Google Scholar] [CrossRef]
  21. Zhu, L.; Xie, M.; Wu, Y. Quantitative analysis of land area variations and the influence factors from 1971 to 2004 in the Nam Co basin of the Southern Tibet Plateau. Chin. Sci. Bull. 2010, 55, 1294–1303. [Google Scholar] [CrossRef]
  22. Ye, Q.; Zhu, L.; Zheng, H.; Naruse, R.; Kang, S. Glacier and lake variations in the Yamzhog Yumco Basin in the last two decades using remote sensing and GIS technologies. J. Glaciol. 2007, 53, 673–676. [Google Scholar] [CrossRef]
  23. Song, C.; Huang, B.; Ke, L.; Richards, K.S. Remote sensing of alpine lake water environment changes on the Tibetan Plateau and surroundings: A review. ISPRS J. Photogramm. Remote Sens. 2014, 92, 26–37. [Google Scholar] [CrossRef]
  24. Dong, S.; Peng, F.; You, Q.; Guo, J.; Xue, X. Lake dynamics and its relationship to climate change on the Tibetan Plateau over the last four decades. Reg. Environ. Chang. 2018, 18, 477–487. [Google Scholar] [CrossRef]
  25. Lafitte, G. Spoiling Tibet: China and resource nationalism on the roof of the world. In Zed Books, London; Zed Books Ltd.: New York, NY, USA, 2013; p. 73. [Google Scholar]
  26. Zhao, C.; Liu, B.; Xiao, L.; Li, Y.; Liu, S.; Zhao, B.; Ma, J.; Chu, G.; Gao, P.; Sun, Y. Significant enrichment of Ga, Rb, Cs, REEs and Y in the Jurassic No. 6 coal in the IQE Coalfield, northern Qaidam Basin, China—A hidden gem. Ore Geol. Rev. 2017, 83, 1–13. [Google Scholar] [CrossRef]
  27. Ji, J.; Zhang, K.; Clift, P.D.; Zhuang, G.; Song, B.; Ke, X.; Xu, Y. High-resolution magnetostratigraphic study of the Paleogene–Neogene strata in the Northern Qaidam Basin: Implications for the growth of the Northeastern Tibetan Plateau. Gondwana Res. 2017, 46, 141–155. [Google Scholar] [CrossRef]
  28. Xiao, L.; Wang, J.; Dang, Y.; Cheng, Z.; Huang, T.; Zhao, J.; Xu, Y.; Huang, J.; Xiao, Z.; Komatsu, G. A new terrestrial analogue site for Mars research: The Qaidam Basin, Tibetan Plateau (NW China). Earth-Sci. Rev. 2017, 164, 84–101. [Google Scholar] [CrossRef]
  29. Chen, A.; Zheng, M.; Shi, L.; Wang, H.; Xu, J. Magnetostratigraphy of deep drilling core 15YZK01 in the northwestern Qaidam Basin (NE Tibetan Plateau): Tectonic movement, salt deposits and their link to Quaternary glaciation. Quat. Int. 2017, 436, 201–211. [Google Scholar] [CrossRef]
  30. Jia, M.; Liu, M.; Wang, Z.; Mao, D.; Ren, C.; Cui, H. Evaluating the effectiveness of conservation on mangroves: A remote sensing-based comparison for two adjacent protected areas in Shenzhen and Hong Kong, China. Remote Sens. 2016, 8, 627. [Google Scholar] [CrossRef]
  31. Hutchinson, M.F. Anusplin Version 4.2 User Guide; Centre for Resource and Environmental Studies (CRES), The Australian National University: Canberra, Australia, 2002. [Google Scholar]
  32. Allen, R.G.; Pereira, L.S.; Raes, D.; Smith, M. Crop Evapotranspiration—Guidelines for Computing Crop Water Requirements—FAO Irrigation and Drainage Paper 56; FAO: Rome, Italy, 1998. [Google Scholar]
  33. Rodríguez-Rodríguez, M. Hydrogeology of ponds, pools, and playa-lakes of southern Spain. Wetlands 2007, 27, 819–830. [Google Scholar] [CrossRef]
  34. Phiri, D.; Morgenroth, J. Developments in Landsat Land Cover Classification Methods: A Review. Remote Sens. 2017, 9, 967. [Google Scholar] [CrossRef]
  35. McFeeters, S.K. The use of the Normalized Difference Water Index (NDWI) in the delineation of open water features. Int. J. Remote Sens. 1996, 17, 1425–1432. [Google Scholar] [CrossRef]
  36. Li, W.; Du, Z.; Ling, F.; Zhou, D.; Wang, H.; Gui, Y.; Sun, B.; Zhang, X. A comparison of land surface water mapping using the normalized difference water index from TM, ETM+ and ALI. Remote Sens. 2013, 5, 5530–5549. [Google Scholar] [CrossRef]
  37. Mao, D.; Wang, Z.; Yang, H.; Li, H.; Thompson, J.R.; Li, L.; Song, K.; Chen, B.; Gao, H.; Wu, J. Impacts of climate change on Tibetan lakes: Patterns and processes. Remote Sens. 2018, 10, 358. [Google Scholar] [CrossRef]
  38. Gao, B. NDWI—A normalized difference water index for remote sensing of vegetation liquid water from space. Remote Sens. Environ. 1996, 58, 257–266. [Google Scholar] [CrossRef]
  39. Huang, X.; Zhang, L. A multidirectional and multiscale morphological index for automatic building extraction from multispectral Geoeye-1 imagery. Photogramm. Eng. Remote Sens. 2011, 77, 721–732. [Google Scholar] [CrossRef]
  40. Liu, J.; Tian, H.; Liu, M.; Zhuang, D.; Melillo, J.M.; Zhang, Z. China’s changing landscape during the 1990s: Large-scale land transformations estimated with satellite data. Geophys. Res. Lett. 2005, 32, L02405. [Google Scholar] [CrossRef]
  41. Hall, D.K.G.; Riggs, A.; Salomonson, V.V. Development of methods for mapping global snow cover using moderate resolution imaging spectroradiometer data. Rem Sens Environ. 1995, 54, 127–140. [Google Scholar] [CrossRef]
  42. Du, W.; Li, J. Mapping changes in the glaciers of the eastern Tienshan Mountains during 1977–2013 using multitemporal remote sensing. J. Appl. Remote Sens. 2014, 8, 689–697. [Google Scholar] [CrossRef]
  43. Anderson, J.C.; Gerbing, D.W. Structural equation modeling in practice: A review and recommended two-step approach. Psych. Bull. 1988, 103, 411–423. [Google Scholar] [CrossRef]
  44. Sobel, M.E. A symptotic confidence intervals for indirect effects in structural equation models. Sociol. Methodol. 1982, 13, 290–312. [Google Scholar] [CrossRef]
  45. Hooper, D.; Coughlan, J.; Mullen, M. Structural Equation Modelling: Guidelines for Determining Model Fit. Electron. J. Bus. Res. Methods 2008, 6, 53–60. [Google Scholar]
  46. Carmines, E.G.; McIver, J.P. Analyzing models with unobserved variables. Analyzing models with unobserved variables. Soc. Meas. Curr. Issues 1981, 80, 65. [Google Scholar]
  47. Tabachnick, B.G.; Fidell, L.S. Using Multivariate Statistics, 5th ed.; Allyn&Bacon/Pearson Education: Boston, MA, USA, 2007; pp. 748–752. [Google Scholar]
  48. Bentler, P.M.; Bonnet, D.C. Significance Tests and Goodness of Fit in the Analysis of Covariance Structures. Psycholog. Bull. 1980, 88, 588–606. [Google Scholar] [CrossRef]
  49. Schreiber, J.B.; Nora, A.; Stage, F.K.; Barlow, E.A.; King, J. Reporting structural equation modeling and confirmatory factor analysis results: A review. J. Educ. Res. 2006, 99, 323–337. [Google Scholar] [CrossRef]
  50. Hu, L.T.; Bentler, P.M. Cutoff criteria for fit indexes in covariance structure analysis: Conventional criteria versus new alternatives. Struct. Equ. Model.-Multidiscip. J. 1999, 6, 1–55. [Google Scholar] [CrossRef]
  51. Kline, R.B. Principles and Practice of Structural Equation Modeling, 2nd ed.; The Guilford Press: New York, NY, USA, 2005; pp. 277–278. [Google Scholar]
  52. Tahil, W. The Trouble with Lithium; Meridian International Research: Martainville, France, 2007; Available online: http://meridian-int-res.com/Projects/Lithium_Problem_2.pdf (accessed on 17 June 2010).
  53. Cai, Y. Exploitation and Utilization of Salt Lake Mineral Resources in the Basin of Chaidamu. CHN. Geol. Min. Econ. 2003, 2, 11–13. [Google Scholar]
  54. Lu, N. Changes of lake area in Qaidam basin and the influence factors. J. Arid Land Resour. Environ. 2014, 8, 15. (In Chinese) [Google Scholar]
  55. Duan, S. Lake evolution in the Qaidam Basin during 1976–2015 and their changes in response to climate and anthropogenic factors. J. Lake Sci. 2018, 30, 256–265. (In Chinese) [Google Scholar]
  56. Wei, S.; Jin, X.; Wang, K. Response of lake area variation to climate change in Qaidam Basin based on remote sensing. Earth Sci. Front. 2017, 24, 427–433. (In Chinese) [Google Scholar]
  57. Zhu, Z.; Fu, Y.; Woodcock, C.E.; Olofsson, P.; Vogelmann, J.E.; Holden, C.; Wang, M.; Dai, S.; Yu, Y. Including land cover change in analysis of greenness trends using all available Landsat 5, 7, and 8 images: A case study from Guangzhou, China (2000–2014). Remote Sens. Environ. 2016, 185, 243–257. [Google Scholar] [CrossRef]
  58. Li, M.; Zang, S.Y.; Zhang, B.; Li, S.S.; Wu, C.S. A review of remote sensing image classification techniques: The role of spatio-contextual information. Eur. J. Remote Sens. 2014, 47, 389–411. [Google Scholar] [CrossRef]
  59. Yang, K.; Lu, H.; Yue, S.; Zhang, G.; Lei, Y.; La, Z.; Wang, W. Quantifying recent precipitation change and predicting lake expansion in the Inner Tibetan Plateau. Clim. Chang. 2018, 147, 149–163. [Google Scholar] [CrossRef]
  60. Ma, Y.; Ma, W.; Zhong, L.; Hu, Z.; Li, M.; Zhu, Z.; Han, C.; Wang, B.; Liu, X. Monitoring and Modeling the Tibetan Plateau’s climate system and its impact on East Asia. Sci Rep. 2017, 7, 44574. [Google Scholar] [CrossRef] [PubMed] [Green Version]
  61. Yan, L.; Zheng, M. The response of lake variations to climate change in the past forty years: A case study of the northeastern Tibetan Plateau and adjacent areas, China. Quat. Int. 2015, 371, 31–48. [Google Scholar] [CrossRef]
  62. Lehner, B.; Döll, P. Development and validation of a global database of lakes, reservoirs and wetlands. J. Hydrol. 2004, 296, 1–22. [Google Scholar] [CrossRef]
  63. Wan, W.; Long, D.; Hong, Y.; Ma, Y.; Yuan, Y.; Xiao, P.; Duan, H.; Han, Z.; Gu, X. A lake data set for the Tibetan Plateau from the 1960s, 2005, and 2014. Sci. Data 2016, 3, 160039. [Google Scholar] [CrossRef]
  64. Arendt, A.; Bliss, A.; Bolch, T.; Cogley, J.G.; Gardner, A.S.; Hagen, J.O.; Hock, R.; Huss, M.; Kaser, G.; Kienholz, C.; et al. Randolph Glacier Inventory—A Dataset of Global Glacier Outlines: Version 5.0; Technical Report; Global Land Ice Measurements from Space: Boulder, CO, USA, 2015. [Google Scholar]
  65. Jiao, J.J.; Zhang, X.; Liu, Y.; Kuang, X. Increased water storage in the Qaidam Basin, the North Tibet Plateau from GRACE gravity data. PloS ONE 2015, 10, e0141442. [Google Scholar] [CrossRef]
  66. Goodman, D.S. The campaign to “Open up the West”: National, provincial-level and local perspectives. China Q. 2004, 178, 317–334. [Google Scholar] [CrossRef]
  67. Chen, K.; Bowler J, M. Late Pleistocene evolution of salt lakes in the Qaidam Basin, Qinghai Province, China. Palaeogeogr. Palaeoclimatol. Palaeoecol. 1986, 54, 87–104. [Google Scholar]
  68. Zheng, M. An Introduction to Saline Lakes on the Qinghai—Tibet Plateau; Springer: Berlin, Germany, 1997; p. 125. [Google Scholar]
  69. Du, Y.; Liu, B.; He, W.; Duan, S.; Hou, F.; Wang, Z. Dynamic change and cause analysis of Salt Lake area in Hoh Xil on Qinghai-Tibet Plateau during 1976–2017. J. Glaciol. Geocryol. 2018, 40, 47–54. [Google Scholar]
  70. Li, Y.; Li, H.; Liu, Z.; Miao, C. Spatial Assessment of Cancer Incidences and the Risks of Industrial Wastewater Emission in China. Sustainability 2016, 8, 480. [Google Scholar] [CrossRef]
  71. Li, H.; Li, Y.; Lee, M.K.; Liu, Z.; Miao, C. Spatiotemporal analysis of heavy metal water pollution in transitional China. Sustainability 2015, 7, 9067–9087. [Google Scholar] [CrossRef]
  72. Tibet’s Resource Curse. Available online: https://www.chinadialogue.net/article/show/single/en/4696-Tibet-s-resource-curse (accessed on 19 December 2011).
Figure 1. The geographical situation of the Qaidam Basin (QB) in northern Tibetan Plateau, China.
Remotesensing 11 00343 g001
Figure 2. The structural equation model (SEM) hypothesized structural model.
Remotesensing 11 00343 g002
Figure 3. Spatial distribution of lakes in the Qaidam Basin (QB) in 2015. Only lakes with known names are labeled and the lakes with larger bold fonts have an area larger than 100 km2. The river dataset was derived from Geographic Information System (GIS) Basic Data of China (http://www.ngcc.cn/).
Remotesensing 11 00343 g003
Figure 4. Changes in lake area and number in the four stages between 1977 and 2015. The error bars represent the confidence level of 95%.
Remotesensing 11 00343 g004
Figure 5. Spatial distribution of decadal lake changes in the Qaidam Basin (QB): 1977–1990 (a); 1990–2000 (b); and 2000–2015 (c).
Remotesensing 11 00343 g005
Figure 6. Annual variations in climatic factors. (ac) represent annual changes in mean annual air temperature (MAAT), mean annual precipitation (MAP), and potential evapotranspiration (PET) in the Qaidam Basin (QB) between 1977 and 2015, respectively. (df) represent the annual changes in MAAT and (gi) represent the annual changes in MAP and PET during the periods 1977–1990, 1990–2000, and 2000–2015, respectively.
Remotesensing 11 00343 g006
Figure 7. Spatial distribution of glaciers in the Qaidam Basin (QB) in 2015.
Remotesensing 11 00343 g007
Figure 8. Changes of glacier area between 1977 and 2015. The error bars represent the confidence level of 95%.
Remotesensing 11 00343 g008
Figure 9. Path diagram results of the structural equation model (SEM). Note: * represents p < 0.1, ** represents p < 0.05, *** represents p < 0.01.
Remotesensing 11 00343 g009
Figure 10. Evolution of typical lakes as shown in Landsat images: (ac) represent the typical lakes significantly influenced by precipitation; (df) represent the expanding of glacier-fed lakes.
Remotesensing 11 00343 g010
Figure 11. Evolution of typical lakes influenced by human exploitations as shown in Landsat images: (a) East Taijinar Lake; (b) Yi Ping Li Lake; (c) West Taijinar Lake; (d) Ya Lake; (e) Big Chai Dan Lake; (f) South Hodgson Lake; (g) North Hodgson Lake; and (h) Qarhan Lake area, including Dabsun Lake.
Remotesensing 11 00343 g011
Figure 12. Comparison of the lake data set (2015) in this study and the data set of Wan’s (2014) [63] in the Qaidam Basin (QB).
Remotesensing 11 00343 g012
Figure 13. Expanding salt lakes inundated the high way G315.
Remotesensing 11 00343 g013
Table 1. Detail information of reference data.
YearTotal SamplesLakeGlacierOthers
1977635276177182
1990654289168197
2000621284161176
2015671318150203
Table 2. The commonly used absolute fit indices.
MeasureNameDescriptionValuesReferences
χ2/dfChi-Square/degree of freedomAssess overall fit and the discrepancy between the sample and fitted covariance matrices.Less than 3,
p-value > 0.05
Carmines and McIver (1981) [46]
GFIGoodness of FitA measure of fit between the hypothesized model and the observed covariance matrix.0.90 and AboveTabachnick and Fidell (2007) [47]
NFINormed fit index and non-normed fit indexThe discrepancy between the chi-squared value of the hypothesized model and the chi-squared value of the null model0.90 and AboveBentler and Bonnet (1980) [48]
CFIComparative Fit IndexExamining the discrepancy between the data and the hypothesized model0.90 and AboveSchermelleh (2003) [49]
RMSEARoot Mean Square Error of ApproximationAnalyzing the discrepancy between the hypothesized model, with optimally chosen parameter estimates, and the dataLess than 0.08Hu and Bentler (1999) [50]
SRMRStandardized Root Mean Square ResidualThe square root of the discrepancy between the sample covariance matrix and the model covariance matrixLess than 0.08Kline, (2011) [51]
Table 3. Results of accuracy assessment of lake and glacier mapping in 1977, 1990, 2000, and 2015.
DateCategoriesUser’s AccuracyProducer’s AccuracyOverall Accuracy
1977lake0.91 ± 0.040.89 ± 0.030.90 ± 0.02
glacier0.86 ± 0.030.83 ± 0.040.86 ± 0.04
1990lake0.89 ± 0.050.92 ± 0.010.91 ± 0.03
glacier0.87 ± 0.020.89 ± 0.050.88 ± 0.05
2000lake0.92 ± 0.030.94 ± 0.040.93 ± 0.03
glacier0.89 ± 0.050.88 ± 0.020.87 ± 0.05
2015lake0.95 ± 0.030.94 ± 0.050.94 ± 0.05
glacier0.89 ± 0.020.91 ± 0.040.90 ± 0.04
Note: The value after the symbol “±” represents the margin of error at confidence level 95%.
Table 4. The number, area, and changes of lakes in different sizes in the four stages between 1977 and 2015.
Area Classes (km2) 0.5–11–1010–5050–100>100Total
Number of lakes19771018124650
19901323154762
2000724153756
20151328136868
Change in number (%)1976–199030.027.825.00.016.724.0
1990–2000−46.24.30.0−25.00.0−9.7
2000–201585.716.7−13.3100.014.321.4
1976–201530.055.68.350.033.336.0
Lake area (km2)19766.5 ± 0.363.9 ± 3.2314.3 ± 15.7354.4 ± 17.71022.4 ± 51.11761.5 ± 88.1
19909.0 ± 0.488.3 ± 3.5429.0 ± 17.2257.3 ± 10.31106.6 ± 44.31890.2 ± 75.6
20002.8 ± 0.171.4 ± 3.6386.6 ± 19.3174.4 ± 8.71020.4 ± 51.01655.5 ± 82.8
20159.0 ± 0.473.8 ± 3.0481.8 ± 19.3279.9 ± 11.21441.3 ± 57.72285.9 ± 91.4
Change in area (%)1976–199038.538.236.5−27.48.27.3
1990–2000−68.9−19.1−9.9−32.2−7.8−12.4
2000–2015221.43.424.660.541.238.1
1976–201538.515.553.3−21.041.029.8
Table 5. The indices for overall fitness of the structural equation model (SEM) in 1977–2000 and 1977–2015.
Yearλ2/dfGFINFICFIRMSEASRMR
1977–20001.5300.9890.9510.9620.0710.050
1977–20157.2990.8690.7650.8991.1910.091
Table 6. Area comparison of lakes in the QB between the results in this study and reference atasets.
YearLake NumberLake Area (km2)Reference
DatasetLake NumberLake Area
1977501761.5Wan (1960s) [63]391200.7
Duan (1977) [55]451793.1
1990621890.2Duan (1990) [55]461979.7
2000561655.54Global Lakes and Wetlands Databases (GLWD) (2000) [62]441699.2
Wan (2005) [63]341217.0
Duan (2000) [55]471665.4
2015682285.9Wan (2014) [63]341242.4
Duan (2015) [55]572058.6

