Article

Building Footprint Extraction from Multispectral, Spaceborne Earth Observation Datasets Using a Structurally Optimized U-Net Convolutional Neural Network

by
Giorgio Pasquali
1,
Gianni Cristian Iannelli
2 and
Fabio Dell’Acqua
1,*
1
Department of Electrical, Computer, Biomedical Engineering, University of Pavia, Via Adolfo Ferrata, 5, I-27100 Pavia, Italy
2
Ticinum Aerospace, via Ferrini 17/C, I-27100 Pavia, Italy
*
Author to whom correspondence should be addressed.
Remote Sens. 2019, 11(23), 2803; https://doi.org/10.3390/rs11232803
Submission received: 15 October 2019 / Revised: 12 November 2019 / Accepted: 22 November 2019 / Published: 27 November 2019

Abstract

:
Building footprint detection and outlining from satellite imagery represents a very useful tool in many types of applications, ranging from population mapping to the monitoring of illegal development, from urban expansion monitoring to organizing prompter and more effective rescuer response in the case of catastrophic events. The problem of detecting building footprints in optical, multispectral satellite data is not easy to solve in a general way due to the extreme variability of material, shape, spatial, and spectral patterns that may come with disparate environmental conditions and construction practices rooted in different places across the globe. This difficult problem has been tackled in many different ways since multispectral satellite data at a sufficient spatial resolution started making its appearance on the public scene at the turn of the century. Whereas a typical approach, until recently, hinged on various combinations of spectral–spatial analysis and image processing techniques, in more recent times, the role of machine learning has undergone a progressive expansion. This is also testified by the appearance of online challenges like SpaceNet, which invite scholars to submit their own artificial intelligence (AI)-based, tailored solutions for building footprint detection in satellite data, and automatically compare and rank by accuracy the proposed maps. In this framework, after reviewing the state-of-the-art on this subject, we came to the conclusion that some improvement could be contributed to the so-called U-Net architecture, which has shown to be promising in this respect. In this work, we focused on the architecture of the U-Net to develop a suitable version for this task, capable of competing with the accuracy levels of past SpaceNet competition winners using only one model and one type of data. This achievement could pave the way for achieving better performances than the current state-of-the-art. All these results, indeed, have yet to be augmented through the integration of techniques that in the past have demonstrated a capability of improving the detection accuracy of U-net-based footprint detectors. The most notable cases are represented by an ensemble of different U-Net architectures, the integration of distance transform to improve boundary detection accuracy, and the incorporation of ancillary geospatial data on buildings. Our future work will incorporate those enhancements.

Graphical Abstract

1. Introduction

The ability to accurately detect and locate building footprints is a powerful tool at the service of many different applications such as illegal building detection [1], population mapping [2], and damage assessment [3,4]. Building detection is a very challenging task due to the variability of the shape, material, and dimensions of the buildings, in addition to the different types of background in which they are located. In the past, building detection was mostly based on aerial images—due to their fine at-ground geometric resolution—using computer vision techniques [5,6,7,8]; in the last few years, big progress has been made in machine learning science, particularly in deep learning. Thus, many scientific studies have started applying deep learning in building detection tasks; furthermore, thanks to the very high ground resolution achieved with the latest satellite technology, it became possible to use optical satellite data instead of aerial images. This is a big advantage because satellite remote sensing offers repeated acquisitions of the same area across time, pulling down the costs and opening a route to higher temporal and spatial accuracy in applications like damage assessment or urban monitoring. Moreover, deep learning models need a huge amount of data to be correctly trained for a specific purpose. In this case, satellite data are the best choice because spaceborne systems can provide large sets of acquisitions at an affordable cost. Indeed, in this framework, many online challenges have appeared, like SpaceNet, which provides a large amount of very high resolution (VHR) multispectral satellite data for free to train and test deep learning models. In addition to multispectral data, spaceborne synthetic aperture radar (SAR) data has also been considered in scientific literature for this purpose, and various authors have proposed solutions for SAR-based building detection [9,10]. SAR data offers unquestionable advantages over optical data in terms of all-weather operational capability, but on the other hand, its high level of spatial non-homogeneity due to multiplicative noise and complex reflection patterns makes it more difficult to detect homogeneous areas [11] characterizing building footprints, including when multipolarization data is considered [12]. In our work, we tackle the problem of building footprint mapping; damage mapping, where SAR features can be beneficial [13,14,15] is only considered as an application case study. Building footprint mapping, in general, is not a time-critical task as time-scales in building changes are quite long. Thus, in this context, we chose to focus on multispectral optical data because (i) buildings produce clearer, less ambiguous features in multispectral data than in SAR data, (ii) visual interpretation of multispectral data, including intermediate results, is easier and helps provide clues to steer the research work while in progress, and (iii) last but not least, a good choice of multispectral datasets is distributed under an open license through the SpaceNet challenge and other initiatives.
In this work, indeed, leveraging the sizable dataset provides by SpaceNet, we started from the popular U-Net [16] and, by modifying its architecture, we developed a convolutional neural network suitable for building detection. With this network, we are able to generate binary building masks from 8-band multispectral satellite data, where buildings and background are the only two defined classes. Once we developed the architecture, we applied it to a damage assessment case: specifically, the availability of a map of all buildings before and after a natural disaster allows us to accurately detect areas where collapse events were geographically concentrated and thus send a better organized and prompter response to rescue the victims of the event and help survivors. Furthermore, early building damage estimation makes it possible to issue a first rough estimation of the funds to be allocated in order to rebuild the collapsed buildings. It is especially useful in poor countries, where natural disasters inflict much more damage and cause many more victims than in highly developed countries, due to the use of poor-quality construction materials, creaky infrastructures, and the presence of many illegal buildings. The case study discussed in this paper is a category five hurricane that on 10 October 2018 made landfall in the Florida panhandle region, with a maximum sustained wind speed of 140 knots and a minimum pressure of 919 mb. The storm caused an estimated $25 billion dollars in damage [17]. Applying the network to pre- and post-event images, it is possible to create two binary building masks, where the only differences between them are generated by building collapses; therefore, image-wide subtraction allows the generation of a mask that represents only severely damaged buildings. This paper, which describes the above-mentioned research work and its results, is organized as follows. The next section draws a concise picture of the state-of-the-art in building detection from very high spatial Resolution (VHR) optical satellite datasets; Section 3 reports on the dataset used and its features; Section 4 describes the proposed method for building mapping, while discussing and motivating how it was developed; Section 5 presents some results, analyzing its pros and cons; Section 6 regards possible application of the developed method to the specific problem of mapping damage to buildings due to natural disasters; finally, Section 7 draws some conclusions and proposes possible avenues for further improvement of the method.

2. State-of-the-Art in Building Footprint Extraction

In recent years, building detection in satellite data has become a hot topic in scientific research. The earlier approaches to the problem were mostly based on computer vision techniques, applied to aerial images at first and then, when technological progress enabled the production of spaceborne multispectral data at a sufficient resolution, also to satellite images. A representative work for this era is described in [7], where color-invariant features are used to help extract rooftops and shadow information from aerial images; the geometry of shadow is then exploited to determine the illumination direction, which is in turn leveraged to estimate the location of the corresponding building. In the next step, the authors used the Canny edge detector to extract roof boundary hypotheses and then exploited the predominance of rectangular-shaped features in buildings to constrain the search for footprint limits and thus to fix the final roof shape. In [8], instead, a non-linear bilateral filter is first applied to smooth out unwanted high-frequency noise in the input mutispectral satellite image [18]. Then, local-scale invariant feature transform (SIFT) key-points are extracted from the processed satellite image; using matching key-points between predefined templates and the contents of the tested image, built-up areas are detected. Starting from the extent of the urban areas, thanks to a novel, graph-cut method, the authors can detect individual buildings. In [19], panchromatic data is used in place of multispectral data in order to maximize the spatial resolution. For this type of input data, the authors developed a multi-step method: First, to enhance buildings structures, they used local directional morphological operations; then, a multiseed-based clustering of internal gray variance (IGV) features was performed. Moreover, the edges were identified using bimodality detection, and shadows were extracted from the image; these features were used together to reduce false alarms. Finally, the image was segmented with an adaptive-threshold technique. The use of techniques mutuated from the traditional fields of image processing and computer vision was a natural choice when other powerful tools like deep learning approaches were out of the question due to a lack of sufficient computing power to cater for their requirements and the parallel lack of huge training sample sets. More recently, the growth of available computing performances and the flood of VHR satellite data that can be annotated made the deep learning alternative viable. Many of the latest pieces of scientific work [20,21,22] on this problem, indeed, propose deep learning models as their approach, although papers based on the image-processing approach continue to appear [23]. In this context, the SpaceNet challenge [24] constitutes a reference point due to two main reasons. First of all, very high resolution (VHR) satellite data are generally expensive, whereas SpaceNet challenges make available every year a huge amount of fresh VHR multispectral data for free. Secondly, SpaceNet also makes available the ground truth (GT) of all the data. These two features together make the challenge an attractive, rich source of data for this specific problem, enabling suitable training and testing of CNNs. The above-cited scientific articles [20,21,22], indeed, use such data and choose intersection over union (IoU) and F1 scores as evaluation metrics, in accordance with the SpaceNet provisions [24]. Specifically, in [20] a model based on U-Net with the encoder part replaced with a convolutional part of the WideResNet-38 network is proposed, with in-place activated batch normalization [25], to save up to 50% of GPU memory; this new encoder is pretrained on RGB images from ImageNet. In order to separate buildings, an extra output channel is added that predicts areas where touching or nearing borders are likely; this output is used in post-processing to split the mask into separate instances: they subtract borders from the corresponding mask and use both masks and these new data as input to the watershed transform. The authors used 11-band data to train the model: RGB + 8-band multispectral data; the weights of the pretrained WideResnet-38 are copied to the first three channels, and the remaining channels are initialized with zeros. Adam [26] is selected as the optimizer, with a learning rate of 1 × 10 4 ; data augmentation is then applied in the form of random resize and random rotation. In [21], a model based on U-Net composed of a common feature extractor followed by four multitask branches to detect roads and “small”, “medium”, and “large” buildings is proposed. The authors used RGB data from SpaceNet to train the building detection branches and used the road extraction dataset from the competition to train the related branch. Roads help to recognize buildings due to their frequent co-occurrence; they are extracted after training the related branch by knowledge distillation from another road extraction model [27]. Building detection branches are trained using multisize building labels; finally, building predictions of the three different branches are merged together into a final mask. They used the Adam optimizer with a learning rate of 1 × 4 4 and with a coefficient of weight decay of 5 × 10 4 ; the layers in the encoder are initialized with pre-trained weights on ImageNet. In [22], an ensemble of three different U-Nets for building footprint detection is proposed, using multispectral satellite images and OpenStreetMap data. The authors used data with five bands (Coastal, Yellow, Red, Red Edge, and Near-IR1) and a modified version of the original U-Net. Specifically, the stochastic gradient descent is substituted with the Adam optimizer; furthermore, they introduced a batch normalization wrapper around the activation function of each layer to accelerate network training [28]. Finally, they applied the binary distance transform to improve building detection accuracy [29]. In [30], a modified model of the U-Net is proposed: the 1024 depth layer is dropped in order to ease optimization and batch normalization is added after each activation function to speed up training. The Adam optimizer is chosen to replace stochastic gradient descent with a learning rate of 0.001. The dataset is collected using the MapBox API for OpenStreetMap, and real-time data augmentation is applied: images are flipped, rotated, and shifted. Unlike for the other papers, in this case the Dice coefficient is used as the metric to evaluate training in place of the IoU. The winner of the SpaceNet competition also developed a model based on U-Net. It is an averaging ensemble of three U-Net models [31] that process three different-sized datasets and, particularly, the third model integrates OpenStreetMap data. The SpaceNet winner chose to use 8-band multispectral data because it apparently improves performance with respect to RGB data alone. Finally, in [32] is proposed a model based on SegNet [33], with the VGG16 [34] encoder architecture and a mirrored version of the encoder as the decoder; an additional convolutional layer is appended to the last layer of the decoder to predict the distance to the border of the buildings, also known as the distance transform. Feature maps produced by the additional convolutional layer and the last layer of the decoder are concatenated and passed to a second convolutional layer to predict the final mask. The aim is to add geometric features incorporating boundary information on buildings in order to produce less “blobby”, and thus more accurate, predictions. The dataset is retrieved from the Inria Aerial Image Labeling Dataset, which comprises 360 orthorectified aerial RGB images at a 0.3 m spatial resolution. The encoder is initialized with the weights of a VGG16 model pretrained on ImageNet, and the network is trained with stochastic gradient descent with a learning rate of 0.01, a weight decay of 0.0005, and a momentum of 0.9. Random flip in the vertical and horizontal directions are applied as a form of data augmentation. Further improvements over final U-net results may be achieved by incorporating additional information and/or post-processing steps. Different avenues were proposed recently, which can be roughly categorized into three classes. These latter are summarized in Table 1, along with references to papers where they are proposed. The reader is referred to the referenced papers for more details, as these techniques are not employed in this work.
In summary, U-Nets have already been used in the context of building detection in Earth observation data; our work, however, features remarkable differences with respect to previously published material, as detailed in the itemized list below:
  • The solution in [20] employs in-place activated batch normalization, which can save up to 50% of GPU memory. Their network achieves very good results, thanks also to the post-processing step based on watershed transform. However, even with in-place activated batch normalization, the proposed solution is expensive in terms of GPU memory. Indeed, the authors used a 4 GTX 1080-Ti to run it on a batch size of 20. Furthermore, the proposed network is relatively slow: to process 10 samples, it takes 1 s.
  • In [21], the authors developed a network that can reliably detect buildings of different sizes, even the smallest ones. However, this result is achieved introducing a notable complexity, which includes four different branches plus a post-processing step. Furthermore, the network is designed to use RGB data, whereas it is proven [31] that higher-dimensional data can achieve better levels in terms of final accuracy.
  • In [22], building boundaries are determined accurately thanks to the distance transform, and the authors achieved good overall accuracy, thanks also to three different U-Net architectures. However, their results are good only on larger building, whereas smaller buildings are detected poorly. Good results are achieved only after setting a minimum area—below which buildings are neglected—of 120 pixels for Las Vegas and 180 pixels for Paris, Shanghai, and Khartoum, while for the SpaceNet competition, the minimum area was of 20 pixels.
  • Finally, in [30], the proposed networks achieved good results, although not optimal in some cases. Whereas the presence of buildings works well, issues are encountered with the identification of boundaries. The authors indeed plan to integrate distance transform, which is known to mitigate this problem. Our proposed approach can better identify the boundaries of detected buildings, generally.

3. The Dataset Used

We chose to train our CNN with the dataset made available by SpaceNet for its competitions and downloadable through the Amazon Web Service (AWS) [35]. The areas of interest are Rio de Janeiro (first round of the competition), Las Vegas, Shanghai, Khartoum, and Paris (second round). Data on Rio de Janeiro was collected by DigitalGlobe’s WorldView-2 satellite; it features a 50 cm spatial resolution on its 8-band multispectral pansharpened data. The eight bands are: Coastal (400–450 nm), Blue (450–510 nm), Green (510–580 nm), Yellow (585–625 nm), Red (630–690 nm), Red Edge (705–745 nm), Near-IR1 (770–895 nm), Near-IR2 (860–1040 nm). Data on Las Vegas, Shanghai, Khartoum, and Paris were collected by DigitalGlobe’s WorldView-3 satellite; they consist of 8-band multispectral data pansharpened at a 30 cm spatial resolution, with the same bands as WorldView-2. SpaceNet provides 200 m × 200 m tiles both for the first and the second round, composed of 6940 and 10,593 tiles with sizes of 438 × 406 and 650 × 650 pixels, respectively. It is possible to download 8-band or RGB data for both rounds; for the second round, it is also possible to download panchromatic and non-pansharpened data. We decided to use 8-band instead of RGB data based on the results from the SpaceNet competition winner suggesting that such data affords better results [31]. This is not surprising as a wider spectral scope makes it possible to exploit additional spectral features, such as the vegetation reflectance peak in the NIR range; e.g., with 8-band data it is easier to detect vegetation through its typical spectral signature, which is characterized by a sharp increase of reflectance in the NIR range. In this way, it is easier to identify buildings totally or partly surrounded by vegetation or to separate neighboring buildings interspersed with grass or trees.
Together with the data, ground truth information is also distributed. In our case, we decided to use it as follows: 80% of the entire dataset is used for training and validation and the remaining 20% for the test set; then, from the training and validation set, 90% is used for training and 10% for validation. As shown in Figure 1, the training and validation set is composed of a different number of tiles for each area: specifically, starting from the whole dataset—composed of 3851 tiles for Las Vegas, 1148 for Paris, 4582 for Shanghai, 1012 for Khartoum, and 6940 for Rio de Janeiro—the training and validation set is composed of 80% of the tiles from each area, thus 3081 tiles for Las Vegas, 918 for Paris, 3666 for Shanghai, 810 for Khartoum, and 5552 for Rio de Janeiro. This is done in order to build a training and validation set that includes a homogeneous contribution of tiles from each area; therefore, the same percentage is taken for each area. Since the number of tiles is different for each zone, this translates into different contributions to the training and validation set. The test set reflects this structure, albeit with a different overall size.
For the application example on damage assessment, we picked the case of hurricane Michael. This was a Cat5 hurricane that made landfall on the Florida panhandle, in the continental USA, at peak intensity on 10 October 2018. The satellite dataset selected is centered on the closest city to the most damaged area, i.e., Panama City, FL, as shown in Figure 2. Unfortunately, it was not possible to retrieve the full 8-band satellite data of this area; 3-band (RGB) pre- and post-event data with 50 cm spatial resolution was downloaded from the DigitalGlobe Open Data Program [36] portal. The solution adopted to deal with this problem is accurately explained in Section 6.

4. The Proposed Method

4.1. Pre-Processing of Input Data

The input data were resized to 384 × 384 pixels; this size was chosen because every convolutional layer is applied with stride and padding equal to 1 in order to preserve more features while passing through each of them. The smallest figure not greater than 438 × 406 (the Rio de Janeiro tile size) that is divisible by 2 as many times as the number of pooling layers is 384. Spline interpolation was used to resize the data. Furthermore, the data were centered using Z-score standardization: the mean and standard deviation were computed on the whole dataset (i.e., training and validation sets), for each band; then each band of each image was standardized with Z-score standardization:
s t a n d a r d i z e d _ b a n d i = b a n d i m e a n i s t d i ,
where b a n d i is the band to be standardized and m e a n i and s t d i are the mean and the standard deviation of that band calculated over the whole training + validation dataset. The same values were then used to standardize the test set. To reduce overfitting and grant to the network the best possible generalization capability, data augmentation was applied to the training set: to each standardized image and the relative ground truth mask loaded, a combination of transformations randomly selected among 90, 180, 270 rotation, horizontal, and vertical flip were applied. In addition, training images were loaded in a different random order for each epoch. The same preprocessing steps were applied to the application case, except for the resize operation, which was substituted with clipping the satellite images in tiles of the desired resolution.

4.2. Architecture

Starting from the original U-Net architecture, the 1024-depth layer was removed to ease optimization, as done in [30]. Stochastic gradient descent was replaced with the Adam optimizer to increase the model accuracy, especially for noisy data and non-stationary objectives [26,38]; the learning rate was set to 0.0001. Moreover, the number of epochs was set to 200; however, EarlyStopping from Keras call-back functions [39] was used. It allows stopping the training of the network if it does not improve anymore for a specified number of consecutive epochs: in our case, the improvement of the network was based on the IoU computed on the validation dataset, and the number of epochs without improvement was set to 20. Furthermore, the ReduceLROnPlateu Keras call-back function [39] was used to reduce the learning rate after 10 epochs without any improvement by a factor of 0.5; this allows us to get deeper into the minimum of the loss function. During the training and validation, the predictions were evaluated through the Jaccard coefficient, also known as the intersection over union (IoU). Binary cross entropy was used as a loss function and Sigmoid function as a classifier.
Hence, different architectures were trained; from the original one, which starts with a 64-depth layer and ends the contraction section with the 1024-depth layer, the 1024-depth layer was removed. and five different architectures were generated by removing and adding additional layers as shown in Figure 3: 8-256, 16-256, 16-512, 32-512 and 64-512, where the first number stands for the the first layer depth of the contraction section and the second one stands for the last layer depth. These additional layers were specifically selected to make the network less demanding in terms of GPU memory requirements: adding initial layers with a smaller depth results in fewer activation maps extracted from the full-size image, and ultimately into less GPU memory occupied. In this way, it is possible to test various batch sizes and identify the best one, scanning even those that would saturate the GPU memory if used in the original U-Net architecture. Hence, in order to choose the best one, the 8-256 architecture was trained only on the Rio de Janeiro dataset, with various batch sizes: 2, 32, 64, and 128. To speed up the training process and avoid GPU memory saturation, only the lighter architecture was tested, and on only one area, specifically, the one with the largest dataset. Results in Figure 4 show that a batch size of 2 is the best choice.
Thus, setting the batch size equal to 2, all of the models were trained on Rio de Janeiro, and the results are reported in Figure 5.
From these results, it is clear that the various models achieve very similar results, except for 8-256; thus, the 16-256, 16-512, 32-512, and 64-512 architectures were trained on the whole training set to figure out which one performs best with the best batch size, i.e., the one equal to 2.
In Figure 6 and Figure 7, the loss and accuracy results are shown for the training and validation of the four different models. From the accuracy curves, it can be seen that the 32-512 model offers the best accuracy, while the loss highlights instead that even if overfitting is still observed, it has a very limited impact. Furthermore, the 32-512 model also achieves the lowest loss; therefore, it is the best model found, as shown in Figure 8.
The final results were then evaluated through the SpaceNet competition metric: every predicted building was compared with the ground truth through the IoU. If the result is greater than 0.5, then a true positive is found; otherwise, it is considered a false positive. Finally, the F1 score was computed to evaluate the performance of the model. The F1 score is given by the formula
F 1 = 2 p r e c i s i o n r e c a l l p r e c i s i o n + r e c a l l ,
where p r e c i s i o n is the fraction of true positives among the total of detected buildings and r e c a l l is the fraction of labeled buildings that are detected correctly by the algorithm, i.e., true positives. An implementation of this metric can be found in [40].

5. Results

In Table 2, our model results are reported as evaluated with the F1 score and compared to those from the winners of both SpaceNet competitions. Our model predicts better on less urbanized areas with respect to the models proposed by the winners of the second round. This is an important achievement because those are the areas of greater interest for this research work. Moreover, our model outperforms the models proposed by the winners of the first competition; this is partially due to the big progress made in deep learning in recent years. Moreover, our model results are also reported for each area, evaluated with the training metric: areas with good predictions score higher in F1 than the pixel-based IoU, contrary to what happens for worse-predicted areas. Indeed, in those areas, even if the shape of the buildings is well detected, many buildings are detected as one big building, hence generating errors in the 1-to-1 building correspondence underpinning the F1 evaluation.
This effect is more evident for Rio de Janeiro, where the F1 score is 51.8%, which is lower than for the Khartoum dataset, while the IoU is 70%, which is higher than for Khartoum; this is caused by the lower resolution of the Rio de Janeiro data, which is 50 cm instead of 30 cm, resulting in more difficult discrimination between neighboring buildings. In Figure 9 is shown a visual example of this problem for Rio de Janeiro; furthermore, in Figure 10 and Figure 11, visual examples are shown of the best- (Las Vegas) and the worst- (Khartoum) predicted area from the second round of the SpaceNet competition.
Regarding processing times, training the network on the whole dataset with a GTX 1080-Ti GPU took around 4–5 days, while evaluating it on the test set lasted approximately 2 min.
At this stage, it may be useful to compare our network with another one closer to the original U-Net, used in [30]. Starting from the original U-Net architecture, in [30] the authors removed the deepest layer to ease optimization and tackle the vanishing gradient problem; this is also done in the present work, but with a major difference: in our case, we experimented with adding and removing further layers in order to identify the architecture that best fits the building detection problem. We indeed found that the addition of an initial 32-depth layer gives better results than other architectures, even the one used in [30]; moreover, thanks to the initial 32-depth layer, the GPU memory consumption is reduced: from the original, full-size image, 32 activation maps are extracted; then, after downsampling, the 64 activation maps are extracted from a reduced-size image. As the authors of [30] did, we used the Adam optimizer instead of the original stochastic gradient descent in order to ensure faster convergence. Contrary to [30], batch normalization was not applied in our work, due to the small batch size. Tests indeed revealed that, in our case, it does not improve our result but it does increase both training and test times, due to the extra computations needed at each layer. Furthermore, in our research work we used binary cross-entropy as the loss function and intersection over union as the metric. Finally, instead of simply rotating, flipping, and shifting images, we applied a more refined data augmentation strategy, as explained in Section 4.1. To summarize, we have identified a U-Net-based architecture that best fits the building detection problem, using less GPU memory and having a faster training and test process while still maintaining good results. These latter may be further improved in the future by applying some of the post-processing techniques that are usually leveraged in this context.

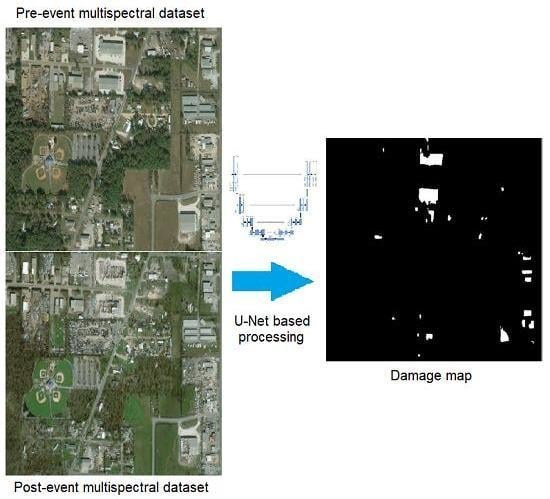
6. Application to Damage Mapping

Moving on to the applicative case, as already mentioned, it was not possible to obtain the 8-band data of this area under the DigitalGlobe Open Data Program as it was once possible. The new owner of DigitalGlobe, Maxar, has tightened the terms of the Open Data Program, and nowadays, only 3-band data is available for the listed events. We thus decided to adapt the model to the data at hand. Therefore, the best model found with the 8-band data (i.e., 32-512) was modified to operate on 3-band data: it was trained with the same training set and all the same techniques as previously explained, but with 3 bands in place of 8. We understand that the best model built on 8 bands is not necessarily also the best model with 3-band data and that the solution adopted appears to be a bit of a stretch, but this is still a way to test whether it can still offer acceptable results when applied to poorer data; indeed, 3-band data are more easily provided for free for research purposes than more expensive, full 8-band data. The performances achieved by the 32-512 model during the training, without changing any hyperparameter with respect to the best model found, are the following:
  • Validation loss (binary cross-entropy): 0.1122…
  • Validation accuracy (IoU): 0.7001…
Hence, with 3 bands instead of 8, the model loses approximately 1% of the accuracy computed with the IoU, but it still offers good performance; applying the F1 score, the results are
  • Las Vegas: 0.772,
  • Paris: 0.664,
  • Shanghai: 0.622,
  • Khartoum: 0.55,
  • Rio de Janeiro: 0.489.
Thus, it is shown that training the model with 3-band data results in a loss of F1 score that ranges between 2% and 3%, while the IoU is only 1% below the model trained with 8-band data. This means that the new model still predicts the distribution of the buildings well, but it does not separate neighboring buildings as well as the best model does. One of the reasons for these results is that the new model is trained without the near infrared band; this band is very useful for detecting vegetation, which is useful to separate neighboring buildings with grass or trees in between them. Hence, to generate a collapsed building mask of the selected area, this modified network is used to predict two buildings masks: one on the pre- and one on the post-event satellite image. Then, a subtraction of the two building masks is computed to generate a map that sets to 1 the pixels where buildings were found only in the pre-event mask, i.e., buildings that collapsed and thus are not found in the post-event mask.
Before moving on to visual assessment, it is important to point out that the resolution of the input data is 50 cm, and thus, it is expected that predictions will not be as good as the best ones achieved but will rather be similar to those for Rio de Janeiro. Furthermore, due to the temporal difference in the acquisition of the images, some buildings in the post-event image are not observed in the pre-event one because they were built between the two acquisitions. Here, the subtraction will generate pixels valued at -1: these errors are easily removed by setting to zero all pixels with a negative value. Furthermore, the training set is orthorectified, while the application case set is not; this implies that predictions will be worse because the network is not trained to detect buildings on this type of data. Moreover, the satellite images before and after the event are taken from different orbits and thus feature different incidence angles. This implies that the detailed shapes of buildings detected in the two images will not exactly match, thus causing false positives in the collapsed buildings map, as visible also in Figure 12.
Hence, due to the lack of orthorectified data, a post-process step is needed to improve results, removing at least some of the false positives generated by the subtraction step. As a first approach, the idea was to delete all buildings smaller than a fixed area. However, this leads to many correctly detected small collapsed buildings being removed from the map together with false positives. Thus, the solution adopted was to develop an algorithm that tries to recognize and remove only errors due to different view angles of the same building.
The logic behind this algorithm is the following:
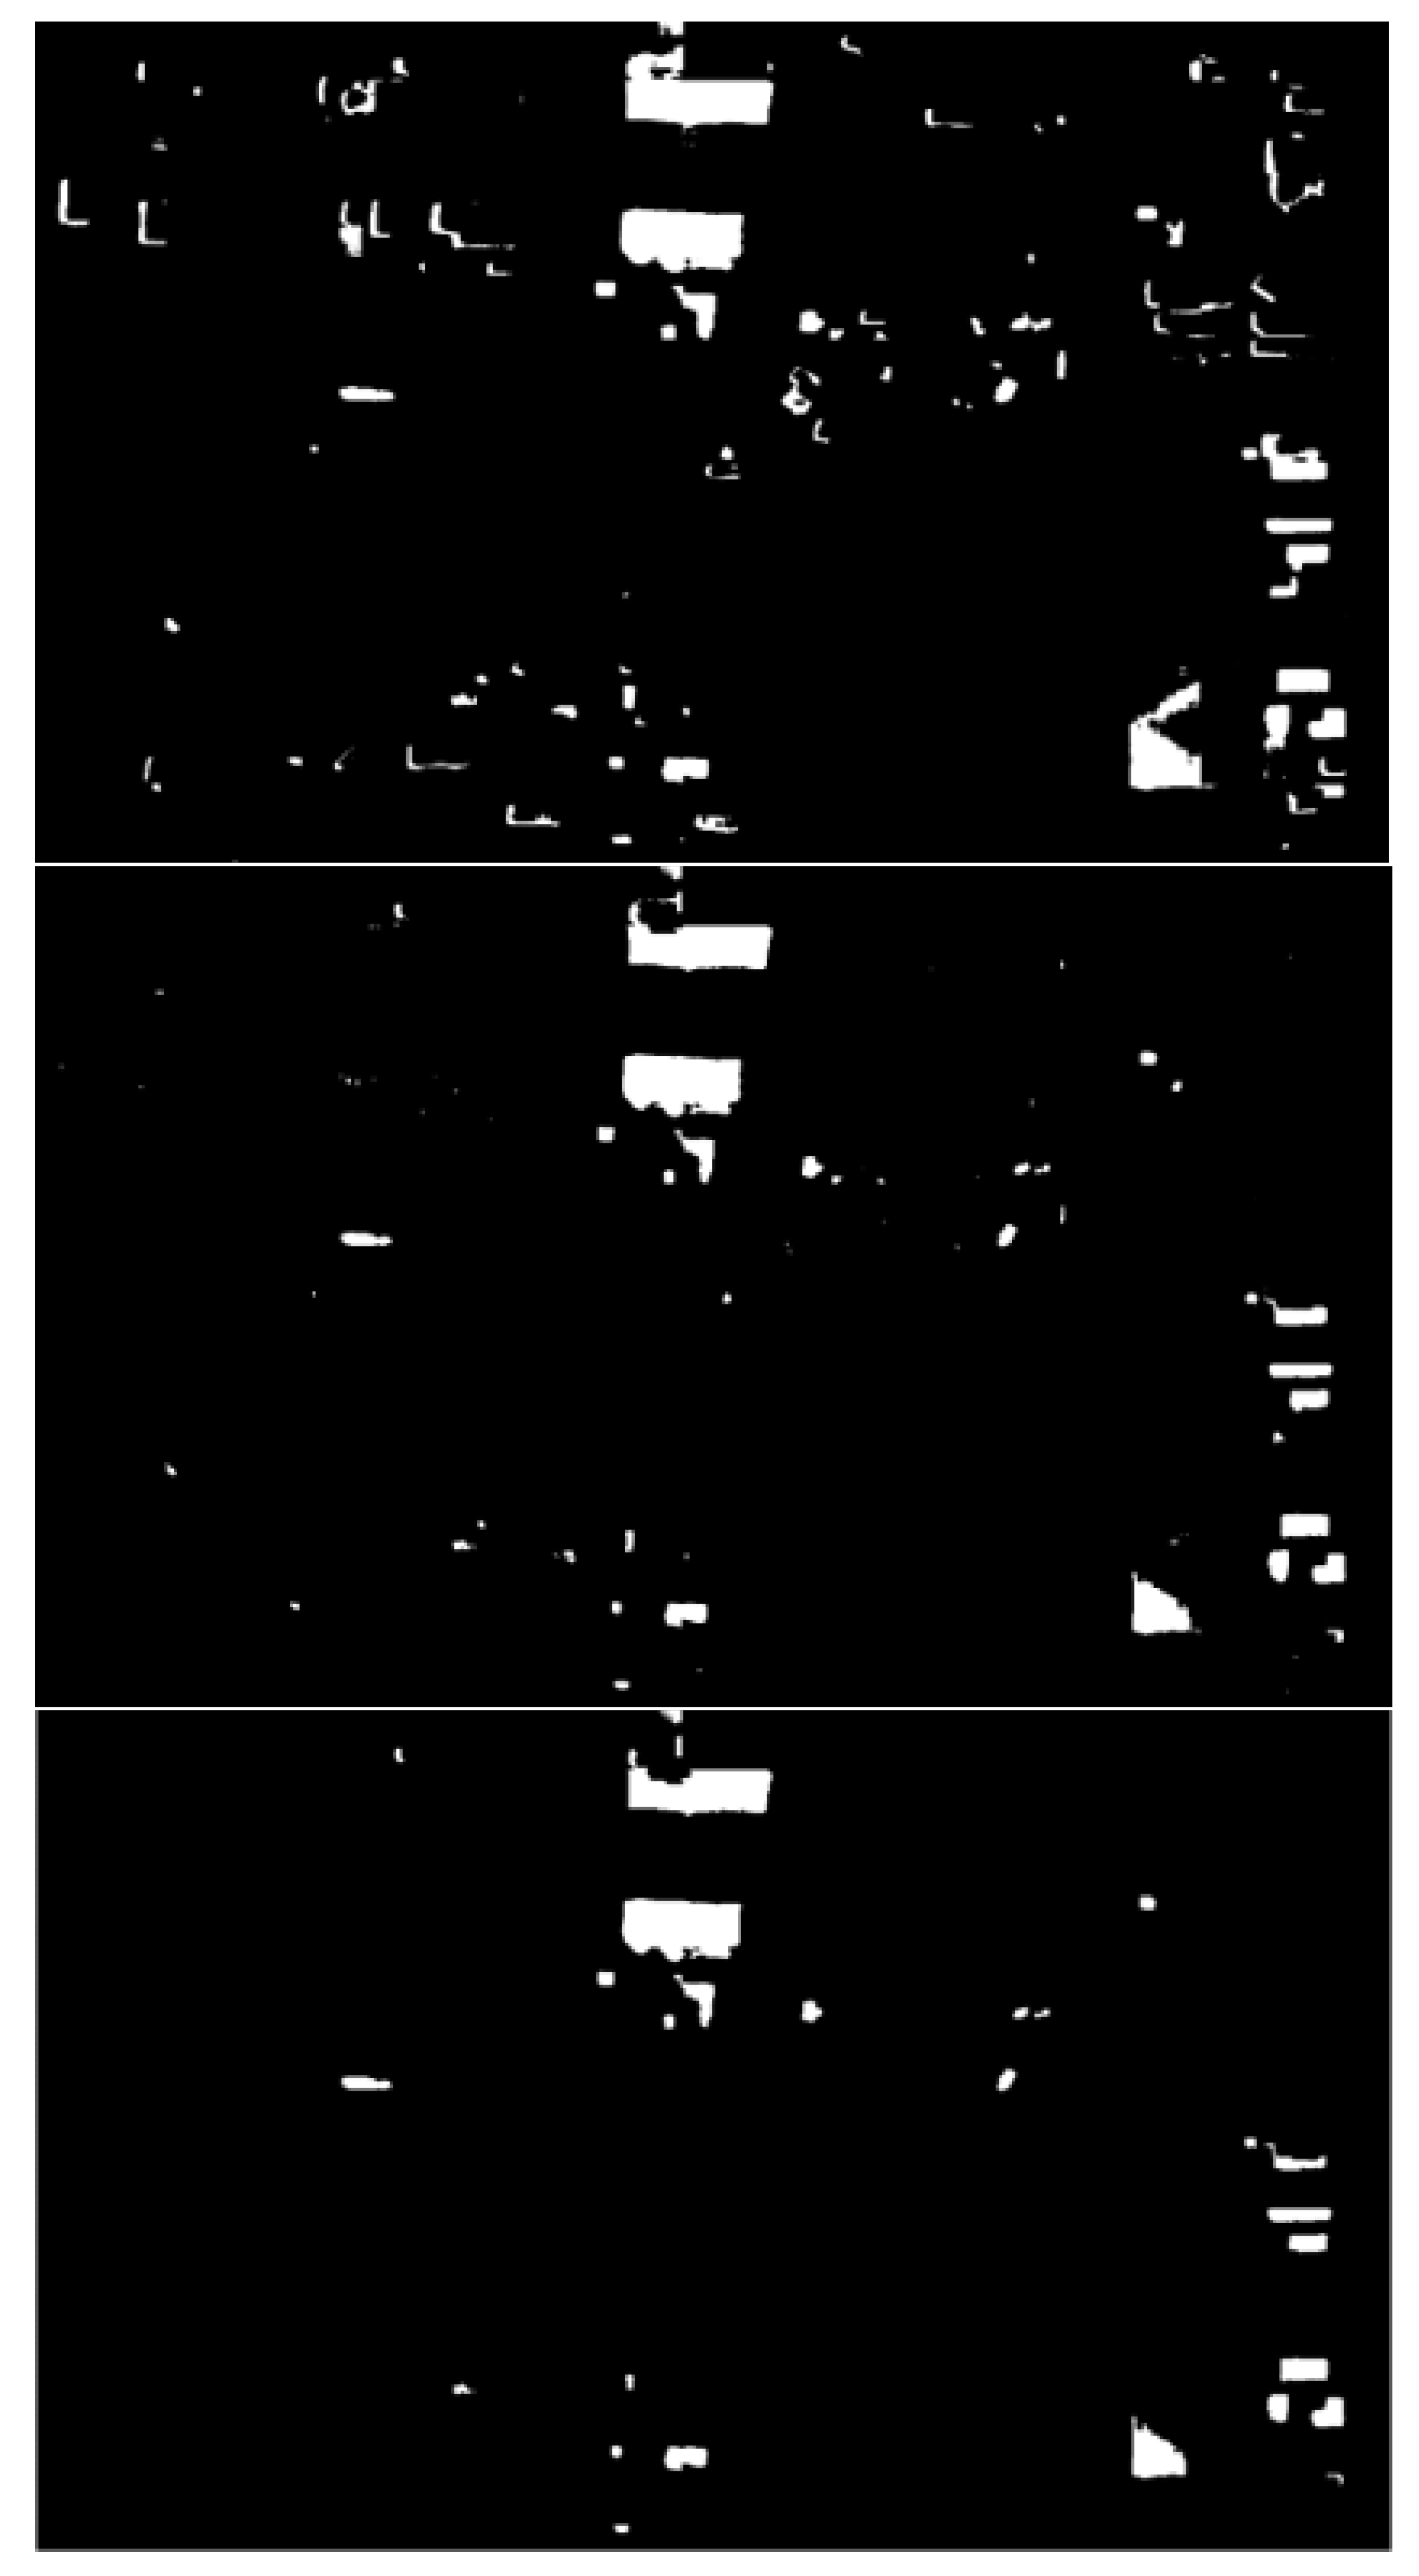
  • Look for all zero-valued pixels in the final map. For each of them, check the corresponding pixels in the pre- and post-event masks. If both equal one, then there exists an intact building that disappeared in the final map (Figure 13), as it should. This occurrence is recorded and used in the next step.
  • At this stage, set to zero a contour of pixels around the recorded intact building.
Setting all surrounding pixels to zero suppresses the false change records due to the change in incidence angle between the two images (i.e., a building facade visible in one image but not in the other). Correctly detected collapsed buildings are left untouched thanks to the first condition (pixels must be zero in both masks). In the general case, the width of the zeroed contour should be adjusted for pixel size and difference in viewing angle.
The problem, however, should be inherently solved if higher resolution, orthorectified images are used, without the need for this additional processing step.
The result of our case study is shown in the middle section of Figure 14: most of the false positives due to the different view angles between the two satellite acquisitions are removed, leaving only a few wrong pixels. At this point, it is possible to apply the first idea of removing all buildings with an area below a threshold, without removing any correctly detected small buildings, because the remaining wrong detection blobs are composed of very few pixels, much fewer than a real building. The final result is shown in the bottom section of Figure 14. As can be seen, now most of the false positives are due to incorrect detection and not to the subtraction step. At this stage, buildings that are only partially collapsed are still correctly detected.

7. Conclusions and Way Forward

In this paper we presented a novel approach to building footprint detection in VHR, multispectral optical satellite data, leveraging existing scientific results and further advancing the recorded performance of a classification scheme based on the U-Net scheme, which represents a popular approach to this class of problems. It has been demonstrated that suitable modifications of the architecture and effective use of data augmentation lead to a novel network configuration that can be trained in a relatively short time and can achieve comparable performances to the existing state-of-the-art solutions, but with simpler processing. Indeed, even if the proposed solution performs slightly worse than the SpaceNet competition winner in highly urbanized areas, it scores better in less urbanized ones. This is a very good result in view of damage assessment applications. In this specific context, indeed, the effectiveness in sparsely, disorderly built areas of less developed countries is more important than in dense urban areas in rich countries; the former, in fact, suffer the most damage from catastrophic events and need the most help. Moreover, whereas the comparison of scores with SpaceNet competition winners shows similar overall figures, the complexity of the proposed solution is significantly lower, resulting in a less computationally demanding solution. Specifically, our network is lighter in terms of GPU memory requirements with respect to [20]—indeed, we use only one GTX 1080-Ti—and it is also faster: in our case, the network takes 1 s to process 30 samples, instead of the 10 samples of [20]. Furthermore, we also achieved good results using a simple architecture on small buildings, contrary to the case of [22]. Generally speaking, our solution achieves good results even without any post-processing step—like in [20]—or a heavy and slow architecture—like in [20,21,22]. This is its best advantage with respect to the other works. In our case, indeed, it is still possible to further improve the network’s performance by appending post-processing steps. The focus of our work was on improving the network architecture, and there is still room for additional improvement by cascading it with some of the techniques mentioned in Section 2, which have been shown to improve prediction accuracy, especially after specific optimization. Specifically, we could:
  • improve network performance by building an ensemble of three different networks, as done in [21,31];
  • use the distance transform to improve the detection accuracy of building boundaries, as done in [22,32] and as also suggested in [30];
  • try and apply in-place activated batch normalization to further reduce GPU memory consumption and thus apply other techniques.
Moving on to the damage mapping application, many problems arose that resulted in a lower final accuracy for the test case. First of all, the available dataset was composed of 3 bands instead of 8, its spatial resolution was 50 cm instead of 30 cm, and it was not orthorectified as the training dataset was. Finally, the pre- and post-event satellite images feature different view angles because they were acquired on different orbits. Despite all these problems, it has been demonstrated that it is possible to create a faithful map of collapsed buildings with a simple post-processing step that fixes those issues to a large extent. Hence, it is possible to improve the final accuracy of this application by using 8-band orthorectified data with a 30 cm spatial resolution and a ground truth dataset on the area of interest with which to train the network to better recognize the type of buildings present in the application area.
While performing this investigation, some directions for future development emerged, which are summarized in the following.
  • The current system was trained on a set of urban sites that are representative of different contexts across the globe but are still too few in number to make the system usable in any context. Given the high cost of VHR multispectral data and the limited availability of ground truth (GT) information, one identified research line is the determination of a minimum set of training sites to ensure satisfactory performances in a broad range of different local contexts. The performances on new sites are expected to improve when adding new items to the training set, until they plateau when a sufficiently diverse training set has been achieved. A full investigation of whether this really happens, and under what terms, is certainly due.
  • Many cases were observed in which the system provided a building map not exactly matching the GT, but visually comparing the apparently incorrect portion of the output with the underlying true color image revealed that the mistake was in the GT rather than in the network output. This may happen because the GT map, generally obtained by visual inspection, is subject to human error due to fatigue or lack of attention to details. Starting from this remark, another challenging research line is an investigation of the possible creation of a second CNN specifically designed to identify mistakes in GT by analyzing the underlying multispectral data in areas where the output map does not match the GT. Where appropriate, the network should raise a flag suggesting further visual inspection and possible correction of the ground truth. Our tests have shown that incorrect GT boundaries come with typical trends in the building recognition network before thresholding, and this will be the starting point for our investigation.
  • In the context of post-disaster assessment, when the timely delivery of information is critical, the earliest post-disaster image is often used even when its resolution and incidence angle is not homogeneous with the nearest pre-event one. In Section 6, an ad hoc solution is developed specifically for a slight mismatch in incidence angles, but the solution should be made more general if the method is to be robust to wider angle differences. Systematic orthorectification is not always feasible, especially in remote areas where an accurate DSM may not be available. A specific research line will investigate the possibility of training the network directly on multi-angle images to accommodate possible differences in viewing angles.
  • Specifically in terms of resolution, another investigation should be conducted made into the impact of the spatial resolution of input data on system performance and whether training and processing of data whose geometric resolution has been altered by up- or down-sampling is still effective.
This work represents a first step in a long-lasting effort to develop an efficient and effective processing chain for building footprint identification and mapping for purposes of disaster-damage mapping. Whereas at the current stage, a suitable structure is identified that makes the procedure inherently efficient and flexible, a substantial amount of additional investigation is still required to make the system more widely usable. Some of the future research lines that should help achieve this goal have been listed and discussed above.

Author Contributions

Conceptualization, G.C.I.; methodology, G.C.I., G.P., F.D.; software, G.P.; validation, G.P.; formal analysis, G.C.I., G.P., F.D.; investigation, G.C.I., G.P.; resources, G.C.I., G.P.; data curation, G.P.; writing—original draft preparation, G.P.; writing—review and editing, F.D.; visualization, G.P.; supervision, F.D.; project administration, G.C.I.; funding acquisition, G.C.I. (Company internal funding).

Funding

This research received no external funding.

Acknowledgments

The authors wish to acknowledge the respective sources of the publicly distributed data that were used in their experiments. Namely: the SpaceNet competion and its respective data contributors for data used in developing and tuning the method; Maxar Technologies Inc. for making available multispectral satellite data on areas stricken by hurricane Michael as a part of their Open Data program.

Conflicts of Interest

The authors declare no conflict of interest.

References

  1. Ostankovich, V.; Afanasyev, I. Illegal Buildings Detection from Satellite Images using GoogLeNet and Cadastral Map. In Proceedings of the 2018 International Conference on Intelligent Systems (IS), Funchal-Madeira, Portugal, 25–27 September 2018; pp. 616–623. [Google Scholar] [CrossRef]
  2. Ural, S.; Hussain, E.; Shan, J. Building population mapping with aerial imagery and GIS data. Int. J. Appl. Earth Obs. Geoinf. 2011, 13, 841–852. [Google Scholar] [CrossRef]
  3. Chesnel, A.; Binet, R.; Wald, L. Object Oriented Assessment of Damage Due to Natural Disaster Using Very High Resolution Images. In Proceedings of the 2007 IEEE International Geoscience and Remote Sensing Symposium, Barcelona, Spain, 23–27 July 2007; pp. 3736–3739. [Google Scholar] [CrossRef]
  4. Brunner, D.; Lemoine, G.; Bruzzone, L. Earthquake Damage Assessment of Buildings Using VHR Optical and SAR Imagery. IEEE Trans. Geosci. Remote Sens. 2010, 48, 2403–2420. [Google Scholar] [CrossRef]
  5. Kim, T.; Muller, J.P. Development of a graph-based approach for building detection. Image Vis. Comput. 1999, 17, 3–14. [Google Scholar] [CrossRef]
  6. Müller, S.; Zaum, D.W. Robust building detection in aerial images. Int. Arch. Photogramm. Remote Sens. 2005, 36, 143–148. [Google Scholar]
  7. Sirmacek, B.; Unsalan, C. Building detection from aerial images using invariant color features and shadow information. In Proceedings of the 2008 23rd International Symposium on Computer and Information Sciences, Istanbul, Turkey, 27–29 October 2008; pp. 1–5. [Google Scholar] [CrossRef]
  8. Sirmacek, B.; Unsalan, C. Urban-Area and Building Detection Using SIFT Keypoints and Graph Theory. IEEE Trans. Geosci. Remote Sens. 2009, 47, 1156–1167. [Google Scholar] [CrossRef]
  9. Gui, R.; Xu, X.; Dong, H.; Song, C.; Pu, F. Individual Building Extraction from TerraSAR-X Images Based on Ontological Semantic Analysis. Remote Sens. 2016, 8, 708. [Google Scholar] [CrossRef]
  10. Ferro, A.; Brunner, D.; Bruzzone, L. Automatic Detection and Reconstruction of Building Radar Footprints From Single VHR SAR Images. IEEE Trans. Geosci. Remote Sens. 2013, 51, 935–952. [Google Scholar] [CrossRef]
  11. Ciecholewski, M. River channel segmentation in polarimetric SAR images: Watershed transform combined with average contrast maximisation. Expert Syst. Appl. 2017, 82, 196–215. [Google Scholar] [CrossRef]
  12. Lang, F.; Yang, J.; Yan, S.; Qin, F. Superpixel Segmentation of Polarimetric Synthetic Aperture Radar (SAR) Images Based on Generalized Mean Shift. Remote Sens. 2018, 10, 1592. [Google Scholar] [CrossRef]
  13. Wieland, M.; Liu, W.; Yamazaki, F. Learning Change from Synthetic Aperture Radar Images: Performance Evaluation of a Support Vector Machine to Detect Earthquake and Tsunami-Induced Changes. Remote Sens. 2016, 8, 792. [Google Scholar] [CrossRef]
  14. Yamazaki, F.; Liu, W.; Kojima, S. Use of airborne sar imagery to extract earthquake damage in urban areas. In Proceedings of the Eleventh U.S. National Conference on Earthquake Engineering Integrating Science, Engineering & Policy, Los Angeles, CA, USA, 25–29 June 2018. [Google Scholar]
  15. Uprety, P.; Yamazaki, F.; Dell’Acqua, F. Damage Detection Using High-Resolution SAR Imagery in the 2009 L’Aquila, Italy, Earthquake. Earthq. Spectra 2013, 29, 1521–1535. [Google Scholar] [CrossRef]
  16. Ronneberger, O.; Fischer, P.; Brox, T. U-Net: Convolutional Networks for Biomedical Image Segmentation. In Medical Image Computing and Computer-Assisted Intervention—MICCAI 2015; Navab, N., Hornegger, J., Wells, W.M., Frangi, A.F., Eds.; Springer International Publishing: Cham, Switzerland, 2015; pp. 234–241. [Google Scholar]
  17. National Centers for Environmental Information, National Oceanic and Atmospheric Administration. Available online: https://www.ncei.noaa.gov/news/national-climate-201812 (accessed on 20 August 2019).
  18. Tomasi, C.; Manduchi, R. Bilateral filtering for gray and color images. In Proceedings of the Sixth International Conference on Computer Vision (IEEE Cat. No.98CH36271), Bombay, India, 7 January 1998; pp. 839–846. [Google Scholar] [CrossRef]
  19. Chaudhuri, D.; Kushwaha, N.K.; Samal, A.; Agarwal, R.C. Automatic Building Detection From High-Resolution Satellite Images Based on Morphology and Internal Gray Variance. IEEE J. Sel. Top. Appl. Earth Obs. Remote Sens. 2016, 9, 1767–1779. [Google Scholar] [CrossRef]
  20. Iglovikov, V.; Seferbekov, S.; Buslaev, A.; Shvets, A. TernausNetV2: Fully Convolutional Network for Instance Segmentation. In Proceedings of the 2018 IEEE/CVF Conference on Computer Vision and Pattern Recognition Workshops (CVPRW), Salt Lake City, UT, USA, 18–22 June 2018; pp. 228–2284. [Google Scholar] [CrossRef]
  21. Hamaguchi, R.; Hikosaka, S. Building Detection from Satellite Imagery using Ensemble of Size-Specific Detectors. In Proceedings of the 2018 IEEE/CVF Conference on Computer Vision and Pattern Recognition Workshops (CVPRW), Salt Lake City, UT, USA, 18–22 June 2018; pp. 223–2234. [Google Scholar] [CrossRef]
  22. Prathap, G.; Afanasyev, I. Deep Learning Approach for Building Detection in Satellite Multispectral Imagery. In Proceedings of the 2018 International Conference on Intelligent Systems (IS), Funchal-Madeira, Portugal, 25–27 September 2018; pp. 461–465. [Google Scholar] [CrossRef]
  23. Andreoni, A.; Dell’Acqua, F.; Freddi, R. A Novel Technique for Building Roof Mapping in Very-High-Resolution Multispectral Satellite Data. In Proceedings of the IGARSS 2018—2018 IEEE International Geoscience and Remote Sensing Symposium, Valencia, Spain, 22–27 July 2018; pp. 1256–1259. [Google Scholar] [CrossRef]
  24. Etten, A.V.; Lindenbaum, D.; Bacastow, T.M. SpaceNet: A Remote Sensing Dataset and Challenge Series. arXiv 2018, arXiv:1807.01232. [Google Scholar]
  25. Bulò, S.R.; Porzi, L.; Kontschieder, P. In-place Activated BatchNorm for Memory-Optimized Training of DNNs. In Proceedings of the 2018 IEEE/CVF Conference on Computer Vision and Pattern Recognition, Salt Lake City, UT, USA, 18–22 June 2018; pp. 5639–5647. [Google Scholar] [CrossRef]
  26. Kingma, D.; Ba, J. Adam: A Method for Stochastic Optimization. In Proceedings of the International Conference on Learning Representations, Banff, AB, Canada, 14–16 April 2014. [Google Scholar]
  27. Hinton, G.; Vinyals, O.; Dean, J. Distilling the Knowledge in a Neural Network. arXiv 2015, arXiv:1503.02531. [Google Scholar]
  28. Ioffe, S.; Szegedy, C. Batch Normalization: Accelerating Deep Network Training by Reducing Internal Covariate Shift. arXiv 2015, arXiv:1502.03167. [Google Scholar]
  29. Neiva, M.B.; Manzanera, A.; Bruno, O.M. Binary Distance Transform to Improve Feature Extraction. arXiv 2016, arXiv:1612.06443. [Google Scholar]
  30. Chhor, G.; Aramburu, C.B. Satellite Image Segmentation for Building Detection Using U-Net; Stanford University Internal Report; Stanford University: Stanford, CA, USA, 2017. [Google Scholar]
  31. Winning Solution for the Spacenet Challenge: Joint Learning with OpenStreetMap. Available online: https://i.ho.lc/winning-solution-for-the-spacenet-challenge-joint-learning-with-openstreetmap.html (accessed on 15 September 2019).
  32. Bischke, B.; Helber, P.; Folz, J.; Borth, D.; Dengel, A. Multi-Task Learning for Segmentation of Building Footprints with Deep Neural Networks. In Proceedings of the 2019 IEEE International Conference on Image Processing (ICIP), Taipei, Taiwan, 22–25 September 2019; pp. 1480–1484. [Google Scholar] [CrossRef]
  33. Badrinarayanan, V.; Kendall, A.; Cipolla, R. SegNet: A Deep Convolutional Encoder-Decoder Architecture for Image Segmentation. IEEE Trans. Pattern Anal. Mach. Intell. 2017, 39, 2481–2495. [Google Scholar] [CrossRef] [PubMed]
  34. Simonyan, K.; Zisserman, A. Very Deep Convolutional Networks for Large-Scale Image Recognition. arXiv 2014, arXiv:1409.1556. [Google Scholar]
  35. Open Data AWS. Available online: https://registry.opendata.aws (accessed on 12 September 2019).
  36. DigitalGlobe. Available online: https://www.digitalglobe.com/ecosystem/open-data (accessed on 17 September 2019).
  37. National Weather Service, National Oceanic and Atmospheric Administration. Available online: https://www.weather.gov/tae/HurricaneMichael2018 (accessed on 5 October 2019).
  38. Ruder, S. An overview of gradient descent optimization algorithms. arXiv 2016, arXiv:1609.04747. [Google Scholar]
  39. Keras Documentation. Available online: https://keras.io/callbacks/ (accessed on 17 August 2019).
  40. SpaceNet Challenge Utilities on Github. Available online: https://github.com/SpaceNetChallenge/utilities/blob/master/python/evaluateScene.py (accessed on 7 September 2019).
Figure 1. Percentage composition of the training + validation set; the test set possesses the same structure.
Remotesensing 11 02803 g001
Figure 2. Damage map of hurricane Michael in Florida. Image from [37]; copyrights of image authors and contributors are fully acknowledged.
Remotesensing 11 02803 g002
Figure 3. Modification applied to the original U-Net architecture: the red box shows the initial layer added, while the yellow one shows layers removed. Different combinations of these added/removed layer were tested to find the best architecture.
Remotesensing 11 02803 g003
Figure 4. Best validation loss and accuracy reached on Rio de Janeiro by the 8-256 model, with different batch sizes.
Remotesensing 11 02803 g004
Figure 5. Best validation loss and accuracy reached on Rio de Janeiro by different architectures, all with a batch size = 2.
Remotesensing 11 02803 g005
Figure 6. Training loss (binary cross-entropy) and accuracy (intersection over union) for the four models.
Remotesensing 11 02803 g006
Figure 7. Validation loss (binary cross-entropy) and accuracy (intersection over union) for the four models.
Remotesensing 11 02803 g007
Figure 8. Best validation loss and accuracy achieved on the whole dataset by different architectures, all with a batch size = 2.
Remotesensing 11 02803 g008
Figure 9. From left to right: RGB image of Rio de Janeiro, ground truth, and predicted mask.
Remotesensing 11 02803 g009
Figure 10. From left to right: RGB image of Las Vegas, ground truth, and predicted mask.
Remotesensing 11 02803 g010
Figure 11. From left to right: RGB image of Khartoum, ground truth, and predicted mask.
Remotesensing 11 02803 g011
Figure 12. From the top down: pre- and post-event satellite images and the generated collapsed building mask.
Remotesensing 11 02803 g012
Figure 13. From left to right: example of a building in the pre-event mask, post-event mask, and final map.
Remotesensing 11 02803 g013
Figure 14. From top to bottom: collapsed building mask resulting from the subtraction operation, after the post-processing algorithm, and after removing the remaining small buildings.
Remotesensing 11 02803 g014
Table 1. Main categories of techniques offering a proven capability to improve the final building-detection accuracy.
MethodologyReferences
Ensemble of models[22,31]
Distance transforms[22,32]
Incorporation of OpenStreetMap data[22,31]
Table 2. Results of the proposed model in terms of both SpaceNet competitions compared to the performances of the respective winners.
RankAuthorLas VegasParisShanghaiKhartoumTotal ScoreRio de Janeiro
1wleite 0.255
2marek.cygan 0.249
3qinhaifang 0.255
1XD_XD0.890.750.60.540.69
2wleite0.830.680.580.480.64
3nofto0.790.580.520.420.58
proposed model0.8050.6810.6480.5970.6830.518
IoU evaluation0.7930.7430.6910.657 0.7

