Farmer Perception, Recollection, and Remote Sensing in Weather Index Insurance: An Ethiopia Case Study

 , ,
, ,
Abstract
:
1. Introduction
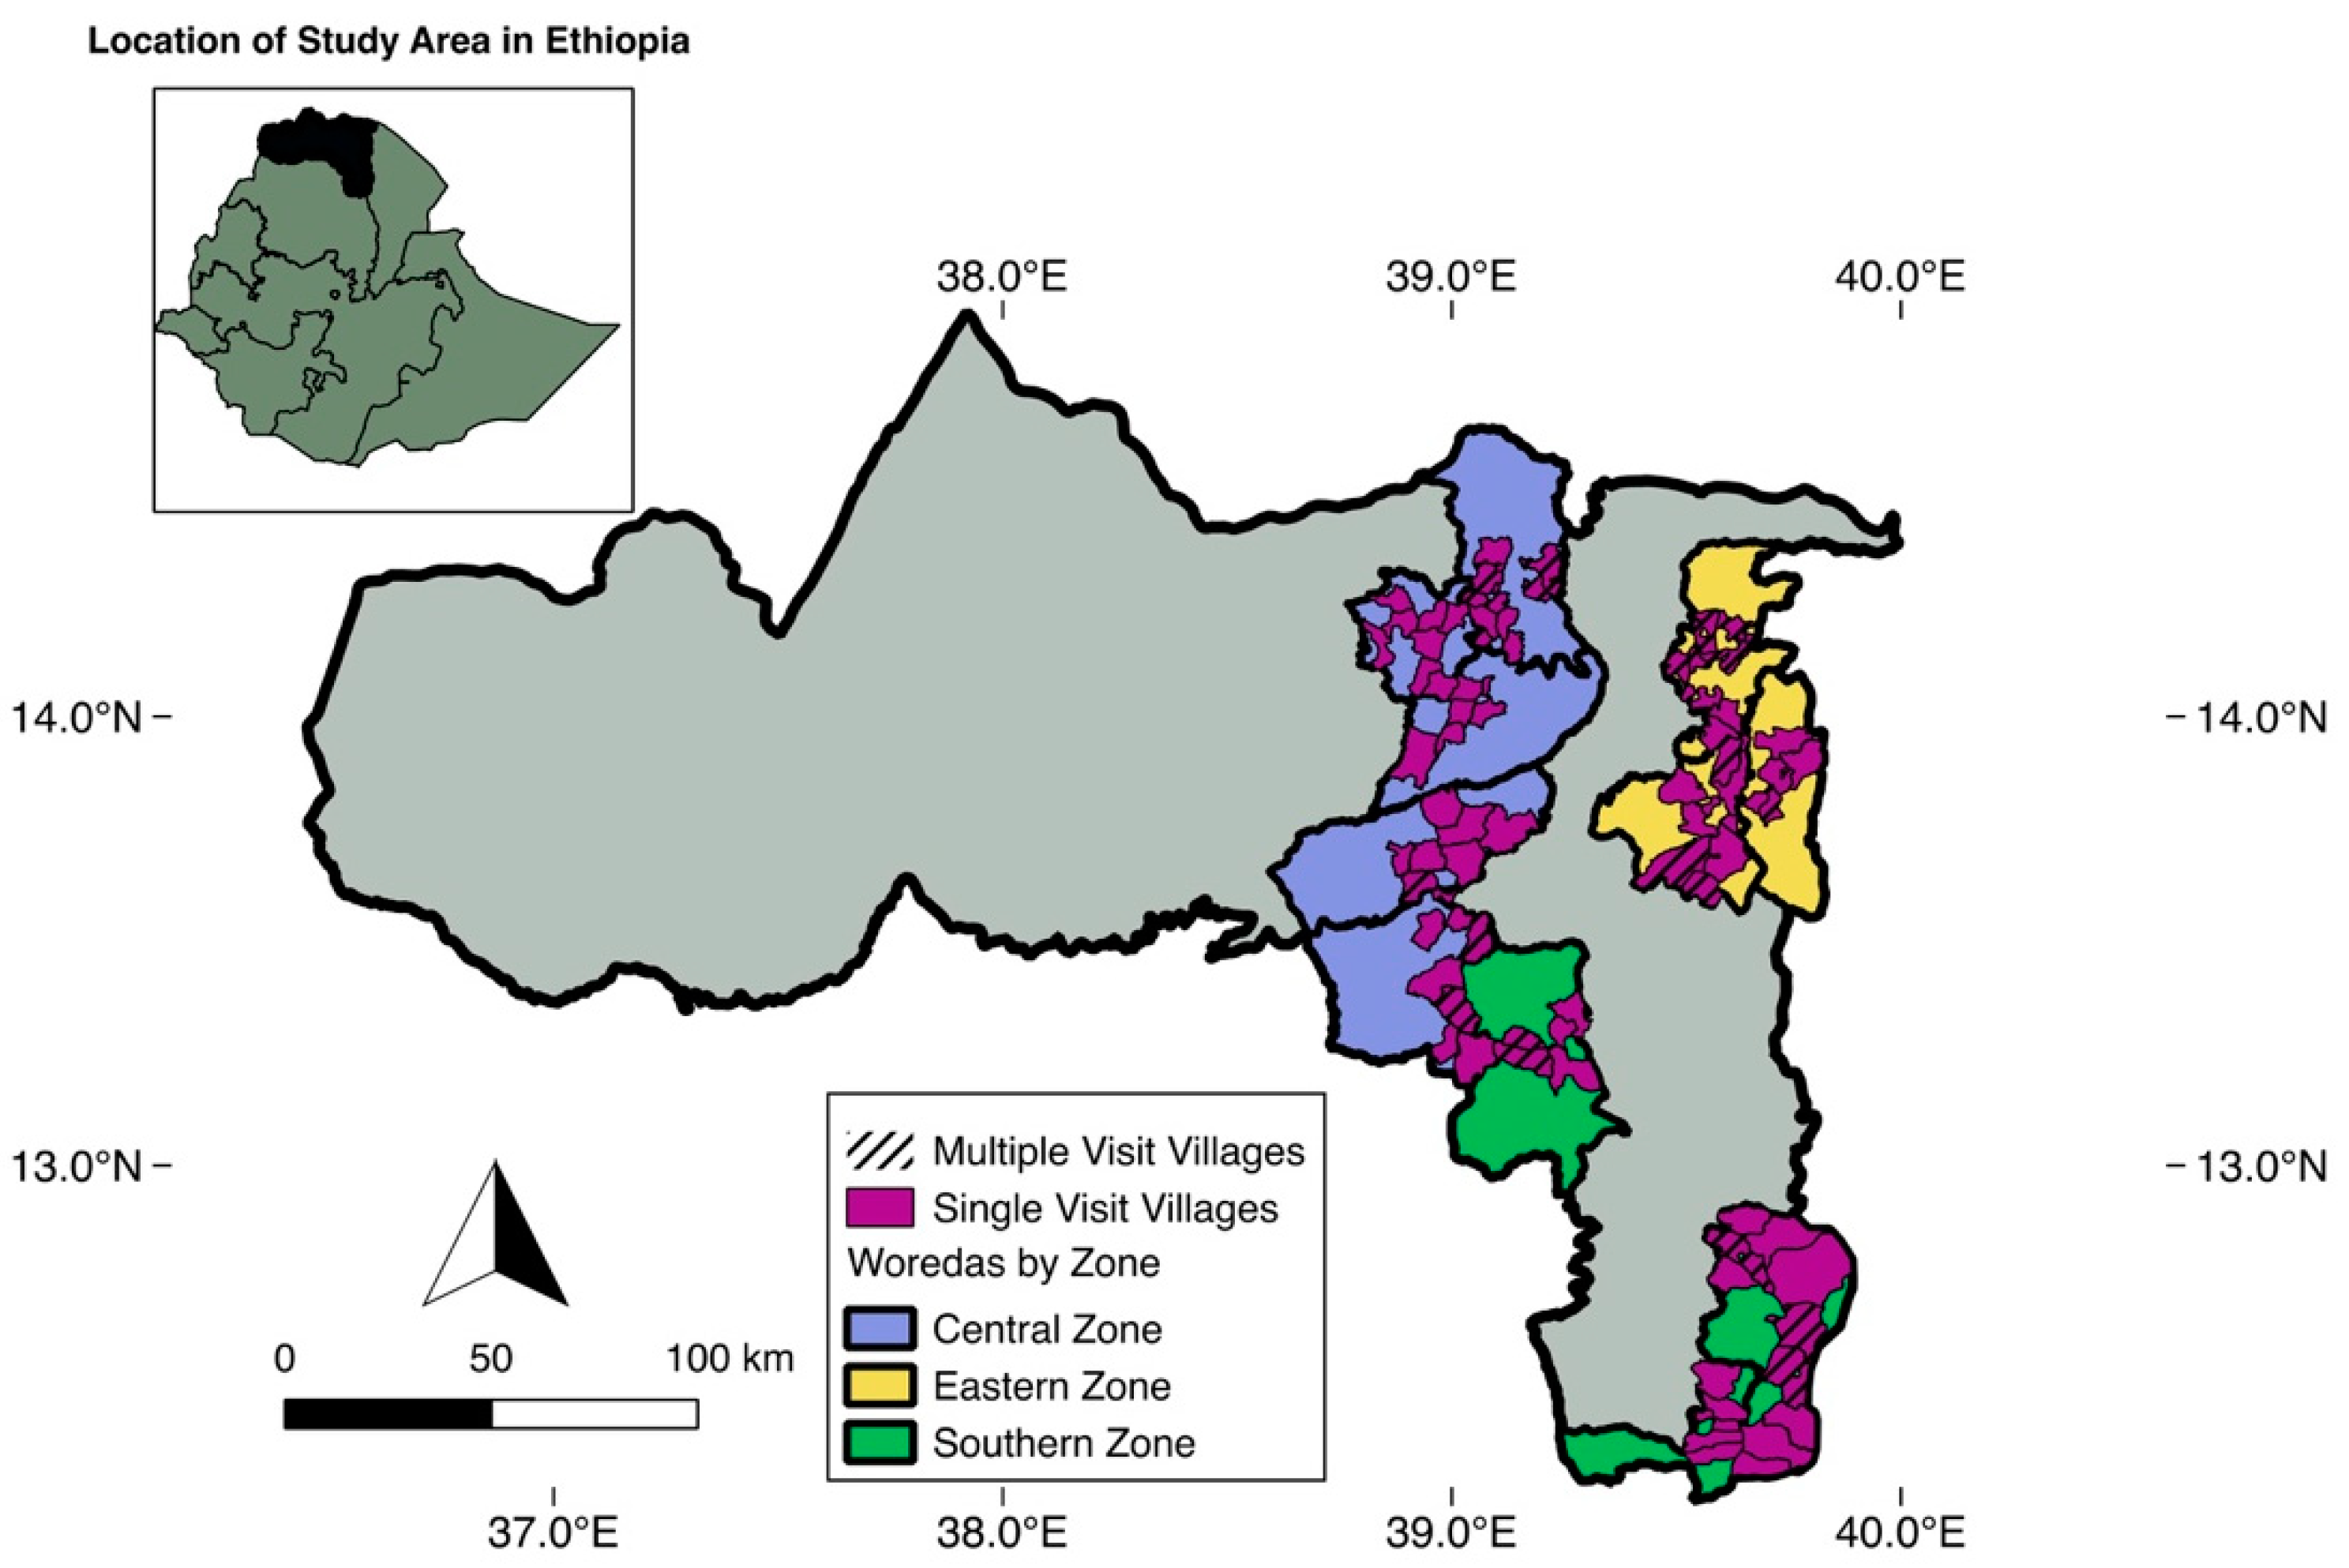
1.1. Case Study
1.2. R4 Rainfall Index Design and Threshold
1.3. Methodological Framework Objective
2. Materials and Methods
2.1. Data Information
2.1.1. Farmer Perception Data
2.1.2. African Rainfall Climatology Version 2 (ARC2) Rainfall Estimates
2.1.3. Climate Hazards Group InfraRed Precipitation with Station Data (CHIRPS)
2.1.4. The Atmosphere–Land Exchange Inverse (ALEXI)
2.1.5. Moderate-Resolution Imaging Spectroradiometer (MODIS), Normalized Difference Vegetation Index (NDVI), Enhanced Vegetation Index (EVI)
2.1.6. Climate Change Initiative (CCI) of the European Space Agency (ESA)—ESA CCI Surface Soil Moisture
2.2. Methodology
Retrieval of Drought Events from Satellite Information
3. Results
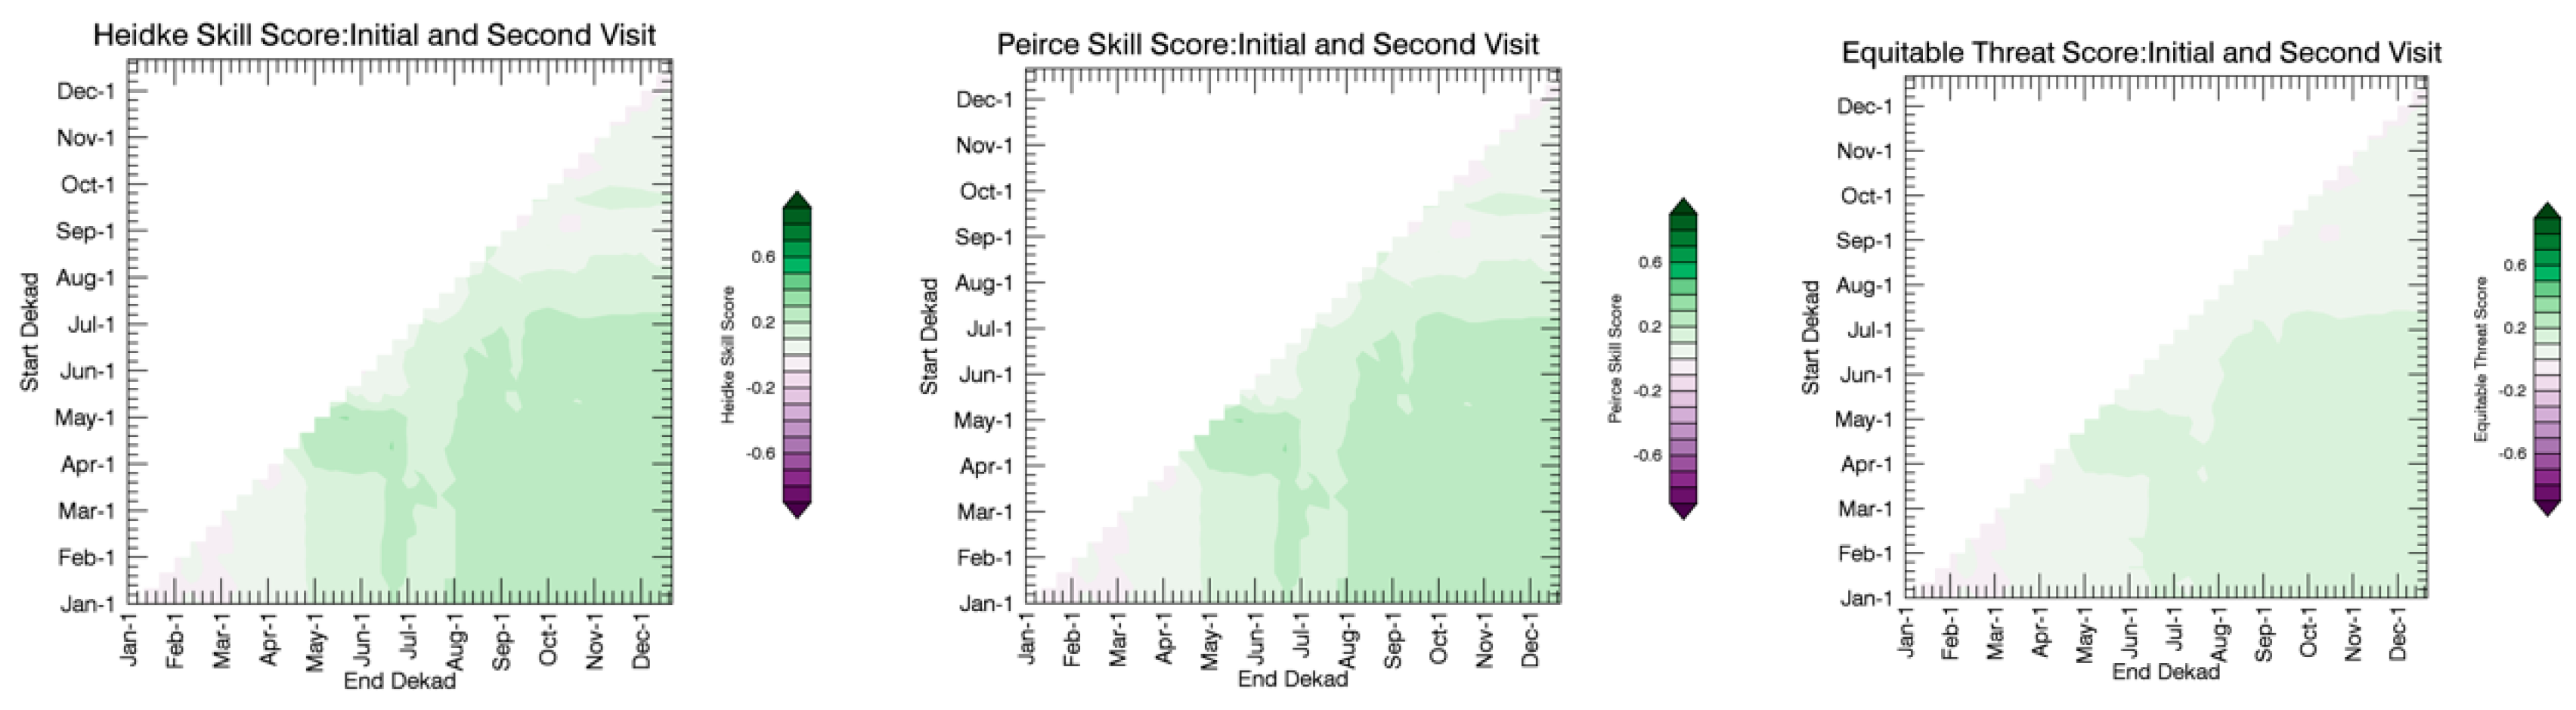
3.1. Temporal Aggregation
3.2. Diagnostics Based on Increasing Sample Size
3.3. Spatial Aggregation
3.4. Extremes Diagnostic
3.5. Broader Suite of Remote Sensing Sources
4. Discussion
5. Conclusions
Author Contributions
Funding
Conflicts of Interest
References
- Hellmuth, M.E.; Osgood, D.E.; Hess, U.; Moorhead, A.; Bhojwani, H. Index Insurance and Climate Risk: Prospects for Development and Disaster Management; International Research Institute for Climate and Society (IRI): New York, NY, USA, 2009. [Google Scholar]
- Sheriff, G.; Osgood, D. Disease Forecasts and Livestock Health Disclosure: A Shepherd’s Dilemma. Am. J. Agric. Econ. 2010, 92, 776–788. [Google Scholar] [CrossRef]
- Stiglitz, J.E. The Theory of “Screening”; Education, and the Distribution of Income. Am. Econ. Rev. 1975, 65, 283–300. [Google Scholar]
- Akerlof, G.A. The Market for “Lemons”: Quality Uncertainty and the Market Mechanism. Q. J. Econ. 1970, 84, 488. [Google Scholar] [CrossRef]
- Jejeebhoy, S.J. Convergence and Divergence in Spouses’ Perspectives on Women’s Autonomy in Rural India. Stud. Fam. Plan. 2002, 33, 299–308. [Google Scholar] [CrossRef]
- Anderson, C.L.; Reynolds, T.W.; Gugerty, M.K. Husband and Wife Perspectives on Farm Household Decision-making Authority and Evidence on Intra-household Accord in Rural Tanzania. World Dev. 2017, 90, 169–183. [Google Scholar] [CrossRef] [PubMed]
- Alwang, J.; Larochelle, C.; Barrera, V. Farm Decision Making and Gender: Results from a Randomized Experiment in Ecuador. World Dev. 2017, 92, 117–129. [Google Scholar] [CrossRef] [Green Version]
- Casaburi, L.; Willis, J. Time vs. State in Insurance: Experimental Evidence from Contract Farming in Kenya. Available online: https://bit.ly/2DKsfyg (accessed on 27 November 2018).
- Kahneman, D.; Tversky, A. Subjective Probability: A Judgment of Representativeness. In The Concept of Probability in Psychological Experiments; Springer: Dordrecht, The Netherlands, 1972; pp. 25–48. [Google Scholar]
- Beegle, K.; Carletto, C.; Himelein, K. Reliability of Recall in Agricultural Data. J. Dev. Econ. 2012, 1, 34–41. [Google Scholar] [CrossRef]
- Fisher, R.J.; Katz, J.E. Social-desirability bias and the validity of self-reported values. Psychol. Mark. 2000, 17, 105–120. [Google Scholar] [CrossRef]
- Bertrand, M.; Mullainathan, S. Do People Mean What They Say? Implications for Subjective Survey Data. Am. Econ. Rev. 2001, 91, 67–72. [Google Scholar] [CrossRef] [Green Version]
- Dillon, A.S.; Gourlay, S.; Mcgee, K.R.; Oseni, G.O. Land Measurement Bias and Its Empirical Implications: Evidence from a Validation Exercise. Available online: https://bit.ly/2DYpZV2 (accessed on 27 November 2018).
- Bound, J.; Brown, C.; Mathiowetz, N. Chapter 59. Measurement Error in Survey Data. Available online: https://bit.ly/2zt7Ryx (accessed on 27 November 2018).
- Allahyari, M.; Ghavami, S.; Daghighi Masuleh, Z.; Michailidis, A.; Nastis, S. Understanding Farmers’ Perceptions and Adaptations to Precipitation and Temperature Variability: Evidence from Northern Iran. Climate 2016, 4, 58. [Google Scholar] [CrossRef]
- Falaki, A.A.; Akangbe, J.A.; Ayinde, O.E. Analysis of Climate Change and Rural Farmers’ Perception in North Central Nigeria. J. Hum. Ecol. 2013, 43, 133–140. [Google Scholar] [CrossRef]
- Ogalleh, S.; Vogl, C.; Eitzinger, J.; Hauser, M.; Ogalleh, S.A.; Vogl, C.R.; Eitzinger, J.; Hauser, M. Local Perceptions and Responses to Climate Change and Variability: The Case of Laikipia District, Kenya. Sustainability 2012, 4, 3302–3325. [Google Scholar] [CrossRef] [Green Version]
- De Leeuw, J.; Vrieling, A.; Shee, A.; Atzberger, C.; Hadgu, K.; Biradar, C.; Keah, H.; Turvey, C.; de Leeuw, J.; Vrieling, A.; et al. The Potential and Uptake of Remote Sensing in Insurance: A Review. Remote Sens. 2014, 6, 10888–10912. [Google Scholar] [CrossRef] [Green Version]
- Cole, S.; Giné, X.; Tobacman, J.; Topalova, P.; Townsend, R.; Vickery, J. Barriers to Household Risk Management: Evidence from India. Am. Econ. J. Appl. Econ. 2013, 5, 104–135. [Google Scholar] [CrossRef] [PubMed] [Green Version]
- Hill, R.V.; Hoddinott, J.; Kumar, N. Adoption of weather-index insurance: Learning from willingness to pay among a panel of households in rural Ethiopia. Agric. Econ. 2013, 44, 385–398. [Google Scholar] [CrossRef]
- ScienceDirect (Online service), H.; Haque, T.; Alderman, H.; Haque, T. Food Policy; Elsevier Science Pub. Co.: Amsterdam, The Netherlands, 2006; Volume 31. [Google Scholar]
- Brown, M.E.; Osgood, D.E.; Carriquiry, M.A. Science-based insurance. Nat. Geosci. 2011, 4, 213–214. [Google Scholar] [CrossRef]
- Greatrex, H.; Hansen, J.; Garvin, S.; Diro, R.; Blakeley, S.; Le Guen, M.; Rao, K.; Osgood, D. Scaling up Index Insurance for Smallholder Farmers: Recent Evidence and Insights CCAFS: CGIAR Research Program on Climate Change, Agriculture and Food Security. Available online: https://bit.ly/2Sf8RgW (accessed on 25 September 2018).
- World Bank. Managing Food Price Risks and Instability in an Environment of Market Liberalization Agriculture and Rural Development Department; World Bank: Washington, DC, USA, 2005. [Google Scholar]
- Banerjee, A.; Duflo, E. Poor Economics A Radical Rethinking of the Way to Fight Global Poverty; PublicAffairs: New York, NY, USA, 2011; p. 144. ISBN 9781610390934. [Google Scholar]
- Binswanger-Mkhize, H.P. Is There Too Much Hype about Index-based Agricultural Insurance? J. Dev. Stud. 2012, 48, 187–200. [Google Scholar] [CrossRef]
- Chantarat, S.; Mude, A.G.; Barrett, C.B.; Carter, M.R. Designing Index-Based Livestock Insurance for Managing Asset Risk in Northern Kenya. J. Risk Insur. 2013, 80, 205–237. [Google Scholar] [CrossRef]
- Gautam, S.C.; Bastian, G.; Vyas, S.; Wendel, C.; Stein, D. The Effectiveness of Index-Based Micro-Insurance in Helping Smallholders Manage Weather-Related Risks. Available online: https://bit.ly/2zv7dAH (accessed on 27 November 2018).
- Norton, M.; Osgood, D.; Madajewicz, M.; Holthaus, E.; Peterson, N.; Diro, R.; Mullally, C.; Teh, T.-L.; Gebremichael, M. Evidence of Demand for Index Insurance: Experimental Games and Commercial Transactions in Ethiopia. J. Dev. Stud. 2014, 50, 630–648. [Google Scholar] [CrossRef]
- Enenkel, M.; Osgood, D.; Anderson, M.; Powell, B.; Mccarty, J.; Neigh, C.; Carroll, M.; Wooten, M.; Husak, G.; Hain, C.; et al. Exploiting the Convergence of Evidence in Satellite Data for Advanced Weather Index Insurance Design. Weather Clim. Soc. 2018. [Google Scholar] [CrossRef]
- Onwonga, R.N.; Sommer, R.; Rubyogo, J.-C.; Mukankusi, C.M.; Mburu, J.; Kariuki, R. Index-Based Agricultural Insurance Products: Challenges, Opportunities and Prospects for Uptake in Sub-SAHARA Africa. J. Agric. Rural Dev. Trop. Subtrop. 2017, 2, 171–185. [Google Scholar]
- Osgood, D.; Stanimirova, R.; Greatrex, H.; Diro, R.; Mccarney, G.; Sharoff, J.; Mann, B.; Louis D’agostino, A.; Rogers-Martinez, M.; Blakeley, S.; et al. Using Satellites to Make Index Insurance Scalable: Final IRI Report to the International Labour Organisation-Microinsurance Innovation Facilityedu/Resources/Publications/Using-Satellites-Scalable-Index-Insurance-IRI-ILO-Report; International Research Institute for Climate and Society (IRI): New York, NY, USA, 2013. [Google Scholar]
- Bone, C.; Alessa, L.; Altaweel, M.; Kliskey, A.; Lammers, R. Assessing the Impacts of Local Knowledge and Technology on Climate Change Vulnerability in Remote Communities. Int. J. Environ. Res. Public Health 2011, 8, 733–761. [Google Scholar] [CrossRef] [PubMed] [Green Version]
- Bandura, A. Human Agency in Social Cognitive Theory. Am. Psychol. 1989, 44, 1175–1184. [Google Scholar] [CrossRef] [PubMed]
- World Food Program. R4 Rural Resilience Initiative 2014 Contents; World Food Program: Rome, Italy, 2018. [Google Scholar]
- Madajewicz, M.; Norton, M. Managing Risks to Agricultural Livelihoods: Impact Evaluation of the Harita Program in Tigray, Ethiopia, 2009–2012; Oxfam America: Washington, DC, USA, 2013. [Google Scholar]
- Janzen, S.A.; Carter, M.R. The Impact of Microinsurance on Asset Accumulation and Human Capital Investments: Evidence from a Drought in Kenya; National Bureau of Economic Research: Cambridge, MA, USA, 2013; Working Paper 19702; Available online: https://www.nber.org/papers/w19702 (accessed on 27 November 2018).
- Mude, A.G. East African Herders Insure against Drought: An Impact Narrative from Kenya and Ethiopia. 2014. Available online: https://www.ilri.org/node/39363 (accessed on 27 November 2018).
- Belay, T.; Araya, A. Grain and biomass yield reduction due to russian wheat aphid on bread wheat in northern ethiopia. Afr. Crop Sci. J. 2015, 23, 197–202. [Google Scholar]
- Lobell, D.B.; Bänziger, M.; Magorokosho, C.; Vivek, B. Nonlinear heat effects on African maize as evidenced by historical yield trials. Nat. Clim. Chang. 2011, 1, 42–45. [Google Scholar] [CrossRef]
- Taddese, G. Land Degradation: A Challenge to Ethiopia. Environ. Manag. 2001, 27, 815–824. [Google Scholar] [CrossRef]
- Antwi-Agyei, P.; Fraser, E.D.G.; Dougill, A.J.; Stringer, L.C.; Simelton, E. Mapping the vulnerability of crop production to drought in Ghana using rainfall, yield and socioeconomic data. Appl. Geogr. 2012, 32, 324–334. [Google Scholar] [CrossRef]
- Mishra, A.; Hansen, J.W.; Dingkuhn, M.; Baron, C.; Traoré, S.B.; Ndiaye, O.; Ward, M.N. Sorghum yield prediction from seasonal rainfall forecasts in Burkina Faso. Agric. For. Meteorol. 2008, 148, 1798–1814. [Google Scholar] [CrossRef]
- Zaal, F.; Dietz, T.; Brons, J.; Geest, K.; Ofori-Sarpong, E. Sahelian Livelihoods on the Rebound. In The Impact of Climate Change on Drylands; Kluwer Academic Publishers: Dordrecht, The Netherlands, 2004; pp. 61–77. [Google Scholar]
- McIntosh, C.; Sarris, A.; Papadopoulos, F. Productivity, credit, risk, and the demand for weather index insurance in smallholder agriculture in Ethiopia. Agric. Econ. 2013, 44, 399–417. [Google Scholar] [CrossRef]
- Hellmuth, M.E.; Moorehead, A.; Thomson, M.C.; Williams, J. Climate Risk Management in Africa: Learning from Practice; International Research Institute for Climate and Society (IRI): New York, NY, USA, 2007. [Google Scholar]
- Novella, N.S.; Thiaw, W.M.; Novella, N.S.; Thiaw, W.M. African Rainfall Climatology Version 2 for Famine Early Warning Systems. J. Appl. Meteorol. Climatol. 2013, 52, 588–606. [Google Scholar] [CrossRef] [Green Version]
- Osgood, D.; McLaurin, M.; Carriquiry, M.; Mishra, A.; Fiondella, F.; Hansen, J.; Peterson, N.; Ward, N.; Malawi, I. Designing Weather Insurance Contracts for Farmers; International Research Institute for Climate and Society (IRI): New York, NY, USA, 2007. [Google Scholar]
- Funk, C.; Peterson, P.; Landsfeld, M.; Pedreros, D.; Verdin, J.; Shukla, S.; Husak, G.; Rowland, J.; Harrison, L.; Hoell, A.; et al. The climate hazards infrared precipitation with stations—A new environmental record for monitoring extremes. Sci. Data 2015, 2, 150066. [Google Scholar] [CrossRef] [PubMed]
- Tarnavsky, E.; Grimes, D.; Maidment, R.; Black, E.; Allan, R.P.; Stringer, M.; Kayitakire, F. Extension of the TAMSAT Satellite-Based Rainfall Monitoring over Africa and from 1983 to Present. J. Appl. Meteorol. Climatol. 2014, 53, 2805–2822. [Google Scholar] [CrossRef]
- Thiemig, V.; Rojas, R.; Zambrano-Bigiarini, M.; Levizzani, V.; De Roo, A. Validation of Satellite-Based Precipitation Products over Sparsely Gauged African River Basins. J. Hydrometeorol. 2012, 13, 1760–1783. [Google Scholar] [CrossRef] [Green Version]
- Dinku, T.; Funk, C.; Peterson, P.; Maidment, R.; Tadesse, T.; Gadain, H.; Ceccato, P. Validation of the CHIRPS satellite rainfall estimates over eastern Africa. Q. J. R. Meteorol. Soc. 2018, 144, 292–312. [Google Scholar] [CrossRef]
- Ramier, D.; Boulain, N.; Cappelaere, B.; Timouk, F.; Rabanit, M.; Lloyd, C.R.; Boubkraoui, S.; Métayer, F.; Descroix, L.; Wawrzyniak, V. Towards an understanding of coupled physical and biological processes in the cultivated Sahel—1. Energy and water. J. Hydrol. 2009, 375, 204–216. [Google Scholar] [CrossRef]
- Redelsperger, J.-L.; Thorncroft, C.D.; Diedhiou, A.; Lebel, T.; Parker, D.J.; Polcher, J.; Redelsperger, J.-L.; Thorncroft, C.D.; Diedhiou, A.; Lebel, T.; et al. African Monsoon Multidisciplinary Analysis: An International Research Project and Field Campaign. Bull. Am. Meteorol. Soc. 2006, 87, 1739–1746. [Google Scholar] [CrossRef] [Green Version]
- Grimes, D.I.; Pardo-Igúzquiza, E.; Bonifacio, R. Optimal areal rainfall estimation using raingauges and satellite data. J. Hydrol. 1999, 222, 93–108. [Google Scholar] [CrossRef]
- Rembold, F.; Atzberger, C.; Savin, I.; Rojas, O.; Rembold, F.; Atzberger, C.; Savin, I.; Rojas, O. Using Low Resolution Satellite Imagery for Yield Prediction and Yield Anomaly Detection. Remote Sens. 2013, 5, 1704–1733. [Google Scholar] [CrossRef] [Green Version]
- Eastwood, C.; Kenny, S. Art or Science? Heuristic versus Data Driven Grazing Management on Dairy Farms. Exten. Farm. Sys. J. 2009, 5, 95–102. [Google Scholar]
- Wang, K.; Franklin, S.E.; Guo, X.; He, Y.; McDermid, G.J. Problems in remote sensing of landscapes and habitats. Prog. Phys. Geogr. 2009, 33, 747–768. [Google Scholar] [CrossRef]
- Ayehu, G.T.; Tadesse, T.; Gessesse, B.; Dinku, T. Validation of new satellite rainfall products over the Upper Blue Nile Basin, Ethiopia. Atmos. Meas. Tech. 1921, 11. [Google Scholar] [CrossRef]
- West, C.T.; Roncoli, C.; Ouattara, F. Local perceptions and regional climate trends on the Central Plateau of Burkina Faso. Land Degrad. Dev. 2008, 19, 289–304. [Google Scholar] [CrossRef]
- De Wit, A.J.W.; van Diepen, C.A. Crop growth modelling and crop yield forecasting using satellite-derived meteorological inputs. Int. J. Appl. Earth Obs. Geoinf. 2008, 10, 414–425. [Google Scholar] [CrossRef]
- Reynolds, C.A.; Yitayew, M.; Slack, D.C.; Hutchinson, C.F.; Huete, A.; Petersen, M.S. Estimating crop yields and production by integrating the FAO Crop Specific Water Balance model with real-time satellite data and ground-based ancillary data. Int. J. Remote Sens. 2000, 21, 3487–3508. [Google Scholar] [CrossRef]
- Toté, C.; Patricio, D.; Boogaard, H.; van der Wijngaart, R.; Tarnavsky, E.; Funk, C.; Toté, C.; Patricio, D.; Boogaard, H.; van der Wijngaart, R.; et al. Evaluation of Satellite Rainfall Estimates for Drought and Flood Monitoring in Mozambique. Remote Sens. 2015, 7, 1758–1776. [Google Scholar] [CrossRef] [Green Version]
- Hessels, T.M. Comparison and Validation of Several Open Access Remotely Sensed Rainfall Products for the Nile Basin. Master’s Thesis, Delft University of Technology, Delft, The Netherlands.
- Maidment, R.I.; Grimes, D.; Black, E.; Tarnavsky, E.; Young, M.; Greatrex, H.; Allan, R.P.; Stein, T.; Nkonde, E.; Senkunda, S.; Alcántara, E.M.U. A new, long-term daily satellite-based rainfall dataset for operational monitoring in Africa. Sci. Data 2017, 4, 170063. [Google Scholar] [CrossRef] [PubMed] [Green Version]
- Enenkel, M.; Osgood, D.; Anderson, M.; Powell, B.; McCarty, J.; Neigh, C.; Carroll, M.; Wooten, M.; Husak, G.; Hain, C.; et al. Exploiting the convergence of evidence in satellite data for advanced weather index insurance design. Weather. Clim. Soc. 2018. [Google Scholar] [CrossRef]
- Anderson, M.C.; Kustas, W.P.; Norman, J.M.; Hain, C.R.; Mecikalski, J.R.; Schultz, L.; González-Dugo, M.P.; Cammalleri, C.; d’Urso, G.; Pimstein, A.; et al. Mapping daily evapotranspiration at field to continental scales using geostationary and polar orbiting satellite imagery. Hydrol. Earth Syst. Sci. 2011, 15, 223–239. [Google Scholar] [CrossRef] [Green Version]
- Yilmaz, A.G.; Hossain, I.; Perera, B.J.C. Effect of climate change and variability on extreme rainfall intensity–frequency–duration relationships: A case study of Melbourne. Hydrol. Earth Syst. Sci. 2014, 18, 4065–4076. [Google Scholar] [CrossRef]
- FESA MICRO-INSURANCE Crop Insurance Reaching Every Farmer in Africa Final Report EARS Earth Environment Monitoring-Delft FOOD EARLY SOLUTIONS FOR AFRICA (FESA); Scientific Final Report of Millennium Agreements Project no. 38. Commissioned by the Netherlands Ministry of Foreign Affairs, Directorate Sustainable Economic Development (DDE); EARS Earth Environment Monitoring: BV, Delft, The Netherlands, 2014.
- Wiegand, C.L.; Richardson, A.J. Spectral components analysis Rationale, and results for three crops. Int. J. Remote Sens. 1987, 8, 1011–1032. [Google Scholar] [CrossRef]
- Fuller, D.O. Trends in NDVI time series and their relation to rangeland and crop production in Senegal, 1987–1993. Int. J. Remote Sens. 1998, 19, 2013–2018. [Google Scholar] [CrossRef]
- Rasmussen, M.S. Developing simple, operational, consistent NDVI-vegetation models by applying environmental and climatic information: Part I. Assessment of net primary production. Int. J. Remote Sens. 1998, 19, 97–117. [Google Scholar] [CrossRef]
- Huete, A.; Didan, K.; Miura, T.; Rodriguez, E.; Gao, X.; Ferreira, L. Overview of the radiometric and biophysical performance of the MODIS vegetation indices. Remote Sens. Environ. 2002, 83, 195–213. [Google Scholar] [CrossRef]
- Klisch, A.; Atzberger, C.; Klisch, A.; Atzberger, C. Operational Drought Monitoring in Kenya Using MODIS NDVI Time Series. Remote Sens. 2016, 8, 267. [Google Scholar] [CrossRef]
- Enenkel, M.; See, L.; Bonifacio, R.; Boken, V.; Chaney, N.; Vinck, P.; You, L.; Dutra, E.; Anderson, M. Drought and food security—Improving decision-support via new technologies and innovative collaboration. Glob. Food Sec. 2015, 4, 51–55. [Google Scholar] [CrossRef]
- Enenkel, M.; Osgood, D.; Powell, B. Chapt. 4 The Added Value of Satellite Soil Moisture for Agricultural Index Insurance. In Remote Sensing of Hydrometeorological Hazards; Petropoulos, G., Islam, T., Eds.; CRC Press: Boca Raton, FL, USA, 2017; pp. 69–81. ISBN 9781498777599. [Google Scholar]
- Liu, Y.Y.; Parinussa, R.M.; Dorigo, W.A.; De Jeu, R.A.M.; Wagner, W.; Van Dijk, A.I.J.M.; Mccabe, M.F.; Evans, J.P. Hydrology and Earth System Sciences Developing an improved soil moisture dataset by blending passive and active microwave satellite-based retrievals. Hydrol. Earth Syst. Sci. 2011, 15, 425–436. [Google Scholar] [CrossRef] [Green Version]
- Wagner, W.; Dorigo, W.; de Jeu, R.; Fernandez, D.; Benveniste, J.; Haas, E.; Ertl, M. Fusion of Active and Passive Microwave Observations to Create AN Essential Climate Variable Data Record on Soil Moisture. ISPRS Ann. Photogramm. Remote Sens. Spat. Inf. Sci. 2012, 7, 315–321. [Google Scholar] [CrossRef]
- McNally, A.; Shukla, S.; Arsenault, K.R.; Wang, S.; Peters-Lidard, C.D.; Verdin, J.P. Evaluating ESA CCI soil moisture in East Africa. Int. J. Appl. Earth Obs. Geoinf. 2016, 48, 96–109. [Google Scholar] [CrossRef] [PubMed] [Green Version]
- Dorigo, W.; Wagner, W.; Albergel, C.; Albrecht, F.; Balsamo, G.; Brocca, L.; Chung, D.; Ertl, M.; Forkel, M.; Gruber, A.; et al. ESA CCI Soil Moisture for improved Earth system understanding: State-of-the art and future directions. Remote Sens. Environ. 2017, 203, 185–215. [Google Scholar] [CrossRef]
- Enenkel, M.; Reimer, C.; Dorigo, W.; Wagner, W.; Pfeil, I.; Parinussa, R.; De Jeu, R. Combining satellite observations to develop a daily global soil moisture product for a wide range of applications. Hydrol. Earth Syst. Sci. Discuss. 2015, 12, 11549–11589. [Google Scholar] [CrossRef]
- Brier, G.W.; Allen, R.A. Verification of Weather Forecasts. In Compendium of Meteorology; American Meteorological Society: Boston, MA, USA, 1951; pp. 841–848. [Google Scholar]
- Enenkel, M.; Farah, C.; Hain, C.; White, A.; Anderson, M.; You, L.; Wagner, W.; Osgood, D.; Enenkel, M.; Farah, C.; et al. What Rainfall Does Not Tell Us—Enhancing Financial Instruments with Satellite-Derived Soil Moisture and Evaporative Stress. Remote Sens. 2018, 10, 1819. [Google Scholar] [CrossRef]
- Bremer, S.; Meisch, S. Co-production in climate change research: Reviewing different perspectives. Wiley Interdiscip. Rev. Clim. Chang. 2017, 8, e482. [Google Scholar] [CrossRef]
- Montoyo, A.; Martínez-Barco, P.; Balahur, A. Subjectivity and sentiment analysis: An overview of the current state of the area and envisaged developments. Decis. Support Syst. 2012, 53, 675–679. [Google Scholar] [CrossRef]


| Name | Description | Period/Spatial Resolution Used in This Study |
|---|---|---|
| Farmer perception of dry years | Farmer discussions | 1983–2016 Community level |
| African rainfall climatology version 2 (ARC2) Rainfall Estimates | Satellite-derived dataset from NOAA | 1983–2016 10 km resolution |
| Climate hazards group infrared precipitation with station data (CHIRPS) rainfall estimates | Satellite-derived and gauge data merge dataset | 1983–2016 5 km resolution |
| Moderate-resolution imaging spectroradiometer (MODIS), normalized difference vegetation index (NDVI) | Vegetation greenness index from MODIS Terra | 2000–2016 250 m resampled to 10 km resolution |
| Moderate-resolution imaging spectroradiometer (MODIS) enhanced vegetation index (EVI) | Vegetation greenness index from MODIS terra | 2000–2016 250 m resampled to 10 km resolution |
| The atmosphere–land exchange inverse (ALEXI model) evapotranspiration (ET) | ET used in ALEXI model | 2000–2013 4 km resolution |
| Climate Change Initiative (CCI) of the European Space Agency (ESA) soil moisture | Satellite-derived surface soil moisture estimates provided via the Climate Change Initiative of the European Space Agency | 2000–2016 0.25 degree resolution |
| DEP Variable | Village Bad Year | ||
|---|---|---|---|
| Time | First Visit | Second Visit | First + Second |
| Early Rainfall | −0.00761 *** | −0.000964 | −0.00492 *** |
| (0.00251) | (0.00197) | (0.00175) | |
| Late Rainfall | −0.00199 | −0.00904 *** | −0.00653 *** |
| (0.00201) | (0.00228) | (0.00170) | |
| Constant | −1.157 *** | −0.907 *** | −0.0979 |
| (0.234) | (0.233) | (0.191) | |
| Observations | 693 | 693 | 693 |
| Pseudo R2 | 0.0212 | 0.0311 | 0.0308 |
| Logit Hits | 26 | 27 | 75 |
| p-value X2 | 0.999331 | 0.99975686 | 0.00344567 |
| Bad Years | 105 | 104 | 193 |
| DEP Variable | Village Bad Year |
|---|---|
| Time | Village |
| Early Rainfall | –0.0115 *** |
| (0.00151) | |
| Late Rainfall | –0.00493 *** |
| (0.000960) | |
| Constant | –0.693 *** |
| (0.124) | |
| Observations | 2,673 |
| Pseudo R2 | 0.0445 |
| Logit Hits | 91 |
| p-value X2 | 1 |
| Bad Years | 416 |
| DEP Variable | Bad Year First and Second | |||
|---|---|---|---|---|
| Time | Village | Woreda | Zone | Tigray |
| Early Rainfall | −0.00492 *** | −0.00181 | −0.00224 | 0.00845 |
| (0.00175) | (0.00234) | (0.00453) | (0.0174) | |
| Late Rainfall | −0.00653 *** | −0.00761 *** | −0.0159 *** | −0.0229 * |
| (0.00170) | (0.00248) | (0.00517) | (0.0129) | |
| Constant | −0.0979 | 0.537 * | 2.178 *** | 3.214 ** |
| (0.191) | (0.301) | (0.629) | (1.497) | |
| Observations | 693 | 264 | 99 | 33 |
| Pseudo R2 | 0.0308 | 0.0306 | 0.0829 | 0.112 |
| Logit Hits | 75 | 56 | 43 | 24 |
| p-value X2 | 0.00344567 | 0.00024069 | 0.04361193 | 0.45069452 |
| Bad Years | 193 | 111 | 61 | 26 |
| DEP Variable | Bad Years First and Second |
|---|---|
| Time | Village |
| Early Pay Out | 0.00590 * |
| (0.00351) | |
| Late Pay Out | 0.0107 *** |
| (0.00352) | |
| Constant | –1.126 *** |
| (0.101) | |
| Observations | 693 |
| Pseudo R2 | 0.0151 |
| Logit Hits | 73 |
| p-value X2 | 0.00128046 |
| Bad Years | 193 |
| DEP Variable | Village Bad Years First and Second Visit | |||||
|---|---|---|---|---|---|---|
| Early ARC | −0.00492 *** | - | - | - | - | - |
| (0.00175) | ||||||
| Late ARC | −0.00653 *** | - | - | - | - | - |
| (0.00170) | ||||||
| Early CHIRPS | - | −0.00556 *** | - | - | - | - |
| (0.00193) | ||||||
| Late CHIRPS | - | −0.00139 | - | - | - | - |
| (0.0231) | ||||||
| Early ALEXI | - | - | 0.0263 | - | - | - |
| (0.0177) | ||||||
| Late ALEXI | - | - | −0.00722 | - | - | - |
| (0.00966) | ||||||
| Early EVI | - | - | - | −0.975 | - | - |
| (1.576) | ||||||
| Late EVI | - | - | - | −9.161 *** | - | - |
| (3.130) | ||||||
| Early NDVI | - | - | - | - | −1.353 | - |
| (1.246) | ||||||
| Late NDVI | - | - | - | - | −7.412 *** | - |
| (1.999) | ||||||
| Early ESA CCI | - | - | - | - | - | 0.737 |
| (1.552) | ||||||
| Late ESA CCI | - | - | - | - | - | −5.674 * |
| (3.383) | ||||||
| Constant | −0.0979 | −0.701 *** | −1.075 ** | 1.588 ** | 2.425 *** | −0.0200 |
| (0.191) | (0.222) | (0.467) | (0.795) | (0.890) | (0.385) | |
| Observations | 693 | 693 | 651 | 336 | 336 | 328 |
| Pseudo R2 | 0.0308 | 0.0117 | 0.00287 | 0.0232 | 0.0370 | 0.0104 |
| Logit hits | 75 | 57 | 60 | 42 | 44 | 37 |
| p-value X2 | 0.00344567 | 0.00101756 | 0.00011416 | 0.00232766 | 0.00422679 | 0.00185025 |
| Bad Years | 193 | 193 | 193 | 107 | 107 | 107 |
© 2018 by the authors. Licensee MDPI, Basel, Switzerland. This article is an open access article distributed under the terms and conditions of the Creative Commons Attribution (CC BY) license (http://creativecommons.org/licenses/by/4.0/).
Share and Cite
Osgood, D.; Powell, B.; Diro, R.; Farah, C.; Enenkel, M.; Brown, M.E.; Husak, G.; Blakeley, S.L.; Hoffman, L.; McCarty, J.L. Farmer Perception, Recollection, and Remote Sensing in Weather Index Insurance: An Ethiopia Case Study. Remote Sens. 2018, 10, 1887. https://doi.org/10.3390/rs10121887
Osgood D, Powell B, Diro R, Farah C, Enenkel M, Brown ME, Husak G, Blakeley SL, Hoffman L, McCarty JL. Farmer Perception, Recollection, and Remote Sensing in Weather Index Insurance: An Ethiopia Case Study. Remote Sensing. 2018; 10(12):1887. https://doi.org/10.3390/rs10121887
Chicago/Turabian StyleOsgood, Daniel, Bristol Powell, Rahel Diro, Carlos Farah, Markus Enenkel, Molly E. Brown, Greg Husak, S. Lucille Blakeley, Laura Hoffman, and Jessica L. McCarty. 2018. "Farmer Perception, Recollection, and Remote Sensing in Weather Index Insurance: An Ethiopia Case Study" Remote Sensing 10, no. 12: 1887. https://doi.org/10.3390/rs10121887