Article

Absolute Calibration of the European Sentinel-3A Surface Topography Mission over the Permanent Facility for Altimetry Calibration in west Crete, Greece

1
Geodesy and Geomatics Engineering Laboratory, Technical University of Crete, GR-73100 Chania, Greece
2
European Space Agency/European Space Research and Technology Centre (ESA/ESTEC), Keplerlaan 1, 2201 AZ Noordwijk, The Netherlands
3
European Space Agency/European Space Research Institute (ESA/ESRIN), Via Galileo Galilei, I-00044 Frascati, Italy
4
Space Geomatica P.C., Xanthoudidou 10A, GR-73132 Chania, Greece
5
Department of Geodesy and Surveying, Aristotle University of Thessaloniki, University Box 440, 54124 Thessaloniki, Greece
6
Centre National d’ Etudes Spatiales (CNES), 31401 Toulouse, CEDEX, France
*
Author to whom correspondence should be addressed.
Remote Sens. 2018, 10(11), 1808; https://doi.org/10.3390/rs10111808
Submission received: 20 October 2018 / Accepted: 13 November 2018 / Published: 15 November 2018
(This article belongs to the Special Issue Radar Remote Sensing of Oceans and Coastal Areas)

Abstract

:
This work presents calibration results for the altimeter of Sentinel-3A Surface Topography Mission as determined at the Permanent Facility for Altimetry Calibration in west Crete, Greece. The facility has been providing calibration services for more than 15 years for all past (i.e., Envisat, Jason-1, Jason-2, SARAL/AltiKa, HY-2A) and current (i.e., Sentinel-3A, Sentinel-3B, Jason-3) satellite altimeters. The groundtrack of the Pass No.14 of Sentinel-3A ascends west of the Gavdos island and continues north to the transponder site on the mountains of west Crete. This pass has been calibrated using three independent techniques activated at various sites in the region: (1) the transponder approach for its range bias, (2) the sea-surface method for the estimation of altimeter bias for its sea-surface heights, and (c) the cross-over analysis for inspecting height observations with respect to Jason-3. The other Pass No.335 of Sentinel-3A descends from southwest of Crete to south and intersects the Gavdos calibration site. Additionally, calibration values for this descending pass are presented, applying sea-surface calibration and crossover analysis. An uncertainty analysis for the altimeter biases derived by the transponder and by sea-surface calibrations is also introduced following the new standard of Fiducial Reference Measurements.

1. Introduction

For several decades, international satellite Earth Observation (EO) programs have demonstrated their capacity to serve both scientific and societal needs. Currently, 60 agencies from all over the world are operating 154 satellites [1]. Copernicus is the European EO program that relies upon an open and free-of-charge data policy for improving European citizens’ welfare and environmental protection. It is the world’s largest single EO program, a huge European investment that, although not fully operational, already produces a clear economic impact. For every 1 Euro that is spent in the Copernicus program a total of 1.39 Euro of added value is produced in the European economy [2].
The Sentinel satellites are the means to provide the foreseen set of observations for the Copernicus program. They consist of six different satellite families (Sentinel-1 to Sentinel-6 and, in the future, to be extended up to Sentinel-9 series) designed to serve different Copernicus services (atmosphere, land, climate change, emergency management, security, marine environment). The Sentinel-3 family contributes to the Copernicus Marine Services by measuring variables such as sea-surface topography, ocean and land color, and temperature to support operational oceanography and environmental and climate change monitoring.
Sentinel-3A was launched on 16 February 2016 and its twin satellite Sentinel-3B was put in orbit on 25 April 2018. This Sentinel-3 family is expected to grow soon with two more satellites, i.e., Sentinel-3C and Sentinel-3D, to ensure continuity of service until 2030 [3].
The Surface Topography Mission (STM) element of Sentinel-3 consists of a dual-frequency (Ku-and C-band) Synthetic Aperture Radar Altimeter (SRAL), a Microwave Radiometer (MWR) and a system for Precise Orbit Determination (POD) that includes a Global Navigation Satellite System (GNSS), a DORIS (Détermination d’Orbite et Radiopositionnement Intégré par Satellite) system, and a Laser Retro Reflector. The main objective of Sentinel-3 STM is to deliver sea-surface heights with an accuracy of 3.5 cm [4]. This shall be considered as a combination of contributions arising from the SRAL, MWR and POD instruments. To reach this goal and ensure long-term confidence, accuracy and quality in Sentinel-3 data products, calibration and validation (Cal/Val) activities have to be carried out during all mission phases, i.e., pre-launch, commissioning, and operations.
This work presents the latest results of the external altimeter calibration of the Sentinel-3A STM with in-situ data at the dedicated Permanent Facility for Altimetry Calibration (PFAC) in west Crete, Greece. This is a Cal/Val facility that provides external range transponder calibration, cross-calibration with other altimetry missions, and sea-surface height calibration with in-situ data, primarily in the Gavdos island, south of Crete [5]. In addition, validation of the atmospheric delays provided by the MWR instrument is carried out using observations from a network of Continuously Operating Reference GNSS Stations established in the broader PFAC area.
In the following, Section 2 presents the PFAC infrastructure and instrumentation setting. Then, Section 3 describes the diverse methodologies applied for the calibration of the altimeter products, along with the dataset used. The latest Cal/Val results and their standard uncertainty as delivered by each methodology are given in Section 4 as well as a comparison of the wet tropospheric delays as derived by the MWR measurements and the GNSS data processing. Finally, in Section 5, the main conclusions for the overall performance of Sentinel-3A altimeter and MWR are given along with future plans for improving uncertainty analysis within the context of the Fiducial Reference Measurements for altimetry [6,7].

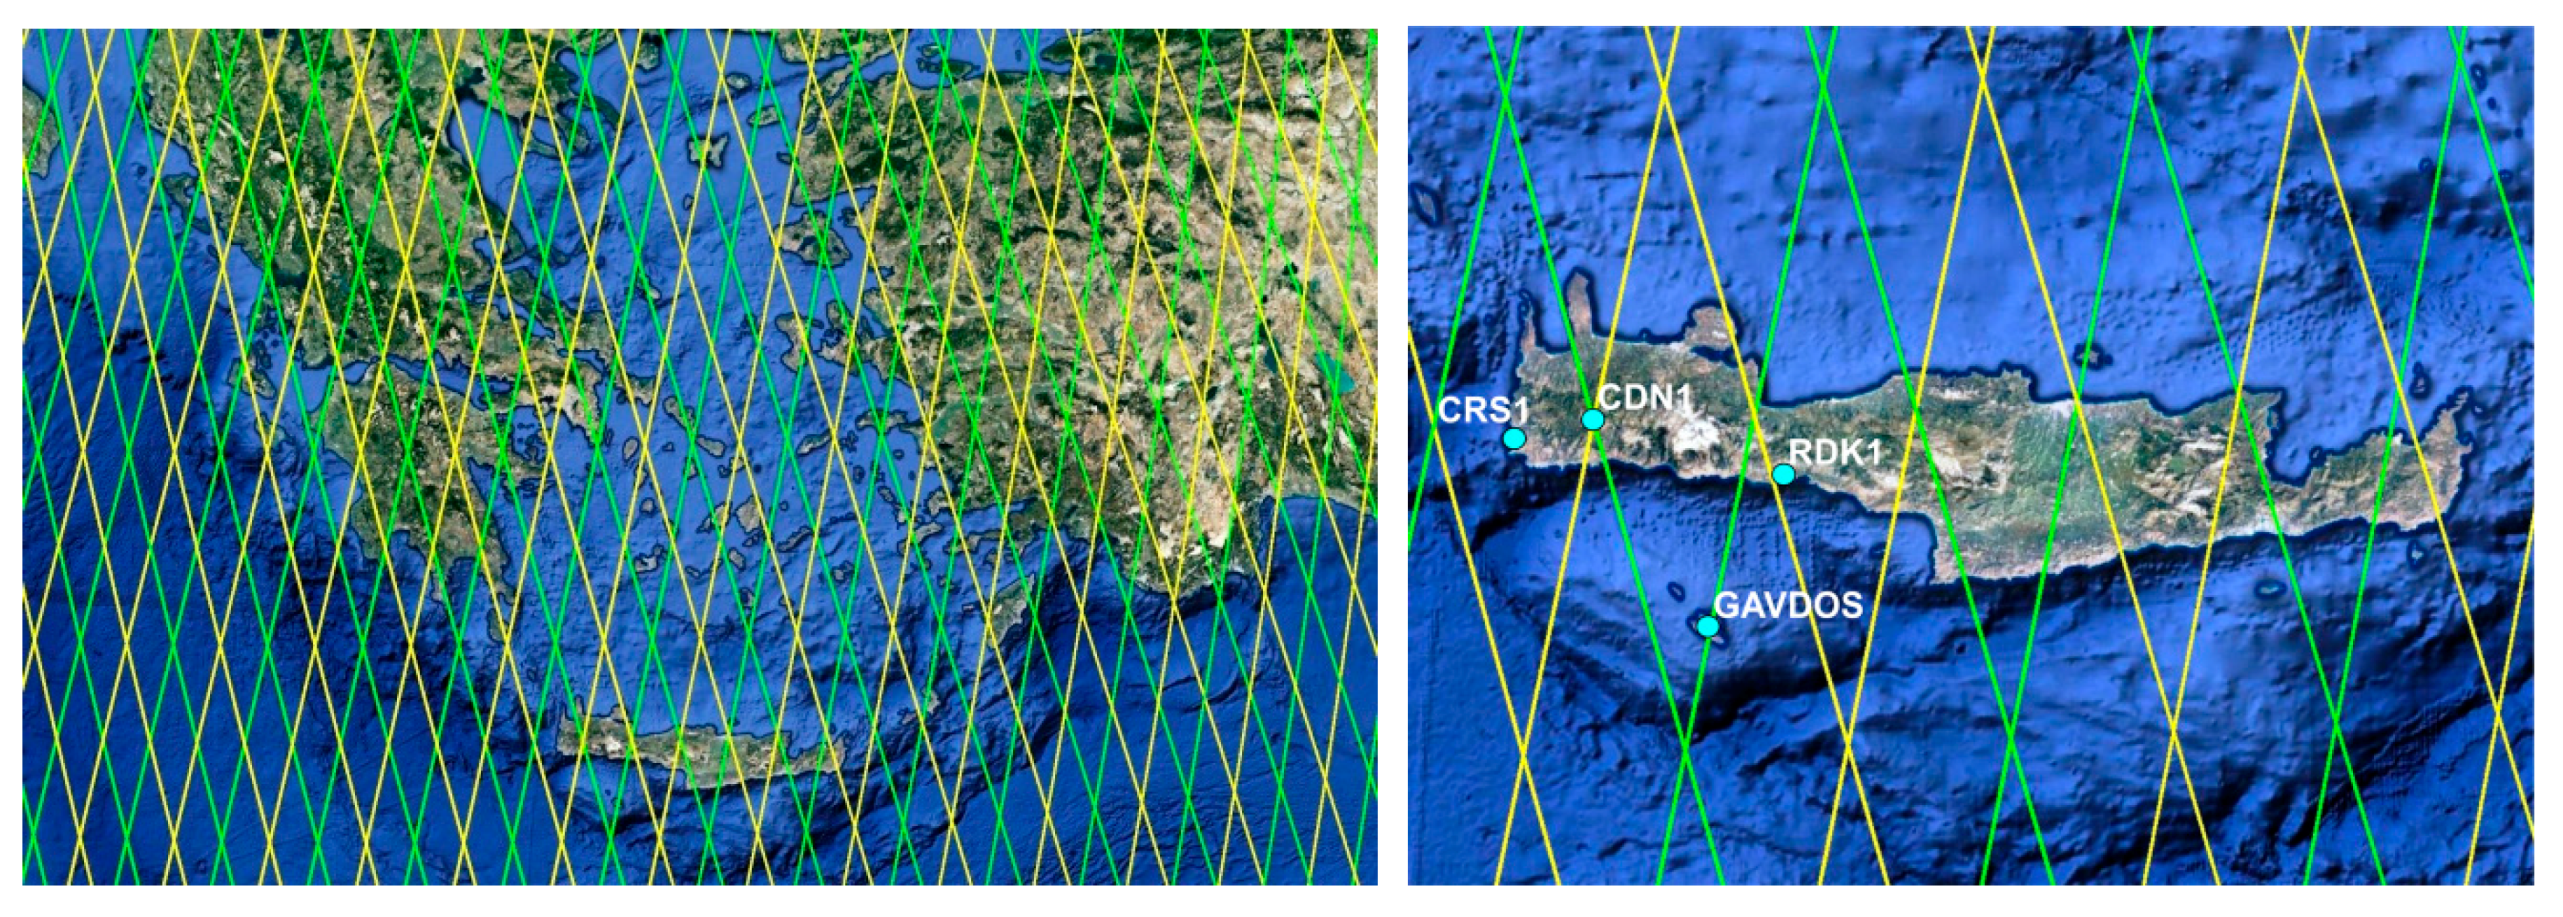
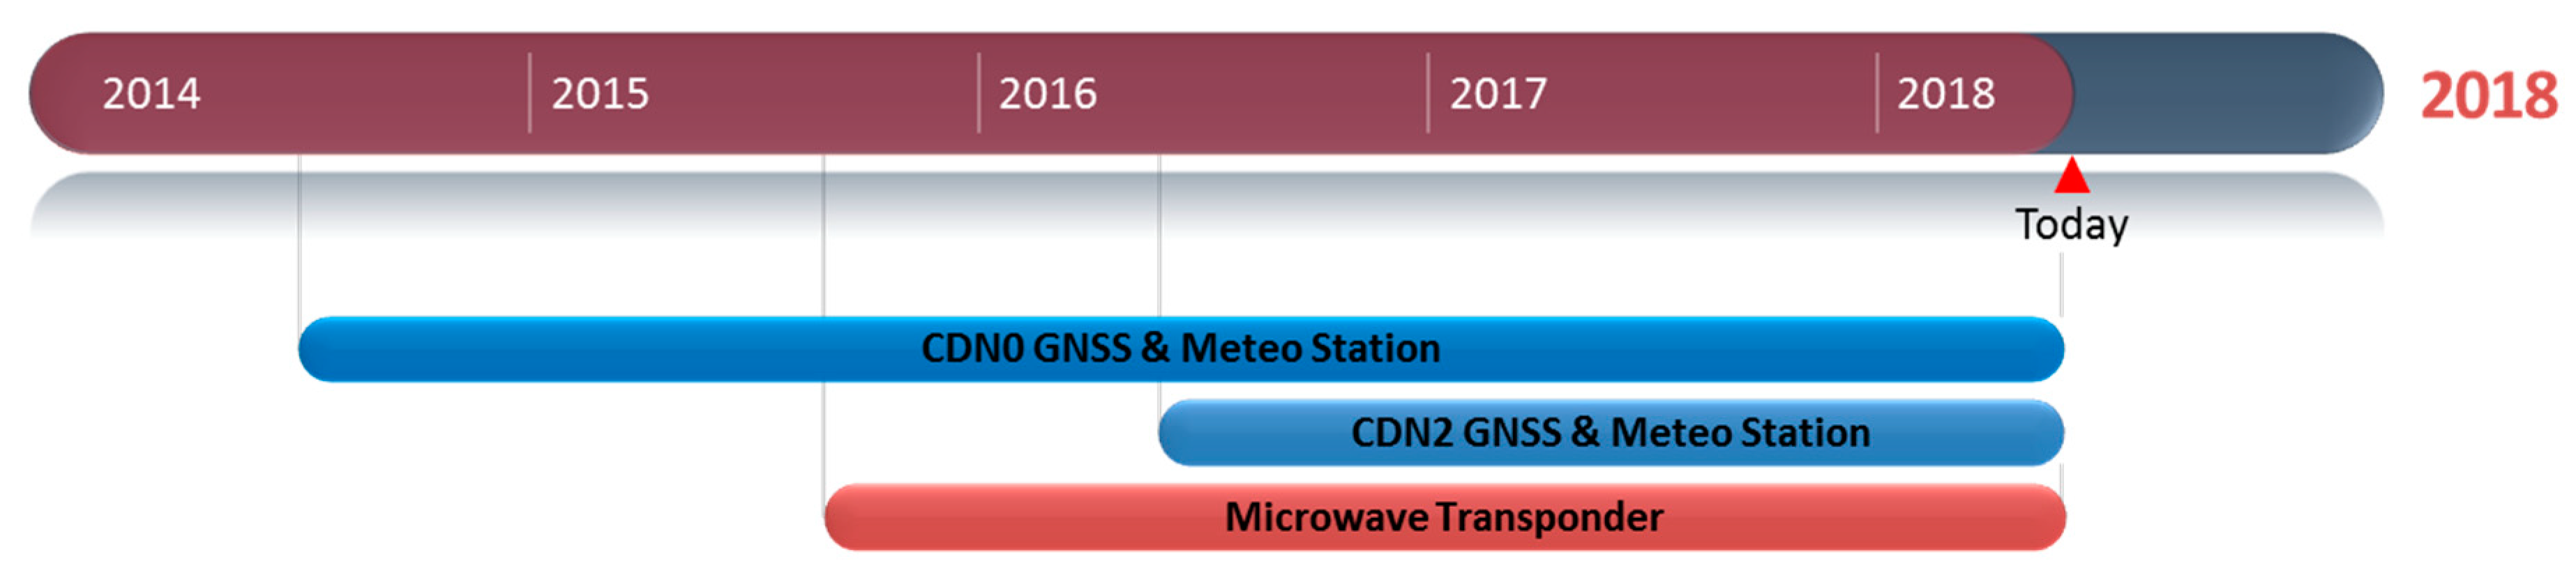
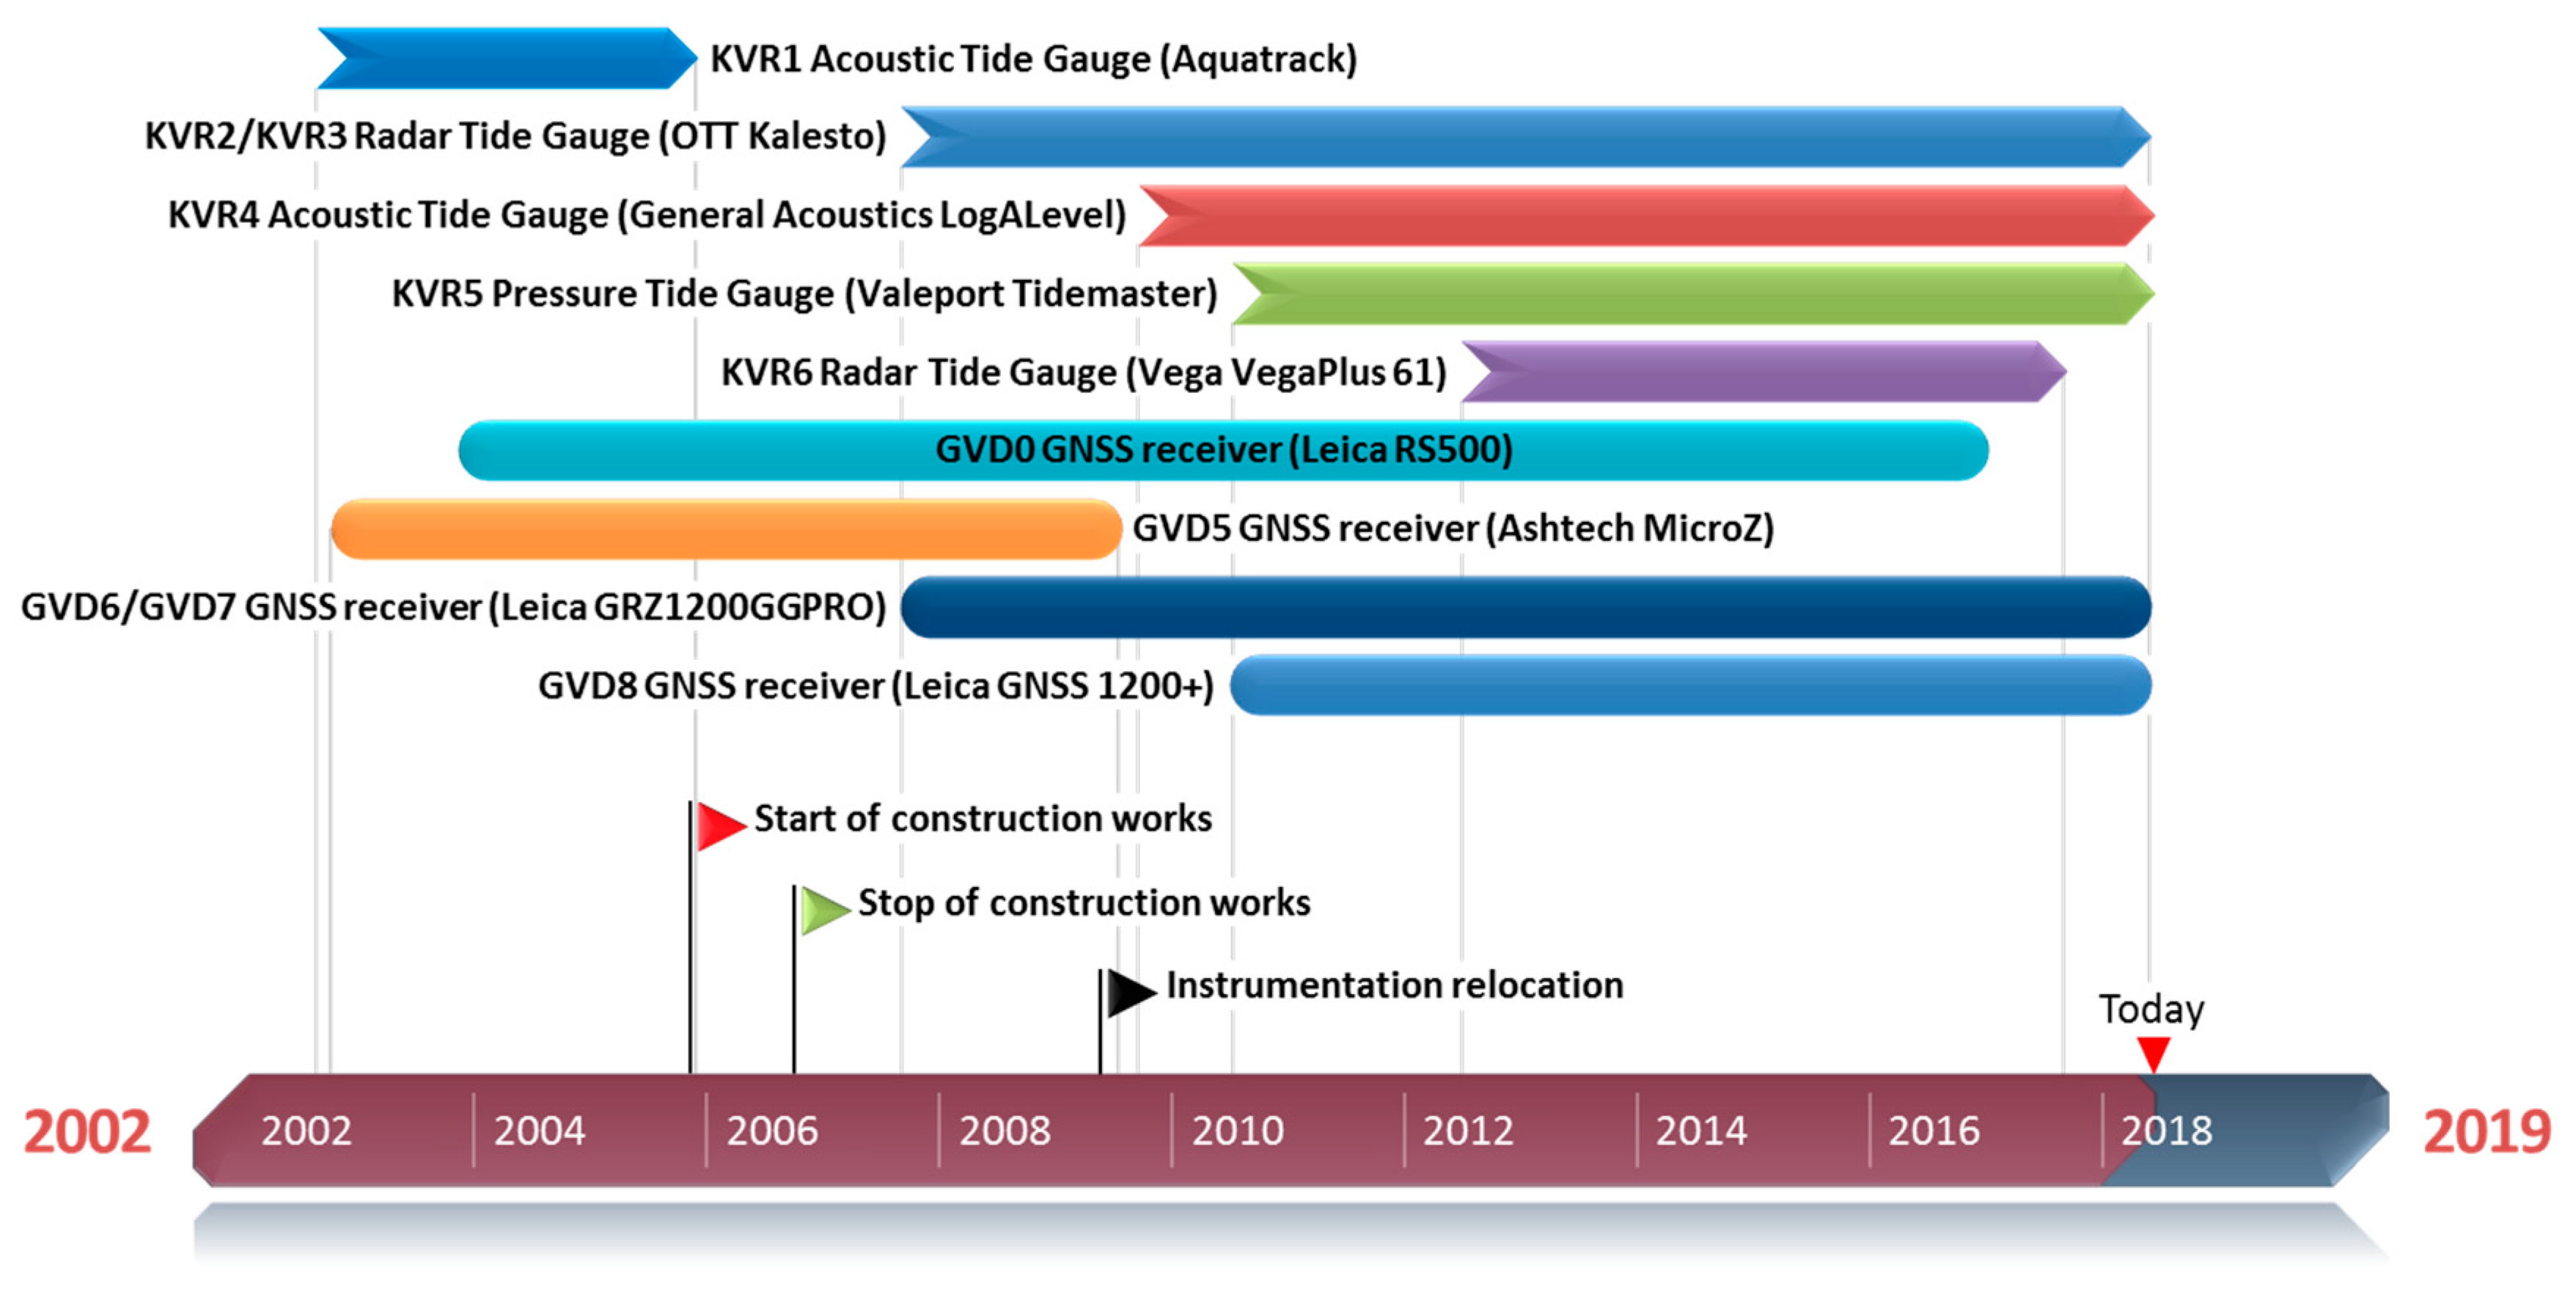
2. PFAC Infrastructure & Instrumentation

The Sentinel-3 satellite flies at an altitude of 814.5 km following a near-polar sun-synchronous orbit that ensures 104 km ground track separation at the Equator. It needs 385 orbits to perform a complete Earth cycle. The STM element has a 27-day revisit time upon the same ground location. This temporal repeatability of Sentinel-3 lies between that of Envisat’s and SARAL/AltiKa’s (35-days) and CryoSat-2 (369-days) and Jason (10-days) satellite altimeters.
The Sentinel-3A & Sentinel-3B ground tracks over the island of Crete, Greece are illustrated in Figure 1. The locations of the independent Cal/Val sites that compose the Permanent Facility for Altimetry Calibration are also presented in the same Figure. Two of these sites are employed for the calibration of Sentinel-3A STM element: the CDN1 transponder and the Gavdos sea-surface Cal/Val facilities.

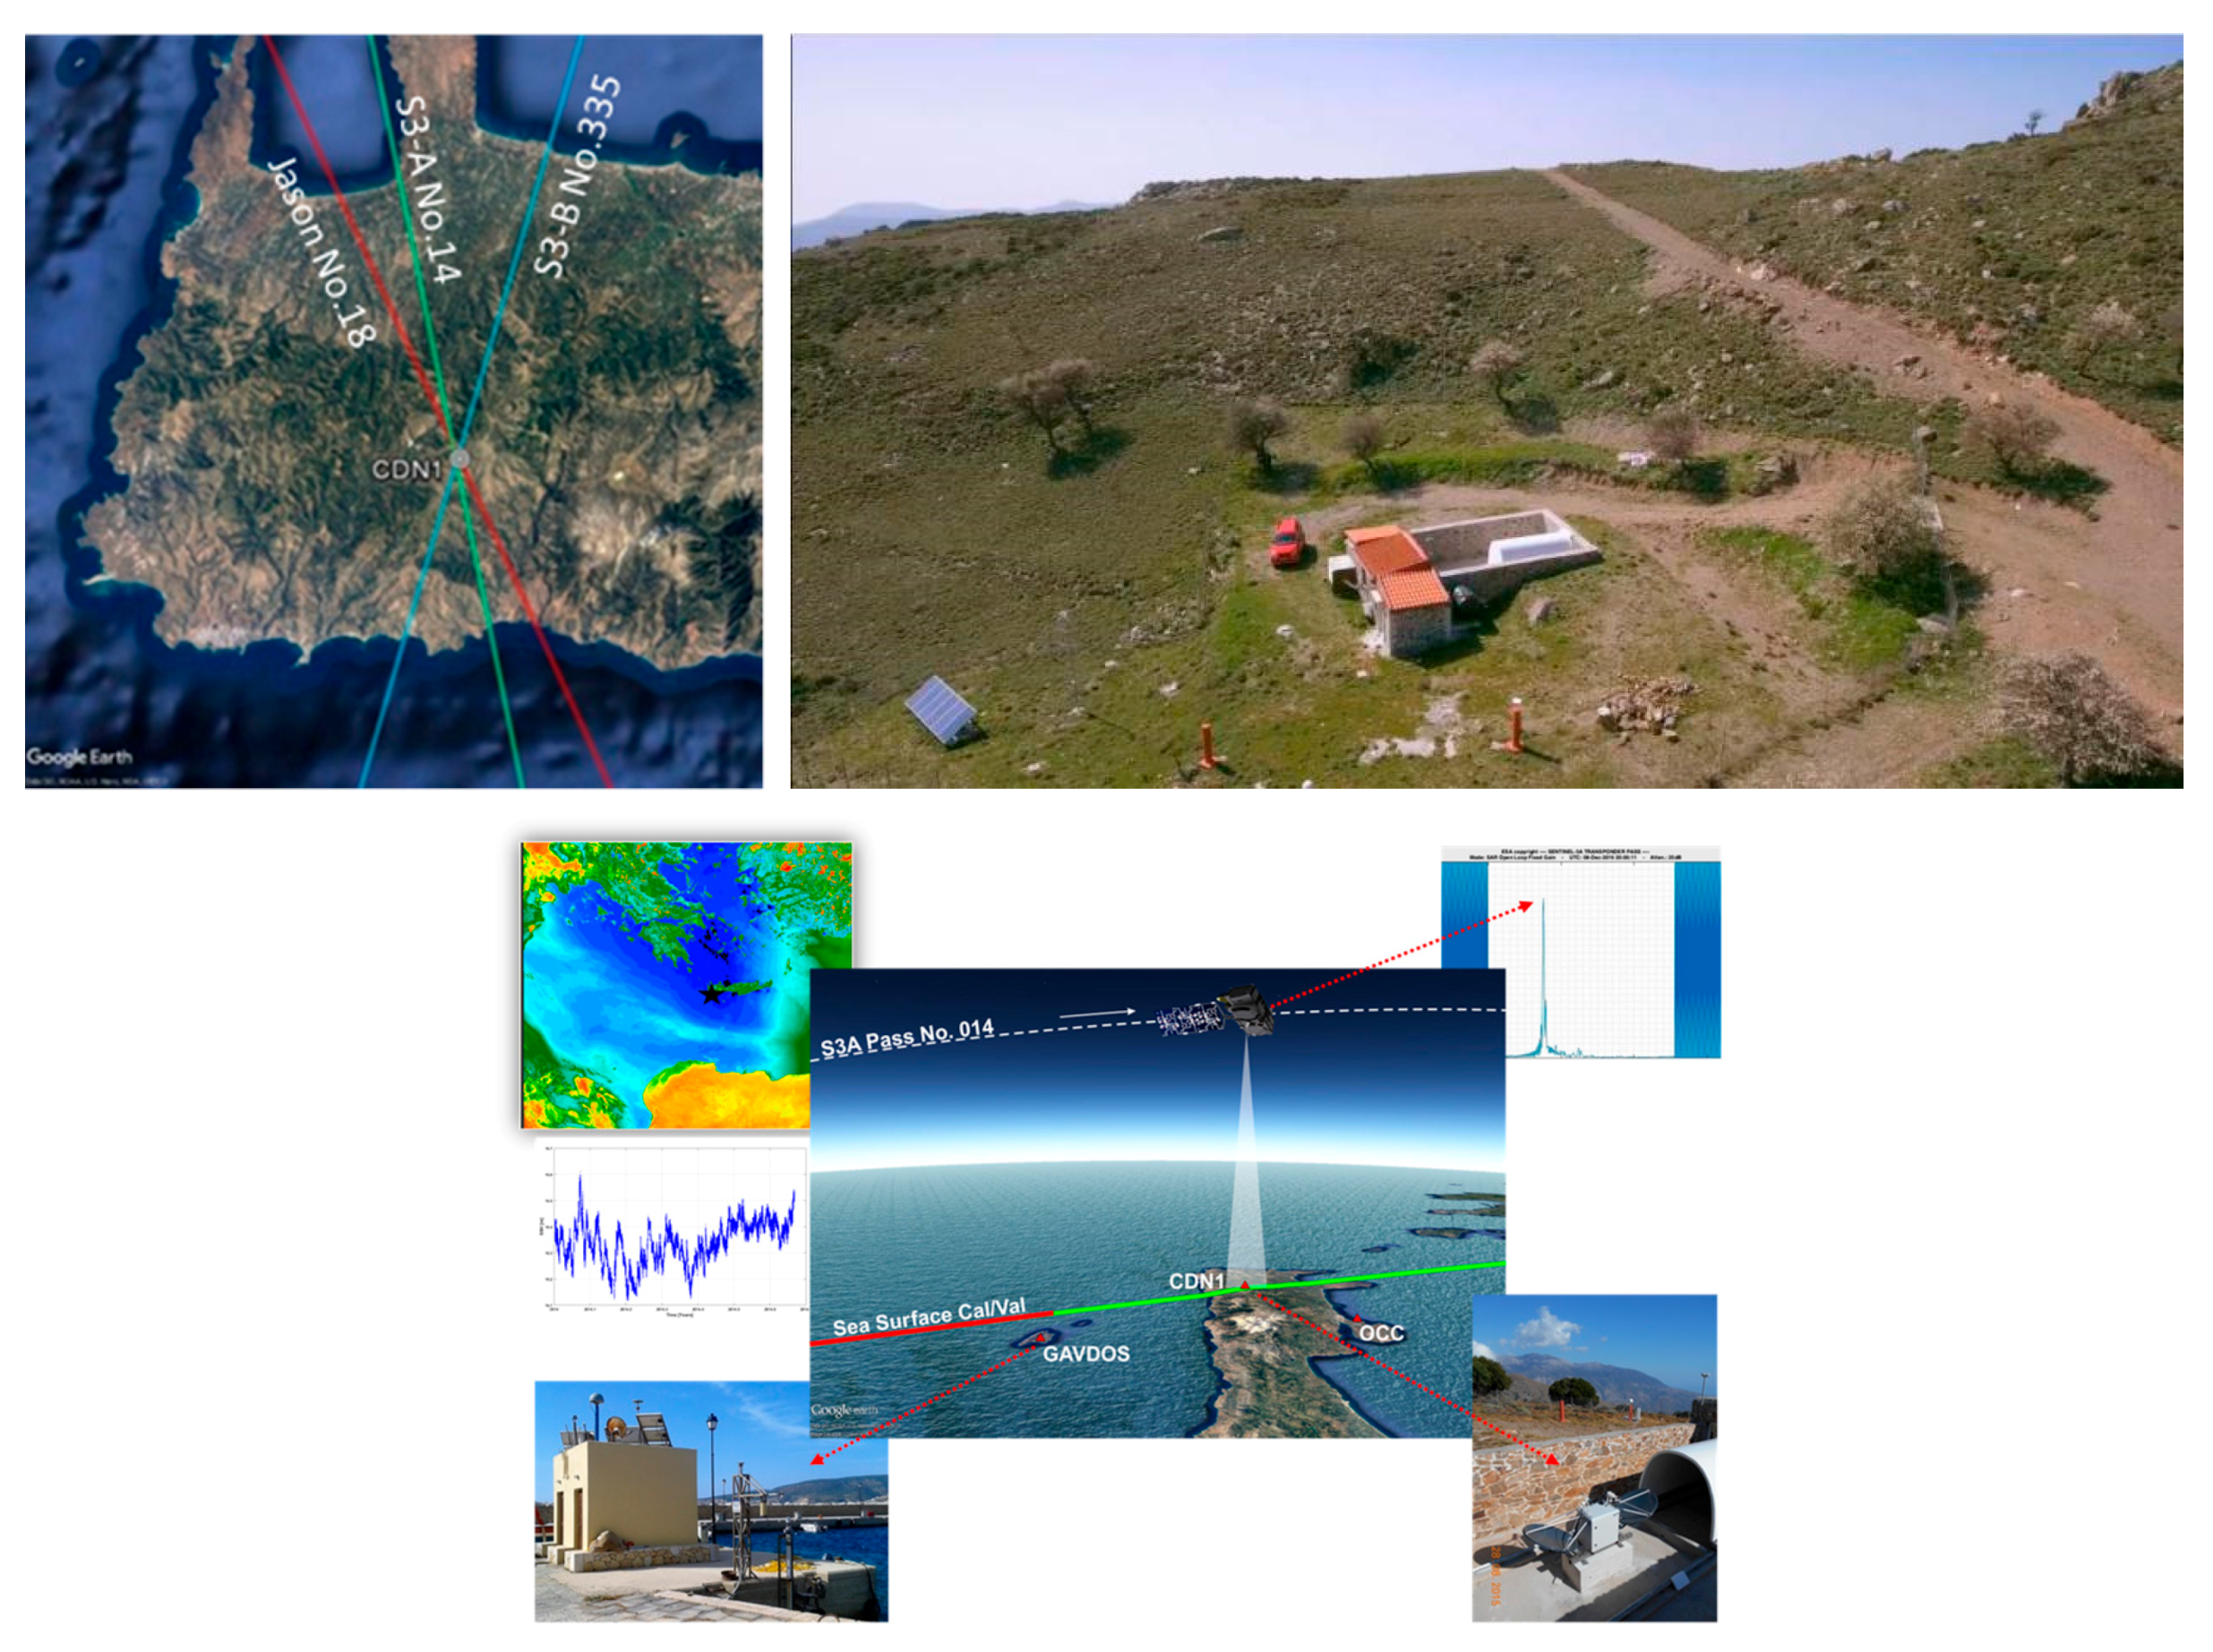
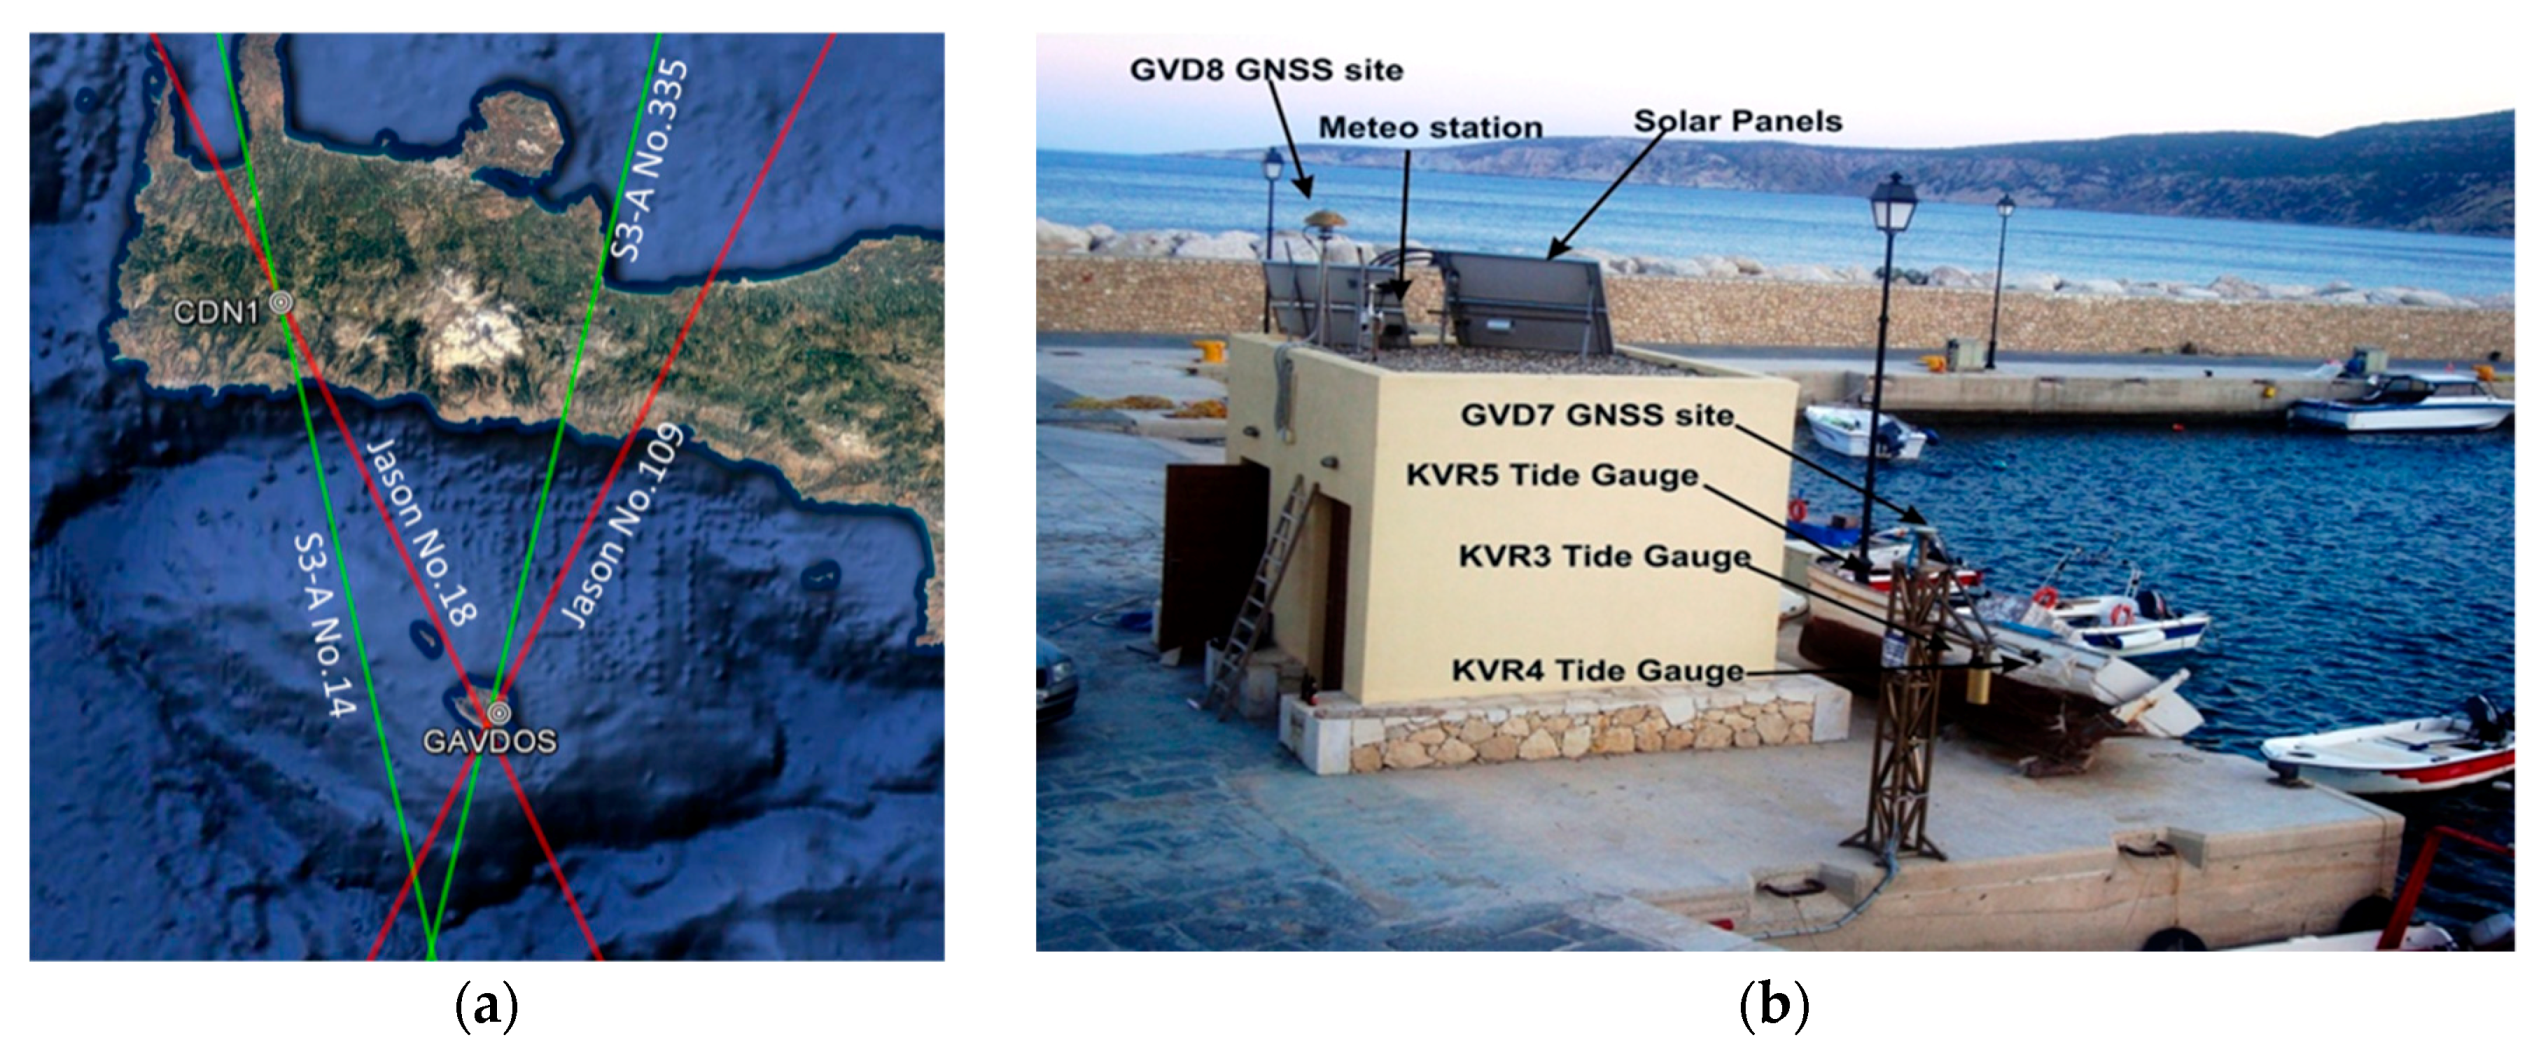
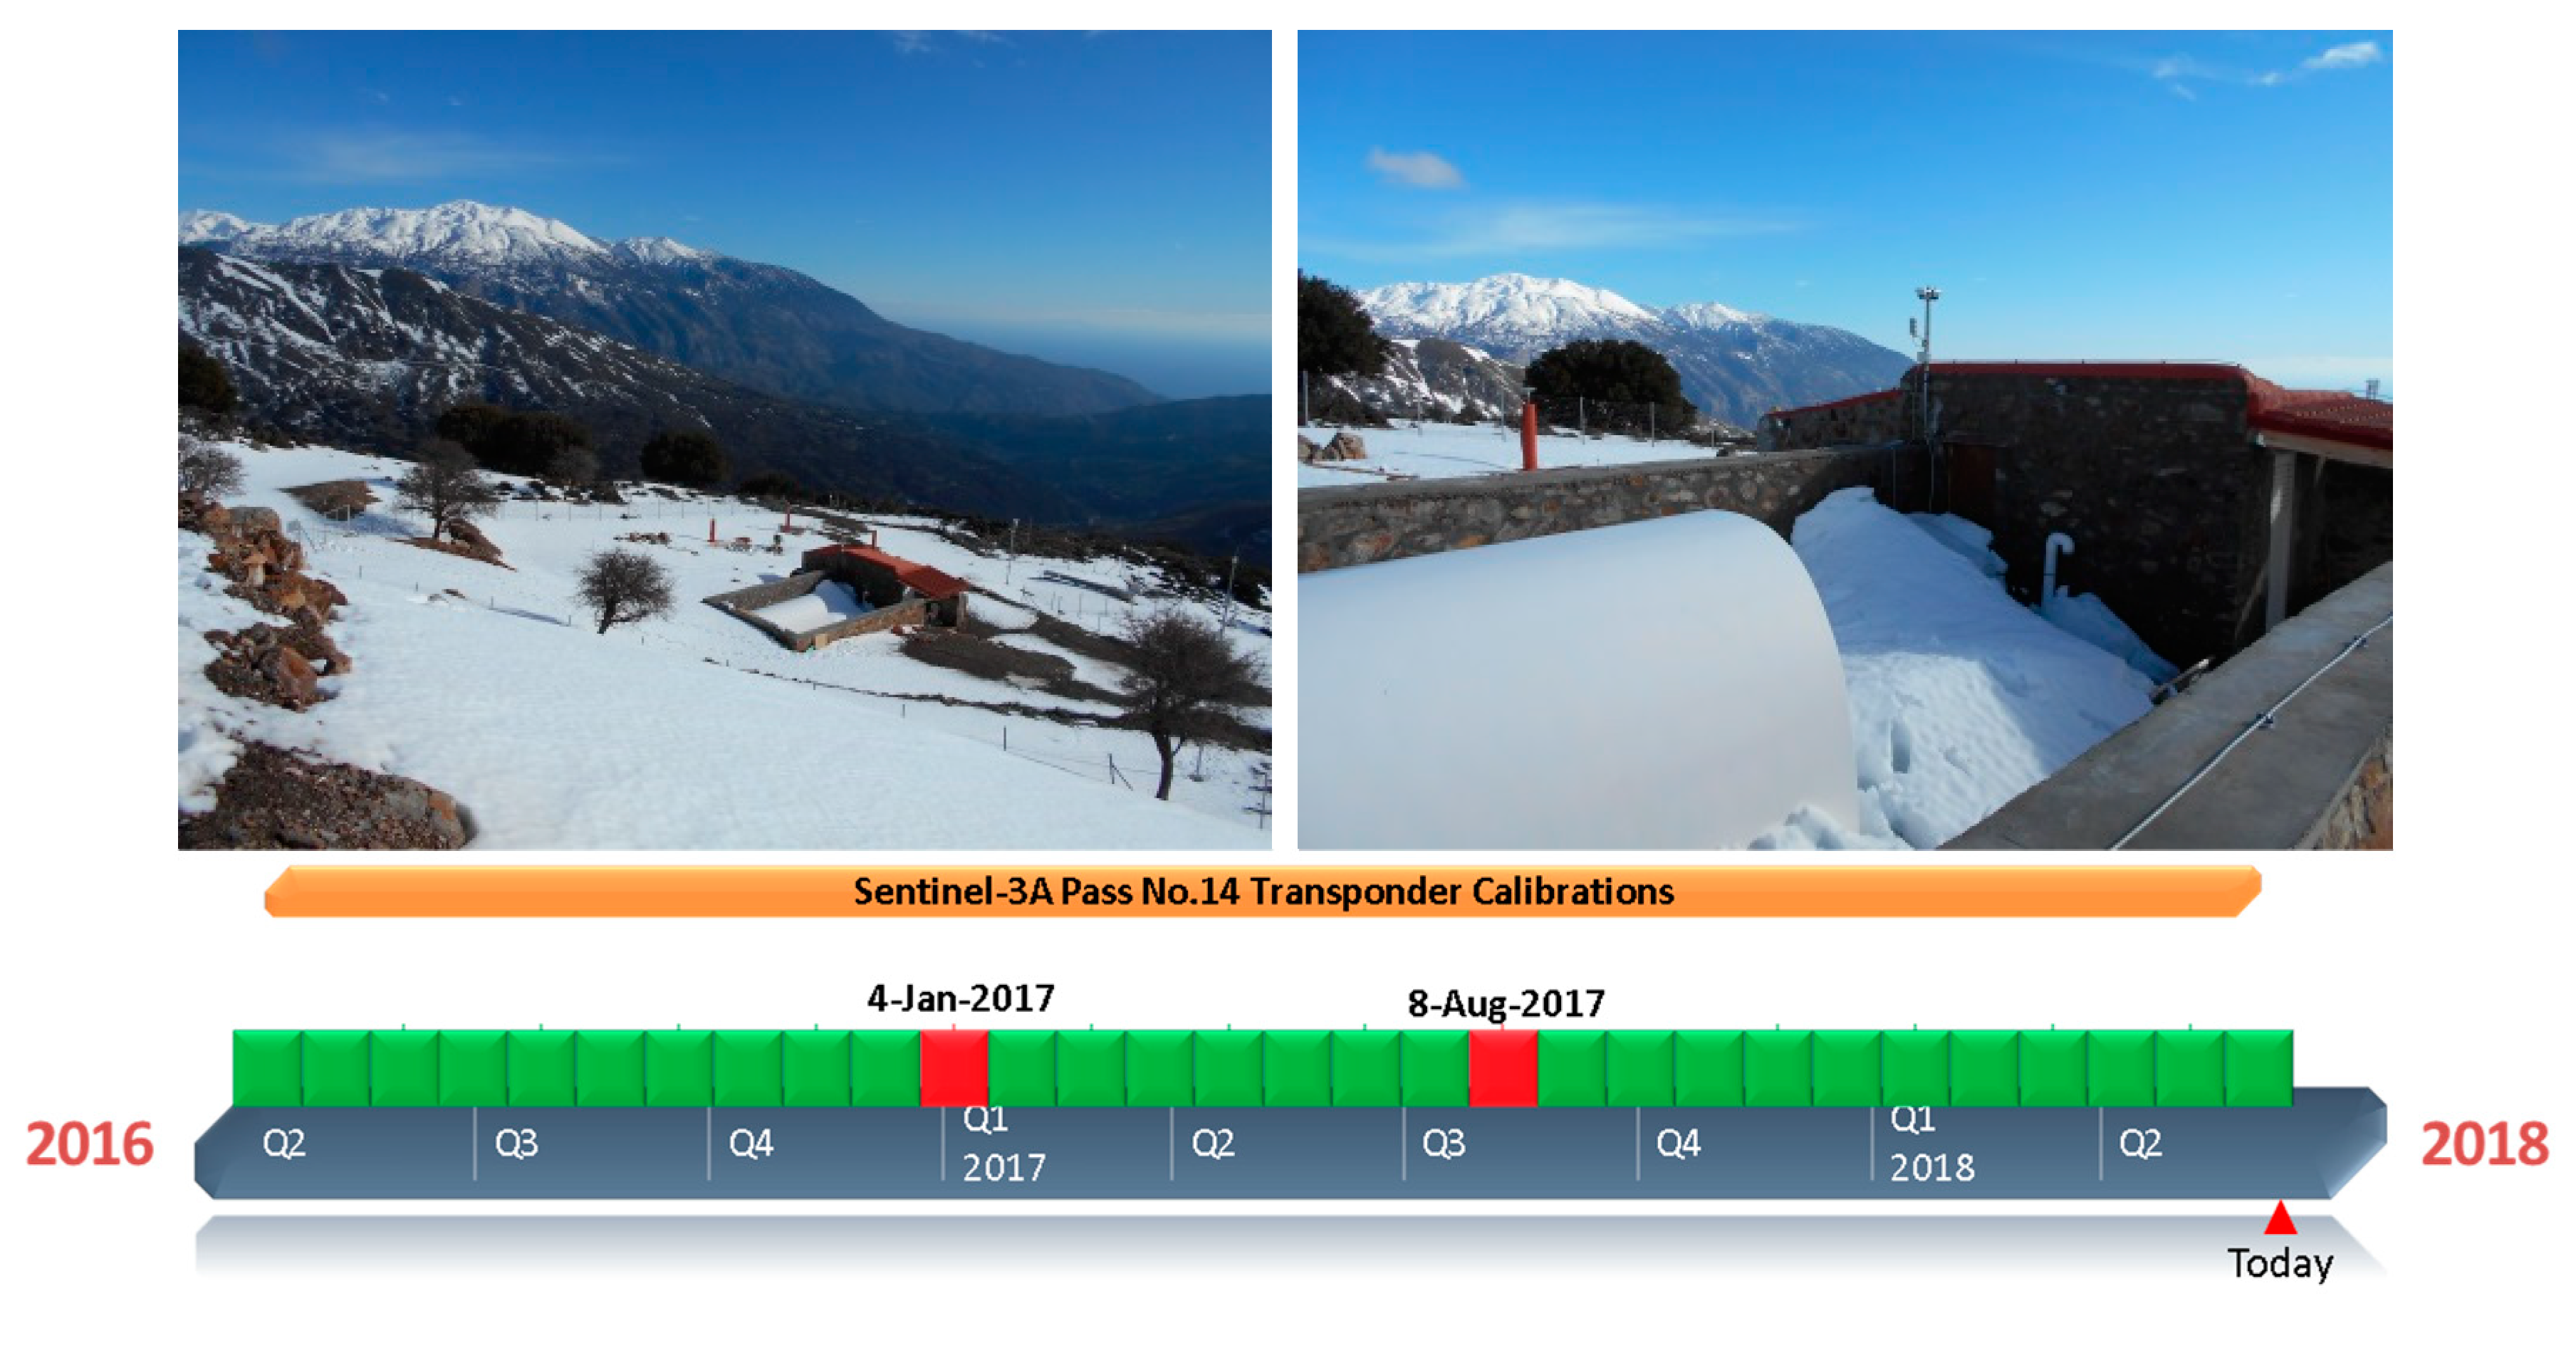
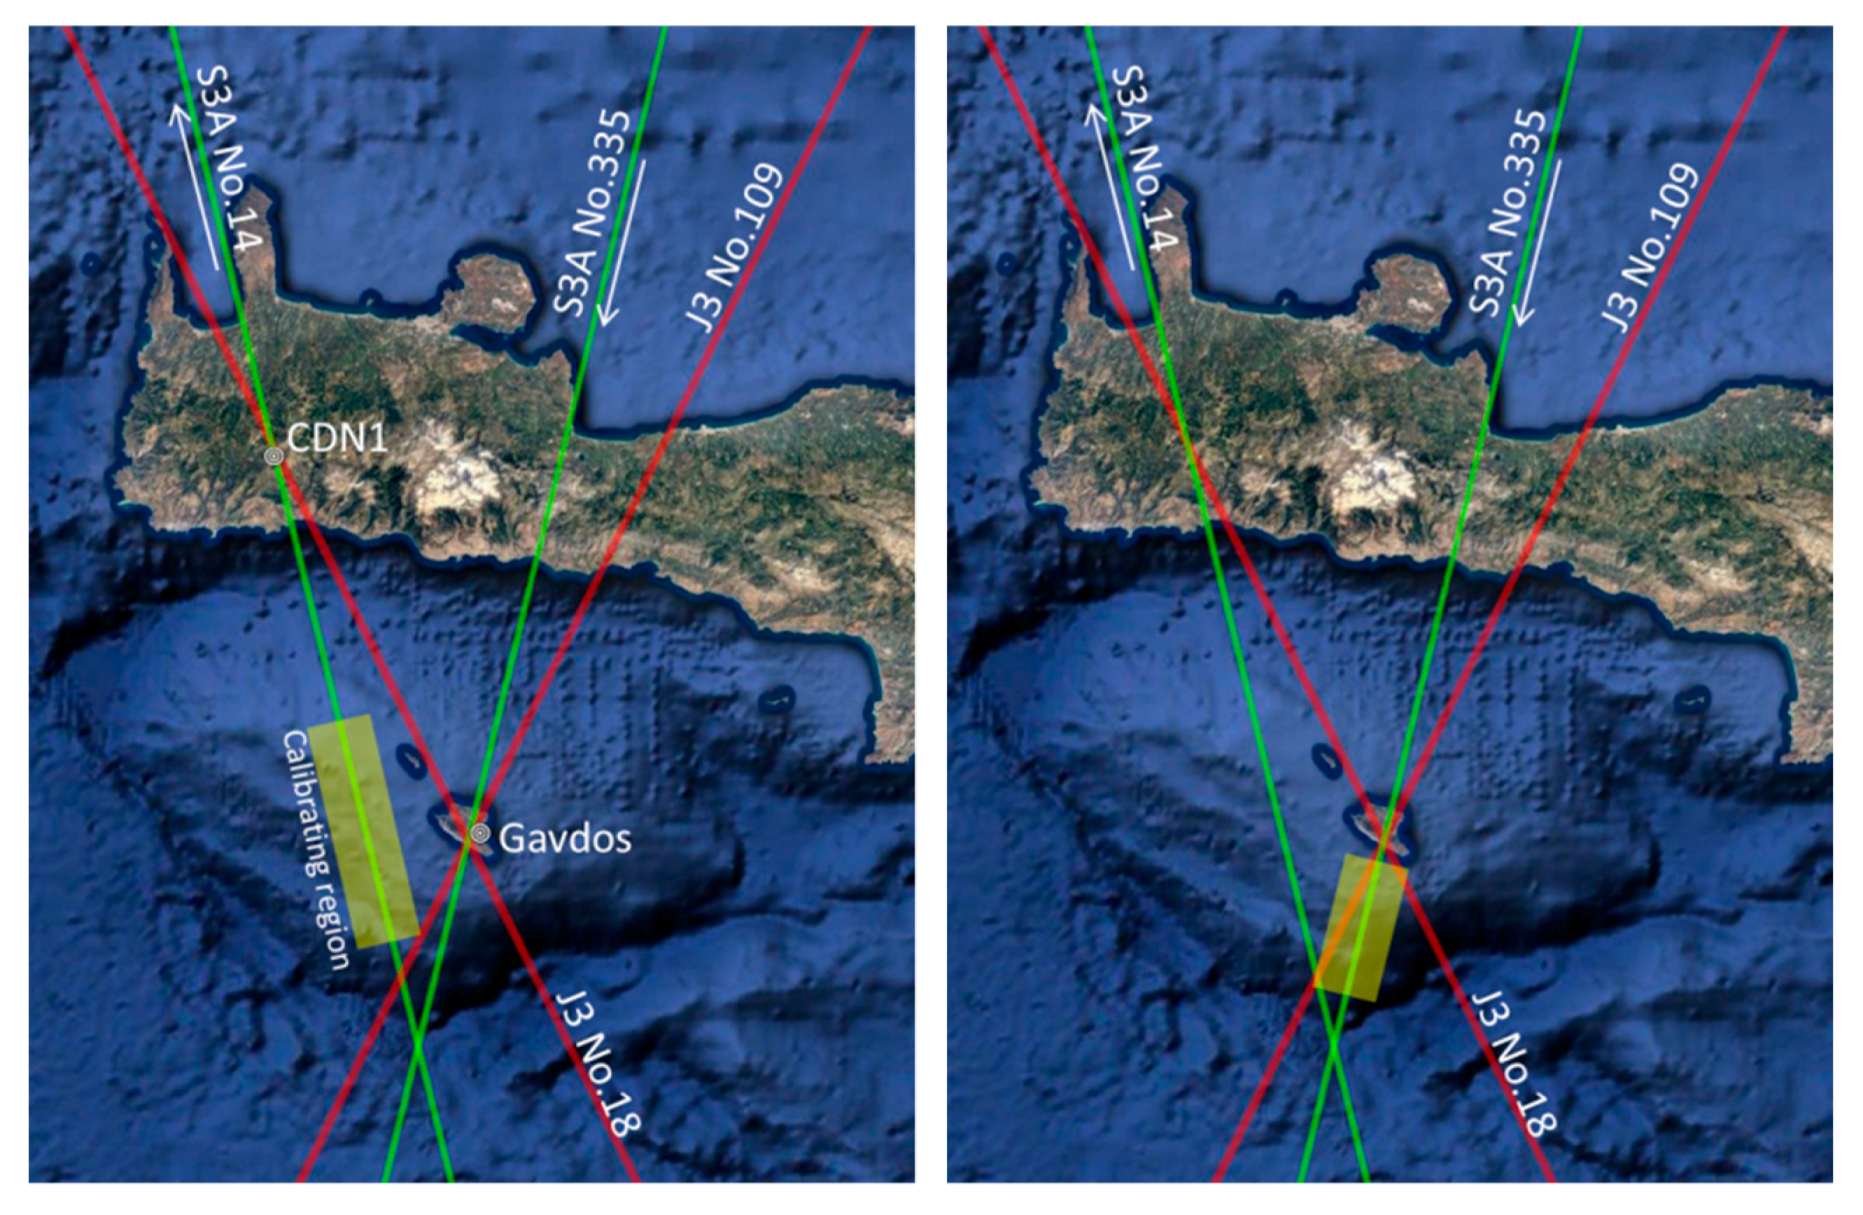
2.1. CDN1 Transponder Cal/Val Site

The Sentinel-3 Altimeter Calibration Site, named “CDN1 Cal/Val” site, is located on the mountainous of West Crete, at about 1000 m altitude under a triple crossover of Sentinel-3A Pass No.14 (ascending), Sentinel-3B Pass No.335 (descending) and Jason Pass No.18 (descending) (Figure 2).
The main instrumentation at the CDN1 Cal/Val site includes a prototype range microwave transponder [8], two continuously operating GNSS stations, and two meteorological stations. The first GNSS receiver has been installed on site and has been operational as of June 2014, while the microwave transponder has been installed and operational as of 28 August 2015 (Figure 3).

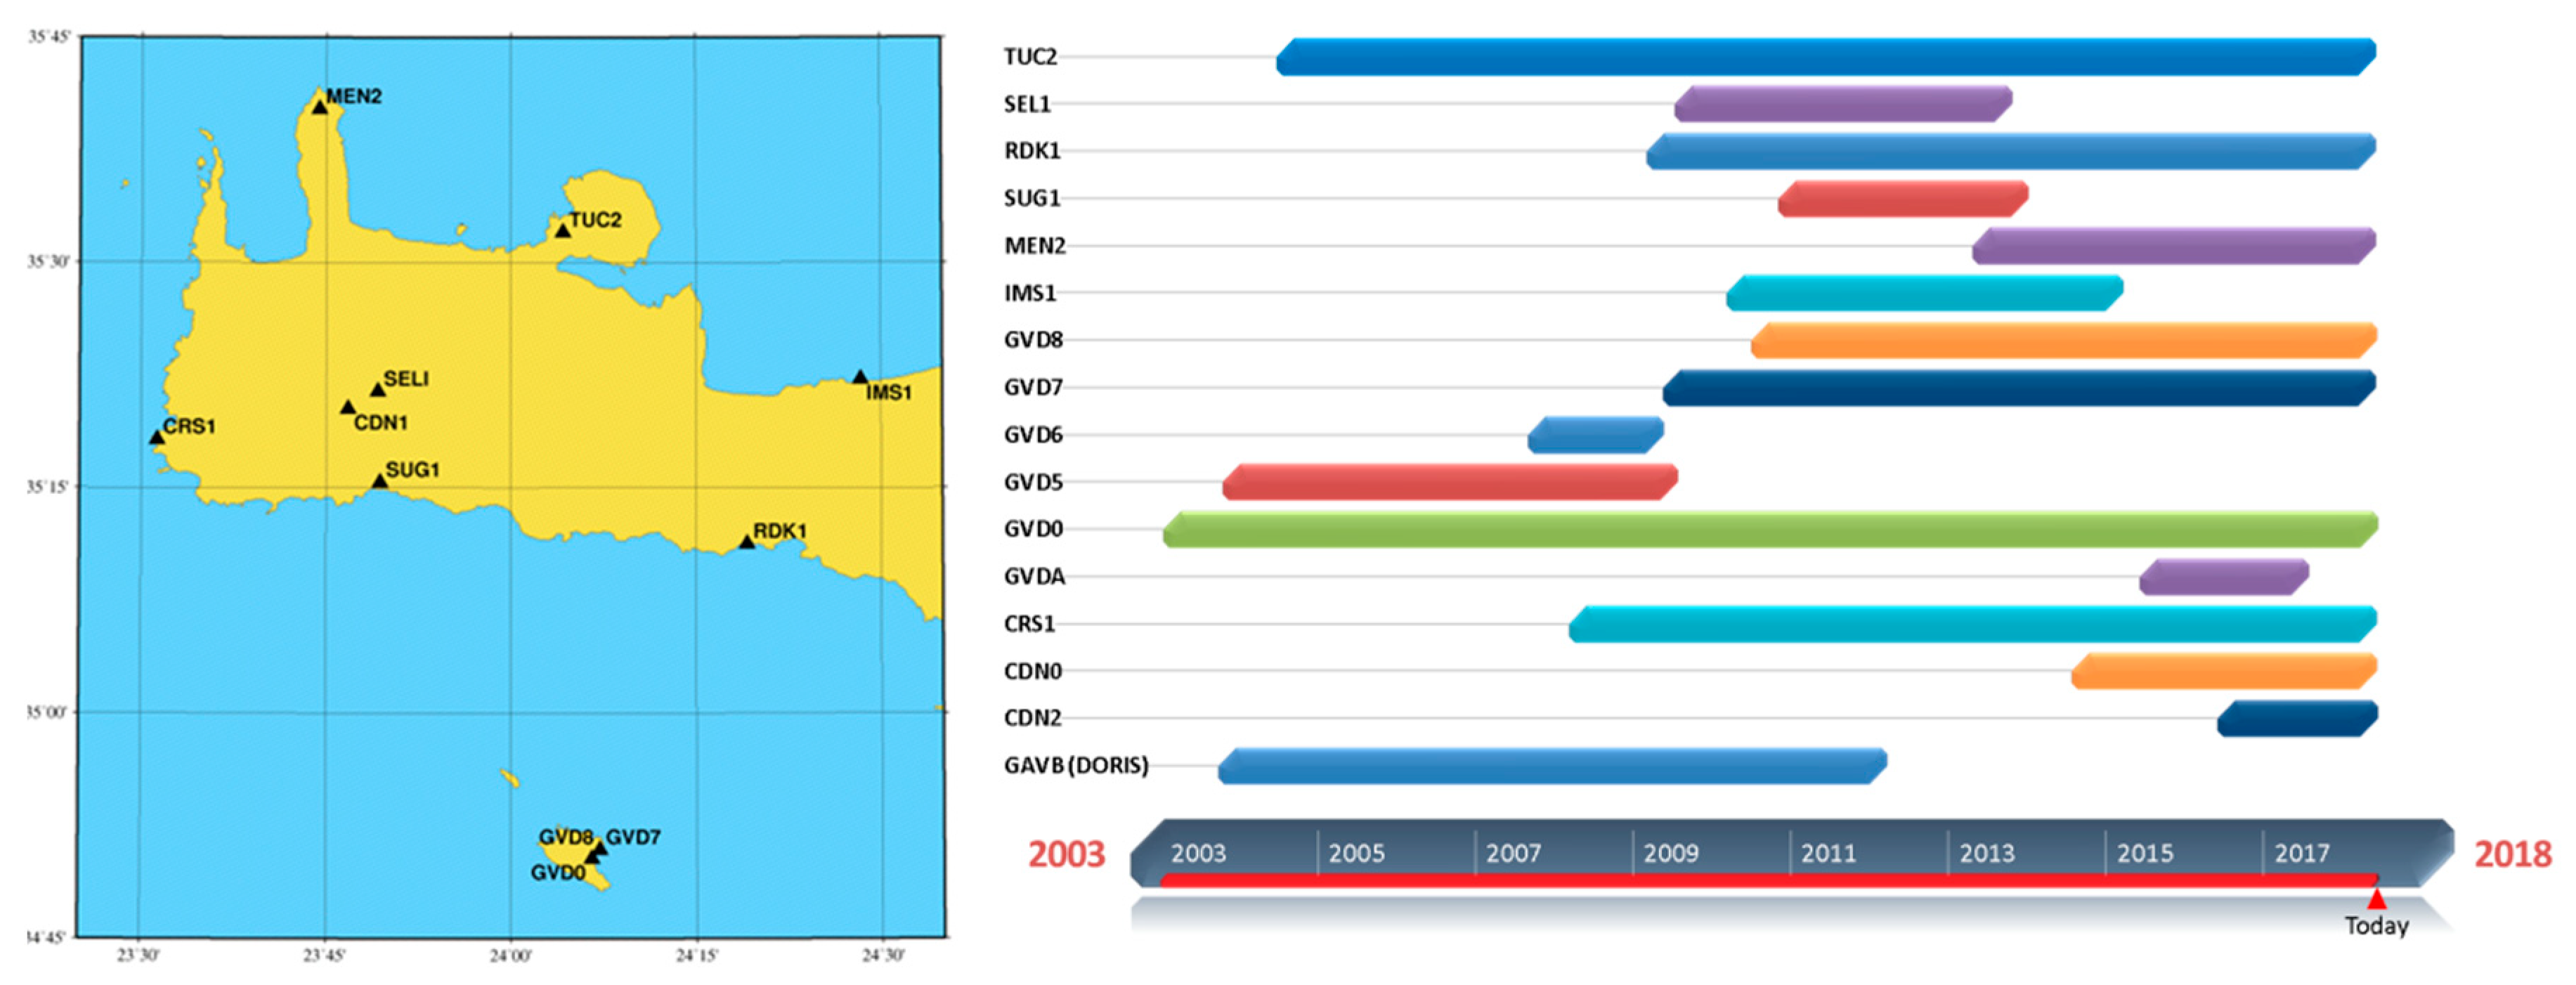
2.2. Gavdos Sea-Surface Cal/Val Facility

The Gavdos Cal/Val facility has been operational since 2004. It provides absolute calibration values for the Sentinel-3A SRAL altimeter and, more specifically, for its ascending Pass No.14, and for its descending Pass No.335 (Figure 4a). Additionally, this site has been engaged in sea-surface calibration of the Jason missions (Jason-1, Jason-2 and Jason-3, along the descending Pass No.18 and the ascending Pass No.109). In the past, Gavdos has provided Cal/Val results for Jason-1, Jason-2, Jason-3, Envisat, and SARAL/AltiKa satellite altimeters [9]. At present, three tide gauges of different measuring technology (KVR3-radar, KVR4-open air acoustic, and KVR5-pressure) have been used to provide water level observations at the “Karave” harbor site in the Gavdos inland (Figure 4b).
Since the initial setup in 2001, the instrumentation installed at this sea-surface Cal/Val facility in the Gavdos island has been modified throughout this long period of operation to (a) compensate malfunctions, failures, and damages caused by extreme weather events, (b) to follow up changes in satellite altimetry measuring techniques, and (c) improve the instrumentation’s uncertainty budget (Figure 5).

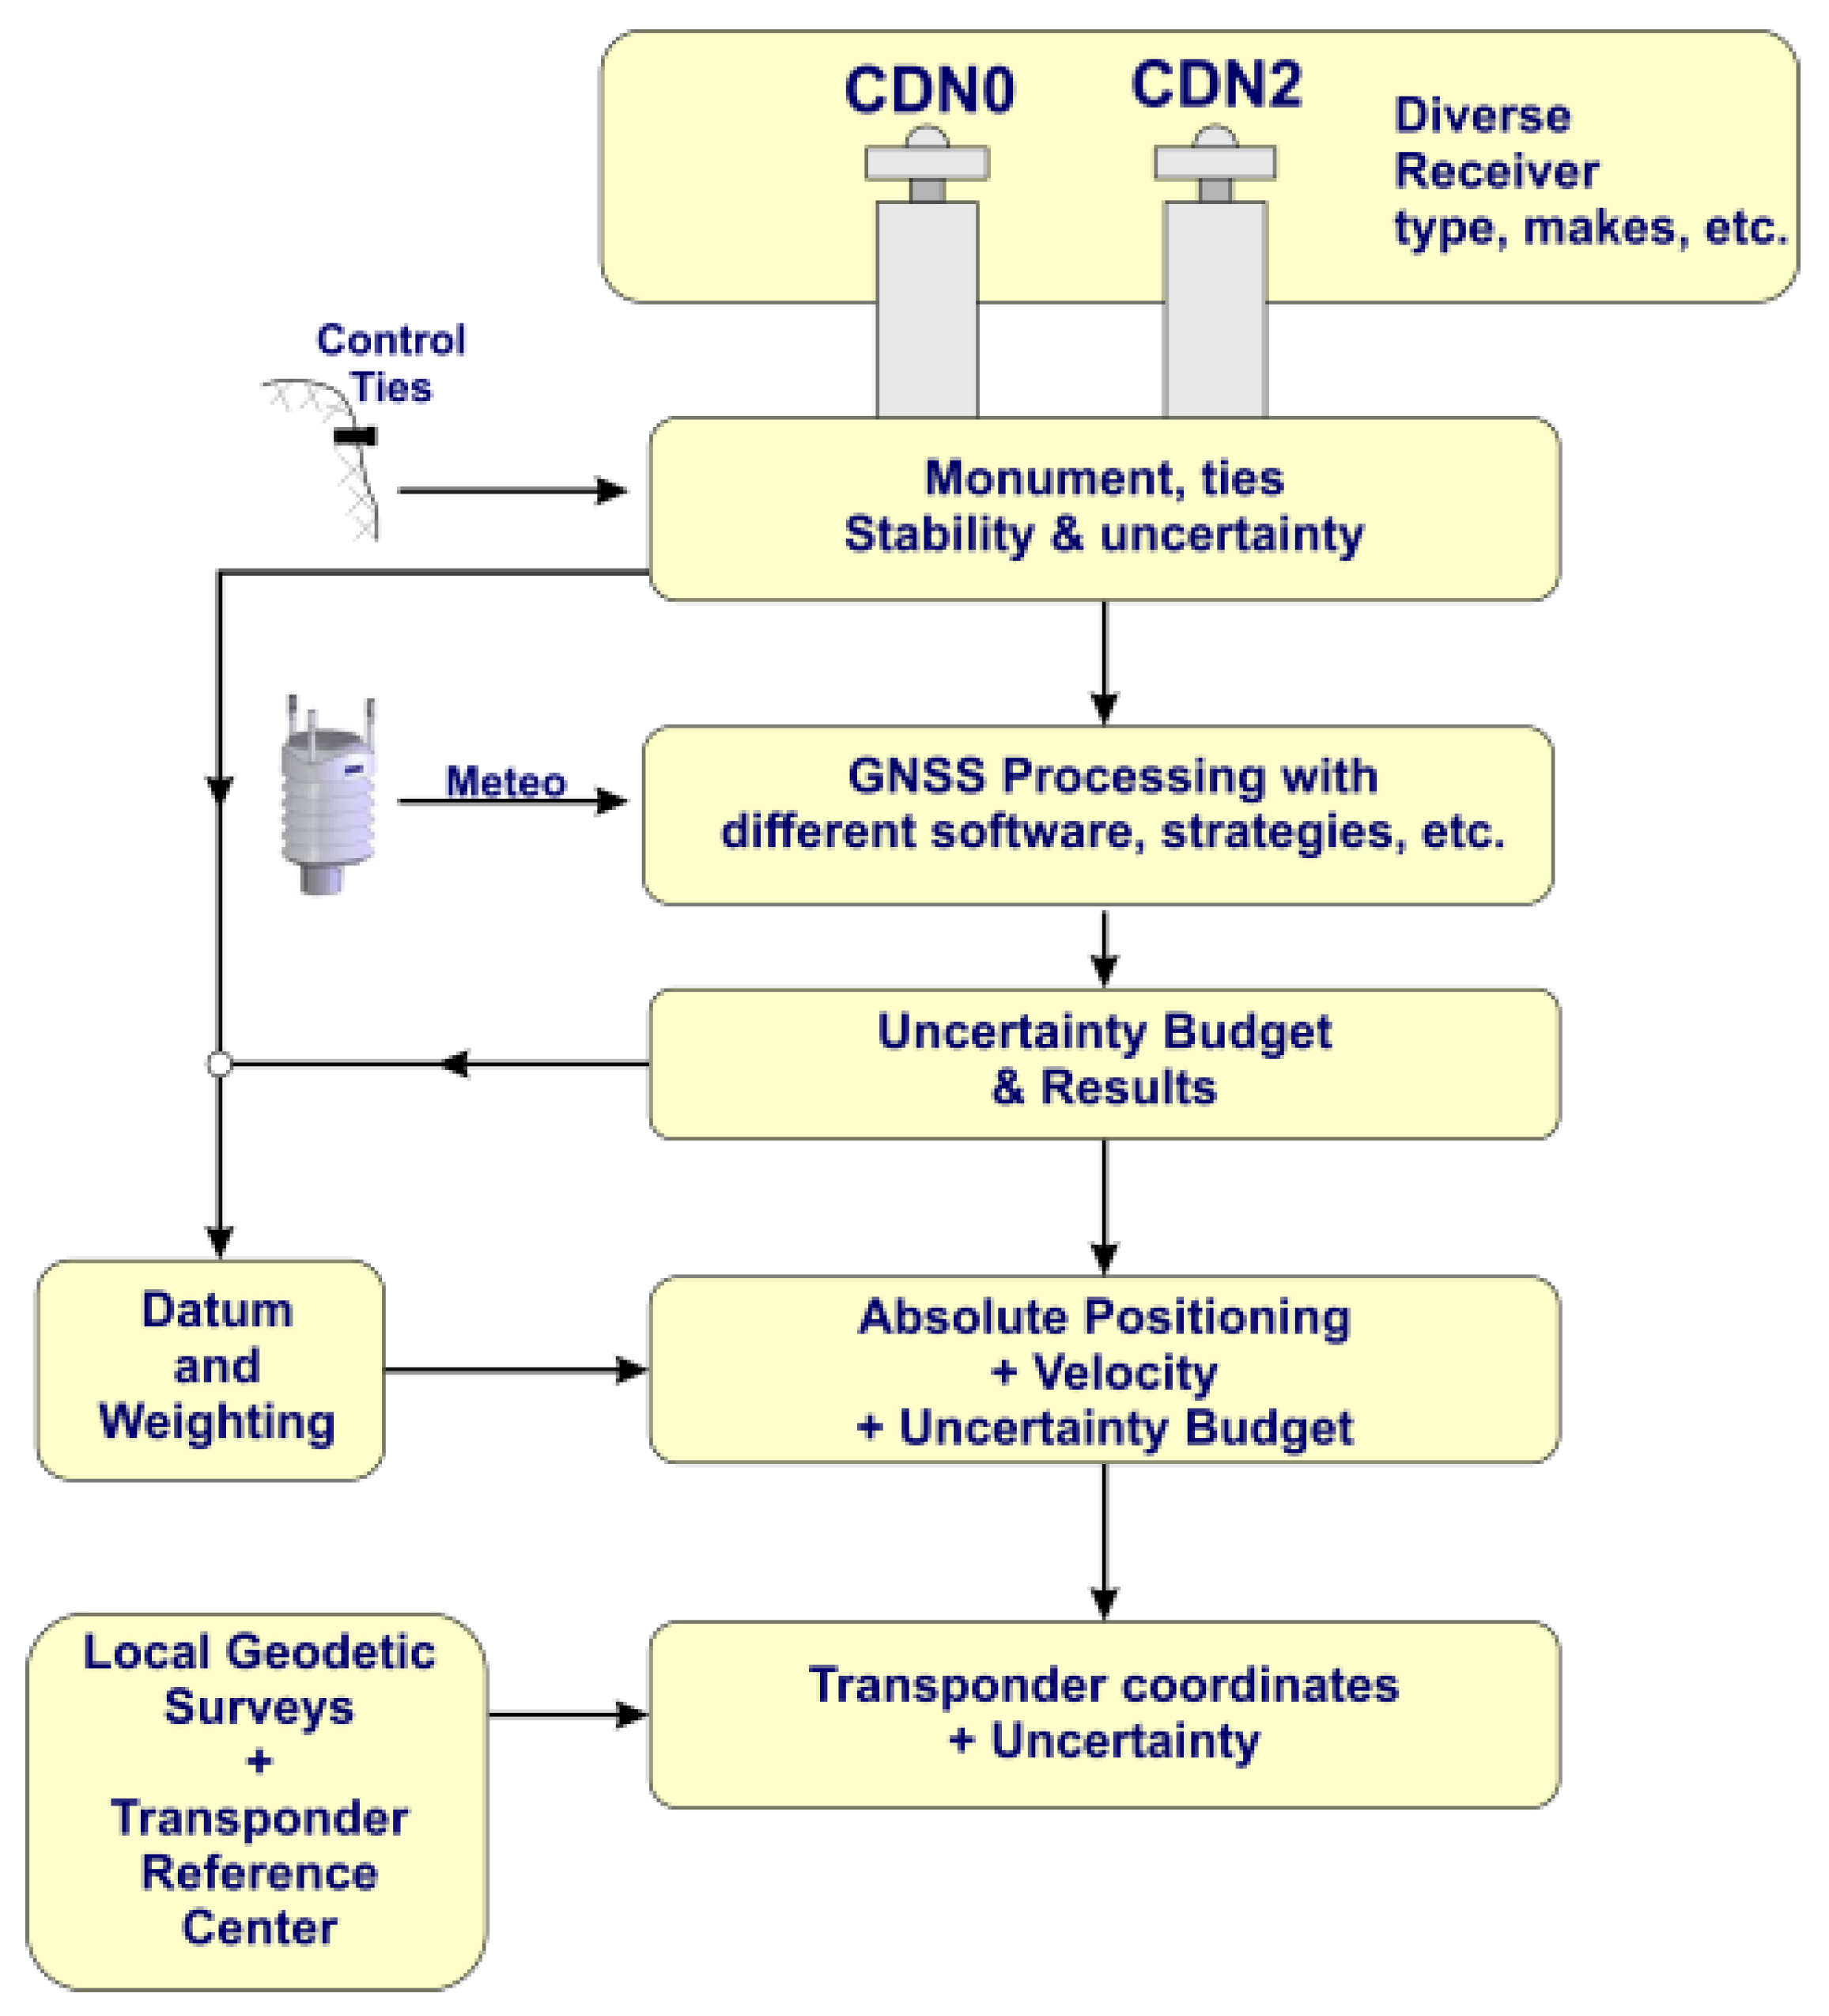
2.3. The Regional GNSS Network

To determine precise geodetic coordinates for the reference marks of the PFAC instrumentation, continuously operating reference GNSS stations have been setup at each Cal/Val site (Gavdos, CRS1, RDK1, CDN1). Additional GNSS stations have also been installed in west Crete, in support of PFAC operations and to provide better understanding of the tectonic deformations in this earthquake prone region (Figure 6). The same instrumentation has also been used to derive the atmospheric delays (wet and dry troposphere, ionosphere) for the altimeter’s signals.

3. Calibration Methodologies & Dataset Used

The scientific community investigates [10] and provides post-launch calibration and validation of satellite altimeter products from the early beginning of the altimetry era [11,12]. Following the technological advances in satellite altimetry, several techniques have been implemented to provide both absolute and relative calibration of satellite altimeters: distributed tide-gauge network (relative), crossover analysis (relative), sea-surface calibration using tide gauges and/or GNSS buoys (absolute indirect), and active transponder calibration (absolute direct). Three of these Cal/Val techniques are put into action at the PFAC, and presented hereafter.

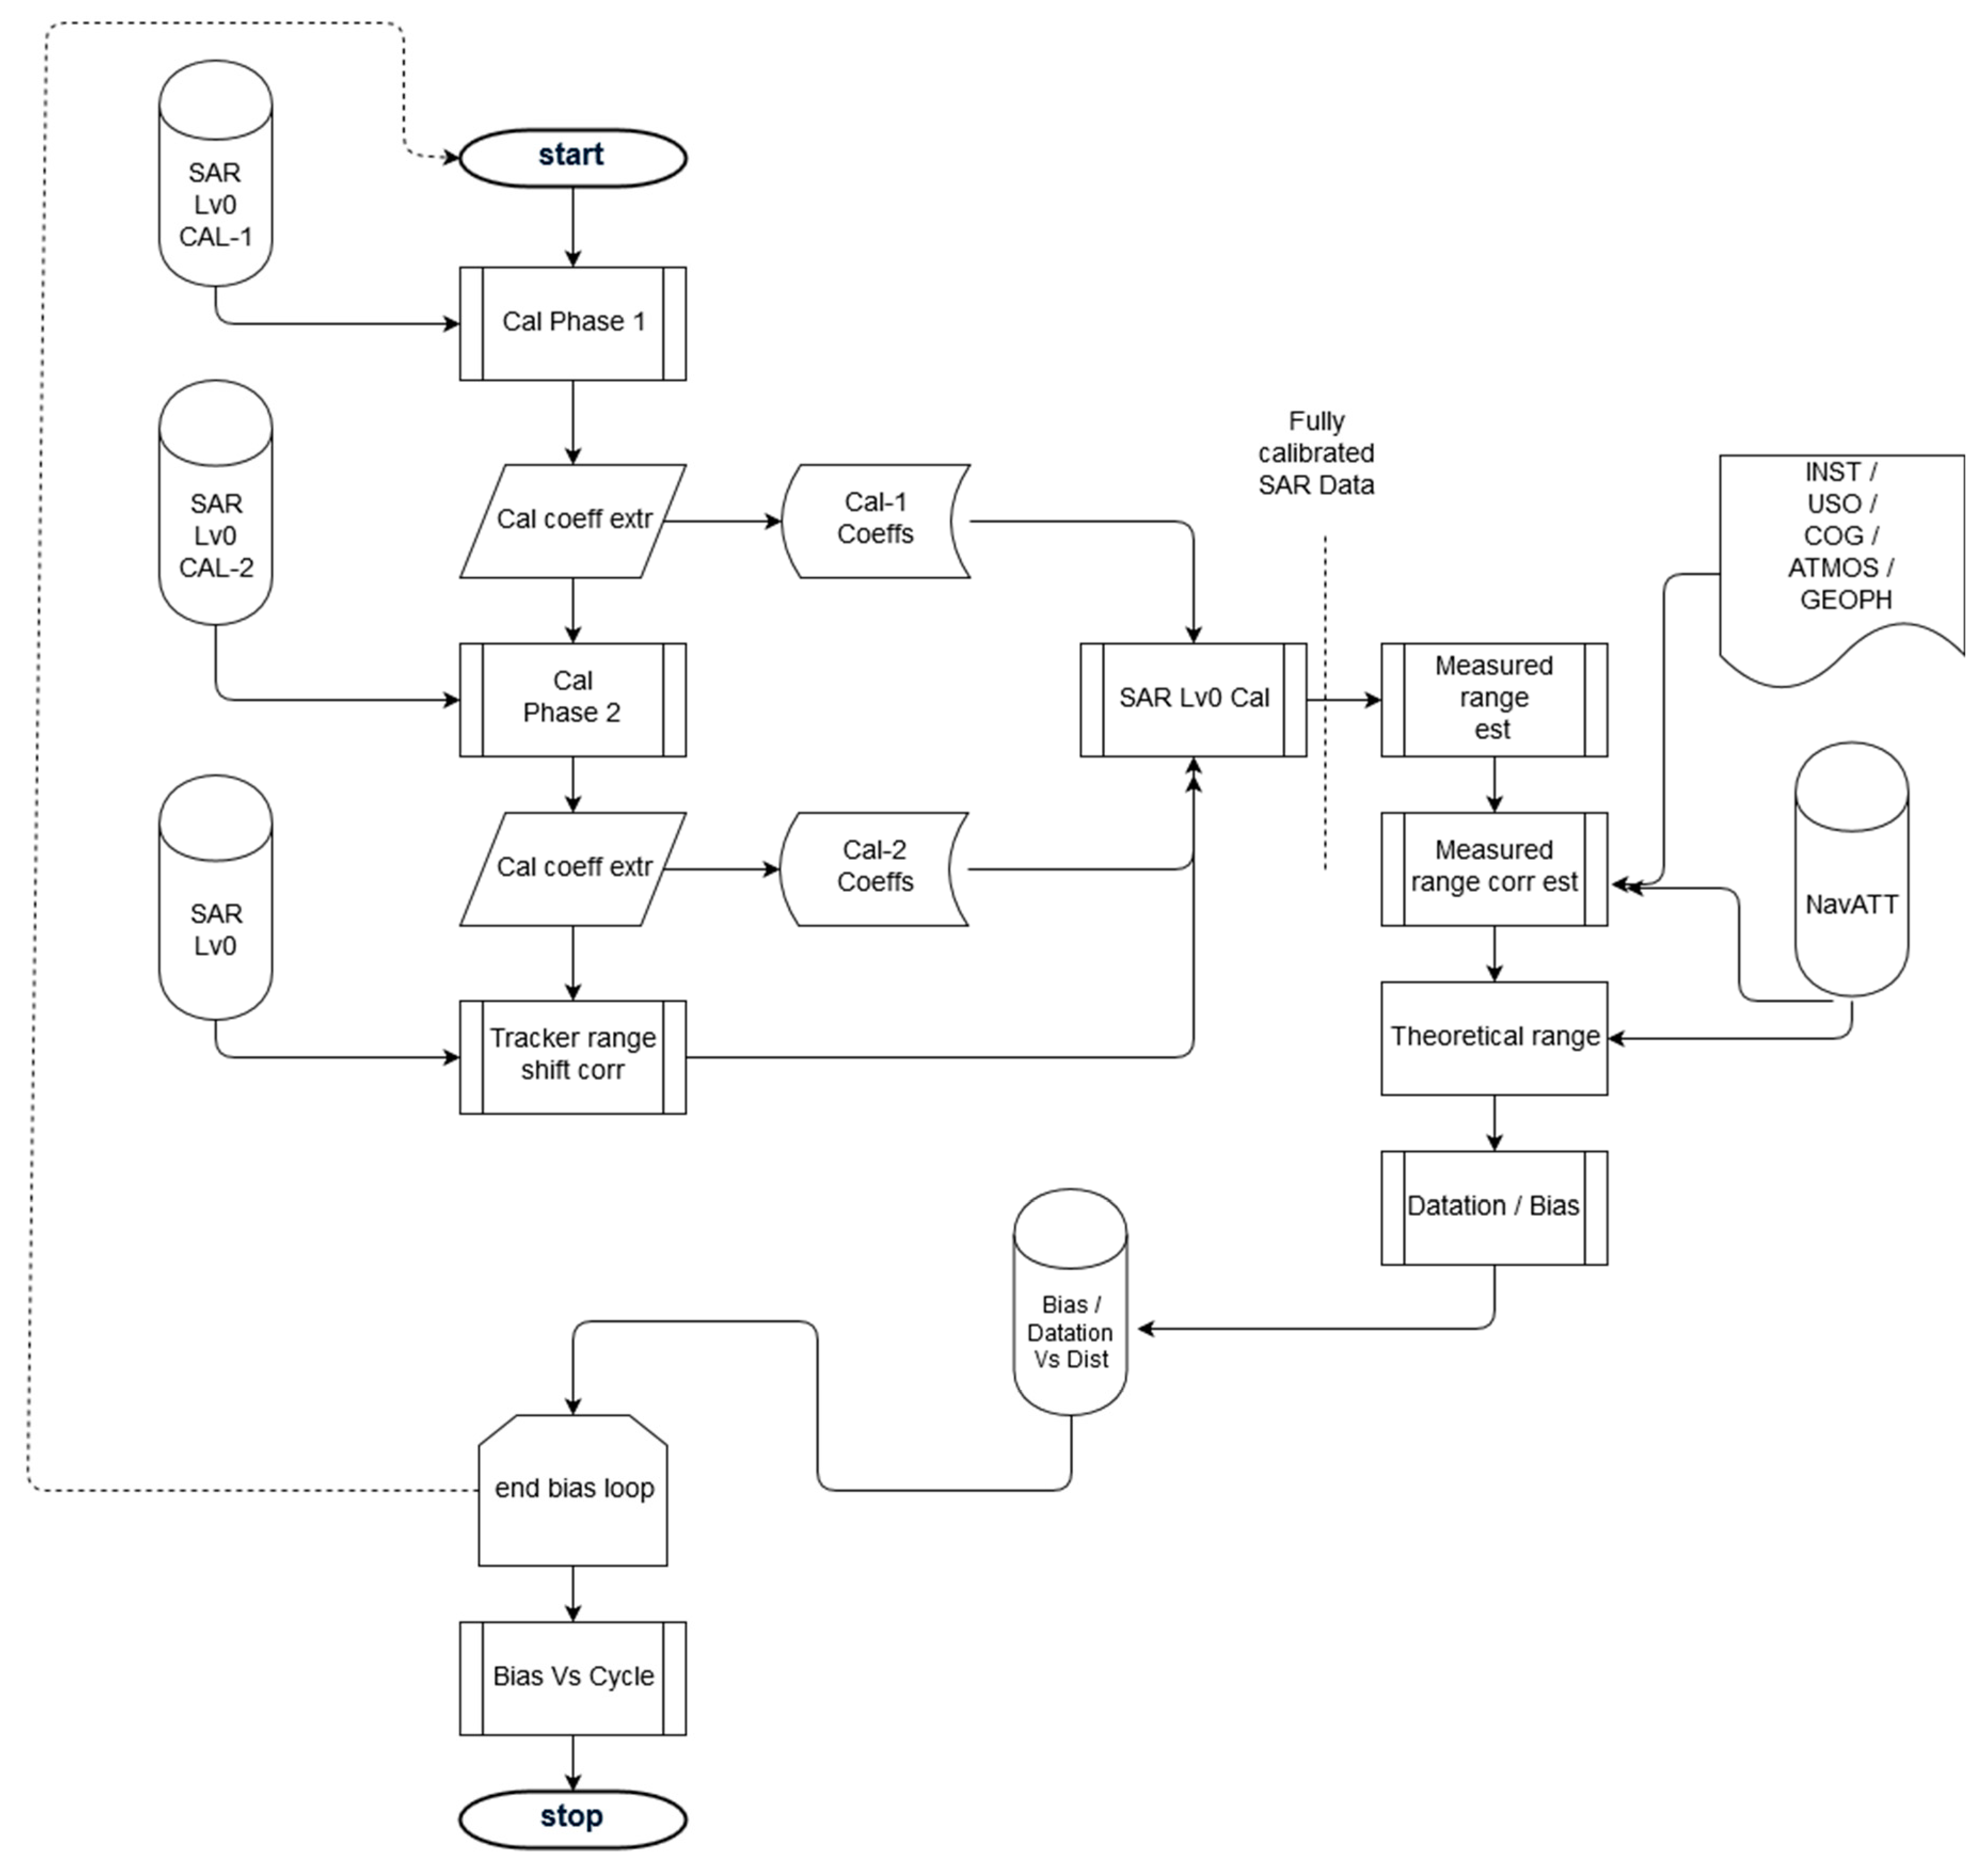
3.1. Transponder Calibration

In satellite altimetry, the actual observation is the two-way travel time of the altimeter’s signal: transmission by the altimeter, reflection by the Earth’s surface, and recording by the altimeter. Subsequently, given that the speed of light is constant, it is the range (signal propagation time) between the satellite and the Earth’s surface that defines the primary measurement in altimetry. Thus, in order to claim direct and absolute calibration of satellite altimeters it is the range bias that has to be examined meticulously by external and independent means on the ground.
Microwave transponders are the apparatus to provide the absolute direct range bias of the satellite altimeter with no averaging of different reflection points and of the dynamic conditions at sea during satellite overpass [13]. In this Cal/Val technique, a transponder on the ground receives the transmitted data by the altimeter signal as the satellite overflies its location. Then, the transponder amplifies it and transmits it back to the satellite. The amplification procedure at the transponder is fully controlled, stable, and designed to ensure that the point target response, such as the one produced by a transponder, is clearly detectable in the recorded signal at the altimeter and certainly distinguishable among other reflections from the surrounding setting on the ground.
Absolute range calibration of altimeters using transponders have been carried out for Envisat [14], Jason-2 [15], CryoSat-2 [16], and Jason-3 [17]. Sentinel-3A transponder calibration results have been presented in [17,18] using the transponder operating at the CDN1 Cal/Val site in West Crete. The technical characteristics of this transponder instrument have been presented elsewhere [8].
The Sentinel-3A altimeter operates under two radar modes: (a) the Low-Resolution Mode (LRM) with the traditional pulse-limited signal transmitted on a 3 Ku-band/1 C-band/3 Ku-band patterns and (b) the Synthetic Aperture Radar (SAR) mode, with a high resolution along its track. SAR mode is made of bursts, each of which contains 64 Ku-band pulses surrounded by two C-band pulses. The SAR mode processing makes use of these 64 echoes within each burst, and it allows narrowing the along track resolution from a few km to about 300 m [19]. The reader can refer to other publications for further details on this the SAR mode altimetry [20,21,22].
Transponder calibration of Sentinel-3A in the SAR mode requires extensive processing of individual pulses within each burst as these were first received and retransmitted by the transponder and later received and recorded by the satellite altimeter in its orbit. In-house software has been developed to process all these data for transponder calibration. It relies upon raw Sentinel-3 Level-0 products along with raw telemetry data. A comprehensive block diagram of the essential and sequential steps involved in the processing of Level-0 products of Sentinel-3A for transponder calibration is given in Figure 7.
Specifically, transponder calibration in the SAR mode consists of the following steps:
  • Data retrieval. The data necessary for the implementation of the transponder calibration processing are: (a) Sentinel-3A Level-0 binary products; (b) altimeter internal calibration files; (c) satellite orbit navigation and attitude data; (d) auxiliary data, including Centre of Gravity (COG) and Ultra Stable Oscillator (USO) data; (e) accurate and absolute transponder’s measuring point coordinates in relation to a reference coordinate system (i.e., ITRF 2014); (f) atmospheric delays (i.e., wet and dry troposphere, ionosphere) of altimeter signals and geophysical Level-2 corrections; (g) the transponder’s internal path delay.
  • Waveform Calibration. This step includes the calibration of the Sentinel-3A Level-0 engineering SAR data products using its internal calibration files (e.g., CAL1 for the time delay in the range instrument correction, CAL2 to compensate distortions in the system transfer function on signal returns, etc.).
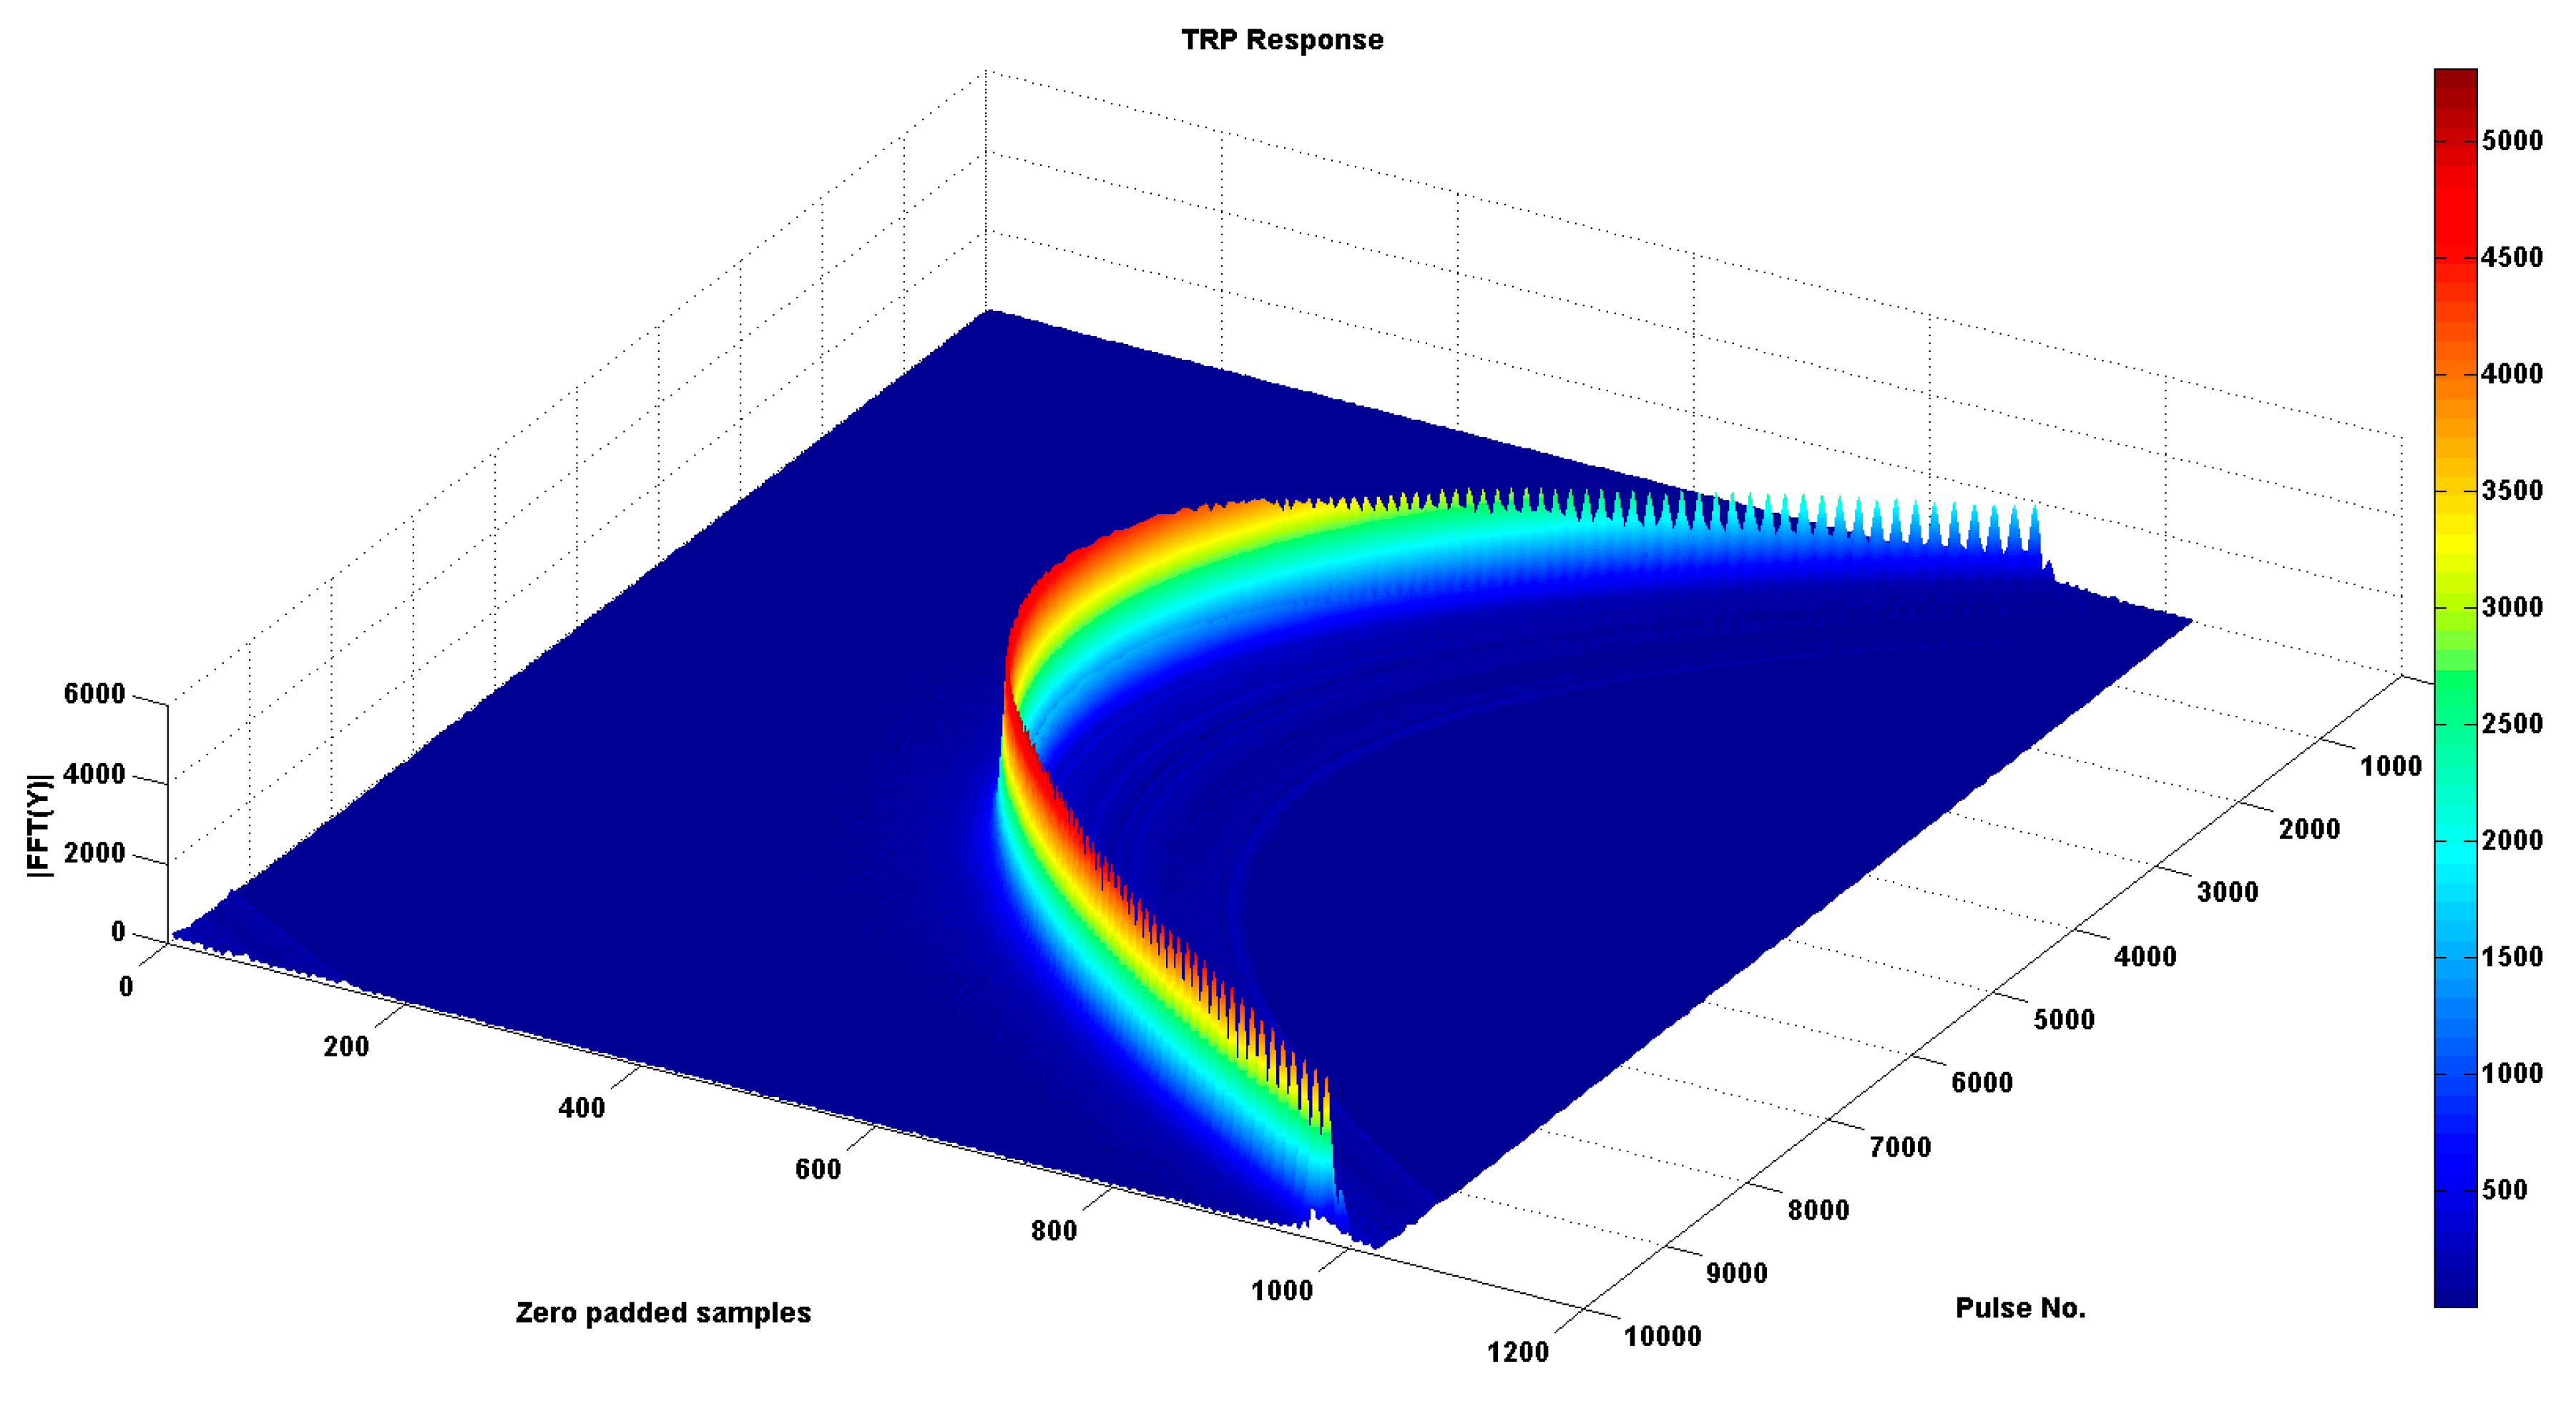
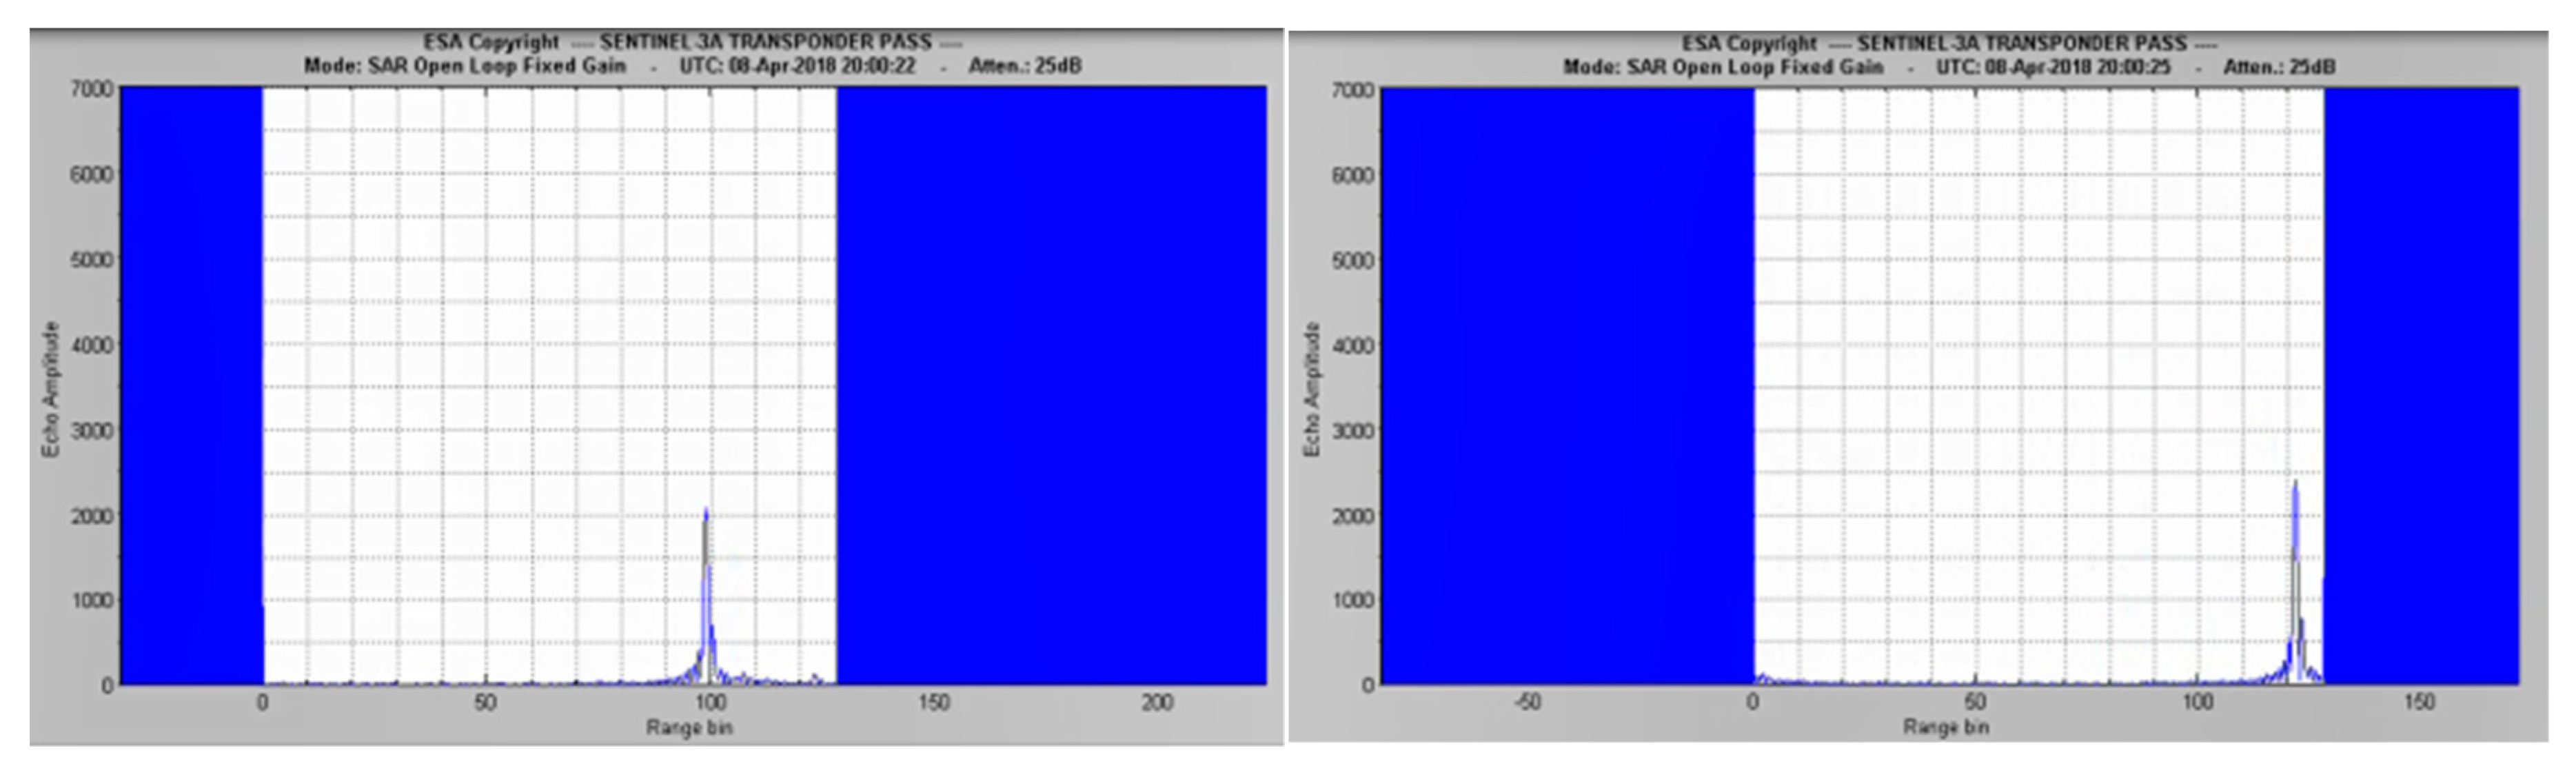
  • Waveform retracking. Used for determining the measured altimeter range. Slant ranges between the satellite and the transponder are computed by waveform retracking of the range compressed SAR data. An example of such a waveform is presented in Figure 8.
    The measured altimeter range is given as the difference between the gate number (bin number) of the peak (maximum) of each pulse and the reference gate number set on the altimeter, multiplied by the actual “bin resolution” (in theory about 3.125 ns for the Ku-band pulse duration). For example, for Sentinel-3 the tracking point is gate 44, i.e., bin index is 43 for Ku-band, or gate 46, i.e., bin index 45 for C-band, as measuring starts from bin index zero (index = 0). Nonetheless, the effective range resolution with which the actual range is to be determined by the altimeter is driven by the width of the point target response recorded with 3dB, and included in its “Autocal” mode [23]. The measured altimeter distance R k between the satellite and the transponder, is given by:
    R k = R t r c + ( B m a x B 0 ) × c τ p 2
    where R t r c is the altimeter distance from the satellite to the Earth’s surface corrected for instrumental delays, such as Ultra Stable Oscillator frequency drift, internal path correction or Doppler correction (Called “tracker range”), B m a x is the bin number of the maximum signal return by the transponder, B 0 is the reference bin number, c is the speed of light, and τ p is the pulse duration in seconds. The altimeter range bias is computed as measured minus theoretical altimeter range after corrections are applied.
  • Corrections on the observed range. The altimeter range Rm, as reckoned in the previous step, is corrected for the following quantities: (a) troposphere and ionosphere delays caused by the atmosphere onto the altimeter’s signal; (b) difference between the satellite’s center of gravity and the altimeter’s effective center of measurement; (c) drift of the Ultra Stable Oscillator in the altimeter; (d) internal delays of the associated instruments as the echo travels back and forth; (e) geophysical corrections (i.e., solid earth tides, etc.) at the transponder location; (f) Doppler correction from both altitude rate and velocity of the satellite.
  • Theoretical Range Estimation. The absolute Cartesian coordinates of the satellite ( x k ,   y k ,   z k ) as well as of the transponder ( X 0 ,   Y 0 ,   Z 0 ) are, respectively, given by the satellite’s navigation files and by local geodetic surveys on the ground. Care should be taken to ensure that all coordinates refer to the same geodetic reference frame of coordinates and time. The theoretical range ρ k is then calculated by the Euclidian distance between the satellite and the transponder:
    ρ k = ( x k X 0 ) 2 + ( y k Y 0 ) 2 + ( z k Z 0 ) 2
  • Range Bias Determination. Given the measured R k and the theoretical range ρ k between the Sentinel-3A SRAL and the ground transponder, the range bias is estimated as “ B i a s = M e a n { k } [ R k ρ k ] ,   k = 1 ,   2 ,   , N ”, after corrections for time-tagging offsets (datation) and Doppler-altitude slope are applied [20,21,23]. All in all, the Sentinel-3A level 0 products have been used as input in the custom-made software to derive the SRAL altimeter’s absolute range bias.

Overflights for Transponder Calibrations

The ascending Pass No.14 of Sentinel-3A flies over the CDN1 transponder Cal/Val site at 20:00:12 UTC. This event is repeated every 27 days as a result of polar orbits of this satellite. The first transponder calibration for Sentinel-3A commenced on 9 April 2016 (Cycle No.3). Since then, roughly 30 transponder calibrations have been carried out, with a success rate of 95% and clear transponder responses on SRAL records (Figure 9). Only two calibrations had to be canceled because of extreme weather conditions (4 January 2017, Cycle No.13) and site maintenance (8 August 2017, Cycle No.21).
After each satellite overpass, within 24-h, a movie presentation of the actual and continuous transponder response is created. This movie shows the transponder echo entering the tracking window, reaching its peak (maximum spike at the “point of closest approach”), and then leaving the tracking window (Figure 10).

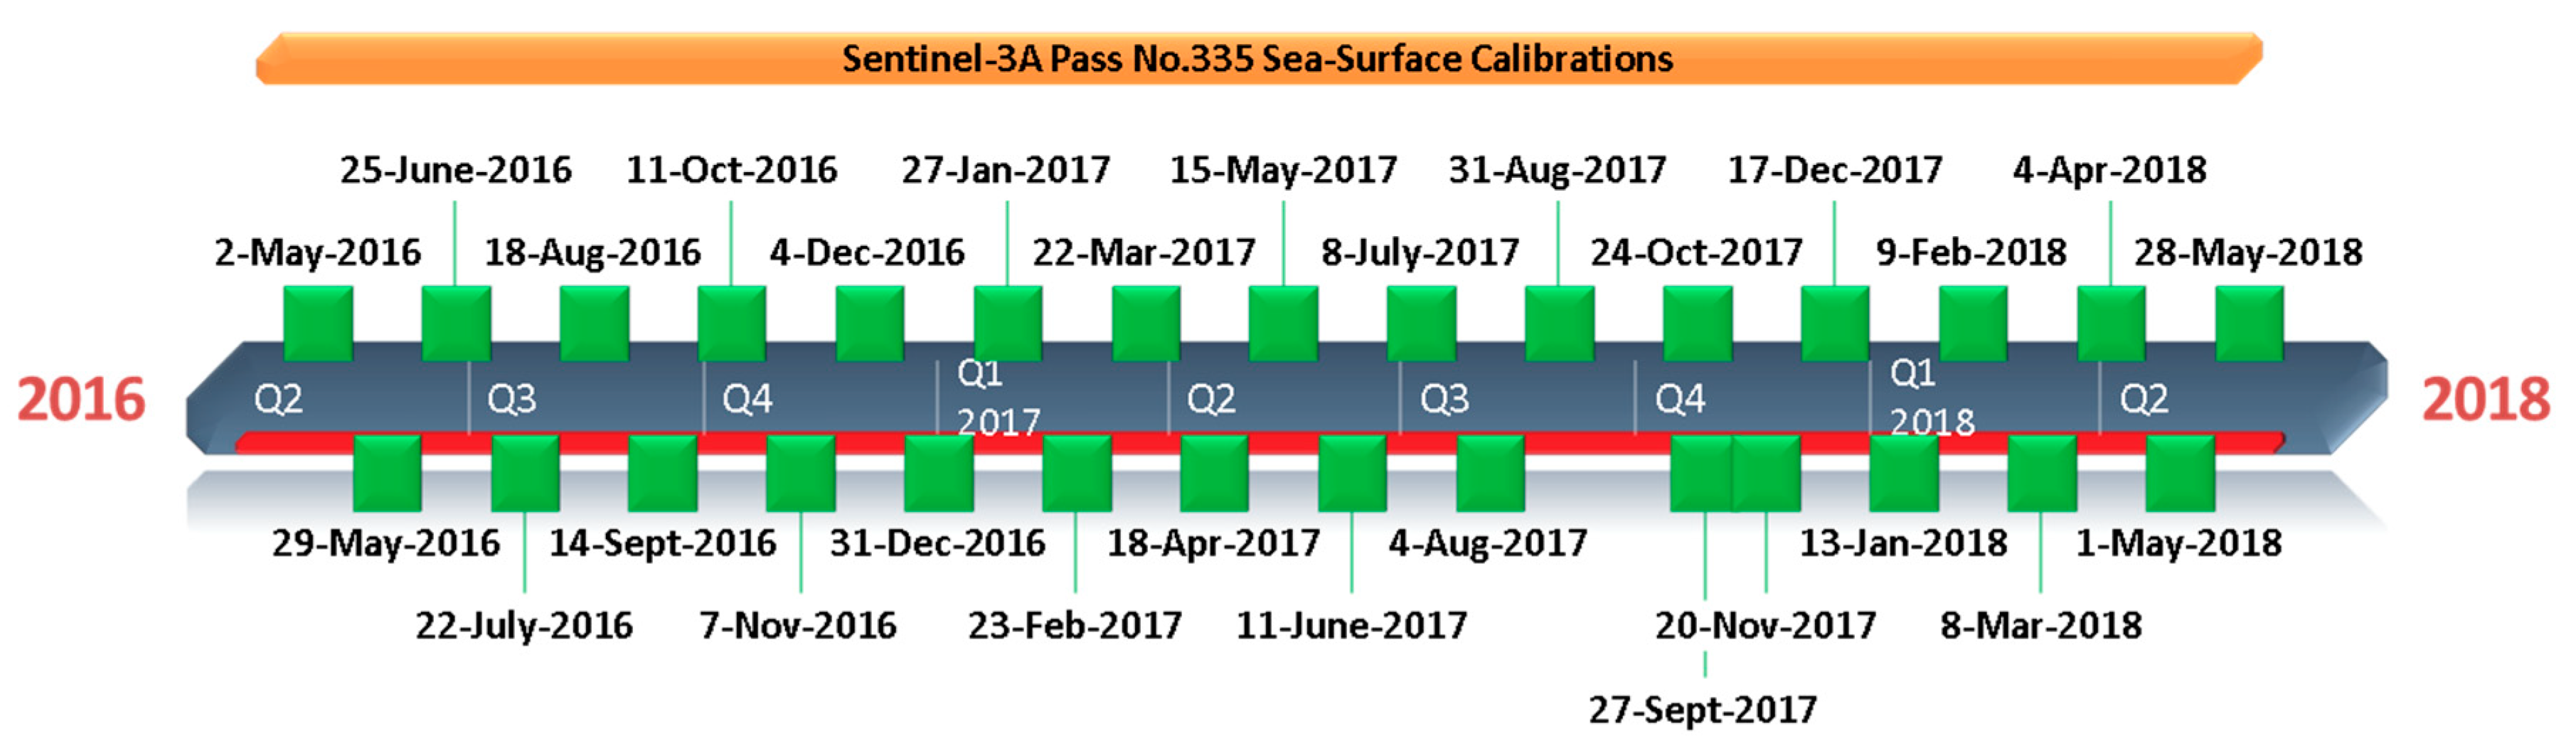
3.2. Sea-Surface Calibration

Altimetry calibration relying upon sea-surface heights has been customarily carried out in open seas though for the past few decades also in coastal regions and inland waters [24,25,26,27]. Calibrations usually take place where satellite observations are not contaminated by land. This has, up to now, been accomplished by setting up Cal/Val facilities on either small infrastructures at sea (oil platforms or calibrating instrumentation in shallow waters) or on coastal or islet sites next to open oceans where altimeters measure. In the first case, small-scale infrastructures do not contaminate the altimeter’s signal and are commonly located exactly under the satellite altimeter’s ground-track. In the second case, coastal Cal/Val sites need to transfer the in-situ reference measurements to open sea where satellite measurements are valid.
The Harvest platform, USA [24] and Bass Strait, Australia [25] belong to the first category, whereas the two European permanent Cal/Val facilities in Corsica, France [26] and Gavdos/Crete, Greece [27] represent the second category.
In the Gavdos/Crete Cal/Val facility, the sea-surface calibration has been implemented in sea regions where the Sentinel-3 SRAL and MWR observations are not contaminated by land mass (Figure 11). The groundtrack of Pass No.14 of Sentinel-3A ascends west of Gavdos and continues north to the other transponder Cal/Val site on the mountains of west Crete. This pass has been calibrated using the transponder; however, before it reaches that site, it comes to pass west of the Gavdos Cal/Val site where sea-surface calibration is put into action. Additionally, the other Pass No.335 of Sentinel-3A descends from southwest of Crete to south and intersects the Gavdos calibration site. Calibration values for this descending pass are also presented applying sea-surface calibration and crossover analysis.
During the satellite overpass, the instantaneous sea-surface height at the reference Cal/Val location k 0 is established from tide gauge measurements and absolute geodetic heights. Given the satellite’s velocity (~7 km/s), the local tidal range and the tide gauge sampling (i.e., 6-min, 1-min), hourly values of the tide gauge measurements (centered to the satellite pass over the point-of-closest approach) are used to settle the value for the S S H ( k 0 ) . Then, this value is transferred to open sea in the calibrating regions using reference models.
Detailed and precise models have been constructed for the mean dynamic topography ( M D T ) and geoid undulation ( N ) in this region [28]. Models are often being validated as a matter of usual practice by means of dedicated boat campaigns. They are used to transfer S S H from the Gavdos reference Cal/Val site to open seas [29,30], by first establishing its sea level anomaly ( S L A ):
S L A ( k 0 ) = S S H ( k 0 ) N ( k 0 ) M D T ( k 0 )
The sea level anomaly S L A ( k ) is also required for altimeter calibration over the sea surface along the satellite’s track. Subsequently, at each satellite measuring point k and in open seas, the following quantities are determined: (1) the Sea Surface Height S S H ( k ) , calculated as the difference between altitude and altimeter range, after corrections are applied, (2) the geoid height N ( k ) above reference ellipsoid, and (3) the mean dynamic topography M D T ( k ) . Then, the estimated absolute sea-surface height bias for the altimeter can be computed as:
B i a s ( k ) = S L A ( k ) S L A ( k 0 )
The bias per cycle for each Sentinel-3A Pass No.14 and Pass No.335 is thus determined.

Dataset for Sea-Surface Calibration

The Sentinel-3A Pass No.14 is an ascending pass, with groundtrack west of Gavdos. This means that just a few seconds before reaching from the south the CDN1 transponder Cal/Val site on the mountains, the satellite makes its way up north from the sea, but 10–15 km west of the Gavdos (Figure 12 left). Additionally, the descending Sentinel-3A Pass No.335, coming from the north, crosses at a point on the island where the Gavdos Cal/Val facility is located, at about 08:47:00 UTC every 27 days (Figure 12 right). At least two GNSS receivers, as well as three tide gauges, have been continuously operating at the Gavdos Cal/Val facility during these Sentinel-3A Passes. This helps maintain a high success rate for sea-surface calibrations (Figure 12).
The data used for the sea-surface calibration of Sentinel-3A are SAR mode, Level 2 products, WAT data, Non-Time Critical orbits, and with Processing Baseline PB 2.2 and for its cycles 1–31 (June, 2018).

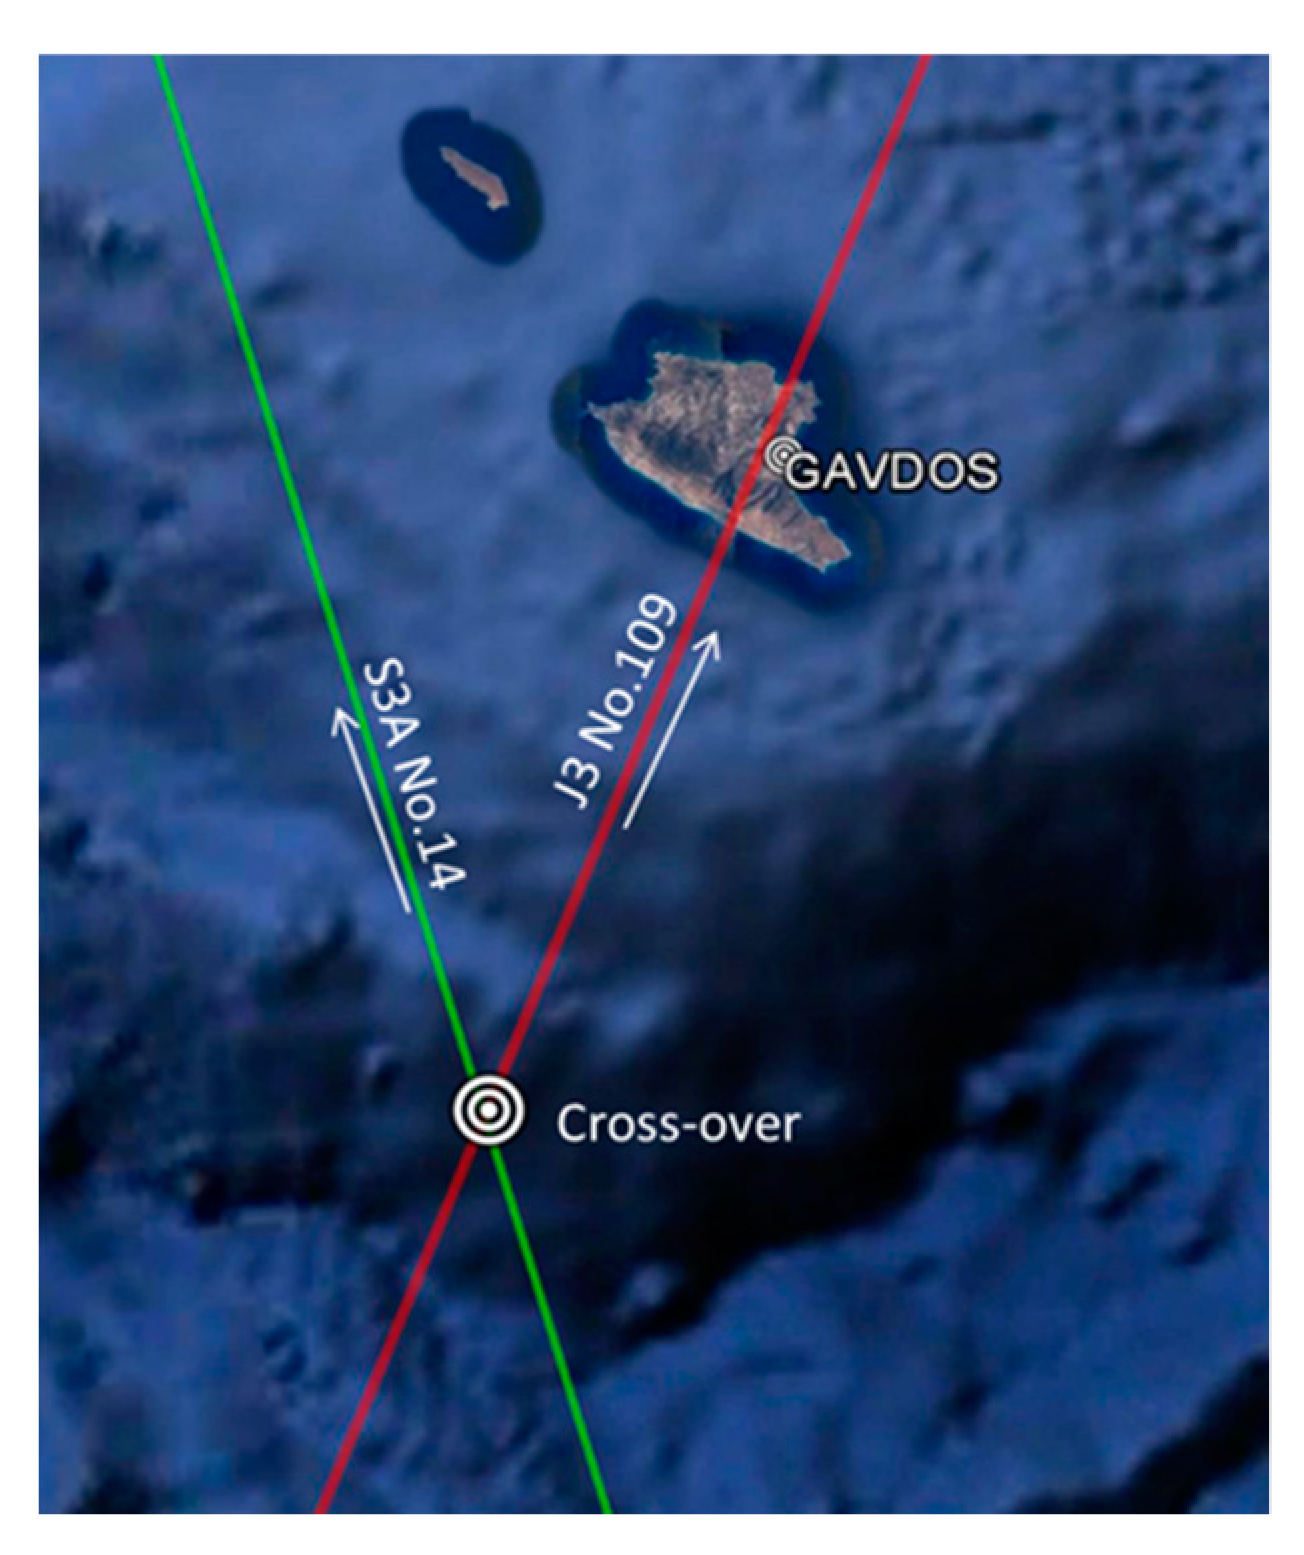
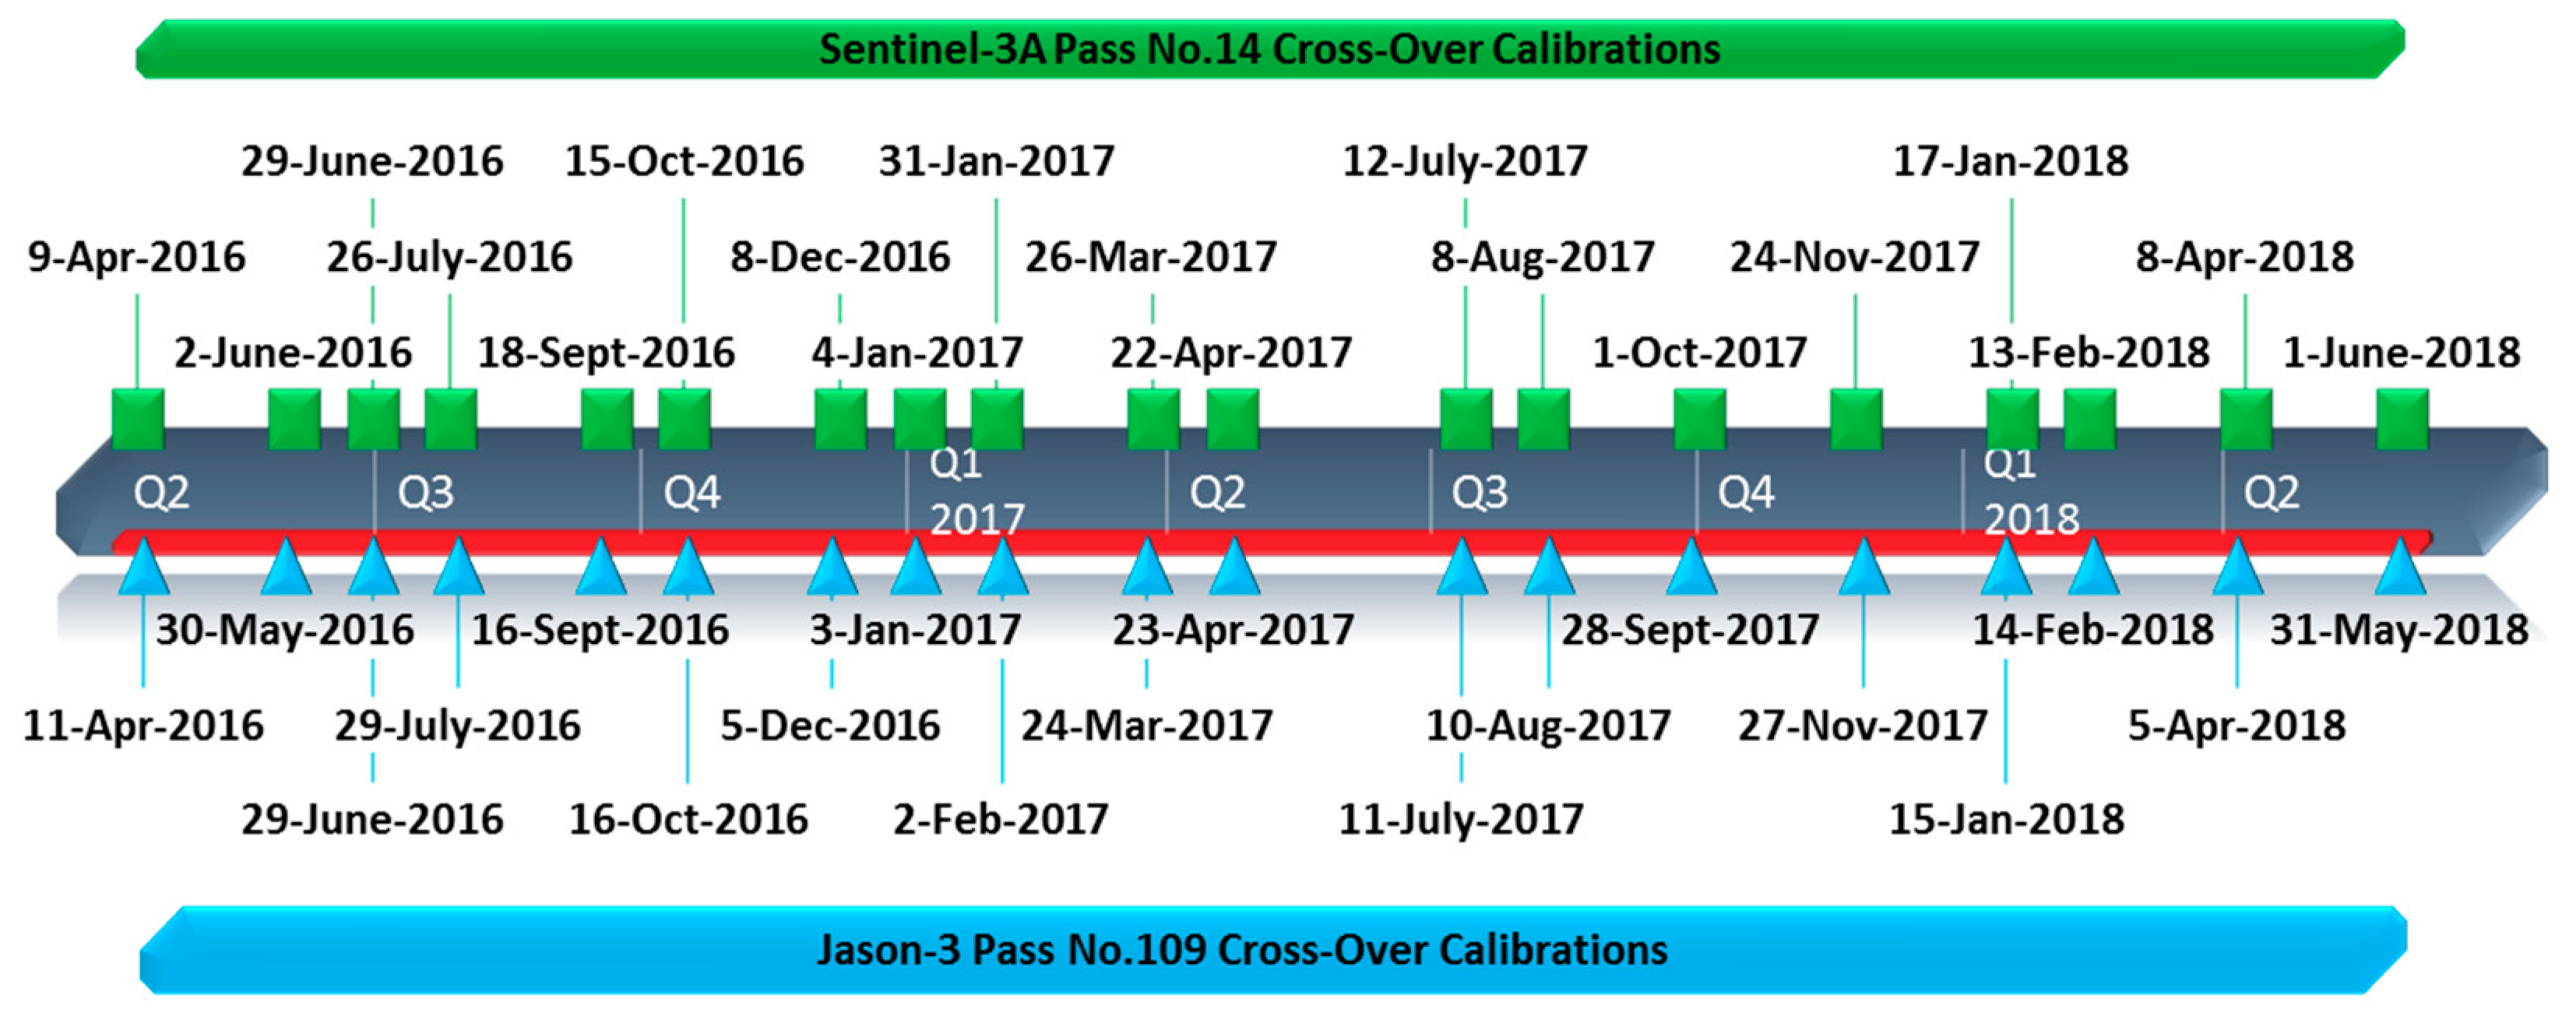
3.3. Crossover Analysis

Multi-mission crossover analysis provides relative but global calibration results and supports the discovery of geographically distributed error patterns [31]. This analysis was initially applied in [32], while a detailed description of this methodology is given in [33].
Additionally, a crossover analysis has been carried out with nearby cross-over points in the vicinity of the PFAC Cal/Val sites. The Sentinel-3A Pass No.14, for example, intersects with Jason-3 Pass No.109 about 20 km south of Gavdos (Figure 13). The analysis involves the examination of the sea-surface heights, as estimated by Sentinel-3A and Jason-3, when they overpass that crossover location within a window of ±3 days [34].
Dates of the crossovers as of April 2016 for both missions are briefly shown in Figure 14. An analysis of the sea-surface heights as estimated by the Sentinel-3A and Jason-3 altimeters at this crossover location indicates that Sentinel-3A measures heights higher than Jason-3 (i.e., S3A-JA3) by about +4 cm with a standard deviation for the estimated mean as ±8 cm. Results for this crossover analysis have also been reported in [35].

4. Sentinel-3A SRAL and MWR Cal/Val Results

The latest calibration results for the radar altimeter and for the microwave radiometer of Sentinel-3A, are given in this section, along with their uncertainties.

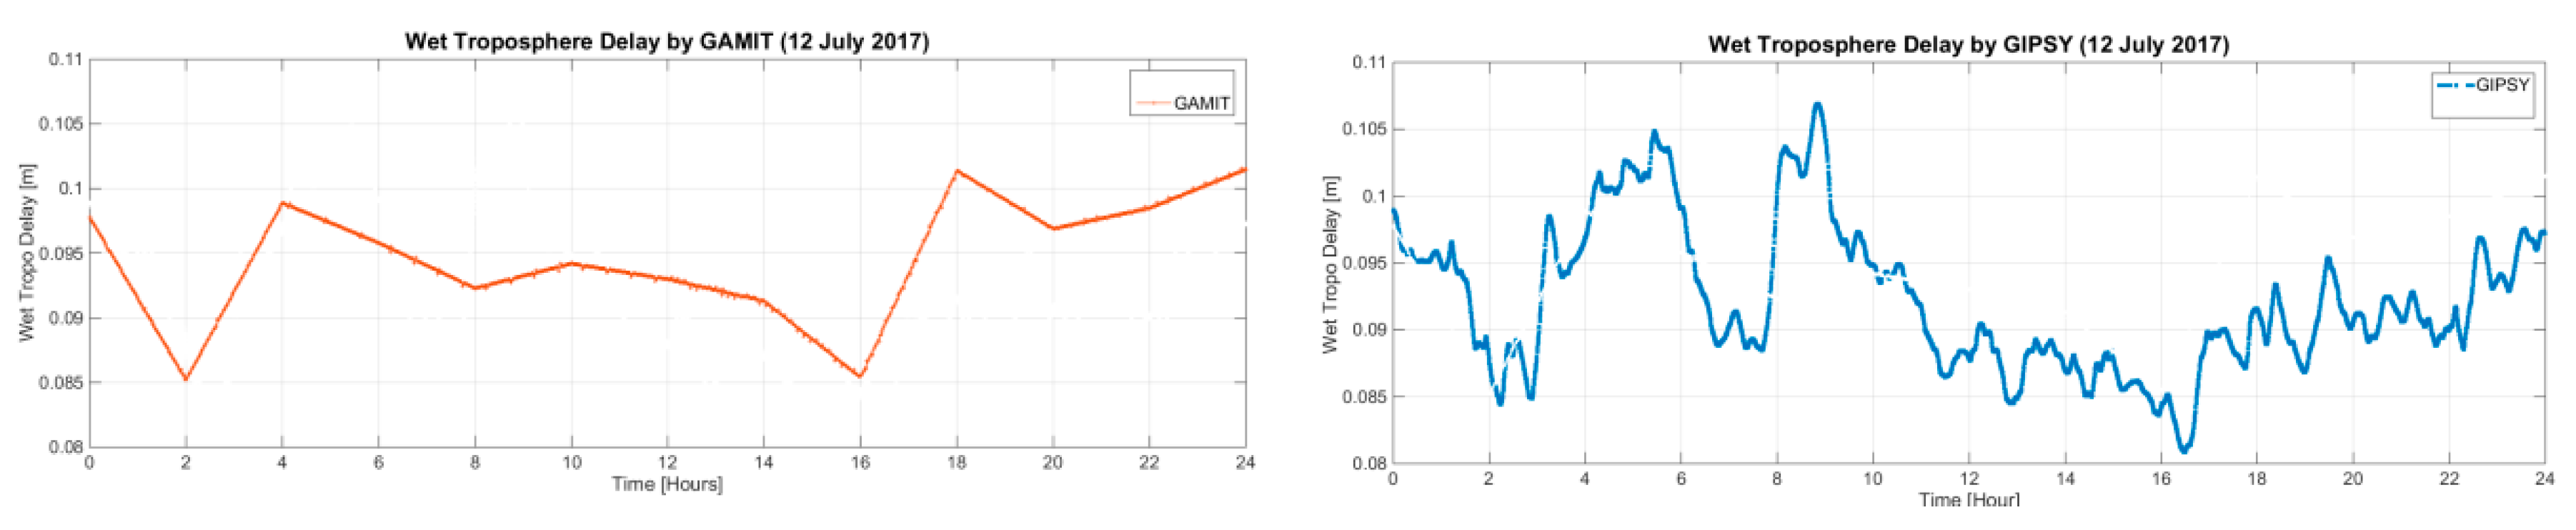
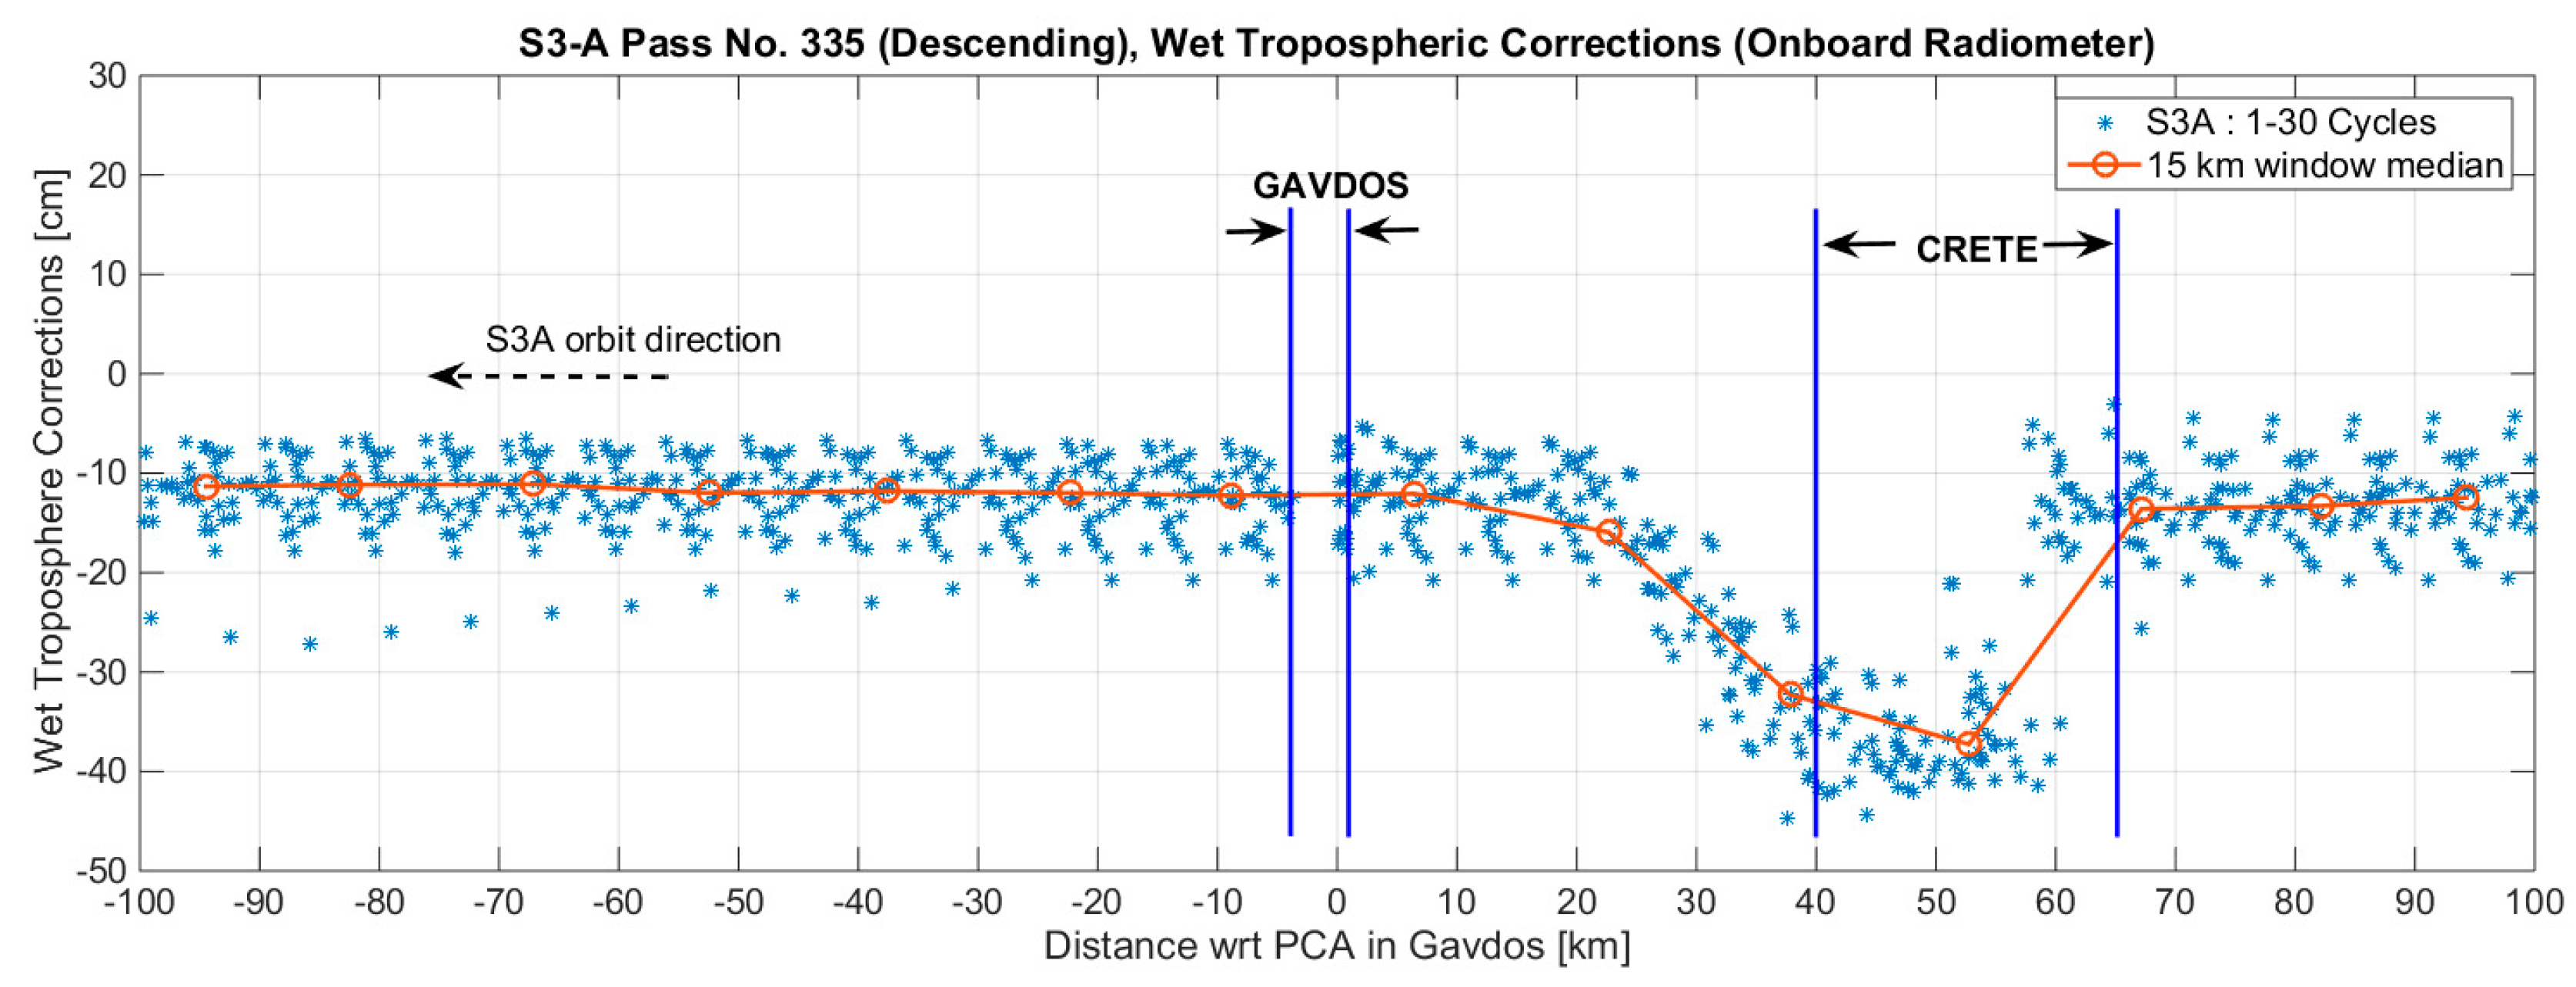
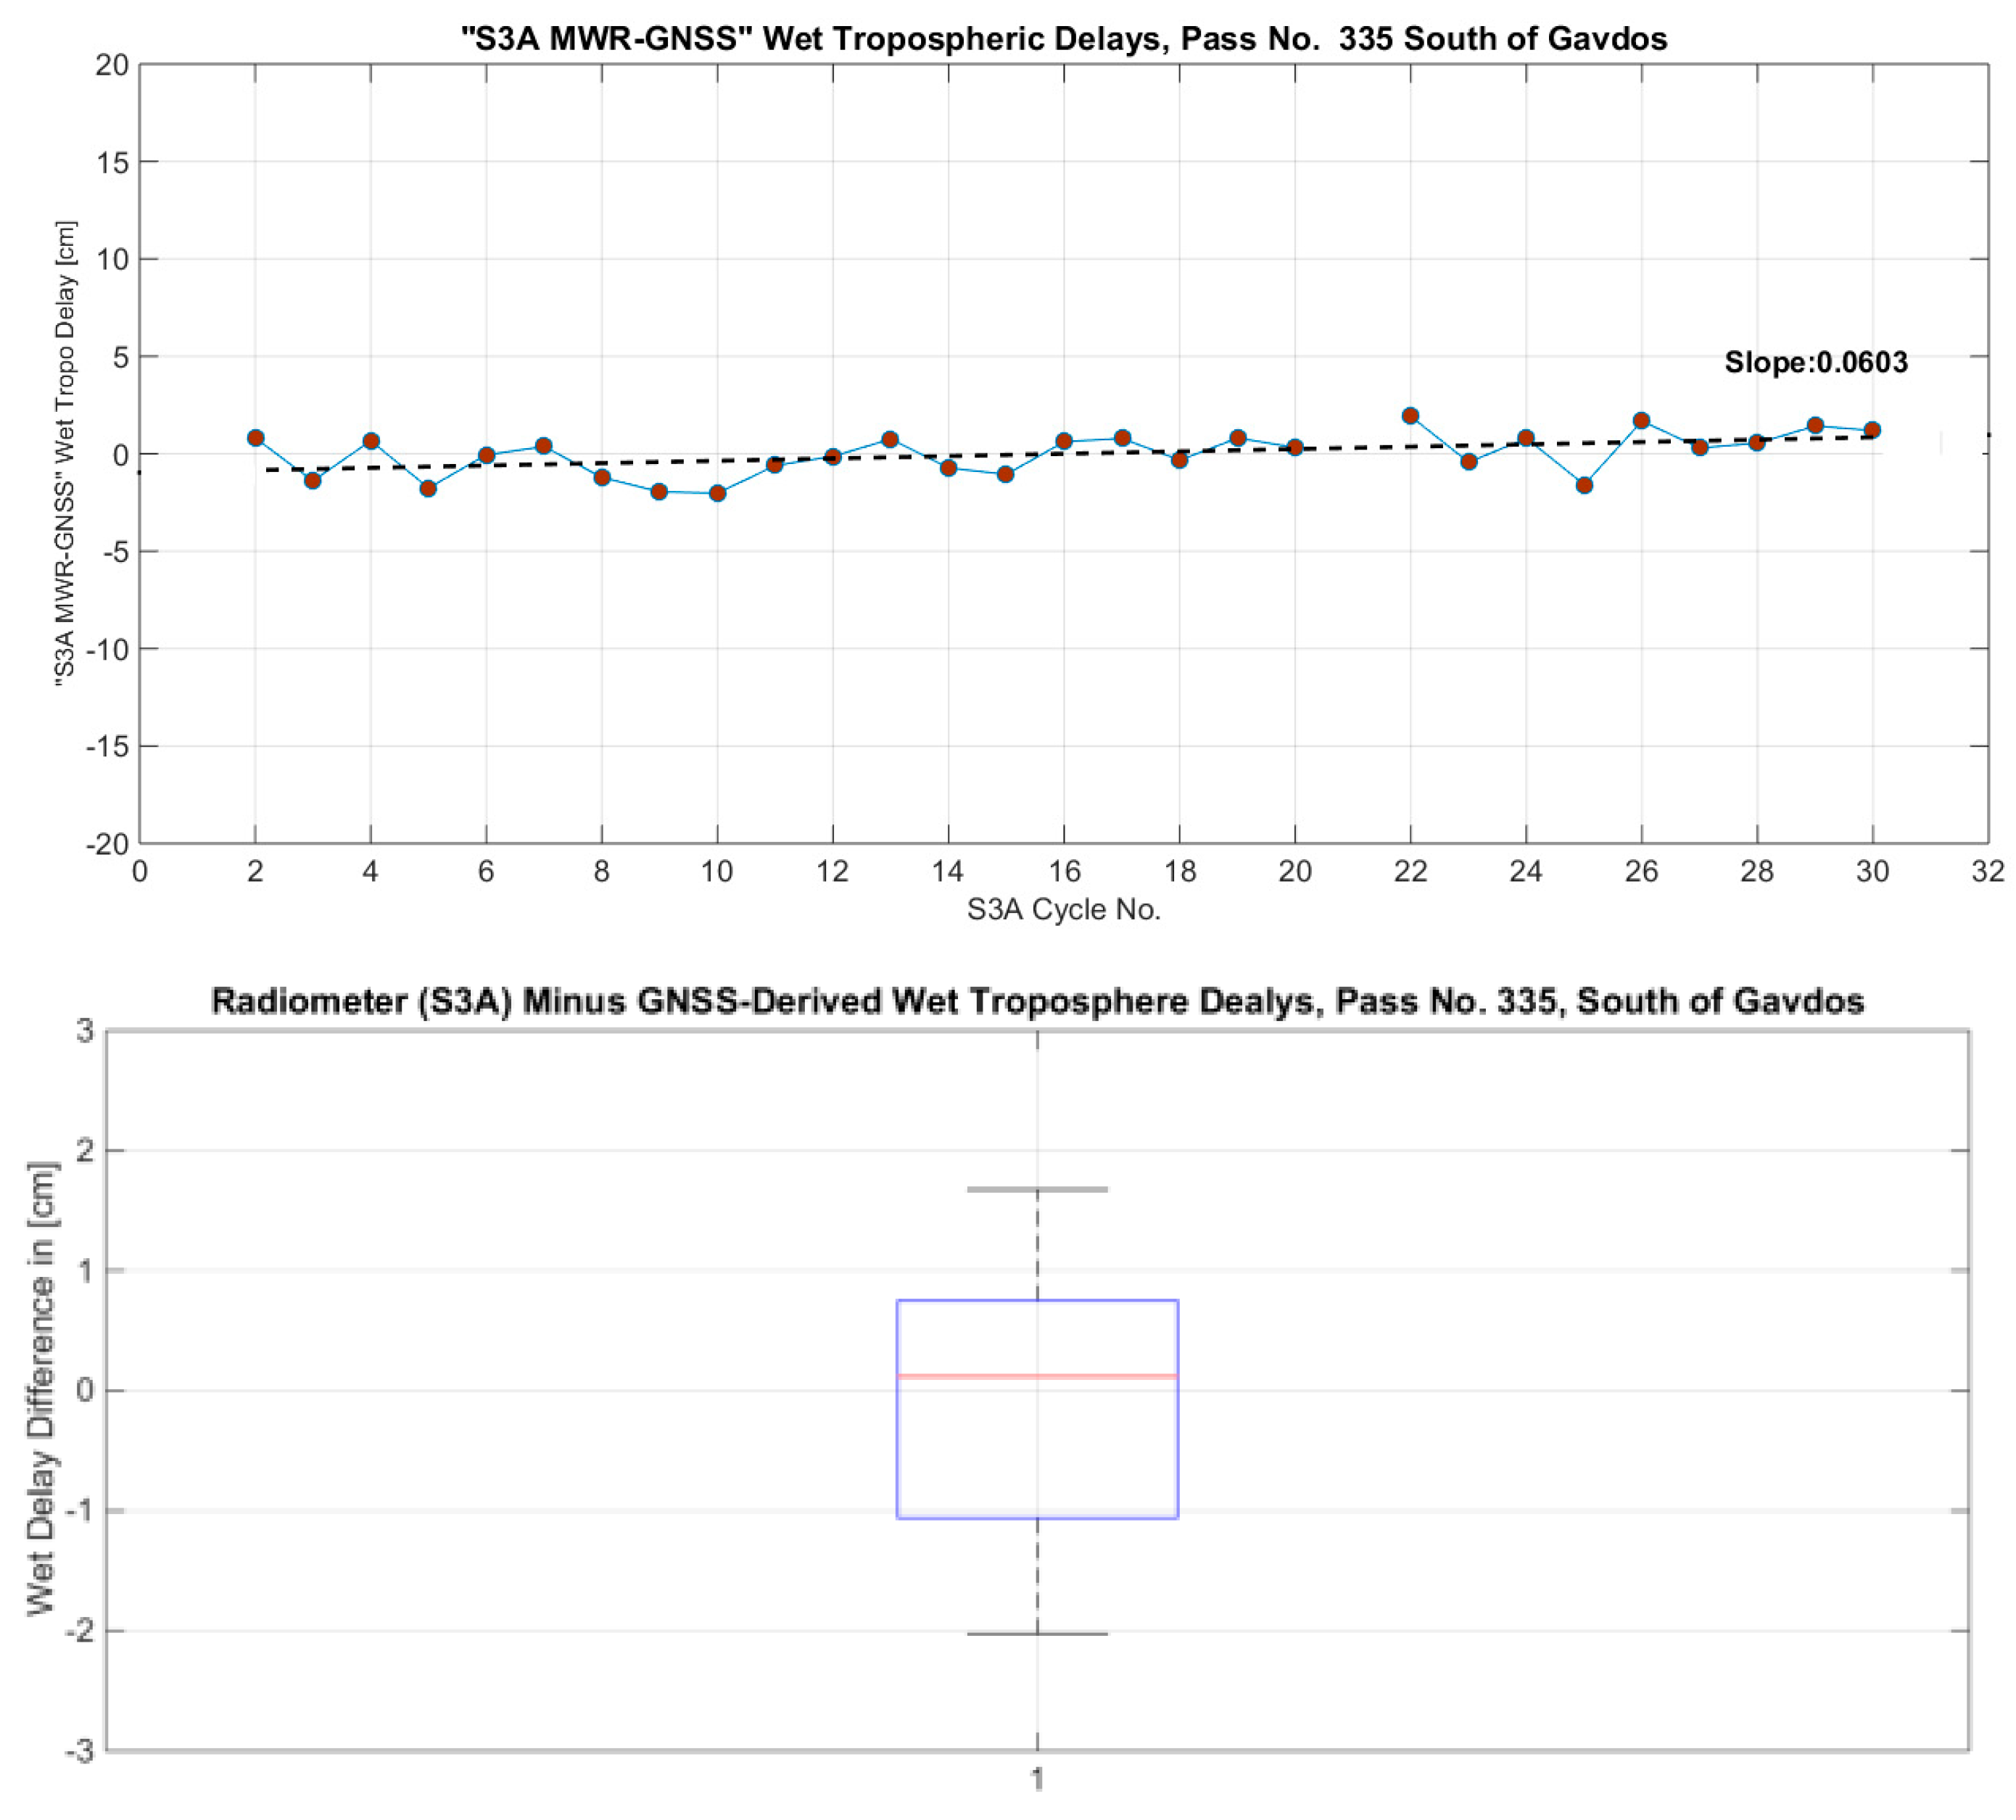
4.1. Validation of MWR Measurements

The MWR is a dual frequency (23.8 GHz & 36.5 GHz) radiometer that observes the natural microwave emissions for the Earth and its atmosphere. Its observations are used to estimate, and subsequently correct, the radar altimeter signal delays caused by the atmosphere and, most importantly, its wet troposphere component [4]. The MWR’s sea observations are contaminated in a distance up to 20–25 km from any land mass [36]. Thus, it is not possible to use it when the transponder calibration is employed up in the mountains in West Crete. On the contrary, the MWR observations in the open sea are applied regularly when sea-surface calibration is implemented.
In this work, tropospheric delays coming from the Sentinel-3A MWR have been cross-examined against those derived by GNSS coastal stations operating continuously next to the Cal/Val sites. The uncertainties of the GNSS-derived zenith tropospheric delays are of the order of some millimeters [36].
The dry troposphere and ionosphere delay may be retrieved with accuracy (<1 cm) from global models as their temporal variation is quite small. This is not the case for the wet troposphere delays: these cannot be modeled flawlessly as they change rapidly over time and exhibit values of several cm (e.g., 5–15 cm in wet troposphere over several hours). Hence, the meteorological parameters of temperature, pressure, and humidity are continuously monitored at the PFAC Cal/Val sites. Furthermore, it has been observed that different GNSS processing software (i.e., GAMIT, Bernese, and GIPSY) may produce slightly different values for the troposphere at times, depending on the algorithms applied and their model resolutions (see Figure 15 as a demonstration example).
The wet tropospheric corrections (WTC) as produced by Sentinel-3 radiometer, along Pass No.335, have been compared against corrections derived by GNSS processing. Satellite measurements that are flagged as invalid have not been taken into evaluation. The individual radiometer WTC profiles along-track of each cycle of Sentinel-3A have been plotted with respect to distance from the point of closest approach in Gavdos and are shown in Figure 16. The central red line represents a moving median within a window of 15 km of radiometer values as a function of distance. Positive distance denotes north of Gavdos, while negative distance stands for locations south of Gavdos.
Then, the wet tropospheric delays, as determined by the S3A radiometer, were compared against those derived from the GNSS monitoring stations in Gavdos. Comparisons have been made between the last valid value of the radiometer, about 15–20 south of Gavdos (depending on the S3A pass), and the value produced at the reference GNSS sites in Gavdos, at the same time. It seems that there is an upward trend in the plot of Figure 17 with a slope of +0.0603 cm/cycle (98% significance). The average value of that difference in the wet troposphere delays comes to −0.09 cm, a value very close to zero. The standard deviation for its average is ±2 mm. Additionally, a certain larger number of differences seem to be negative rather than positive (lower plot of Figure 17, asymmetrical distribution of differences with respect to central location, i.e., median). The Root-Mean-Square value is estimated to be +1.06 cm. This RMS error of the observed satellite WTD is in agreement with values presented elsewhere [36,37].

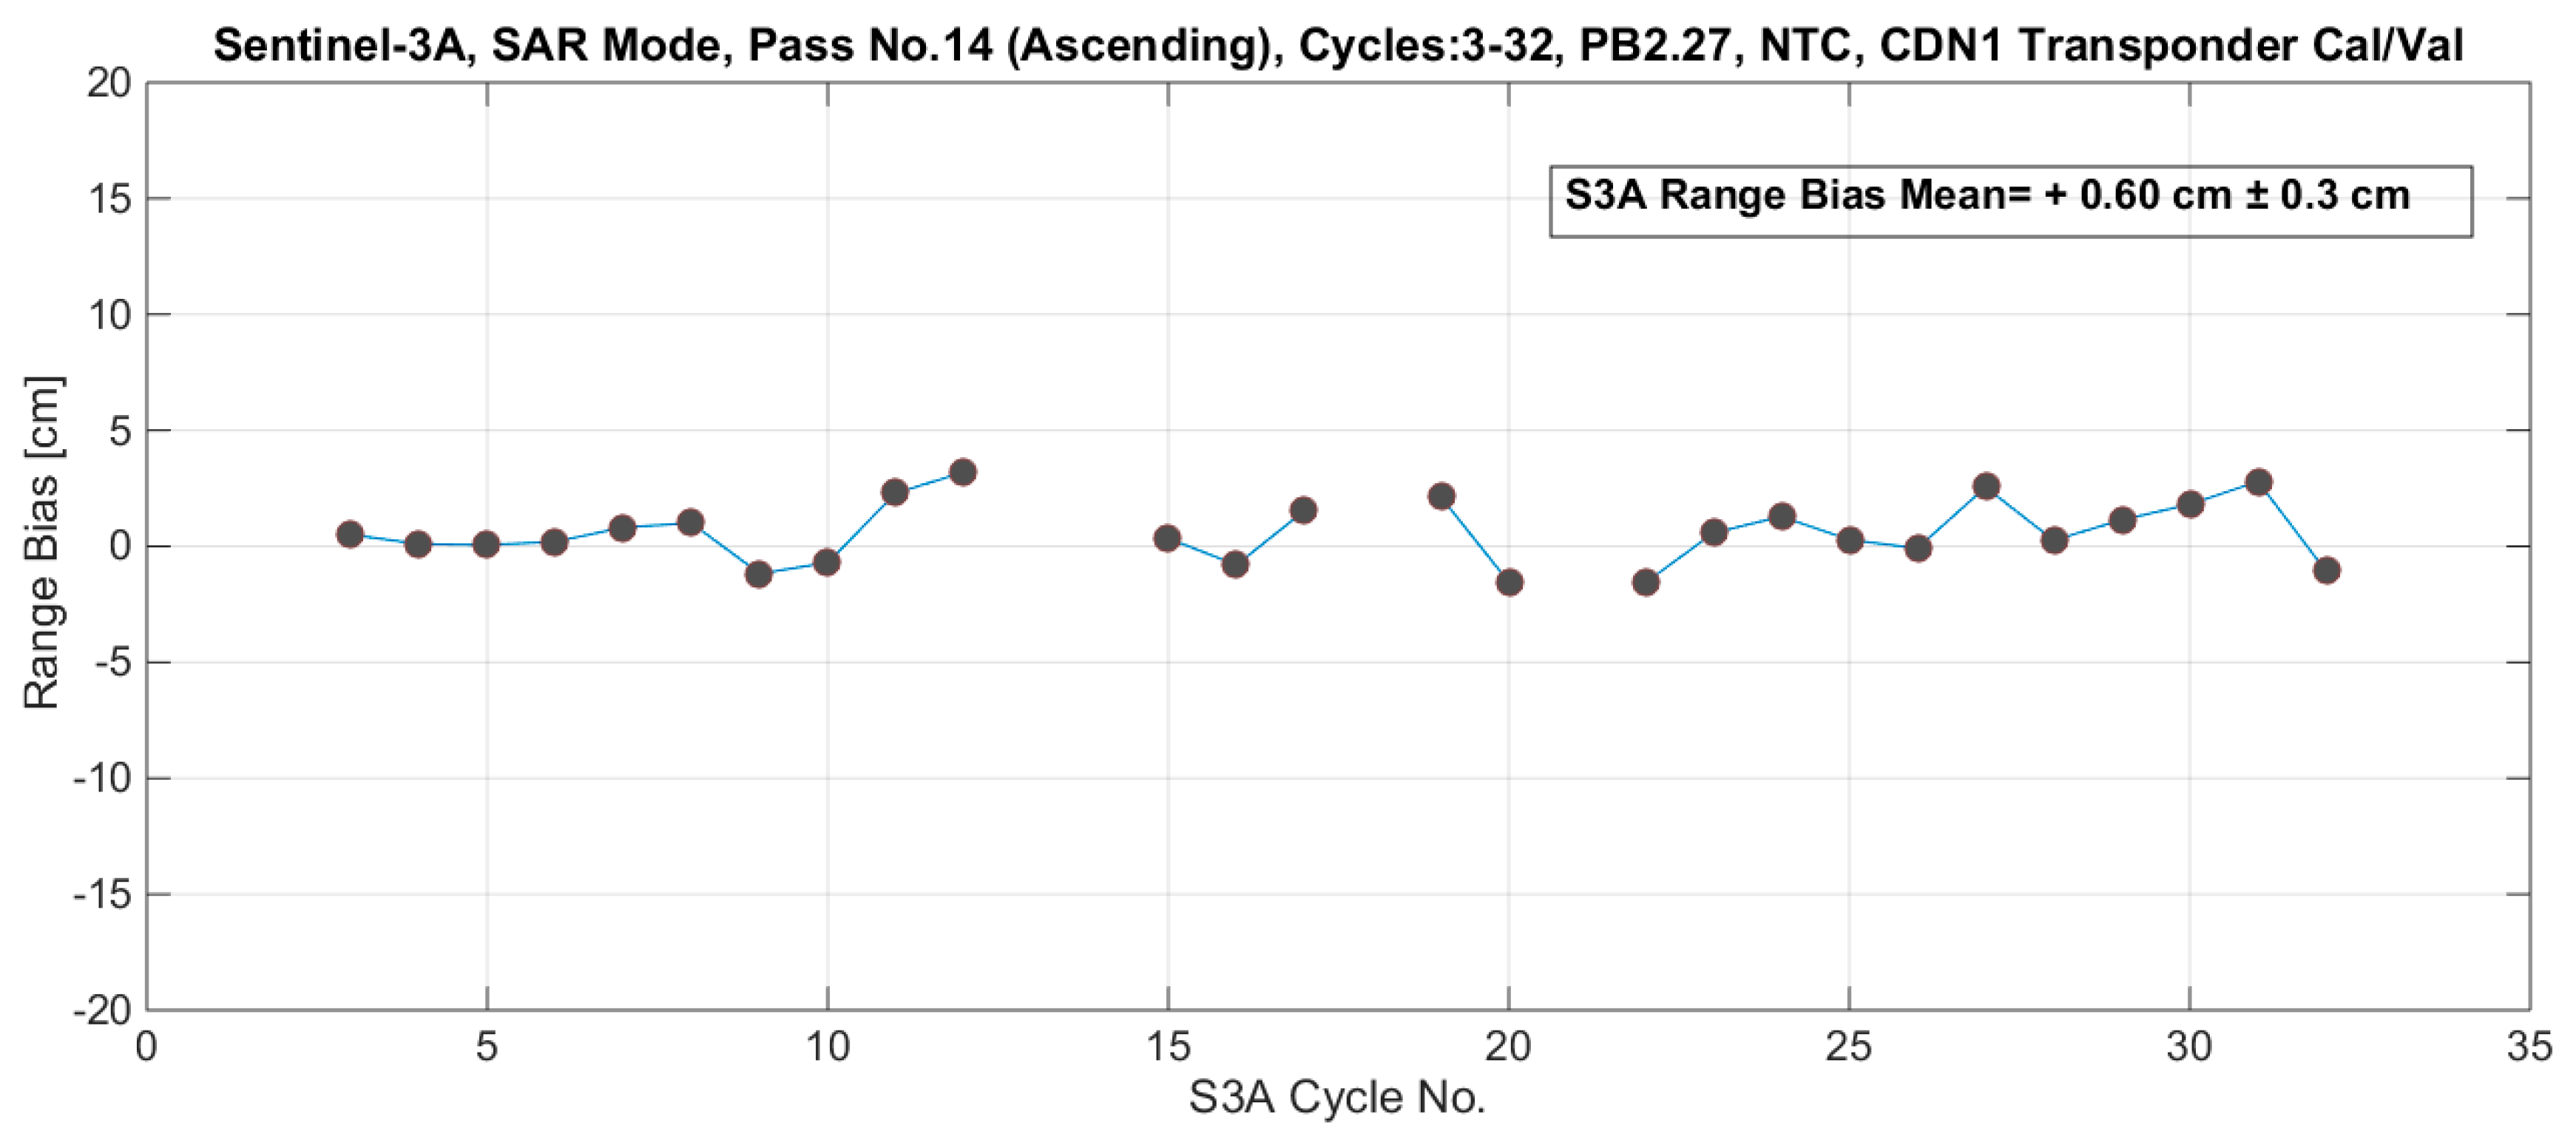
4.2. Transponder Calibration Results

Absolute coordinates for the transponder were supported by two continuously operating GNSS stations and by periodic geodetic and local surveys at the CDN1 Cal/Val site. Final coordinates for the transponder reference center were delivered after diverse GNSS processing (different receiver makes, processing, and procedures) was carried out, along with a weighting mechanism depending on component uncertainties. Figure 18 shows the two GNSS stations of CDN0 and CDN2 and the way final positioning results were produced for the transponder reference center. Atmospheric delays were derived through GNSS processing and at the time of satellite overpass.
The absolute range bias of Sentinel-3A Pass No.14, and for the period under consideration and the dataset available, is illustrated in Figure 19. Level-0 data products, with Non-Time Critical orbits in SAR mode have been used for cycles 3 to 32.

Uncertainty Budget for Transponder Calibration

This uncertainty analysis attempts to standardize practices for reporting uncertainties in altimetry calibration. To express the uncertainty for the results in range bias, as previously presented, a two-stage procedure was required. Specifically, this depended upon: (1) the identification of all the parameters, components and constituents that contribute to the transponder error budget, and (2) the quantification of each error contribution, following international units and standards [38].
As a first step in this work, we started to approximate procedures for analyzing uncertainty by assuming residuals were to be random and normally distributed, with no autocorrelation. The International Standards Organization Guide to Uncertainty in Measurement [38] classifies elemental uncertainties in two categories: Type A and Type B. Uncertainties that can be evaluated by statistical methods are treated as Type A uncertainties, and those evaluated by any other means (scientific judgment, previous measurement data, experience of the behavior of instruments, manufacturer’s specifications, data provided in calibration and other reports, uncertainties assigned to reference data taken from handbooks, etc.), are treated as Type B uncertainties. Type B error constituents [38,39], are commonly built up step by step and gradually based on knowledge accumulated from prior measurements, instrument certificates, scientific knowledge, etc.
The standard uncertainty for each error constituent is formed by combining uncertainties quoted in different ways (Type A and Type B errors, see for details [40]), and by starting off, at this initial stage in transponder calibration, with the following assumptions: (a) The error constituents for the transponder internal delay and the GNSS antenna reference point were to follow a normal distributions, and (b) all the rest error constituents followed a uniform distribution. All constituents of error sources in transponder calibration were identified, and thus, an estimation of their variance is presented. Uncertainties were in that manner appraised for every individual constituent, and later, we integrated them to determine the more complex and final uncertainty for the reported calibration results. Table 1 presents such an uncertainty budget for the transponder calibration following this analysis [38].
With those error values presented in Table 1, the combined (root-sum-squared uncertainty) and the expanded uncertainty (standardized at 95% confidence level) were calculated to be ±41.5 mm and ±81.3 mm ( k [ 0.005 ] = 1.96 at 95% with normality, k [ α ] is called the 100α percentage point or coefficient), respectively. These values correspond to the Sentinel-3A Pass No.14 transponder calibration at the CDN1 Cal/Val site. As soon as supplementary knowledge is accumulated later on, this table has to be iterated and updated with improved values for each error constituent and its uncertainty.

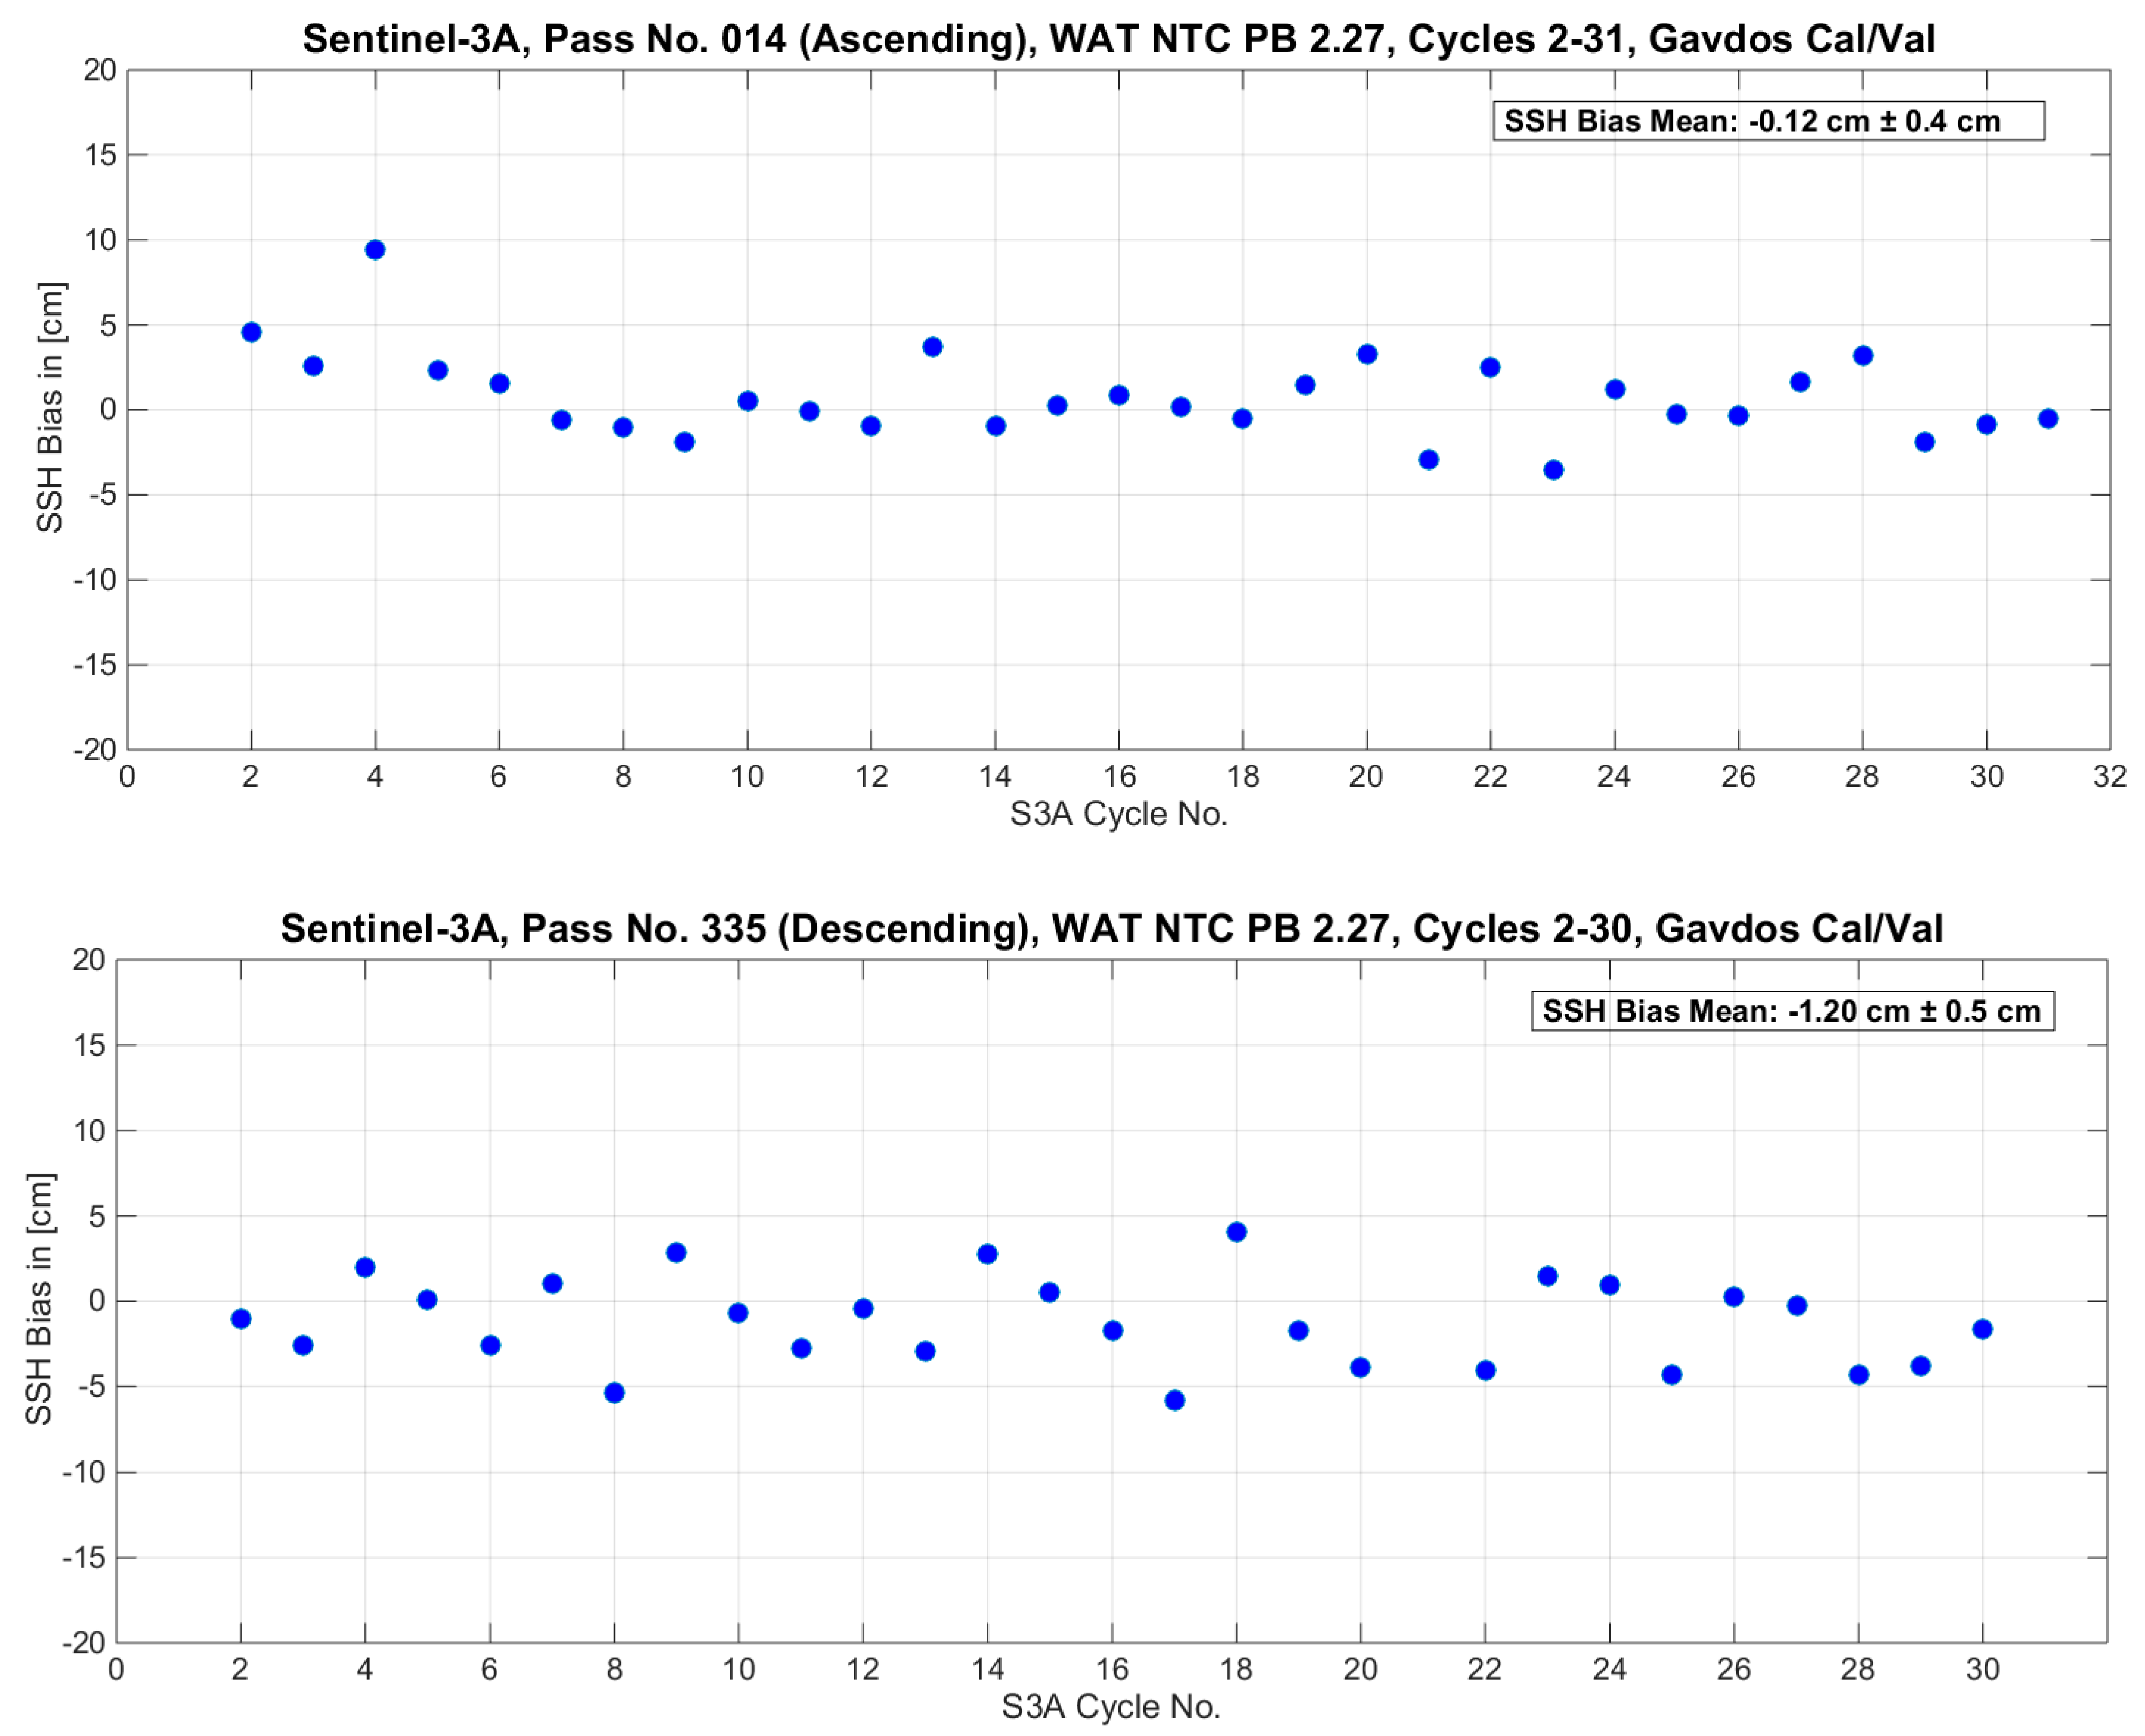
4.3. Sea-Surface Calibration Results

The latest Sentinel-3A sea-surface height Cal/Val results are given in Figure 20 for the ascending Pass No.14 and the descending Pass No.335. It can be seen that the SSH bias along the ascending Pass No.14 is estimated to be −0.12 cm, while the descending Pass No.335 gave an SSH bias of −1.20 cm (N ≈ 30). Both of these results carry a standard deviation for their internal dispersion of about ±5 mm. These figures are to improve in confidence as soon as more calibrations are carried out.

Uncertainty Budget for Sea-Surface Calibration

By the same token, to estimate uncertainty of results in sea-surface calibration, the following main error components were identified [39]: (1) Cal/Val site coordinate determination. This group identified possible errors induced by the GNSS receiver, its antenna, ground stability, local setting, geodetic control ties, unaccounted effects, etc., and, by GNSS processing and data rectification strategies, to arrive at the absolute geodetic coordinates of the Cal/Val site. (2) Sea-surface height at Cal/Val site. The determination of the sea level at the Cal/Val site in an earth-centered earth-fixed reference system involved several error constituents related to water level observations (made by tide gauges), local conditions, models, for example for significant wave heights [41], setting and measuring and sampling strategies, instrument, monumentation and setting, ground deformation, earth tides, thermal expansion, atmospheric loading, local effects, reference time and coordinate frame for site positioning, etc., and to field leveling surveys when connecting water level records with absolute coordinates of reference site. (3) Local Reference Surfaces. The determination of sea level anomaly constituted the procedure with the largest uncertainty contribution in the sea-surface calibration. This was accomplished by dissecting the way models were applied for transferring heights from the Cal/Val site to open ocean using Mean Sea Surface, Mean Dynamic Topography, and geoid models, as well as the way their each individual uncertainty is combined to arrive at the final result for sea-surface calibration. (4) Cal/Val processing and transformations. The errors induced by the calibration processing and technique and the technique followed to transfer the coastal sea-surface height to the open sea were taken into consideration in this category. (5) Unaccounted effects. Additional effects which were not taken care of in the previous description.
Table 2 presents an example for the analysis of the uncertainty budget for sea-surface calibration for every cycle of the Sentinel-3A Pass No.14 and Pass No.335. In order to calculate the combined (root-sum squared) and the expanded uncertainty (standardized at 95% confidence level), two cases were identified based on the reference surface applied to transfer offshore the site sea heights: (a) the MSS reference and (b) the geoid plus MDT reference. In the former case, the combined uncertainty is of the order of ±36 mm and the expanded uncertainty [95%] equals ±70 mm ( k [ 0.005 ] = 1.96 at 95% with normality). When the geoid and MDT models were employed, these figures increased to: ±98 mm (combined uncertainty) and ±190 mm (expanded uncertainty, k [ 0.005 ] = 1.96), respectively.
This was the uncertainty for the altimeter bias estimated for each satellite cycle. This figure seems to be close to the ±30 mm “standard deviation” presented by the other permanent Cal/Val sites [42].

4.4. Summary of Transponder, Sea-Surface, and Crossover Cal/Val results

Table 3 summarizes the Cal/Val results for Sentinel-3A Pass No.14 and Pass No.335 as estimated by three diverse and independent calibration methodologies. The last column presents the standardized uncertainty values as determined by the concept of Fiducial Reference measurements. The bias for the Sentinel-3A comes close to zero based on the observations carried out by the transponder and the sea-surface calibrations.
In summary, the results out of this investigation can be succinctly described as follows: (1) both the transponder and sea-surface Cal/Val methodologies agree that the Sentinel-3A SRAL altimeter bias was less than 1 cm; (2) no significant drift in SRAL performance was monitored, although some trend has been observed in its radiometer that needs to be verified; (3) at present, no significant directional errors can be reported, with confidence, based on the ascending Pass No.14 and the descending Pass No.335; (4) the difference between the transponder and the sea-surface biases for Sentinel-3A Pass No.14 was quite small and within their uncertainty bounds; (5) the Sentinel-3A altimeter seemed to measure sea-surface height +4cm higher than the Jason-3 reference altimeter, based on crossover analysis; (6) the MWR measurements along the descending Pass No.335 were land contaminated by Gavdos in a distance about 15–20 km from the land mass.

5. Conclusions and Future Plans

The Sentinel-3A satellite altimeter is the first “offspring” of the Sentinel-3 family of the Copernicus program. It is crucial to validate this altimeter’s performance in an indisputable way following internationally agreed standards and reporting the results along with their uncertainty employing metrology guidelines. The Permanent Facility for Satellite Altimeter operating in west Crete, Greece has been employed to serve as the fiducial facility for monitoring Sentinel-3A altimeter performance. Two major permanent Cal/Val sites that incorporate diverse calibration methodologies were used: the European Space Agency’s Sentinel-3 Altimeter Transponder Calibration Site on the mountains of Crete (“CDN1 Cal/Val”) and the Gavdos sea-surface Cal/Val facility that provides calibration services for all altimetry missions continuously since 2004.
The Cal/Val results for Sentinel-3A, as presented in this work, are in line with those determined by other research teams. In [42], the absolute bias of S3A for sea surface height was estimated to be of the order of +2 cm ± 2.5 cm at Bass Strait, Australia [43]. At the Corsica Cal/Val site in France [44], bias for sea-surface heights amounts to +0.9 ± 0.6 cm. Moreover, transponder observations processed by other groups arrived at +0.6 cm in range bias for S3A [45]; all within the uncertainty limits and specifications of ±3 cm for this Sentinel-3A satellite altimeter.
The uncertainty budget analyses presented for the transponder and sea-surface calibrations constitute the first effort to write down the error sources, characterize them according to the International Standards Organization Guide for Measurement Uncertainty and provide a simplified and realistic approach for the uncertainty of each altimeter calibration. Work has already been conducted by this team to implement more advanced statistical tools and methods which will certainly improve and safeguard this uncertainty budget analysis. Satellite altimetry results have been given, along with their uncertainty, attaining the European Space Agency standard of fiducial reference measurements based upon a series of independent, fully characterized, and traceable ground measurements.

Author Contributions

Conceptualization, S.P.M., C.D. and C.M.; Data curation, X.F., C.K. and G.V.; Funding acquisition, S.P.M.; Investigation, S.P.M., C.M., D.G. and I.N.T.; Methodology, S.P.M. and C.D.; Project administration, S.P.M., C.D., P.F., C.M., A.T. and T.G.; Software, D.G., X.F., C.K. and G.V.; Supervision, S.P.M., P.F. and C.M.; Visualization, X.F.; Writing—original draft, S.P.M. and A.T.; Writing—review & editing, S.P.M.

Funding

This research was funded by European Union and the European Space Agency grant numbers [4000117101/16/I/BG and 4000122240/17/I-BG] and the APC was funded by the Technical University of Crete.

Acknowledgments

This work has been primarily supported and funded by the European Union, the European Space Agency, and the Centre National d’Etudes Spatiales, France. Many thanks to Joana Fernandes and Telmo Vieira, University of Porto, Portugal, for helping us better understand the wet troposphere delays and for verifying the produced results. Ole Andersen of the Danish Space Center has provided the Mean Sea Surface models for the region.

Conflicts of Interest

The authors declare no conflict of interest.

References

  1. CEOS Database. Available online: http://database.eohandbook.com/database/missiontable.aspx (accessed on 20 July 2018).
  2. PWC. Study to Examine the Socio-Economic Impact of Copernicus in the EU; European Commission DG GROW I.3; European Commission: Brussels, Belgium, 2016. [Google Scholar]
  3. ESA. Sentinel-3 Family Grows. 2016. Available online: http://m.esa.int/Our_Activities/Observing_the_Earth/Copernicus/Sentinel-3/Sentinel-3_family_grows (accessed on 21 July 2018).
  4. ESA. Sentinel-3: ESA’s Global Land and Ocean Mission for GMES Operational Services; ESA Communications: Noordwijk, The Netherlands, 2012; ISBN 978-92-9221-420-3. [Google Scholar]
  5. Rebhan, H.; Goryl, P.; Donlon, C.; Féménias, P.; Bonekamp, H.; Fournier-Sicre, V.; Kwiatkowska, E.; Montagner, F.; Nogueira-Loddo, C.; O’Carroll, A. Sentinel-3 Calibration and Validation Plan; European Space Agency, European Space Research and Technology Centre: Noordwijk, The Netherlands, 2012. [Google Scholar]
  6. Donlon, C. Fiducial Reference Measurements for Altimetry. FRM4ALT Project Webportal. Available online: https://goo.gl/Yn23pQ (accessed on 26 June 2018).
  7. Mertikas, S.P.; Donlon, C.; Cullen, R.; Tripolitsiotis, A. Scientific and Operational Roadmap for Fiducial Reference Measurements in Satellite Altimetry Calibration and Validation. Int. Altimet. Cal/Val Rev. Appl. 2018. under review. [Google Scholar]
  8. Mertikas, S.P.; Tripolitsiotis, A.; Mavrocordatos, C.; Picot, N.; Féménias, P.; Daskalakis, A.; Boy, F. A permanent infrastructure in Crete for the calibration of Sentinel-3, Cryosat-2 and Jason missions with a transponder. In Proceedings of the ESA Living Planet Symposium 2013 (ESA SP-722), Edinburgh, UK, 9–13 September 2013. [Google Scholar]
  9. Mertikas, S.P.; Donlon, C.; Tripolitsiotis, A.; Mavrocordatos, C.; Tziavos, I.N.; Galanakis, D.; Andersen, O.B.; Tripolitsiotis, A.; Frantzis, X.; Lin, M.; et al. Gavdos/West Crete Cal/Val site: Over a decade calibrations for Jason series, SARAL/AltiKa, CryoSat-2, Sentinel-3 and HY-2 altimeter satelites. In Proceedings of the ESA Living Planet Symposium 2013 (ESA SP-740), Prague, Czech Republic, 9–13 May 2016. [Google Scholar]
  10. Kolenkiewicz, R.; Martin, C.F. Satellite Altimeter Calibration Techniques. Adv. Space Res. 1990, 10, 269–277. [Google Scholar] [CrossRef]
  11. Christensen, E.J.; Haines, B.J.; Keihm, S.J.; Morris, C.S.; Norman, R.A.; Purcell, G.H.; Williams, B.G.; Wilson, B.D.; Born, G.H.; Parke, M.E.; et al. Calibration of TOPEX/POSEIDON at Platform Harvest. J. Geophys. Res. 1994, 99, 24465–24485. [Google Scholar] [CrossRef]
  12. Menard, Y. Calibration of the TOPEX/POSEIDON altimeters at Lampedusa: Additional results at Harvest. J. Geophys. Res. 1994, 99, 24487–24504. [Google Scholar] [CrossRef]
  13. Pesec, P.; Sunkel, H.; Fachbach, N. Transponders for Altimeter Calibration and Height Transfer. VGI— Österreichische Zeitschrift fü Vermessung Geoinf. 1996, 84, 252–256. [Google Scholar]
  14. Cristea, E.; Moore, P. Altimeter bias determination using two years of transponder observations. In Proceedings of the “Envisat Symposium” 2007 (ESA SP-636); Lacoste, H., Ouwehand, L., Eds.; ESA Publications Division; European Space Agency: Noordwijk, The Netherlands, 2007. [Google Scholar]
  15. Hausleitner, W.; Moser, F.; Desjonqueres, J.D.; Boy, F.; Picot, N.; Weingrill, J.; Mertikas, S.; Daskalakis, A. A New Method of Precise Jason-2 Altimeter Calibration Using a Microwave Transponder. Mar. Geod. 2012, 35, 337–362. [Google Scholar] [CrossRef]
  16. Fornari, M.; Scagliola, M.; Tagliani, N.; Parrinello, T.; Mondejar, A.G. CryoSat SIRAL Calibration and Performance. IEEE Geosci. Remote Sens. 2014, 702–705. [Google Scholar] [CrossRef]
  17. Mertikas, S.P.; Donlon, C.; Mavrocordatos, C.; Tripolitsiotis, A.; Féménias, P.; Galanakis, D.; Tziavos, I.N.; Boy, F.; Vergos, G.; Andersen, O.B.; et al. Multi-mission calibration results at the Permanent Facility for Altimetry Calibration in west Crete, Greece attaining Fiducial Reference Measurement Standards. In Proceedings of the Ocean Surface Topography Science Team Meeting 2017, Miami, FL, USA, 23–27 October 2017. [Google Scholar]
  18. Mondejar, A.; Mertikas, S.; Galanakis, D.; Labroue, S.; Bruniquel, J.; Quartly, G.; Féménias, P.; Mavrocordatos, C.; Wood, J.; Garcia, P.; et al. Sentinel-3 Transponder Calibration Results. In Proceedings of the Ocean Surface Topography Science Team Meeting 2017, Miami, FL, USA, 23–27 October 2017. [Google Scholar] [CrossRef]
  19. Egido, A. Fully focused SAR altimetry: Theory and Applications. IEEE Trans. Geosci. Remote Sens. 2017, 55, 392–406. [Google Scholar] [CrossRef]
  20. Raney, R.K. The delay/Doppler radar altimeter. IEEE Trans. Geosci. Remote Sens. 1998, 36, 1578–1588. [Google Scholar] [CrossRef]
  21. Raynal, M.; Labroue, S.; Moreau, T.; Boy, F.; Picot, N. From conventional to Delay Doppler altimetry: A demonstration of continuity and improvements with the CryoSat-2 mission. Adv. Space Res. 2018. [Google Scholar] [CrossRef]
  22. Radar Altimetry Tutorial & Toolbox. Available online: http://www.altimetry.info/toolbox/ (accessed on 1 August 2018).
  23. Garcia, P. S3-A SRAL Cyclic Performance Report; Sentinel-3 Mission Performance Centre, 2017. Available online: https://sentinel.esa.int/documents/247904/2829969/Sentinel-3-MPC-SRAL-Cyclic-Report-020 (accessed on 14 November 2018).
  24. Haines, B.J.; Desai, S.; Born, G. The Harvest Experiment: Calibration of the climate data record from TOPEX/Poseidon, Jason-1 and the Ocean Surface Topography Mission. Mar. Geod. 2010, 33, 91–113. [Google Scholar] [CrossRef]
  25. Watson, C.; White, N.; Church, J.; Reed, B.; Paul, T.; Richard, C. Absolute calibration in Bass Strait, Australia: TOPEX, Jason-1 and OSTM/Jason-2. Mar. Geod. 2011, 34, 242–260. [Google Scholar] [CrossRef]
  26. Bonnefond, P.; Exertier, P.; Laurain, O.; Guillot, A.; Picot, N.; Cancet, M.; Lyard, F. SARAL/AltiKa Absolute calibration from the multi-mission Corsica facilities. Mar. Geod. 2015, 38, 171–192. [Google Scholar] [CrossRef]
  27. Mertikas, S.P.; Ioannides, R.T.; Tziavos, I.N.; Vergos, G.S.; Hausleitner, W.; Frantzis, X.; Tripolitsiotis, A.; Partsinevelos, P.; Andrikopoulos, D. Statistical models and latest results in the determination of the absolute bias for the radar altimeters of Jason satellites using the Gavdos facility. Mar. Geod. 2010, 33, 114–149. [Google Scholar] [CrossRef]
  28. Tziavos, I.N.; Vergos, G.S.; Mertikas, S.P.; Daskalakis, A.; Grigoriadis, V.N.; Tripolitsiotis, A. The contribution of local gravimetric geoid models to the calibration of satellite altimetry data and an outlook of the latest GOCE GGM performance in GAVDOS. Adv. Space Res. 2013, 51, 1502–1522. [Google Scholar] [CrossRef]
  29. Mertikas, S.P.; Daskalakis, A.; Tziavos, I.N.; Andersen, O.B.; Vergos, G.; Tripolitsiotis, A.; Zervakis, V.; Frantzis, X.; Partsinevelos, P. Altimetry, bathymetry and geoid variations at the Gavdos permanent Cal/Val facility. Adv. Space Res. 2012, 51, 1418–1437. [Google Scholar] [CrossRef]
  30. Vergos, G.S.; Tziavos, I.N.; Andritsanos, V.D. On the determination of marine geoid models by least-squares collocation and spectral methods using heterogeneous data. In A Window on the Future of Geodesy; Sanso, E., Ed.; International Association of Geodesy Symposia; Springer: Berlin/Heidelberg, Germany, 2003. [Google Scholar] [CrossRef]
  31. Dettmering, D.; Bosch, W. Global Calibration of Jason-2 by multi-mission crossover analysis. Mar. Geod. 2010, 33, 150–161. [Google Scholar] [CrossRef]
  32. Tai, C.K.; Fu, L.L. On crossover adjustment in satellite altimetry and its oceanographic implications. J. Geophys. Res. 1986, 91, 2549–2554. [Google Scholar] [CrossRef]
  33. Bosch, W.; Dettmering, D.; Schwatke, C. Multi-mission cross-calibration of satellite altimeters: Constructing a long-term data record for global and regional sea level change studies. Remote Sens. 2014, 6, 2255–2281. [Google Scholar] [CrossRef]
  34. Bosch, W.; Savcenko, R. Satellite altimetry: Multi-mission cross calibration. In Dynamic Planet; Tregoring, P., Rizos, C., Eds.; International Association of Geodesy Symposia; Springer: Berlin/Heidelberg, Germany, 2005. [Google Scholar]
  35. Mertikas, S.; Donlon, C.; Féménias, P.; Mavrocordatos, C.; Galanakis, D.; Tripolitsiotis, A.; Frantzis, X.; Tziavos, I.N.; Vergos, G.; Andersen, O.B.; et al. Fifteen years of Cal/Val service to reference altimetry missions: Calibration of satellite altimetry at the Permanent Facilities in Gavdos and Crete, Greece. Remote Sens. 2018, 10, 1557. [Google Scholar] [CrossRef]
  36. Fernandes, M.J.; Lazaro, C. Independent assessment of Sentinel-3A wet tropospheric correction over the opean and coastal ocean. Remote Sens. 2018, 10, 484. [Google Scholar] [CrossRef]
  37. Snajdrova, K.; Boehm, J.; Willis, P.; Hass, R.; Schuh, H. Multi-technique comparison of tropospheric zenith delays derived during the CONT02 campaign. J. Geod. 2006, 79, 613–623. [Google Scholar] [CrossRef]
  38. BIPM. International Vocabulary of Metrology-Basic and General Concepts and Associated Terms (VIM), 3rd ed.; JCGM/WG 2 Doc. N313; Bureau Int. des Poids et Mesures: Sevres, France, 2012. [Google Scholar]
  39. Mertikas, S.P.; Donlon, C.; Femenias, P.; Mavrocordatos, C.; Galanakis, D.; Guinle, T.; Boy, F.; Tripolitsiotis, A.; Frantzis, X.; Tziavos, I.N.; et al. Fiducial Reference Measurements for Satellite Altimetry Calibration: The Constituents. Int. Altimet. Cal/Val Rev. Appl. 2018. under review. [Google Scholar]
  40. Ratcliffe, C.; Ratcliffe, B. Doubt-Free Uncertainty in Measurement: An Introduction for Engineers and Students; Springer International Publishing: Cham, Switzerland, 2015. [Google Scholar]
  41. Pires, N.; Fernandes, M.J.; Gommenginger, C.; Scharroo, R. Improved sea state bias estimation for altimeter reference missions with altimeter-only three-parameter models. IEEE Trans. Geosci. Remote Sens. 2018, 99, 1–15. [Google Scholar] [CrossRef]
  42. Bonnefond, P.; Exertier, P.; Laurain, O.; Guillot, A.; Guinle, T.; Picot, N.; Femenias, P.; Parrinello, T.; Dinardo, S. Corsica: A multi-mission absolute calibration site. In Proceedings of the Ocean Surface Topography Science Team Meeting 2017, Miami, FL, USA, 23–27 October 2017. [Google Scholar]
  43. Watson, C.; Legresy, B.; King, M.; Deane, A. Absolute altimeter bias results from Bass Strait, Australia. In Proceedings of the Ocean Surface Topography Science Team Meeting 2018, Ponta Delgada, Portugal, 24–29 September 2018. [Google Scholar]
  44. Bonnefond, P.; Exertier, P.; Laurain, O.; Guinle, T.; Féménias, P. Corsica: A 20-Yr multi-mission absolute altimeter calibration site. In Proceedings of the Ocean Surface Topography Science Team Meeting 2018, Ponta Delgada, Portugal, 24–29 September 2018. [Google Scholar]
  45. Garcia-Mondejar, A.; Zhao, Z.; Rhines, P. Sentinel-3 Range and Datation Calibration with Crete transponder. In Proceedings of the 25 Years of Progress in Radar Altimetry, Ponta Delgada, Portugal, 24–29 September 2018. [Google Scholar]
Figure 1. Sentinel-3A (green) and Sentinel-3B (yellow) ground tracks over Greece (left) and the island of Crete (right). The location of several calibration and validation (Cal/Val) sites in west Crete, Greece are shown in the right image.
Remotesensing 10 01808 g001
Figure 2. Upper Left: The CDN1 transponder Cal/Val site has been established to support Cal/Val activities for the Sentinel-3A (green) and Sentinel-3B (blue) missions and for the Jason (red) series (future Sentinel-6/Jason-CS). Upper Right: Aerial view of the CDN1 transponder Cal/Val site in West Crete Mountains. Lower: The sequential calibration of Sentinel-3 along the ascending Pass No.14 with sea-surface and transponder techniques, respectively. Overview of the calibration process along with photos from the satellite calibration infrastructure.
Remotesensing 10 01808 g002
Figure 3. The operational status of the main instrumentation (microwave transponder, Global Navigation Satellite System (GNSS) receivers and meteorological stations) at the CDN1 transponder Cal/Val site as of 2014.
Remotesensing 10 01808 g003
Figure 4. (a) The location of the Gavdos sea-surface Cal/Val facility enables the provision of calibration services for Sentinel-3A (green) andJason (red) satellite altimetry missions. Ascending and descending passes for both missions are calibrated at the Gavdos Cal/Val facility. (b) The current setup of the “Karave” harbor site in the Gavdos Cal/Val facility.
Remotesensing 10 01808 g004
Figure 5. The operational status of the instrumentation (tide gauges, GNSS receivers) at the Gavdos Cal/Val site as of 2004.
Remotesensing 10 01808 g005
Figure 6. The regional GNSS network in Gavdos and west Crete, Greece (left) and availability of GNSS observations (right).
Remotesensing 10 01808 g006
Figure 7. Flowchart of the transponder calibration developed for range and datation bias estimation of Sentinel-3A.
Remotesensing 10 01808 g007
Figure 8. This is an example of the Sentinel-3A signal responses generated by the transponder at the CDN1 Cal/Val site on 21 December 2017, at the mountains of West Crete. Calibrated Synthetic Aperture Radar (SAR) data, shown as a Fast Fourier Transform, are plotted against zero-padded samples and Ku-pulse index in Cycle No.26 of Sentinel-3A. The Pulse Repetition Internal for Sentinel-3A has been 17,800 Hz within a burst and the burst repetition interval is 80 Hz. Relative scale of signal magnitude is shown in color on the vertical bar (arbitrary units).
Remotesensing 10 01808 g008
Figure 9. Timeline of Sentinel-3A Pass No.14 transponder calibrations at the CDN1 Cal/Val site. Green boxes represent successful calibration, whereas red boxes correspond to two calibrations canceled as a consequence of extreme weather conditions (4 January 2017, Cycle No.13, Images above) and site maintenance (8 August 2017, Cycle No.21).
Remotesensing 10 01808 g009
Figure 10. Screenshots of the transponder response movie for the Sentinel-3 Pass No.14 calibration on 8 April 2018. The transponder echo in the altimeters records as it enters (left), reaches its maximum (middle) and leaving (right) the tracking window. Similar echo movies are generated within 24 h after each satellite overpassed the CDN1 transponder Cal/Val site.
Remotesensing 10 01808 g010
Figure 11. The shaded greenish areas represent the Sentinel-3A Pass No.14 (left, ascending) and Pass No.335 (right, descending) calibrating regions at the Gavdos sea-surface Cal/Val site.
Remotesensing 10 01808 g011
Figure 12. Timeline of Sentinel-3A Pass No.335 sea-surface calibrations at the Gavdos Cal/Val site in west Crete, Greece. The green boxes illustrate days of satellite overpass and availability of sea-surface heights by the in-situ scientific instruments.
Remotesensing 10 01808 g012
Figure 13. The cross-over location of Sentinel-3A Pass No.14 and Jason-3 Pass No.109 south of Gavdos Cal/Val site.
Remotesensing 10 01808 g013
Figure 14. Dates when Sentinel-3A Pass No.14 and Jason-3 Pass No.109 overpassed the cross-over location south of Gavdos within a window of ±3 days.
Remotesensing 10 01808 g014
Figure 15. An example, of the Zenith Wet Troposphere Delay in mm as derived by GNSS processing with GAMIT (left) and GIPSY (right) scientific software for 12 July 2017 at the transponder CDN1 Cal/Val site.
Remotesensing 10 01808 g015
Figure 16. Profiles of Zenith Wet Troposphere Corrections in cm, as observed by the S3A radiometer for cycles 1–30, along the descending Pass No.335, starting off north of Crete and converging south onto the Gavdos Cal/Val site (Please see Figure 12, S3A descending Pass No.335, right mage).
Remotesensing 10 01808 g016
Figure 17. Differences between the S3A Radiometer and the GNSS-Derived delays for the Wet Troposphere as a function of cycle number. It seems that there is an upward trend with a slope of +0.0603 cm/cycle (S3A descending Pass No.335). The standard error for this estimated slope is SE = ±0.0245 cm/cycle and its p-value is 0.0137 which determines the significance of these results (98%). The plot, below the first diagram above, is the boxplot of these delay differences. It can be seen that the location estimate (horizontal red line in the middle) is the median (slightly above zero). The average value, however, comes to −0.09 cm, a value also close to zero. The standard deviation for this average is ±2 mm.
Remotesensing 10 01808 g017
Figure 18. An example of data processing and procedures, in a Block diagram, to arrive at the transponder absolute coordinates and their uncertainties.
Remotesensing 10 01808 g018
Figure 19. Absolute range bias results for the ascending Sentinel-3A Pass No.14, Cycles 3–32 at the CDN1 Cal/Val site.
Remotesensing 10 01808 g019
Figure 20. Sea-surface height biases for the ascending Pass No.14 (up) and descending (down) Pass No.335 of Sentinel-3A, as estimated by the Gavdos Cal/Val site.
Remotesensing 10 01808 g020
Table 1. Uncertainty budget for the transponder calibration, following the International Standards Organization “Guide to the Expression of Uncertainty in Measurement” [38].
Contributing Error ConstituentError TypeVariance EstimateStandard Uncertainty
Measured rangeB3.00 mm±1.73 mm
Transponder Internal DelayB30.00 mm±15.00 mm
Dry Tropospheric DelayB2.00 mm±1.16 mm
Wet Tropospheric DelayB14.00 mm±8.10 mm
Ionospheric DelayB4.00 mm±2.31 mm
Geophysical correctionsB20.00 mm±11.60 mm
Satellite orbit heightB50.00 mm±29.00 mm
Pseudo-Doppler correctionB2.00 mm±1.16 mm
GNSS instrument B6.00 mm±3.50 mm
GNSS antenna reference pointB4.00 mm±2.00 mm
GNSS repeatabilityA6.00 mm±0.17 mm
GNSS-Transponder LevelingA1.00 mm±0.18 mm
Levelling instrument/method B1.00 mm±0.60 mm
Processing & Approximations B30.00 mm±17.34 mm
Orbit InterpolationsB0.30 mm±0.17 mm
Unaccounted effectsB20.00 mm±11.60 mm
Root-Sum Squared (Combined) ±41.50 mm
Table 2. Uncertainty budget for the sea-surface calibration following the analysis proposed in the International Standards Organization “Guide to the Expression of Uncertainty in Measurement”.
Error ConstituentTypeVariance EstimateStandard Uncertainty
Cal/Val Site Coordinates
GNSS heightA0.10 mm±0.10 mm
GNSS receiverB6.00 mm±3.50 mm
Antenna reference pointB2.00 mm±2.00 mm
SSH@Cal/Val site
Water levelA1.30 mm±1.30 mm
Tide gauge zero pointA0.15 mm±0.15 mm
Tide gauge vertical alignmentB2.40 mm±1.40 mm
Tide gauge certificateB5.50mm±5.50 mm
Leveling repeatabilityA0.12 mm±0.12 mm
MonumentationB1.10 mm±0.64 mm
Vertical misalignmentB1.00 mm±0.60 mm
Leveling observerB1.00 mm±0.60 mm
Leveling instrument/methodB1.00 mm±0.60 mm
Tide pole readingB1.00 mm±0.60 mm
MSS/MDT/Geoid
MSSB33.00 mm±33.00 mm
MDTB85.00 mm±85.00 mm
GeoidB80.00 mm±46.20 mm
Processing Errors
ProcessingB0.50 mm±0.30 mm
Geoid slope/offshore transferB10.00 mm±5.80 mm
Unaccounted
Unaccounted effectsB20.00 mm±11.55 mm
Root-sum-Squared Uncertainty ±36.1 mm
Table 3. Latest results of the Sentinel-3A Pass No.14 and Sentinel-3A Pass No.335 range and sea-surface bias at the Permanent Facility for Altimetry Calibration in west Crete, Greece.
Bias [mm]Sentinel-3AAscending No.14Descending No.335FRM Uncertainty
ProductPB 2.27, NTCPB 2.27, NTC
Cycles3–321–31
Range BiasTransponder+0.60 cm ± 0.3 cm ±4.1 cm (68%)
SSH BiasGavdos Cal/Val−0.12 cm ± 0.4 cm−1.20 cm ± 0.5 cm±3.60 cm (68%)
Crossover AnalysisS3A-JA3+4.00 cm ± 8 cm

