Article

Life Satisfaction of Downtown High-Rise vs. Suburban Low-Rise Living: A Chicago Case Study

1
College of Architecture, Illinois Institute of Technology, Chicago, IL 60616, USA
2
Department of Psychology, Illinois Institute of Technology, Chicago, IL 60616, USA
3
Department of Civil, Architectural, and Environmental Engineering, Illinois Institute of Technology, Chicago, IL 60616, USA
*
Author to whom correspondence should be addressed.
Sustainability 2017, 9(6), 1052; https://doi.org/10.3390/su9061052
Submission received: 14 April 2017 / Revised: 14 June 2017 / Accepted: 14 June 2017 / Published: 17 June 2017
(This article belongs to the Special Issue Social Sustainability and Justice)

Abstract

:
There has been a long-standing debate about whether urban living is more or less sustainable than suburban living, and quality of life (QoL) is one of several key measures of the social sustainability of residential living. However, to our knowledge, no study to date has examined life satisfaction among residents of downtown high-rise living compared to residents living in suburban low-rise housing. Further, very few studies have utilized building or neighborhood-scale data sets to evaluate residents’ life satisfaction, and even fewer have controlled for both individual and household-level variables such as gender, age, household size, annual income, and length of residence, to evaluate residents’ life satisfaction across different living scenarios. Therefore, the goal of this study was to investigate residents’ satisfaction with their place of residence as well as overall life in general via surveys of individuals living in existing high-rise residential buildings in downtown Chicago, IL, and in existing low-rise residential buildings in suburban Oak Park, IL. Over 1500 individuals were contacted directly, resulting in over 500 responses. The number of fully completed responses for this study was 177, including 94 from residents of four downtown high-rise buildings and 83 from residents in suburban low-rise homes. Residents living in downtown high-rise buildings had significantly higher life satisfaction scores than residents living in suburban low-rise homes when controlling for demographic differences; however, the differences were small, as housing type explained less than 5% of the observed variance in life satisfaction outcomes. The research also evaluated five life satisfaction domains including travel, accessibility, social interaction, safety, and overall residential environment (ORE). In all cases, residents of the downtown high-rises reported higher satisfaction levels, although the scores on all these five satisfaction domains reported from both urban scenarios were very high. Moreover, all five satisfaction domains were highly associated with each other, and accessibility and safety were found as the strongest predictors of ORE for individuals.

1. Introduction

According to the United Nations, 187,000 people are urbanizing across the world every day [1]. Accommodating an estimated 2.4 billion new urban dwellers over the next 35 years is one of the most pressing challenges for ensuring global sustainability. The world will need to build a new or expanded city of more than one million people every week for the next 40 years to cope with this urban growth.
There has been a long-standing debate about whether urban living is more or less sustainable than suburban living. From the perspective of energy use and carbon emissions, there is generally support for higher density urban living [2,3,4,5,6,7,8,9,10]. At the same time, from a social perspective, there has been a long-standing argument that people living in dense urban cities may have a lower quality of life (QoL) and are less happy or less satisfied with their lives than those living in the suburbs, based on city and regional data sets [11,12,13,14,15,16,17]. QoL has been widely considered to be an important indicator for social sustainability [18,19,20,21,22,23,24,25,26], and is a multidimensional concept that has been assessed and quantified using a number of objective and subjective indicators across various research communities. In the social science and urban/community planning fields, life satisfaction and happiness are often used as indicators of subjective QoL [18,19,20]. However, very few studies have utilized building or neighborhood-scale data sets to evaluate residents’ life satisfaction, which could be distributed unevenly within a city or county and across its neighborhoods. Furthermore, residential satisfaction is thought to include a range of domains, such as physical qualities of the dwelling as well as features of the surrounding neighborhood, social environment, and place attachment [27,28].
To our knowledge, no study to date has examined life satisfaction among residents of downtown high-rise living, which is the most common residential pattern in the centers of major cities across the world. Further, very few studies have controlled for both individual and household-level variables such as gender, age, household size, annual income, and length of residence, to evaluate residents’ life satisfaction across different urban scenarios.
Therefore, the goal of this work was to investigate residents’ life and residence satisfaction at a building and neighborhood level via surveys of individuals living in existing high-rise residential buildings in downtown Chicago, IL, and in existing low-rise residential buildings in suburban Oak Park, IL. Specific research questions included:
  • Controlling for demographic differences, is residence type (downtown high-rise setting vs. suburban low-rise setting) associated with life satisfaction?
  • Are there differences in residential satisfaction domains such as travel, accessibility, social interaction, and safety based on residence type?
  • Which of the satisfaction domains are the strongest predictors of overall satisfaction with residential environment?

2. Case Studies

Residents across four existing residential towers spanning two downtown Chicago, IL, locations (Chicago Loop and Lakeview) were recruited as the downtown high-rise case studies. The low-rise case study included existing single-family detached homes and several duplex/townhomes recruited in suburban Oak Park, IL. Their geographic locations and major connected transportation systems, including local Chicago Transit Authority (CTA) trains, regional Metra Commuter trains and major expressways, are shown in Figure 1. These areas were chosen as a sample of convenience, but reflect two distinct urban and suburban residential areas in a major metropolitan area in the U.S. Table 1 outlines the basic characteristics of the two case study sets using data collected from several public data sources.

2.1. Residence Type 1: Downtown High-Rise Residential Towers in Chicago, IL

The four downtown high-rise residential buildings are located in areas of relatively high urban density and are served by numerous forms of public transportation. These four residential buildings were chosen as a sample of convenience based on the positive response by their developers, architects, and management companies. However, their locations generally represent two distinct areas of downtown Chicago high-rise residential life. The Aqua Tower and the Legacy at Millennium Park are both located in the downtown Chicago Loop (population density: 7200/km2). The 73-story Legacy at Millennium Park is located in the heart of a central business district of the Chicago Loop, facing eastward to Millennium Park and Lake Michigan. The 86-story Aqua Tower is located in Lakeshore East, a master-planned mixed-use urban development comprising apartments, condos, luxury townhomes, shops, and a 6-acre park as the neighborhood’s centerpiece. The 27-story Commonwealth Plaza (comprising two towers) is located on the edge of the Lakeview and Lincoln Park neighborhoods (Lakeview population density: 12,000/km2), approximately 8 km north of the downtown Chicago Loop. These are two of the highest density residential neighborhoods in the City of Chicago.

2.2. Residence Type 2: Suburban Low-Rise Residences in Oak Park, IL

The Village of Oak Park, IL was chosen as the representative suburban low-rise residential area for comparison to the downtown high-rise residential buildings. The location was also selected as a sample of convenience, in part because of the strong support of our study displayed by the area’s leadership for this study. Oak Park (population density: 4262/km2) is located approximately 14 km from Chicago’s city center. As an inner suburban neighborhood, Oak Park constitutes a relatively dense mix of single-family homes and apartments, with a relatively walkable environment. It is also accessible to much of Chicagoland’s public transportation systems, including the CTA green and blue elevated train and subway lines and the regional Metra train lines. Because of this connection to public transit, Oak Park is considered distinctly suburban, rather than exurban like many of Chicago’s other surrounding towns (e.g., Aurora or Naperville, IL).

3. Methods

Data were collected via an online survey created using SurveyGizmo that took approximately 20 minutes to complete. The research approach and the questionnaire were reviewed and approved by the Illinois Institute of Technology Institutional Review Board (IRB) prior to the study. The study launched in Oak Park in February 2014, and in the Legacy at Millennium Park, Commonwealth Plaza, and Aqua Tower in March, May, and June 2014, respectively. The survey remained open for approximately three months in each case. Participants were recruited through a combination of strategies, including messages on the websites of the buildings and their respective community groups, emailing solicitations to residents, advertising in the building and/or community newsletters, posting flyers in the buildings, mailing letters to targeted households, and giving presentations at social and community events. Over 1500 individuals were contacted directly, resulting in over 500 responses. The number of fully-completed responses for this study was 177, including 94 from the downtown high-rise settings and 83 from the suburban low-rise setting. In addition to the questions accessing residents’ life satisfaction, the information from the online questionnaires completed by residents also included:
  • Individual information including each household member’s gender, age, race, employment status.
  • Household information including annual income, ownership status, household size, and time of residence.

3.1. Study Measures

In addition to demographic questions, two additional measures were used to evaluate the life satisfaction and satisfaction with residence of the study participants, as outlined below:

3.1.1. Satisfaction with Life Scale (SWLS)

The Satisfaction with Life Scale (SWLS) was developed by Diener and colleagues to assess satisfaction with the respondent's life as a whole [33]. The SWLS is a short 5-item instrument designed to measure global cognitive judgments of satisfaction with one’s life. The scale does not assess satisfaction with objective life domains such as health or finances, but allows individuals to integrate and weight these domains in whatever way they choose. Participants were asked to rate the extent to which they agree with each of the following statements on a 5-point Likert scale (1 = strongly disagree, 2 = disagree, 3 = neutral, 4 = agree, 5 = strongly agree):
  • In most ways my life is close to my ideal.
  • The conditions of my life are excellent.
  • I am satisfied with life.
  • So far I have gotten the important things I want in life.
  • If I could live my life over, I would change almost nothing.
The SWLS has been widely examined for both reliability and sensitivity, and suited for use with a wide range of age groups and applications, which makes possible the savings of interview time and resources compared to many measures of life satisfaction. In addition, the high convergence of self- and peer-reported measures of subjective well-being and life satisfaction provide strong evidence that subjective well-being is a relatively global and stable phenomenon, not simply a momentary judgment based on fleeting influences [34]. Cronbach’s alpha was found to be 0.92 (≥ 0.9) for the present study, indicating strong internal consistency across the five items.

3.1.2. Significant Domains of Satisfaction with Residence

In addition to assessing overall life satisfaction, this study also evaluated five subjective domains related to satisfaction with residence in the field of city/community planning: travel, accessibility, social interaction, safety and overall residential environment (ORE). Items were created by the researchers for this study. As with the SWLS, participants were asked to rate the extent to which they agreed with each of the following statements (1 = strongly disagree, 2 = disagree, 3 = neutral, 4 = agree, 5 = strongly agree).
  • I am satisfied with my overall travel. Factors to be considered include travel mode/type, travel time, travel stress, quality of walking environment and ease of undertaking longer journeys.
  • I am satisfied with my overall accessibility. Factors to be considered include accessibility to school, public transportation, healthcare, shopping, and recreational facilities, green space and job opportunities.
  • I am satisfied with my overall social interaction. Factors to be considered include the proximity to friends and family, communication with neighbors, and accessibility to social opportunities.
  • I am satisfied with my overall safety. Factors to be considered include the safety aspects across 3 scales: individual house or apartment/condo, block or neighborhood and the whole community.
  • I am satisfied with my overall residential environment.

3.2. Data Analysis

The Statistical Package for the Social Sciences (SPSS 22.0, IBM: Armonk, NY, USA) for Windows was used to perform all data analyses. Data were analyzed using descriptive statistics, preliminary screening procedures, and hierarchical multiple regression to test research hypotheses. Frequencies, percentages, means, and standard deviations were used to summarize the demographic characteristics of participants. Descriptive statistics were computed for all independent and dependent variables to examine the central tendency (mean, median and mode) and dispersion (range, variance, standard deviation). Cronbach’s alphas were used to estimate internal consistency of scores on each measure used. The data were screened for missing data, outliers, and multicollinearity.
For the first research question hierarchical regression analysis (HRA) was used in order to measure the incremental variance accounted with the residence type variable (downtown high-rise scenarios and suburban low-rise scenario), controlling for significant demographic differences between the participants based on residence. Prior to this analysis, group differences based on residence type on the demographic characteristics gender, age, race/ethnicity, employment status, household income, housing ownership, household size and residence time were tested using t-tests and Chi-square analyses (see Table 2). Variables that were significantly different between the groups were entered as control variables in the regression models. The change in R2R2) was examined as a measure of the residence type’s contribution to life satisfaction. Specifically, two blocks were entered for each model: demographic characteristics (gender, age, household size and residence time); followed by the residence type (downtown high-rise scenarios vs. suburban low-rise scenario).
For the second research question, t-tests were used to examine group differences by residence type on the satisfaction domains (travel, accessibility, social integration, and safety). Significance value was set at 0.05. For the third research question, multiple regression was used to examine the independent contributions of the satisfaction domains on overall residential satisfaction.

4. Results

4.1. Participant Characteristics

Table 2 summarizes the demographic characteristics of the participants and differences between the two groups, relative to the life satisfaction measures. The research sample (177 in total, including 94 from downtown high-rises and 83 from suburban low-rises) includes all the participants who completed the questionnaire, but not all participants answered demographic questions, resulting in some “missing” an item. Also, some of the demographic factors might break down into fewer categories than the ones in the original questionnaires for the purpose of statistical tests.
Based on Chi-square tests and t-test analyses using the Statistical Package for the Social Sciences 22.0 (SPSS), four demographic characteristics were found to be statistically different between the two residential types (downtown high-rise and suburban low-rise scenarios). These were gender, age, household size and length of time at the residence. Specifically, the majority of participants in the downtown high-rise scenarios were male, and female participants accounted for only 20.2%, versus 39.8% in the suburban low-rise scenario. The majority of participants in the downtown high-rise settings were over 50 years old, comprising 70.2%, versus only 31.3% in the suburban low-rise scenario; and 60.2% of the participants in the suburban low-rise setting were in the 36–50 age range, versus 17.1% in the downtown high-rise scenarios. The average household size in the downtown high-rises was 1.86 people, which was lower than the 3.55 mean for Oak Park. Finally, the average residence time was 6.3 years in the downtown high-rises and 10.29 years in the suburban low-rise scenario. The difference in residence time might be also directly affected by the completion time of the residential buildings chosen in this study. For example, Aqua Tower was built in 2010 and Legacy in 2009, while Commonwealth Plaza was built in 1956. Conversely, the majority (approximately 72%) of Oak Park residences were built before 1950 (see Table 1). No significant differences were found between the groups regarding race/ethnicity, employment status, household income, and housing ownership. Therefore, only four demographic variables, including gender, age, household size and residence time, will need to be controlled for the further analysis.
The correlation matrix for the four controlled demographic variables, including gender, age, household size and residence time, as well as residence type (downtown residential towers vs. Oak Park low-rise residential buildings), and Satisfaction with Life Scale (SWLS) is presented in Table 3. Of the total sample (N = 177), only 168 cases had scores for all variables and were included in this analysis. Significant correlations between scores on the various measures were generally small to medium. High correlations were found between household size and residence type (r = 0.63, p < 0.001). Moderate correlations were found between age and household size (r = –0.33, p <0 .001), age and residence time (r = 0.32, p < 0.001), and age and residence type (r = 0.30, p < 0.001).

4.2. Research Question 1: Controlling for Demographic Differences, is Residence Type (Downtown High-Rise Scenarios and Suburban Low-Rise Scenario) Associated with Life Satisfaction?

The mean scores on the SWLS were not significantly different between the downtown high-rise (M = 4.18) and the suburban low-rise (M = 4.01) groups (see Table 4). However, this result did not account for demographic differences that existed between the two residence groups. Therefore, the first research question addressed the prediction of life satisfaction for individuals based on residence type controlling for demographic differences between the two groups. Hierarchical regression analysis (HRA) was used, with two predictor sets, and the criterion variable was scores on the 5-item SWLS. For this analysis, eight cases were not included due to missing data, resulting in a total of 169. The results of the analysis, including values of change in R2 (ΔR2), along with unstandardized regression coefficients (B), standard errors (SE B), and standardized coefficients (β) for the predictor variables at each step and in the final mode are presented in Table 5.
In the first step of the regression analysis, demographic variables were entered. This set of variables did not account for a significant amount of variance in SWLS scores, R = 0.19, R2 = 0.04, F (4, 164) = 1.51, p = 0.203. In the second step, residence type was entered, accounting for a significant amount of additional variance in SWLS scores, R = 0.27, R2 = 0.07, ΔR2 = 0.04, ΔF (5, 163) = 6.72, p = 0.010. This indicates that the residents in the downtown residential towers reported higher scores on the SWLS than those from Oak Park, when controlling for demographic differences (B = −0.39, p = 0.010). Although residence type did explain additional variance in life satisfaction scores, the addition of this variable only accounted for an additional 4% of the variance. In the final model, household size was also independently associated with SWLS, with larger household size associated with greater life satisfaction (B = 0.11, p = 0.040).

4.3. Research Question 2. Are There Differences in Residential Satisfaction in the Areas of Travel, Accessibility, Social Integration, and Safety Based on Residence Type (Downtown High-Rise Scenarios and Suburban Low-Rise Scenario)?

Table 6 summarizes the scores on the five different satisfaction domains including travel, accessibility, social interaction, safety and overall residential environment (ORE), and differences by group. Based on t-tests using SPSS, all five of the satisfaction domains were found to be statistically different between the two residential types, with higher mean satisfaction ratings reported on all domains for the downtown high-rise group. Specifically, the greatest differences on the satisfaction ratings between the two residence types were found for accessibility and ORE. The mean score on accessibility satisfaction was 4.76 in downtown high-rise scenarios, and 4.31 in suburban low-rise scenario; the mean score on ORE satisfaction was 4.67 in downtown high-rise scenarios, and 4.28 in suburban low-rise scenario. In all cases, residents of the downtown high-rises reported higher satisfaction levels, although the scores on all these five satisfaction domains reported from both urban scenarios were relatively high (e.g., higher than 4, 5 = highest score).

4.4. Research Question 3. Which of the Satisfaction Domains are the Strongest Predictors of Overall Residential Environment (ORE)?

The third research question addressed which of the satisfaction domains (travel, accessibility, social integration and safety) are the strongest predictors of overall residential environment (ORE) for individuals. The correlation matrix for all variables is presented in Table 7. Significant correlations were found between scores in all the variable measures. This indicates all these satisfaction domains are positively associated with each other. The highest correlation existed between ORE and accessibility (r = 0.73, p < 0.001).
To answer the research question and control for the impact of satisfaction domain areas on satisfaction with ORE, multiple regression analysis was used, with four predictor variables, and the criterion variable was scored on the ORE. The results of the analysis, including change in R2, along with unstandardized regression coefficients (B), standard errors (SE B), and standardized coefficients (β) for the predictor variables are presented in Table 8.
In the regression analysis, four predictor variables (travel, accessibility, social integration and safety) were entered. This set of variables accounted for a significant amount of variance in ORE scores, R = 0.82, R2 = 0.67, F (4, 121) = 62.21, p < 0.001. Accessibility and safety were found to be independently correlated with overall residential environment ORE (B = 0.59, p < 0.001, and B = 0.33, p < 0.001, respectively). Thus, accessibility and safety were found as the strongest predictors of ORE for individuals in this study.

5. Discussion and Future Research

5.1. Life Satisfaction

This study found that those living in downtown high-rises were associated with higher life satisfaction than those from suburban low-rises when controlling for demographic differences; however, this explained less than 5% of the observed variance in life satisfaction outcomes. Still, this was somewhat surprising since suburban living is typically thought to make people feel more satisfied possibly due to larger houses, lower living expenses, better public education resources, greater accessibility to nature, less pollution, etc. This conclusion does not support the long-standing argument that people in dense cities are less satisfied with their lives than suburbs, so the study shows the importance of investigating residents’ life satisfaction at building or neighborhood scales. Social scientists, urban planners, and architects should continue to examine the implications of the characteristics of specific residential buildings and neighborhoods on residents’ life satisfaction, since life satisfaction could be distributed unevenly within a city or county and across its neighborhoods.
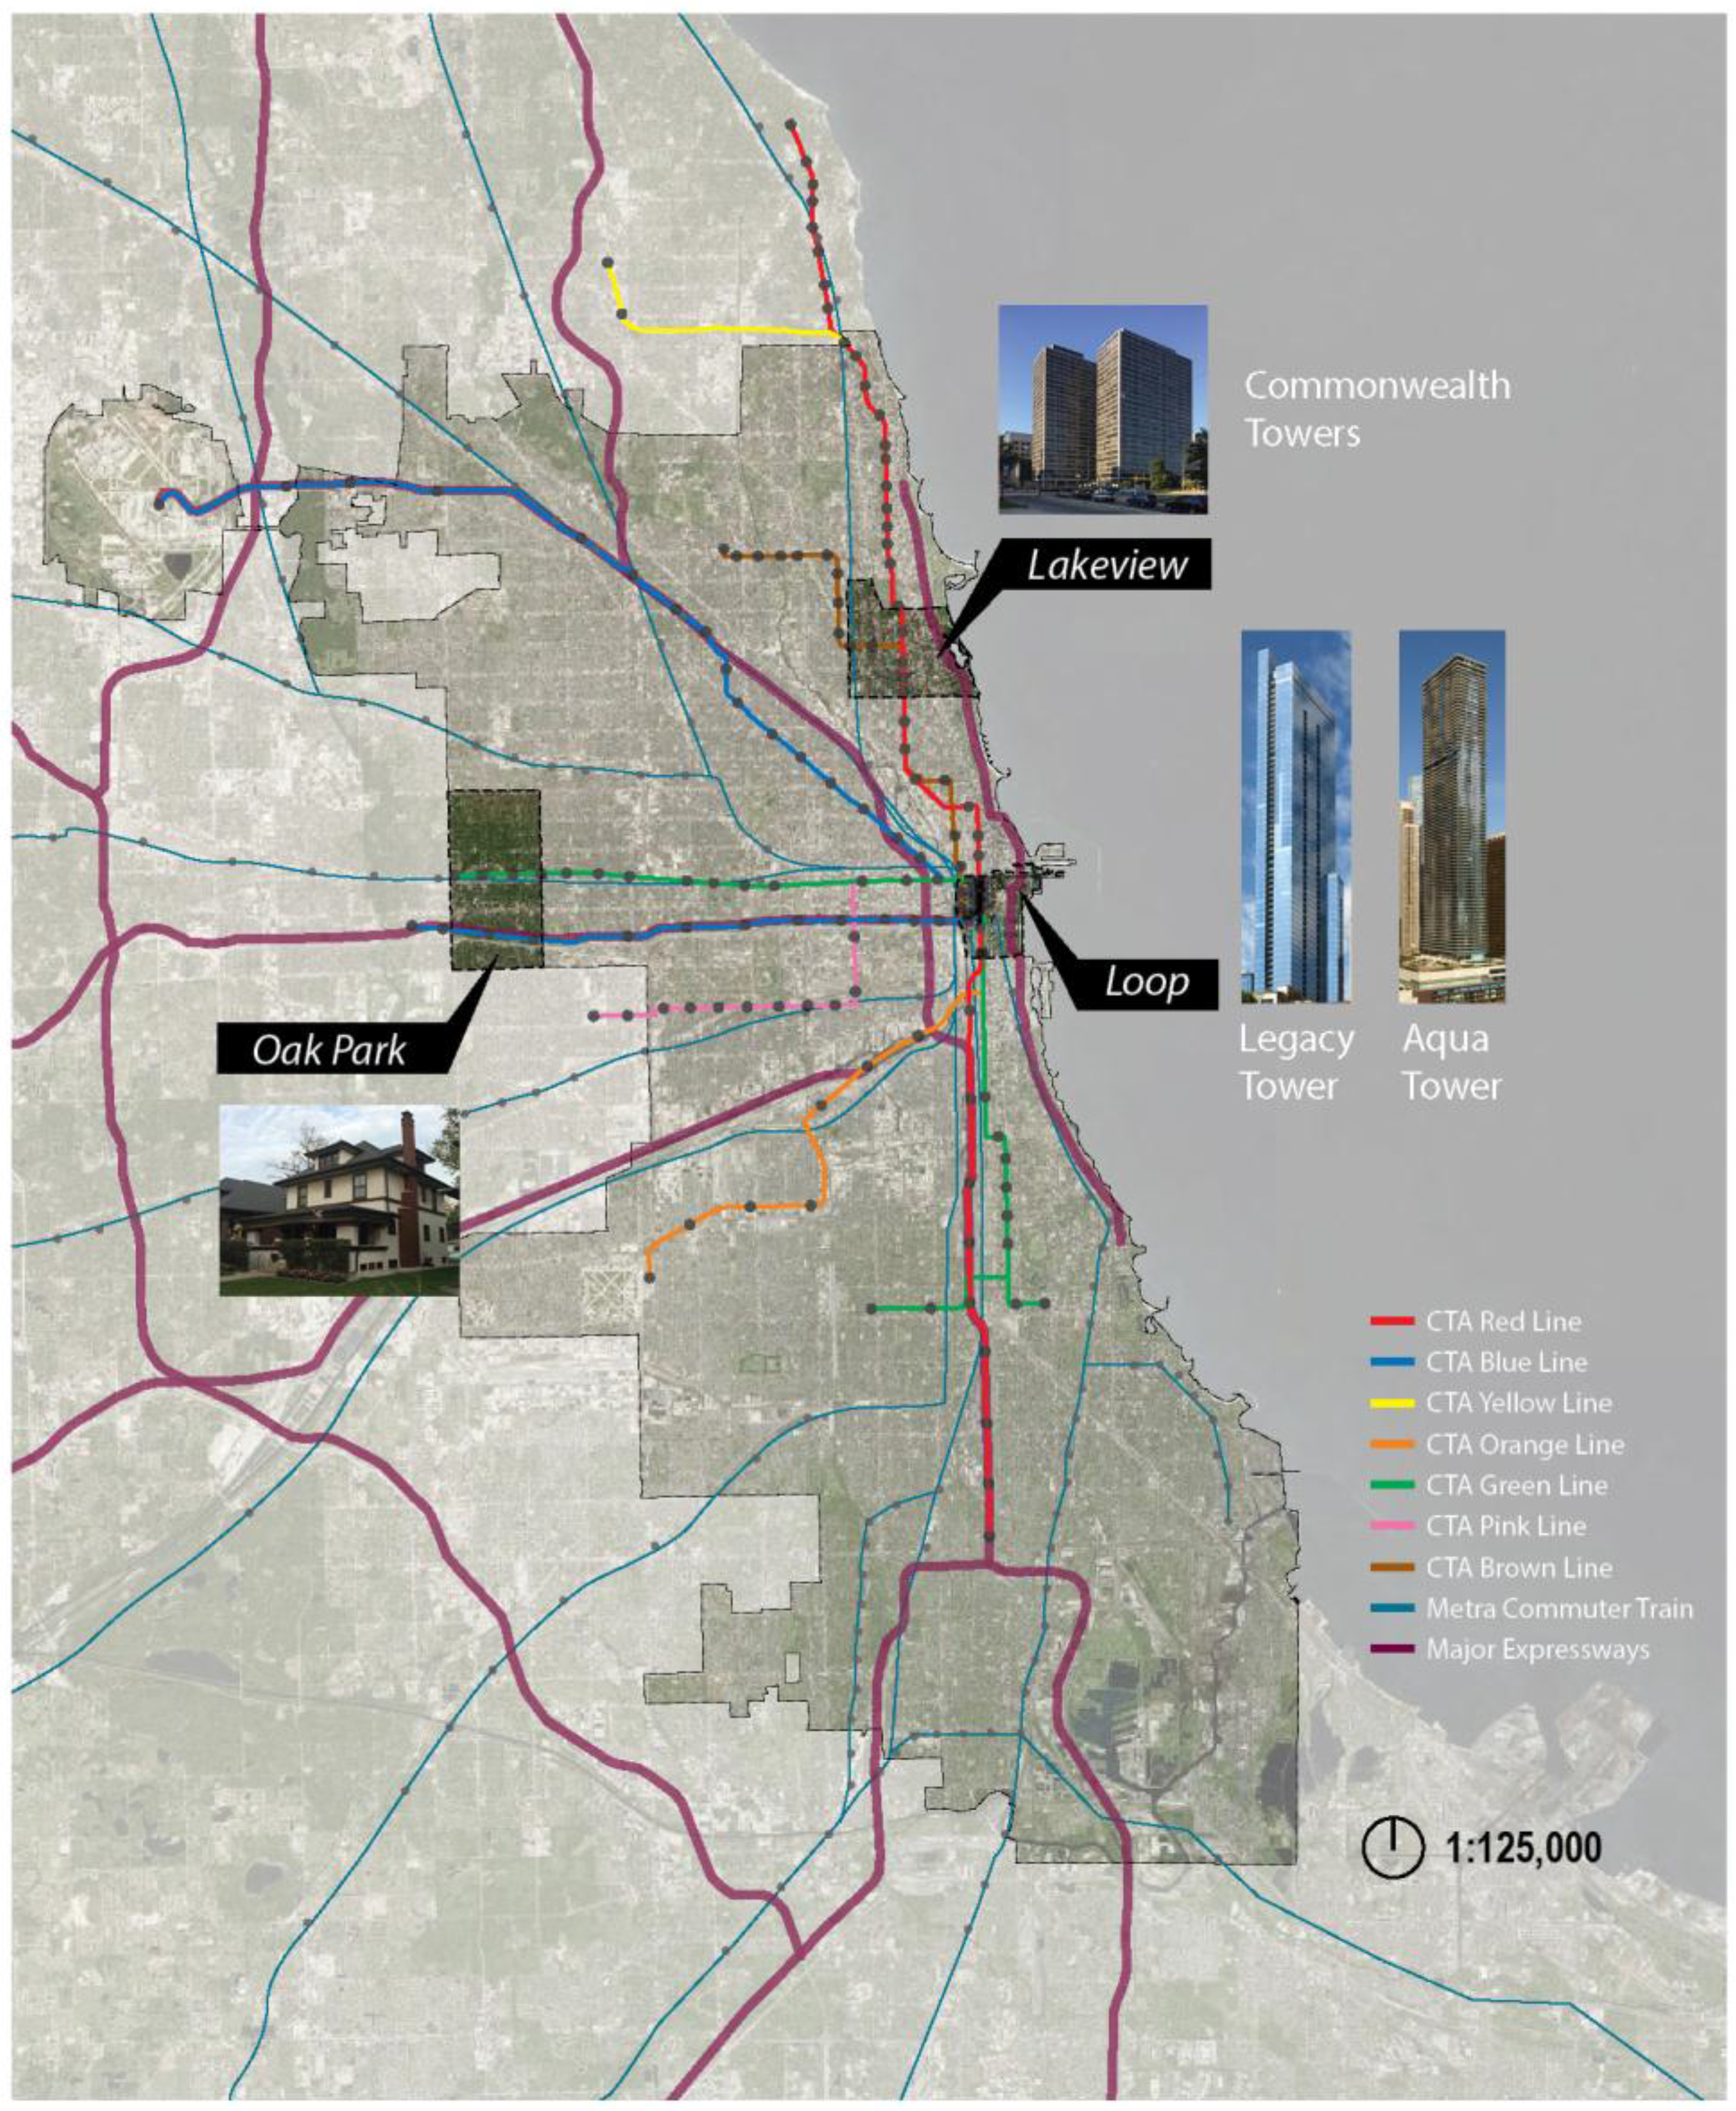
The finding that people living in downtown high-rises had statistically higher life satisfaction than those from suburban low-rises may be explained by the results in the third research question, which indicates that accessibility and safety are the strongest predictors of satisfaction with overall residential environment in the research sample. Apparently, a residential lifestyle in downtown Chicago has greater perceived accessibility (i.e., to public transit, grocery stores, museums, restaurants, sporting events, and others) and perhaps higher perceived safety (i.e. because of the presence of security guards, access control systems for buildings, and eyes on the streets [35]).

5.2. Significant Domains of Satisfaction with Residence

The scores on all five satisfaction domains including travel, accessibility, social interaction, safety and overall residential environment (ORE) reported by residents from both urban and suburban scenarios indicated a high level of satisfaction with residence in both downtown Chicago and Oak Park. Across all satisfaction domains, residents of the downtown high-rises reported higher satisfaction levels, and specifically, accessibility and ORE were found to be the most different between the two settings. As illustrated above, accessibility to public transportation and facilities in downtown Chicago is greater than Oak Park, e.g., multiple modes of transport, especially walking, bicycling and public transportation, greatly support accessibility in the city. Moreover, most city facilities are accessible within a walkable distance in the Chicago Loop and Lakeview neighborhoods where those residential towers are located, as shown in Table 1, e.g., the “Walk Score” is 94 in Chicago Loop, 95 in Lakeview, and only 73 in Oak Park.
All five satisfaction domains were also found to be highly associated with each other. This suggests that researchers need to consider all these factors as a whole, and study the connections between each domain in order to better serve the planning and design process. Moreover, accessibility and safety were found as the strongest predictors of overall residential environment (ORE) for individuals. This conclusion indicates that social scientists, urban planners, and architects might prioritize the improvement of accessibility and safety in the residential environment in order to achieve a higher overall quality of life for the residents. However, even with these four domains accounted for, only two-thirds (67%) of the variance in overall residential satisfaction could be explained. Thus, future research is needed to examine other factors that contribute to residential satisfaction, such as green space, view, privacy, etc.

5.3. Limitations and Future Research

There were a number of limitations to this study that are important to consider when designing future research. First, this study is cross-sectional in nature and cannot imply causality. Second, the results are likely unique to the Chicago and Oak Park areas, with limited ability to infer similar details in other locations. Third, only limited variables were investigated and controlled for to measure life satisfaction and a sense of community. Demographics such as gender, age, income, and household size were tested in the study, but other variables that might also influence residents’ life satisfaction, such as personality, health constitution, or marriage status, were not considered in the study or controlled for. The research thus shows that residents in the downtown high-rises investigated herein have a higher life satisfaction when controlling for these limited variables, but the results might be very different if more variables are considered and controlled. For example, although household size and years of residence were controlled for, those in the Oak Park setting were more likely to have children, which is an important variable impacting life satisfaction. Furthermore, living longer in the residence may not entirely control for the levels of attachment individuals have toward their residential settings. Future research should incorporate these variables as well. Although random assignment to residence type is not practical or likely ethical, more rigorous research methods such as case control designs and matched data will be useful to further isolate the impact of residence type on life satisfaction.
Additionally, only a limited number of satisfaction domains were examined. Five satisfaction domains including travel, accessibility, social interaction, safety and overall residential environment (ORE) were included in the study. However, these accounted for about two-thirds of the variance in ORE scores in the research sample, indicating more other domains can also contribute to ORE score, such as green space, view, and privacy. It is possible that other domains might be found to be stronger predictors of ORE for individuals, instead of accessibility or safety or that the importance of these domains may differ depending on the characteristics and values of the individual (e.g., socioeconomic status or gender). Also, the five satisfaction domains examined in the study are relatively generic, and future research should break them down into more specific domains such as accessibility to transportation, restaurant, shops, social/culture facilities, sense of community, opportunities for participation in community life, etc. It is also important to note the concept of a neighborhood is multifaceted. Future research is also needed to examine how “neighborhood”, “residence”, and “community” are conceptualized differently between suburban and high rise settings.
As an inner suburb neighborhood, Oak Park is located just approximately 12 km away from the urban center of Chicago (just beyond the boundary of the city), and is supported by access to public transportation, which is not common in the typical American suburb. Moreover, Oak Park has a relatively high population density (4262/km2 as shown in Table 1) compared to the typical American suburb (e.g., nearby Naperville, 55 km from Chicago, has a population density of 1554/km2). Conversely, the downtown Chicago neighborhoods investigated here have a lower population density (i.e., 7200/km2 in the Loop and 12,000/km2 in Lakeview) than other comparable cities such as New York City (i.e., 27,799/km2 in Manhattan). Further research is needed to encompass more neighborhoods across more dense downtown settings and less-dense suburban settings.
Finally, a major limitation of this study is possible sample bias and generalizability. Since individuals in the study were overall quite satisfied with where they live they may have been more inclined to participate in this study and not representative of true population. Therefore, the potential for response bias, given this was not a randomly selected sample, is important to consider when interpreting the findings. Moreover, the majority of the participants were white, wealthy, and highly educated and do not reflect the diversity of the true population. For example, more than 84% of study participants in both scenarios were white, and more than 68% of the households’ annual income in both scenarios was more than USD $100,000, which is significantly higher than the median household income of the Chicago metropolitan area, which was about USD $60,000 in 2013 [36], as shown in Table 1. On one hand this degree of homogeneity between the two residence types was useful in the attempt to isolate the impact of the residence type on the life satisfaction indicators. However, the sample is clearly not representative of the true population and future research is needed to see if these findings hold true for diverse populations. Future research examining residents’ satisfaction in conjunction with U.S. Census data would be particularly beneficial for ensuring representativeness of the sample. Further, continued examination of how the qualities and features of residential environments in other locations and populations relate to the life and residential satisfaction of inhabitants can help to inform design and policy to improve these important facets of sustainability.

6. Conclusions

This work describes results of an investigation of the satisfaction of place and overall life satisfaction of residents living in both urban high-rise residential buildings and suburban low-rise residential buildings, which are key measures of the social sustainability of residential living. Surveys were administered to individuals living in existing high-rise residential buildings in downtown Chicago, IL, and in existing low-rise residential buildings in suburban Oak Park, IL. Over 1500 individuals were contacted, resulting in over 500 responses. There were 177 completed responses in total, including 94 from residents of four downtown high-rise buildings and 83 from residents in suburban low-rise homes. Residents living in downtown high-rise buildings had significantly higher life satisfaction scores than residents living in suburban low-rise homes when controlling for demographic differences; however, the differences were small, as housing type explained less than 5% of the observed variance in life satisfaction outcomes. The research also evaluated five life satisfaction domains including travel, accessibility, social interaction, safety, and overall residential environment (ORE). In all cases, residents of the downtown high-rises reported higher satisfaction levels, although the scores on all these five satisfaction domains reported from both urban scenarios were high. Moreover, all five satisfaction domains were associated with each other, and accessibility and safety were found to be the strongest predictors of ORE for individuals in this study. This work provides valuable empirical evidence from a major U.S. city and one of its surrounding suburban neighborhoods to help address the long-standing debate about whether urban living is more or less socially sustainable than suburban living.

Acknowledgments

The authors gratefully acknowledge financial and technical support from the Council on Tall Buildings and Urban Habitat (CTBUH). The authors also recognize the following companies and organizations, which have supported this research: The Village of Oak Park, Oak Park Elementary School District 97, Mesa Development LLC, DK Condo for the Legacy at Millennium Park, Property Owner’s Association of the Legacy at Millennium Park, Commonwealth Plaza Condominium Association, Green Initiative Committee of Commonwealth Plaza Condominium, Aqua at Lakeshore East Condominium, Aqua Condominium Association, Magellan Development Group, Solomon Cordwell Buenz (SCB) Architecture, Studio Gang Architects, and Walsh Construction.

Author Contributions

As the primary author, Peng Du initiated the study, performed the analysis, and wrote the main body of this paper. Antony Wood supervised the study, provided advice on the research scope, methodology, and data analysis, and also contributed in editing the paper. Nicole Ditchman contributed in structuring and editing the paper, advising on conducting the surveys, performing the data analysis, and proofreading the manuscript. Brent Stephens contributed in structuring and editing the paper, and proofreading the manuscript.

Conflicts of Interest

The authors declare no conflict of interest.

References

  1. United Nations, Department of Economic and Social Affairs, Population Division. World Urbanization Prospects: The 2014 Revision, Highlights. 2014. Available online: https://esa.un.org/unpd/wup/publications/files/wup2014-highlights.Pdf (accessed on 1 March 2017).
  2. Bastos, J.; Batterman, S.A.; Freire, F. Significance of mobility in the life-cycle assessment of buildings. Build. Res. Inf. 2016, 44, 376–393. [Google Scholar] [CrossRef]
  3. Du, P. Environmental and Social Sustainability Implications of Downtown High-Rise vs. Suburban Low-Rise Living: A Chicago Case Study. Ph.D. Thesis, Illinois Institute of Technology, Chicago, IL, USA, 2015. [Google Scholar]
  4. Du, P.; Wood, A.; Stephens, B. Empirical Operational Energy Analysis of Downtown High-Rise vs. Suburban Low-Rise Lifestyles: A Chicago Case Study. Energies 2016. [Google Scholar] [CrossRef]
  5. Du, P.; Wood, A.; Stephens, B.; Song, X. Life-Cycle Energy Implications of Downtown High-Rise vs. Suburban Low-Rise Living: An Overview and Quantitative Case Study for Chicago. Buildings 2015, 5, 1003–1024. [Google Scholar] [CrossRef]
  6. Gudipudi, R.; Fluschnik, T.; Ros, A.G.; Walther, C.C.; Kropp, J.P. City density and CO2 efficiency. Energy Policy 2016, 91, 352–361. [Google Scholar] [CrossRef]
  7. Norman, J.; MacLean, H.L.; Kennedy, C.A. Comparing High and Low Residential Density: Life-Cycle Analysis of Energy Use and Greenhouse Gas Emissions. J. Urban Plan. Dev. 2006, 132, 10–21. [Google Scholar] [CrossRef]
  8. Perkins, A.; Hamnett, S.; Pullen, S.; Zito, R.; Trebilcock, D. Transport, Housing and Urban Form: The Life Cycle Energy Consumption and Emissions of City Centre Apartments Compared with Suburban Dwellings. Urban Policy Res. 2009, 27, 377–396. [Google Scholar] [CrossRef]
  9. Stephan, A.; Crawford, R.H.; de Myttenaere, K. A comprehensive assessment of the life cycle energy demand of passive houses. Appl. Energy 2013, 112, 23–34. [Google Scholar] [CrossRef]
  10. Du, P.; Wood, A.; Stephens, B. Life Cycle Assessment of Urban vs. Suburban Residential Mobility in Chicago. In Proceedings of the ARCC 2015 Conference, Chicago, Illinois, IL, USA, 6–9 April 2015. [Google Scholar]
  11. Adams, R.E. Is happiness a home in the suburbs?: The influence of urban versus suburban neighborhoods on psychological health. J. Commun. Psychol. 1992, 20, 353–372. [Google Scholar] [CrossRef]
  12. Adams, R.E.; Serpe, R.T. Social Integration, Fear of Crime, and Life Satisfaction. Sociol. Perspect. 2000, 43, 605–629. [Google Scholar] [CrossRef]
  13. Balducci, A.; Checchi, D. Happiness and Quality of City Life: The Case of Milan, the Richest Italian City. Int. Plan. Stud. 2009, 14, 25–64. [Google Scholar] [CrossRef]
  14. Berry, B.J.L.; Okulicz-Kozaryn, A. An Urban-Rural Happiness Gradient. Urban Geogr. 2011, 32, 871–883. [Google Scholar] [CrossRef]
  15. Fassio, O.; Rollero, C.; Piccoli, N.D. Health, Quality of Life and Population Density: A Preliminary Study on ‘Contextualized’ Quality of Life. Soc. Indic. Res. 2013, 110, 479–488. [Google Scholar] [CrossRef]
  16. Knight, J.; Gunatilaka, R. The Rural-Urban Divide in China: Income but Not Happiness? J. Dev. Stud. 2010, 46, 506–534. [Google Scholar] [CrossRef]
  17. Okulicz-Kozaryn, A. Unhappy metropolis (when American city is too big). Cities 2017, 61, 144–155. [Google Scholar] [CrossRef]
  18. Okulicz-Kozaryn, A.; Mazelis, J.M. Urbanism and happiness: A test of Wirth’s theory of urban life. Urban Stud. 2016. Available online: http://journals.sagepub.com/doi/abs/10.1177/0042098016645470 (accessed on 1 March 2017). [CrossRef]
  19. Turkoglu, H. Sustainable Development and Quality of Urban Life. Procedia Soc. Behav. Sci. 2015, 202, 10–14. [Google Scholar] [CrossRef]
  20. Moser, G. Quality of life and sustainability: Toward person-environment congruity. J. Environ. Psychol. 2009, 29, 351–357. [Google Scholar] [CrossRef]
  21. Pissourios, I.A. An interdisciplinary study on indicators: A comparative review of quality-of-life, macroeconomic, environmental, welfare and sustainability indicators. Ecol. Indic. 2013, 34, 420–427. [Google Scholar] [CrossRef]
  22. Eizenberg, E.; Jabareen, Y. Social Sustainability: A New Conceptual Framework. Sustainability 2017. [Google Scholar] [CrossRef]
  23. Dempsey, N.; Bramley, G.; Power, S.; Brown, C. The social dimension of sustainable development: Defining urban social sustainability. Sustain. Dev. 2011, 19, 289–300. [Google Scholar] [CrossRef]
  24. Campbell, A. The Sense of Well-Being in America: Recent Patterns and Trends; McGraw-Hill: New York, NY, USA, 1981. [Google Scholar]
  25. Myers, D. Building Knowledge about Quality of Life for Urban Planning. J. Am. Plann. Assoc. 1988, 54, 347–358. [Google Scholar] [CrossRef]
  26. Van Kamp, I.; Leidelmeijer, K.; Marsman, G.; De Hollander, A. Urban environmental quality and human well-being: Towards a conceptual framework and demarcation of concepts; a literature study. Landsc. Urban Plan. 2003, 65, 5–18. [Google Scholar] [CrossRef]
  27. Fornara, F.; Bonaiuto, M.; Bonnes, M. Cross-Validation of Abbreviated Perceived Residential Environment Quality (PREQ) and Neighborhood Attachment (NA) Indicators. Environ. Behav. 2010, 42, 171–196. [Google Scholar] [CrossRef]
  28. Allen, H.M., Jr.; Bentler, P.M.; Gutek, B.A. Probing Theories of Individual Well-being: A Comparison of Quality-of-life Models Assessing Neighborhood Satisfaction. Basic Appl. Soc. Psychol. 1985, 6, 181–203. [Google Scholar] [CrossRef]
  29. The Global Tall Building Database of the CTBUH. The Skyscraper Center. Available online: http://www.skyscrapercenter.com/ (accessed on 1 March 2017).
  30. US Census Bureau. Census.gov. Available online: http://www.census.gov/ (accessed on 28 March 2016).
  31. CMAP. Community Data Snapshots. Available online: http://www.cmap.illinois.gov/data/metropulse/community-snapshots (accessed on 1 March 2015).
  32. Walk Score. Walk Score. Available online: https://www.walkscore.com/ (accessed on 13 March 2017).
  33. Diener, E.R.; Emmons, A.; Larsen, R.J.; Griffin, S. The Satisfaction with Life Scale. J. Pers. Assess. 1985, 49, 71–75. [Google Scholar] [CrossRef] [PubMed]
  34. Pavot, W.; Diener, E.; Colvin, C.R.; Sandvik, E. Further Validation of the Satisfaction With Life Scale: Evidence for the Cross-Method Convergence of Well-Being Measures. J. Pers. Assess. 1991, 57, 149–161. [Google Scholar] [CrossRef] [PubMed]
  35. Jacobs, J. The Death and Life of Great American Cities; Vintage Books: New York, NY, USA, 1961. [Google Scholar]
  36. US Census Bureau. American Community Survey (ACS). Available online: https://www.census.gov/programs-surveys/acs (accessed on 13 March 2017).
Figure 1. Study case locations relative to central Chicago and its major transportation systems.
Sustainability 09 01052 g001
Table 1. Basic characteristics of the two case study sets.
BuildingDowntown High-RiseSuburban Low-Rise
Aqua TowerLegacyCommonwealth PlazaOak Park
Completion year20102009195671.9% built before 1950
24.7% built 1950–1999
3.4% built after 2000
Height250 m262 m77 mTypically 10 m or lower
# Number of floors867327Typically 1–3
# Number of units738357375Typically 1 per abode
Structural materialConcreteConcreteSteel/concreteWood frame or stone or brick
# Number of available parking spaces1271449293N/A
# Number of available parking spaces/unit1.71.30.8N/A
NeighborhoodLoopLakeviewOak Park
Neighborhood population22,65564,63151,781
Neighborhood density7200/km²12,000/km²4262/km²
Distance to Chicago LoopWalkable6 km (average)11–16 km (average)
Walk Score949573
Public transport system in reasonable walking distanceAll CTA lines, all Metra lines and multiple bus linesCTA red, purple and brown lines, Metra Union Pacific North line and multiple bus linesGreen and blue CTA lines, Metra UP-West line and Pace buses
N/A = not applicable. Data sources: Building management companies, Council on Tall Buildings and Urban Habitat (CTBUH) Skyscraper Center [29], U.S. Census Bureau [30], Chicago Metropolitan Agency for Planning (CMAP) [31] and Walk Score [32]; Walk Score measures walkability on a scale from 0 to 100 based on walking routes to destinations such as grocery stores, schools, parks, restaurants, and retail. A higher Walk Score indicates that the location has a larger number of amenities that can be accessed by a short walk.
Table 2. Characteristics of the research sample.
VariablesDowntown High-RiseSuburban Low-RiseTest Statistic
N94 83
Gender χ2(1, N = 170) = 7.51, p = 0.006 **
Female19(20.2%)33(39.8%)
Male70(74.5%)48(57.8%)
Missing5(5.3%)2(2.4%)
Age a χ2(3, N = 175) = 35.09, p < 0.001 ***
18–3510(10.6%)7(8.4%)
36–5016(17.1%)50(60.2%)
51–6547(50.0%)19(22.9%)
66+19(20.2%)7(8.4%)
Missing2(2.1%)0(0.0%)
Race/ethnicity a χ2 (1, N = 174) = 3.67, p = 0.055
White85(90.4%)70(84.3%)
Non-white6(6.4%)13(15.7%)
Missing3(3.2%)0(0.0%)
Employment Status a χ2(1, N = 175) = .53, p = 0.466
Employed63(67.0%)61(73.5%)
Unemployed29(30.9%)22(26.5%)
Missing2(2.1%)0(0.0%)
Annual household income a χ2(3, N = 160) = 2.78, p = 0.427
Under 50,0004(4.3%)4(4.8%)
USD $50,000–$99,99910(10.6%)12(14.5%)
USD $100,000–$199,99922(23.4%)32(38.6%)
USD $200,000+42(44.9%)34(40.9%)
Missing16(17.0%)1(1.2%)
Housing ownership a χ2 (1, N = 177) = 0.79, p = 0.67
Own82(87.2%)74(89.2%)
Rent9(9.6%)8(9.6%)
Missing3(3.2%)1(1.2%)
Household size b1.86(0.78)3.55(1.28)t(132.5) = 10.44, p < 0.001 ***
Average residence time (years) b6.39(9.55)10.29(8.77)t(174) = 2.81, p = 0.006 **
Note: a Frequency (%). b M (SD). * p < 0.05 (2-tailed), ** p < 0.01 (2-tailed), *** p < 0.001 (2-tailed).
Table 3. Correlations of study variables (N = 168).
Variables M(SD)12345
1. Gender0.70 (0.46)
2. Age2.55 (0.86)0.135
3. Household size2.70 (1.35)−0.117−0.334 ***
4. Residence time8.30 (9.47)−0.0510.316 ***0.032
5. Residence type0.48 (0.50)−0.218 **−0.297 ***0.631 ***0.197 *
6. SWLS4.12 (0.73)0.017−0.0750.047−0.177 *−0.147
Sex (0 = male, 1 = female); age (1 = 18–35, 2 = 36–50, 3 = 51–65, 4 = 66+); residence time (in years); household size (number of household members); residence type (0 = downtown residential towers, 1 = Oak Park); Satisfaction with Life Scale, SWLS (1 = worst, 5 = best); * p < 0.05 (2-tailed), ** p < 0.01 (2-tailed), *** p < 0.001 (2-tailed).
Table 4. Scores on Satisfaction with Life Scale (SWLS) reported by the research sample (N = 171).
VariablesDowntown High-RiseSuburban Low-RiseTest Statistic
N89 82
SWLS4.18(0.62)4.01(0.81)t(175) = −1.58, p = 0.116
Note: * p < 0.05, ** p < 0.01, *** p < 0.001.
Table 5. Hierarchical regression analysis for prediction of life satisfaction (N = 169).
Model
VariableR2ΔR2BSE Bβp
Step 10.04
Gender (1 = female) 0.040.120.020.775
Age −0.010.07−0.010.896
Household size 0.030.040.060.496
Residence time −0.010.01−0.170.035 *
Step 20.07 *0.04 **
Gender (1 = female) −0.020.12−0.010.905
Age −0.050.07−0.060.515
Household size 0.110.540.210.040 *
Residence time −0.010.01−0.110.179
Residence type (1 = Oak Park) −0.390.15−0.270.010 **
Note: F (5, 163) = 2.59, p = 0.028 for the full model; * p < 0.05, ** p < 0.01, *** p < 0.001.
Table 6. Scores on satisfaction domains reported by the research sample (N = 171). ORE: overall residential environment.
VariablesDowntown High-RiseSuburban Low-RiseTest Statistic
N89 82
Travel4.55(0.63)4.29(0.73)t(151) = −2.451, p = 0.015 *
Accessibility4.76(0.43)4.31(0.79)t(115.7) = −4.351, p < 0.001 ***
Social Integration4.46(0.83)4.19(0.80)t(158) = −2.112, p = 0.036 *
Safety4.44(0.78)4.20(0.79)t(169) = −2.017, p = 0.045 *
ORE4.67(0.52)4.28(0.82)t(135.2) = −3.673, p < 0.001 ***
Note: * p < 0.05, ** p < 0.01, *** p < 0.001.
Table 7. Correlations of study variables (N = 126).
VariablesM(SD)12345
1. ORE4.52 (0.71)
2. Travel4.48 (0.67)0.540 ***
3. Accessibility4.56 (0.65)0.731 ***0.539 ***
4. Social integration4.36 (0.80)0.421 ***0.311 ***0.397 ***
5. Safety4.37 (0.75)0.584 ***0.413 ***0.338 ***0.286 ***
Note: * p < 0.05, ** p < 0.01, *** p < 0.001.
Table 8. Regression analysis for overall residential environment (N = 126).
Model
VariableR2BSE Bβp
0.67 ***
Travel 0.090.070.080.199
Accessibility 0.590.070.540.000 ***
Social integration 0.080.050.080.149
Safety 0.330.060.340.000 ***
Note: F (4, 121) = 62.21, p < 0.001 for the model; * p < 0.05, ** p < 0.01, *** p < 0.001.

