Article

The Significance of Forests and Algae in CO2 Balance: A Hungarian Case Study

1
Institute of Business Economics, Faculty of Economics and Business, University of Debrecen, Böszörményi Street 138, H-4032 Debrecen, Hungary
2
Institute of Sectoral Economics and Methodology, Faculty of Economics and Business, University of Debrecen, Böszörményi Street 138, H-4032 Debrecen, Hungary
3
Institute of Rural Development, Tourism and Sports Management, Faculty of Economics and Business, University of Debrecen, Böszörményi Street 138, H-4032 Debrecen, Hungary
*
Author to whom correspondence should be addressed.
Sustainability 2017, 9(5), 857; https://doi.org/10.3390/su9050857
Submission received: 21 February 2017 / Revised: 12 May 2017 / Accepted: 15 May 2017 / Published: 19 May 2017

Abstract

:
This study presents the sequestration and emissions of forests and algae related to CO2 while providing a comparison to other biomass sources (arable crops, short rotation coppices). The goal of the paper is to analyze the impact of the current CO2 balance of forests and the future prospects for algae. Our calculations are based on data, not only from the literature but, in the case of algae, from our own previous experimental work. It was concluded that the CO2 sequestration and natural gas saving of forests is typically 3.78 times higher than the emissions resulting from the production technology and from the burning process. The economic and environmental protection-related efficiency operate in opposite directions. The CO2 sequestration ability of algae can primarily be utilized when connected to power plants. The optimal solution could be algae production integrated with biogas power plants, since plant sizes are smaller and algae may play a role, not only in the elimination of CO2 emissions and the utilization of heat but also in wastewater purification.

1. Introduction

According to the 2015 statement of the American Meteorological Society, 2014 was the hottest year since records began. This change is supposed to have been caused by the increasing amount of greenhouse gas (GHG) emissions, of which the concentration of CO2 increased by 1.9 ppm and globally reached 397.2 ppm in an average year. This tendency increases a risk of reductions in crop yields and forage quality [1]. Global CO2 emissions in 2012 were 54 Gt [2], 42% of which resulted from electric and heat energy production, 23% from automobiles, 19% from industrial production, 6% from residential communities, and 3% from services. The total emissions of agriculture, forestry, and fisheries were only 7% of the total [3]. Most scientific papers state that higher GHG emissions result in increasing global temperature [4,5,6,7,8,9].
One possible way to stop these unfavorable tendencies is to capture CO2 in the biomass. Theoretically, there are three basic solutions for reducing CO2 emissions, and thereby mitigating the impacts of climate change: (1) reducing the use of fossil energy resources, (2) CO2 sequestration from the atmosphere and (3) sequestration and storing the emitted CO2 (via pre-, post-, and oxycombustion) before it is emitted into the atmosphere [10]. The plants (algae, tree species, short rotation coppices, and arable crops) examined in this paper are theoretically able to contribute to mitigating environmental damage in all three ways. Artificial carbon capture technology is water-, energy-, and capital-intensive [11] compared to biomass.
Based on the study by Chen and Geng [12], there is no significant correlation between the proportion of renewable energy consumption and fossil energy saving and CO2 emissions reduction, since it differs significantly between countries. Hungary is in the same group as Denmark, France, Germany, Ireland, Italy, Japan, Korea, Spain, and the United Kingdom. These countries have a good performance with a relatively low proportion of renewable energy, which implies they have advanced technology and management. The proportion of renewables in Hungary in 2015 was 14.5% [13].
Our study describes the characteristics of growing and using both groups of plants (algae, tree species, short rotation coppices, and arable crops), as well as the potential savings to be achieved in terms of harmful gas emissions by comparing them to other biomass resources (arable crops, short rotation coppices). This paper briefly outlines the current significance of these crops, as well as their economic attributes, based not only on statistical data but also on our own experimental results.
Arable crops are the most important elements of CO2 emissions and sequestration in agriculture; however, short rotation coppices can be produced both on arable land and forestry areas. Since two of the analyzed species (acacia: Robinia pseudoacacia and poplar: Populus genera) are considered in both conventional forestry and short rotation coppices, they may be essential for this assessment. It is essential to introduce them briefly in order to assess the cultivation and utilization of traditional tree species and algae from an environmental perspective compared to the previous technologies and land use methods.
Our results basically apply to Hungarian conditions, but the used methods and the specific technological and environmental data (applying one hectare areas) are suitable to international comparison. Hungarian specialties are highlighted for making comparison with international data.
The goal of this paper is to analyze the impact of the current CO2 balance of forests and future prospects for algae in Hungary. Our objectives include the creation of a CO2 emission sequestration model, which is able to take into consideration both the production and utilization sides of the crops analyzed, the description of the related forest technologies and their impacts on CO2 emissions. These technologies have great importance regarding biomass yields and CO2 emissions and sequestration. The reason we considered algae for biodiesel with power plants is that the emissions from power plants and traffic is of great importance in Hungary, accounting for almost 20% [11] and 22% [9] of total emissions, respectively. In this way a considerable reduction in emissions is possible. In addition, algae can even be substituted for diesel oil with a more positive effect on the CO2 balance [3,13,14,15,16], and the waste heat from electricity generation is another aspect of algae production. Regarding the long-term importance of algae in CO2 sequestration, the possible effects of two algae species (Chlorella vulgaris and Scenedesmus dimorphus) produced near power plants are included in our analysis by using some of the results from our previous experiments [16].
In our calculations the main problem was a lack of detailed studies about typical forest technologies and their emissions in scientific papers, so in some cases we used trustworthy expert opinions in order to clarify the most important technical details about forestry. The results confirm that the average NPP of Hungarian forests is 10–46% higher than the EU average.
Here are our hypotheses:
  • Currently, forests have the biggest potential in the sequestration of CO2, but the future holds significant prospects for algae as well.
  • Forests are more effective in CO2 sequestration in Hungary compared to the European average, thanks to the favorable geographical conditions and the dominant wood species.
  • Due to the high yield potential and favorable composition, algae have a very high potential in CO2 sequestration compared to other crops.
The carbon balance of European forests can be studied by various methods. Ťupek et al. [14] assessed the net primary production (NPP) of national forests with four different models. The results confirm that the average NPP of Hungarian forests is 10–46% higher than the EU average. The exact values differ slightly from our results, due to the different methodology and the specific category calculated, but the higher NPP justifies the higher yields of Hungarian forests compared with the European average.
Forests and algae both have very favorable and similar CO2 sequestration potential (in average 1.78 kg/kg/year and 1.6–2 kg/kg/year dry material, respectively), and high yields (forests: 2.6–3.9 t/ha/year; algae: 127–250 t/ha/year). In addition, algae can even substitute other fossil fuels (in our calculations this would be diesel oil) with a more positive effect on the CO2 balance [3,15,16,17,18], as detailed later. It should be mentioned that these crops also produce CO2 emissions but this is a non-fossil type of emission so it does not add to the global CO2 balance.
Due to the fact that forests represent a large amount of biomass and have long life cycles, while algae grows rather fast and can be used in multiple ways, they may have a significant impact on air pollutant emissions.
Forests are an irreplaceable national treasure and a form of land use that provides not only financial security but also mental refreshment, while also being indispensable aspects of environmental protection. A large proportion of their advantages cannot even be expressed in monetary terms.
European forests are very important in the economy as they represent income for more than 16 million forest owners. Forest-related activities result in a turnover of around 500 billion EUR per year and provide subsistence to around 3.5 million people [19]. In Europe, the extent of forested areas is around 180–190 million hectares, which makes Europe one of the most forest-rich regions in the world, where more than 40% of the mainland is covered with forest [20]. Moreover, annually, forests absorb 719 million tons of CO2 on average in the EU (9% of total emissions), which is equivalent to 3.3 t ha−1 [21]. Unlike many other parts of the world, the size of forested areas in Europe is increasing by around 0.5% per year [3].
As regards Hungary, the total amount of CO2 emissions was 51 million tons in 2013. This value was 46% less than the average yearly emissions between 1985 and 1987, although the reason for this decrease was mostly due to the economic restructuring that has since taken place. The main sources of emissions are household and electricity production, which together provide 65%, with traffic contributing another 22% of CO2 emissions in Hungary. Forestry, agriculture, and fishery represented only 4% of all CO2 emissions [22].
Forests are a relatively low-cost option for mitigating climate change [23,24], but transaction costs range widely (0.09–7.71 USD/t CO2), depending principally on the price of carbon and the project size [25]. Application of traditional low-input, indigenous forest resource management methods may be an especially sustainable option [26]. However, there are also other important elements of sustainability in renewable energy. According to the analyses of Dombi et al. [27], Dombi et al. [28], the most important one in Hungary is not CO2 sequestration, but land demand and social impacts (employment, local revenue production).

1.1. The Significance of Forests in Hungary

Due to the importance of the Hungarian forests in CO2 sequestration and the different parameters in terms of geographical conditions, share of tree species, and features of wood utilization, we would like to briefly introduce the specific characteristics of these forests.
Currently, 22% of Hungary’s land is covered with forest, while in the EU-28, forests and other wooded land cover approximately the same proportion of land area as that used for agriculture, corresponding to an estimated 41% of its total area [29]. In Hungary, the long-term objective is to increase the size of forested areas up to a forestation rate of 26–27%. The main characteristics of Hungarian forestry in 2012 were [3]:
  • Forestry area: 1.938 million hectares
  • Tree stock: 370 million m3
  • Yearly gross increment: 13 million m3
  • Mean yearly gross increment: 6.8–7 m3/ha/year (EU: 4.7 m3/ha/year)
  • Yearly gross timber extraction: 7.8 million m3
  • Logging residue (% of timber extraction): 13–15%
This paper primarily focuses on the amount of CO2 captured and emitted by the dendromass above the ground (cutting level), even though there is a significant amount of wood below the ground whose CO2 cycle is also notable. According to Führer and Molnár [15], 57% of the carbon stock is stored in the tree stock above the cutting level, while 41% is stored in the stump and the root system. Furthermore, around 2% of all stored carbon can be found in the foliage.
The amount of above-ground and below-ground dendromass depends on the tree species, production site, and climatic circumstances, similarly to the amount of captured CO2 both in terms of the whole quantity and its proportions. During the analyses performed by Führer et al. [30], the above- and below-ground biomass amounts of climate indicator species, more specifically a sessile oak population, were determined and expressed in carbon equivalents. Based on the measurements performed, the following distribution of total organic content was observed:
  • 70% above the ground:
    trunk (55%)
    roots (24%)
    branches (13%)
    stump (6%)
    foliage (2%)
  • 30% below the ground, in the soil. The carbon stock in the forest floor and mineral soil also appears to be highly dependent on the local tree species [21].
The amount of CO2 captured by the dendromass below the cutting level (mainly in the soil) does not affect the CO2 balance, since the amount of CO2 captured here will eventually be transferred back into the atmosphere following the extraction of the wood population in a few years or decades, similarly to when the wood is burnt. The carbon chains of the part of the stump beneath the surface and the root residues are broken down with the help of fungi and microorganisms by means of natural decay by a form of a slow burning [31].
Based on the study of Führer and Molnár [15], the C-contents of the different tree species are almost equal to each other. Calculating the average annual increment of the forests, the value of CO2 sequestration can be determined per hectare using the formula based on the chemical content of wood and the plant photosynthesis. This value is 981 kg m−3. From an air pollutant emissions perspective, burning is an important theoretical opportunity to achieve savings. However, the fact that collecting the wood from the soil has especially high energy demands, costs, and emissions is a serious obstacle. Nowadays, stump planning and root tearing are usually the first steps before forest renewal, and therefore the wood of the stump and the roots remain in the soil.

1.2. Other Crops

Field crops play a significant role in the carbon cycle and woody energy plantations include significant wood species in forestry; therefore, we consider it necessary to briefly describe their role in the CO2 balance. It should be emphasized that a great number of species and technologies make great differences in CO2 emissions and sequestration, but here we can only consider the averages and variations of the most relevant sources due to the limitations of related sources.

1.2.1. Woody Energy Plantations

Both the revenue and expenditures of energy plantations significantly exceed those of conventional forests; therefore, their CO2 sequestration and emissions are also much higher. These plantations are much more sensitive to the production technology than conventional forests [32]. Additionally, their annual yield—due to the more intensive juvenile growth and the more intensive production technology—amounts to around three times that of a conventional forest. Since the feedstock is only used for energy production purposes, this quantity of emissions is accompanied by savings on the emissions of the saved fossil energy resources as a positive factor, while the emissions involved in expenditures related to production and transport are also taken into consideration.
The energy balance of energy plantations was examined by Kohlheb et al. [33] in relation to intensive and extensive technologies on outstanding and unfavorable production sites. According to their findings, the energy input/energy output ratio of energy plantations shows a rather high standard deviation, ranging from 1:2.3 to 1:18.5. Extensive technologies have more favorable indexes (Appendix A).

1.2.2. The Impact of Crop Production on CO2 Sequestration

Agriculture and climate change have a mutual impact on each other. Agricultural activities have an effect on climate through GHG emissions, which result from the procedures performed, while climate change has an impact on the efficiency of expenditures, primarily that of fertilization [34]. However, it has to be emphasized in terms of field crop production that the amount of carbon released or captured during production is not the primary consideration, since food must be produced independently of the CO2 balance. Climate change may lead to reduced productivity resulting in food scarcity and price increases. For this reason, ecologically intensive land use methods may be preferred in practice.
According to Ciais et al. [35], the amount of carbon captured in the soil is between 490 and 846 g C m−2 year−1 in net primary production (NPP) in the area of the EU-25. Based on the long-term carbon balance of arable lands, they concluded that the average carbon loss of the soil is −13 ± 33 g C m−2 year−1, with the average value being 17 g m−2 year−1. Next, the authors obtained values of 8.3 ± 13 g C m−2 year−1 by comparing three process-based ecosystem models. This value shows a decrease in comparison with the previously estimated emissions of 90 ± 50 g C m−2 year−1. Freibauer et al. [5] and Janssens et al. [36] used the CESAR (Carbon Emission and Sequestration by Agricultural land use) model in the examinations they performed between 2008 and 2012 and arrived at the conclusion that the change in the carbon stock of arable lands is −83 g C m−2 year−1, where the mean deviation from the average value is 40 g C m−2 year−1. Similarly, Smith [37] concluded that agricultural sites are CO2 emitters. On the contrary, according to the results of the simulation carried out by Gervois et al. [38] for the period 1901–2001, these areas are actually carbon binders, to the extent of 16 ± 15 g C m−2 year−1.
The wide range of the data described above shows that the carbon balance of arable land is very difficult to determine accurately, despite the rather thorough work carried out. One of the possible reasons for this difficulty is that this value depends on the method of tillage. Birkás [39] demonstrated the impact of tillage on carbon sequestration in the case of rape seed sown after winter wheat. According to the calculations, properly performed cultivation may reduce the carbon loss from the soil by up to 2.8 t ha−1 in the case of straw harvesting. If the straw is not harvested, a further carbon sequestration of 1.2 t ha−1 can be achieved. In this way agriculture is able to reduce CO2 concentrations while increasing the soil’s organic matter content.
Present agricultural GHG reduction projects in Hungary cannot contribute to achieving long-term GHG reduction goals to the same degree as experienced in other sectors due to food market insecurities, production limitations, and the decreasing exchange quotation of GHG emissions. Consequently, climate-friendly agricultural investments have more advantageous returns than in other sectors [40].

1.3. Potential Significance of Algae

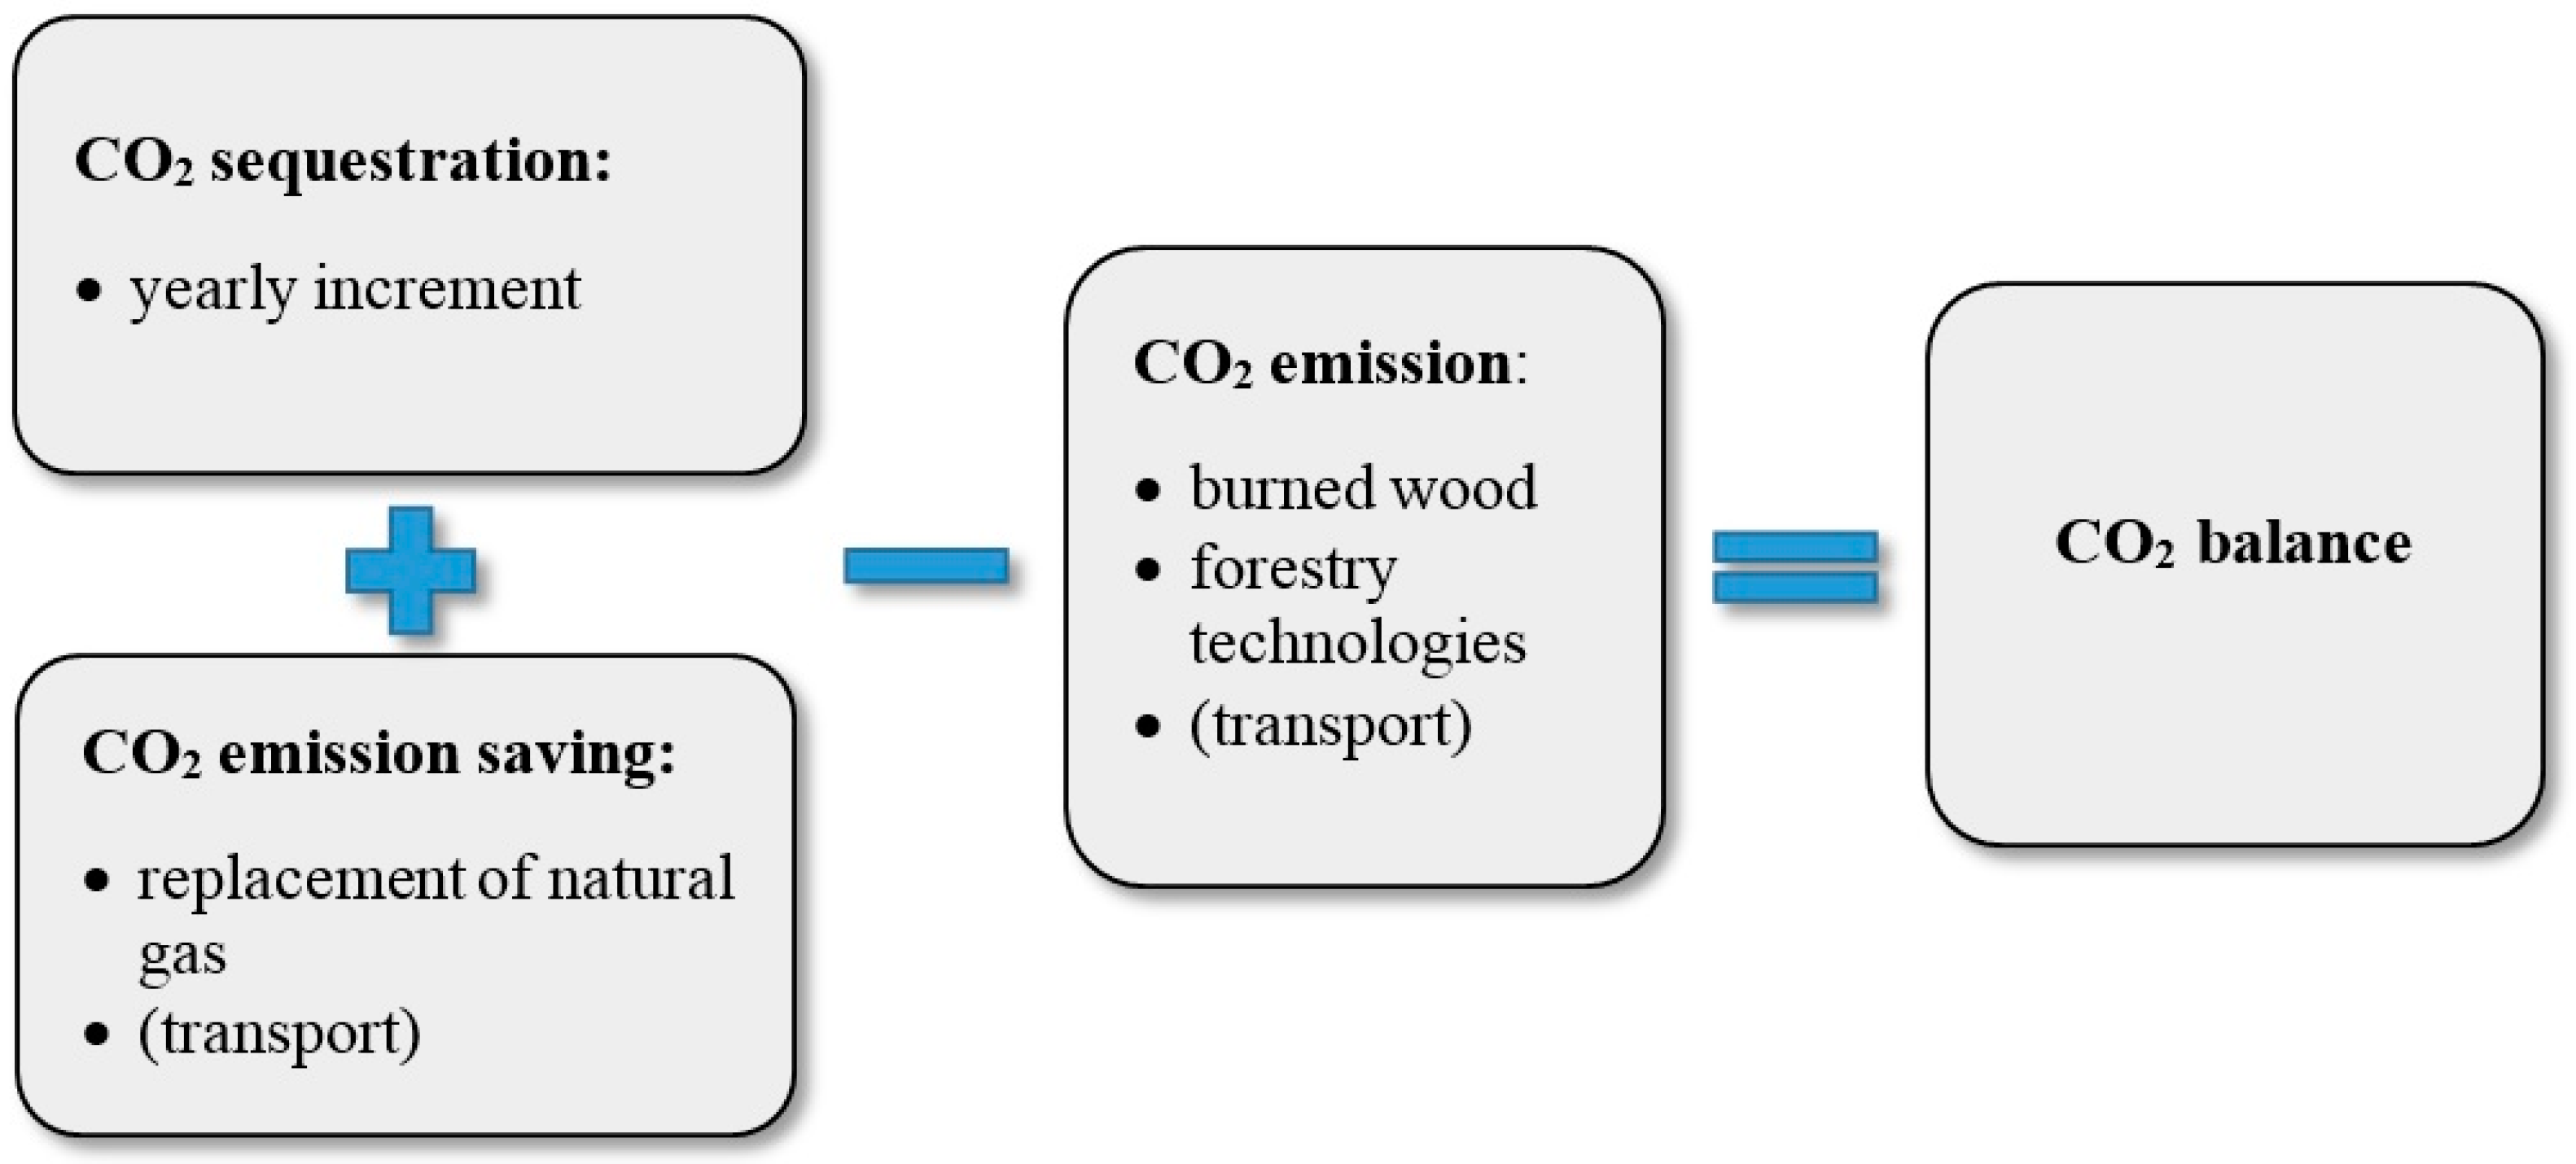
Algae have the highest potential yield in plants with the highest potential for CO2 sequestration per hectare and—in the case of energy use through the avoided emissions from substituted fossil energy sources—also in CO2 emissions reduction. Recently, microalgae have emerged as a source that can play a dual role in the bioremediation of wastewater, as well as the generation of biomass for energy and food production. Growing microalgae on different types of wastewaters has been studied over the past decades. The success of such studies depends on the performance of the selected microalgae strains [41].
Since algae proliferate rather quickly, they can be grown in three-dimensional space and all of their parts can be used, so the amount of biomass to be harvested in one unit of a field (even up to 150–300 t ha−1) is many times that of field crops.
In order to produce this huge yield, algae use a vast amount of CO2, which made it possible to purify the atmosphere millions of years ago; therefore, they may contribute to higher environmental, energy- and food security [42]. The environmental impact of the algae plant can be observed in the purification of wastewater from mineral substances and the reduction of air pollutant emissions by means of CO2 sequestration. Both of these impacts have significant economic implications since purified wastewater can be released into living waters without any risk (in theory, it can also be utilized for irrigation purposes), while the saved CO2 emissions can theoretically be sold at the CO2 stock exchange, especially to buyers who are interested in smaller quantities, mostly for marketing purposes (e.g., hypermarket chains, large companies operating fuel stations, organizers of international programs).
In order to reach outstandingly high yields, it is necessary to provide the ideal conditions needed for photosynthesis and growth (light, temperature, macro- and micronutrients, and carbon dioxide). Of these factors, the lack of CO2 often causes limited yields, but the fundamental condition of a large extent of CO2 sequestration is to make sure that both the proper concentration of CO2 and all other conditions of intensive technology are available. As for light, the minimum light intensity is 3240 lx and at least 180 [43] or 300 [44] hours of effective illumination are needed to reach 500 mg L−1. The optimum temperature is between 20 and 30 degrees Celsius [45]. At the same time, low temperature within the optimum range increases yields and the solubility of CO2 [44].
The CO2 sequestration ability of algae can be used mainly in power plants. The significance of power plants is shown by the fact that they produce more than 37% of Hungarian CO2 emissions. Although emissions are constantly decreasing, they still remain at around 11.6 Mt year−1. However, algae production makes it possible to capture CO2 (and sell the CO2 quota) and, in addition, to utilize power plant waste heat to produce a huge amount of algae biomass [46]. From an environmental protection perspective, algae can be used even more effectively if connected to a biogas plant that performs wastewater purification, since the conventional process of oxidation currently calls for a significant amount of mechanical energy, which can be achieved with solar energy for algae.
Flue gases usually contain 5–30% CO2, a level that is basically in accordance with the concentration tolerated by algae [47]. The other gases present in flue gases (NOx, SOx, and CxHy) can also affect the efficiency of the CO2 sequestration activity of algae. For this reason, occasional purification is necessary before release into algae ponds [48]. At the same time, there are algae species that are also able to capture these gases [49] to a limited extent and under specific environmental conditions, but these are not the same as the most effective CO2 sequestration algae.
Since algal species are diverse in composition, this diversity is reflected in their CO2 sequestration abilities. However, according to our own experiments [16], CO2 fertilization of the examined algae species—with their rather diverse characteristics—resulted in nearly double yield increases independently of algae species, while it increased the protein content and decreased the oil content of algae.
The average composition of algae is described by Richmond [50] as CO2 0.48 H 1.83 N 0.11 P 0.01, while Chowdhury et al. [51] provided the following formulae: C106H263O110N16P. The average composition of the dry matter of the most frequently used Chlorella vulgaris species (which is also used in this experiment) is described by Becker [52]: 50% protein, 15% carbohydrate, 25% lipids, and 10% other materials. Theoretically, the production of one kg of algae dry matter (with 50% carbon content) calls for 1.6–2 kg CO2 [17], while the N need fluctuates between 8 and 16 t ha−1 year−1 in the case of an average composition, which is 55–111 times that of rape [53].
Algae plant technology also significantly affects the amount of CO2 to be captured, as well as the potential algae yields. In the case of raceway ponds, the efficiency of CO2 sequestration is around 10%, while it is around 35% in greenhouse technologies and even reaches 75% in photo-bioreactor (PBR) systems [44]. The amount of CO2 emitted during photorespiration reduces theoretical efficiency by 20–30% [54].
According to Carlsson and Bowles [18], potential algae yields in raceway ponds are 50–60 t ha−1 year−1 in dry material, while Chisti [55], reports 127 t ha−1 year−1. Based on the same authors’ study the potential yields in PBR systems are 150 t ha−1 year−1 and 263 t ha−1 year−1, respectively. Bai et al. [16] achieved a yield of 252–288 t ha−1 in a 14-day-long rotation in small-scale field experiments with the use of Chlorella vulgaris (Beijerinck), under the following optimal circumstances:
  • 3.84 g wet weight/500 mL (C. vulgaris) of inoculums solution
  • 28-day measurement interval (from 9 July to 6 August 2010)
  • 1000 L tanks, 500 L of water, 30 cm water depth
  • Natural illumination (14–15 h/day)
  • Outdoor temperature (17–29 °C daily average temperature, min. 14 °C, max. 35 °C, 28-day average: 24.5 °C)
  • No added manure and carbon dioxide; instead, we used 250, 500, and 1000 mL nutrient solutions with 0.42 mg/L nitrogen, 0.18 mg/L phosphorus, and 0.402 mg/L potassium on the basic case (250 mL)
  • Moderate aeration: 50 L/h and without aeration in each of the nutrient level
In the study by Lam et al. [56], diluted wastewater was used in cultivation. Chlorella vulgaris was able to grow under the following conditions: 0.02–0.2 v/v of domestic wastewater, initial pH of 3–9, and 0.03 v/v initial amount of microalgae seed. Under these conditions, the highest lipid content reached 32.7% during 2–12-day-long cultivation times. During 12 days under pH 3 or 7, 0.02 v/v wastewater concentration (optimum parameters), the biomass yield reached 0.5 g/L.
Chinnasamy et al. [57] obtained a dry weight production of about 50 µg mL−1 during the exponential phase of C. vulgaris grown at 0.036% CO2 and 30 °C, which falls within the values (13–54 µg mL−1) obtained in Chia et al. [58]. The experiments were carried out in 500-mL polycarbonate Erlenmeyer flasks containing 200 mL of culture kept semi-continuously under controlled conditions of light intensity (150 µmol m−2 s−1), light-dark cycle (16:8 h), and temperature (20 + 2 °C).
CO2 concentration has an impact on the efficiency of sequestration. If the concentration of CO2 is less than optimal, it directly decreases potential yields, while a higher than optimal concentration has an indirect yield reduction effect due to the acidification of the algae system. In the case of Chlorella vulgaris, the algae species used in our experiments [16], the optimal CO2 concentration is around 20%, based on the data from 37 developed countries [45,57]. In the case of Nannochloropsis [22,59] and Chlorococcum species [60] much higher values (even up to 40%) were obtained. For the strains Botryococcus braunii SI-30, S. obliquus SJTU-3 and C. pyrenoidosa SJTU-2, which are quite promising for biofuel production, a CO2 concentration of 30–50% can be deemed ideal [61]. Hirata et al. [62] determined the optimal daily CO2 dose of Chlorella vulgaris as 865 mg L−1, while Murakami and Ikenouchi [63] concluded the optimum is 1 g L−1 in the case of the Chlorella sp. UK001 strain.
Theoretically, algae are able to directly capture the CO2 emitted by fossil fuels. Based on the experiments performed by Taştan et al. [64], an algae biomass yield of anything up to 1.3–1.6 g L−1 day−1 can be achieved under an optimal concentration of diesel and algae, which could potentially result in 2.4–3.7 g L−1 CO2 sequestration per day. This could possibly have a huge potential impact if the necessary technical and economic conditions needed for the technology could be established on a large scale and worldwide.
The energetic efficiency and CO2 balance of algae for biodiesel production were examined by Slade and Bauen [44]. The findings clearly show that PBR systems may have a higher energetic efficiency, but they have much higher CO2 emissions than open water algae systems and fossil energy resources. The higher CO2 emission is mainly due to the significant amount of electricity needed, which could theoretically be zero if produced from renewable energy sources. According to Jonker and Faaij [65], prominent elements of the energy consumption ratios of algae production are CO2 supply for raceway ponds and circulation power consumption for horizontal tubular systems.
As regards the purpose of algae production, the calculations of Soratana et al. [66] showed that the impact of utilization for biodiesel production purposes (0.9–1 kg GHG MJ−1) on emissions saving is around twice as much as that of methane production. At the same time, drying may result in significant energy needs and air pollutant emissions, therefore, there could be a significant difference between the CO2 emissions of wet and dry algae-biomass (1–8 kg CO2 equi GJ−1 [67], and 20–50 kg CO2 equi/GJ [68]). At the same time, wet algae with 5–14% dry matter content [69] is suitable for anaerobic fermentation, but is unsuitable for any other use.
Around half of the air pollutant emissions during intensive algae production take place at harvesting [66]; therefore, choosing the most appropriate harvesting method is of great importance. At the same time, dewatering and drying are significant factors in emissions, so great savings can be achieved by using energy-efficient methods and renewable energy. Even though solar drying would be the most obvious solution [66,70], it has a large space need [71] and the oxidation of lipids may deteriorate the quality of the algae [72]. Based on Chowdhury et al. [51], the integration of technology can lead to 3–14 GJ t−1 biodiesel energy (and the related pollutant) savings.
During biodiesel production the common efficiency of oil extraction and esterification (using hexane and methanol) is between 0.55 and 1, and the mean value is 0.9 according to Collet et al. [69], who processed 41 sources. Soratana and Landis [68] prepared a study which examined 20 technological variations and concluded that the emissions from PBR production had an algae dry matter range between 0.02 and 0.09 kg CO2 equi kg−1, considering the utilization of by-products and calculating with 30% oil content Chlorella vulgaris and a specific algae dry matter value of 1.85 kg CO2 kg−1. Together with harvesting, dewatering and drying, emissions of the PBR system range between 0.4 and 1 kg CO2 equi kg−1 algae dry matter, according to Clarens et al. [67]. Gnansounou and Raman [73] characterized the emission of biodiesel production from algae with the following values, with similar technical parameters as the cases described above:
  • biodiesel and protein feed production: 0.22–0.39 CO2 equi kg−1 algae dry matter
  • biodiesel, protein feed and succinic acid production: 0.33–0.46 42 kg CO2 equi kg−1 algae dry matter
When using wastewater feedstock (e.g., biogas plant), the emissions savings resulting from the saved energy used for feedstock during the fertilization of algae (nitrogen: 14 MJ kg−1 N, phosphorus: 24 MJ kg−1 P [74]) is also a part of the lifecycle analysis.
In extensive algae pond systems, the amount of CO2 emitted during algae production is negligible, amounting to only 2% of the emissions during the whole life cycle [75], while its extent is 9% in the case of PBR systems [76]. The electricity needs when injecting CO2 from flue gases into the algae pond is somewhat less, but must definitely be taken into consideration (0.08 MJ kg−1 CO2 [77]). In raceway ponds, one also has to consider the loss of a part of the injected CO2; according to Collet et al. [69], the average amount of this loss is 18%.
With regard to economic implications, it is a significant fact that the harvesting of algae can—ideally—be carried out every two weeks, which represents a constant income and the continuous operation of processing plants with a short term inventory. There are no crop rotation problems and the acquisition of different investments is not necessary either, since the technological processes of algae species intended for economic utilization are the same. At the same time, the process itself is still expensive: estimates from Demirbas and Demirbas [78] show—assuming 30% oil content algae and freely available flue gas—that the prime cost of algoil was 1.8 USD L−1 in open systems and 1.4 USD L−1 in PBR systems in 2010 [78]. For cost comparison, it must be emphasized that the prime cost of biodiesel produced from palm oil, which is the cheapest vegetable oil, was 0.66 USD L−1 in 2010 [78]. According to Norsker et al. [79], the 2010 production costs of algae dry matter were 4.95 € kg−1 in raceway ponds, 4.16 € kg−1 in horizontal tubular PBR systems and 5.96 € kg−1 in flat panel PBR systems for 100 ha production size. As regards investment costs [80], the typical investment range of raceway ponds is 200–300 thousand € ha−1 based on several case studies, while for PBR systems it is 1000–3000 € ha−1, depending primarily on the technology applied and the scale. Other previous calculations [81] show that the 2010 investment costs of greenhouse pond systems were about 500 thousand € for 1 ha and 140 thousand € for 0.21 ha.

2. Materials and Methods

For most renewable energies, CO2 emissions during the life cycle are usually associated with the installation of different equipment (solar panels, solar collectors, and wind turbines), while biomass represents an exception, as the production of the energy resource generates a perceptible amount of emissions, which, depending on the crop species, variety and the intensity of production, ranges over a rather wide spectrum [82]. We examined the impact of forests on current CO2 emissions and focused on future prospects for algae. Our calculations were based on data from the literature and from our own previous experimental work, in the case of forests and algae, respectively.

2.1. Methodology of Forest-Related Calculations

Emissions resulting from forestry activities can be linked to three main factors: technology, direct and indirect transport of wood, and the proportion of firewood serving the energy supply [83]. As regards the latter factors, the type of fossil energy replaced and the transport parameters (distance, method) greatly affect CO2 emissions (Figure 1). In our calculations we took natural gas as the replaced energy source as it plays a major role in heat energy supply in Hungary, and typically this fossil energy source has been substituted by wood. However, we did not include transport emissions for wood and natural gas in our calculations, since determining this item at the national level is biased by a great deal of inaccuracy due to the various different transport methods and distances involved. Furthermore, we assumed that the transport emissions of wood and natural gas are approximately the same. The conceptual figure of the forests’ CO2-balance—based on the methodology of Musselman and Fox [84] and Chen et al. [85]—is presented in Figure 1.
In our calculations we also considered the amount of logging residue that results from forestry activities (15%). Due to the lack of any official information regarding the further use of logging residue, we assume that the stored CO2 is emitted back into the atmosphere while it rots, during which time it participates in the nutrient replenishment of the forest’s soil [86]. Additionally, due to changes in the criminal code in Hungary (the illegal gathering of logging residues is strictly prohibited and punished), the public use of logging residue for heating purposes has practically disappeared.
The CO2 sequestration ability of dendromass mainly depends on the technology (intensive or extensive), the tree species, and the climatic, soil, and other conditions, as well as the forest coverage. The basis of the CO2 amount per hectare is the average yearly amount of any increment in volume of Hungarian forests (7 m3 ha−1 year−1). The average annual increment per hectare is determined based on the statistics and records of special Hungarian forest authorities (detailed in Table 1), which include regions with different climatic and soil conditions. Some of this volume is used by the energy and wood industry, while the other parts (roots and residues) remain in the forest. The wood utilized for industrial purposes stores the captured CO2 for a longer period, while it is emitted back into the atmosphere during the burning of firewood. Simultaneously, by utilizing firewood for energy production, fossil fuels and their CO2 emissions can be saved.
The yearly CO2 sequestration and emissions from forests were determined on the basis of the factors and data shown in Table 1.
As the first element of calculating emissions, we performed calculations based on the forestry technologies of the wood species representing 80% of timber extraction, i.e., hardwood species (more specifically oak and acacia) and poplar, in order to determine the amount of CO2 emitted into the atmosphere per hectare during the life cycle of the wood as a result of the fuel need that arises during each work operation. In accordance with the proportion of the abovementioned wood species, we determined the weighted average to calculate the CO2 emissions of forestry technologies for one hectare in order to obtain the average emissions at the national level.
Due to the lack of relevant technical literature, we used personal communications with several forestry engineers and professionals with significant experience and scientific degrees to determine the technologies, work operations, and characteristics of each wood species. These data are technically reliable and necessary for the new results, besides being appropriate. In accordance with the characteristics of the given wood species, the technological elements used in practice differ in several details. The following special elements must be mentioned:
  • suckering of acacia
  • stump planning of poplar
  • nursing and thinning operations
The number of light disking operations within a year was determined as five for acacia, which tolerates weed competition better, and 10 for poplar and oak (and hardwood species). The fuel need and CO2 emissions of end use for one hectare was determined in accordance with the national average increment (7 m3 ha−1 year−1) [3], based on the fuel need per cubic meter mentioned by experts as the observed value.
In addition, during the forestry activity, plantation renewal is performed by planting seedlings (in most cases). In our calculations—since the average transport distance is not known—we did not consider the fuel need of this operation, but its CO2 emissions could increase the air pollutant emissions balance of forestry. According to professionals dealing with seedling production, the amount of CO2 emitted into the atmosphere during seedling production prior to forest renewal and plantation is almost identical to the CO2 emissions during silo maize production, as the necessary work operations are mostly the same. The following basic data were used to calculate the emissions of seedling production:
  • fertilizer use: 400 kg NPK ha−1, of which specific use: 0.85 kg CO2 kg−1 NPK [94]
  • emissions from diesel use: 269 kg CO2 ha−1 [95]
  • forest to be planted from a hectare seedling plantation: acacia: 30 ha (every 4 rotations), oak: 30 ha, poplar: 70 ha
  • rooting ratio: 80% (expert data, 2016)
  • proportion of seedling plantation of all plants: 93% [88]
The processes and tool requirements of the three general technological series of operations differ from each other due to the technological peculiarities of production (Table 2).
The stumping operation following the end use was not calculated since it is only used in an insignificant part of the forested area. Typically, CO2 transport and storage, as well as the construction of the power plants have only a minor impact on the overall effects [96] and therefore were not calculated.

2.2. Methodology of Algae-Related Calculations

While other crop species can generally be used for food, animal feed and a fertilizer source, as well as energy production (usually a single type of energy), the use of algae is much more diverse, which greatly affects the duration of CO2 capture and the saving of air pollutant emissions. At the same time, algae have a favorable impact on the air pollutant content, in addition to direct CO2 sequestration. If waste heat is used for algae production (i.e., from near power plants) natural gas can be saved, while if it is used for energy production the amount of CO2 emitted by the replaced fossil energy source is saved.
Considering the fact that the area needed for algae production is quite large, in our theoretical potential calculations we decided not to examine the alternative of using PBR technology. Instead, our calculations were based on greenhouse pools and raceway ponds. In our calculations we used the algae species Chlorella vulgaris and Scenedesmus dimorphus, which have been used in our previous experiments. In addition, we took the produced algoil and the amount of CO2 captured by these species in our previous experiments into consideration [16]. For the former algae species we analyzed both previously mentioned technological alternatives, while for the latter we only examined the impacts of the greenhouse alternative, since the production of this species is not recommended in raceway ponds.
Since there is no reliable database on the amount of wastewater disposed by Hungarian biogas plants, we did not allow for the emissions reduction from wastewater purification (fertilizer saving) in our calculations, but only the algae’s utilization of the flue gases emitted by power plants and the savings of emissions by diesel which can be replaced by algoil. We identified two potential values: (a) CO2 savings to be achieved by algae production and (b) savings to be achieved by replacing diesel during the process of biodiesel production. In the case of both alternatives, we also considered technological losses in addition to CO2 savings, as well as the amount of CO2 emitted as a result of using the technology.
Of the total amount of flue gas emitted by the power plants, we allowed 35% as the amount to be captured by algae in a greenhouse and 10% in raceway ponds, while deducting 25% of the CO2 used during the photorespiration of algae and 18% of the loss resulting from the raceway pond technology, as well as the CO2 emissions of harvesting and drying (1.67 kg CO2 equi t−1 algae), in line with the findings [44,54,68,69]. The amount of algae expected per year in greenhouse production was calculated from our previous experimental data, while that of raceway pond production was calculated partially based on technical literature basic data:
  • greenhouse production [16]
  • Chlorella vulgaris: 54.6 t ha−1 year−1 captured CO2, 248 t ha−1 year−1 average yield, 28% oil content
  • Scenedesmus dimorphus: 32.4 t ha−1 year−1 captured CO2, 241 t ha−1 year−1 average yield, 51% oil content
  • raceway pond production
  • Chlorella vulgaris: 865 mg L−1 day−1 captured CO2 [62], 2 t CO2 t−1 algae [17], 30 cm water depth, 200-day-long vegetation period and 14-day rotation period [16]
During the calculation of the amount of CO2 emitted during the production technology, we also considered the electricity need of injecting CO2 (0.08 MJ kg−1 CO2) [77]. Taking into consideration the average CO2 emissions of Hungarian electricity (678 kg CO2 equi kWh−1) [93], this value is 0.15 t t−1 CO2.
In our calculations, the emissions of biodiesel production was considered to be 0.26 kg CO2 kg−1 algae dry matter, which is in accordance with that used by Gnansounou and Raman [73]. The following basic data were taken into consideration for economic calculations:
  • Stock exchange price of CO2: 8.4 € t−1 [97]
  • Price of biodiesel: 1.18 € L−1 [98]
  • Ratio of heating value of fossil diesel and biodiesel: 1.1 [98]
  • Density of algoil: 0.885 kg/L [98]
  • Investment demand: greenhouse: 500 thousand € ha−1 [16], raceway pond: 250 thousand € ha−1 [80]

3. Results

3.1. The Impact of Forests on CO2 Emissions in Hungary

According to our calculations, the amount of non-extracted increment was 5.7 million m3 wood in Hungary in 2014, which included 5.6 million tons of CO2 altogether. The volume of yearly gross timber extraction was 7.8 million m3, of which the net timber extraction (logging residue excluded) was 6.7 million m3 (Figure 2). However, only 47% of this volume captures CO2 in the long run [3] in the form of furniture and other industrial products. The volume of industrial wood production amounted to 3.2 million m3 in 2014 [3], with the absorption of 3.1 million tons of CO2, according to our calculations.
Based on our calculations, 3.5 million m3 wood was used as firewood [3] in 2014, capturing 3.4 million tons of CO2. Taking the heating value of natural gas and wood into consideration, this volume represents 913 million m3 natural gas saving at current market prices. With burning, around 1.792 million tons of CO2 would be emitted into the atmosphere.
As mentioned in the Materials and Methods, our calculations considered the production technologies and physiological characteristics of the main wood species of Hungarian forests (poplar, acacia, and other hardwood species). As a result of our calculations the following CO2 emission values were obtained for each wood species (Table 3):
Acacia has the lowest CO2 emissions (63 kg CO2 ha−1 year−1), considering the production technology and maturity of wood species, while this value is twice as high for other hardwood species and nearly four times as high for poplar (Table 3).
The differences between the data described above are based on the different maturity ages and production technologies of wood species, as their density and carbon content show slight differences. During the calculation of air pollutant emissions during fuel use, we considered the technological peculiarities of wood species from plantation to harvesting. The hectare-based yearly CO2 emissions values of the three wood species with the highest proportion in Hungarian forests were obtained from the weighted average of these species.
Consequently, by considering the composition, extraction, and utilization methods of the wood population, as well as the usual production technologies, the CO2 sequestration during the life cycle and the related natural gas savings in Hungary (7.21 t CO2 ha−1 year−1 altogether) are typically 3.78 times higher than the emissions (1.90 t CO2 ha−1 year−1) that result from the production technology and the burning process (Table 4). The production technology from the whole amount of emission represents negligible proportion (6%), so its ratio of CO2 output/input coefficiency (ignoring the CO2 amount sequestrated and emitted by wood) itself can even reach 44.5.
According to our calculations, the whole forested area in Hungary of 1.938 million ha [87] emits around 230 thousand tons of CO2, which accounts for around 10% of the CO2 emissions of agriculture, forestry, and fisheries combined. At the same time, CO2 emitted as a result of burning is much more significant, although it includes the emissions of the energy industry.
The equations applied in the calculations in Table 4:
  • Columns 1–3 (in one hectare (t CO2))
  • Positive impact (+):
Line 1. Wood growing:
  • Amount of yearly increment in Hungary (tons hectare−1 year−1) = National statistical data
  • Extra increment (tons hectare−1 year−1) = Amount of yearly increment minus Amount of yearly harvested timber
  • CO2 captured by Extra increment (tons hectare−1 year−1) = Amount of Extra increment for Hungary multiplied by the Average CO2 sequestration ability of wood
  • CO2 captured by Industrial wood (tons hectare−1 year−1) = Amount of Industrial wood per hectare multiplied by the Average CO2 sequestration ability of wood
  • CO2 captured by Firewood (tons hectare−1 year−1) = Amount of Firewood multiplied by the Average CO2 sequestration ability of wood
Line 2. Natural gas replacement:
  • Natural gas replacement of Firewood (tons hectare−1 year−1) = Amount of firewood multiplied by the Average density of wood multiplied by the Heating value of wood multiplied by the Share of heating value of natural gas and wood divided by the Heating value of natural gas multiplied by the Multiplier (kg CO2 m−3 natural gas burning multiplier) divided by 1000
  • Total (captured and saved CO2) = Extra increment (Line 1. Wood growing) + Industrial wood (Line 1. Wood growing) + Firewood (Line 1. Wood growing) + Firewood (Line 2. Natural gas replacement)
Negative impact (–):
  • Production technology (tons hectare−1 year−1) = weighted average of tree species’ CO2 emissions, based on Table 4.
  • CO2 emission of firewood Burning (tons hectare−1 year−1) = Amount of harvested Firewood multiplied by the CO2-content of wood
  • Total (technology + burning) = Production technology + Burning
  • Balance
  • Balance of forestry = Total (captured and saved CO2) minus Total (technology + burning)
The values of Columns 4–6 (referring to the national area) are equal to the forestry area of Hungary multiplied by the related data for one hectare in Columns 1–3.
The main factor in CO2 sequestration from forestry is the wood that is not extracted from forests, leading to increased environmental protection at the same level as forests. In the case of trees in conservation areas, the CO2 balance would be higher (6.17 CO2 ha−1 year−1) since the sequestration from growing wood significantly exceeds avoiding natural gas replacement, so these areas can be regarded as the best option against CO2 emissions. Wood for industry significantly—even over decades—delays the emission of the sequestrated CO2, especially if used as a building material. Forests grown for energy use are less effective for air quality because the amount of CO2 emitted into the atmosphere during burning is higher (111 kg CO2 GJ−1) than when burning natural gas (52 kg CO2 GJ−1). However, when the whole life cycle is analyzed, it is noticeable that wood burning is more favorable for the environment. These parameters represent the Hungarian average, which should be higher than the European average and must be much more favorable in the case of acacia forests in conservation areas.

3.2. The Impact of Algae on CO2 Emissions in Hungary

As for the potential CO2 savings to be attained with algae, the method used in our analysis partially differs from the method proposed by Collet et al. [69], which is based on 41 different algae life cycle assessments (LCA). The reason for this difference is the nature of our potential calculation as our goal is to demonstrate the emissions reduction that can theoretically be achieved with algae ponds at heat power plants in Hungary. However, the use of algae is so varied that the analysis of life cycle following dewatering would go beyond the framework of this study. The quantified impacts and basic parameters of the algae-based fixation of CO2 emitted by the Hungarian power plant network are summarized in Table 5, in accordance with our previously described model.
The equations applied in the calculations for Table 5:
  • CO2 emissions = National statistical data on emissions from power plants
  • CO2 fixation by algae = CO2 emissions multiplied by Captured CO2 from flue gas multiplied by Loss in photorespiration
  • CO2 emissions in production = (CO2-fixation by algae multiplied by the average CO2 emissions of Hungarian electricity) plus (CO2 emissions of harvesting and drying multiplied by the Necessary amount of algae)
  • Value of saved CO2 = (CO2-fixation by algae minus CO2 emissions in production) multiplied by the Stock exchange price of CO2
  • Necessary amount of algae = CO2-fixation by algae divided by (Captured CO2 multiplied by Average yield)
  • Necessary amount of ponds = Necessary amount of algae divided by Average yield
  • Necessary investment = Necessary number of ponds multiplied by Investment cost per unit
  • Extractable oil = Necessary amount of algae multiplied by Oil content per unit
  • Biodiesel to be produced = Extractable oil multiplied by Oil density
  • Replaced CO2 in biodiesel production = Biodiesel to be produced multiplied by The emissions from biodiesel production divided by the Ratio of the heating value of normal diesel and biodiesel
  • Emitted CO2 in biodiesel production = Replaced CO2 in biodiesel production multiplied by Emissions from biodiesel production
  • Value of saved CO2 of algoil = (Replaced CO2 in biodiesel production minus Emitted CO2 in biodiesel production) multiplied by the Stock exchange price of CO2
  • Value of algoil = Biodiesel to be produced multiplied by Biodiesel price
The values of the factors of these equations are detailed in this chapter and are differentiated in the cases of both types of algoil and the intensity of technology.
Table 5 shows that if Hungarian power plants were to dispose of all emitted CO2 in algae ponds, they would make not only an indirect but also a direct step towards better air purity by producing many times the Hungarian diesel consumption with the examined algae species under more intensive circumstances, in addition to capturing 22–23% of the emissions of power plants. The direct CO2 stock exchange value of this amount would be 21–22 million € per year even at the currently low carbon quota market prices. This value can be further increased by adding the expenses of diesel imports and GHG emissions of the saved amount of diesel, as well as the use of algae biomass byproducts as animal feed. However, in the case of semi-intensive technologies, the significant proportion of the money value of CO2 sequestration would not result from the disposal of flue gases, but from the reduced expenses arising from the value of the CO2 emissions of the saved diesel (59–217 billion €/year). At the same time, the investment cost of this technology would exceed the total yearly Hungarian GDP. Although extensive technologies are much cheaper, they are able to capture only a small portion (around 6%) of power plant flue gases and their biodiesel yield is also much lower, so their operation has a high risk. Additionally, they can operate this way only for a certain period of the year. All these factors show that algae can only serve as a partial solution for treating flue gases, both at large-scale power plants and at the national level. If the primary objective is CO2 sequestration, Chlorella vulgaris is the species to choose, while if the main focus is to produce as much algoil as possible, the ideal choice from all algae species examined is Scenedesmus dimorphus. In the latter case, the CO2 equivalent savings would increase to up to 70% of Hungary’s national emissions, the predominant share of this originating from the saved diesel oil emissions.

4. Discussion

Hungary’s forests significantly contribute to the reduction of CO2 emissions, as they save 19% of the total emissions in Hungary, while the proportion of forested areas in the country accounts for just 21% of the total area. If the proportion of forested areas reached the EU average, they could save nearly 40% of the current total emissions without any change in the structure of utilization, which is much more favorable than the figure for the EU (9% [21]). The current proportion of forests could be increased by means of the forestation of agricultural land (mainly with acacia), and an increase in the proportion of forests in conservation areas could lead to a reduction in total CO2 emissions.
The most significant effect on the CO2 balance in Hungary is mainly based on the fact that the average annual increase in Hungarian forests (7 m3/ha/year) exceeds the EU average (4.7 m3/ha/year, [99]). The CO2 sequestration ability of forests (on average 5.3 t ha−1 year−1) can be considered very favorable in Hungary since the geographical conditions (water management, soil conditions, little unforeseen damage) are more favorable and a more significant part of the forest area is planted with fast-growing species (acacia and poplar) compared to the EU. Acacia and poplar play a significant role in the Hungarian forest area. Based on the study of Nabuurs and Schelhaas [100], poplar and acacia species have a high mean annual increase (10 and 9 m3 ha−1 per year), while acacia has one of the largest basic wood densities (0.63 t m−3), so it is assumed that these tree species have a higher carbon sequestration ability compared with the average. These facts and the favorable site conditions result in a high CO2 sequestration potential in Hungary in comparison with the EU average. According to Nabuurs and Schelhaas [100], the largest carbon sequestration potential was found for the Atlantic sites and the Central European/central mountain sites. The slower-growing tree species prefer the climate of rural/countryside areas, which have a more significant role in the EU.
The effectiveness of forests in CO2 sequestration (the abovementioned 5.3 t ha−1 year−1) can be evaluated as clearly positive compared to conventional arable plants, since this figure exceeds not only the statements of Ciais et al. [35] and Smith [37], namely that agricultural sites are CO2 emitters, but the number (16 ± 15 g C m−2 year−1) provided by Gervois et al. [38]. Taking into consideration the fact that this latter study evaluated a century-long period, when extensive agricultural technology was dominant, it can be concluded that conventional forests (especially those in conservation areas) have a much more favorable effect on the CO2 balance than agricultural plants produced on arable land in the EU. They also have an extremely positive effect on CO2 emissions compared to short rotation coppices [23], since the importance of the less intensive technology far exceeds the effect of smaller yields.
Our results regarding the CO2 emissions of wood species show that the difference between wood species and production technologies plays an important role (nearly four times more) in CO2 emissions, as was established by Thomas and Martin [89].
With our calculations, our main problem was the lack of detailed and typical forest technologies available in scientific papers, so we required the use of expert opinions in some cases. We would like to fill this gap in our article and clarify the most important technical details in forestry and algae in our future research activities.
Regarding algae, the results of our previous test exceed the experimental results of Lam et al. [56] and Chinnasamy et al. [57]. The explanation for this could be: (1) the larger system we used has a better adaptability and a capability to neutralize temperature fluctuations and other harmful effects, and (2) nutrition supply has a significant yield-increasing effect up to the optimum point. As a result, the annual average yield in our measurements surpassed not only the best results of our liquid manure tests, but also the results of our previous nutrient solution laboratory experiments at the same water depth.

5. Conclusions

Algae and forests have great potential in the reduction of CO2 emissions. The enumeration is neither simple nor obvious because of the differential production technology, the possible ways of utilization, and (for forests) the conservation areas and (for algae) the neighborhood of power plants.
In Hungary the high efficiency of the CO2 sequestration of forests (45:1) justifies the further extension of forested areas (more specifically acacia) with a higher share of forests for nature conservation and the development of environmental considerations in the wood processing industry. However, this is not the primary consideration in Hungarian policy. Besides, an aggressive forest expansion policy could threaten food security due to land competition between forest and agriculture.
The forests in Hungary contribute to the reduction of CO2 emissions, as they save 19% of the total emissions in Hungary, while the proportion of forested areas in the country accounts for just 21%. If the share of forested areas reached the EU average, they could save nearly 40% of the current total emissions without any change in the structure of utilization.
The changes in the economic and environmental efficiency of forests lead in opposite directions. In itself, burning wood results in higher CO2 emissions (111 kg GJ−1) than burning natural gas (52 kg GJ−1). However, when examining the whole life cycle, wood burning can still be considered a much more favorable option not only environmentally but in terms of rural development, employment, and import reduction. Our calculations showed that the differences between forestry wood species result in fourfold differences in their CO2 emissions. Although the use of short rotation coppices as feedstock for energy production may be profitable, in terms of CO2 emissions it provides a less effective solution than conventional forests.
Unlike studies published so far, this paper focuses not only on the potential significance of the CO2 savings to be achieved with algae but also discusses the economic barriers that are expected to make it possible to achieve only a slight market penetration in the near future, given the economic environment in Hungary.
The CO2 sequestration ability of algae can mostly be utilized in conjunction with power plants. In the case of semi-intensive technologies, a significant proportion of the CO2 emissions of the algae species examined by the authors would not result from the disposal of flue gases but from the reduced amount of CO2 linked to the diesel saved. However, an extension of this technology on the national market cannot be financed in the near future. Although extensive technologies are much cheaper, they are able to capture only a small portion (around 6%) of power plant flue gases, their biodiesel yield is also much lower, and their operation poses a high risk compared to intensive technologies. All these factors show that algae can only be a partial solution to treating flue gases both at large-scale power plants and at the national level. The best solution could be algae production integrated with biogas power plants due to the fact that the scale is smaller and algae can play a major role in addition to CO2 disposal in heat utilization and wastewater purification.
If the primary objective is CO2 sequestration, Chlorella vulgaris is the species to choose, while if the main focus is to produce as much algoil as possible, the ideal choice from all the algae species examined is Scenedesmus dimorphus.
Based on our calculations, it can be concluded that forests currently represent the most significant source of CO2 savings in Hungary. Crops are indispensable from a market perspective, but their contribution to CO2 sequestration is much lower. In the future, algae could represent the most significant reserve for CO2 sequestration both for the environment and for food and energy production; however, their production is not currently competitive due to the high investment costs.
The characteristics of different CO2 sequestration methods will determine mitigation policies even more in the future. Since this problem occurs primarily at the global level, it has been regulated typically in the form of global or regional legislative instruments, although there have also been successful case studies at the local level (e.g., Sustainable Energy Action Plan by European municipalities).

Acknowledgments

This study and our research work were supported by the University of Debrecen, Faculty of Economics and Business Research Fund (in Hungarian: GTK Kutatási Alap).

Author Contributions

Attila Bai executed the algal overview and calculations, and finalized the manuscript. József Popp revised and finalized the manuscript, and double checked calculations. Károly Pető revised the manuscript. Irén Szőke executed the chapter about crop production. Mónika Harangi-Rákos participated in data collection and formatted the manuscript. Zoltán Gabnai executed the majority of the overview and the calculations regarding forests and SRC.

Conflicts of Interest

The authors declare no conflicts of interest. The founding sponsors had no role in the design of the study; in the collection, analyses, or interpretation of data; in the writing of the manuscript, and in the decision to publish the results.

Abbreviations

The following abbreviations are used in this manuscript:
GHGgreenhouse gas
NPPnet primary production
SOCsoil organic carbon
LCAlife cycle assessment
PBRphoto-bioreactor
UNFCCCUnited Nations Framework Convention on Climate Change

Appendix A

Table A1. Complex energy output and return indexes of woody plantations.
Outstanding AreasUnfavorable Areas
AcaciaPoplarWillowAcaciaPoplarWillow
Intensive
Energy input (GJ)451473472436442441
Energy output (GJ) 306445954745102113991371
Energy Output/Input ratio6.89.710.12.33.23.1
Extensive
Energy input (GJ) 118129128110113112
Energy output (GJ)153222982373511699685
Energy Output/Input ratio13.017.818.54.76.26.1
Source: [33] Legend: GJ = 109 J.

References and Notes

  1. Fuhrer, J.; Beniston, M.; Fischlin, A.; Frei, C.; Goyette, S.; Jasper, K.; Pfister, C. Climate risks and their impact on agriculture and forests in Switzerland. In Climate Variability, Predictability and Climate Risks; Springer: Berlin, Germany, 2006; pp. 79–102. [Google Scholar]
  2. UNEP. The Emissions Gap Report 2014. Available online: http://www.unep.org/publications/ebooks/emissionsgapreport2014/portals/50268/pdf/EGR2014_LOWRES.pdf (accessed on 12 May 2017).
  3. Tobisch, T.; Kottek, P. Forestry-Related Databases of the Hungarian Forestry Directorate. Available online: https://www.nebih.gov.hu/en//data/cms/160/854/Forestry_related_databases_2012.pdf (accessed on 12 May 2017).
  4. Kurkalova, L.A. Carbon sequestration in agricultural soils: Discounting for uncertainty. Can. J. Agric. Econ./Rev. Can. D'agroecon. 2005, 53, 375–384. [Google Scholar] [CrossRef]
  5. Freibauer, A.; Rounsevell, M.D.; Smith, P.; Verhagen, J. Carbon sequestration in the agricultural soils of Europe. Geoderma 2004, 122, 1–23. [Google Scholar] [CrossRef]
  6. Cox, P.M.; Betts, R.A.; Jones, C.D.; Spall, S.A.; Totterdell, I.J. Acceleration of global warming due to carbon-cycle feedbacks in a coupled climate model. Nature 2000, 408, 184–187. [Google Scholar] [CrossRef] [PubMed]
  7. Friedlingstein, P.; Bopp, L.; Ciais, P.; Dufresne, J.L.; Fairhead, L.; LeTreut, H.; Monfray, P.; Orr, J. Positive feedback between future climate change and the carbon cycle. Geophys. Res. Lett. 2001, 28, 1543–1546. [Google Scholar] [CrossRef]
  8. Knutti, R.; Hegerl, G.C. The equilibrium sensitivity of the Earth’s temperature to radiation changes. Nat. Geosci. 2008, 1, 735–743. [Google Scholar] [CrossRef]
  9. Florides, G.A.; Christodoulides, P. Global warming and carbon dioxide through sciences. Environ. Int. 2009, 35, 390–401. [Google Scholar] [CrossRef] [PubMed]
  10. Benemann, J.R. CO2 mitigation with microalgae systems. Energy Convers. Manag. 1997, 38, 475–479. [Google Scholar] [CrossRef]
  11. Breunig, H.M.; Birkholzer, J.T.; Borgia, A.; Oldenburg, C.M.; Price, P.N.; McKone, T.E. Regional evaluation of brine management for geologic carbon sequestration. Int. J. Greenh. Gas Control. 2013, 14, 39–48. [Google Scholar] [CrossRef]
  12. Chen, W.; Geng, W. Fossil energy saving and CO2 emissions reduction performance, and dynamic change in performance considering renewable energy input. Energy 2017, 120, 283–292. [Google Scholar] [CrossRef]
  13. EUROSTAT. Energy from Renewable Sources. Available online: http://ec.europa.eu/eurostat/statistics-explained/index.php/Energy_from_renewable_sources#Main_tables (accessed on 12 May 2017).
  14. Ťupek, B.; Zanchi, G.; Verkerk, P.J.; Churkina, G.; Viovy, N.; Hughes, J.K.; Lindner, M. A comparison of alternative modelling approaches to evaluate the European forest carbon fluxes. For. Ecol. Manag. 2010, 260, 241–251. [Google Scholar] [CrossRef]
  15. Führer, E.; Molnár, S. The amount of carbon stored in the live matter in Hungarian forests. Wood Ind. 2003, 51, 16–19. (In Hungarian) [Google Scholar]
  16. Bai, A.; Stündl, L.; Bársony, P.; Fehér, M.; Jobbágy, P.; Herpergel, Z.; Vaszkó, G. Algae production on pig sludge. Agron. Sustain. Dev. 2012, 32, 611–618. [Google Scholar] [CrossRef]
  17. Khan, F.A.; Ansari, A.A. Eutrophication: an ecological vision. Bot. Rev. 2005, 71, 449–482. [Google Scholar] [CrossRef]
  18. Carlsson, A.S.; Bowles, D.J. Micro-and Macro-Algae: Utility for Industrial Applications: Outputs from the EPOBIO Project; CPL Press: Thatcham, UK, 2007. [Google Scholar]
  19. European Environment Agency. Eight Facts about Europe’s Forest Ecosystems. Available online: http://www.eea.europa.eu/highlights/eight-facts-about-europe2019s-forest-ecosystems (accessed on 12 May 2017).
  20. FAO. State of Europe’s Forests 2011. Status and Trends in Sustainable Forest Management in Europe. Available online: http://www.unece.org/fileadmin/DAM/publications/timber/Forest_Europe_report_2011_web.pdf (accessed on 12 May 2017).
  21. San-Miguel-Ayanz, J.S.; Rigo, D.D.; Caudullo, G.; Houston Durrant, T.; Mauri, A. European Atlas of Forest Tree Species; European Commission, Joint Research Centre: Brussels, Belgium, 2016. [Google Scholar]
  22. Hungarian Central Statistical Office. Emissions of Air Pollutants and Greenhouse Gases. Available online: https://www.ksh.hu/docs/eng/xstadat/xstadat_annual/i_ua002d.html (accessed on 12 May 2017).
  23. Sheeran, K.A. Forest conservation in the Philippines: A cost-effective approach to mitigating climate change? Ecol. Econ. 2006, 58, 338–349. [Google Scholar] [CrossRef]
  24. Richards, K.R.; Stokes, C. A review of forest carbon sequestration cost studies: A dozen years of research. Clim. Chang. 2004, 63, 1–48. [Google Scholar] [CrossRef]
  25. Pearson, T.R.H.; Brown, S.; Sohngen, B.; Henman, J.; Ohrel, S. Transaction costs for carbon sequestration projects in the tropical forest sector. Mitig. Adapt. Strateg. Glob. Chang. 2014, 19, 1209–1222. [Google Scholar] [CrossRef]
  26. Dixon, R.K.; Smith, J.; Guill, S. Life on the edge: vulnerability and adaptation of African ecosystems to global climate change. Mitig. Adapt. Strateg. Glob. Chang. 2003, 8, 93–113. [Google Scholar] [CrossRef]
  27. Dombi, M.; Kuti, I.; Balogh, P. Sustainability assessment of renewable power and heat generation technologies. Energy Policy 2014, 67, 264–271. [Google Scholar] [CrossRef]
  28. Dombi, M.; Kuti, I.; Balogh, P. Aspects of the sustainable utilization of renewable energy sources. APSTRACT Appl. Stud. Agribus. Commer. 2012, 6, 91–94. [Google Scholar] [CrossRef]
  29. EUROSTAT. Forestry Statistics. Available online: http://ec.europa.eu/eurostat/statistics-explained/index.php/Forestry_statistics (accessed on 12 May 2017).
  30. Führer, E.; Csiha, I.; Szabados, I.; Pödör, Z.; Jagodics, A. Aboveground and belowground dendromass in a stand of turkey oak. For. Sci. Publ. 2014, 4, 109–119. [Google Scholar]
  31. Henderson, R.P. How Does the CO2 Output of Campfires Compare to Letting Wood Rot. Available online: http://www.Nature.Org/science-in-action/science-features/ask-the-conservationist-september-2010.Xml (accessed on 12 May 2017).
  32. Mitchell, C.; Bridgwater, A.; Stevens, D.; Toft, A.J.; Watters, M. Technoeconomic assessment of biomass to energy. Biomass Bioenergy 1995, 9, 205–226. [Google Scholar] [CrossRef]
  33. Kohlheb, N.; Gergely, S.; Laki, G.; Podmaniczky, L.; Skutai, J.; Szakál, F. Proposals for the Development of Agricultural Support System Enabling the Faster Spreading of Renewable Energy Sources. Final Report. Gödöllő, Hungary, 2004; Project ID: K-36-02-00114H. [Google Scholar]
  34. Zilberman, D.; Liu, X.; Roland-Holst, D.; Sunding, D. The economics of climate change in agriculture. Mitig. Adapt. Strateg. Glob. Chang. 2004, 9, 365–382. [Google Scholar] [CrossRef]
  35. Ciais, P.; Wattenbach, M.; Vuichard, N.; Smith, P.; Piao, S.; Don, A.; Luyssaert, S.; Janssens, I.; Bondeau, A.; Dechow, R. The European carbon balance. Part 2: Croplands. Glob. Chang. Biol. 2010, 16, 1409–1428. [Google Scholar] [CrossRef]
  36. Janssens, I.; Freibauer, A.; Schlamadinger, B.; Ceulemans, R.; Ciais, P.; Dolman, A.; Heimann, M.; Nabuurs, G.-J.; Smith, P.; Valentini, R. The carbon budget of terrestrial ecosystems at country-scale—A European case study. Biogeosciences 2005, 2, 15–26. [Google Scholar] [CrossRef]
  37. Smith, P. Carbon sequestration in croplands: The potential in Europe and the global context. Eur. J. Agron. 2004, 20, 229–236. [Google Scholar] [CrossRef]
  38. Gervois, S.; Ciais, P.; de Noblet-Ducoudré, N.; Brisson, N.; Vuichard, N.; Viovy, N. Carbon and water balance of European croplands throughout the 20th century. Glob. Biogeochem. Cycles 2008, 22, 1–13. [Google Scholar] [CrossRef]
  39. Birkás, M. The compulsion of classical soil cultivation methods and reduction of climate damage. Plant Prot. 2009, 58, 123–134. (In Hungarian) [Google Scholar]
  40. Fogarassy, C.; Nabradi, A. Proposals for low-carbon agriculture production strategies between 2020 and 2030 in Hungary. APSTRACT Appl. Stud. Agribus. Commer. 2015, 9, 5–19. [Google Scholar]
  41. Zhou, W.; Chen, P.; Min, M.; Ma, X.; Wang, J.; Griffith, R.; Hussain, F.; Peng, P.; Xie, Q.; Li, Y. Environment-enhancing algal biofuel production using wastewaters. Renew. Sustain. Energy Rev. 2014, 36, 256–269. [Google Scholar] [CrossRef]
  42. Grasseli, G.; Szendrei, J. Possibilities of algae in biomass energy and food production through gas emission mitigation. Hung. Agric. Eng. 2012, 24, 71–75. [Google Scholar]
  43. Ip, S.; Bridger, J.; Chin, C.; Martin, W.; Raper, W. Algal growth in primary settled sewage: The effects of five key variables. Water Res. 1982, 16, 621–632. [Google Scholar] [CrossRef]
  44. Slade, R.; Bauen, A. Micro-algae cultivation for biofuels: cost, energy balance, environmental impacts and future prospects. Biomass Bioenergy 2013, 53, 29–38. [Google Scholar] [CrossRef]
  45. Singh, S.; Singh, P. Effect of CO2 concentration on algal growth: A review. Renew. Sustain. Energy Rev. 2014, 38, 172–179. [Google Scholar] [CrossRef]
  46. OECD/IEA. CO2 Emissions from Electricity and Heat Production, Total (% of Total Fuel Combustion). Available online: http://data.worldbank.org/indicator/EN.CO2.ETOT.ZS (accessed on 12 May 2017).
  47. Niessen, W.R. Combustion and Incineration Processes, Marcel Dekker, Inc. Available online: http://science.fire.ustc.edu.cn/download/download1/book%5Ccombustion%5CCOMBUSTION%20AND%20INCINERATION%20PROCESSES%5CCOMBUSTION%20AND%20INCINERATION%20PROCESSES.PDF (accessed on 12 May 2017).
  48. Van Den Hende, S.; Vervaeren, H.; Boon, N. Flue gas compounds and microalgae: (Bio-)chemical interactions leading to biotechnological opportunities. Biotechnol. Adv. 2012, 30, 1405–1424. [Google Scholar] [CrossRef] [PubMed]
  49. Yue, L.; Chen, W. Isolation and determination of cultural characteristics of a new highly CO2 tolerant fresh water microalgae. Energy Convers. Manag. 2005, 46, 1868–1876. [Google Scholar] [CrossRef]
  50. Richmond, A. Handbook of Microalgal Culture: Biotechnology and Applied Phycology; John Wiley & Sons: Hoboken, NJ, USA, 2008. [Google Scholar]
  51. Chowdhury, R.; Viamajala, S.; Gerlach, R. Reduction of environmental and energy footprint of microalgal biodiesel production through material and energy integration. Bioresour. Technol. 2012, 108, 102–111. [Google Scholar] [CrossRef] [PubMed]
  52. Becker, E. Micro-algae as a source of protein. Biotechnol. Adv. 2007, 25, 207–210. [Google Scholar] [CrossRef] [PubMed]
  53. Halleux, H.; Lassaux, S.; Renzoni, R.; Germain, A. Comparative life cycle assessment of two biofuels ethanol from sugar beet and rapeseed methyl ester. Int. J. Life Cycle Assess. 2008, 13, 184–190. [Google Scholar] [CrossRef]
  54. Zhu, X.G.; Long, S.P.; Ort, D.R. What is the maximum efficiency with which photosynthesis can convert solar energy into biomass? Curr. Opin. Biotechnol. 2008, 19, 153–159. [Google Scholar] [CrossRef] [PubMed]
  55. Chisti, Y. Biodiesel from microalgae. Biotechnol. Adv. 2007, 25, 294–306. [Google Scholar] [CrossRef] [PubMed]
  56. Lam, M.K.; Yusoff, M.I.; Uemura, Y.; Lim, J.W.; Khoo, C.G.; Lee, K.T.; Ong, H.C. Cultivation of Chlorella vulgaris using nutrients source from domestic wastewater for biodiesel production: Growth condition and kinetic studies. Renew. Energy 2017, 103, 197–207. [Google Scholar] [CrossRef]
  57. Chinnasamy, S.; Ramakrishnan, B.; Bhatnagar, A.; Das, K.C. Biomass production potential of a wastewater alga Chlorella vulgaris ARC 1 under elevated levels of CO2 and temperature. Int. J. Mol. Sci. 2009, 10, 518–532. [Google Scholar] [CrossRef] [PubMed]
  58. Chia, M.A.; Lombardi, A.T.; MELãO, M.D. Growth and biochemical composition of Chlorella vulgaris in different growth media. Anais da Academia Brasileira de Ciênc 2013, 85, 1427–1438. [Google Scholar] [CrossRef] [PubMed]
  59. De Morais, M.G.; Costa, J.A.V. Isolation and selection of microalgae from coal fired thermoelectric power plant for biofixation of carbon dioxide. Energy Convers. Manag. 2007, 48, 2169–2173. [Google Scholar] [CrossRef]
  60. Chen, P.C.; Huang, C.H.; Su, T.; Chen, H.W.; Yang, M.W.; Tsao, J.M. Optimum conditions for the capture of carbon dioxide with a bubble-column scrubber. Int. J. Greenh. Gas Control. 2015, 35, 47–55. [Google Scholar] [CrossRef]
  61. Sydney, E.B.; Sturm, W.; de Carvalho, J.C.; Thomaz-Soccol, V.; Larroche, C.; Pandey, A.; Soccol, C.R. Potential carbon dioxide fixation by industrially important microalgae. Bioresour. Technol. 2010, 101, 5892–5896. [Google Scholar] [CrossRef] [PubMed]
  62. Hirata, S.; Hayashitani, M.; Taya, M.; Tone, S. Carbon dioxide fixation in batch culture of Chlorella sp. using a photobioreactor with a sunlight-cellection device. J. Ferment. Bioeng. 1996, 81, 470–472. [Google Scholar] [CrossRef]
  63. Murakami, M.; Ikenouchi, M. The biological CO2 fixation and utilization project by rite (2)-Screening and breeding of microalgae with high capability in fixing CO2-. Energy Convers. Manag. 1997, 38, 493–497. [Google Scholar] [CrossRef]
  64. Taştan, B.E.; Duygu, E.; İlbaş, M.; Dönmez, G. Utilization of LPG and gasoline engine exhaust emissions by microalgae. J. Hazard. Mater. 2013, 246, 173–180. [Google Scholar] [CrossRef] [PubMed]
  65. Jonker, J.; Faaij, A. Techno-economic assessment of micro-algae as feedstock for renewable bio-energy production. Appl. Energy 2013, 102, 461–475. [Google Scholar] [CrossRef]
  66. Soratana, K.; Khanna, V.; Landis, A.E. Re-envisioning the renewable fuel standard to minimize unintended consequences: A comparison of microalgal diesel with other biodiesels. Appl. Energy 2013, 112, 194–204. [Google Scholar] [CrossRef]
  67. Clarens, A.F.; Resurreccion, E.P.; White, M.A.; Colosi, L.M. Environmental life cycle comparison of algae to other bioenergy feedstocks. Environ. Sci. Technol. 2010, 44, 1813–1819. [Google Scholar] [CrossRef] [PubMed]
  68. Soratana, K.; Landis, A.E. Evaluating industrial symbiosis and algae cultivation from a life cycle perspective. Bioresour. Technol. 2011, 102, 6892–6901. [Google Scholar] [CrossRef] [PubMed]
  69. Collet, P.; Hélias, A.; Lardon, L.; Steyer, J.-P.; Bernard, O. Recommendations for Life Cycle Assessment of algal fuels. Appl. Energy 2015, 154, 1089–1102. [Google Scholar] [CrossRef]
  70. Benemann, J.; Woertz, I.; Lundquist, T. Life cycle assessment for microalgae oil production. Disruptive Sci. Technol. 2012, 1, 68–78. [Google Scholar] [CrossRef]
  71. Brennan, L.; Owende, P. Biofuels from microalgae-a review of technologies for production, processing, and extractions of biofuels and co-products. Renew. Sustain. Energy Rev. 2010, 14, 557–577. [Google Scholar] [CrossRef]
  72. Liu, B.; Benning, C. Lipid metabolism in microalgae distinguishes itself. Curr. Opin. Biotechnol. 2013, 24, 300–309. [Google Scholar] [CrossRef] [PubMed]
  73. Gnansounou, E.; Raman, J.K. Life cycle assessment of algae biodiesel and its co-products. Appl. Energy 2016, 161, 300–308. [Google Scholar] [CrossRef]
  74. Maurer, M.; Schwegler, P.; Larsen, T.A. Nutrients in urine: energetic aspects of removal and recovery. Nutr. Remov. Recovery 2003, 48, 37–46. [Google Scholar]
  75. Vasudevan, V.; Stratton, R.W.; Pearlson, M.N.; Jersey, G.R.; Beyene, A.G.; Weissman, J.C.; Rubino, M.; Hileman, J.I. Environmental performance of algal biofuel technology options. Environ. Sci. Technol. 2012, 46, 2451–2459. [Google Scholar] [CrossRef] [PubMed]
  76. Soratana, K.; Harper, W.F., Jr.; Landis, A.E. Microalgal biodiesel and the Renewable Fuel Standard’s greenhouse gas requirement. Energy Policy 2012, 46, 498–510. [Google Scholar] [CrossRef]
  77. Kadam, K.L. Microalgae Production from Power Plant Flue Gas: Environmental Implications on a Life Cycle Basis; National Renewable Energy Laboratory Golden: Golden, CO, USA, 2001. [Google Scholar]
  78. Demirbas, A.; Demirbas, M.F. Importance of algae oil as a source of biodiesel. Energy Convers. Manag. 2011, 52, 163–170. [Google Scholar] [CrossRef]
  79. Norsker, N.H.; Barbosa, M.J.; Vermuë, M.H.; Wijffels, R.H. Microalgal production—A close look at the economics. Biotechnol. Adv. 2011, 29, 24–27. [Google Scholar] [CrossRef] [PubMed]
  80. Richardson, J.W.; Johnson, M.D.; Zhang, X.; Zemke, P.; Chen, W.; Hu, Q. A financial assessment of two alternative cultivation systems and their contributions to algae biofuel economic viability. Algal. Res. 2014, 4, 96–104. [Google Scholar] [CrossRef]
  81. Bai, A.; Jobbágy, P.; Durkó, E. Algae production for energy and foddering. Biomass Convers. Biorefinery 2011, 1, 163–171. [Google Scholar] [CrossRef]
  82. Kapros, T. Reduction of CO2 Emission of Power Plants by Application of CCS Technologies. Available online: http://folyoirat.hulladekonline.hu/files/200/Kapros202.pdf (accessed on 12 May 2017). (In Hungarian).
  83. Sterner, M.; Fritsche, U. Greenhouse gas balances and mitigation costs of 70 modern Germany-focused and 4 traditional biomass pathways including land-use change effects. Biomass Bioenergy 2011, 35, 4797–4814. [Google Scholar] [CrossRef]
  84. Musselman, R.C.; Fox, D.G. A review of the role of temperate forests in the global CO2 balance. J. Air Waste Manag. Assoc. 1991, 41, 798–807. [Google Scholar] [CrossRef]
  85. Chen, J.; Chen, W.; Liu, J.; Cihlar, J.; Gray, S. Annual carbon balance of Canada’s forests during 1895–1996. Glob. Biogeochem. Cycles 2000, 14, 839–849. [Google Scholar] [CrossRef]
  86. Szakálosné Mátyás, K.; Horváth, B.; Major, T.; Horváth, A.L. The Usable Amount of Hungarian Forests’ Timber for Energetic Purposes. Available online: http://erdo-mezo.hu/2014/02/07/a-magyarorszagi-erdok-energetikai-celra-hasznosithato-faanyaga/ (accessed on 12 May 2017). (In Hungarian).
  87. Hungarian Central Statistical Office. Distribution of Stocked Forest Area by Tree Species and Age-Group. Available online: http://www.ksh.hu/docs/eng/xstadat/xstadat_annual/i_ome002a.html (accessed on 12 May 2017).
  88. Ministry of Agriculture. Official Ministerial Informative Material about the Situation and State of Hungary’s Forest Stock in 2014. Available online: http://www.kormany.hu/download/1/27/80000/tajekoztato_erdoallomany_2014.pdf (accessed on 12 May 2017). (In Hungarian).
  89. Thomas, S.C.; Martin, A.R. Carbon content of tree tissues: A synthesis. Forests 2012, 3, 332–352. [Google Scholar] [CrossRef]
  90. Valentini, R.; Matteucci, G.; Dolman, A.; Schulze, E.-D.; Rebmann, C.; Moors, E.; Granier, A.; Gross, P.; Jensen, N.; Pilegaard, K. Respiration as the main determinant of carbon balance in European forests. Nature 2000, 404, 861–865. [Google Scholar] [CrossRef] [PubMed]
  91. Hashi, A.R.E. Natural Gas Conversion Guide, International Gas Union. Available online: http://agnatural.pt/documentos/ver/natural-gas-conversion-guide_cb4f0ccd80ccaf88ca5ec336a38600867db5aaf1.pdf (accessed on 12 May 2017).
  92. The Engineering Toolbox. Wood and Bio Mass Heat, Combustion Values of Wet and Dry Wood. Available online: http://www.engineeringtoolbox.com/wood-biomass-combustion-heat-d_440.html (accessed on 12 May 2017).
  93. Covenant of Mayors. Technical Annex to the SEAP Template Instructions Document: The Emission Factors. Available online: http://www.eumayors.eu/IMG/pdf/technical_annex_en.pdf (accessed on 12 May 2017).
  94. Forster, P.; Ramaswamy, V.; Artaxo, P.; Berntsen, T.; Betts, R.; Fahey, D.W.; Haywood, J.; Lean, J.; Lowe, D.C.; Myhre, G. Changes in atmospheric constituents and in radiative forcing. In Climate Change 2007. The Physical Science Basis; Cambridge University Press: Cambridge, UK, 2007; Chapter 2. [Google Scholar]
  95. Lal, R. Carbon emission from farm operations. Environ. Int. 2004, 30, 981–990. [Google Scholar] [CrossRef] [PubMed]
  96. Zapp, P.; Schreiber, A.; Marx, J.; Haines, M.; Hake, J.-F.; Gale, J. Overall environmental impacts of CCS technologies—A life cycle approach. Int. J. Greenh. Gas Control. 2012, 8, 12–21. [Google Scholar] [CrossRef]
  97. Bloomberg. Energy & Oil Markets, October. Available online: http://www.bloomberg.com/energy (accessed on 12 May 2017).
  98. Licht, F.O. World Ethanol and Biofuels Report. Available online: http://www.earth-policy.org/datacenter/pdf/book_wote_energy_biofuels.pdf (accessed on 12 May 2017).
  99. United Nations Economic Commission for Europe/Food and Agriculture Organization. European Forest Sector Outlook Study 1960-2000-2020 Main Report; United Nations: Geneva, Switzerland, 2005. [Google Scholar]
  100. Nabuurs, G.; Schelhaas, M. Carbon profiles of typical forest types across Europe assessed with CO2FIX. Ecol. Indic. 2002, 1, 213–223. [Google Scholar] [CrossRef]
Figure 1. Main stages involved in establishing the CO2 balance. Source: Authors’ own construction, based on Sterner and Fritsche [83], Musselman and Fox [84], Chen et al. [85].
Sustainability 09 00857 g001
Figure 2. Amount of CO2 (thousand tons) captured by the main wood species in 2014. Source: Authors’ own calculations based on Hungarian Central Statistical Office [22].
Sustainability 09 00857 g002
Table 1. Parameters used for the calculation of the CO2 sequestration and emissions from forests annually.
Calculated Result CategoryFactorValueMeasurement UnitSource
CO2 captured by incrementAmount of yearly increment in Hungary7m3/ha[87]
Forestry area of Hungary1938thousand ha[87]
Average CO2 sequestration ability of wood981kg m−3[15]
CO2 sequestration of the extracted timberQuantity of extracted timber broken down into wood speciesacacia: 1745, poplar: 1359, oak: 1975thousand m3[3]
Average density of wood0.55ton m−3[15]
Industrial wood as a proportion of net extraction ~47%[88]
Firewood as a proportion of net extraction~53%[88]
Average carbon content of wood species49.5–49.8%[15,89,90]
Heating value of natural gas34MJ m−3[91]
Natural gas saving and its CO2 contentDensity of natural gas0.78kg m−3[91]
Heating value of (air-dry) wood16MJ kg−1[92]
CO2 emitted by burning natural gas 1.963kg m−3[93]
Operations to be performed in the life cycle of different wood species details in Table 2L ha−1, working hours per hectareexpert data (2016)
Emission of forestry technologyCO2 emission of diesel2.64kg L−1[93]
Lifespan of wood speciesacacia: 35, poplar: 25, oak: 85yearsexpert data (2016)
Table 2. Description of related forest technologies.
Fuel Need/Life CycleCO2 Emissions/Life CycleCO2 Emissions/Year
Technologyliter ha−1 life cycle−1kg ha−1 life cycle−1kg ha−1 year−1
Acacia
Propagation material production 22.650.65
New population (renewal, plantation and replacement manually, disking (5 times)106.18420.512.01
Cutting stump shoots with motor mower (3 times)7.9542.81.22
Light disking with tractor (5 times)106.181051.242.05
Thinning with motor saw (3 times)19.87107.03.06
Harvesting3.005.40.15
Total 1775.662.74
Poplar
Propagation material production 9.700.39
Stump planning with tractor530.901401.656.06
Disking with tractor331.81876.035.04
Hole boring with tractor191.12871.534.86
Seedling transport and plantation
Light disking with tractor (10 times)106.182803.1112.13
Thinning with motor saw19.8747.50.56
Harvesting3.007.20.29
Total 6016.6239.32
Oak
Propagation material production 22.650.27
Renewal with tractor106.18280.33.30
Manual plantation
Manual replacement
Light disking with tractor (10 times)106.182803.1112.13
Nursing with motor mower (8 times)10.37198.52.34
Thinning with motor saw (4 times)19.87190.12.24
Harvesting3.007.20.08
Total 3501.9120.35
Source: Authors’ own calculation based on expert opinions.
Table 3. Yearly average CO2 emissions of wood species and yearly emissions during their life cycle.
AcaciaPoplarOther Hardwood (Oak)
CO2 during life cycle (kg ha−1 year−1)177660173502
CO2 per year (kg ha−1 year−1)63239120
Proportion of wood species in the forested area (%)24.210.549
Average (kg CO2 emissions year−1 ha−1)119
Source: Authors’ own calculation.
Table 4. The impact of forests on CO2 emissions in Hungary.
Positive Impact (+)
In One Hectare (t CO2 per Year)In Hungary (Mt CO2 per Year)
Extra IncrementIndustrial WoodFirewoodExtra IncrementIndustrial WoodFirewood
1. Wood growing2.901.611.795.613.123.46
2. Natural gas replacement 0.92 1.77
Total (captured and saved CO2)7.2113.96
Negative Impact (–)
Production technology0.120.23
Burning 1.79 3.46
Total (technology + burning)1.903.69
Balance
Balance of forestry5.3010.28
Source: Authors’ own calculation.
Table 5. Potential impact of algae on the Hungarian power plant system.
ParameterUnitHungarian Power Plant System
Algae species Chlorella vulgarisScenedesmus dimorphus
Technology semi-intensive greenhouseextensive raceway pondsemi-intensive greenhouse
CO2 emissionsthousand t CO211,60011,60011,600
CO2 fixation by algaethousand t CO230457133045
CO2 emissions in productionthousand t CO2480108495
Value of saved CO2million €22521
Necessary amount of algaethousand t13,83171322,650
Necessary number of pondsthousand ha563894
Necessary investmentbillion €27,885962246,991
Extractable oilthousand t387320011,551
Biodiesel to be producedmillion L437822613,058
Replaced CO2 in biodiesel productionthousand t10,64654931,755
Emitted CO2 in biodiesel productionthousand t35961855889
Value of saved CO2 of algoilmillion €59.23.1217.3
Value of algoilbillion €5.20.315.4
Source: Authors’ own calculation.

