Article

Life Cycle CO2 Assessment by Block Type Changes of Apartment Housing

1
Korea Institute of Civil Engineering and Building Technology, 283, Goyangdae-ro, Goyang-si, Gyeonggi-do 10223, Korea
2
School of Architecture & Architectural Engineering, Hanyang University, 55 Hanyangdaehak-ro, Sangrok-gu, Ansan-si, Gyeonggi-do 15588, Korea
3
Department of Architectural Engineering, Hanyang University, 55 Hanyangdaehak-ro, Sangrok-gu, Ansan-si, Gyeonggi-do 15588, Korea
*
Author to whom correspondence should be addressed.
Sustainability 2016, 8(8), 752; https://doi.org/10.3390/su8080752
Submission received: 25 March 2016 / Revised: 25 July 2016 / Accepted: 29 July 2016 / Published: 4 August 2016
(This article belongs to the Special Issue Life Cycle Assessment on Green Building Implementation)

Abstract

:
The block type and structural systems in buildings affect the amount of building materials required as well as the CO2 emissions that occur throughout the building life cycle (LCCO2). The purpose of this study was to assess the life cycle CO2 emissions when an apartment housing with ‘flat-type’ blocks (the reference case) was replaced with more sustainable ‘T-type’ blocks with fewer CO2 emissions (the alternative case) maintaining the same total floor area. The quantity of building materials used and building energy simulations were analyzed for each block type using building information modeling techniques, and improvements in LCCO2 emission were calculated by considering high-strength concrete alternatives. By changing the bearing wall system of the ‘flat-type’ block to the ‘column and beam’ system of the ‘T-type’ block, LCCO2 emissions of the alternative case were 4299 kg-CO2/m2, of which 26% was at the construction stage, 73% was as the operational stage and 1% was at the dismantling and disposal stage. These total LCCO2 emissions were 30% less than the reference case.

1. Introduction

Internationally, greenhouse gases are arguably the most prevalent global environmental problem. According to International Energy Agency (IEA), buildings account for almost 30% of greenhouse gas emissions [1,2,3]. Korea established the national Greenhouse Gas Reduction Roadmap to reduce greenhouse gas emissions by 37% for Business-As-Usual (BAU) levels by 2030 [4]. In Korea, the construction industry accounts for 40% of all material consumption, 24% of energy consumption and 42% of CO2 emissions. Thus, reduction of the construction industry’s CO2 emissions is required to reach greenhouse gas reduction goals [5].
Apartment housing is the major type of the residential sector in Korea, making up 52.4% of residential building stock. The most common apartment building in Korea is the ‘flat-type’ block, which consists of two rectangular units side by side like a wide box [6]. Thus far, building types, building forms and structural systems have not been heavily studied in regard to Life Cycle CO2 (LCCO2) emission. However, for the majority of apartment housing blocks, it has been shown that a significant portion of the CO2 emissions can be reduced by using a more sustainable block type instead of the ‘flat-type’ block [7,8,9,10,11,12,13].
The purpose of this study was to assess the LCCO2 emissions when ‘flat-type’ blocks in an apartment building (the reference case) were replaced with more sustainable ‘T-type’ blocks with fewer CO2 emissions (the alternative case) while maintaining the same total floor area. Therefore, this study focuses on changing the building type rather than by improving the insulation or the heating, ventilation and air conditioning (HVAC) equipment. The quantity of building materials used and energy simulations were analyzed on each block type using Building Information Modeling (BIM) techniques, and the LCCO2 emissions were calculated.
The study results indicate that different block types have significantly different CO2 emissions over the building life cycle, and ‘T-type’ blocks have the potential to significantly reduce greenhouse gas emission in the residential sector.

2. Literature Review

Life Cycle Assessment (LCA) that quantifies the consumption of resource and the occurrence of emissions throughout the entire process of products system is an environmental impact assessment scheme that evaluates their overall effects and is defined as ISO14040 [14]. The research on the construction sector began with the reference to the Product Life Cycle Assessment targeting materials and products. In order to apply to building structures, in consideration of the characteristics of having a complicated structure and a long lifetime, the process of establishing the evaluation subject’s list of analysis and evaluation stages should be prioritized by setting a life cycle phase and range and by separating the inputs and outputs [15,16,17]. The building’s previous LCA includes all processes and activities, during the life cycle of the building, that are divided into construction, operation, maintenance, management, dismantling and disposal phases [18]. It is used as a tool to calculate the environmental load of a quantitative structure. In addition, the previous LCA’s ultimate purpose is to drive improvements that minimize the resource, energy consumption, CO2 emissions, etc. at each step for a sustainable development. In consideration of the building’s previous life cycle for an environmental impact assessment, European countries were undertaken in the development of national level since the early 1990s and the studies on building’s environmental performance evaluation is being conducted in various fields using the LCA method [19]. Eco-Quantum is the world’s first building LCA-based computer program and was developed by the IVAM Environmental Research Institute in Netherlands; it evaluates various aspects, such as the effects of energy consumption during the building life cycle, maintenance during the operational phase, differences in the durability of building-related parts, and recycling rates [20]. Becost, developed by the VTT Technical Research Centre of Finland Ltd., is a web-based program that is utilized in marketing and system management, and uses data relating to environmental effects throughout the building life cycle, including during building material production, transportation, construction, maintenance, and disposal [21]. Envest, developed by BRE in UK, is used to evaluate the LCA of building materials from the early phase of building design. Web-based Envest2 was developed in 2003. The system boundary of this system includes material extraction and manufacturing, related transport, on-site construction of assemblies, operation, maintenance and replacement, and demolition. It can evaluate greenhouse gas (GHG) emissions, acid deposition, ozone depletion, eutrophication, human toxicity, eco toxicity, waste disposal, etc. using the Ecoinvent database [22]. The analysis results produced by Envest provide information relating to both environmental performance and economic feasibility, through mean measured values of environmental effects (referred to as Eco-point) and whole-life cost analysis results [23,24]. Athena EcoCalculator is a spreadsheet-based LCA tool developed by the ATHENA Institute in Canada. Architects, engineers and other design professionals can have instant access to instant life cycle assessment results for hundreds of common building assemblies using Athena EcoCalculator for Assemblies [25,26]. The tool was commissioned by the Green Building Initiative (GBI) for use with the Green Globes environmental certification system. The boundary of this system includes material extraction and manufacturing, related transport, on-site construction of assemblies, maintenance and replacement, demolition, and transport to landfill. It can evaluate GHG emission, embodied primary energy, pollution to air, pollution to water, weighted resource use using the ATHENA database (cradle-to-grave) and US life cycle inventory database [27]. This system makes it easy to obtain the environmental impact result in real time and compare each other assemblies. However, it is only available custom assembly options. Column and beam sizes are fixed [25]. LISA, developed in Australia, offers advantages in terms of ease of analysis of environmental performance during the building material production phase by utilizing life cycle inventory (LCI) databases (DBs) for various materials; it also uses simple input methods, thereby reducing evaluation time and effort [24]. In Korea, SUSB–LCA was developed by the Sustainable Building Research Center. SUSB–LCA employs direct input of building materials and energy usage, together with an estimation model. SUSB–LCA can evaluate life-cycle energy, carbon emissions, and cost. It is also an evaluation program that allows a case comparison between target and alternative buildings [28].
Compared with the above LCA Method, SUSB–LCA enables easy assessment of building life cycle CO2, offering outstanding performance of data renewal, and Becost and Envest2 offer users easy access and various analysis results but require many hours of in calculating CO2 due to many input items. Moreover, Eco-Quantum also can perform various comprehensive assessments by the stages based on life cycle, but, due to many direct input items, require many hours in the assessment [29]. On the other hand, Athena EcoCalculator and LISA have outstanding capability to analyze construction material production by utilizing the LCI database of many materials and require relatively less assessment hours in the assessment owing to simple input method, but has limitation in detailed analysis of CO2.

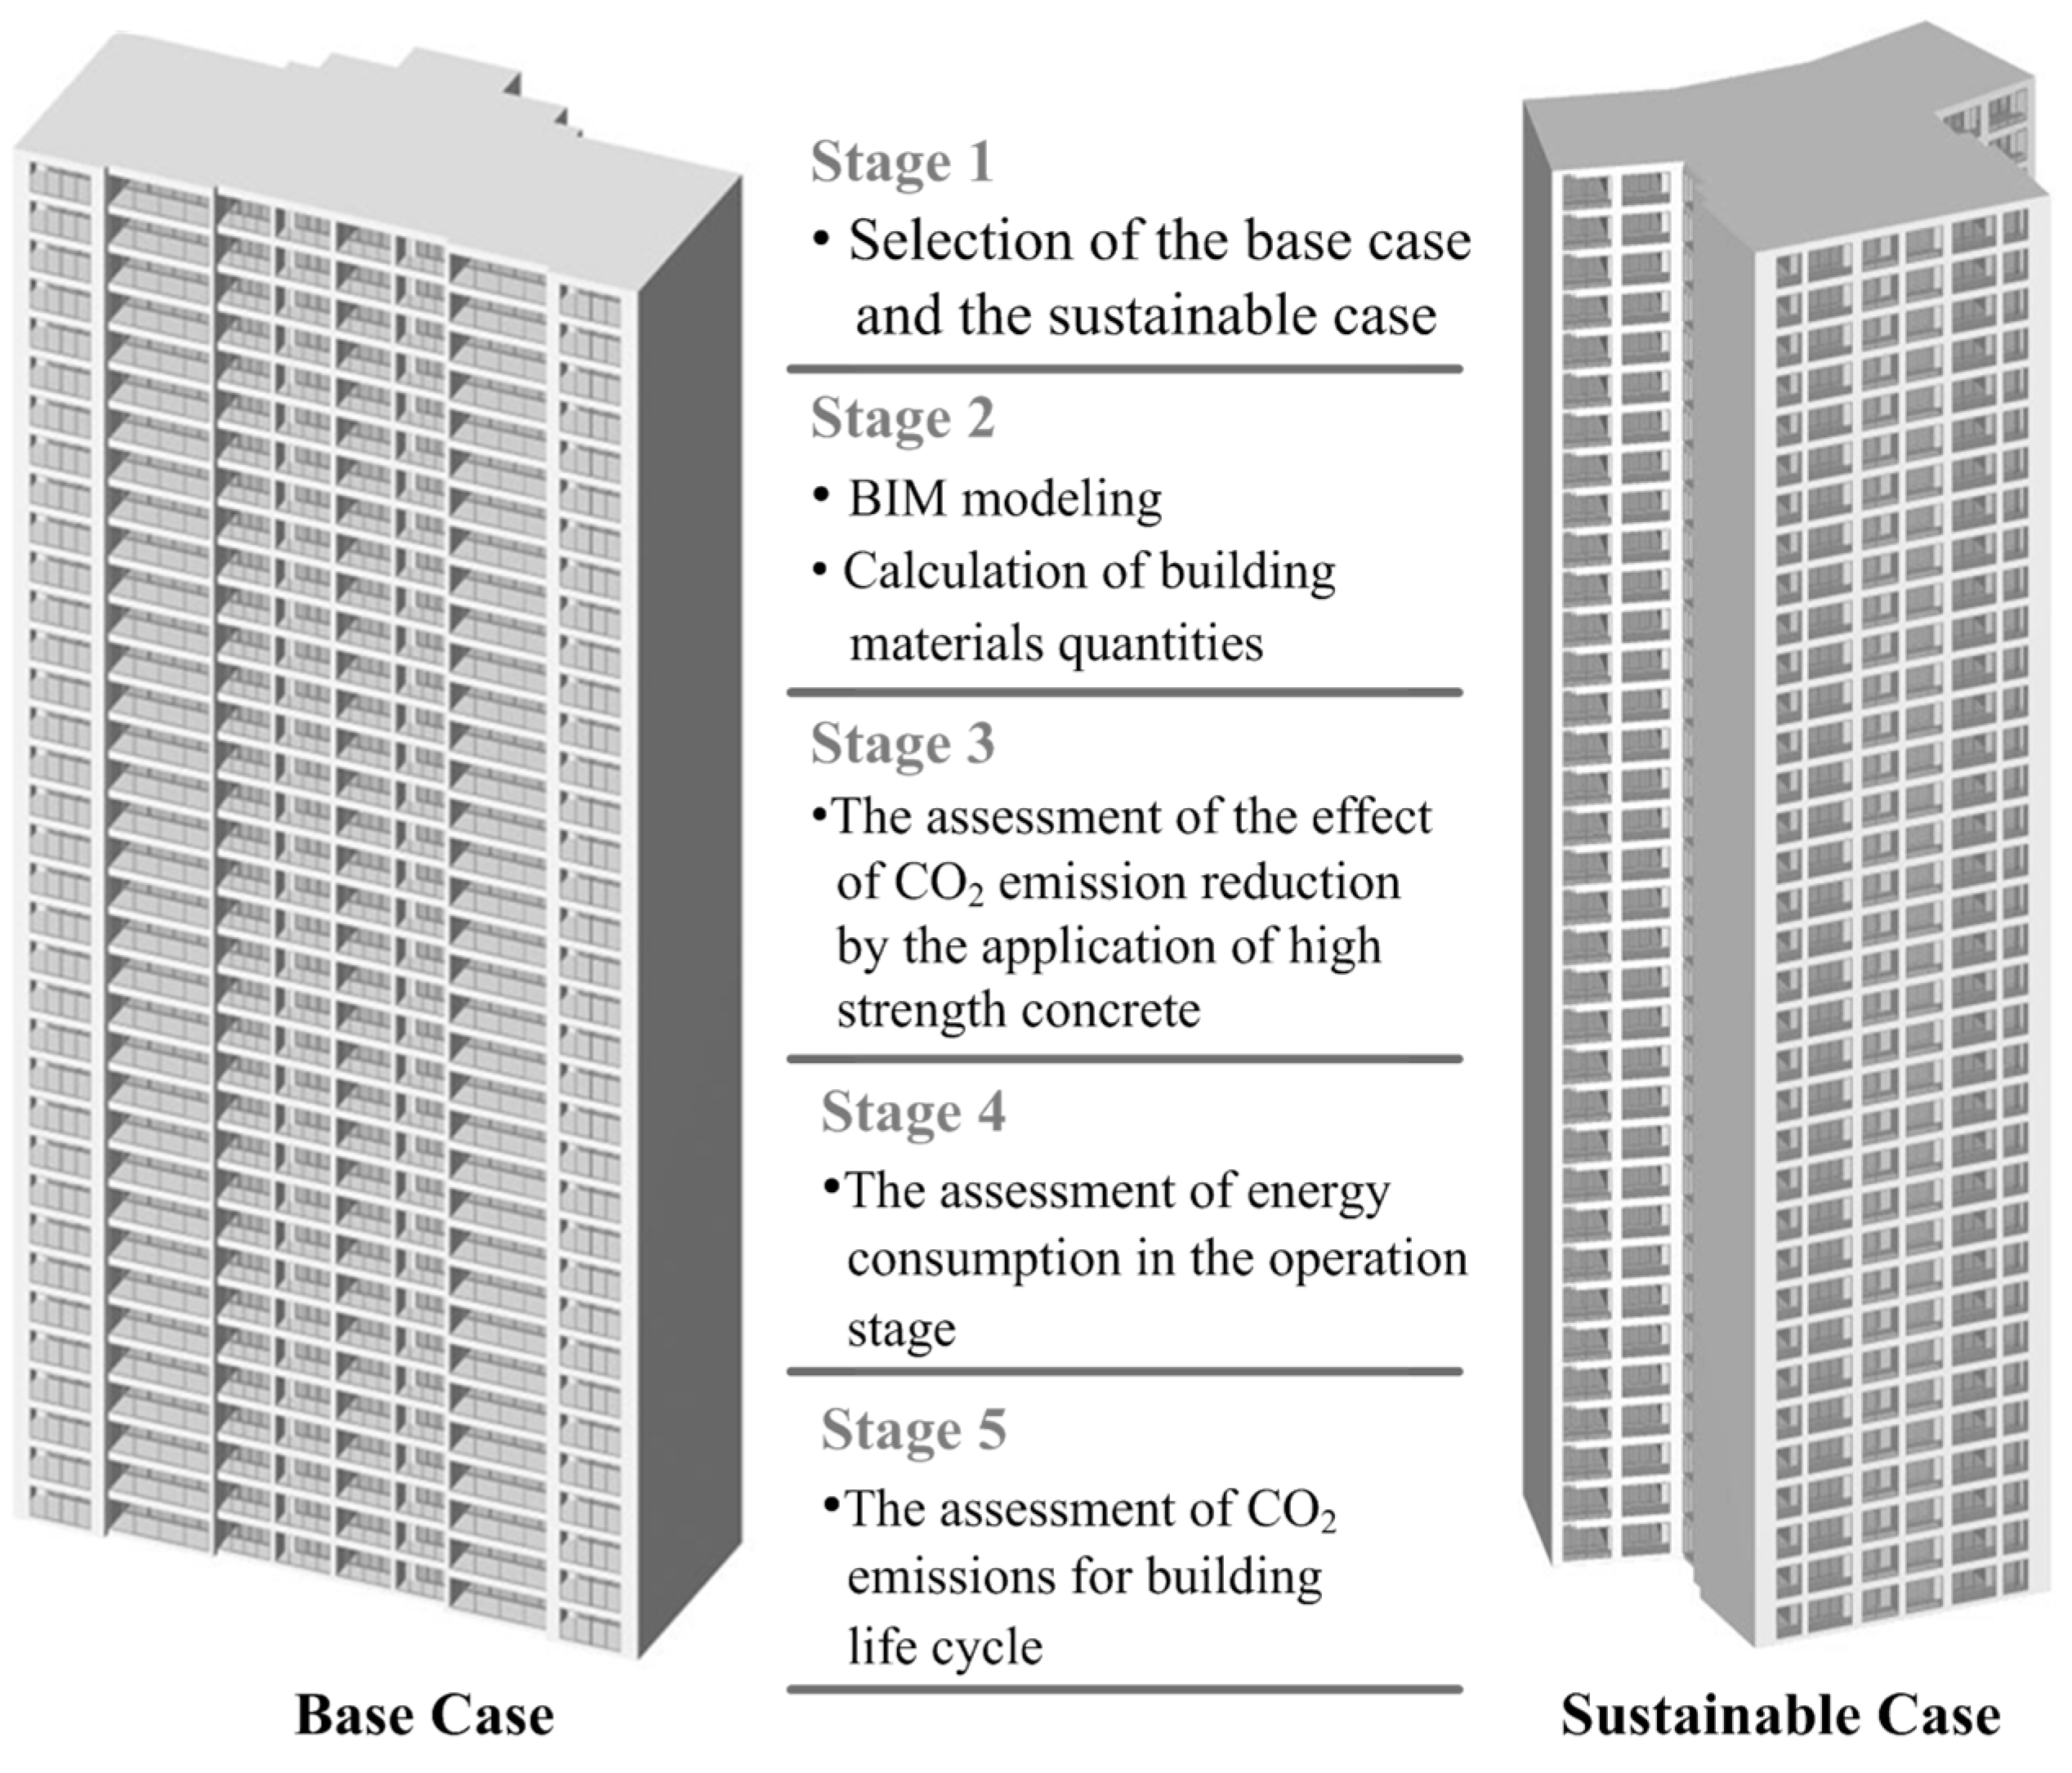
3. Assessment Method

Theory of the Building LCA Assessment Method

To compare the LCCO2 of the different block types, an existing apartment housing project that consisted of all ‘flat-type’ apartment blocks was selected as the reference case, and CAD drawings (e.g., plans, sections, elevations and details) were obtained. To compare a more sustainable block type with the reference case, a ‘T-type’ block was proposed with the same levels of insulation and HVAC equipment as well as with the same total floor area in the block lay-out plan of the existing project. The ‘T-type’ block was developed based on the concepts of less building material used during the construction stage, and less energy used during the operation stage in the project life cycle (the alternative case). Second, each representative block for the base and alternative cases was composed using BIM software (ArchiCAD ver. 13, Graphisoft, Budapest, Hungary) based on 2D CAD drawings. After developing a 3D model, the cost of the building materials was assessed with SUSB–LCA, a software program developed by Sustainable Building Research Center at Hanyang University, Ansan, Korea. This information was used to quantitatively assess CO2 emissions and calculate the cost and energy usage from the building’s entire life cycle (construction, operation, maintenance and demolition and disposal) [28]. Third, the effect of CO2 reduction was assessed by the application of high-strength concrete on the alternative cases only. This was performed by measuring the reduction in the quantity of materials used for construction and the life cycle extension of the structural system due to the use of high-strength concrete [30]. Fourth, CO2 emissions during the operation stage were assessed by measuring energy consumption of each case using EcoDesigner, a building energy simulation software compatible with BIM (Graphisoft, Budapest, Hungary). This program has been validated for fast analysis results by international standards including IEA-BESTEST, ASHRAE-BESTEST and CEN-15265.
Finally, LCCO2 emissions for the entire building life cycle were assessed: all CO2 emissions were summed from the construction, the operation and the dismantling and disposal stages. In this study, for the evaluation of manufacturing process considering the construction materials’ practical aspects and properties, the mixed analysis method, which the individual integration and the input-output analysis are complexly used, was applied. Especially, for the concrete CO2 emission intensity that is different depending on the strength, since the input–output analysis and the individual integration currently indicate just the individual or partial intensity, the CO2 basic unit through the database of concrete strength and CO2 emissions for each admixtures, which were analyzed by the individual integration, was applied in the initial research and, in the case of materials other than concrete, the input–output analysis derived from the direct and indirect parts of the input–output relations table of the Bank of Korea was applied for consistency in the per-unit range analysis and evaluation results. In addition, the supply quantity table by specific-items, which is an attached table of input–output relations table, was prioritized in applying each material unit price, while the energy consumption and CO2 emission per unit of each material were calculated by using the price information data and the construction cost analysis data of the Korea Housing Corporation for the materials that are difficult to apply the specific item. Figure 1 shows the process of assessment for this study.

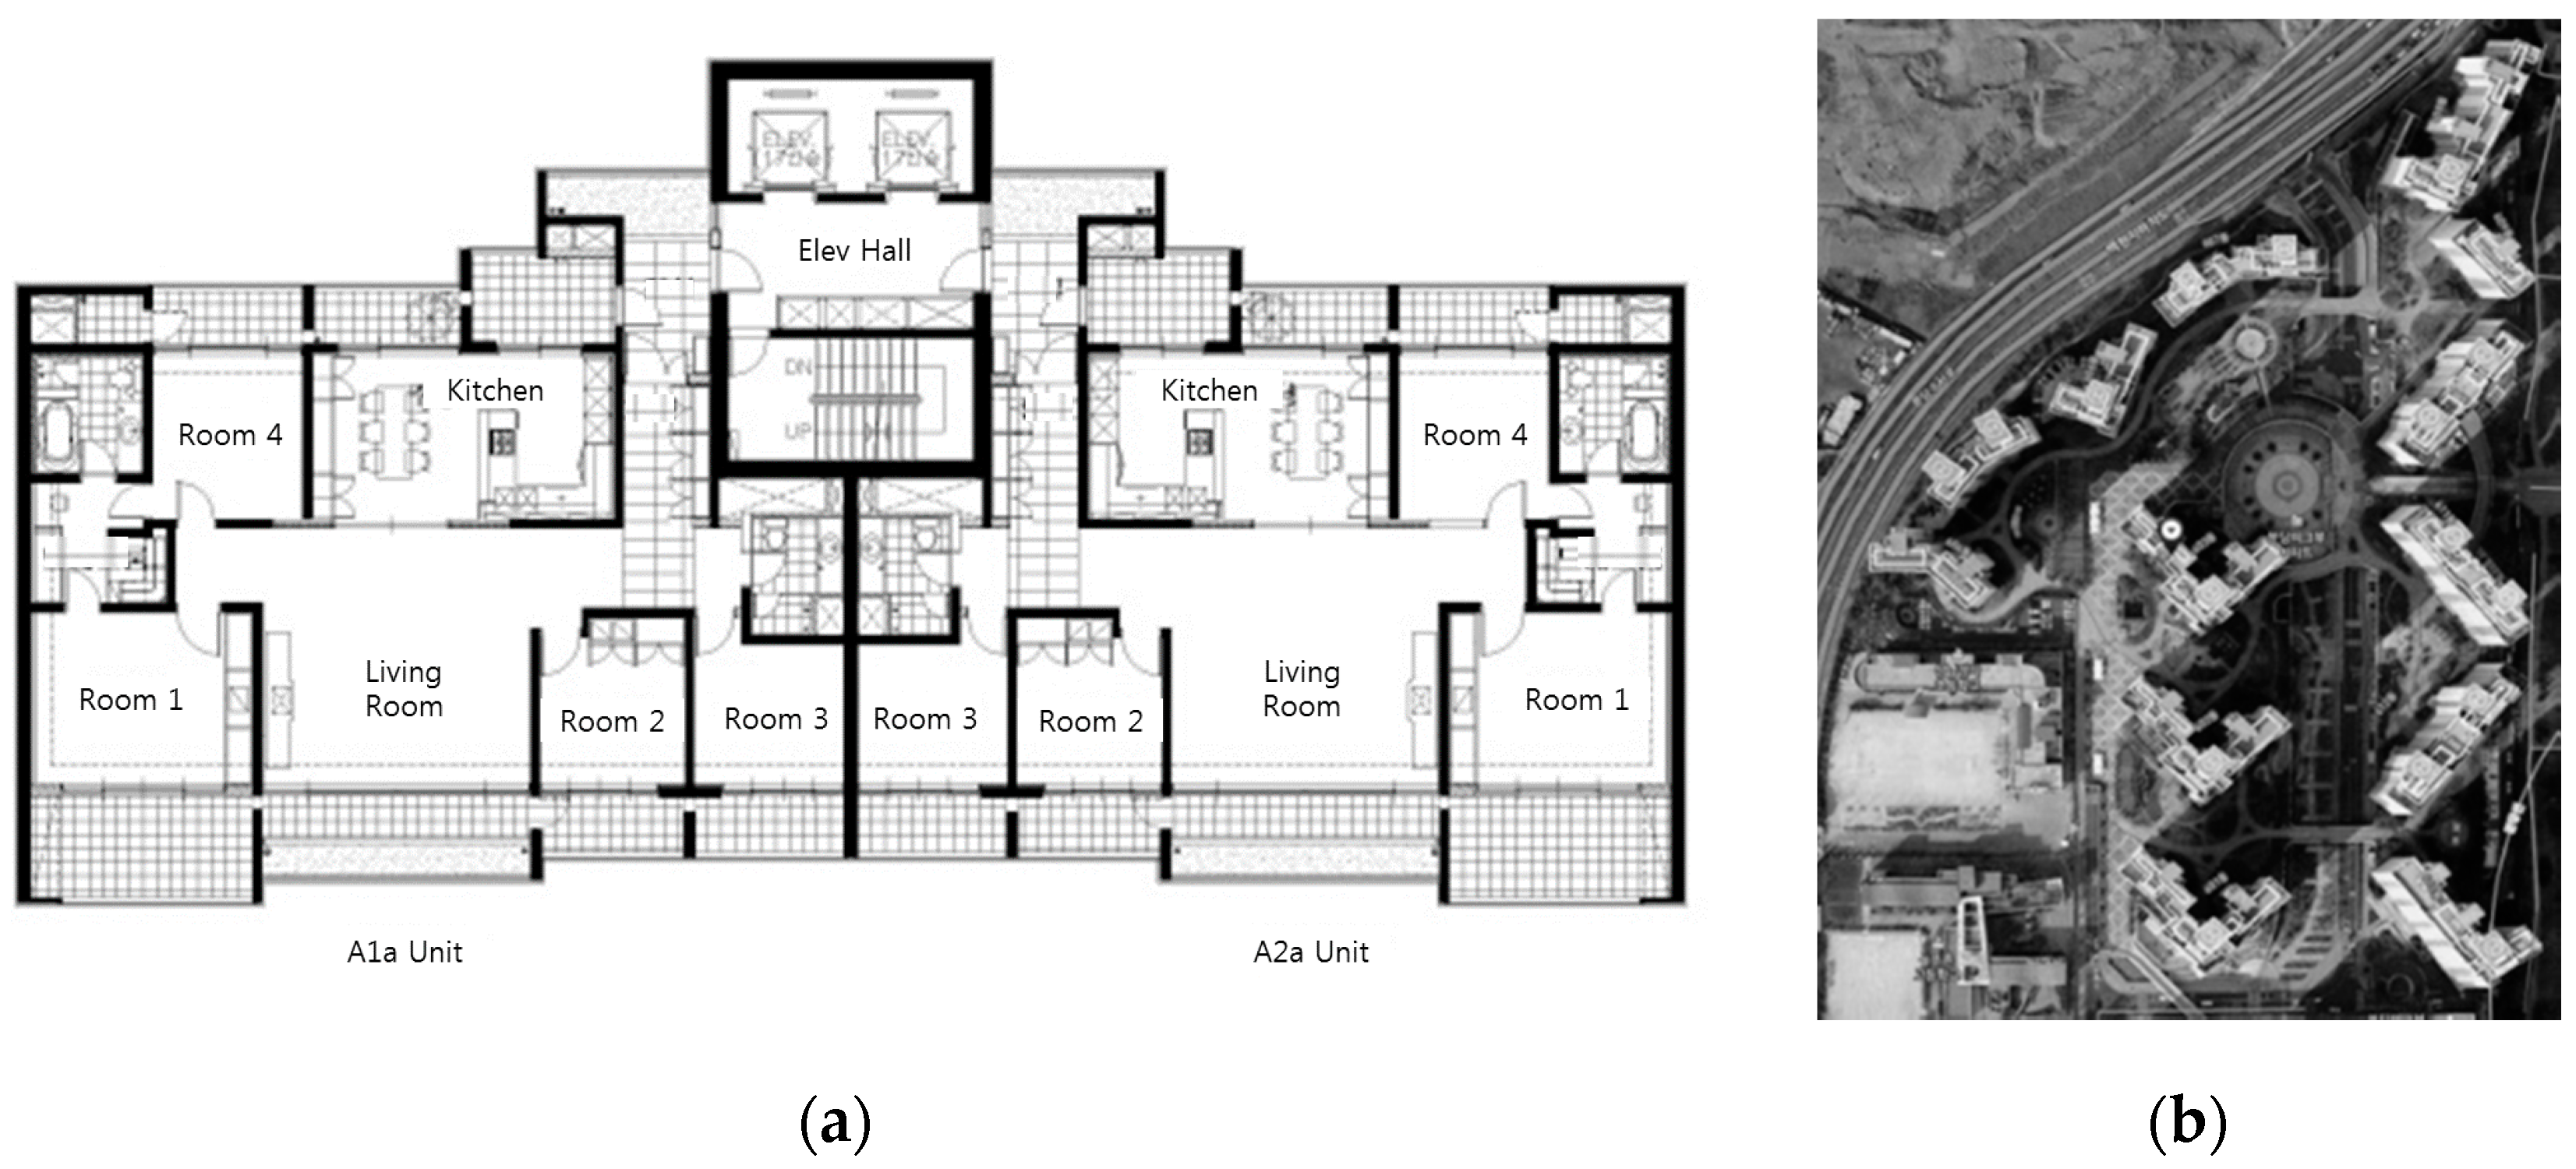
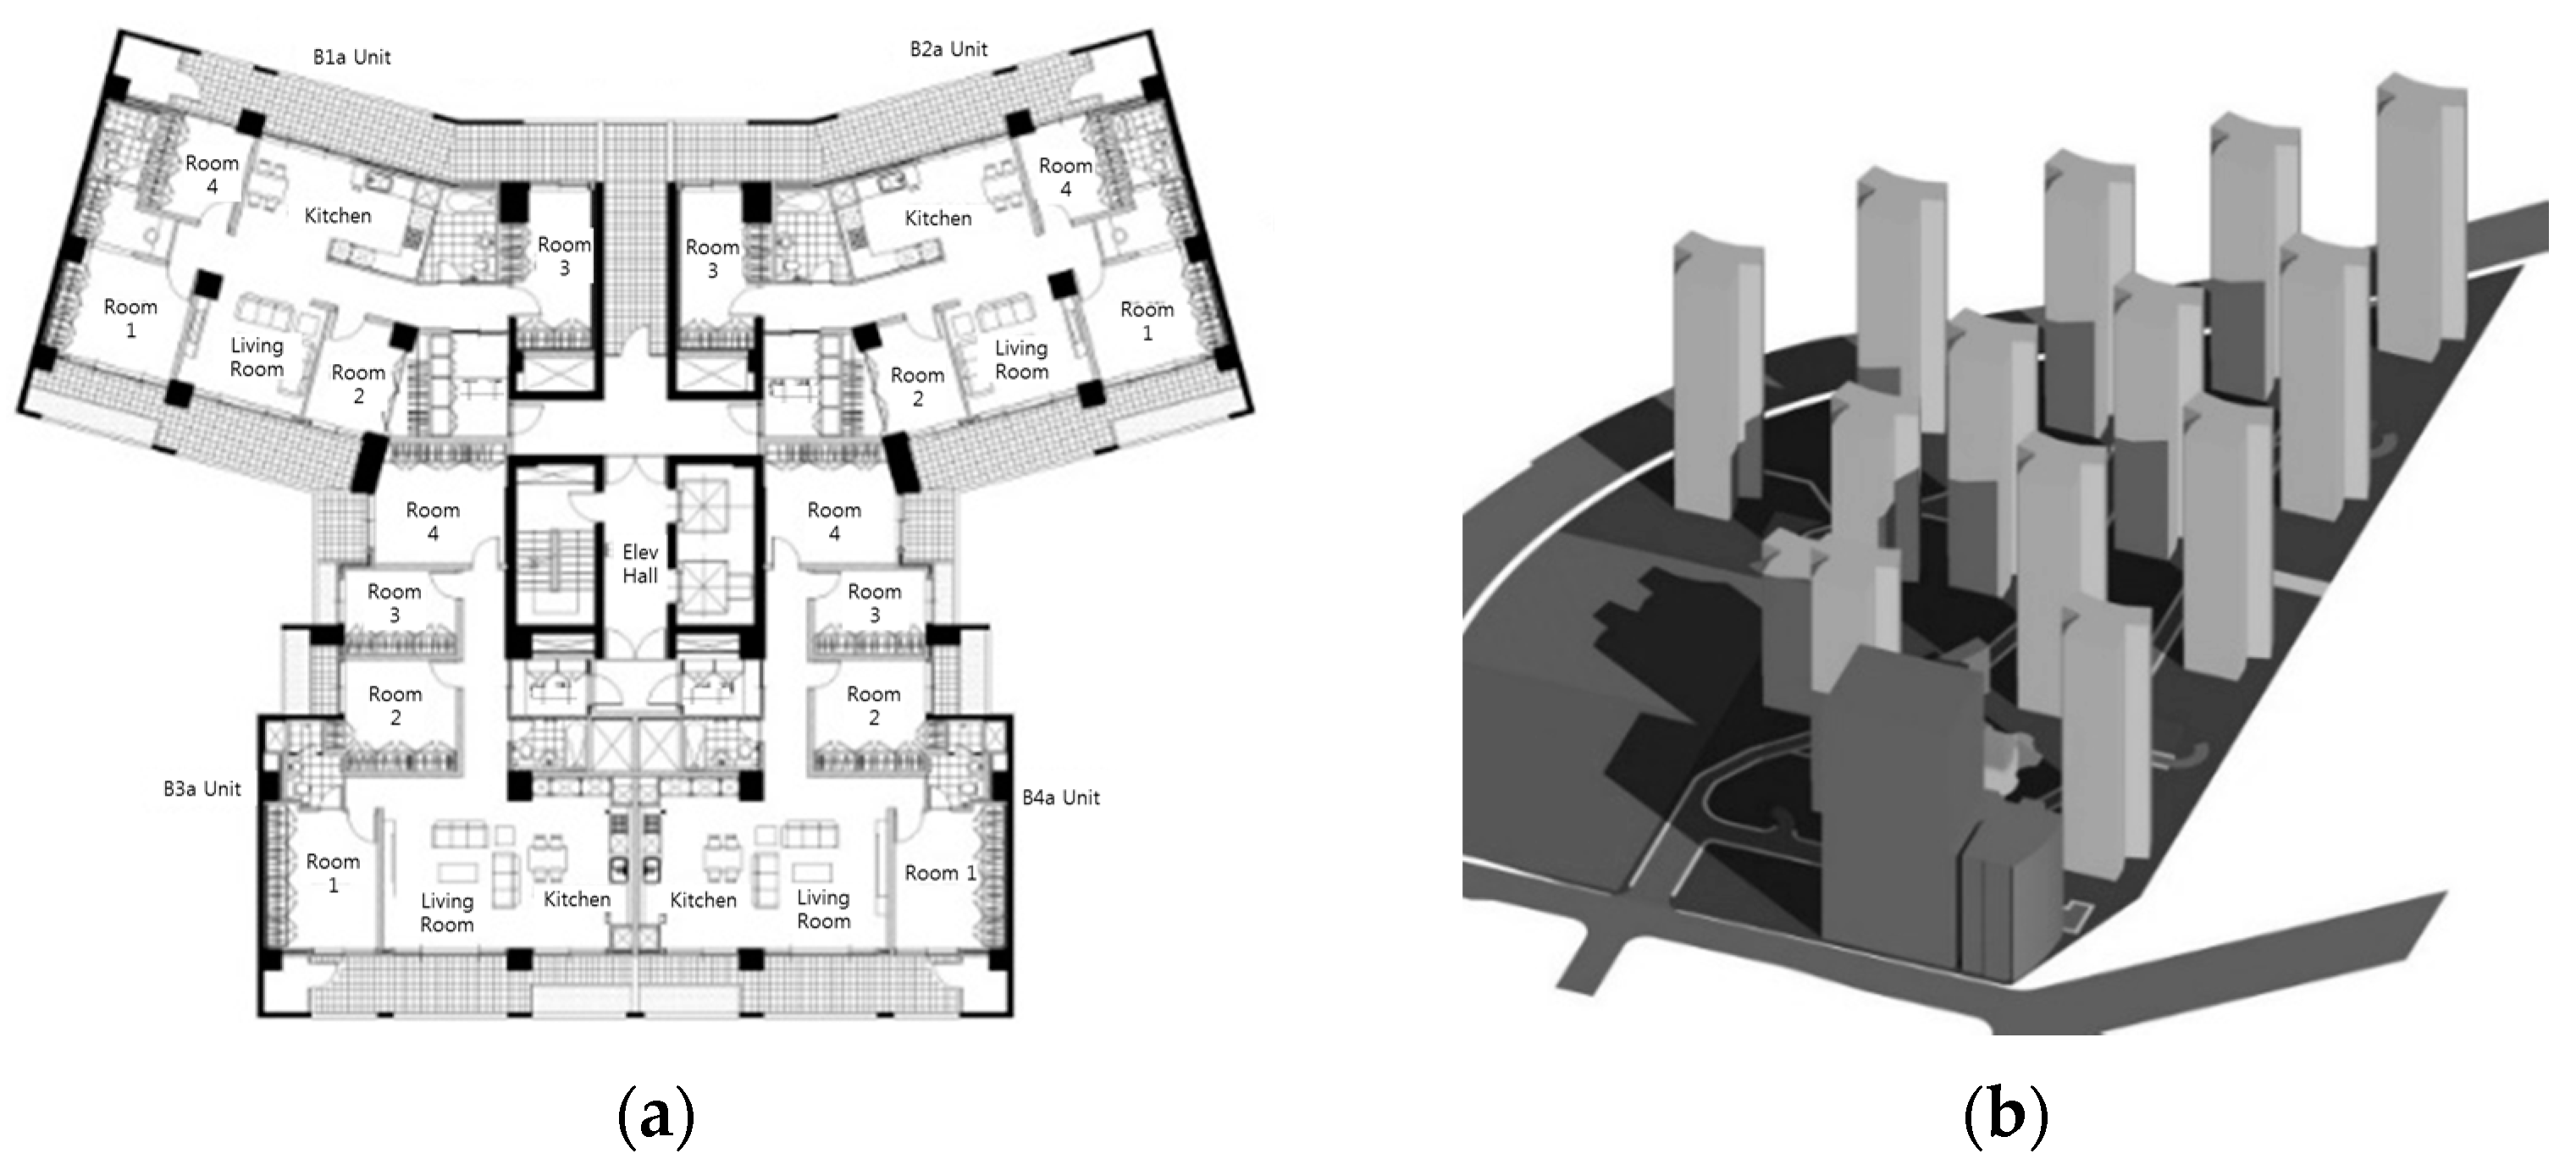
4. Reference Case and Alternative Case Proposal

The apartment housing project selected as the reference case was composed of 14 ‘flat-type’ blocks ranging from 30 to 35 stories. The land area was 99,744 m2, and it had 1829 dwelling units with 249,951 m2 of total floor area for residential use. The project was completed in 2004. A typical 35-story block in the housing project was selected as the reference block of the reference case (see Figure 2). The typical floor plan consisted of the same two units with one vertical circulation core; each unit area was 162.87 m2, and the total floor area of the reference block was 11,400.9 m2. The floor height was 2.9 m and the total height of the reference block was 104.8 m. The structural system was the bearing wall system and the concrete compressive strengths of the vertical members of the reference block were classified into four segments: 35 MPa from the ground floor to the 9th floor, 30 MPa from the 10th to 19th floors, 27 MPa from the 20th to 26th floors and 24 MPa from the 27th to 35th floors (See Table 1). The alternative case was designed to have the same level of insulation and HVAC equipment as well as with the same total floor area in the site level of the reference case. Therefore, the alternative case was composed of 14 ‘T-type’ blocks ranging from 20 to 35 stories, which had 1820 dwelling units with 250,932 m2 of total floor area for residential use.
A typical 35-story block was selected as the reference block in the alternative case. The floor height was 2.9 m and the total height of the reference block was 104.8 m; these dimensions were the same as the reference case. The typical floor plan of the alternative case was planned as the ‘column and beam’ structural system with a front 3–4 bay composition, and in the form of four units with one vertical circulation core to achieve spatial efficiency and openness in each unit (see Figure 3). Each unit area was 137.88 m2, and the total floor area of the reference block was 19,302.5 m2.
The structural system was the ‘column and beam’ system and the variable high-strength concrete was used as the structural material. These factors were selected in order to assess how many CO2 emissions are reduced from each of these changes.

5. Assessment of CO2 Emissions by Changes in Building Form

5.1. Comparison of the Amount of Major Materials and an Assessment of CO2 Emissions

The bearing wall system of the reference case was changed to the ‘column and beam’ system and the changes in the amount of major materials were calculated using the quantity take-off function of the ArchiCAD BIM software. In addition, the quantity of materials per unit floor area was also assessed (Table 2). The materials used for each case were ready mixed concrete, rebar, cement bricks, tiles, expandable polystyrene, plasterboard, poly vinyl chloride (PVC) windows and glass. These elements make up 80% of CO2 emissions in Korean apartments [31]. In the alternative case, the use of cement bricks increased by 236%, porcelain tile (wall) by 3%, expandable polystyrene by 53% and plasterboard by 59.3%. These increases were caused by changes to the different building types, including the ‘column and beam’ system in the structural system and the ‘T-type’ block in the building form. However, substituting load-bearing walls for columns and beams decreased the use of concrete and rebar by 11% and 36%, respectively. The CO2 emissions for the reference case and the alternative case were calculated with SUSB–LCA (Table 3). The alternative case decreased CO2 emissions per unit floor area by 9.45% (to 853.63 kg-CO2/m2) compared to the reference case. This change was mainly due to the decreased use of rebar and concrete in the alternative case.

5.2. Assessment of Changes in CO2 Emissions Due to High Strength Concrete

The use of high-strength concrete may reduce LCCO2 emissions by both extending the building life as well as reducing the amount of concrete and rebar used in the structural members. In this chapter, we specifically analyzed the decrease in CO2 emissions due to life cycle extension, from 40 years in the reference case to 80 years in the alternative case.

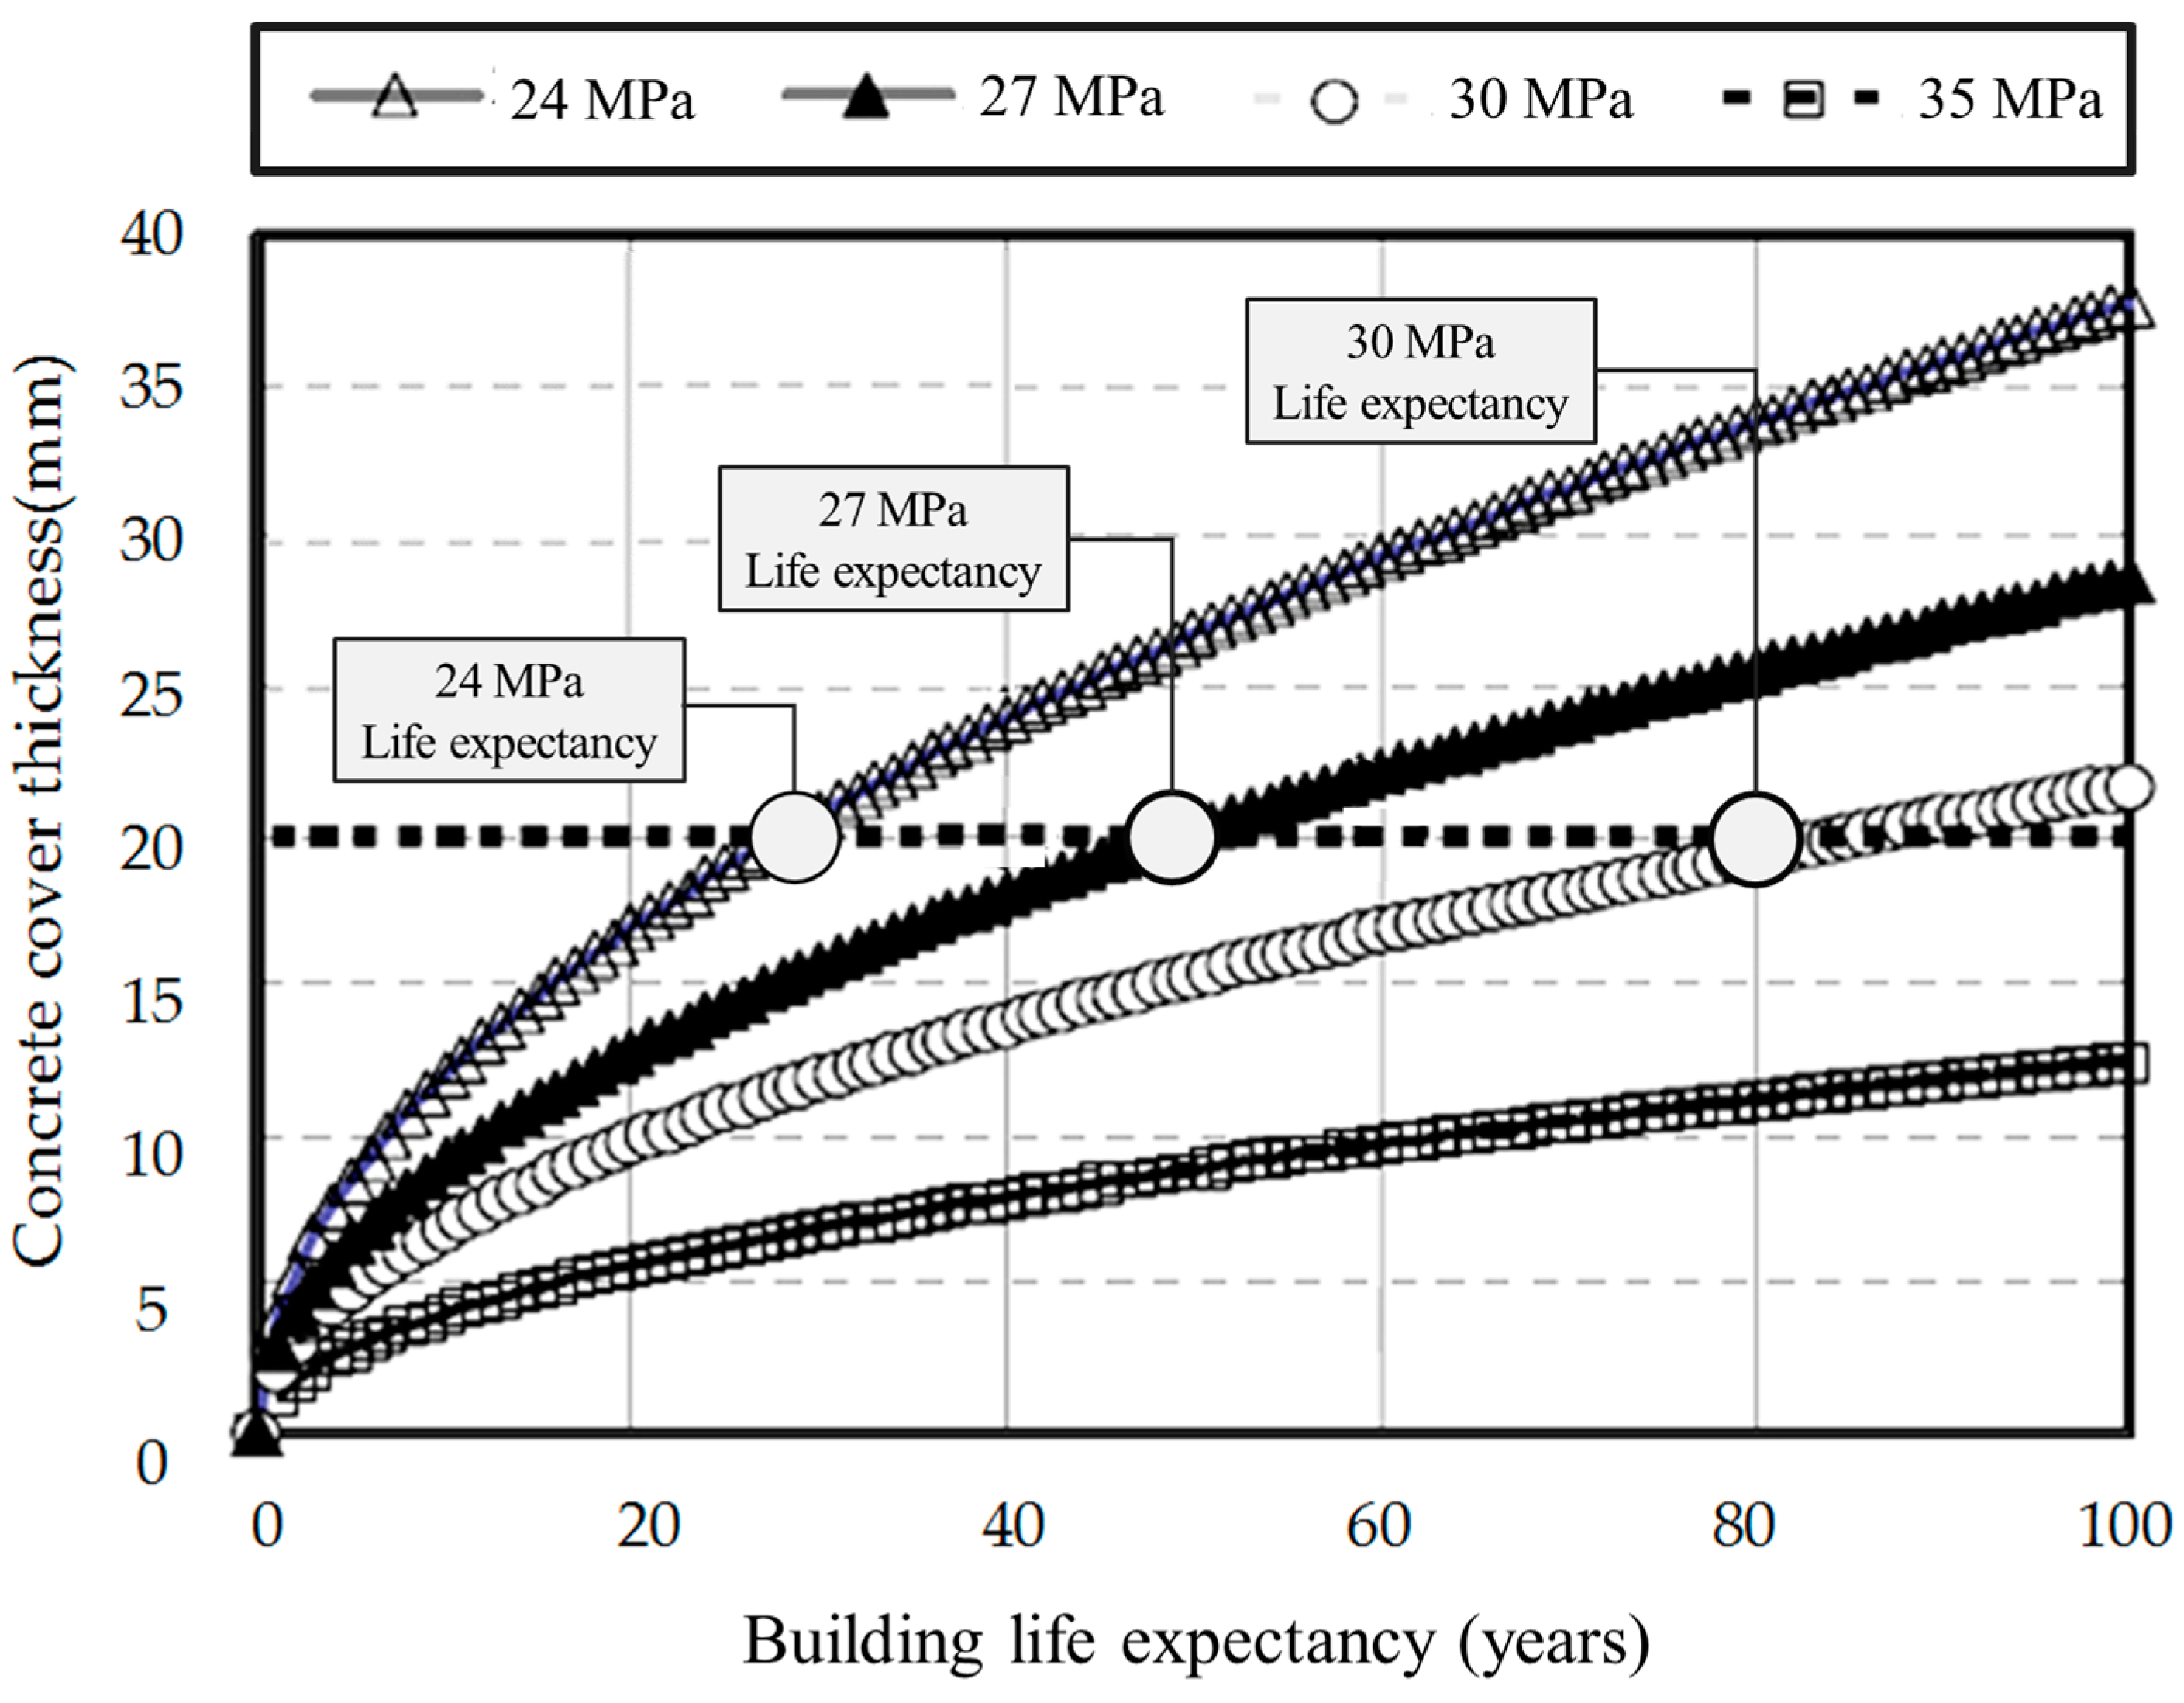
5.2.1. Consideration of the Building Life Cycle

To extend the building life cycle to 80 years, we considered the carbonation phenomenon. Carbonation is where CO2 in the atmosphere leaches into concrete and reacts with calcium hydroxide to form calcium carbonate, reducing the pH of the concrete pore solution down to 8.3–10.0. Once the pH inside the concrete is low, the rebar buried inside the concrete rusts thus decreasing its stability, and corrosion begins. Corrosion in rebar by carbonation is a representative deterioration phenomenon of reinforced concrete structures [31,32,33,34].
The infiltration rate of CO2 into concrete must be computed in order to compute the life cycle of the reinforced concrete in a carbonation environment. In general, it can be expressed as the square root of time, as shown in Equation (1). In addition, the velocity coefficient A used in Equation (1) is calculated from Equation (2), where A depends on: (1) the type of concrete; (2) the type of cement; (3) the water-cement ratio and (4) the temperature and humidity. The coefficient A for this study was determined using methods proposed by the Architectural Institute of Japan [35], and carbonation depth versus time was computed. Table 4 shows the values of the variables that determine the velocity coefficient of carbonation. We used the values shown in Table 4 to compute the carbonation velocity:
C = A t
A = α 1 × α 2 × α 3 × β 1 × β 2 × β 3
where C: Carbonation Depth (cm), A: Carbonation Velocity Coefficient, and t: Time (year).
Figure 4 shows an estimation of the carbonation velocity. Figure 4 illustrates that concrete with a strength of 30 MPa or less may suffer from steel corrosion as carbonation may occur in the rebar inside the concrete within 80 years (the target service life). Therefore, in order to rule out the necessity of structure repair within 80 years, concrete with a minimum strength of 35 MPa should be used.

5.2.2. Quantifying the Reduction of CO2 Emissions by Using High-Strength Concrete

Based on the results of the above rate of carbonation analysis, the effects of high-strength concrete were assessed with both cases (Table 5).
Case 1 represents the reference case and Case 2 represents the alternative case with repairs once every 40 years. Case 3 shows a situation in which no repair is required over the target life cycle (80 years) with the use of 35 MPa high-strength concrete. Case 4 shows a situation in which 20% blast furnace slag is substituted for the high-strength concrete in Case 3. Relatively more CO2 is emitted when high-strength concrete is used because the amount of cement used is increased compared to normal strength concrete. In order to solve this problem, methods such as substitution of a portion of the cement with industrial waste such as blast furnace slag have been proposed [36,37]. This study assumed a mixture with 20% blast furnace slag in the cement.
Based on the actual structural calculations on each case and the quantities of concrete and rebar required, the CO2 emissions were computed and compared (Table 6).
As for structural repair, partial repairs were assessed assuming that the entire repair is done in consideration of inefficiency of construction, and according to the Japan Society of Civil Engineers [38] research results, the CO2 emissions of materials consumed for one session of repair were set to 40% of CO2 emitted from the materials related to the structure for one session of new construction.
When high-strength concrete was used for the alternative cases (Cases 2 to 4), CO2 emissions of concrete and rebar were reduced by 21.08% compared to the reference case in Case 2 (structural repairs at 40 years), 35.39% in Case 3 (without structural repair) and 37.99% in Case 4 (when blast furnace slag is substituted at 20%).

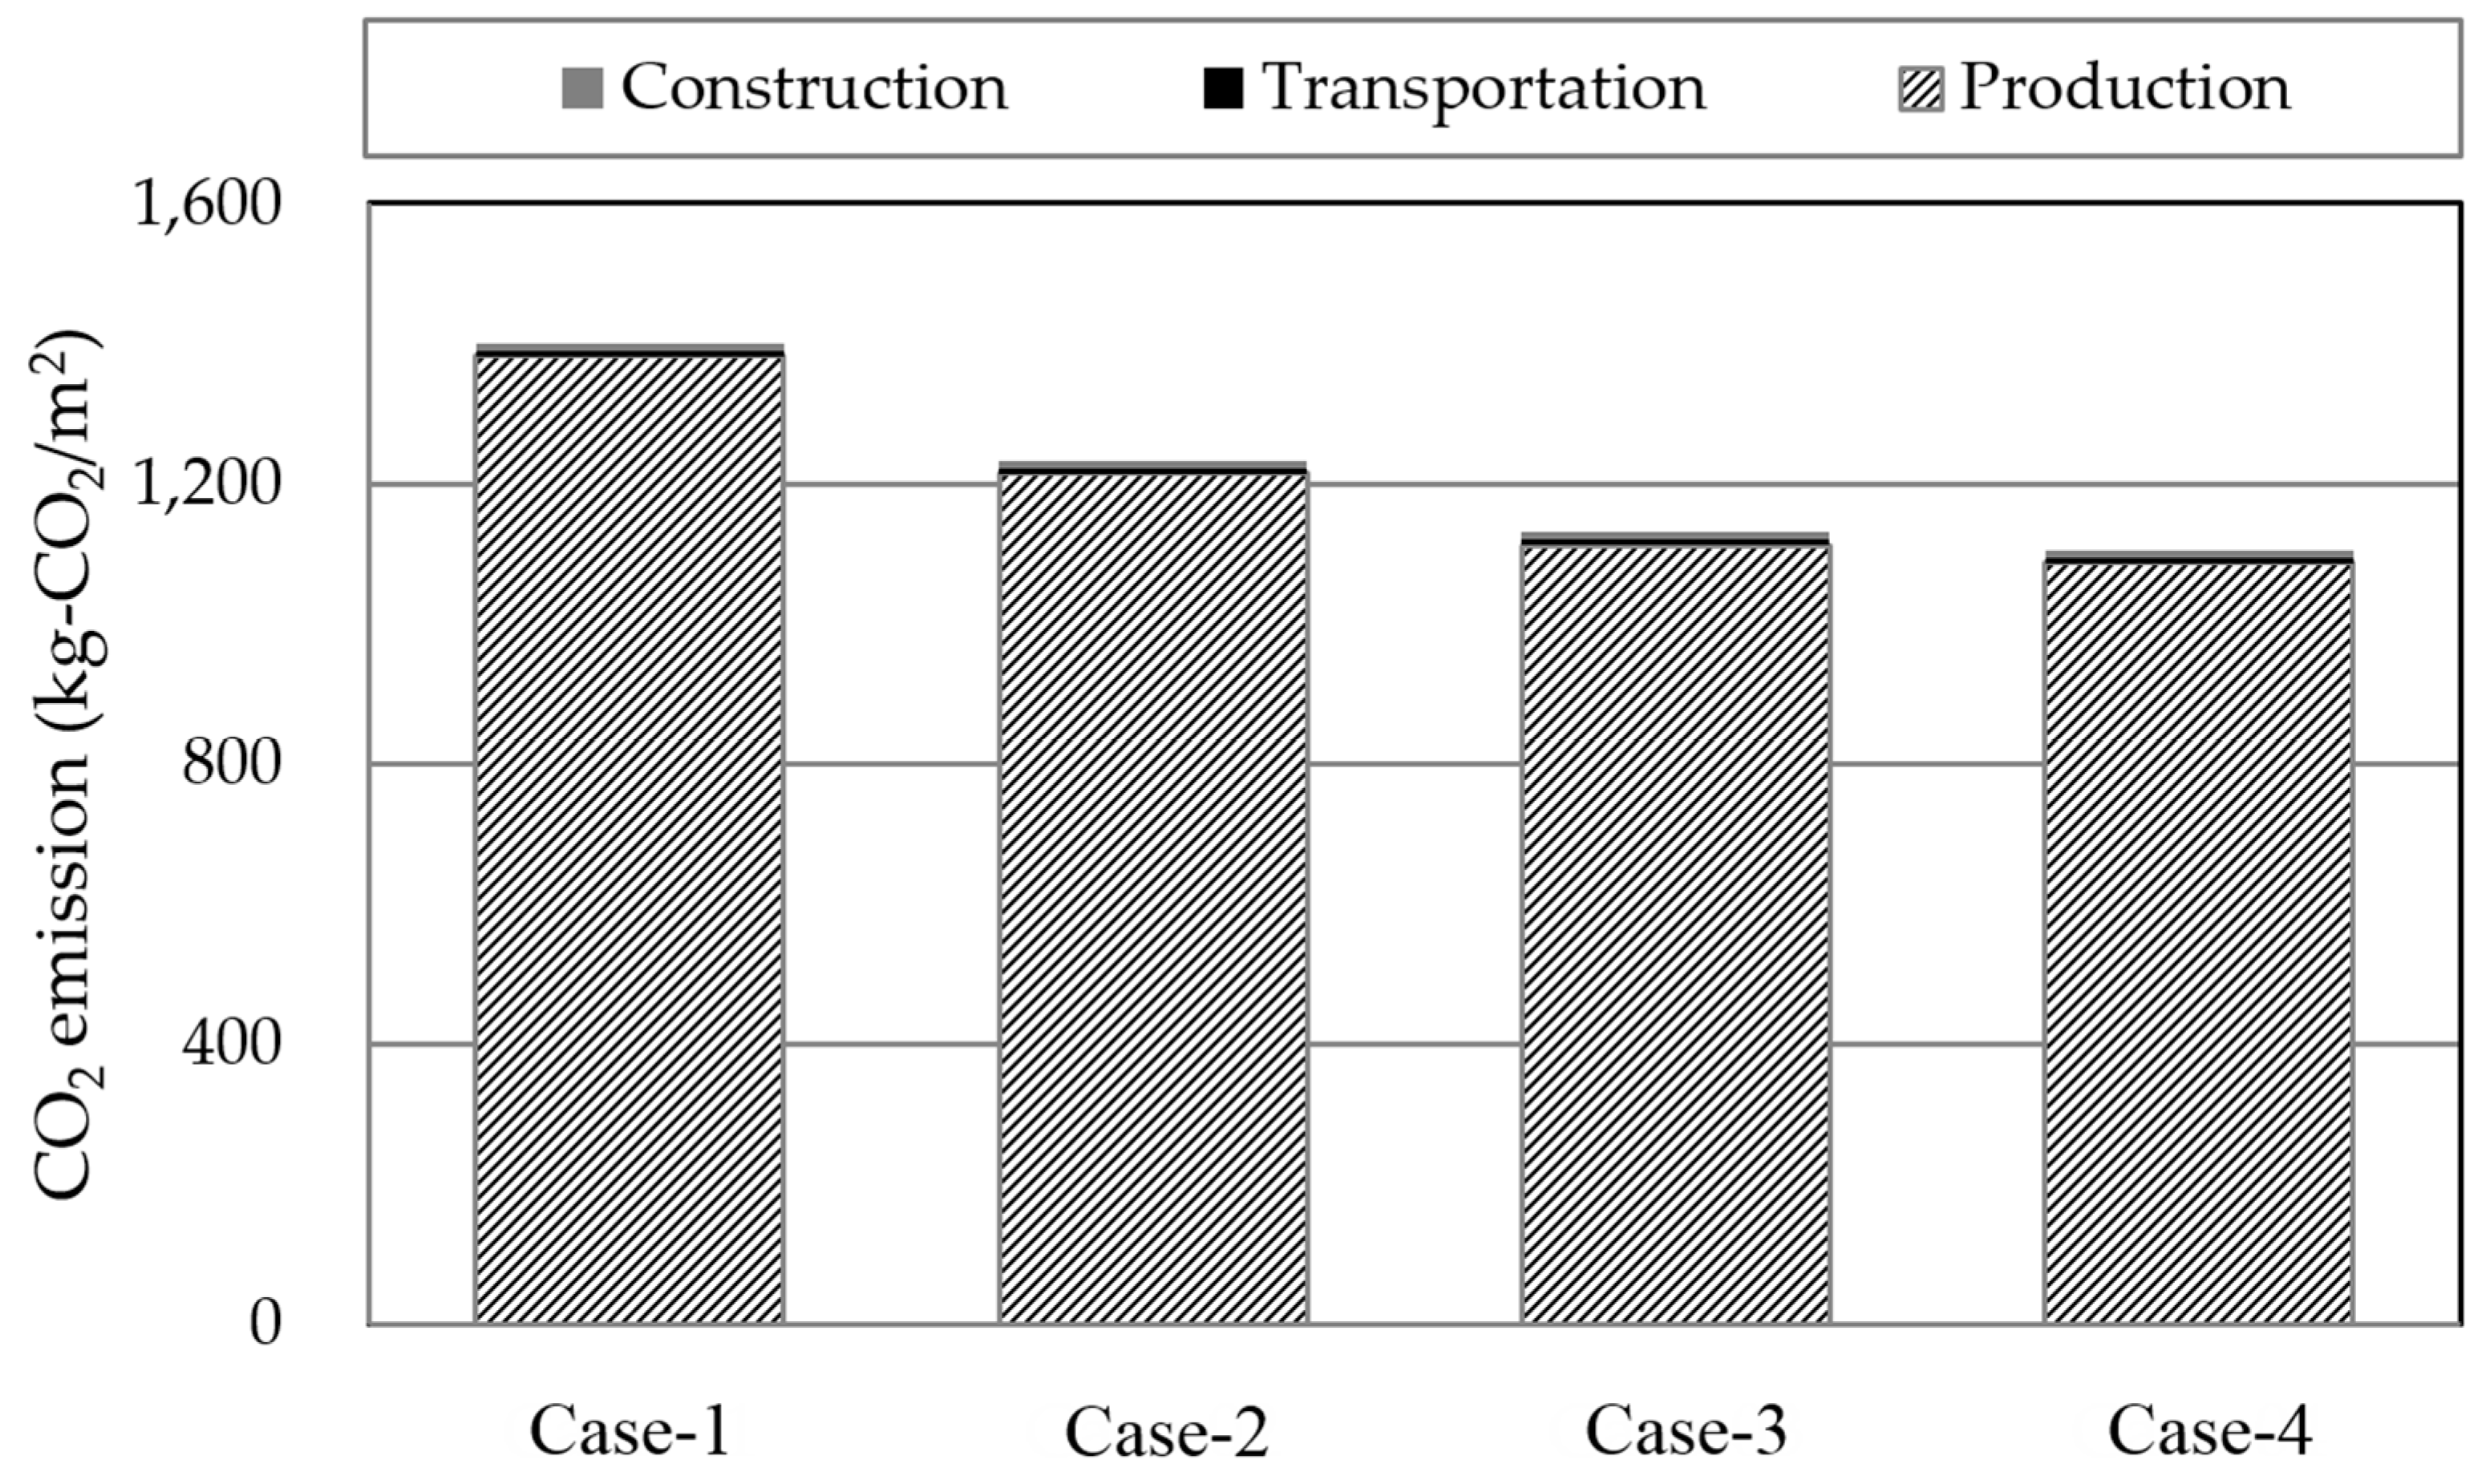
5.2.3. CO2 Emission for the Construction Stage

Based on our assessment of changes in CO2 emissions due to high-strength concrete, Figure 5 shows CO2 emissions of the construction stage, which is composed of emissions from construction works on the site (“Construction”), building material transportation to the site (“Transportation”), and building material production off the site (“Production”). As shown in Figure 5, Case 4 produced the least amount of emissions and Case 1 produced the most. In all cases, Production was the stage that produced the highest percentage of emissions.
Specifically, Case 2, which had the “column and beam” structural system, showed 11.98% fewer emissions than Case 1 (the reference case), which had the bearing wall structural system and less concrete and rebar. Therefore, the ‘column and beam’ structural system was effective at reducing CO2 emissions in the construction stage if the building blocks are in similar conditions. By design, Cases 3 and 4 used high-strength concrete and had twice the building life cycle than Case 1 and 2 (80 years vs. a repair at 40 years). Despite the shorter life cycle, Case 1 had 26.7% more emissions and Case 2 had 11.5% more CO2 emissions than Case 4.
We found that the effects of the structural systems on CO2 emissions were relatively large and that the ‘column and beam’ system was very effective at reducing CO2 emissions compared to the load-bearing wall system during the construction stage. In addition, applying high-strength concrete to apartment housing is advantageous for reducing not only building material amounts but also reducing the requirement for repairs due to extending the building’s life cycle.

5.3. Assessment of Energy Consumption and CO2 Emissions in the Operation Stage

ArchiCAD modeling files and the EcoDesigner add-on energy simulation program were used to assess changes in energy consumption in the operation stage. This study did not consider the reduction rate of operational energy effectiveness [39]. Both cases were simulated under the same conditions (see Table 7) in order to assess the energy consumption due to the different building forms, i.e., “flat-type” blocks and “T-type” blocks.
As for the heat transfer coefficient of the wall parts, both cases were set based on the regional energy code in Korea. The glass used in the windows was 6 mm thick double glazing with a heat transfer coefficient of 3.1 W/m2∙K, solar heat gain coefficient (SHGC) of 0.66 and infiltration of 3.06 L/m2.
Table 8 shows the calculated annual energy consumption and annual CO2 emissions depending on what direction the block is facing. These results were generated with the EcoDesigner energy simulation software.
When facing south, the energy used by the alternative case decreased 33.09% from the reference case. This was mainly due to the 24.9% reduction in the Surface to Volume ratio (S/V ratio), which is attributed to the 25.3% decrease in the envelope area by efficient design of four units per floor and one vertical circulation core of the alternative case. The wall area ratio was also raised from 61.30% to 67.49%.

5.4. Discussion about Assessment of CO2 Emissions for Building Life Cycle

To assess CO2 emissions during the whole life cycle of the building, all CO2 emissions should be totaled from the construction, operational and final stages of the building life cycle, with the final stage consisting of dismantling and disposal. In this chapter, we summarize all previous assessments of CO2 emissions on the reference case and the alternative cases including high-strength concrete alternatives.
Based on the assessments discussed in 5.2 and 5.3 as well as an additional Dismantling and Disposal Assessment, Figure 6 and Table 9 show LCCO2 emissions of all the test cases. LCCO2 emission of Case 4 was 4299 kg-CO2/m2, which consisted of 26% in the construction stage, 73% in the operational stage, and 1% in the dismantling and disposal stage. The total amount of emissions for Case 4 was 30% less than Case 1.
As shown in Figure 6, “Production” in the construction stage and “Occupancy” in the operational stage are the most significant contributors to LCCO2 emission. Therefore, applying effective CO2 emission-reducing technologies to these two sub stages will substantially reduce total LCCO2 emissions. In addition, CO2 emissions from heating the building and the electrical energy required for operation, both in the operation stage, and from “Production” in the construction stage also contribute a fair amount of LCCO2 emissions. The proportion of LCCO2 emissions from each stage of the life cycle is similar in all four cases.
As shown in Table 9, LCCO2 emissions in Case 2 were 27.8% less than that of Case 1, mainly because the operation stage produced 32.8% fewer emissions than Case 1. As we discussed in 5.3, the fewer emissions in the alternative cases stemmed from the different building forms: “flat-type” blocks vs. “T-type” blocks. Therefore, we recommend energy-efficient design strategies that optimize the S/V ratio and the wall area ratio in order to minimize the operational energy requirements and LCCO2 emissions.
Applying high-strength concrete as well as a “column and beam” system led to only a 2.9% decrease in total LCCO2 emission, but a 26.7% reduction in the construction stage is not a small portion of LCCO2 emission. There is a reason that this amount is usually ignored in the construction process of apartment buildings. When apartment housing is planned and constructed initially, developers generally try to reduce the initial construction costs and do not consider LCCO2 emissions. However, when the building is constructed with normal concrete rather than high-strength concrete, the building generally requires normal repairs after approximately 40 years. Although initially cheaper, normal concrete will lead to more CO2 emissions through the whole building life cycle and lower the quality of the structure.
Based on the comparison of block types, we highly recommend the combination of an effective structural system such as the ‘column and beam’ system with a long life cycle technology such as high-strength concrete to help reduce LCCO2 emissions in apartment housing projects. Our results indicate that the block type and system structure have significant impacts on building environmental load over its lifecycle, and significantly contribute to optimal greenhouse gas reduction. Therefore, it is expected that the assessment process of CO2 emission based on the change in shapes of multi-unit dwellings that are examined in this research would be applicable in other countries, including Korea, as an alternative technique for estimating and assessing the environment performance of apartment houses. However, the regional applicability range could be comparatively limited as the established database of the research is based on the actual data of multi-unit dwellings that are built in Korea.

6. Conclusions

This paper assessed LCCO2 emissions when an apartment building in Korea with ‘flat-type’ blocks (the reference case) was changed to a more sustainable ‘T-type’ block structure with fewer CO2 emissions (the alternative case) while maintaining the same total floor area. The quantity of building materials used and building energy simulations were analyzed with each block type using BIM techniques, and the LCCO2 was calculated with high-strength concrete alternatives. The conclusions are as follows:
  • By changing the bearing wall system of the ‘flat-type’ block to the ‘column and beam’ system of the ‘T-type’ block, the alternative case decreased the concrete and rebar used by 11% and 36%, respectively, compared with the ba3se case and as a result, CO2 emission decreased by 9.45%.
  • When concrete strength was raised in order to decrease carbonation and increase durability in the ‘T-type’ block, CO2 emissions of the concrete and rebar in the alternative case decreased by 35.39% compared with the reference case. Moreover, there was an additional 2.6% reduction when the blast furnace slag was substituted at 20%.
  • By changing the building forms, the envelope volume ratio of the ‘T-type’ block decreased by 24% compared with the ‘flat-type’ block and, as a result, the CO2 emissions of the alternative case during the operation stage decreased by 33.1%.
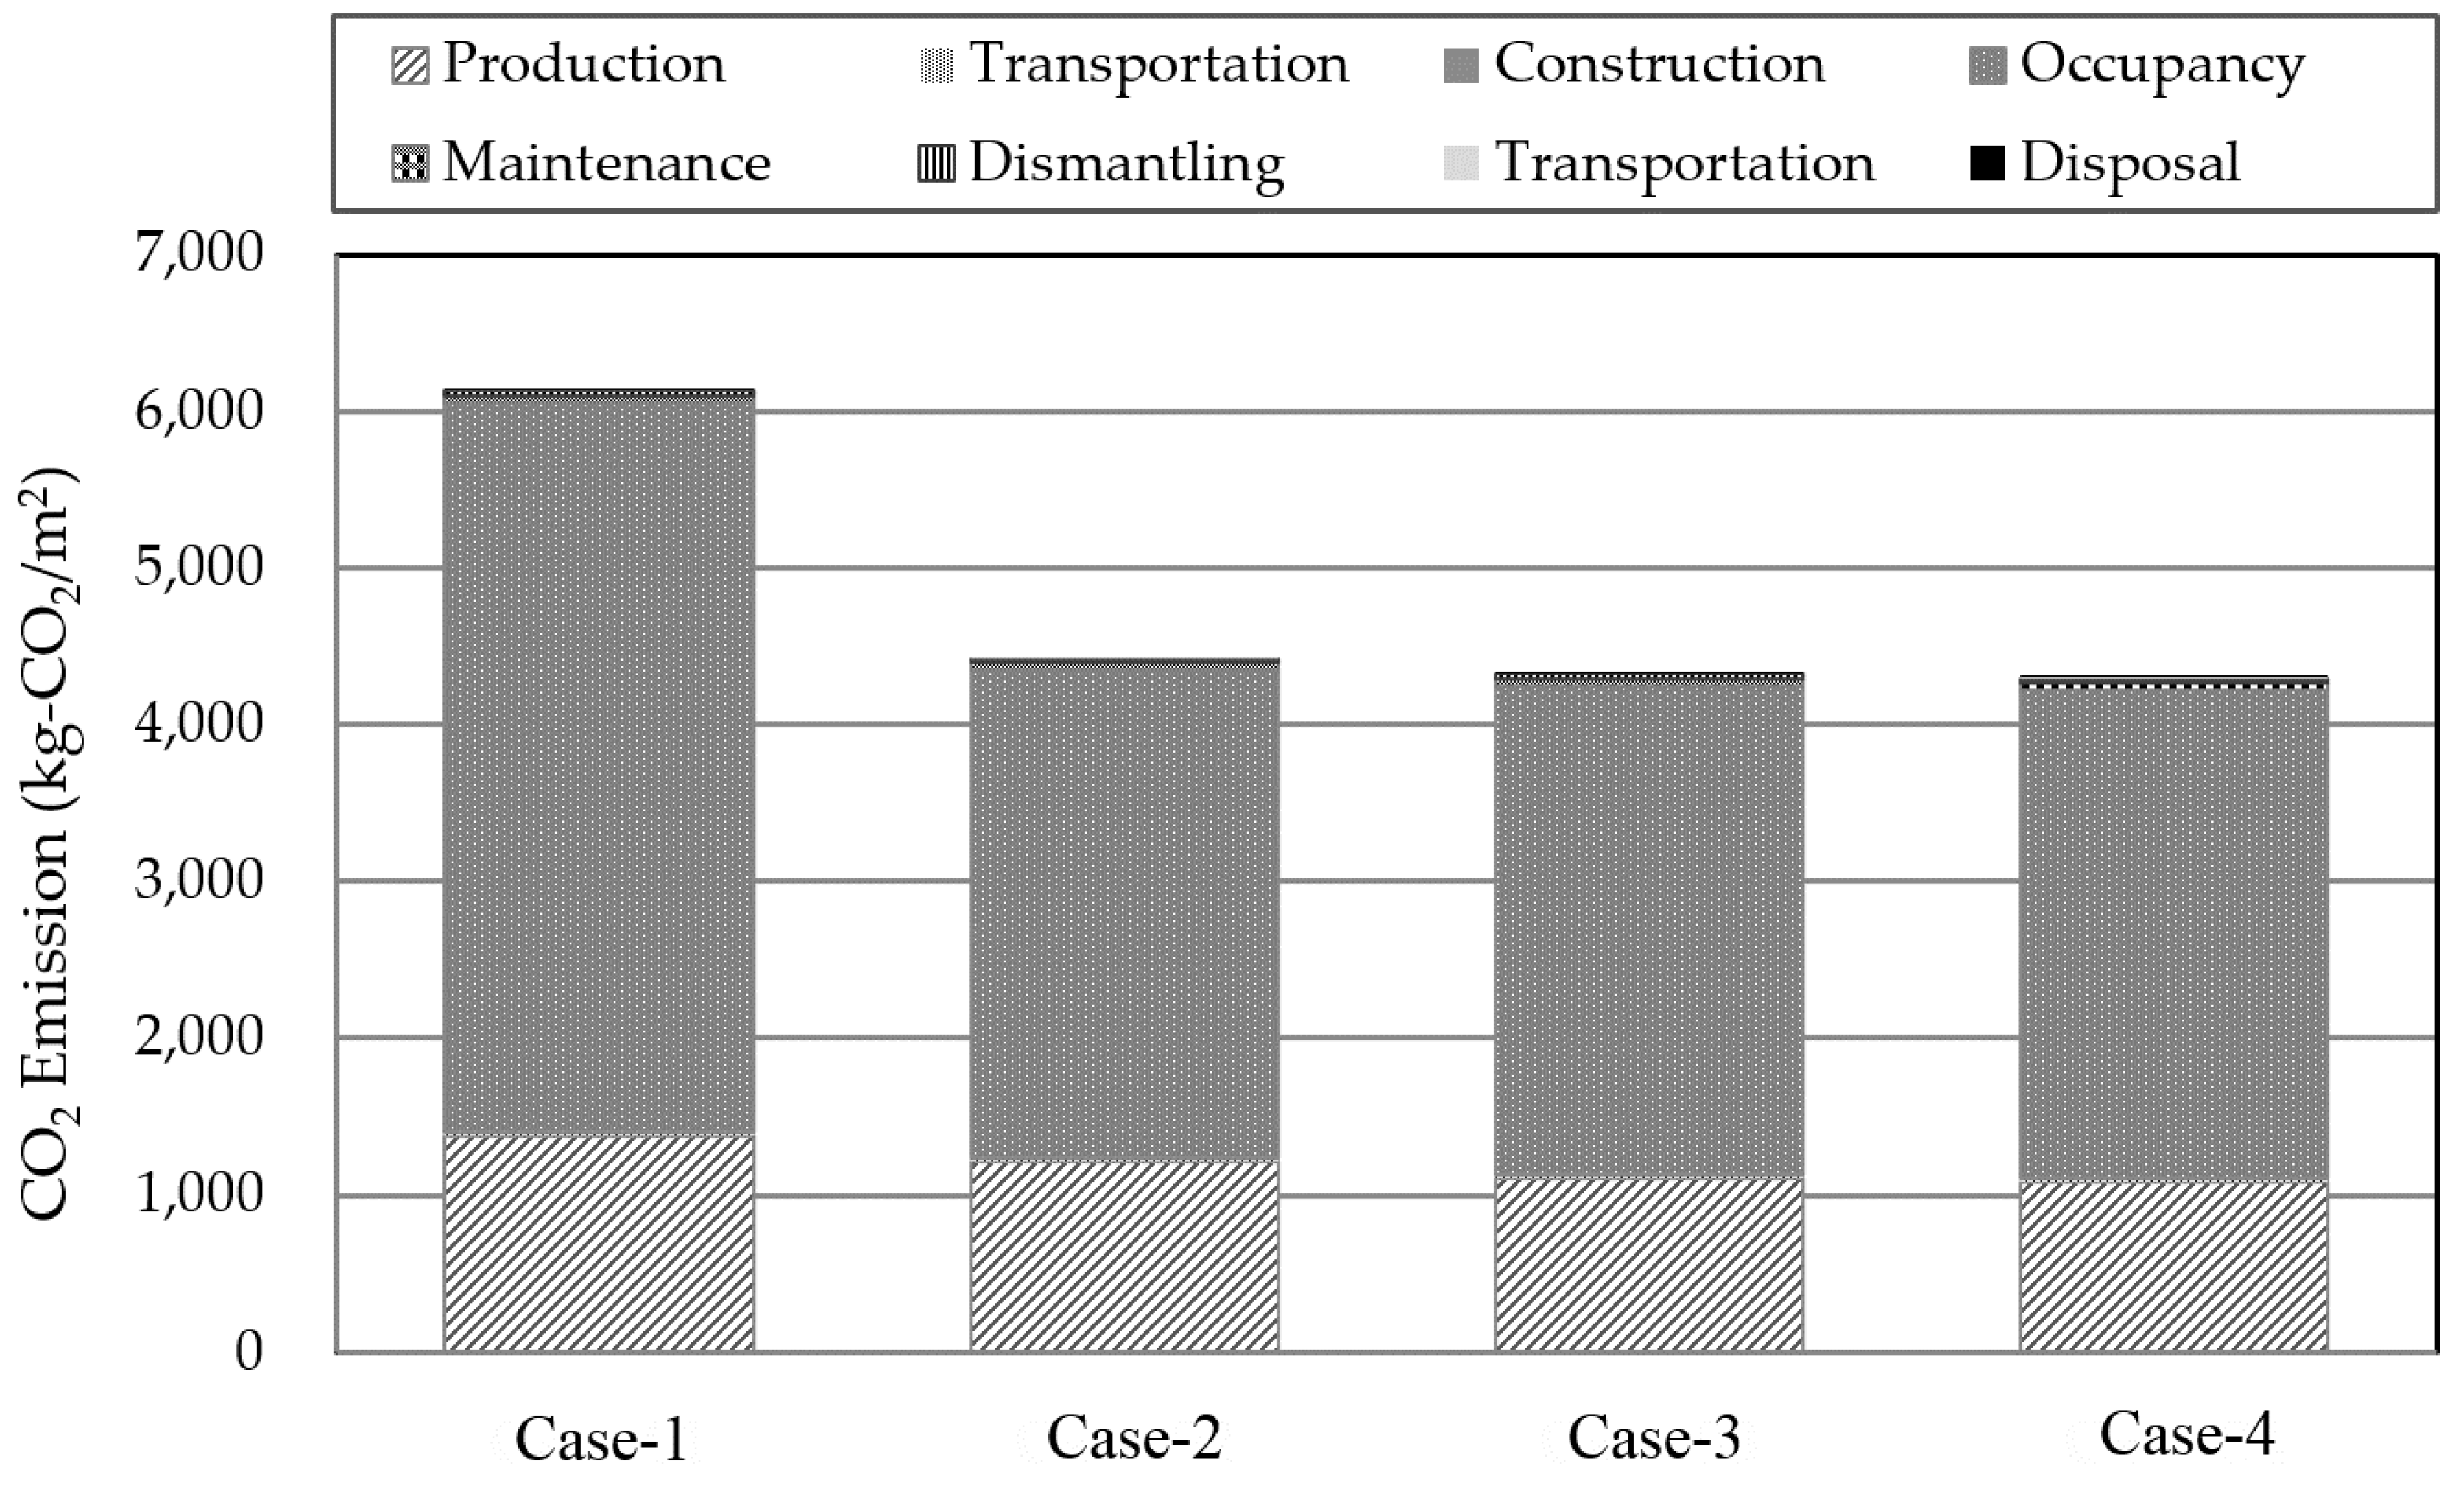
  • LCCO2 emission of Case 4 was 4299 kg-CO2/m2, which consisted of 26% of the construction stage, 73% of the operational stage, and 1% of the dismantling and disposal stage. The total emissions were 30% less than Case 1.

Acknowledgments

This research was supported by Basic Science Research Program through the National Research Foundation of Korea (NRF) funded by the Ministry of Science, ICT & Future Planning (No. 2015R1A5A1037548, No. 2015R1D1A1A01057925).

Author Contributions

The paper was written by Cheonghoon Baek and revised by Sungho Tae. Rakhyun Kim and Sungwoo Shin conducted the experimental and analytical work. All authors contributed to the analysis and approved the final manuscript.

Conflicts of Interest

The authors declare no conflict of interest.

References

  1. Cabeza, L.; Rincon, L.; Vilarino, V.; Perez, G.; Castell, A. Life cycle assessment (LCA) and life cycle energy analysis (LCEA) of buildings and the building sector: A review. Renew. Sustain. Energy Rev. 2014, 29, 394–416. [Google Scholar] [CrossRef]
  2. Dixit, M.; Culp, C.; Fernandez-Solis, J. System boundary for embodied energy in buildings: A conceptual model for definition. Renew. Sustain. Energy Rev. 2013, 21, 153–164. [Google Scholar] [CrossRef]
  3. International Energy Agency (IEA). Energy Technology Perspectives 2010; OECD/IEA: Washington, DC, USA, 2010. [Google Scholar]
  4. UNEP. Overview of the Republic of Korea’s National Strategy for Green Growth. 2010. Available online: http://www.unep.org/PDF/PressReleases/201004_UNEP_NATIONAL_STRATEGY.pdf (accessed on 25 July 2016).
  5. Tae, S.; Shin, S. Current Work & Future Trends for Sustainable Buildings in South Korea. Renew. Sustain. Energy Rev. 2009, 13, 1910–1921. [Google Scholar]
  6. Yi, I.S.; Seo, K.S. Social Indicators in Korea; National Statistical Office: Seoul, Korea, 2010. [Google Scholar]
  7. Federica, C.; Idiano, D.; Massimo, G. Sustainable management of waste-to-energy facilities. Renew. Sustain. Energy Rev. 2014, 33, 719–728. [Google Scholar]
  8. March, L.; Trace, M. The Land-Use Performances of Selected Arrays of Built Forms, Land Use and Built form Studies; University of Cambridge: Cambridge, UK, 1968. [Google Scholar]
  9. Fathy, H. Natural Energy and Vernacular Architecture; The University of Chicago Press: Chicago, IL, USA, 1986. [Google Scholar]
  10. Berköz, E. Energy Efficient Building and Settlement Design; Research Report, INTAG 201; The Scientific and Technical Research Council of Turkey: Istanbul, Turkey, 1995; pp. 98–138. [Google Scholar]
  11. Givoni, B. Climate Considerations in Buildings; Van Nostrand Reinhold: Hoboken, NJ, USA, 1998. [Google Scholar]
  12. Ratti, C.; Raydan, D.; Steemers, K. Building form and environmental performance: Archetypes, and arid climate. Energy Build. 2003, 35, 49–59. [Google Scholar] [CrossRef]
  13. Ba, G.; Gong, G. Research on passive solar ventilation and building self-sunshading. In Proceedings of the International Conference on Computer Distributed Control and Intelligent Environmental Monitoring, CDCIEM, Changsha, China, 19–20 February 2011; pp. 950–953.
  14. International Organization for Standardization. ISO 14040: Environmental Management-Life Cycle Assessment-Principles and Framework; ISO: Geneva, Switzerland, 2006. [Google Scholar]
  15. Ali, H.H.; Nsairat, S.A. Developing a green building assessment tool for developing countries—Case of Jordan. Build. Environ. 2009, 44, 1053–1064. [Google Scholar] [CrossRef]
  16. Haapio, A.; Viitaniemi, P. A critical review of building environmental assessment tools. Environ. Impact Assess. Rev. 2008, 28, 469–482. [Google Scholar] [CrossRef]
  17. Sharifi, A.; Murayama, A. A critical review of seven selected neighborhood sustainability assessment tools. Environ. Impact Assess. Rev. 2013, 38, 73–87. [Google Scholar] [CrossRef]
  18. Shin, S.; Tae, S.; Woo, J.; Roh, S. The development of apartment house life cycle CO2 simple assessment system using standard apartment houses of South Korea. Renew. Sustain. Energy Rev. 2011, 15, 1454–1467. [Google Scholar]
  19. Jukka, H.; Antti, S.; Juha-Matti, J.; Amalia, P.; Seppo, J. Pre-use phase LCA of a multi-story residential building: Can greenhouse gas emissions be used as a more general environmental performance indicator? Build. Environ. 2016, 95, 116–125. [Google Scholar]
  20. Saxena, A.; Sethi, M.; Varun, V. Life cycle assessment of buildings: A review. Renew. Sustain. Energy Rev. 2011, 15, 871–875. [Google Scholar]
  21. Hakkinen, T.; Huovila, P.; Tattari, K. Eco-efficient Building Process, VTT ProP Systematics on Building Headings. 2001. Available online: http://virtual.vtt.fi/virtual/environ/sb02-eco-efficient%20b_process2.pdf (accessed on 25 July 2016).
  22. Roh, S.; Tae, S.; Shin, S.; Woo, J. Development of an optimum design program (SUSB-OPTIMUM) for the life cycle CO2 assessment of an apartment house in Korea. Build. Environ. 2014, 73, 40–54. [Google Scholar] [CrossRef]
  23. Watson, P.; Mitchell, P.; Jones, D. Environmental Assessment for Commercial Buildings: Stakeholder Requirements and Tool Characteristics, Environmental Assessment Systems for Commercial Buildings. 2004. Available online: http://www.sbenrc.com.au/wp-content/uploads/2013/10/20-environmentalassessmentforcommercialbuildings.pdf (accessed on 25 July 2016).
  24. Baek, C.; Park, S.; Suzuki, M.; Lee, S. Life cycle carbon dioxide assessment tool for buildings in the schematic design phase. Energy Build. 2013, 611, 75–87. [Google Scholar] [CrossRef]
  25. AIA. AIA Guide to Building Life Cycle Assessment in Practice; The American Institute of Architects: Washington, DC, USA, 2010. [Google Scholar]
  26. ATHENA Sustainable Materials Institute—Athena EcoCalcuator. Available online: http://calculatelca.com/software/ecocalculator (accessed on 25 July 2016).
  27. US Life Cycle Inventory Database. Available online: http://www.nrel.gov/lci (accessed on 25 July 2016).
  28. Lee, K.; Tae, S.; Shin, S. Development of a Life Cycle Assessment Program for building (SUSB-LCA) in South Korea. Renew. Sustain. Energy Rev. 2009, 13, 1994–2002. [Google Scholar] [CrossRef]
  29. Lombera, J.S.; Rojo, J.C. Industrial building design stage based on a system approach to their environmental sustainability. Constr. Build. Mater. 2010, 24, 438–447. [Google Scholar] [CrossRef]
  30. Tae, S.; Baek, C.; Shin, S. Life cycle CO2 evaluation on reinforced concrete structure with high-strength concrete. Environ. Impact Assess. Rev. 2011, 31, 253–260. [Google Scholar] [CrossRef]
  31. Shin, S.; Tae, S.; Woo, J.; Roh, S. The development of environmental load evaluation system of a standard Korean apartment house. Renew. Sustain. Energy Rev. 2011, 15, 1239–1249. [Google Scholar] [CrossRef]
  32. Sisomphon, K.; Franke, L. Carbonation rates of concrete containing high volume of pozzolanic materials. Cem. Concr. Res. 2007, 37, 1647–1653. [Google Scholar] [CrossRef]
  33. Chang, C.F.; Chen, J.W. The experimental investigation of concrete carbonation depth. Cem. Concr. Res. 2006, 36, 1760–1767. [Google Scholar] [CrossRef]
  34. Tae, S.; Ujiro, T. A study on the corrosion resistance of Cr-bearing rebar in mortar in corrosive environments involving chloride attack and carbonation. ISIJ Int. 2007, 47, 715–722. [Google Scholar] [CrossRef]
  35. AIJ (Architectural Institute of Japan). Recommendations for Durability Design and Construction Practice of Reinforced Concrete; Architectural Institute of Japan: Tokyo, Japan, 2004. (In Japanese) [Google Scholar]
  36. Yuksel, I.; Bilir, T.; Ozkan, O. Durability of concrete incorporating non-ground blast furnace slag and bottom ash as fine aggregate. Build. Environ. 2007, 42, 2676–2685. [Google Scholar] [CrossRef]
  37. Robeyst, N.; Gruyaert, E.; Grosse, C.U.; Belie, N.D. Monitoring the setting of concrete containing blast-furnace slag by measuring the ultrasonic p-wave velocity. Cem. Concr. Res. 2008, 38, 1169–1176. [Google Scholar] [CrossRef]
  38. JSCE (Japan Society of Civil Engineers). Standard Specifications of Concrete—Part Maintenance; Japan Society of Civil Engineers: Tokyo, Japan, 2004. (In Japanese) [Google Scholar]
  39. The Energy Information Administration (EIA). Annual Energy Outlook—Fossil Fuels Remain Dominant through 2040; EIA: Washington, DC, USA, 2014. [Google Scholar]
Figure 1. Process of life cycle CO2 assessment.
Sustainability 08 00752 g001
Figure 2. The plan drawing and the bird’s eye view of the reference floor of the reference case. (a) plan drawing of the reference floor; (b) bird’s eye view.
Sustainability 08 00752 g002
Figure 3. The plan drawing and bird’s eye view of the reference floor of the alternative case. (a) reference floor plan drawing; (b) aerial view.
Sustainability 08 00752 g003
Figure 4. Results of carbonation velocity for each concrete strength.
Sustainability 08 00752 g004
Figure 5. CO2 emissions for the construction stage.
Sustainability 08 00752 g005
Figure 6. CO2 emissions during the building life cycle.
Sustainability 08 00752 g006
Table 1. Building overview.
CategoryContents
Building SizeAbove Ground 35 Stories, Basement 3 Stories
Structural systemReference case: reinforced concrete, bearing wall structure
Alternative case: reinforced concrete, column and beam structure
Concrete compressive strengthReference case: Classified into 4 segments: 24, 27, 30, 35 MPa
Alternative case: Classified into 4 segments: 24, 30, 40, 50 MPa
OthersConcrete and rebar quantities were reviewed comparatively based on the sum of the horizontal and vertical members.
Table 2. Comparisons of the major materials required for the reference case and the alternative case.
MaterialsReference Case
(70 Households, Total Floor Area:
11,400.9 m2)
Alternative Case
(140 Households, Total Floor Area:
19,302.5 m2)
TotalQuantity per Unit AreaTotalQuantity per Unit Area
Concrete
Slab3256.68 m30.2856 m3/m25999.35 m30.3108 m3/m2
Column--2207.45 m30.1143 m3/m2
Beam--1388.93 m30.0719 m3/m2
Wall4706.8 m30.4128 m3/m22350.6 m30.1217 m3/m2
Total7963.48 m30.6984 m3/m211,946.33 m30.6189 m3/m2
Rebar944,656 kg82.8 kg/m21026.080 kg53.1 kg/m2
Cement brick506,832 EA44.455 EA/m22,883,571 EA149.388 EA/m2
Tile
Porcelain tile (floor)64,680 kg5.673 kg/m291,272 kg4.7285 kg/m2
Porcelain tile (wall)74,760 kg6.557 kg/m2130,416 kg6.7564 kg/m2
Expandable polystyrene7949.4 kg0.6972 kg/m220,599.5 kg1.0671 kg/m2
Plasterboard154,918.4 kg13.5882 kg/m2417,826.5 kg21.6462 kg/m2
PVC windows11,945.85 kg1.0477 kg/m217,159.29 kg0.8889 kg/m2
Glass6877.77 m20.6032 m2/m27466.25 m20.3868 m2/m2
Table 3. Comparisons of the CO2 emissions of the reference case and the alternative case.
MaterialsUnitCO2 Emissions Unit (kg-CO2/Unit)Reference CaseAlternative Case
CO2 Emissions (kg-CO2)CO2 Emissions (kg-CO2/m2)CO2 Emission (kg-CO2)CO2 Emissions (kg-CO2/m2)
Concrete
24 MPam3329.371,471,295.79129.052,433,385.56126.07
27 MPam3353.02332,191.8229.140.000.00
30 MPam3383.77516,170.6545.27749,502.8138.83
35 MPam3406.71492,119.1043.160.000.00
40 MPam3429.650.000.00559,404.3028.98
50 MPam3508.390.000.00661,923.7834.29
Rebarkg3.843,627,479.04318.173,940,147.20204.13
Cement BlockEA0.27136,844.6412.00778,564.1740.33
Tilekg13.801,924,272.00168.783,059,294.40158.49
Expandable Polystyrenekg12.73101,195.868.88262,231.6413.59
Plasterboardkg4.45689,386.8860.471,859,327.9396.33
PVC Windowskg12.10144,544.7912.68207,627.4110.76
Glassm227.33187,969.4516.49204,052.6110.57
Total10,748,180.97942.7515,988,617.15853.63
Table 4. Variables of carbonation velocity coefficient A.
VariableDetailsApplied Value
α1Concrete typeNormal concrete → 1
α2Cement typeNormal concrete → 1
α3Water to binder ratioW/B = 0.6 → 0.22
β1TemperatureAnnual average temperature 15.9 °C → 1
β2HumidityAnnual average humidity 63% → 1
β3Carbon dioxide concentrationCO2 concentration 0.05% → 1
Table 5. Overview of the applications of high-strength concrete.
Case-1
(Reference Case)
Case-2
(Alternative Case 1)
Case-3
(Alternative Case 2)
Case-4
(Alternative Case 3)
Structural systembearing wallcolumns and beamscolumns and beamscolumns and beams
If carbonation is considered or notNot consideredNot consideredConsideredConsidered
Concrete strength24, 27, 30, 35 MPa24, 30, 40, 50 MPa35, 40, 50 MPa35, 40, 50 MPa
Whole repairOnceOnceUnnecessaryUnnecessary
Blast furnace slagNot usedNot usedNot usedUsed (substitution rate 20%)
Table 6. CO2 emissions of concrete and rebar by whether high-strength concrete is applied or not.
UnitCase-1
(Reference Case)
Case-2
(Alternative Case 1)
Case-3
(Alternative Case 2)
Case-4
(Alternative Case 3)
VolumeCO2 Emission (kg-CO2/m2)VolumeCO2 Emission (kg-CO2/m2)VolumeCO2 Emission (kg-CO2/m2)VolumeCO2 Emission (kg-CO2/m2)
Concrete24 MPam34467129.057388126.07----
27 MPam394129.14------
30 MPam3134545.27195333.83----
35 MPam3121043.16--9301195.989301183.00
40 MPam3--130228.98130228.98130227.00
50 MPam3--130234.29130234.29130232.00
Repair--98.65-91.270-0-
Sub-totalm37963345.2811,945319.4411,905259.2511,905242.00
Rebarkg944,656318.171,026,080204.13851,646169.42851,646169.42
Total-663.45-523.57-428.68-411.42
Ratio of reduction over case 121.08%35.39%37.99%
Table 7. EcoDesigner input data for each case.
Mechanical Electrical and Plumbing SystemValue
Heating and CoolingHot Water Generation60 °C
Cooling TypeNatural
VentilationVentilation TypeNatural
Air Change per Hour0.7 times/hour
Energy SourceHeatingNatural Gas
Other energy useElectricity
Table 8. Annual energy consumption and CO2 emissions per unit area.
Facing DirectionAnnual Energy ConsumptionAnnual CO2 Emission
Reference caseSouth130.848 kWh/m226.43 kgCO2/m2
Southeast134.234 kWh/m227.11 kg CO2/m2
Southwest137.592 kWh/m227.79 kg CO2/m2
Alternative caseSouth87.547 kWh/m217.68 kg CO2/m2
Table 9. Life cycle CO2 emissions.
CO2 Assessment StageLCCO2 Emissions (kg-CO2/m2)
Case-1Case-2Case-3Case-4
ConstructionProduction1381.521213.831111.871086.59
Transportation7.397.397.397.39
Construction10.9610.9610.9610.96
Sub-total1399.871232.191130.221104.95
OperationOccupancy4656.103115.273115.273115.27
Maintenance42.4042.4042.4042.40
Sub-total4698.503157.673157.673157.67
Dismantling and DisposalDismantling32.4032.4032.4032.40
Transportation3.603.603.603.60
Disposal0.580.580.580.58
Sub-total36.5836.5836.5836.58
TOTAL6134.954426.444324.474299.20

