
Evaluation Analysis of the CO2 Emission and Absorption Life Cycle for Precast Concrete in Korea

Abstract
:1. Introduction
2. Literature Review
2.1. CO2 Emission of Precast Concrete
2.2. Carbonation and Absorption of Precast Concrete
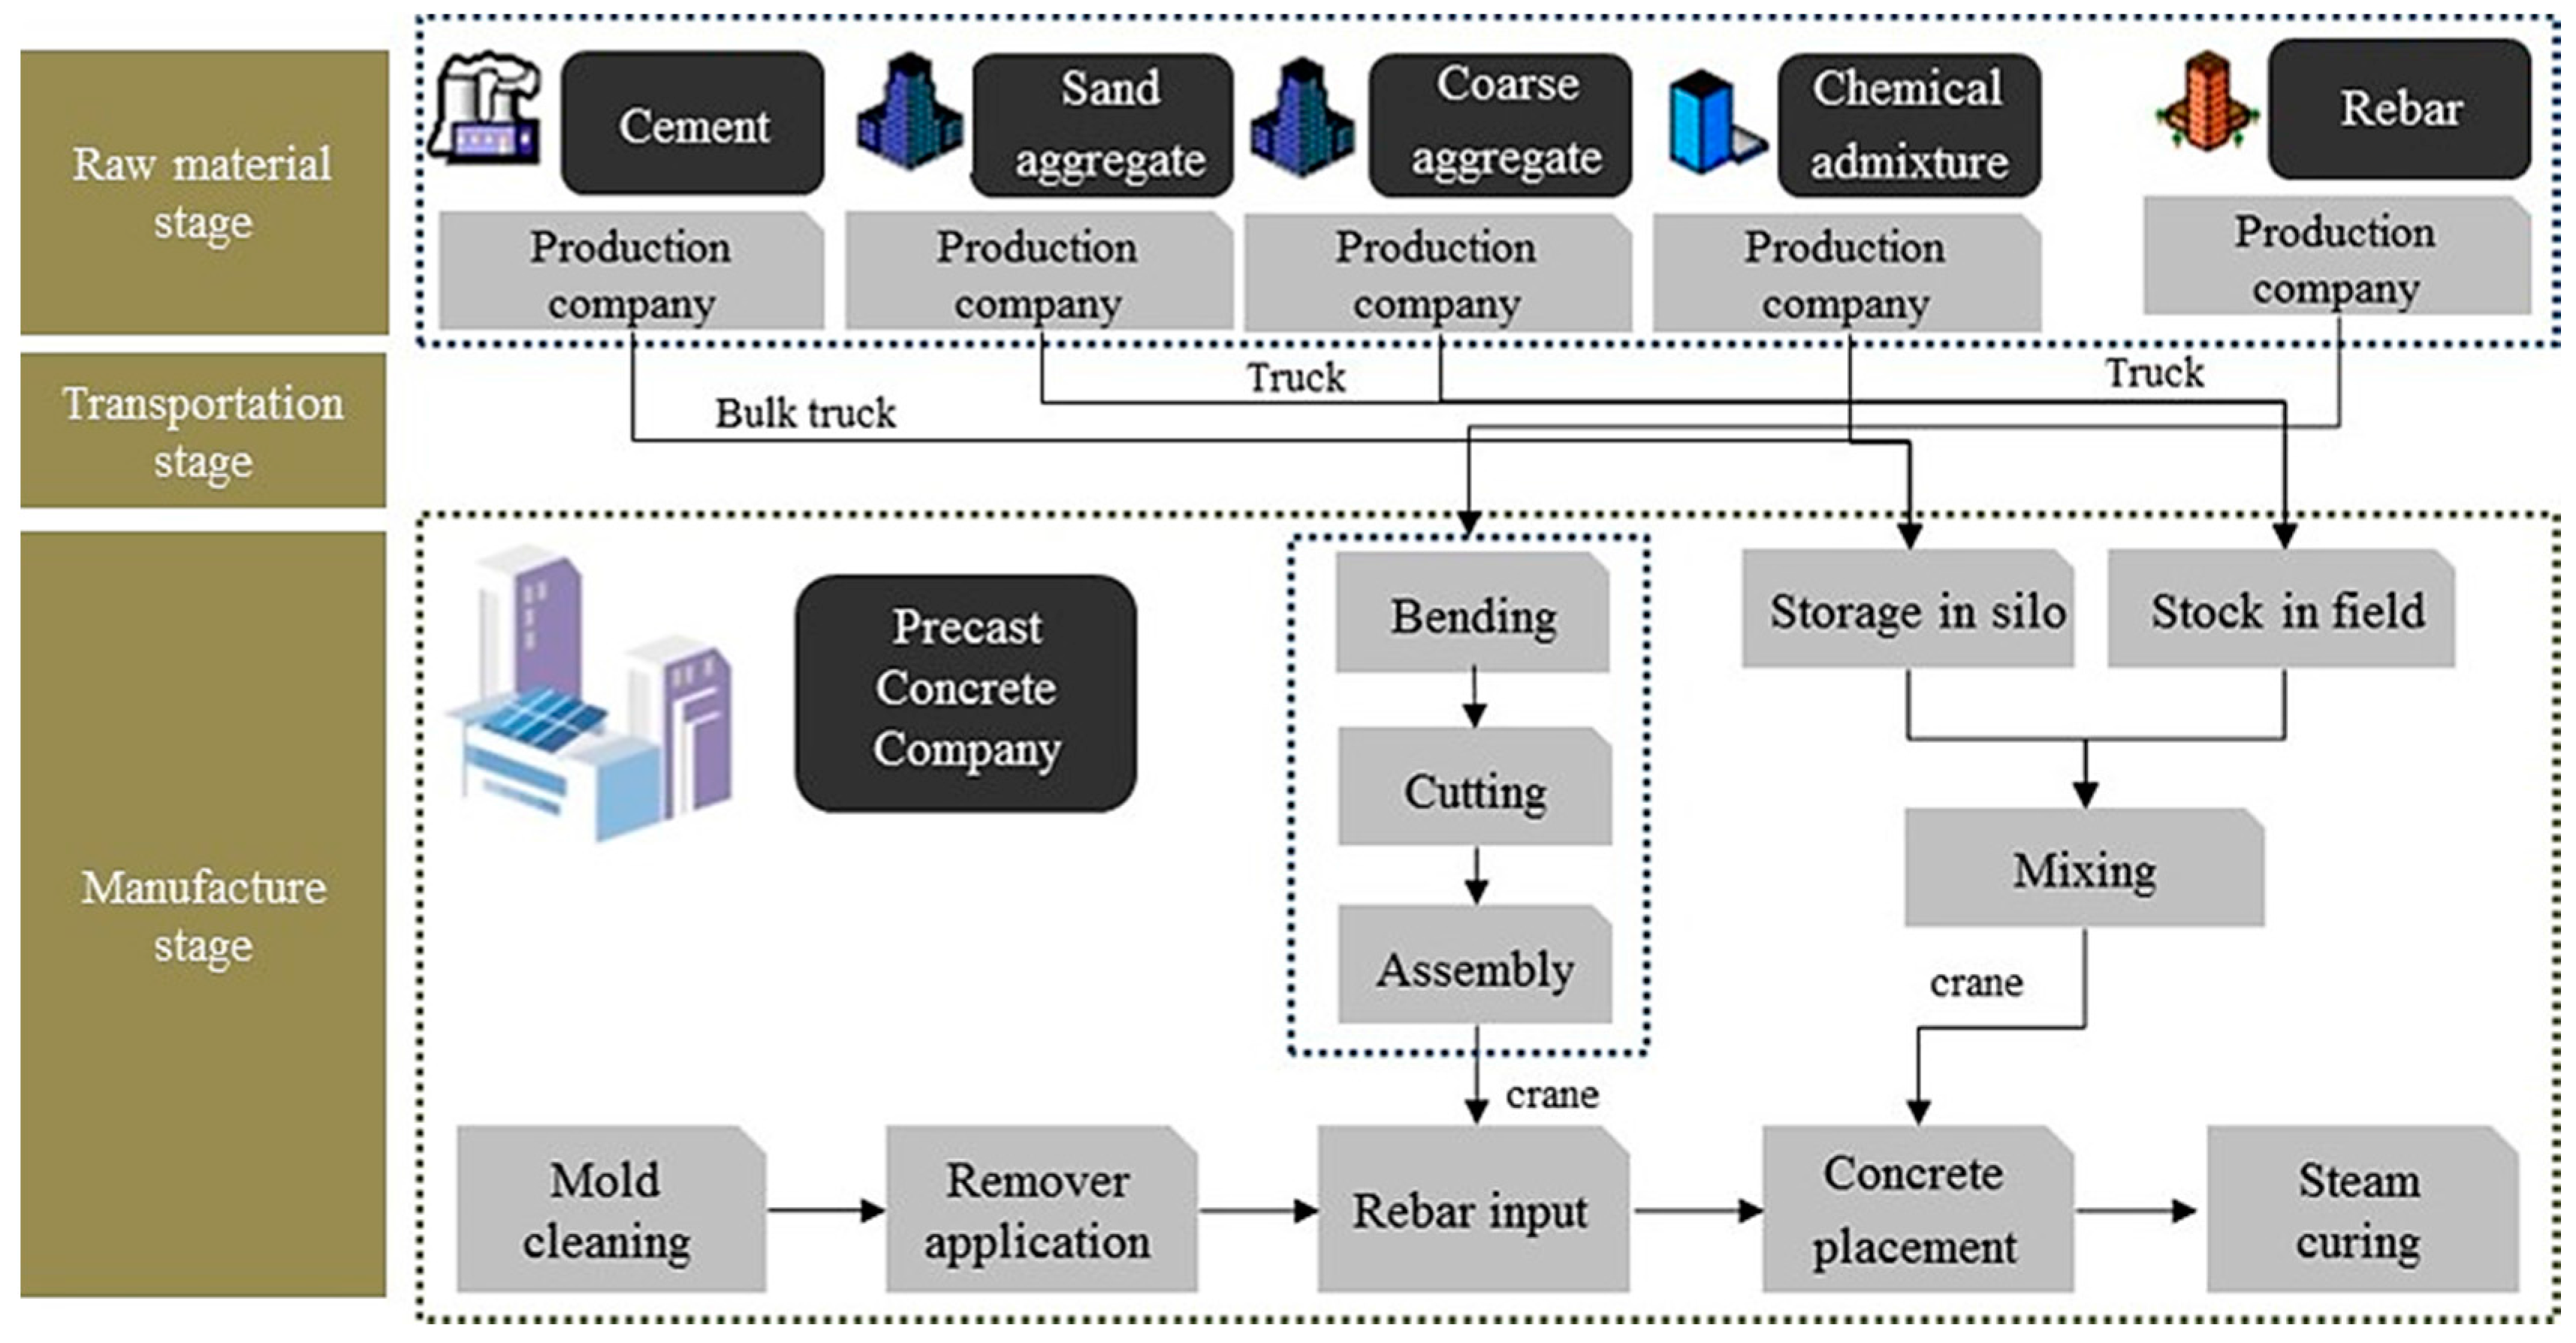
3. Assessment of CO2 Emission in the Precast Concrete
3.1. Raw Material Stage
(1) Concrete
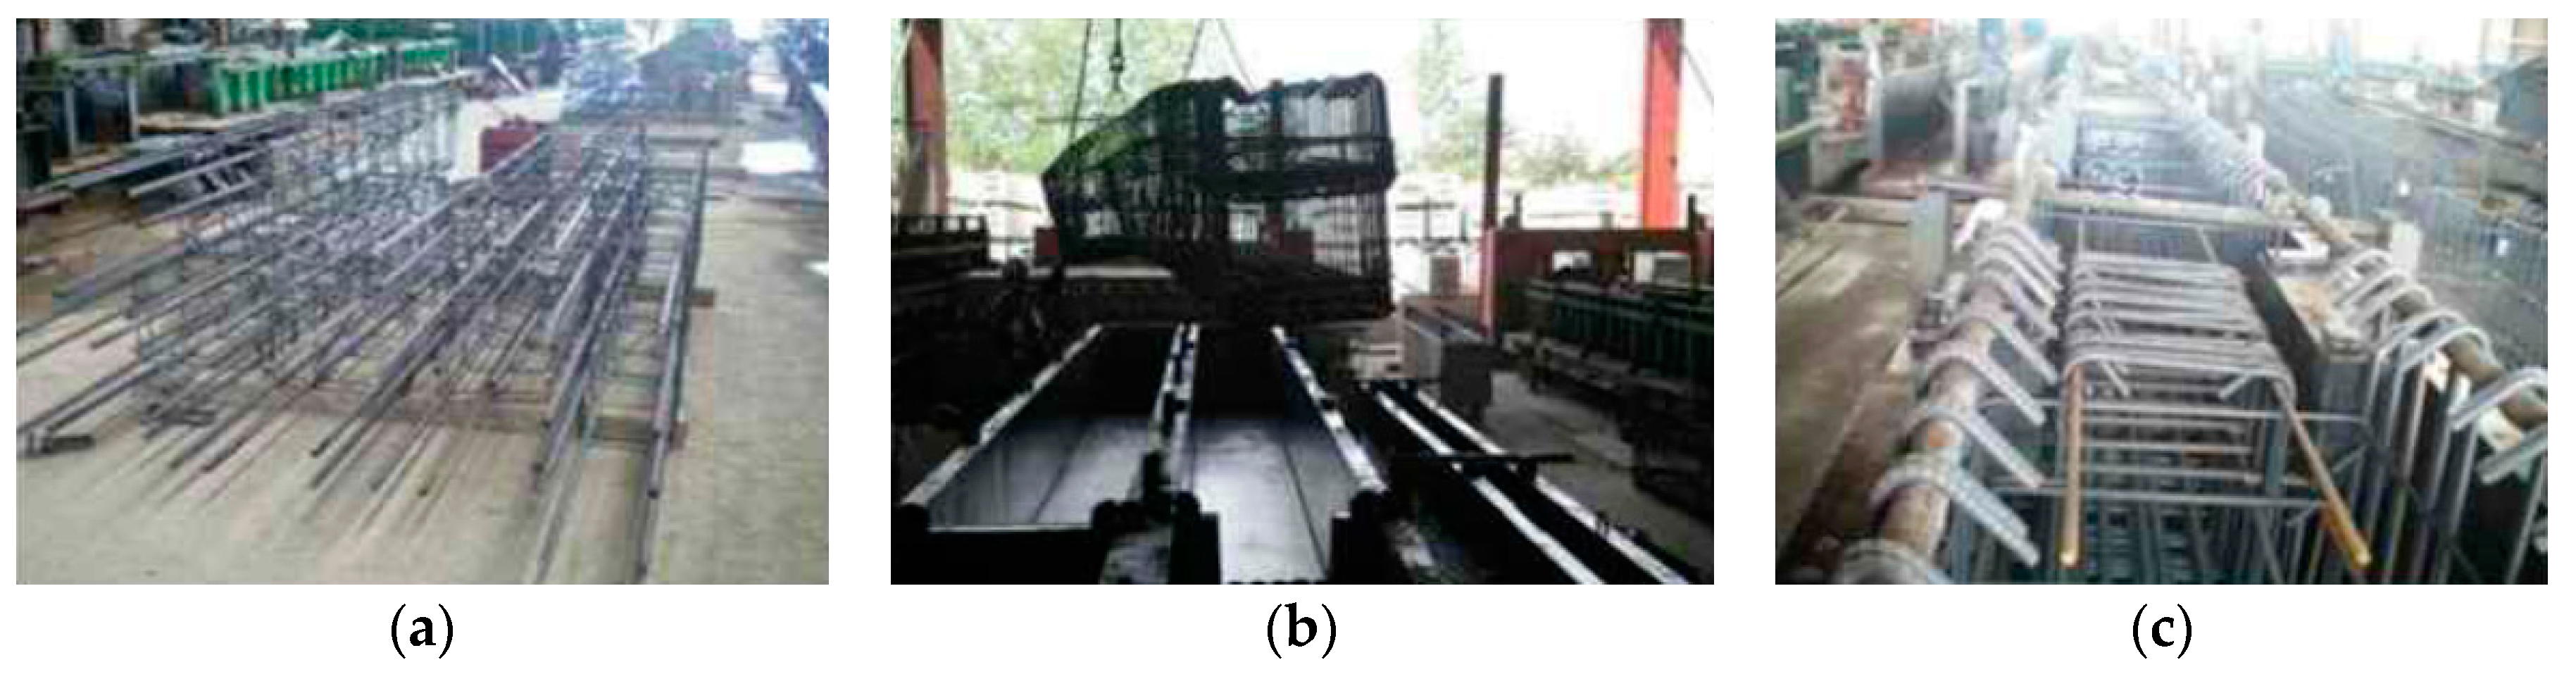
(2) Reinforcing Bar
(i = 1: cement, 2: aggregate, 3: admixture, 4: water, 5: reinforcing bar)
3.2. Transportation Stage
(i = 1: cement, 2: aggregate, 3: admixture, 4: reinforcing bar)
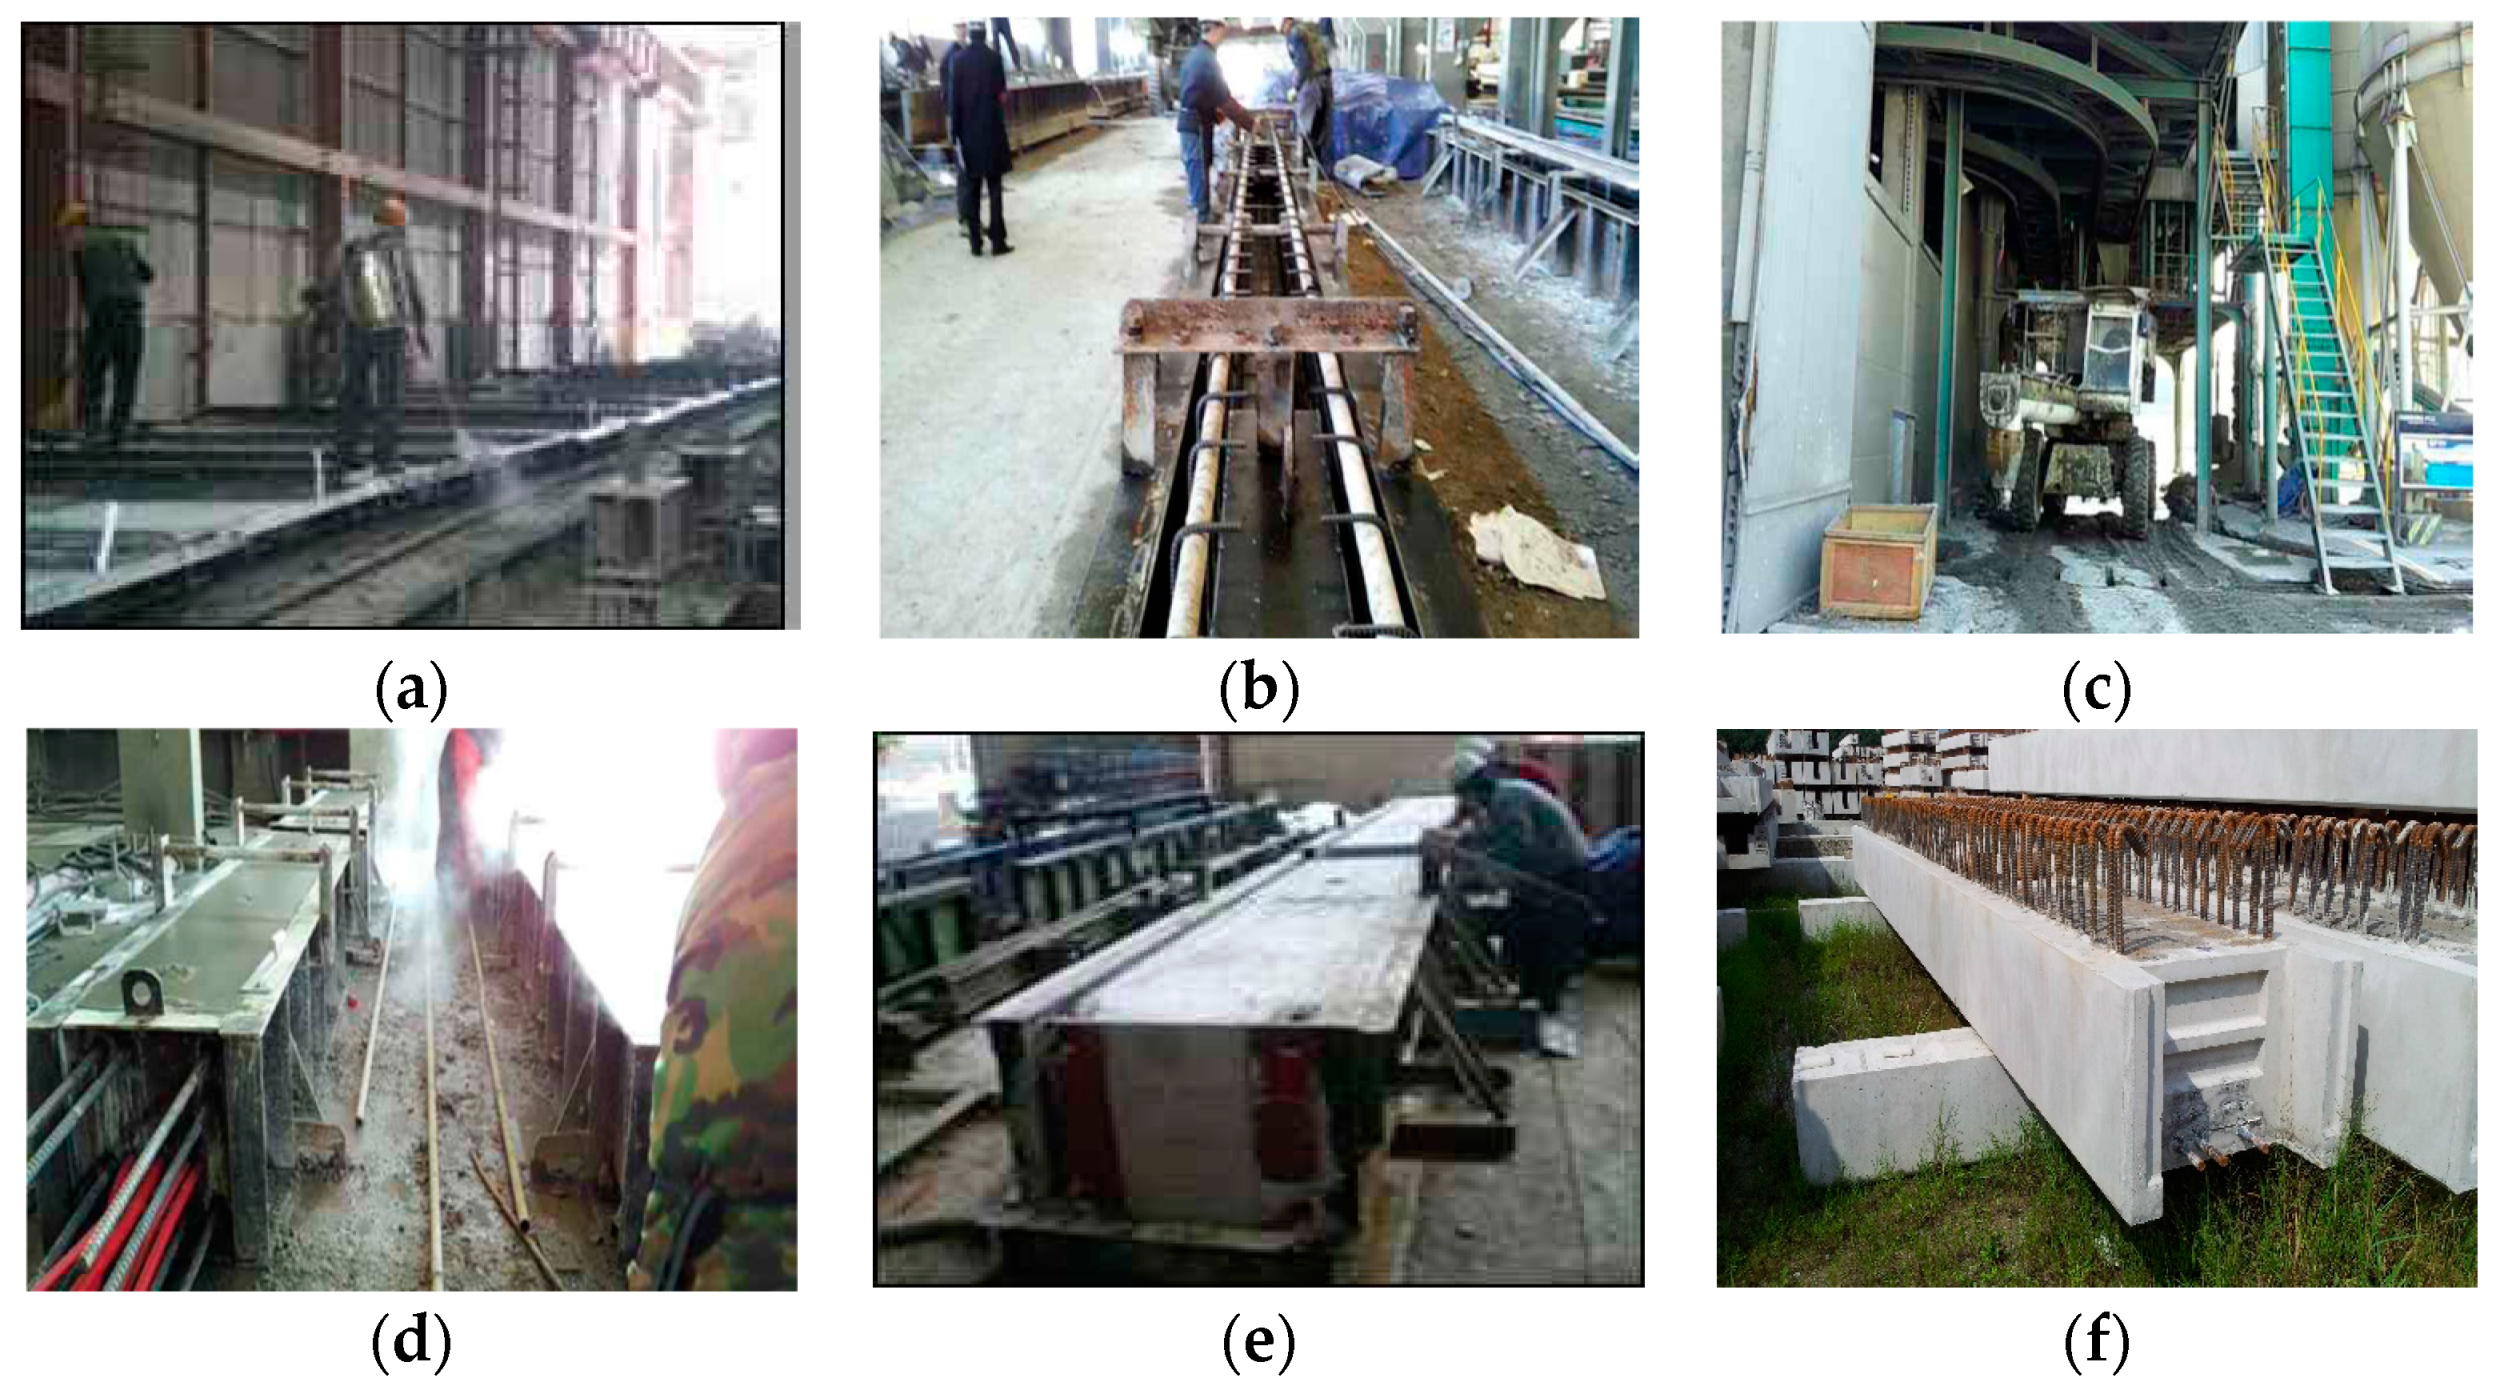
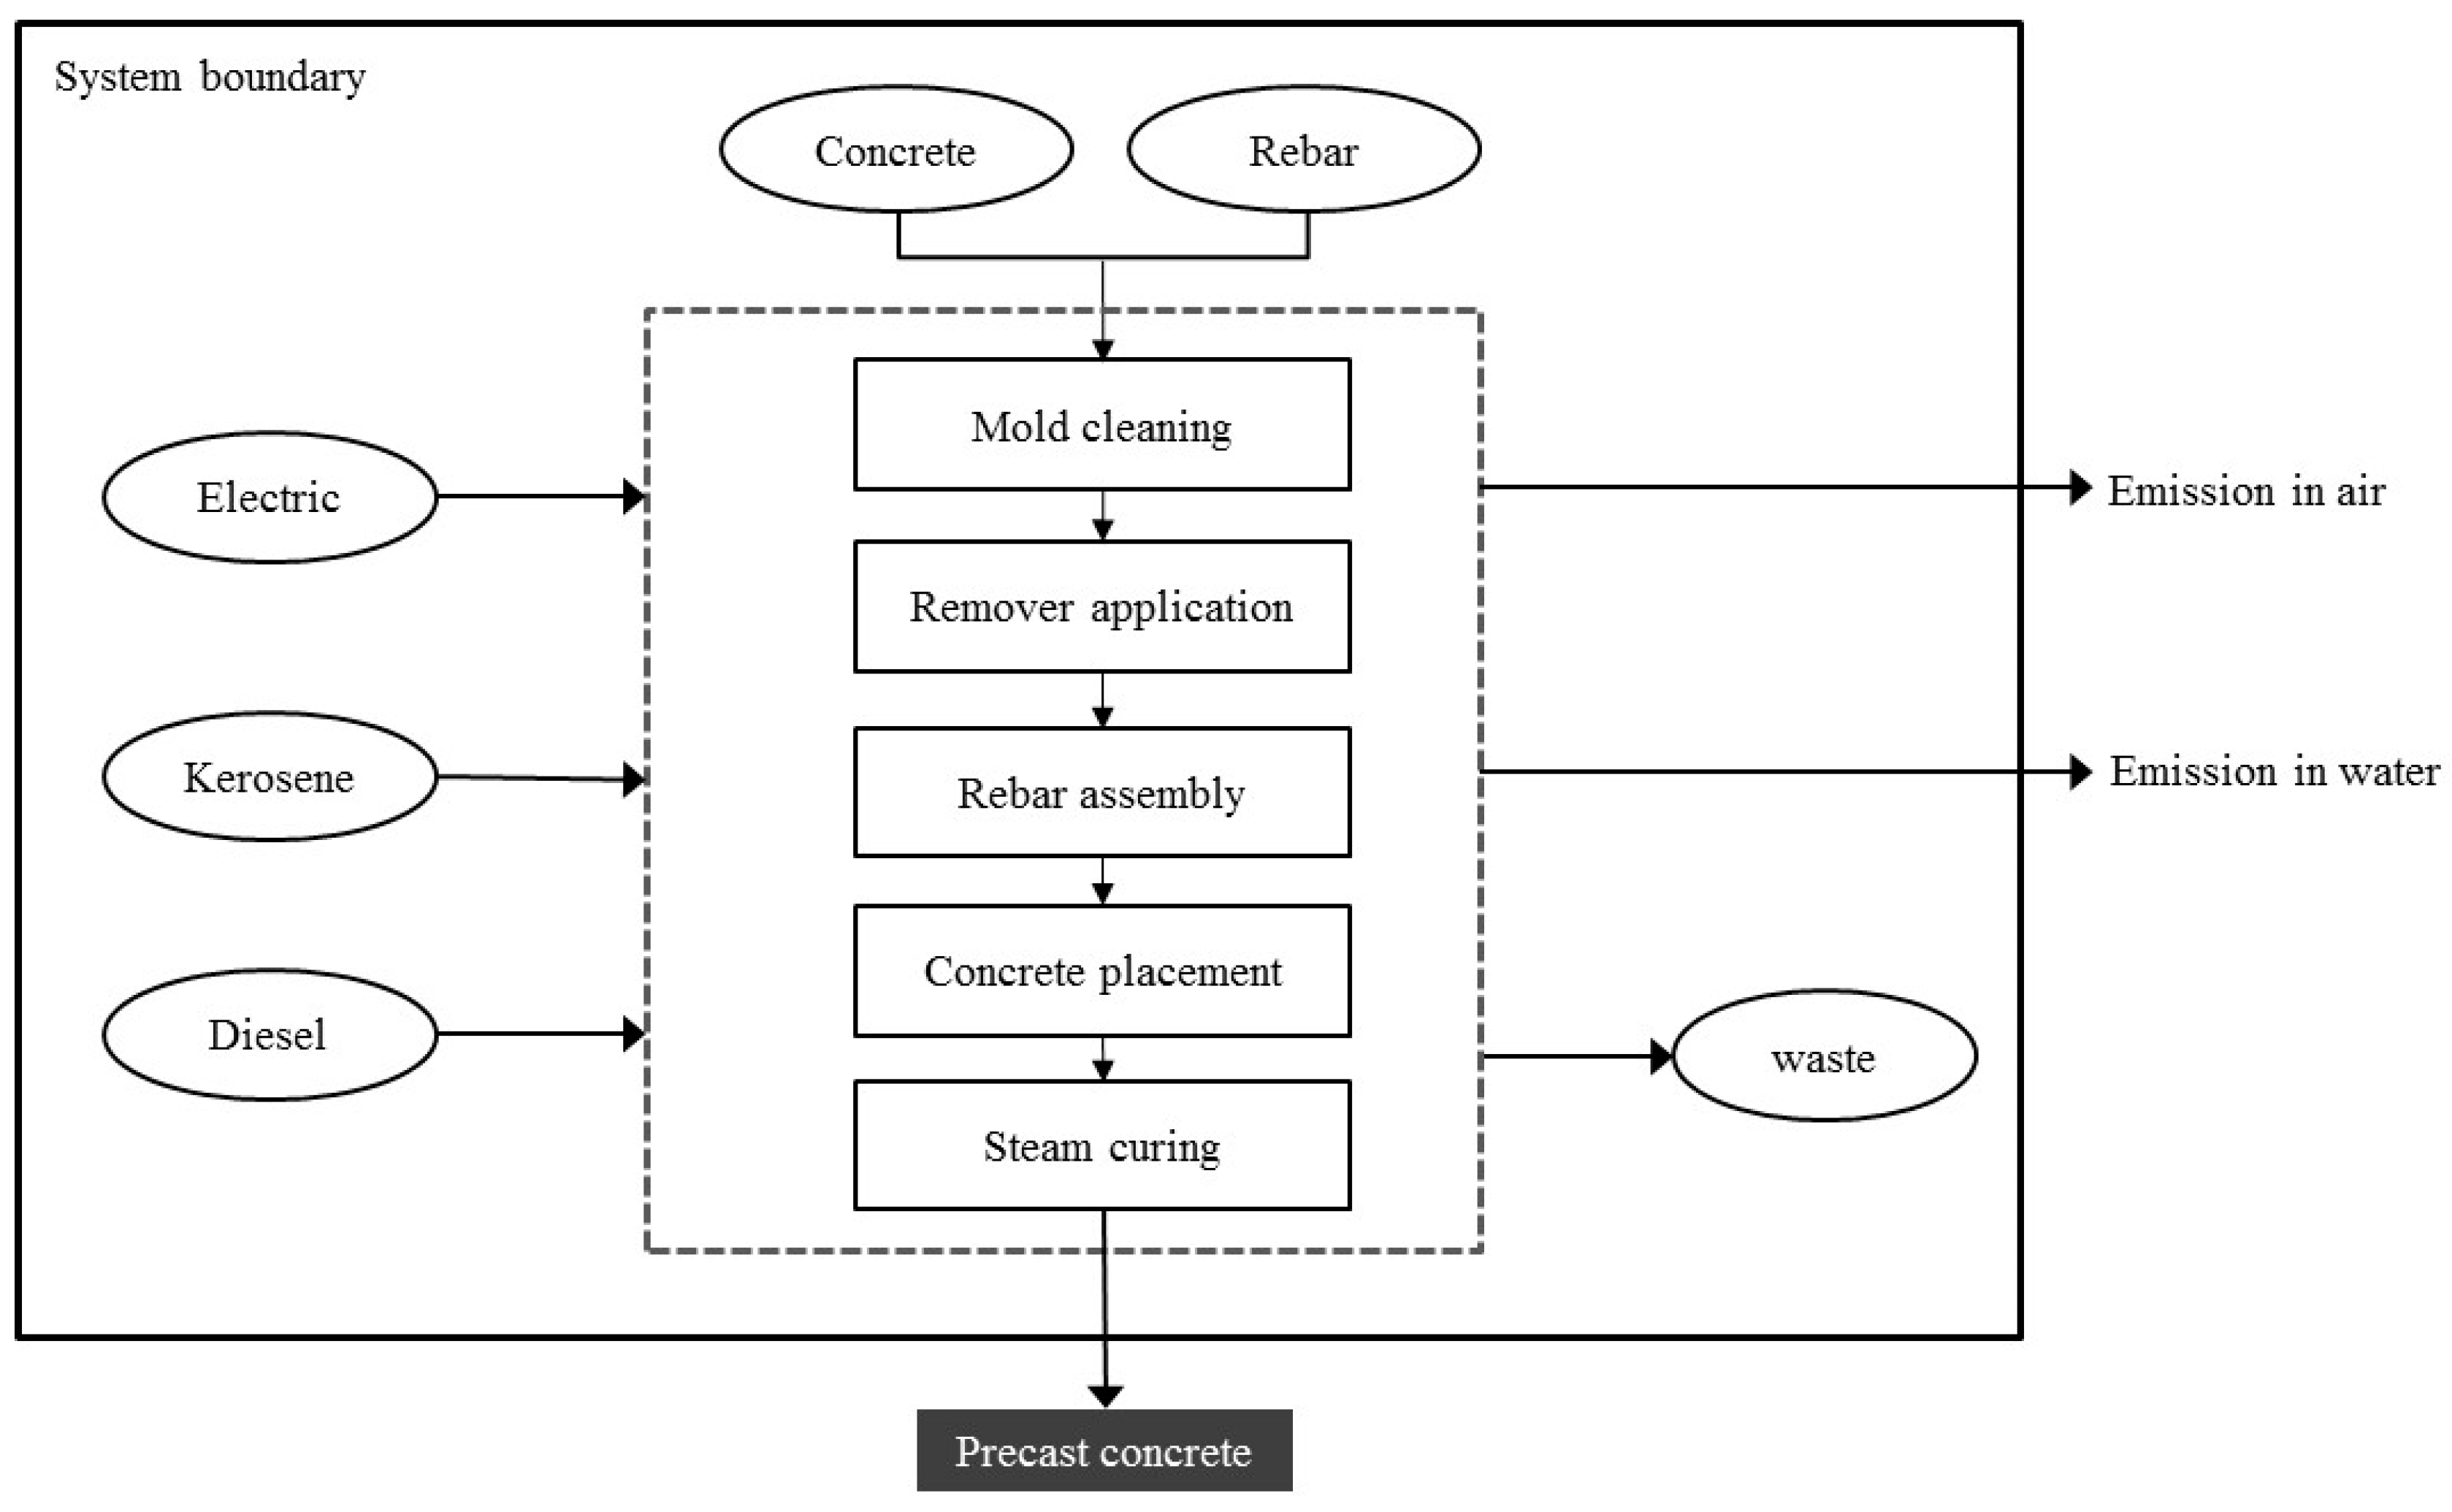
3.3. Manufacturing Stage
(i = 1: electricity usage, 2: oil usage, 3: water usage)
4. Assessment of CO2 Absorption in Precast Concrete
4.1. Absorbable CO2
4.2. Carbonation Depth and CO2 Diffusion Coefficient
5. Case Study: CO2 Emission Assessment of Precast Concrete Girders
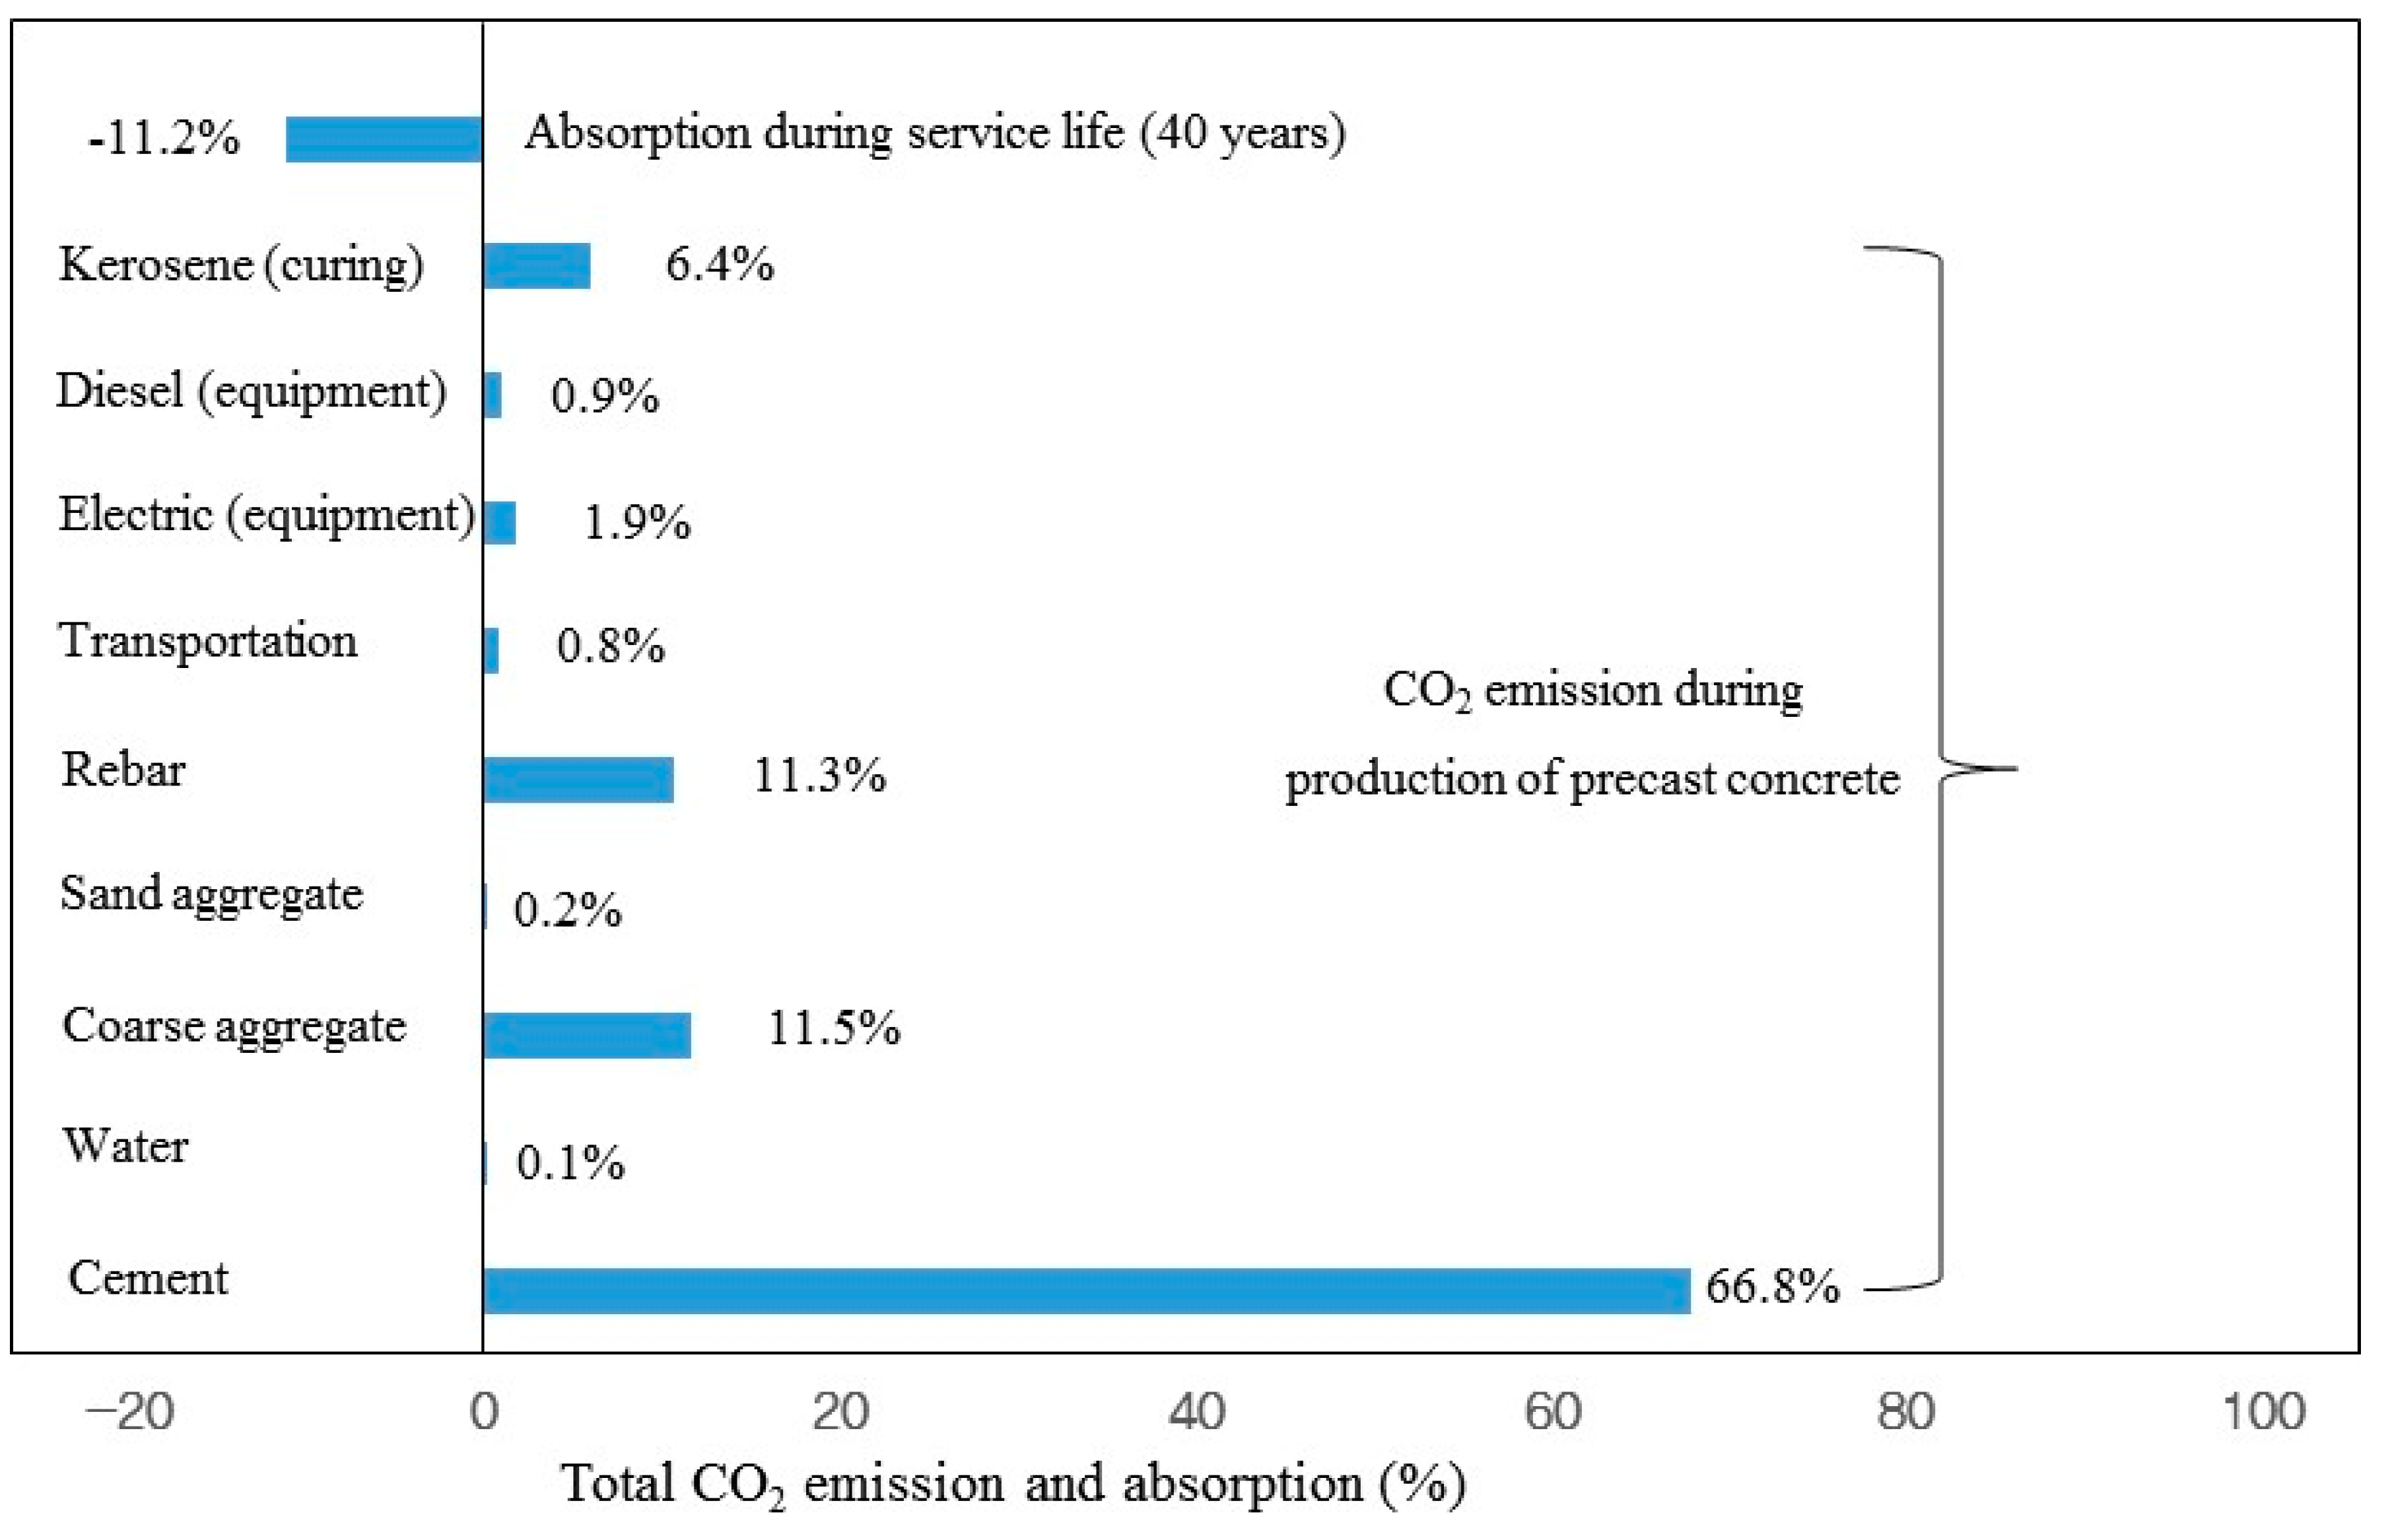
5.1. CO2 Emissions throughout the PC Life Cycle
5.2. CO2 Absorption during Service Life (Four Decades)
6. Conclusions
Acknowledgments
Author Contributions
Conflicts of Interest
References
- Ministry of Environment. The UNFCCC COP21 for a New Climate Regime to Take Place in Paris; Ministry of Environment: Sejong City, Korea, 2015. [Google Scholar]
- Cabeza, L.F.; Rincón, L.; Vilariño, V.; Pérez, G.; Castell, A. Life cycle assessment (LCA) and life cycle energy 32 analysis (LCEA) of buildings and the building sector: A review. Renew. Sustain. Energy Rev. 2014, 29, 394–416. [Google Scholar] [CrossRef]
- Lee, K.H.; Tae, S.H.; Shin, S.W. Development of a Life Cycle Assessment Program for building (SUSB-LCA) in South Korea. Renew. Sustain. Energy Rev. 2009, 13, 1994–2002. [Google Scholar] [CrossRef]
- Ortiz, O.; Castells, F.; Sonnemann, G. Sustainability in the construction industry: A review of recent developments based on LCA. Constr. Build. Mater. 2009, 23, 28–39. [Google Scholar] [CrossRef]
- Dimoudi, A.; Tompa, C. Energy and environmental indicators related to construction of office buildings. Resour. Conserv. Recycl. 2008, 53, 86–95. [Google Scholar] [CrossRef]
- Pacheco-Torgal, F.; Cabeza, L.; Labrincha, J.; De Magalhaes, A. Eco-Efficient Construction and Building Materials: Life Cycle Assessment (LCA), Eco-Labelling and Case Studies; Elsevier: Cambridge, UK, 2014; Volume 1, pp. 624–630. [Google Scholar]
- International Code Council (ICC). International Green Construction Code (IgCC); International Code Council (ICC): Washington, DC, USA, 2010; pp. 1–95. [Google Scholar]
- International Standardization Organization (ISO). ISO 14044(Environmental Management-Life Cycle Assessment Principles and Framework); International Standardization Organization (ISO): Geneva, Switzerland, 2006. [Google Scholar]
- Cement och Betong Institutet. Carbon Dioxide Uptake during Concrete Life Cycle State of the Art; Swedish Cement and Concrete Research Institute: Stockholm, Sweden, 2005. [Google Scholar]
- Korea Society of Architectural Hybrid System. Available online: http://www.ahs.or.kr/ (accessed on 23 March 2016).
- Min, T.B.; Cho, I.S.; Lee, H.S. Fundamental Study on the Development of Precast Concrete without Steam Curing. J. Archit. Inst. Korea Struct. Constr. 2012, 28, 61–68. [Google Scholar]
- Víctor, Y.; José, V.M.; Tatiana, G.-S. Cost and CO2 emission optimization of precast-prestressed concrete U-beam road bridges by a hybrid glowworm swarm algorithm. Autom. Constr. 2015, 49, 123–134. [Google Scholar]
- Zhang, D.; Shao, Y. Early age carbonation curing for precast reinforced concretes. Constr. Build. Mater. 2016, 113, 134–143. [Google Scholar] [CrossRef]
- Ingrao, C.; Lo Giudice, A.; Mbohwa, C.; Clasadonte, M.T. Life Cycle Inventory analysis of a precast reinforced concrete shed for goods storage. J. Clean. Prod. 2014, 79, 152–167. [Google Scholar] [CrossRef]
- Dong, Y.H.; Jaillon, L.; Chu, P.; Poon, C.S. Comparing carbon emissions of precast and cast-in-situ construction methods—A case study of high-rise private building. Constr. Build. Mater. 2015, 99, 39–53. [Google Scholar] [CrossRef]
- Ilwoo, W.; Youngju, N.; JeongTai, K.; Sunkuk, K. Energy-efficient algorithms of the steam curing for the in situ production of precast concrete members. Energy Build. 2013, 64, 275–284. [Google Scholar]
- Cassagnabère, F.; Escadeillas, G.; Mouret, M. Study of the reactivity of cement/metakaolin binders at early age for specific use in steam cured precast concrete. Constr. Build. Mater. 2009, 23, 775–784. [Google Scholar] [CrossRef]
- Pade, C.; GuimaraesPade, C.; Guimaraes, M. The CO2 Uptake of Concrete in a 100 Year Perspective. Cem. Concr. Res. 2007, 37, 1348–1356. [Google Scholar] [CrossRef]
- Liwu, M.; Feng, Z.; Min, D.; Daman, K.P. Effectiveness of using CO2 pressure to enhance the carbonation of Portland cement-fly ash-MgO mortars. Cem. Concr. Compos. 2016, 70, 78–85. [Google Scholar]
- Lee, H.S.; Wang, X.Y. Evaluation of the Carbon Dioxide Uptake of Slag-Blended Concrete Structures, Considering the Effect of Carbonation. Sustainability 2016, 8, 312. [Google Scholar] [CrossRef]
- Elke, G.; van den Philip, H.; de Nele, B. Carbonation of slag concrete: Effect of the cement replacement level and curing on the carbonation coefficient—Effect of carbonation on the pore structure. Cem. Concr. Compos. 2013, 35, 39–48. [Google Scholar]
- Gajda, J. Absorption of Atmospheric Carbon Dioxide by Portland Cement; Portland Cement Association (PCA) R&D: Skokie, IL, USA, 2001. [Google Scholar]
- Lee, S.H.; Park, W.J.; Lee, H.S. Life cycle CO2 Assessment Method for Concrete Using CO2 Balance and Suggestion to Decrease LCCO2 of Concrete in South-Korean Apartment. Energy Build. 2013, 58, 93–102. [Google Scholar] [CrossRef]
- Yang, K.H.; Seo, E.A.; Tae, S.H. Carbonation and CO2 Uptake of Concrete. Environ. Impact Assess. Rev. 2014, 46, 43–52. [Google Scholar] [CrossRef]
- Taehyoung, K.; Sungho, T.; Seongjun, R. Life Cycle Assessment for Carbon Emission Impact Analysis of Concrete Mixing Ground Granulated Blast-furnace Slag (GGBS). Archit. Inst. Korea 2013, 29, 75–82. [Google Scholar]
- National Life Cycle Index Database Information Network. Available online: http://www.edp.or.kr (accessed on 11 August 2015).
- The Ecoinvent Database. Available online: http://www.ecoinvent.org/database (accessed on 11 August 2015).
- Ministry of Strategy and Finance. Implementing Regulations in Corporate Tax Act. 2013.
- Papadakis, V.G.; Vayenas, C.G.; Fardis, M.N. Physical and Chemical Characteristics Affecting the Durability of Concrete. ACI Mater. J. 1991, 88, 186–196. [Google Scholar]
- Cha, S.W. Modeling of Hydration Process and Analysis of Thermal and Hygral Stresses in Hardening Concrete. Ph.D. Thesis, Seoul National University, Seoul, Korea, 1999; pp. 30–36. [Google Scholar]
- Pommer, K.; Pade, C. Guidelines. Uptake of Carbon Dioxide in the Life Cycle Inventory of Concrete; Danish Technological Institute: Taastrup, Denmark, 2005; p. 45. [Google Scholar]
- Oshida, F.; Izumi, I.; Kasami, H. Effects of Cement Type, Mixture Proportion and Curing Condition on Carbonation of Concrete; Architectural Institute of Japan: Tokyo, Japan, 1985; pp. 111–114. [Google Scholar]
- Taehyoung, K.; Sungho, T.; Seongjun, R. Assessment of the CO2 emission and cost reduction performance of a low-carbon-emission concrete mix design using an optimal mix design system. Renew. Sustain. Energy Rev. 2013, 25, 729–741. [Google Scholar]
- Junghoon, P.; Sungho, T.; Taehyoung, K. Life Cycle CO2 Assessment of Concrete by compressive strength on Construction site in Korea. Renew. Sustain. Energy Rev. 2012, 16, 2940–2946. [Google Scholar]
- Taehyoung, K.; Sungho, T.; Changu, C. Analysis of Environmental Impact for Concrete Using LCA by Varying the Recycling Components, the Compressive Strength and the Admixture Material Mixing. Sustainability 2016, 8, 361. [Google Scholar] [CrossRef]
- Kwon, S.J.; Park, S.S.; Nam, S.H. A Suggestion for Carbonation Prediction Using Domestic Field Survey Data of Carbonation. J. Korea Inst. Struct. Maint. Insp. 2007, 11, 81–87. [Google Scholar]
- Jung, S.H. Diffusivity of Carbon Dioxide and Carbonation in Concrete through Development of Gas Diffusion Measuring System. Ph.D. Thesis, Seoul National University, Seoul, Korea, 2003; pp. 7–19. [Google Scholar]


| Material | Unit | Reference Basis [26,27] |
|---|---|---|
| Ordinary Portland Cement | kg | National LCI DB (South Korea) |
| Coarse aggregate | kg | National LCI DB (South Korea) |
| Fine aggregate | kg | National LCI DB (South Korea) |
| Blast-furnace slag powder | kg | Overseas LCI DB (ecoinvent) |
| Fly ash | kg | Overseas LCI DB (ecoinvent) |
| Water | kg | National LCI DB (South Korea) |
| Chemical Admixture compound | kg | Overseas LCI DB (ecoinvent) |
| Reinforcing bar | kg | National LCI DB (South Korea) |
| Truck | km | National LCI DB (South Korea) |
| Train | km | National LCI DB (South Korea) |
| Diesel | L | National LCI DB (South Korea) |
| Kerosene | L | National LCI DB (South Korea) |
| LPG | m3 | National LCI DB (South Korea) |
| Electricity | kwh | National LCI DB (South Korea) |
| Type | Substitution Level of SCMs (%) | |||||
|---|---|---|---|---|---|---|
| 0–10 | 10–20 | 20–30 | 30–40 | 40–50 | 60–80 | |
| FA | 1.05 | 1.05 | 1.10 | 1.10 | - | - |
| GGBS | 1.05 | 1.10 | 1.15 | 1.20 | 1.25 | 1.30 |
| SF | 1.05 | 1.10 | - | - | - | - |
| Finishing Condition | Indoor Area | Outdoor Area | |||||||||
|---|---|---|---|---|---|---|---|---|---|---|---|
| No Finishing | Plaster | Mortar + Plaster | Mortar | Mortar + Paint | Tile | Paint | No Finishing | Mortar | Paint | Tile | |
| Value | 1.0 | 0.79 | 0.41 | 0.29 | 0.15 | 0.21 | 0.57 | 1.0 | 0.28 | 0.8 | 0.7 |
| Raw Material Stage | Transportation Stage (from Gate to Ready-Mixed Concrete Plant) | |||||
| Unit: 1 PCG (Concrete 2.2 m3) | Concrete Component | |||||
| Unit Item | A | B | C = A × B | D | E | F = A × D × E |
| kg/unit | kg-CO/kg | Kg-CO2/unit | Distance (km) | kg-CO2/kg·km | kg-CO2/kg | |
| Ordinary Portland cement (OPC) | 1100 | 9.48 × 10⁻¹ | 1.04 × 10³ | 106 | 6.06 × 10⁻⁵ | 7.07 |
| Water | 352 | 1.31 × 10⁻⁴ | 4.61 × 10⁻¹ | - | - | - |
| Sand aggregate | 1751 | 1.52 × 10⁻⁴ | 2.66 | 32 | 1.16 × 10⁻⁵ | 6.50 × 10⁻¹ |
| Coarse aggregate | 2300 | 7.74 × 10⁻³ | 1.78 × 10² | 32 | 1.16 × 10⁻⁵ | 8.54 × 10⁻¹ |
| Chemical admixture | 11 | 2.05 × 10⁻³ | 7.22 × 10⁻¹ | 77 | 1.16 × 10⁻⁵ | 3.14 × 10⁻¹ |
| Reinforcing rebar | 425 | 3.85 × 10⁻¹ | 1.64 × 10² | 161 | 4.29 × 10⁻⁵ | 2.94 |
| Sum | 1.39 × 10³ | Sum | 1.18 × 101 | |||
| Manufacturing Stage | Transportation Stage (from Batch Plant to Construction Site) | |||||
| Unit Item | A | B | C = A × B | D | E | F = D × E |
| Input/unit | kg-CO2/input | kg-CO2/input | Distance (km) | kg-CO2/kg·km | kg-CO2/kg | |
| Electric (kwh) | 57.4 | 4.88 × 10⁻¹ | 2.80 × 101 | 50 | 2.81 × 10⁻² | 1.41 |
| Kerosene (L) | 29.3 | 3.17 | 9.29 × 101 | |||
| Diesel (L) | 4.7 | 3.19 | 1.50 × 101 | |||
| Remover (L) | 1.3 | 1.45 × 10⁻³ | 1.89 × 10⁻³ | |||
| Sum | 1.36 × 10² | |||||
| Use stage of structure | ||||||
| A | B | C | D | E | F | G = D × E × F |
| Service life | Type | Finishing material | Exposed surface area (m2) | aCO2 (g/cm3) | xc (cm) | CO2 absorption (kg/m3) |
| 40 years | Outdoor area | Paint | 9.27 | 0.32 | 5.79 | −171.8 |
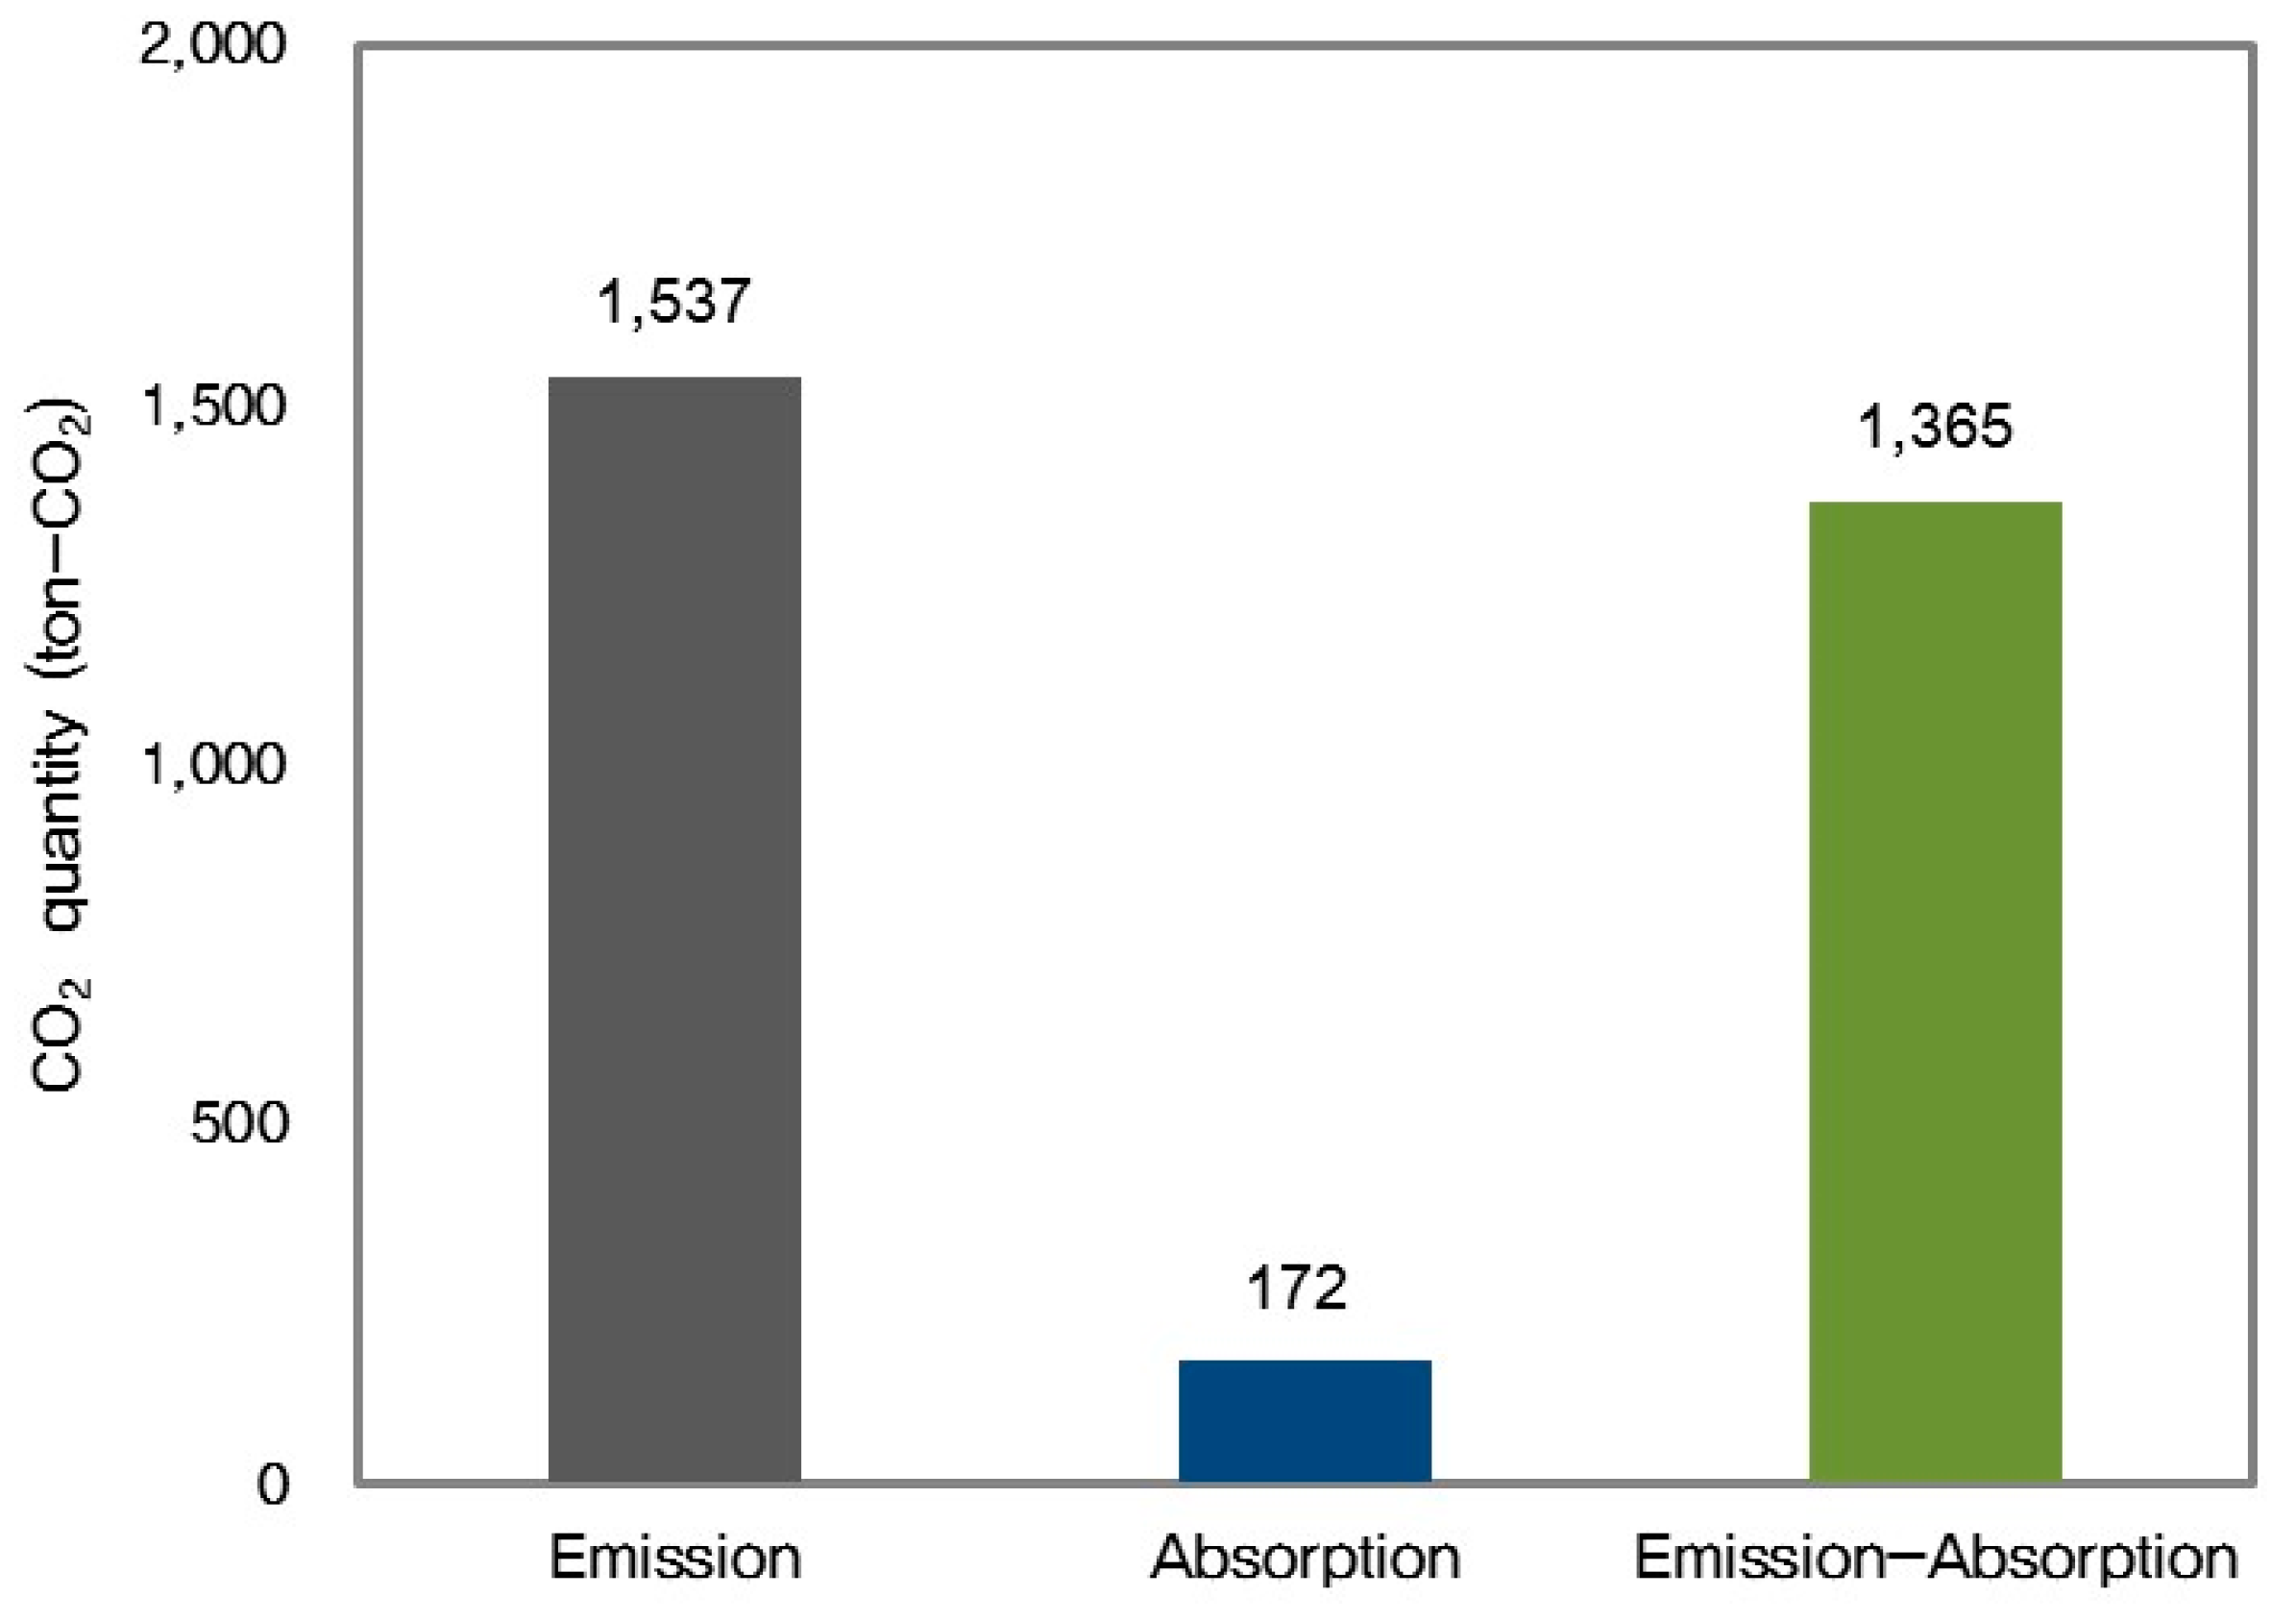
| Total = 1365.6 kg-CO2/1 PCG (=1537.4 (CO2 emission due to concrete) − 171.8 (absorption due to carbonation)) | ||||||
© 2016 by the authors; licensee MDPI, Basel, Switzerland. This article is an open access article distributed under the terms and conditions of the Creative Commons Attribution (CC-BY) license (http://creativecommons.org/licenses/by/4.0/).
Share and Cite
Kim, T.; Chae, C.U. Evaluation Analysis of the CO2 Emission and Absorption Life Cycle for Precast Concrete in Korea. Sustainability 2016, 8, 663. https://doi.org/10.3390/su8070663
Kim T, Chae CU. Evaluation Analysis of the CO2 Emission and Absorption Life Cycle for Precast Concrete in Korea. Sustainability. 2016; 8(7):663. https://doi.org/10.3390/su8070663
Chicago/Turabian StyleKim, Taehyoung, and Chang U. Chae. 2016. "Evaluation Analysis of the CO2 Emission and Absorption Life Cycle for Precast Concrete in Korea" Sustainability 8, no. 7: 663. https://doi.org/10.3390/su8070663