Article

Evaluation of the Carbon Dioxide Uptake of Slag-Blended Concrete Structures, Considering the Effect of Carbonation

1
Department of Architectural Engineering, Hanyang University, Ansan 426-791, Korea
2
Department of Architectural Engineering, Kangwon National University, Chuncheon 200-701, Korea
*
Author to whom correspondence should be addressed.
Sustainability 2016, 8(4), 312; https://doi.org/10.3390/su8040312
Submission received: 15 February 2016 / Revised: 18 March 2016 / Accepted: 23 March 2016 / Published: 30 March 2016
(This article belongs to the Special Issue Life Cycle Assessment on Green Building Implementation)

Abstract

:
During the production of concrete, cement, water, aggregate, and chemical and mineral admixtures will be used, and a large amount of carbon dioxide will be emitted. Conversely, during the decades of service life of reinforced concrete structures, carbon dioxide in the environment can ingress into concrete and chemically react with carbonatable constitutes of hardened concrete, such as calcium hydroxide and calcium silicate hydrate. This chemical reaction process is known as carbonation. Carbon dioxide will be absorbed into concrete due to carbonation. This article presents a numerical procedure to quantitatively evaluate carbon dioxide emissions and the absorption of ground granulated blast furnace slag (GGBFS) blended concrete structures. Based on building scales and drawings, the total volume and surface area of concrete are calculated. The carbon dioxide emission is calculated using the total volume of concrete and unit carbon dioxide emission of materials. Next, using a slag blended cement hydration model and a carbonation model, the carbonation depth is determined. The absorbed carbon dioxide is evaluated using the carbonation depth of concrete, the surface area of concrete structures, and the amount of carbonatable materials. The calculation results show that for the studied structure with slag blended concrete, for each unit of CO2 produced, 4.61% of carbon dioxide will be absorbed during its 50 years of service life.

1. Introduction

Portland cement is the principle hydraulic binder used in modern concrete. The production of one ton of ordinary Portland cement (OPC) generates 0.55 ton of chemical CO2 and requires an additional 0.39 ton of CO2 in fuel emissions, accounting for a total of 0.94 ton of CO2 [1]. The word’s yearly cement accounts for nearly 7% percent of global CO2 emissions [1]. On the other hand, ground granulated blast furnace slag (GGBFS), which is a byproduct of the steel industry, has been increasingly used in the concrete industry as a mineral admixture to partially replace cement. Slag blended concrete has many advantages, such as higher resistance against sulfate and seawater attack, higher late age strength, lower materials cost, and lower CO2 emissions [1].
Carbon dioxide in the environment can ingress into concrete and chemically react with carbonatable constitutes of hardened concrete, such as calcium hydroxide and calcium silicate hydrate. This chemical reaction process is called carbonation. Carbonation presents both advantages and disadvantages to reinforced concrete structures [2]. Carbonation can reduce the porosity of concrete and improve the compressive strength in the carbonated region of concrete. On the other hand, carbonation decreases the alkaline in concrete and induces the corrosion of steel rebar [1].
Many investigations have been conducted regarding the experimental and theoretical study of the carbonation of slag blended concrete and the life cycle of the carbon dioxide emission of structural concrete.
Regarding the carbonation of slag blended concrete, Sulapha [3], Elke [4], Sisomphon [5], Monkman [6], and Bernal [7] experimentally found that carbonation of slag-blended concrete correlates to water to binder ratios, slag replacement ratios, and concrete curing methods. By increasing the replacement of slag, the carbonation depth of concrete will increase. Higher carbonation depth does not necessarily mean higher absorption of CO2. It might mean that there is faster diffusion of CO2 due to there being less CSH to react with. Reducing the water to binder ratio and extending the initial curing period before carbonation tests can reduce the carbonation depth of slag-blended concrete. Papadakis [8,9] proposed chemical reaction equations for cement–mineral admixture blends and evaluated the contents of carbonatable materials and porosity of concrete. Furthermore, carbonation depth was calculated by considering both concrete chemical components and environmental conditions.
Regarding the life cycle assessment of CO2 emission, Hasanbeigi [10], Gartner [11], Miller [12], Roh [13], Kim [14], and Tae [15,16] analyzed carbon dioxide emissions for buildings with different concrete mixing proportions, different building types, and different life cycle stages. On the other hand, some numerical algorithms have been proposed to make an optimum design regarding the reduction of carbon dioxide emission. Using the evolution algorithm, Kim [17] and Roh [18] selected the optimal concrete mix design method, which minimizes the CO2 emission of an apartment house. Ji [19] proposed three methods (eco-efficiency, environmental priority strategy system, and certified emissions reduction price) to support the decision-making processes that simultaneously consider cost and CO2 emissions. Yepes [20] proposed a hybrid glowworm swarm algorithm and optimized the cost and CO2 emissions of concrete beam roads.
However, the carbon dioxide uptake from carbonation was not considered in References [3,4,5,6,7,8,9,10,11,12,13,14,15,16,17,18,19,20]. Carbonation is a lengthy chemical reaction process and will proceed continuously during the service life of buildings. Carbon dioxide will be absorbed into concrete due to carbonation. Compared with abundant research regarding carbonation and the carbon dioxide emission life cycle [3,4,5,6,7,8,9,10,11,12,13,14,15,16,17,18,19,20], the study of carbon dioxide uptake is relatively limited. In recent years, References [21,22,23,24,25] presented some analysis models of the carbon dioxide uptake from carbonation.
Using the carbonation reaction model, Lee [21] analyzed carbon dioxide uptake due to carbonation in the building use stage. García-Segura [22] made life cycle greenhouse gas emissions of blended cement concrete, considering carbonation and durability. The carbon dioxide uptake due to carbonation during the use stage and after demolition stage was considered.
However, in Lee’s [21], García-Segura’s [22], and other researchers’ [3,4,5,6,7,8,9,10,11,12,13,14,15,16,17,18,19,20] studies, they assumed that cement is completely hydrated (i.e., the hydration degree is 100%) regardless of the water to cement ratio. Lagerblad [23] and Yang [24] reported that concrete with lower water to cement ratios has a slower rate of hydration and a lower ultimate degree of hydration. Yang [24] proposed a Portland cement hydration model, evaluated the contents of carbonatable materials, and calculated carbonation depth and carbon dioxide uptake during the use stage and recycling of demolished concrete. Kashef-Haghighi [25] proposed a mathematical model, evaluated the hydration degree of Portland cement, and calculated carbon dioxide uptake in accelerated carbonation curing.
However, the hydration model proposed by Yang [24] and Kashef-Haghighi [25] is only valid for Portland cement. For slag-blended cement, due to the coexistence of cement hydration and slag reaction, Yang’s [24] or Kashef-Haghighi’s [25] hydration model is not valid.
In this study, to overcome the weak points in former studies [3,4,5,6,7,8,9,10,11,12,13,14,15,16,17,18,19,20,21,22,23,24,25], we propose a slag-blended cement hydration model, calculate carbonatable materials’ content and porosity, and evaluate carbonation depth and carbon dioxide uptake. The flowchart of the proposed numerical procedure is shown in Figure 1. The input parameters of the numerical procedure are the shopping drawing of buildings and environmental conditions. By using shopping drawings, the total volume and surface area of concrete are calculated. By using the total volume of concrete and unit carbon dioxide emission of materials, carbon dioxide emissions are calculated. Then, by using a carbonation model considering material properties and environmental conditions, the carbonation depth is determined. By using the carbonation depth of concrete, the surface area of concrete structures, and the amount of carbonatable materials, the absorbed carbon dioxide is calculated. Finally, the ratio between mass of absorbed CO2 and mass of emitted CO2 is calculated.
The contributions of this article are summarized as follows: first, propose a slag-blended cement hydration model and calculate reaction degrees of cement and slag. Second, evaluate the carbonatable materials content and porosity using the reaction degrees of binders. Third, calculate carbonation depth and carbon dioxide uptake of slag-blended concrete, considering material properties and environmental conditions.

2. Evaluation of CO2 Emissions and CO2 Uptake of Slag-Blended Concrete

2.1. CO2 Emissions

Emissions of CO2 from Portland cement production include direct emissions and indirect emissions. As shown in Table 1, direct CO2 emissions mainly come from carbonate decomposition from raw material and the burning of cement kiln fuel. Indirect CO2 emissions mainly come from electricity consumption. Considering both direct and indirect CO2 emissions, to produce 1 ton of ordinary Portland cement, 0.93 ton of CO2 will be emitted [1].
During the production of concrete, cement, water, aggregate, mineral admixtures, and superplasticizer will be used. Table 2 shows a summary of CO2 emission factors for concrete production. The CO2 emission content of 1 kg of GGBFS is 0.034 kg [1], which is much lower than that of ordinary Portland cement. The CO2 emission from concrete production can be calculated as follows:
CO2-e = CO2-eM + CO2-eT + CO2-eP,
where CO2-e is the total CO2 emission from concrete production, CO2-eM is the emission of CO2 from concrete materials, CO2-eT is the emission of CO2 from transport, and CO2-eP is the emission of CO2 from the mixing of concrete. CO2-eM is the sum of CO2 emissions from various components of concrete, such as CO2 emissions from producing cement, water, fine aggregate, coarse aggregate, mineral admixtures, and superplasticizer. Table 3 shows an example of CO2 emissions during the concrete production process. The input parameters are concrete mixing proportions, the CO2 emissions factor, the transportation cycle, and distance. The output result is total CO2 emissions from the concrete production process.

2.2. CO2 Uptake from Carbonation of Concrete

Carbon dioxide will be absorbed into concrete due to carbonation. Concrete carbonation is a complicated physicochemical process. The process consists of several steps, such as the diffusion of gaseous phase CO2 from the air environment into concrete pores, CO2 dissolution in the water film of concrete pores, the dissolution of solid calcium hydroxide (CH) in concrete pore water, the diffusion of dissolved CH in concrete pore water, CH reaction with dissolved CO2, and the reaction of CO2 with calcium silicate hydrate (CSH). The chemical reaction of carbonation is shown as follows:
C a ( O H ) 2 + C O 2 C a C O 3 + H 2 O
( 3 C a O 2 S i O 2 3 H 2 O ) + 3 C O 2 3 C a C O 3 2 S i O 2 3 H 2 O .
As shown in Equations (2) and (3), carbonation closely relates to the compound compositions of concrete, such as the amount of carbonatable materials CH and CSH. Moreover, carbonation also relates to the concrete porosity because concrete pores are necessary paths for the diffusion of atmospheric CO2 into the concrete. Hence, to evaluate concrete carbonation depth, an accurate evaluation of the concrete material properties is necessary, such as CH content, CSH content, and porosity.
Concrete material properties closely relate to mixing proportions and the hydration process. Our former research [26,27] originally proposed a blended hydration model for slag-blended concrete. The hydration model starts with concrete mixing proportions. The age-dependent material properties of concrete, such as the carbonatable materials content and porosity, can be quantitatively calculated. The hydration model has a wide application range for concrete, with different water to binder ratios, different slag replacement levels, and different curing methods [26,27].
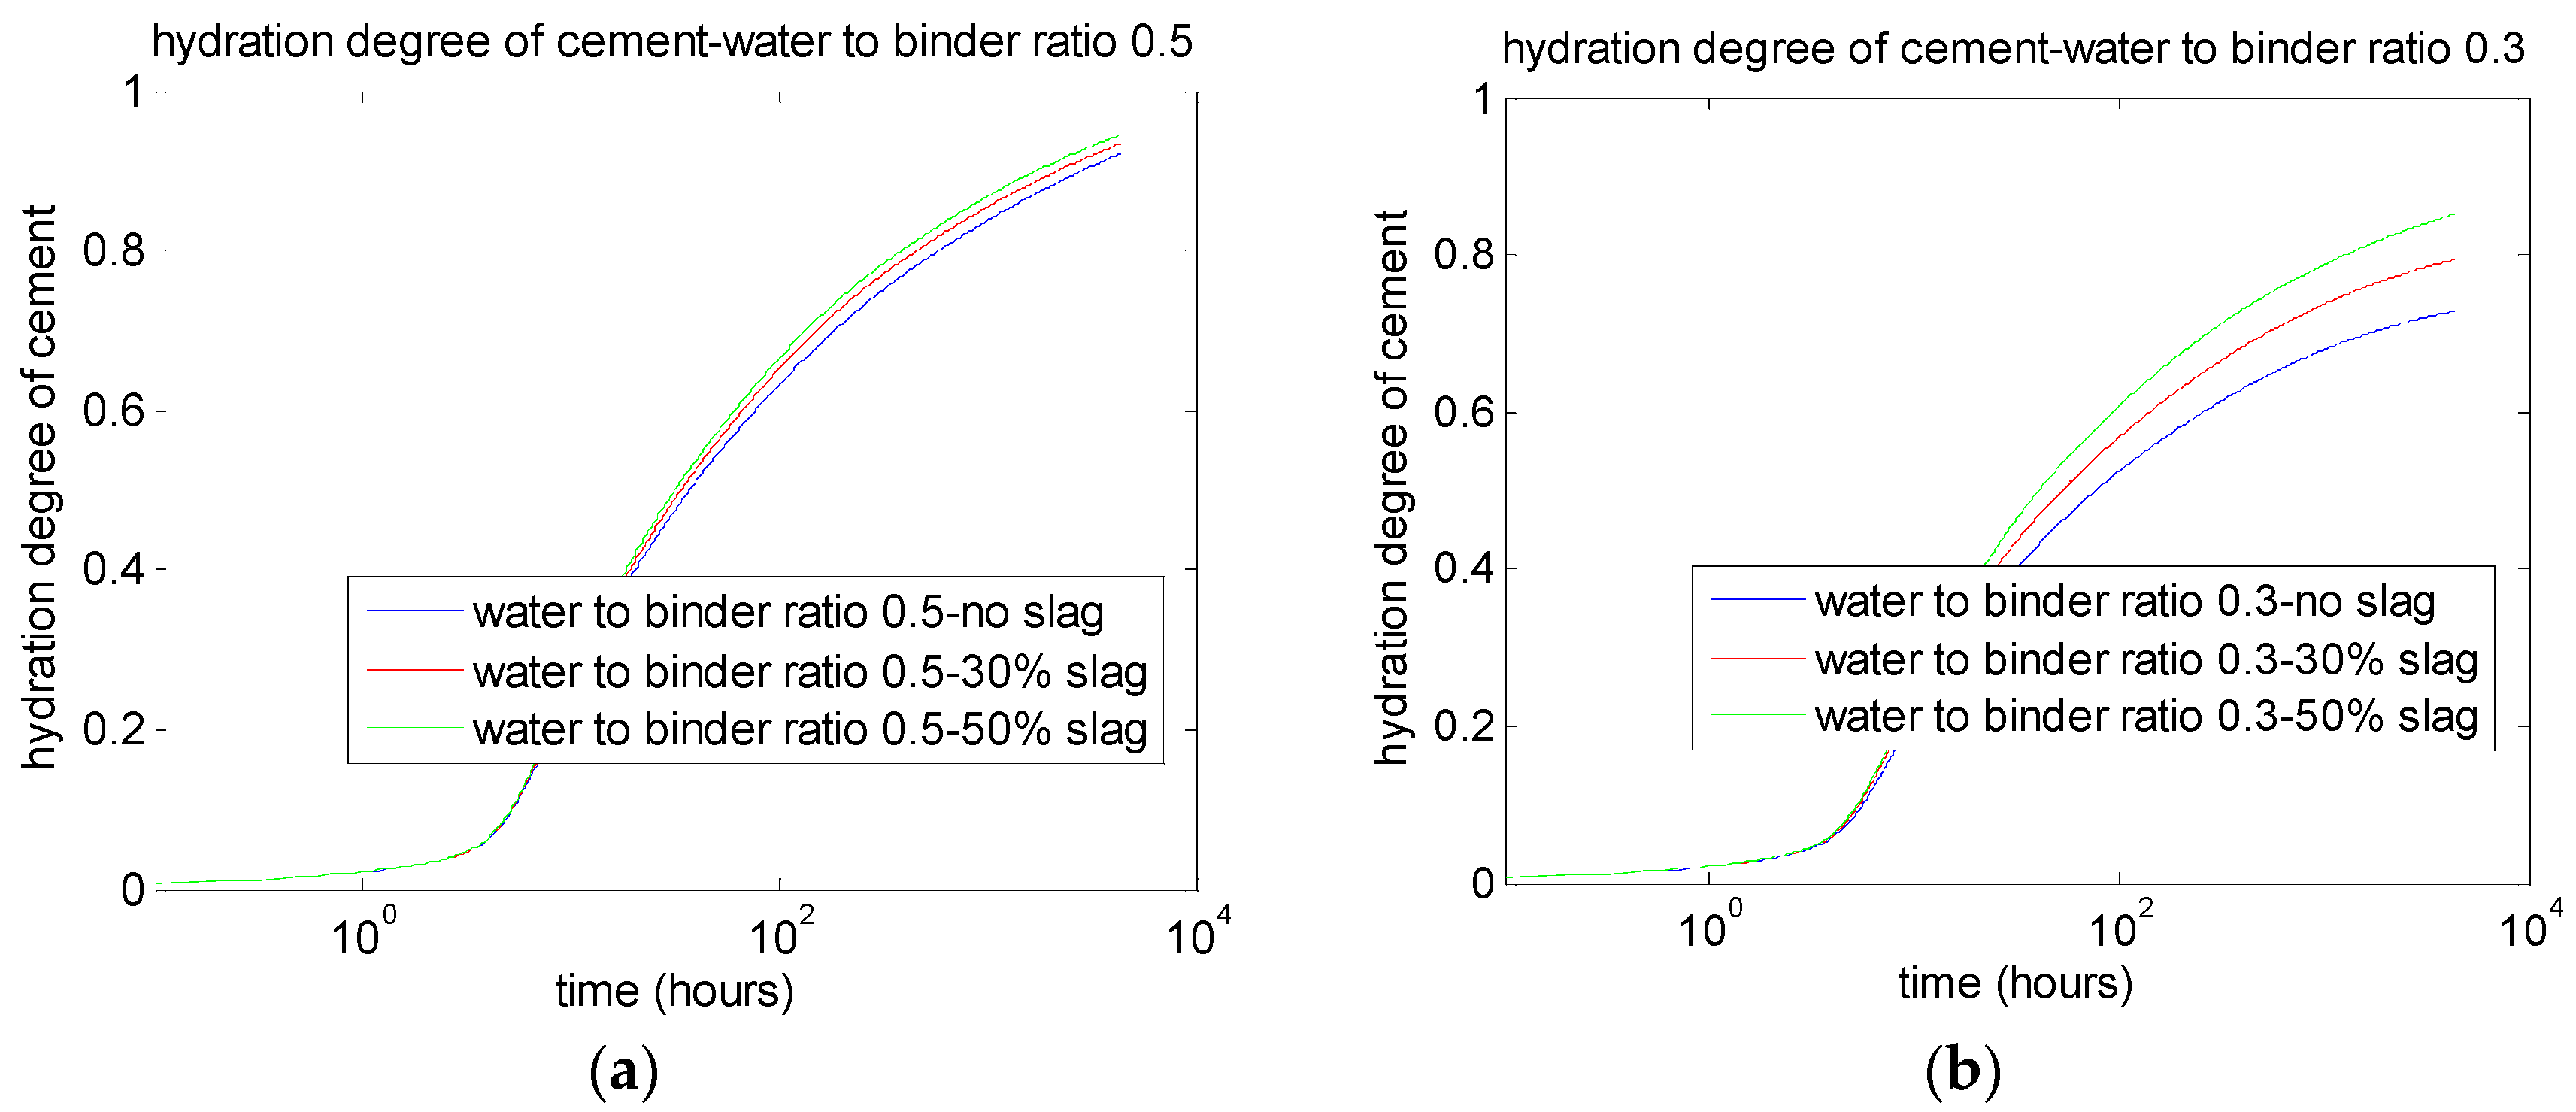
In our proposed hydration model, the hydration degree of cement and reaction degree of slag are adopted as fundamental indicators to evaluate properties of hardening slag-blended concrete. The hydration degree of cement (α) is defined as the ratio of the mass of hydrated cement to the mass of cement in the mixing proportion. The value of the hydration degree of cement (α) ranges between 0 and 1. α = 0 means cement hydration does not start and α = 1 means all the cement has been hydrated. The hydration degree of cement can be determined using an integration method in the time domain ( α = 0 t ( d α d t ) d t , where t is time; d α d t is the rate of cement hydration. The detailed equation for d α d t is available in our former research [26,
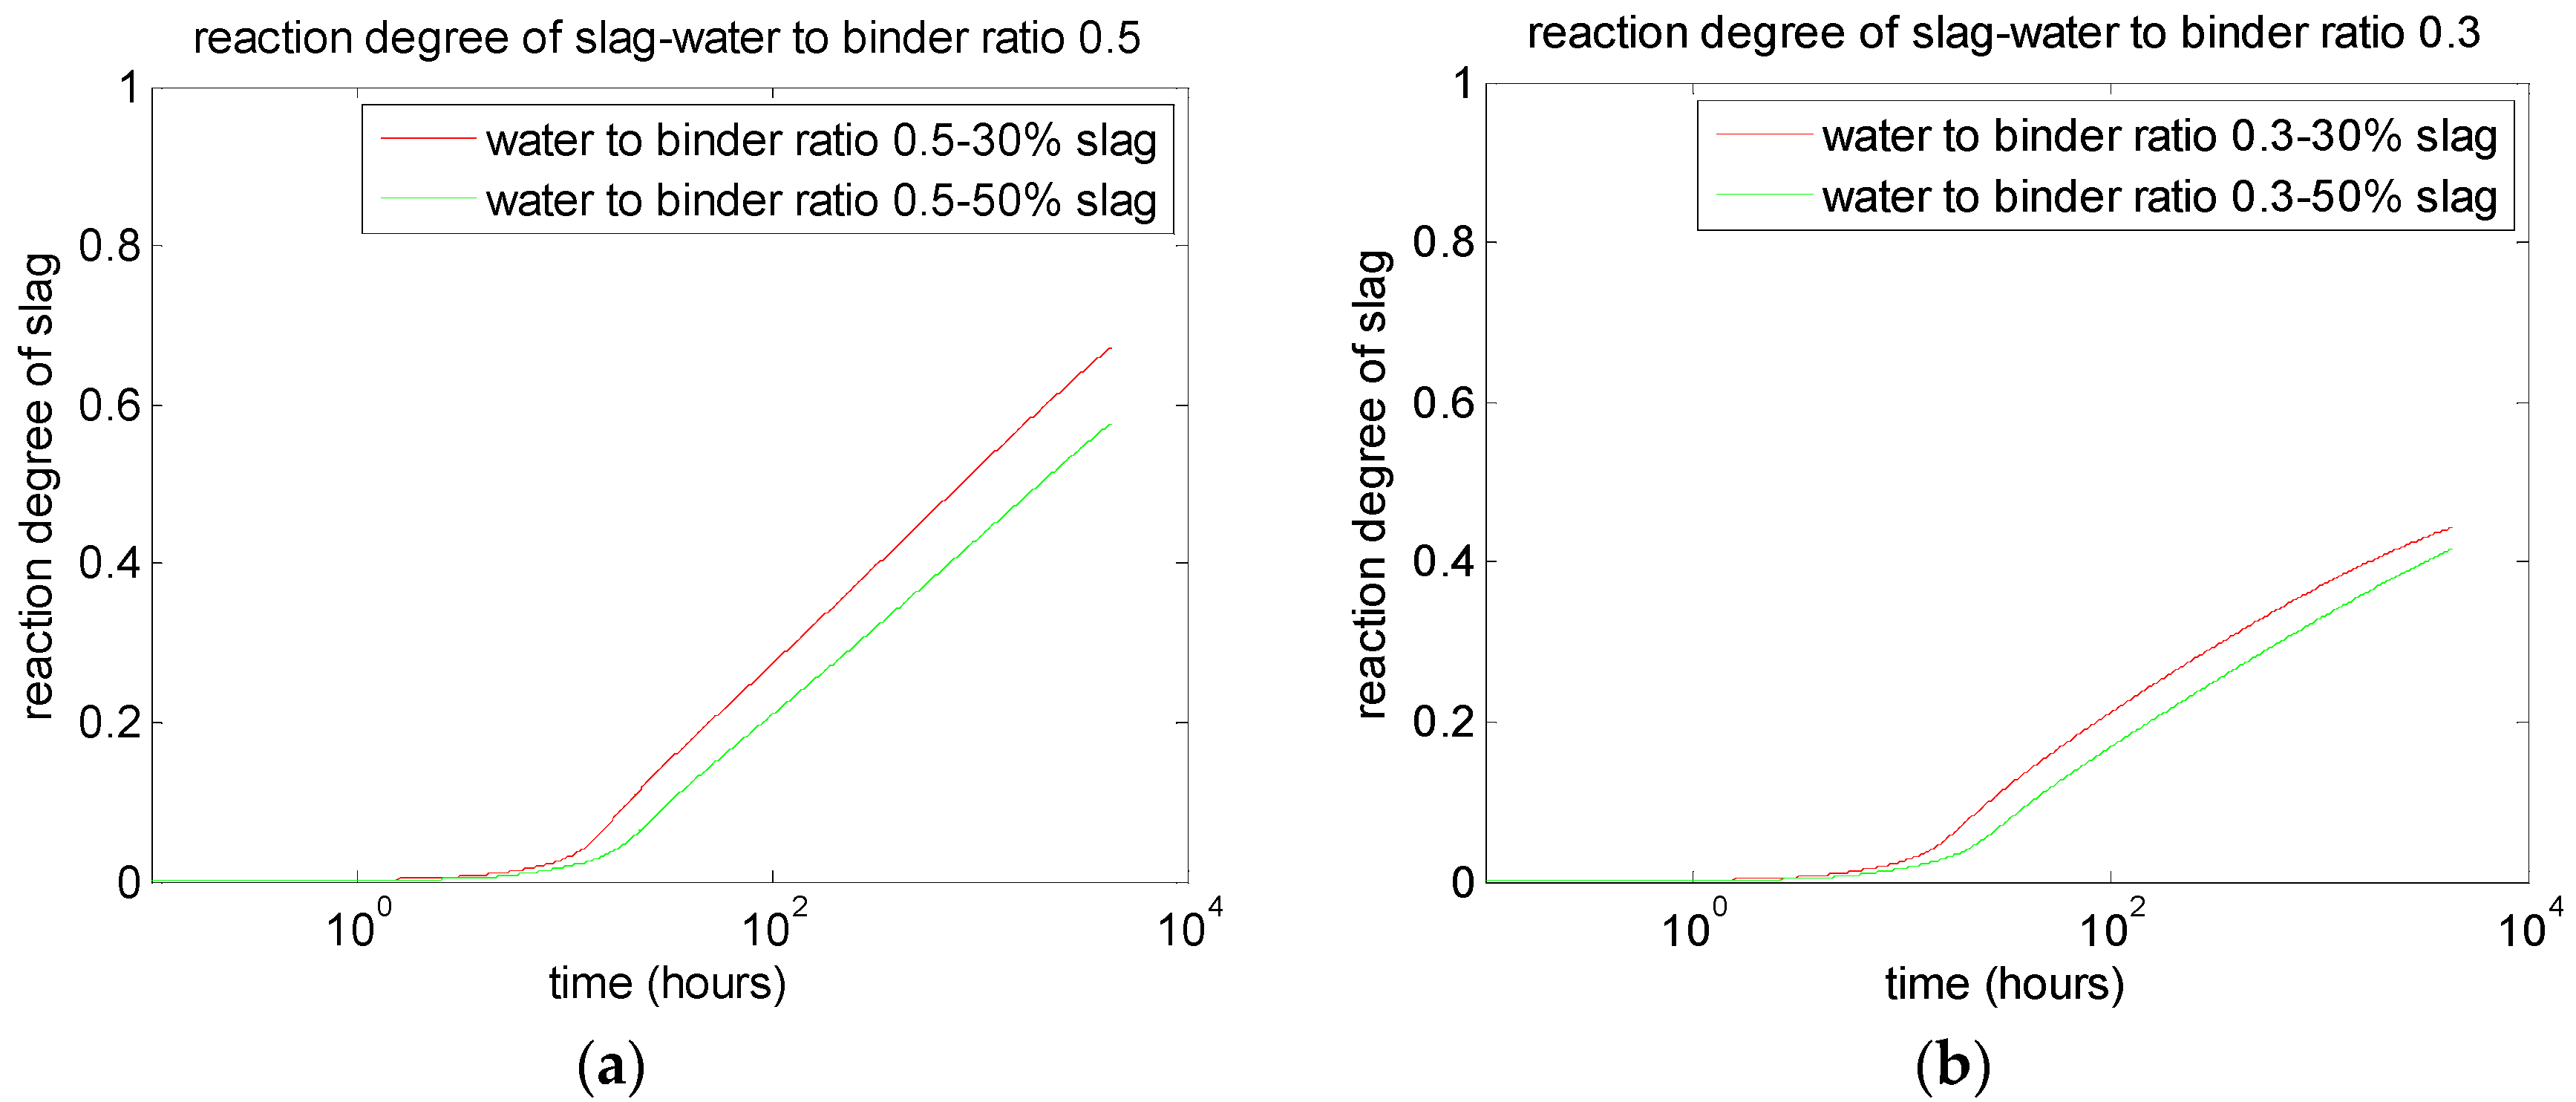
27]). Similarly, the reaction degree of slag (αSG) is defined as the ratio of the mass of reacted slag to the mass of slag in the mixing proportion. The value of the reaction degree of slag (αSG) ranges between 0 and 1. αSG = 0 means the slag reaction does not start and αSG = 1 means all the slag has reacted. The reaction degree of slag can also be determined using an integration method in the time domain ( α S G = 0 t ( d α S G d t ) d t , where d α S G d t is the rate of the slag reaction. The detailed equation for d α S G d t is available in our former research [26,27]).
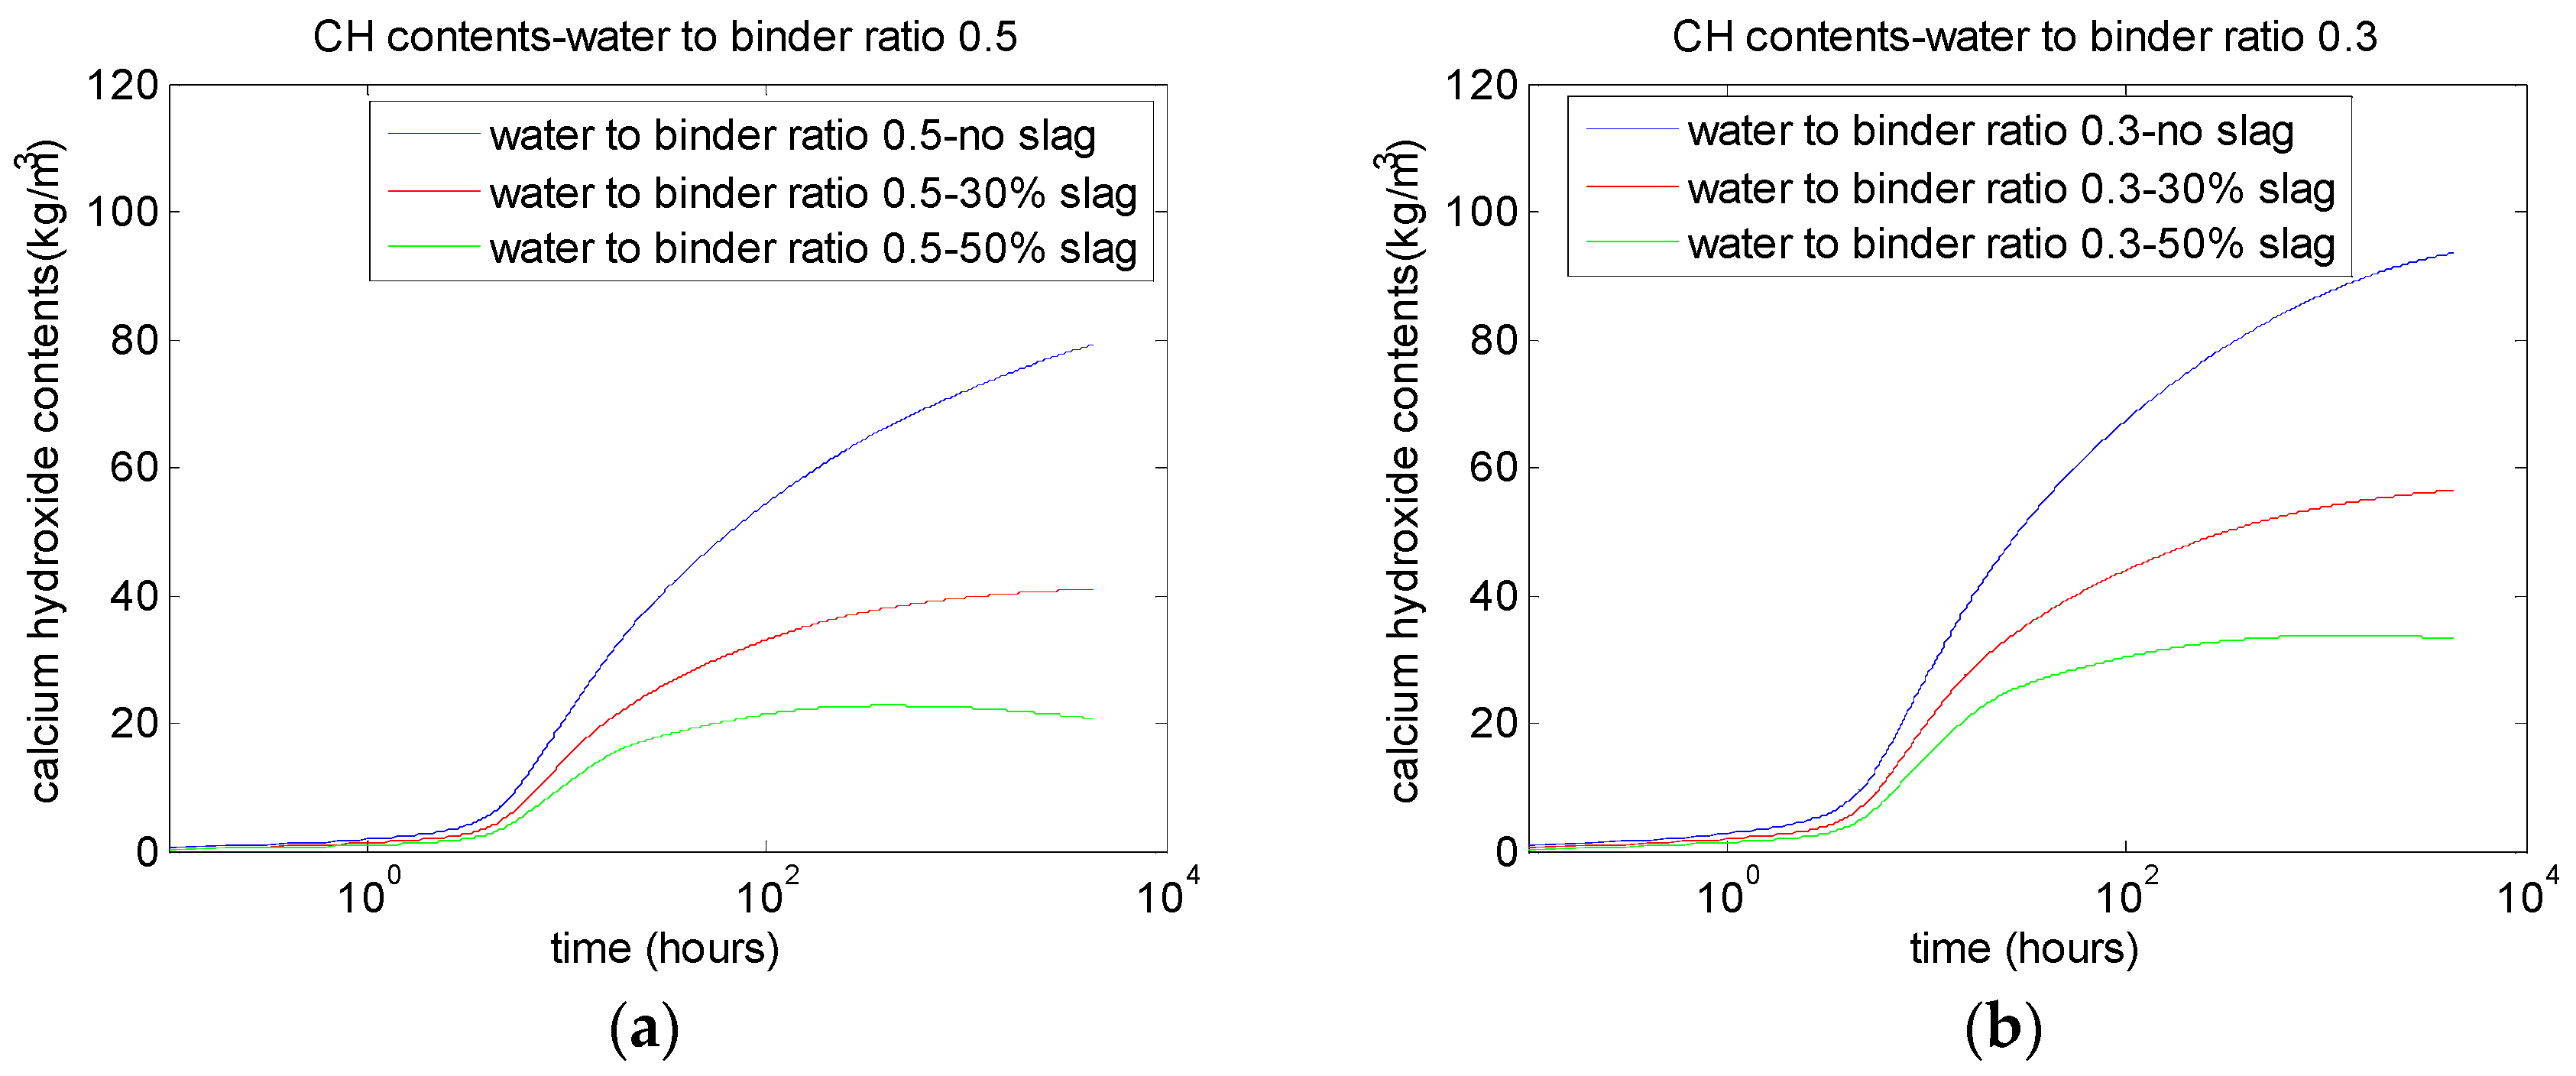
For slag-blended concrete, calcium hydroxide and calcium silicate hydrate are carbonatable materials. Cement hydration produces calcium hydroxide, while the slag reaction consumes calcium hydroxide. Considering the production and consumption of calcium hydroxide, the amounts of calcium hydroxide in cement–slag can be determined as follows [26,27]:
C H ( t ) = R C H C E × C 0 × α ν S G × α S G × P ,
where RCHCE denotes the mass of calcium hydroxide produced by 1-unit mass cement hydration; C0 is the mass of cement; α denotes the degree of cement hydration; vSG denotes the stoichiometric ratio of the mass of CH to slag (vSG = 0.22 [28,29]); αSG denotes the degree of reaction of slag; and P is the mass of mineral mixtures. RCHCE × C0 × α considers the production of calcium hydroxide from cement hydration, while νSG × αSG × P considers the consumption of calcium hydroxide from the slag reaction.
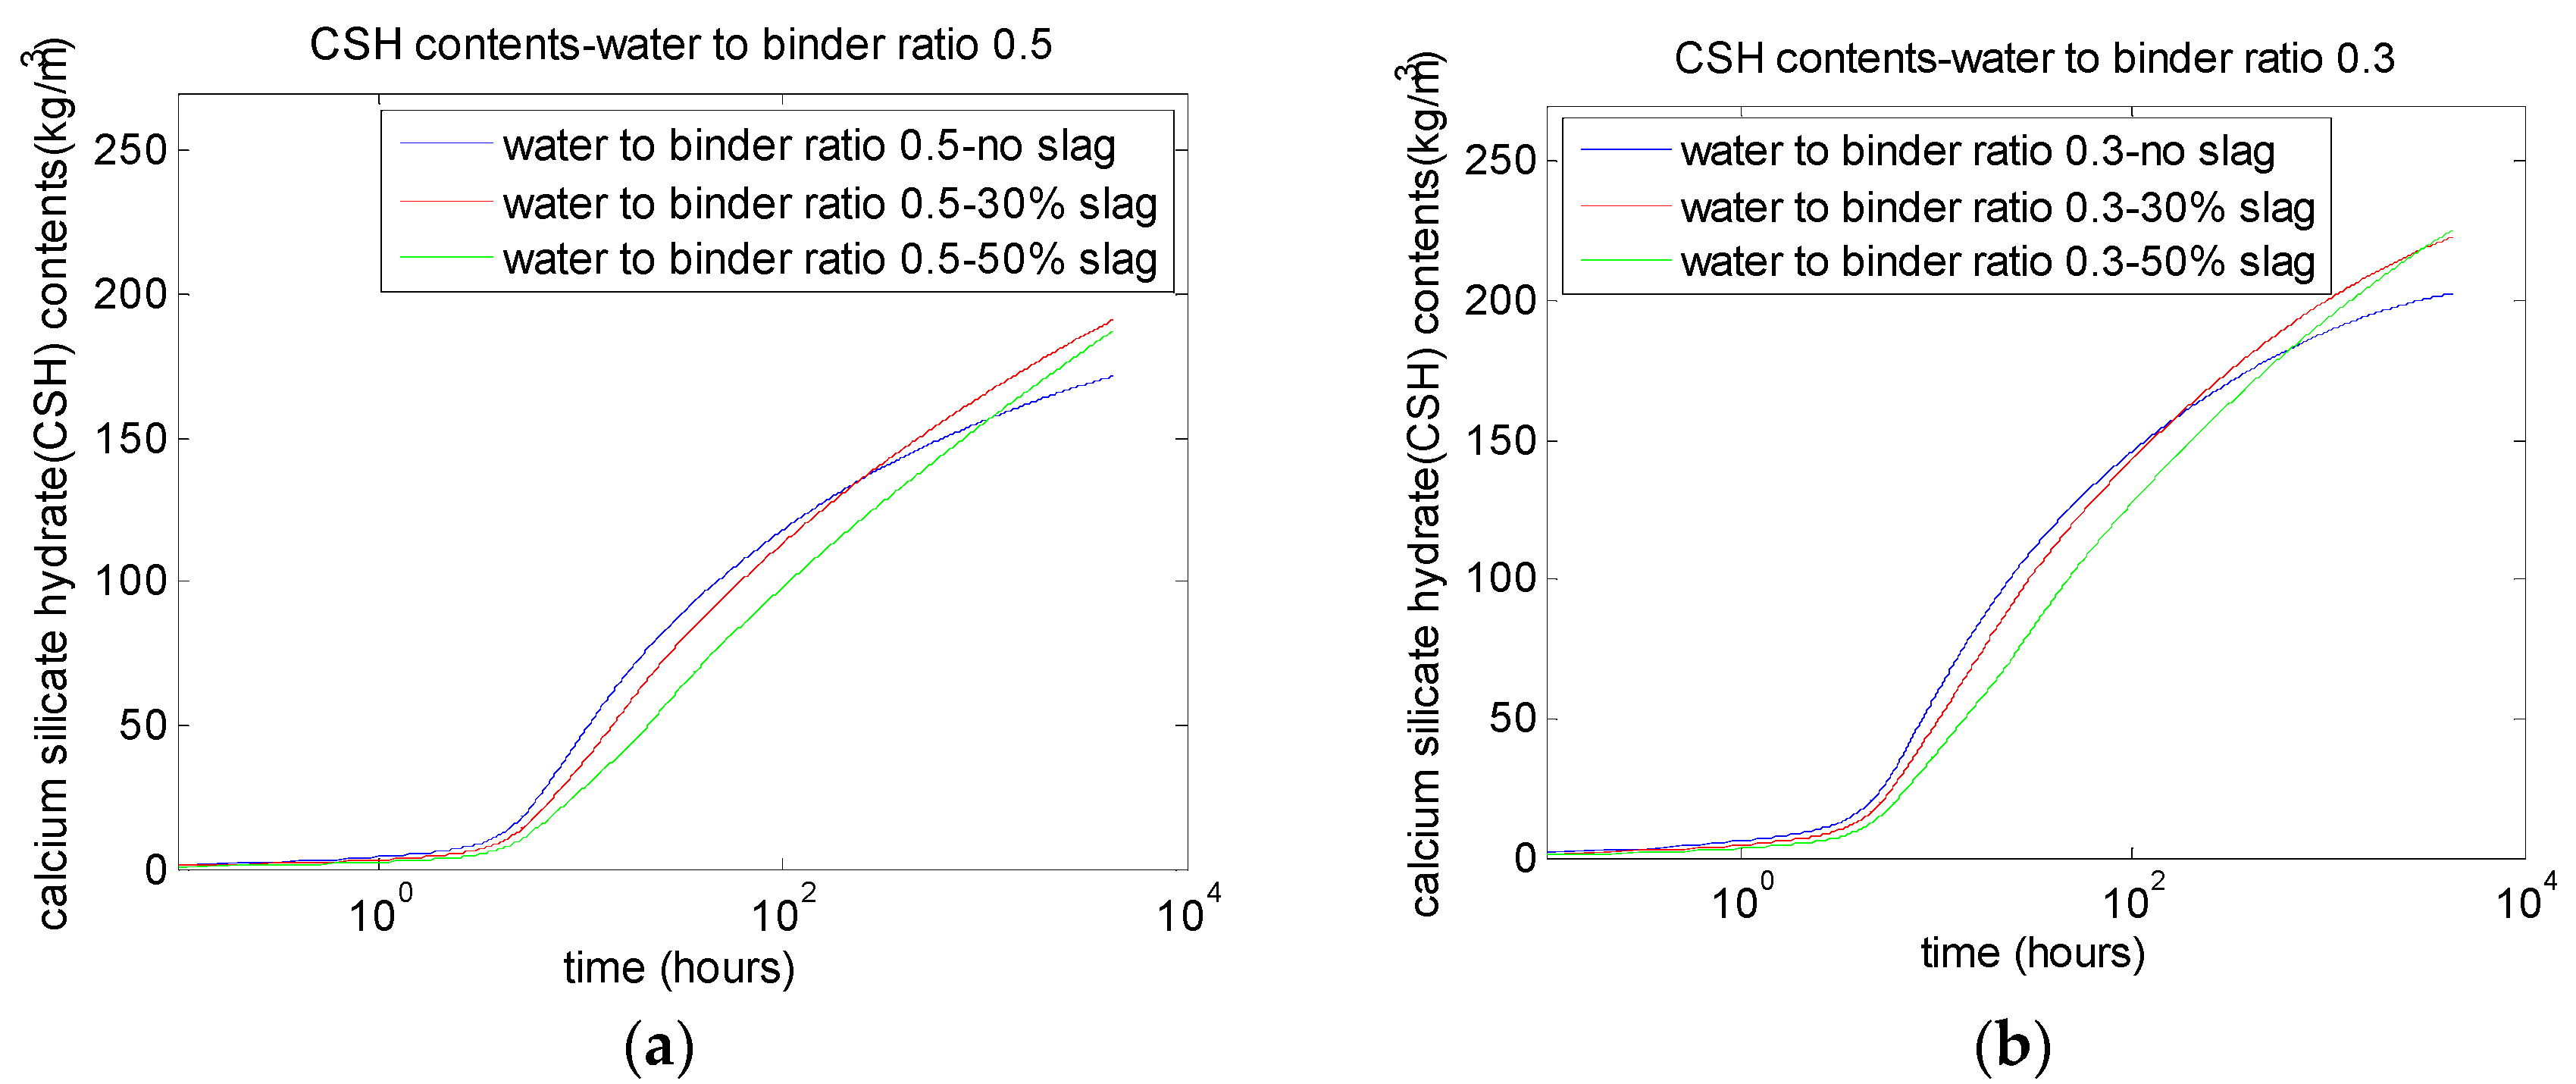
For slag-blended concrete, the calcium silicate hydrate (CSH) content, which is the most critical parameter to strength development, can be calculated as a function of the binder content, reaction degree of binders, the weight fraction of reactive silica in slag, and the weight fractions of the SiO2 in the slag and cement. The amount of CSH in hardening slag-blended concrete can be calculated as follows [26,27]:
C S H ( t ) = 2.85 ( f S , C × C 0 × α + γ s × f S , P × P × α S G ) ,
where fS,C is the weight fraction of silica in cement and fS,P is the weight fraction of silica in slag; and γS is the weight fraction of the reactive SiO2 in the slag. The coefficient 2.85 is the mass ratio between the molar weight of CSH and the weight of oxide SiO2 in CSH. fS,C × C0 × α considers the CSH production from cement hydration, while γS × fS,P × P × αSG considers the CSH production from the slag reaction.
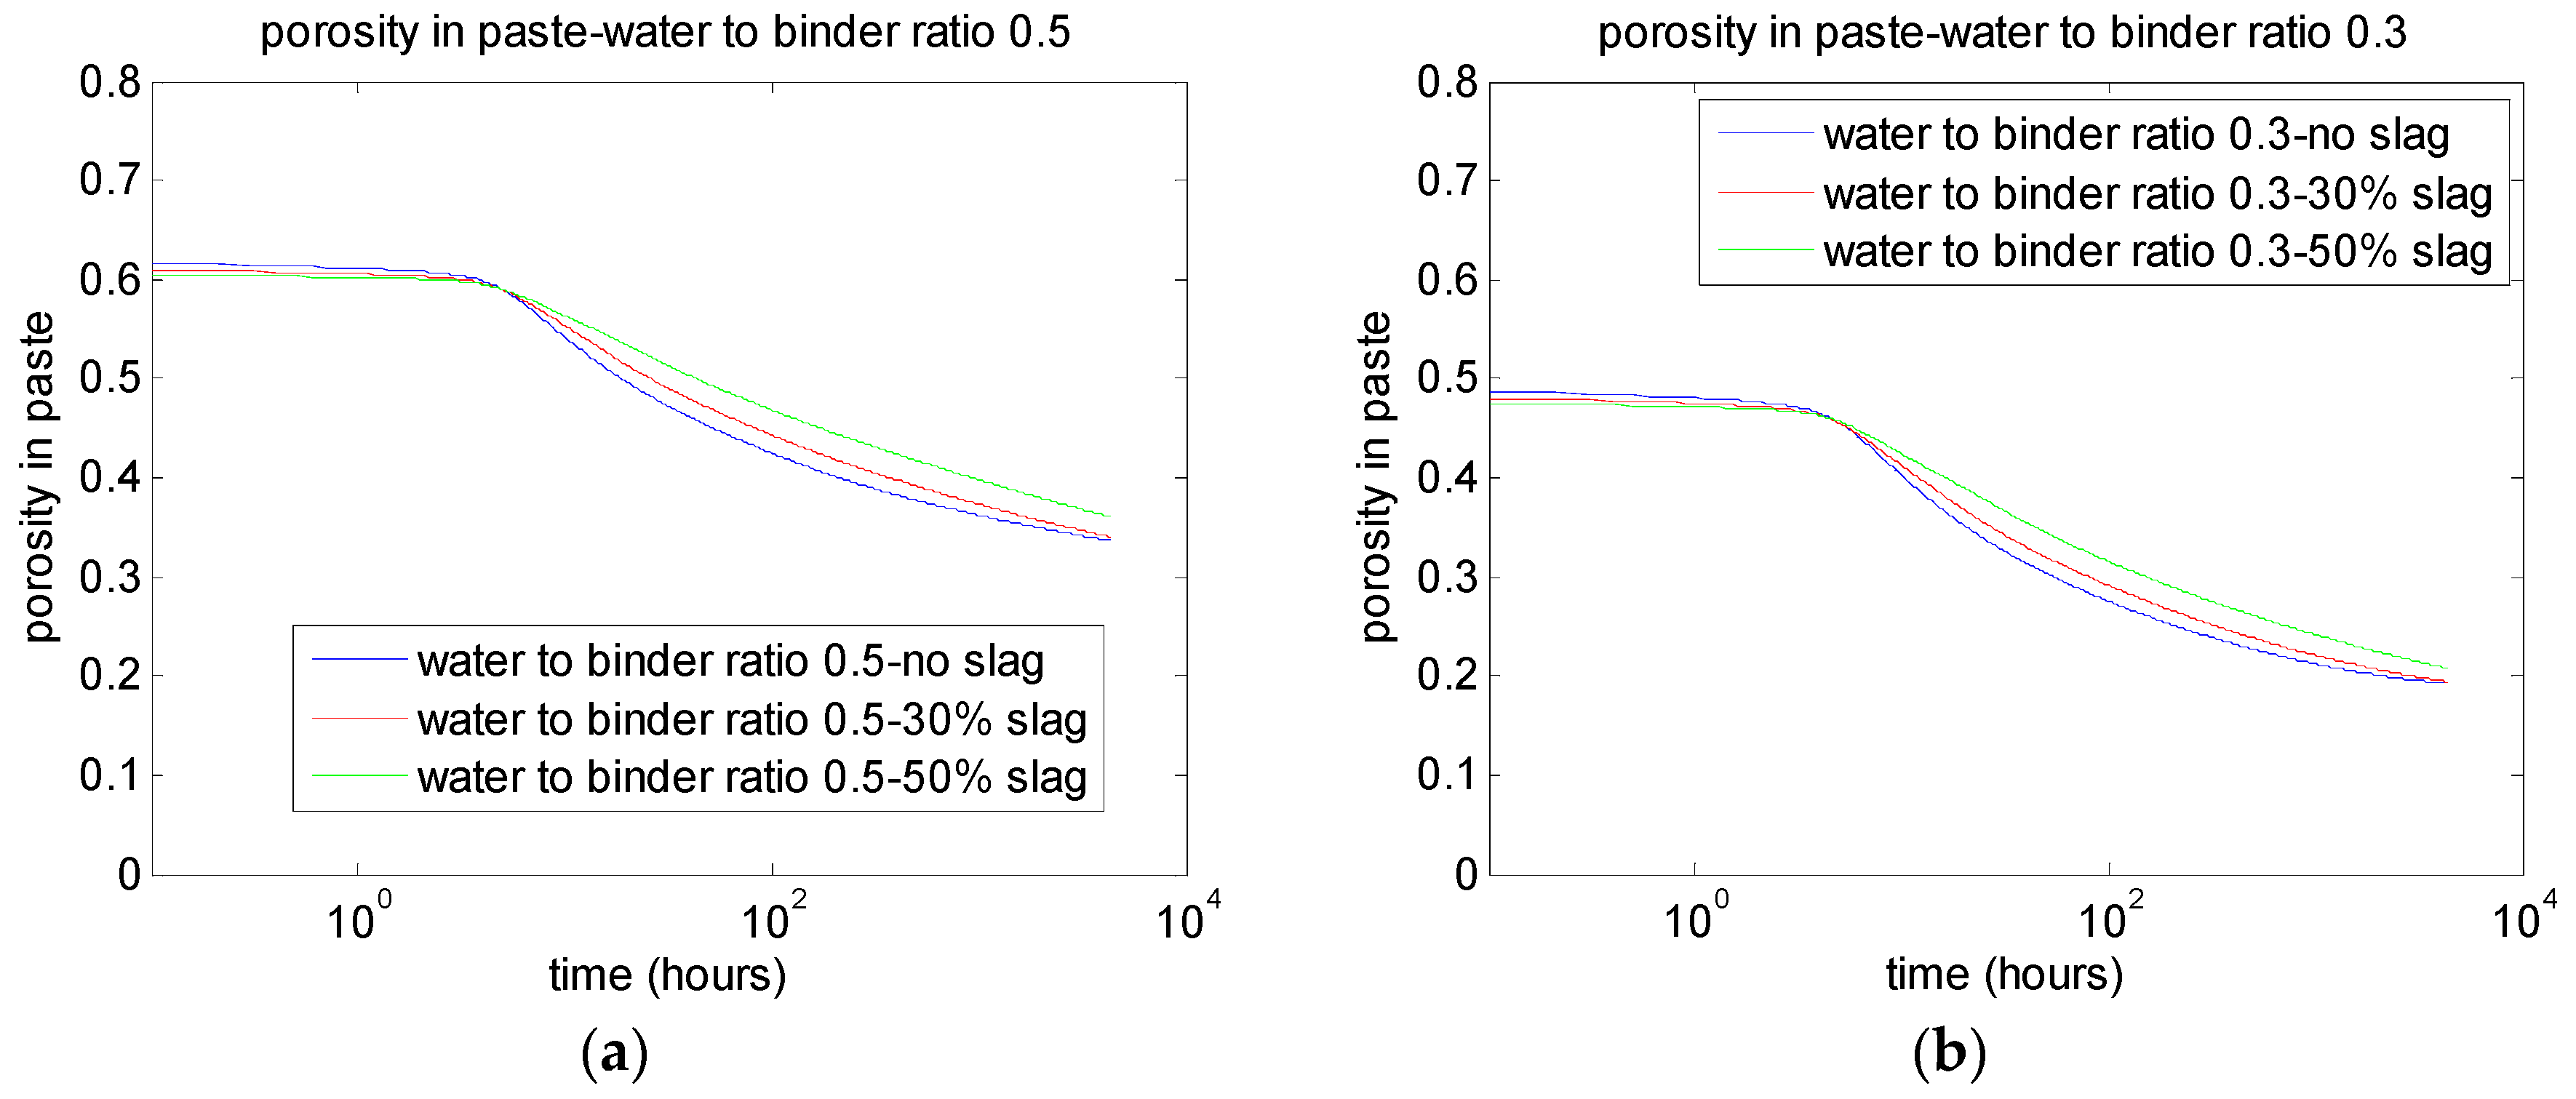
The porosity of hydrating blends is reduced due to the Portland cement hydration, reaction of slag, and carbonation of concrete. The porosity, ε, can be estimated as follows [26,27]:
ε ( t ) = W ρ W 0.25 × C 0 × α 0.3 × α S G × P Δ ε C ,
where ε is porosity, W is water content, and ρW is the density of water. 0.25 × C0 × α considers the porosity reduction from cement hydration, while 0.3 × αSG × P considers the porosity reduction from the slag reaction; ΔεC is the reduction of porosity due to the carbonation of concrete.
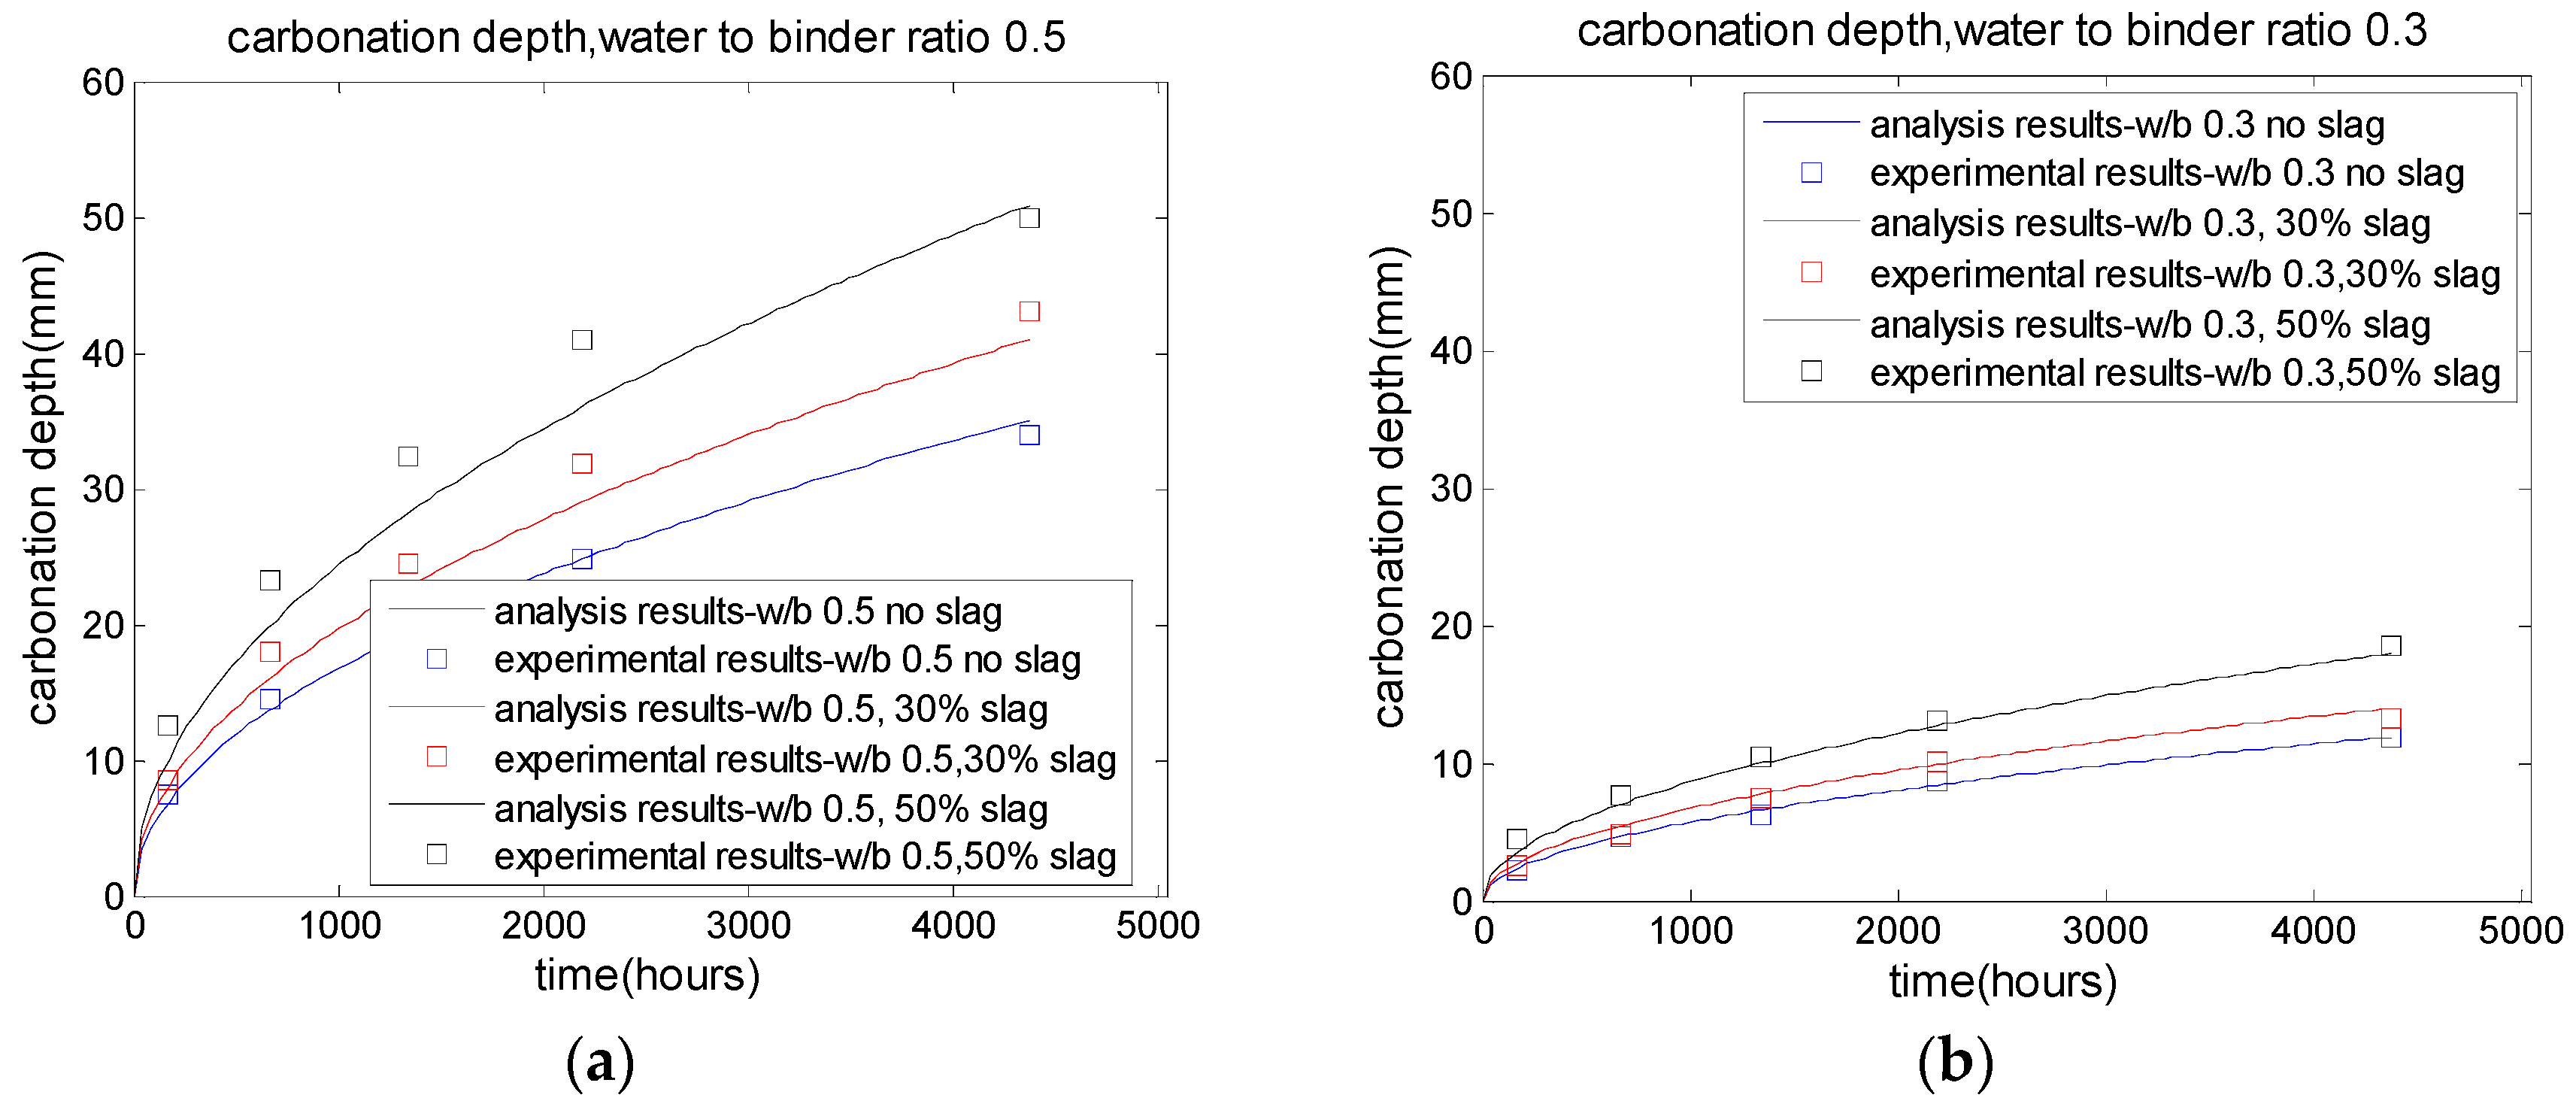
The calculation results from Equations (4)–(6) can used as input parameters for carbonation depth calculation models. For the usual range of parameters (especially for relative humidity higher than 55%, where CO2 diffusion controls the carbonation process [8,9]), a carbonation front will take place that distinguishes concrete as one of two different parts: a fully carbonated part and one part in which concrete carbonation has not started at all. The distance between this carbonation front and the outer concrete surface is called the carbonation depth, and for the most common one-dimensional cases, its evolution with time is given by a simple analytical expression, in terms of the composition and the environmental conditions. The evolution of concrete carbonation depth xc with time t is calculated as follows [8,9,26,27]:
x c = 2 D C [ C O 2 ] 0 t 0.33 CH + 0.214 CSH
D C = A ( ε C 0 ρ c + P ρ S G + W 0 ρ w ) a ( 1 R H 100 ) 2.2 ,
where [CO2]0 is the ambient concentration of CO2 at the concrete surface and A and a are reaction parameters. 0.33CH + 0.214CSH in the denominator of Equation (7) denotes the CO2 uptake ability of concrete. RH in Equation (8) is the ambient relative humidity (because carbonation generally occurs at the surface region of concrete, Papadakis [8,9] assumed that the relative humidity in the carbonated zone is equal to that in the ambient environment). The effect of relative humidity on the rate of hydration can be considered using a reduction factor β R H = [ R H 0.55 0.45 ] 4 for RH > 0.55 and βRH = 0 for RH < 0.55 [26,27,30,31]). In Equations (4)–(6), to consider the further hydration of binders during the concrete carbonation period, items α and αSG should be multiplied by βRH. The influence of temperature on carbonation depth can be considered using the activation energy [8,9,26,27,32,33,34,35,36].
The CO2 uptake due to concrete carbonation can be determined as follows:
C O 2 u = x c × S × ( 0.33 C H + 0.214 C S H ) ,
where CO2u is the CO2 uptake due to carbonation and S is the surface area of the building. In Equation (9), the unit of xc is m, the unit of S is m2, and the unit of carbonatable materials CH and CSH is kg/m3; hence, the unit of CO2u is kg (m × m2 × kg/m3 = kg).
The CO2 uptake ratio χ due to carbonation can be calculated as follows:
χ = C O 2 u C O 2 e .
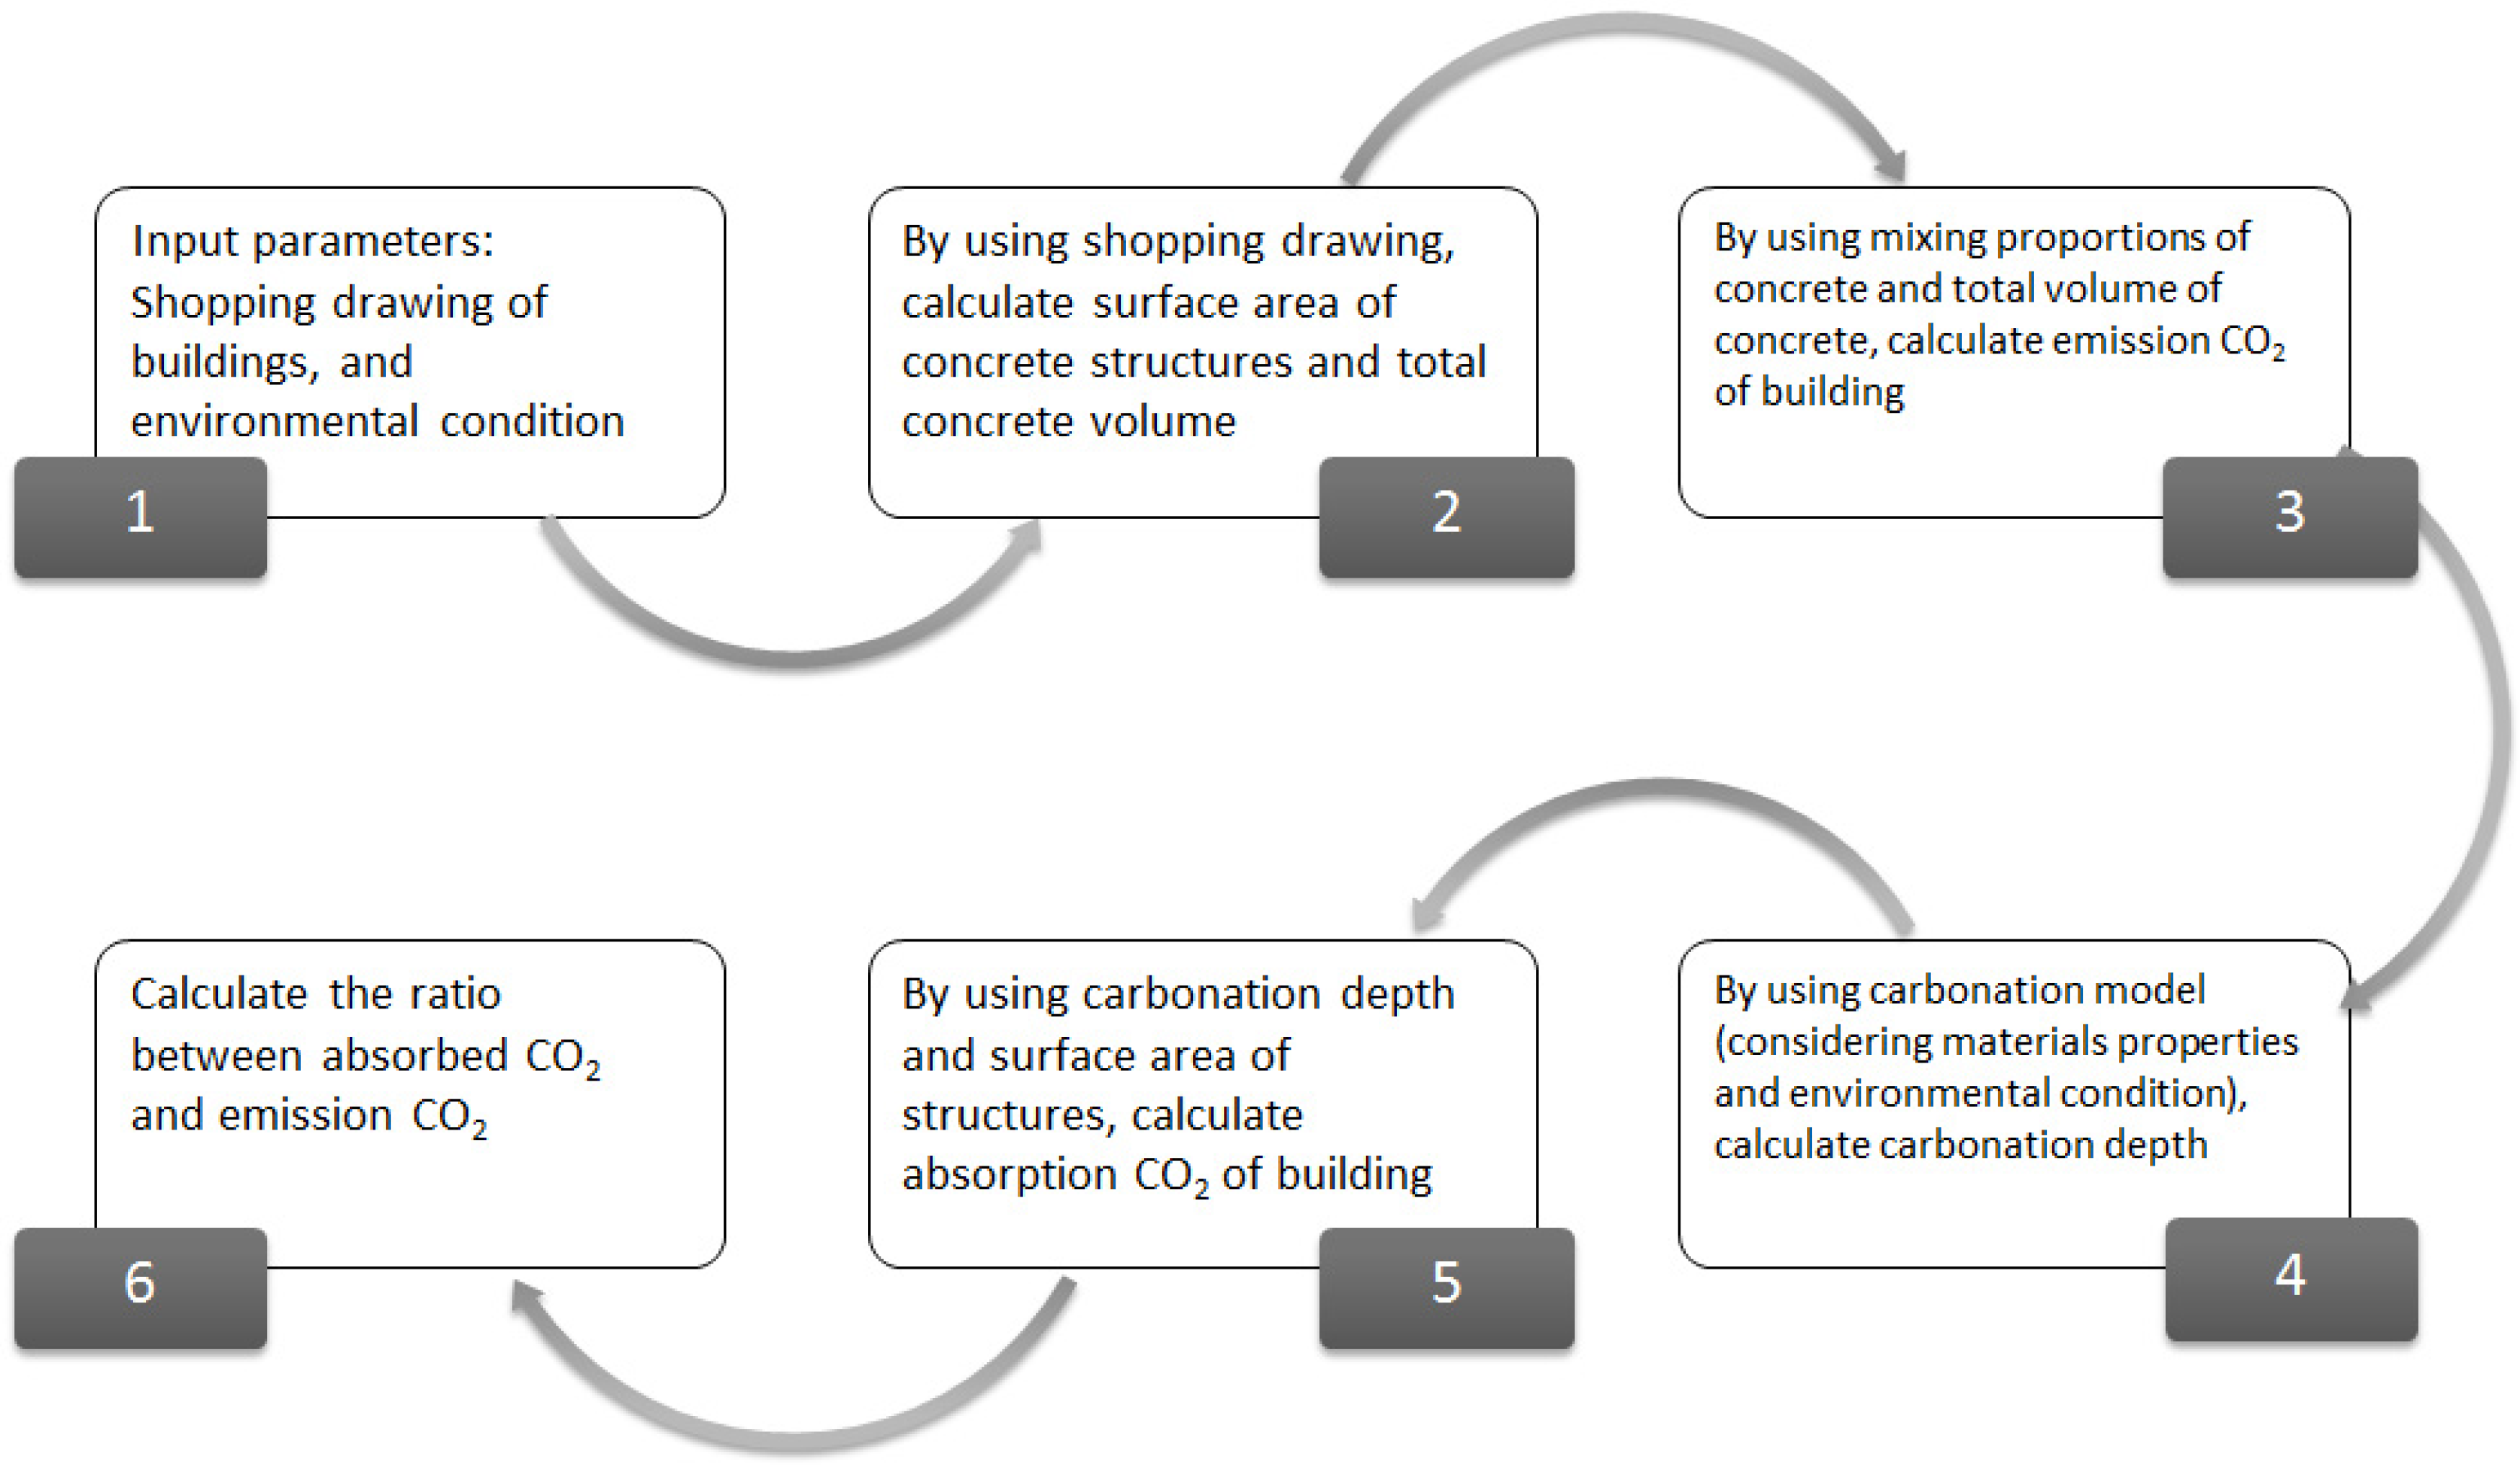
The calculation steps for determining the CO2 uptake ratio are summarized as follows:
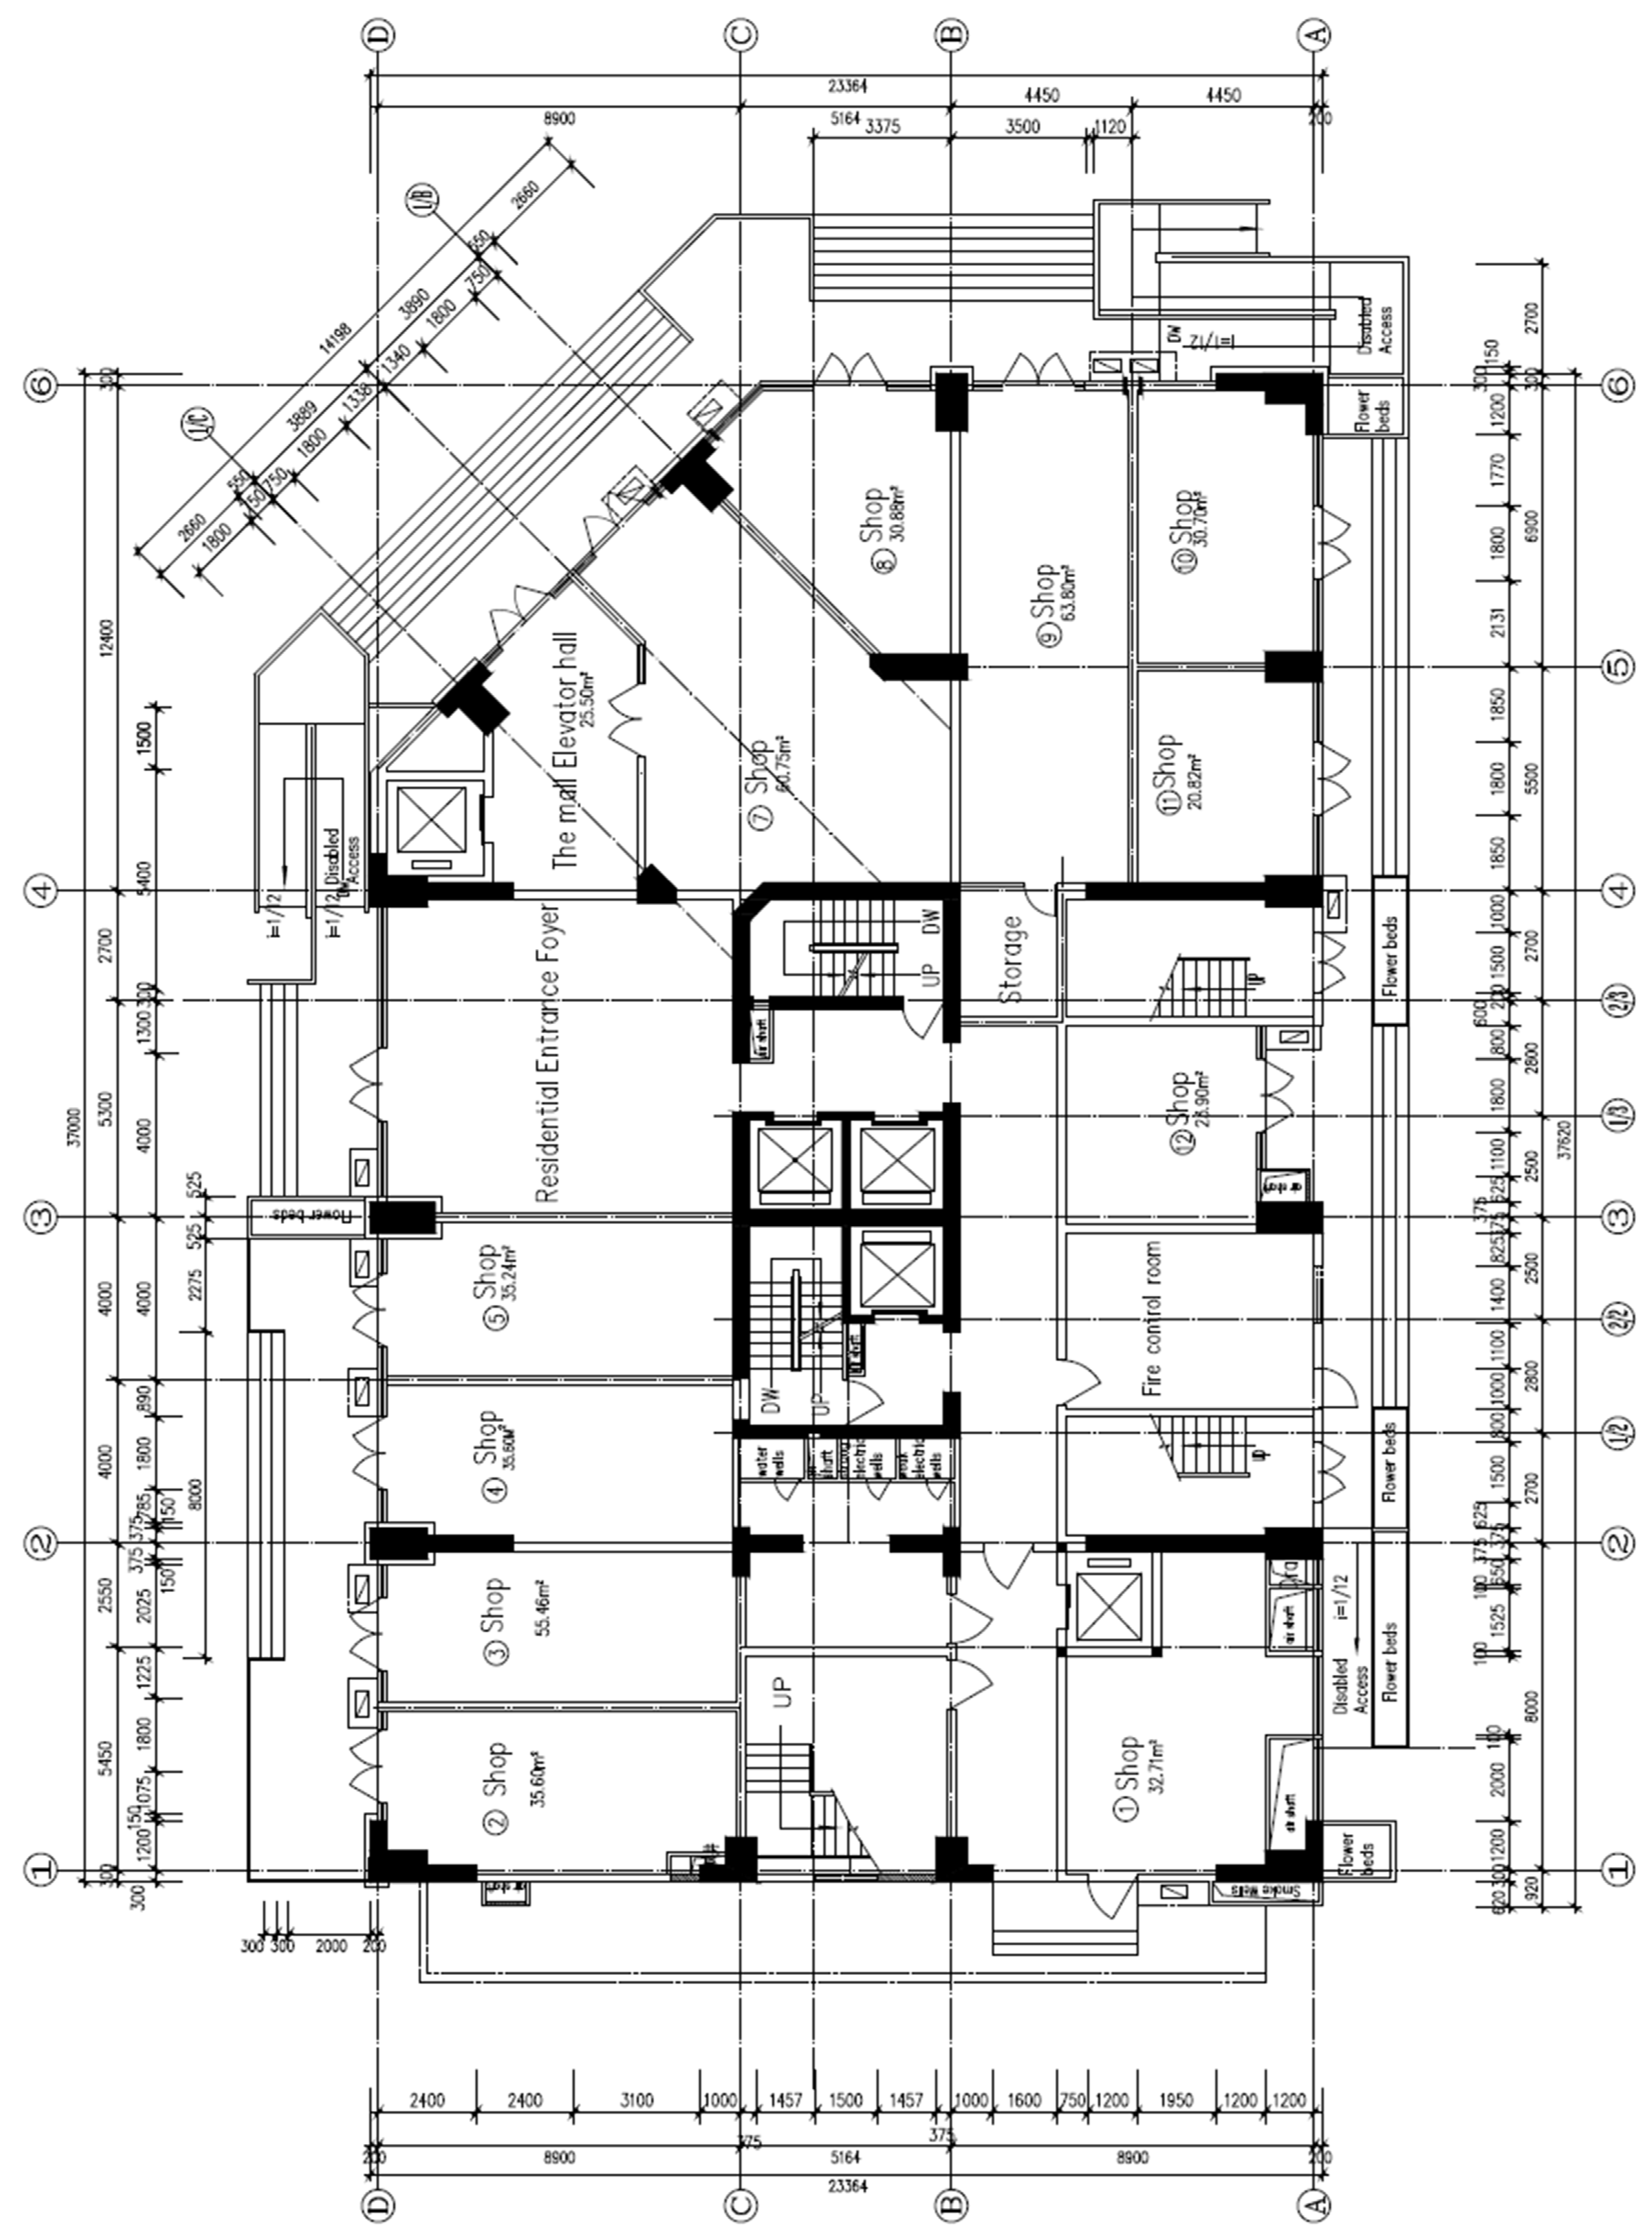
(1)
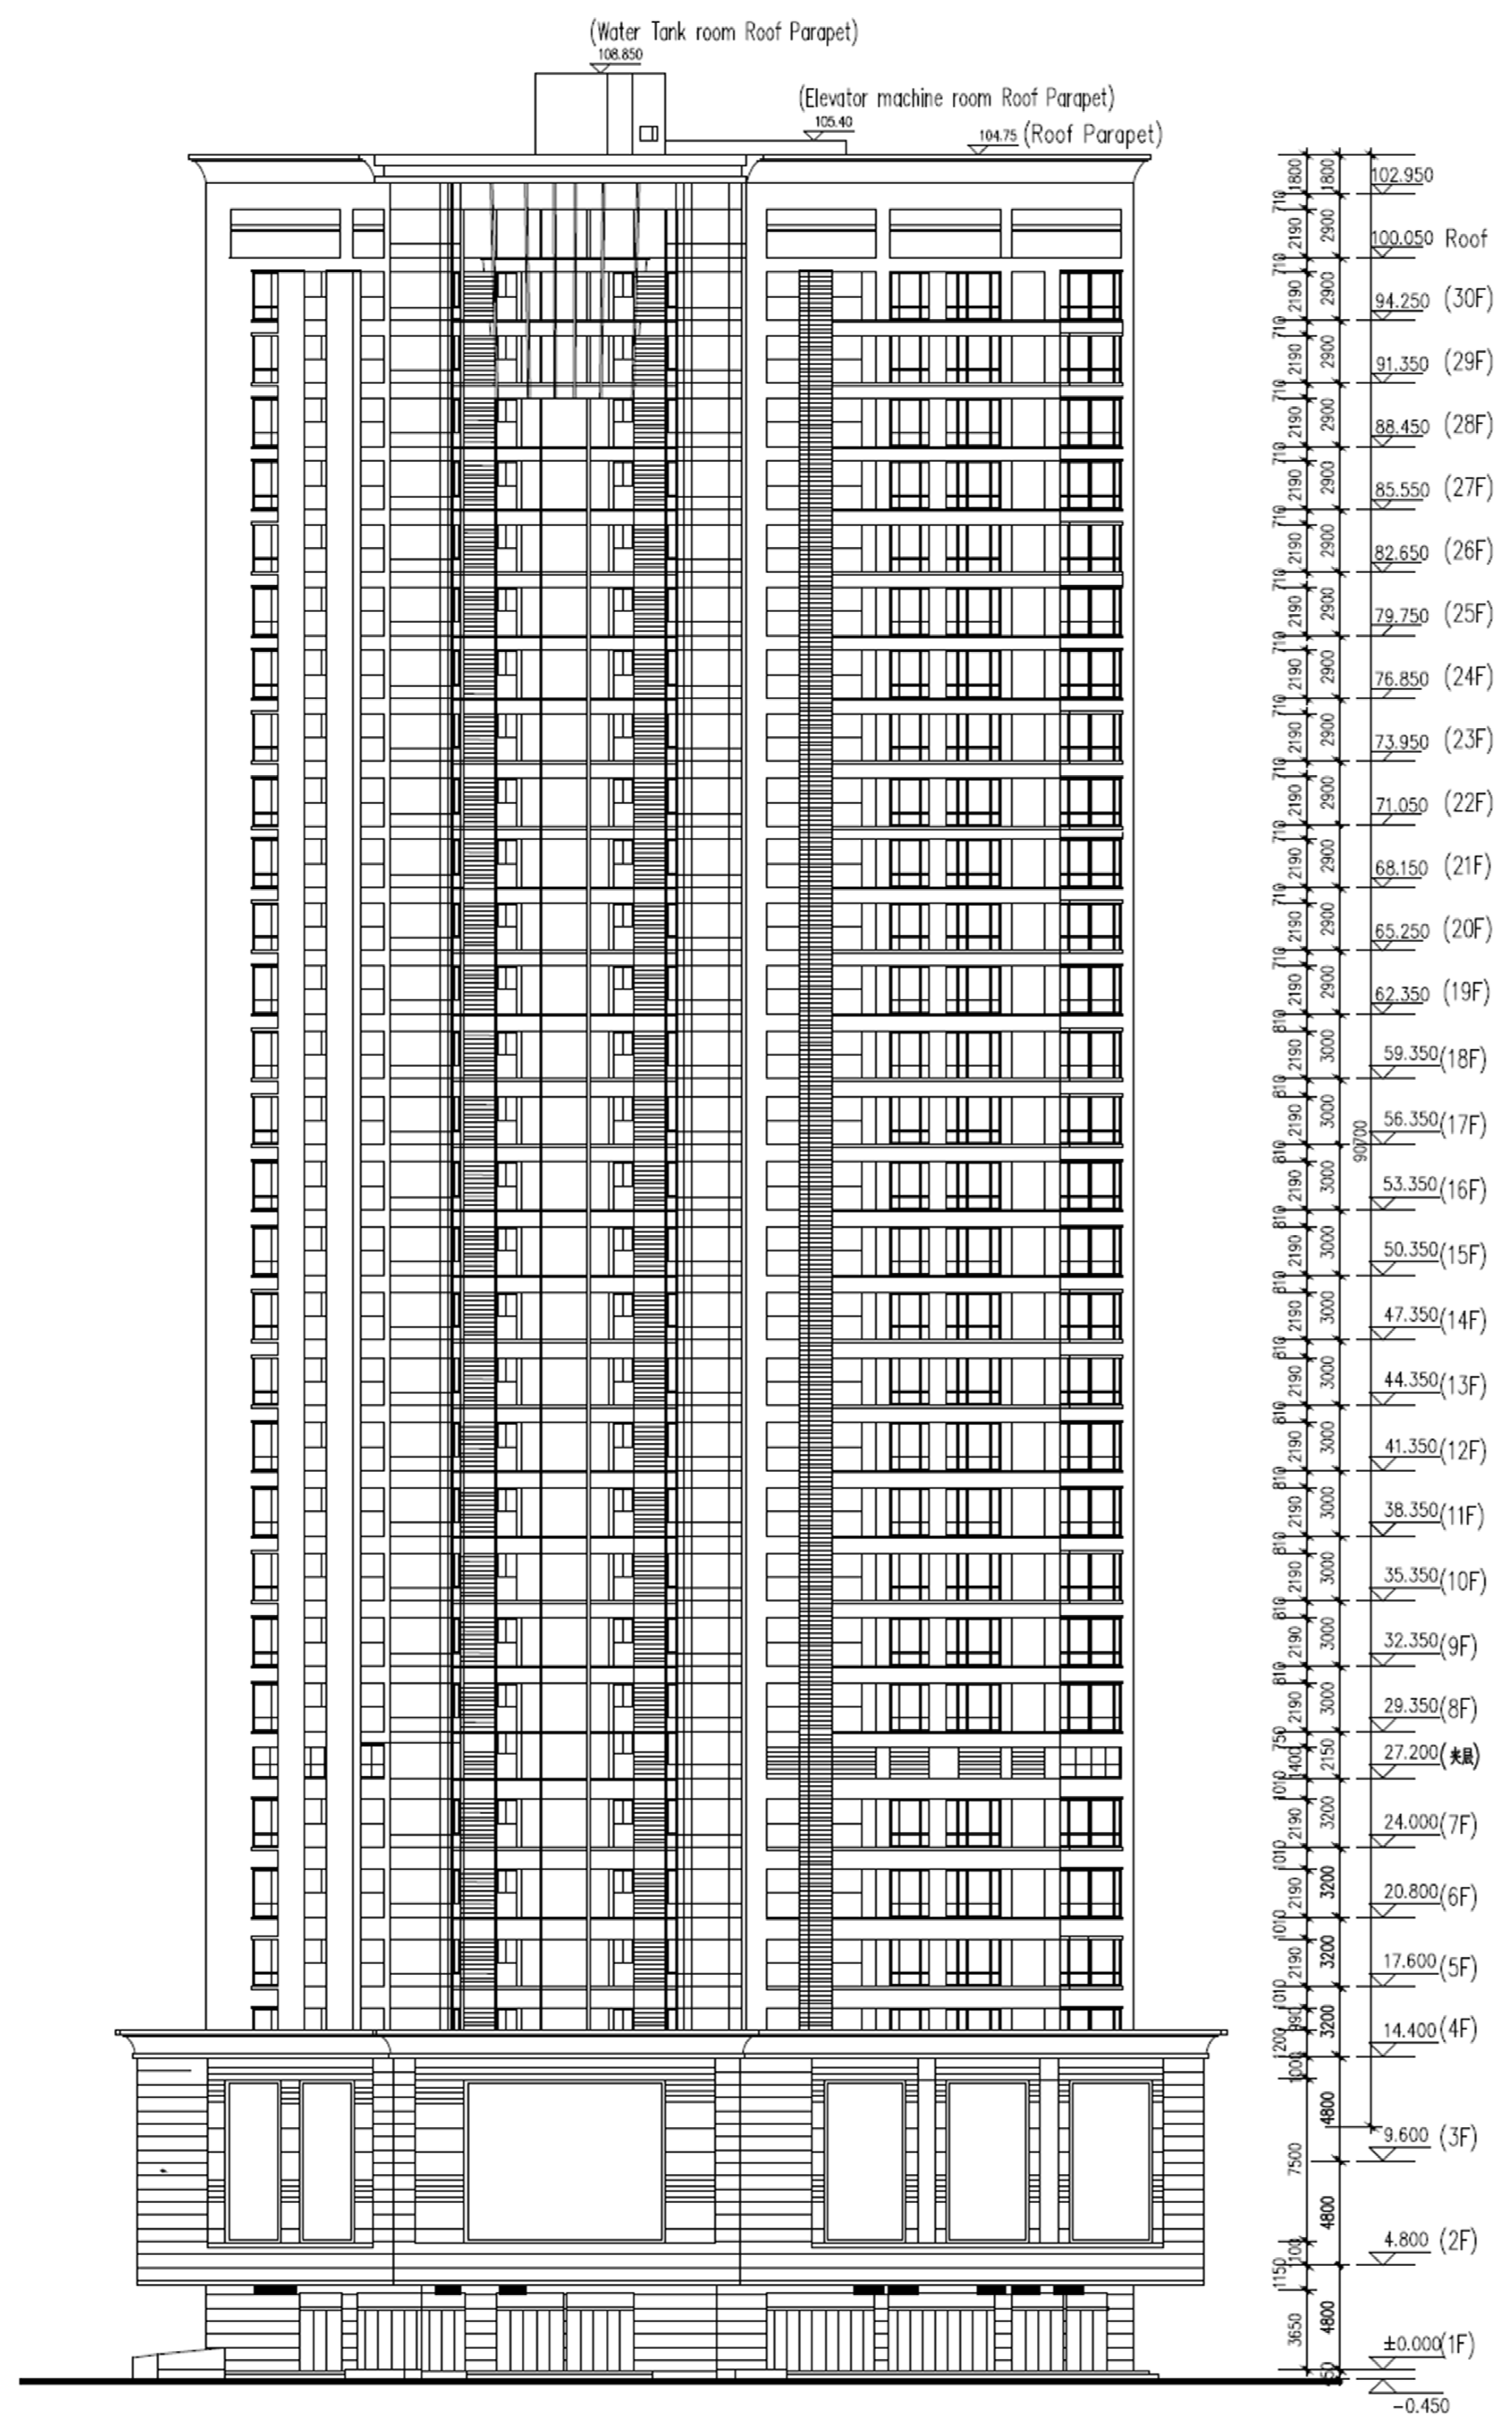
Using building scales and shopping drawings, calculate the total volume and surface area of concrete. The carbon dioxide emissions are calculated using the total volume of concrete and unit carbon dioxide emission of materials (Equation (1)).
(2)
Using the blended cement hydration model, calculate carbonatable materials content and the porosity of concrete (Equations (4)–(6)).
(3)
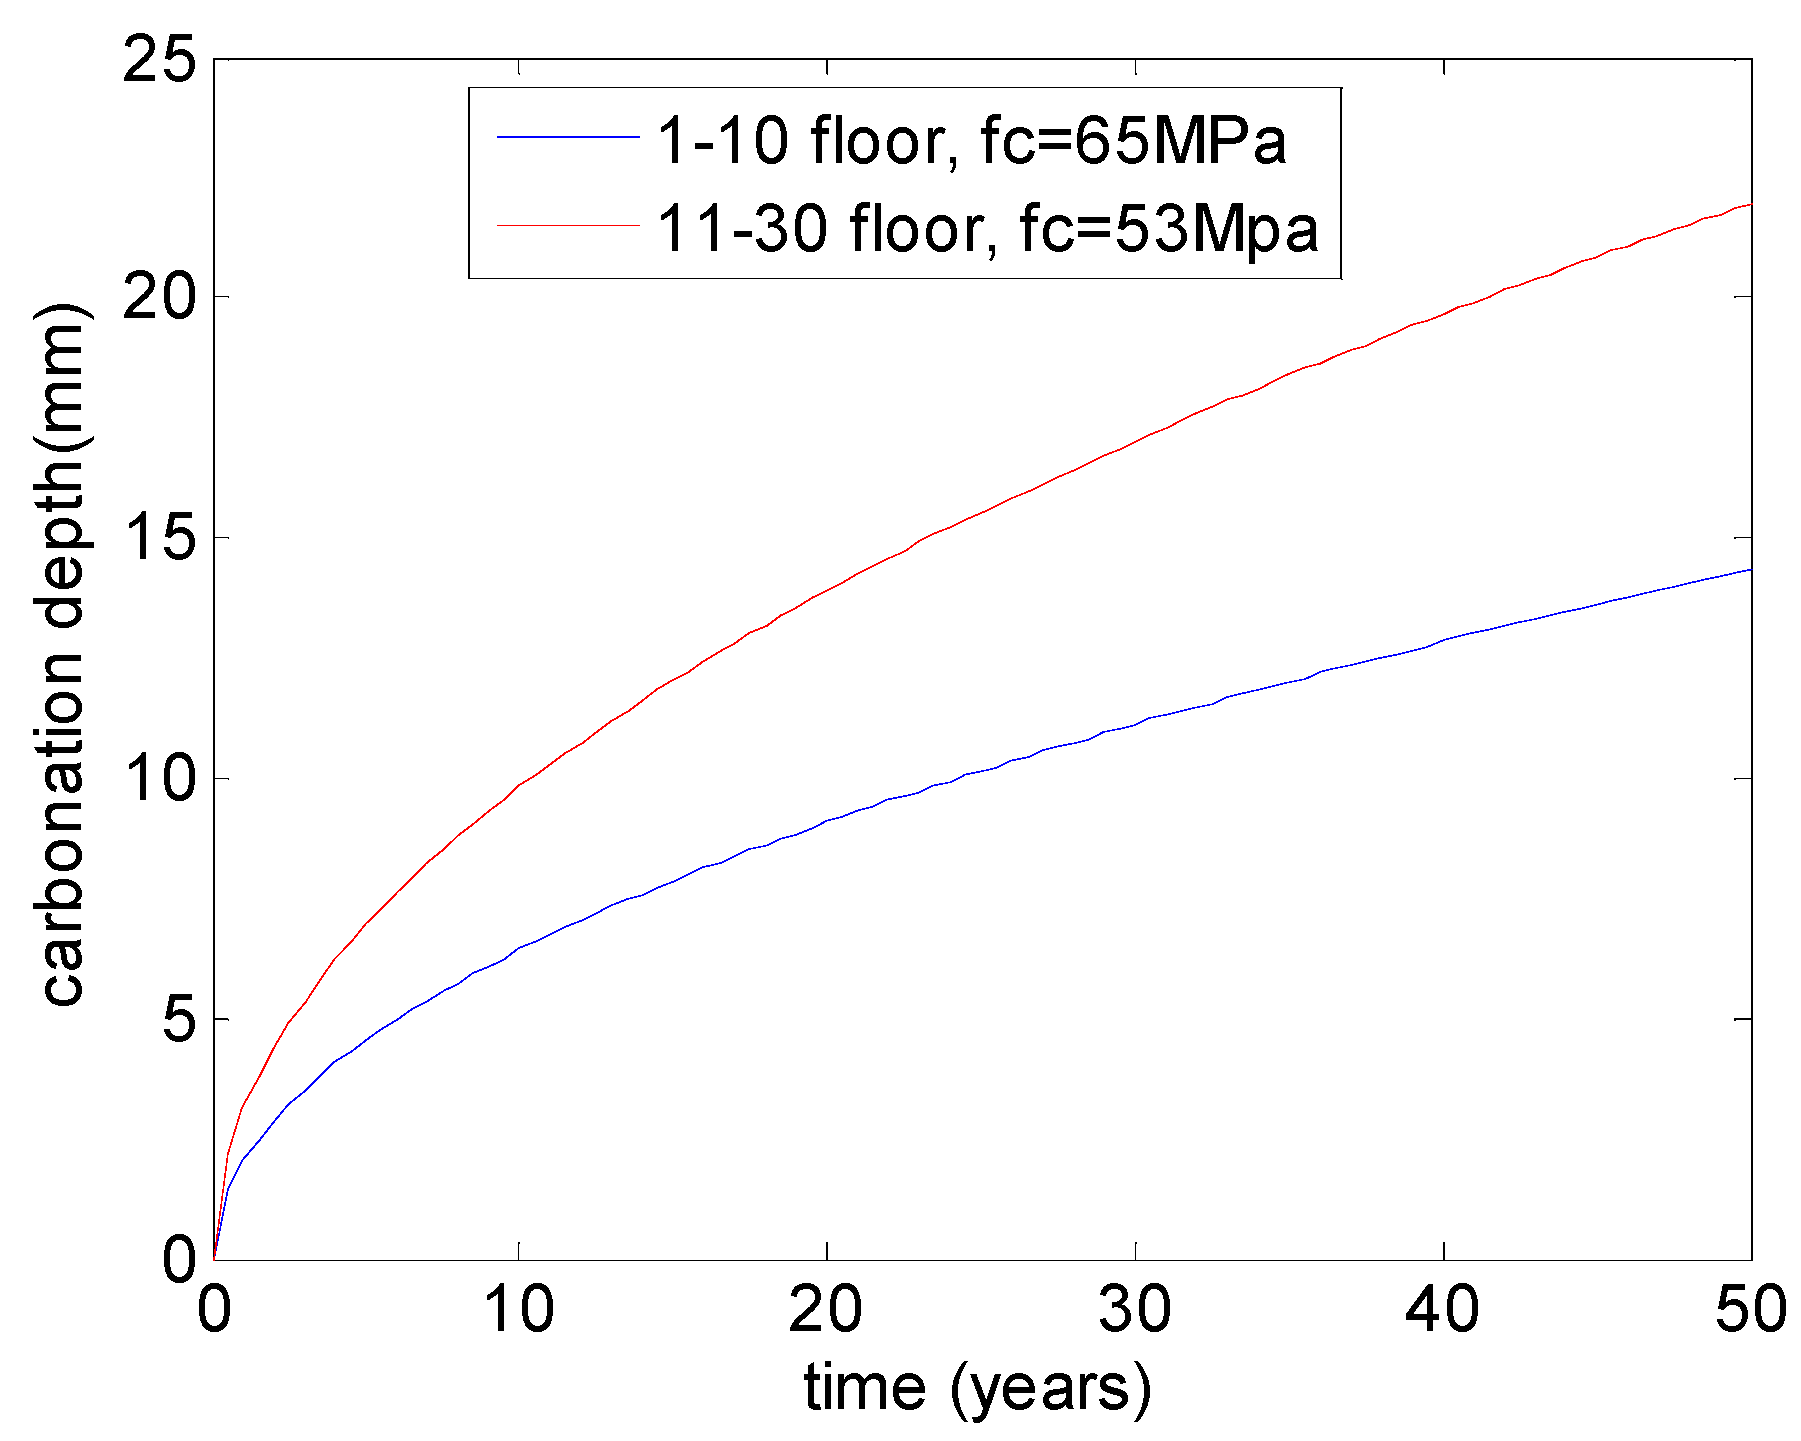
Using the carbonation model, calculate the carbonation depth of concrete (Equations (7) and (8)).
(4)
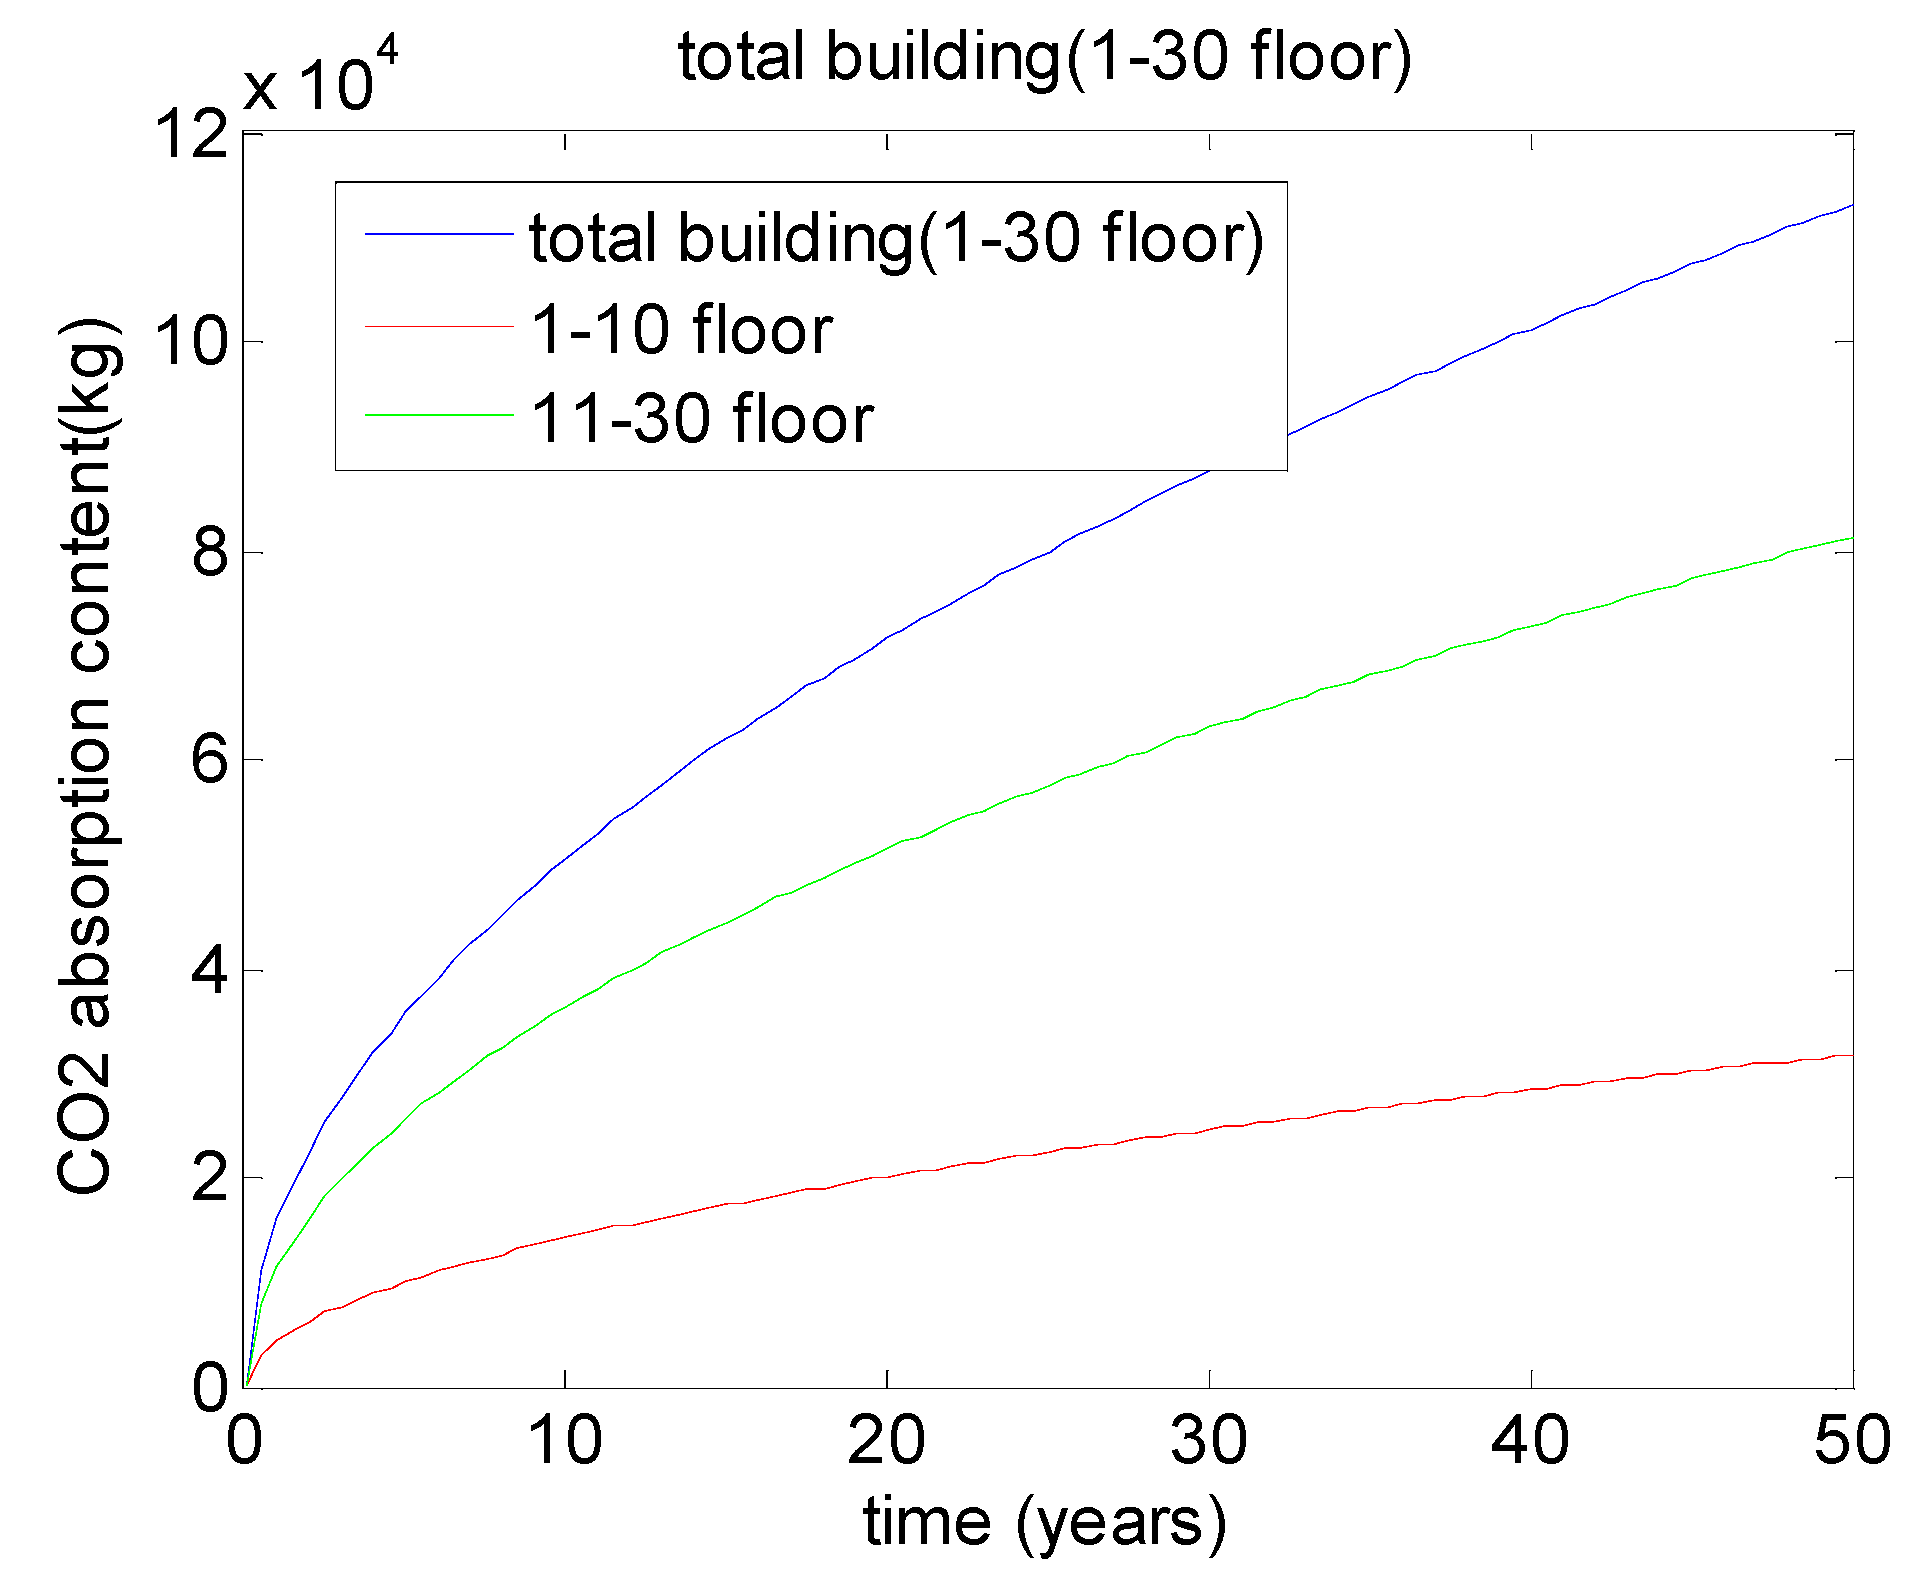
Using the CO2 uptake model, calculate the content of CO2 uptake due to carbonation (Equation (9)).
(5)
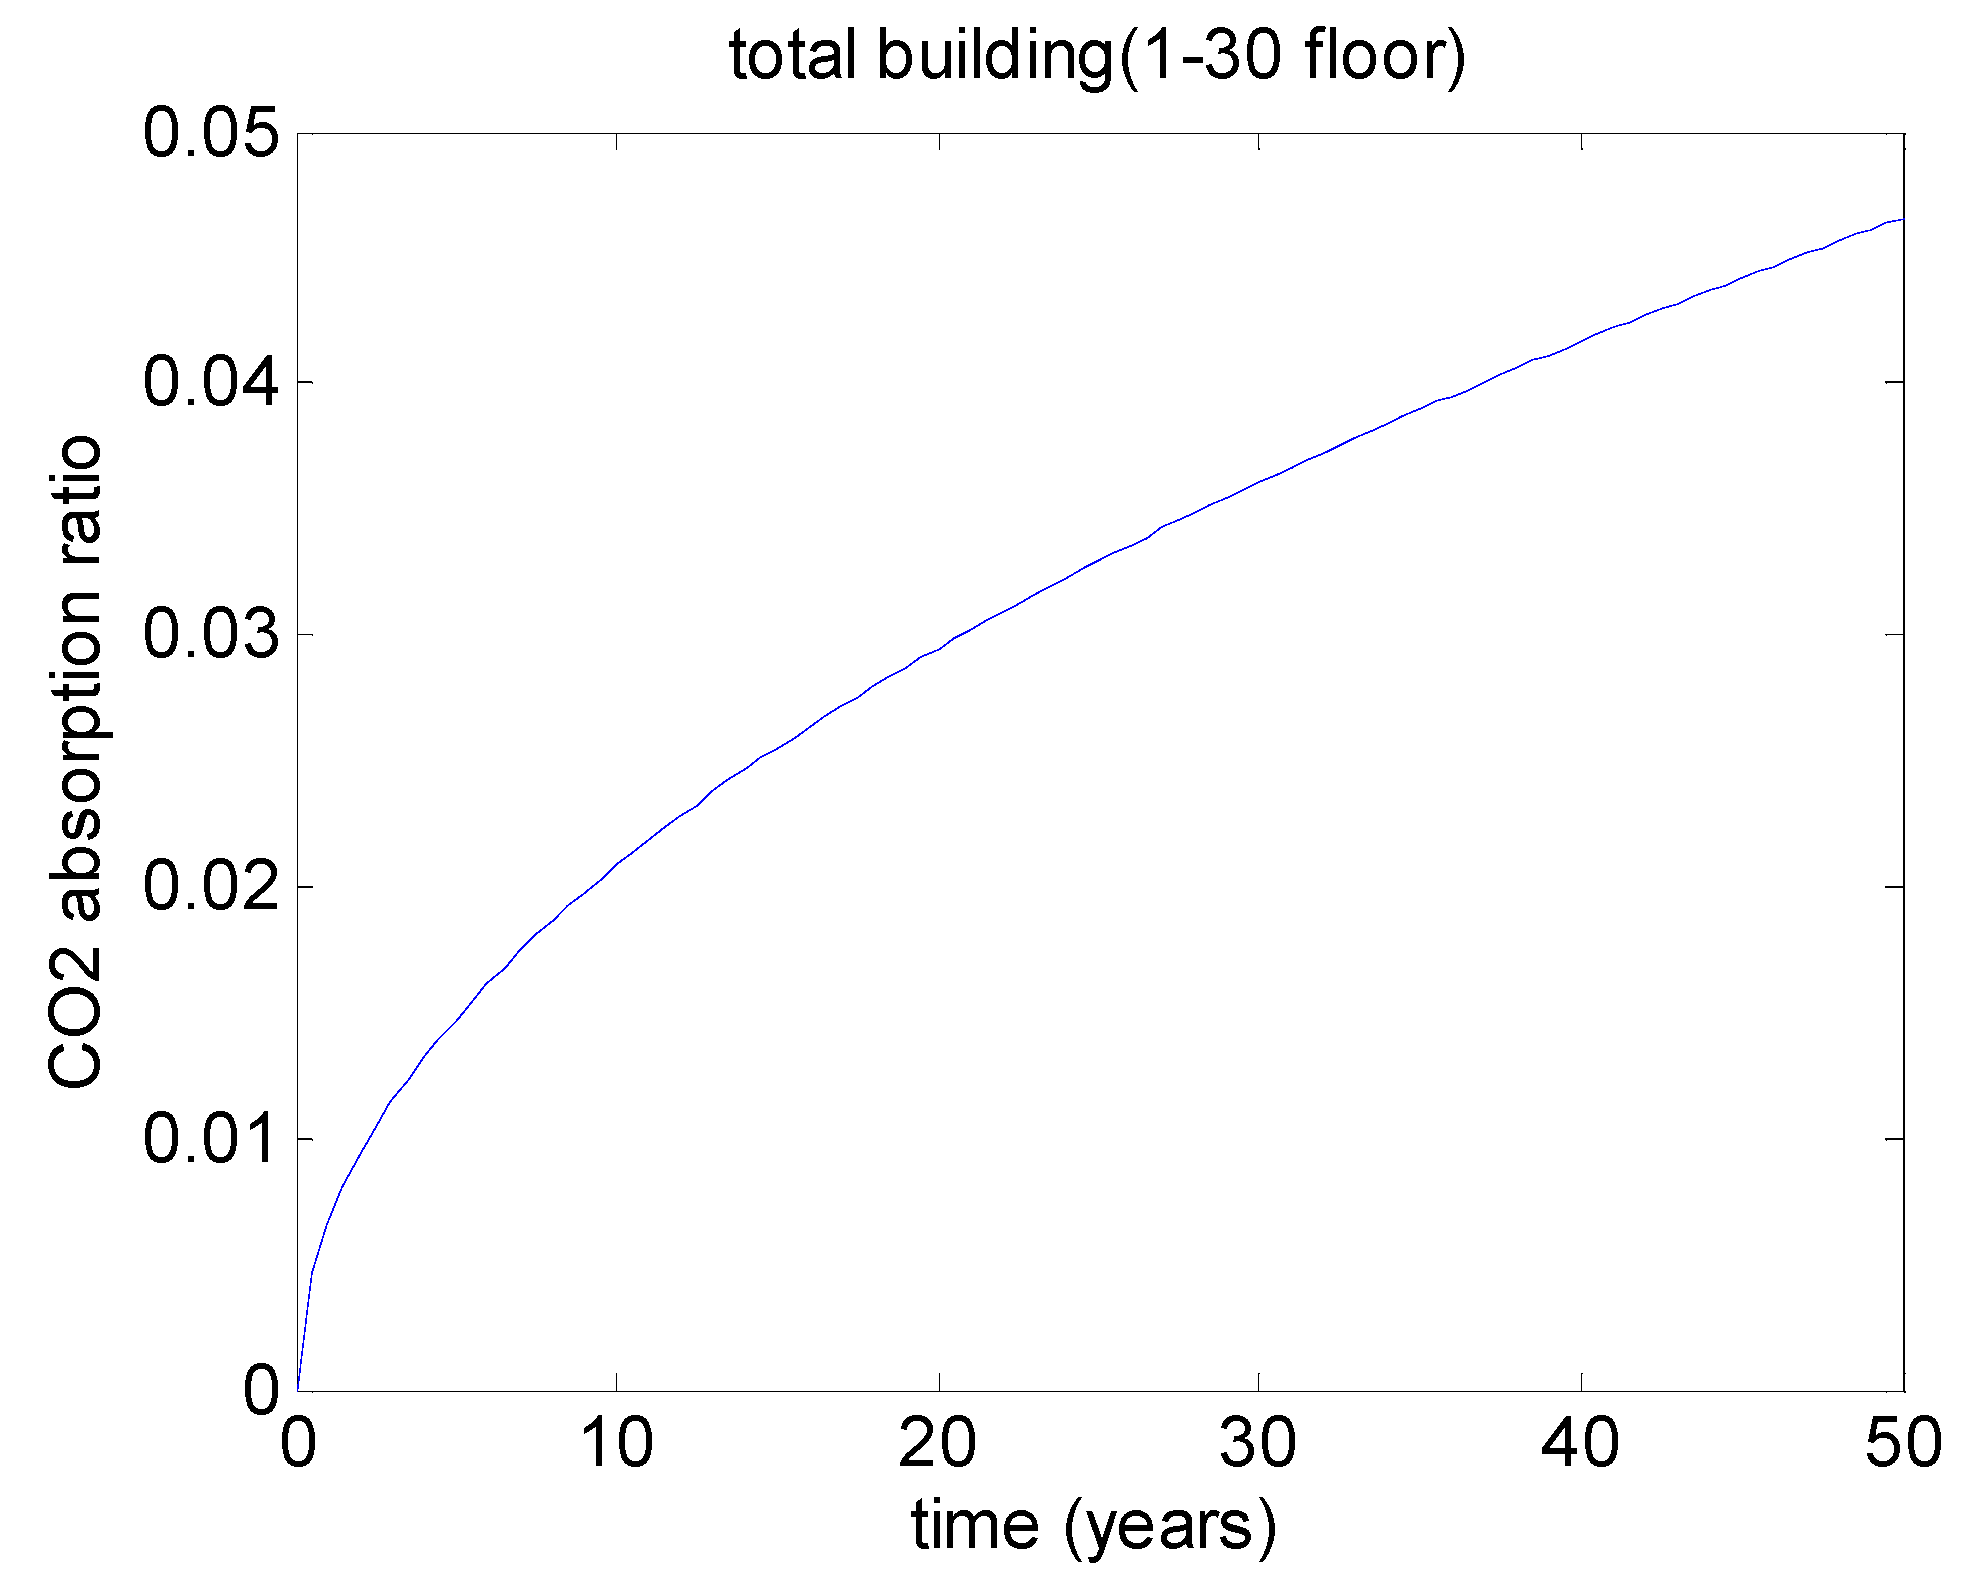
Based on CO2 emission content and CO2 uptake content, calculate the CO2 uptake ratio due to carbonation (Equation (10)).

3. Experimental Study of Accelerated Carbonation of Slag-Blended Concrete

Accelerated carbonation tests are widely used to evaluate the carbonation durability of concrete. The CO2 concentration employed in accelerated carbonation tests is much higher than that in the natural environment. Papadakis [8,9] compared the carbonation of concrete under both a natural environment (0.03% CO2 by volume) and accelerated carbonation tests (7% and 50% CO2 by volume). Papadakis [8,9] found that Equation (7) is valid for concrete with different CO2 concentrations. Because the effect of CO2 concentration on carbonation is considered in Equation (7), the coefficients in Equation (7) do not vary with CO2 concentration.
To verify the carbonation model, a laboratory experimental study was carried out on accelerated carbonation tests of slag-blended concrete with different water to binder ratios (0.3 and 0.5) and slag replacement levels (30% and 50%). The compound compositions of cement and slag are shown in Table 4. The mixing proportions of concrete are shown in Table 5. The size of prism specimens is 10 cm × 10 cm × 40 cm. After 28 days of sealed curing, the specimens were put into a carbonation chamber, in which the CO2 concentration was much higher than that of the natural environment. During accelerated carbonation tests, five sides of prism specimens were sealed with epoxy and one side of each specimen was exposed to CO2. Hence, one-dimensional CO2 ingression occurred. The temperature in the carbonation chamber was 20 °C, the relative humidity in the carbonation chamber was 60%, and the CO2 concentration in the carbonation chamber was 10%. After 1, 4, 8, 13, and 26 weeks of exposure, the carbonation depth was measured via phenolphthalein spraying.
Figure 2 shows the reaction degree of cement (α) in cement–slag blends. For slag-blended concrete, the addition of slag will improve the water to cement ratio. Consequently, the reaction degree of cement in cement–slag blends is higher than in plain cement specimens [26,27,28,29,30,31]. The more slag additions, the higher the cement hydration degree. With a lower water to binder ratio (Figure 2b), a higher replacement of slag will increase the hydration degree of the cement.
Figure 3 shows the reaction degree of slag (αSG) in cement–slag blends. When the replacement ratio of slag increases from 30% to 50%, the alkali-activated effect on the slag reaction will be weakened and the reaction degree of slag will decrease. When the water to binder ratio decreases from 0.5 (Figure 3a) to 0.3 (Figure 3b), due to the reduction of the capillary water concentration and available deposit space of reaction products, the reaction degree of the slag will decrease [26,27,28,29,30,31].
Using the concrete mixing proportions and reaction degrees of cement and slag, the calcium hydroxide (CH) contents can be calculated using Equation (4). As shown in Figure 4, for slag-blended concrete, due to the consumption of CH from the slag reaction, the CH content of slag-blended concrete is much lower than that of the control concrete. When slag replacement levels increase, CH content will decrease. When the water to binder ratio decreases from 0.5 (Figure 4a) to 0.3 (Figure 4b), the CH contents will increase [26,27,28,29,30,31].
Using the concrete mixing proportions and reaction degrees of cement and slag, calcium silicate hydrate (CSH) contents can be calculated by using Equation (5). As shown in Figure 5, for slag-blended concrete, in early stages, mainly because the reaction degree of slag is lower than that of cement, the CSH contents of slag-blended concrete are lower than those of the control concrete. At a late stage, mainly because the SiO2 content in the slag is higher than that in OPC, the CSH contents of slag-blended concrete can surpass those of the control concrete. When slag replacement levels increase, the time corresponding to strength surpassing will delay. When the water to binder ratio decreases from 0.5 (Figure 5a) to 0.3 (Figure 5b), the CSH contents will increase [26,27,28,29,30,31].
Using the concrete mixing proportions and reaction degrees of OPC and GGBFS, porosity reduction in paste due to the hydration of binders can be calculated using Equation (6). As shown in Figure 6, for OPC–slag blends, because the reaction rate of slag is slower than that of OPC, the porosity of slag blended paste is higher than that of the control paste. When the water to binder ratio decreases from 0.5 (Figure 6a) to 0.3 (Figure 6b), the porosity will decrease [26,27,28,29,30,31].
After determination of the carbonatable materials content and porosity of concrete, the carbonation depth of concrete can be calculated using Equation (7) (A = 6.5 × 10⁻⁶ and a = 3.6). Figure 7 shows experimental vs. analytical results. The analysis results generally agree with the experimental results. When the slag replacement levels increase, the carbonation depth increases and more CO2 is absorbed into the concrete. When the water to binder ratio decreases from 0.5 (Figure 7a) to 0.3 (Figure 7b), the carbonation depth of concrete decreases significantly [26,27,28,29,30,31].

4. CO2 Uptake in Real Buildings

4.1. Effect of Finishing Materials and Cracks on Carbonation

For calculating carbonation depth, Equation (7) is valid for sound concrete without cracks or finishing materials. For concrete in real buildings, due to loading and environmental effects, cracks frequently occur. The diffusivity of CO2 in air is much higher than that in concrete and surface cracks will aggravate carbonation [32]. On the other hand, finishing materials, such as mortar and waterproof coatings, are widely used to improve the durability performance of concrete structures [33,34,35,36]. Considering the effects of cracks and finishing materials, the calculation equation for carbonation depth in concrete can be modified as follows [33,34,35,36]:
x c = β c r × β f m × x c ,
where x c is the carbonation depth considering the effects of cracks and finishing materials and βcr considers the aggravation effect of cracks on carbonation. βcr is higher than 1.0 and relates to crack characteristics such as crack width, crack depth, and crack spacing distance [32]. βfm considers the suppression effect of finishing materials on carbonation. βfm is lower than 1.0 and relates to characteristics of finishing materials, such as material type, depth of finishing materials, and environment influence [33,34,35,36]. Yoda [35] conducted field investigations of the carbonation of slag-blended concrete via 40 years of natural aging and the preventive effect of finishing materials. Yoda [35] found that the carbonation suppression coefficients βfm for 20 mm mortar, 5 mm coating, and tile are 0.166, 0.4, and 0.1, respectively. On the other hand, note that Equation (11) is an empirical equation. Equation (11) does not accurately simulate the diffusion and carbonation reaction process. The effect of covering materials on carbonation should be further studied. First, CO2 diffusivity in covering materials and the chemical reaction between covering materials and CO2 should be measured. Second, the diffusion–reaction process in cover materials and substrate concrete should be modeled. Third, the continuity conditions on the interface between cover materials and substrate concrete should be established.

4.2. CO2 Uptake in Real Buildings during Use Stage

In this study, a 30-story apartment complex was selected to evaluate the CO2 absorption of concrete. The 1st floor to 3rd floor are a shopping mall and the 4th floor to 30th floor are for residual usage. The building floor plan (scale = 1/500) is shown in Figure 8 and the building elevation plan is shown in Figure 9. The structure type is a frame-shear wall structure.
Environmental conditions: The environmental data were taken from the Korean meteorological administration [37]. The site of the building is in the southeast of Korea. The average CO2 concentration of the indoor environment is 0.08% and of the outdoor environment is 0.04%. The average relative humidity of the indoor environment is 55% and of the outdoor environment is 65%. The average temperature of the indoor environment is 18.5 °C. For the local region of the building, the average outdoor temperature in spring (from March to May), in summer (from June to August), in autumn (from September to November), and in winter (from December to February) is 15.7 °C, 26.0 °C, 19.6 °C, and 7.1 °C ,respectively. The average outdoor temperature over one year is approximately 17.1 °C.
Material properties: The mixing proportions of concrete are shown in Table 6. The slag replacement level is 40%. From the 1st floor to 10th floor, the compressive strength of concrete is 64.8 MPa, and from the 11th floor to 30th floor, the compressive strength of concrete is 52.3 MPa. The transport distances for OPC, GGBFS, fine aggregate, coarse aggregate, and superplasticizer are 25 km, 25 km, 20 km, 20 km, and 10 km, respectively. Using building drawings, we can calculate the volume of concrete for different floors and different structural members, such as columns, slabs, beams, stairs, and shear walls. As shown in Table 7, the total volume of concrete is 10,769 m3. Similarly, using building drawings, we can calculate the surface area of concrete for different floors and different structural members. As shown in Table 8, the total surface area of concrete is 79,228 m2. The slab and shear wall have a flat shape and larger surface area than that of other structural elements. Four-millimeter polymer waterproof coating is used as the finishing material (βfm = 0.48) [33,34,35,36]. The average crack depth of a structural member is 0.18 mm (βcr = 1.5) [33,34,35,36].
Figure 10 shows the carbonation depth of different floors. The compressive strength of concrete in floors 1–10 (64.8 MPa) is higher than that in floors 11–30 (52.3 MPa). After 50 years of exposure, the calculated carbonation depth for floors 1–10 is approximately 14 mm, while the calculated carbonation depth for floors 11–30 is approximately 22 mm. When the compressive strength of the concrete increases, the carbonation depth decreases.
Figure 11 shows the CO2 uptake of different floors. After 50 years of exposure, by using Equation (9), the sum of CO2 uptake for floors 1–10 is approximately 3.17 × 10⁴ kg, while the sum of CO2 uptake for floors 11–30 is approximately 8.13 × 10⁴ kg. Hence, the CO2 uptake for the total building is determined to be approximately 11.3 × 10⁴ kg.
Figure 12 shows the CO2 uptake ratio of all buildings. Using Equation (1), we can calculate the sum of CO2 emission for floors 1–10 (approximately 9.43 × 10⁵ kg) and for floors 11–30 (approximately 15.07 × 10⁵ kg). The CO2 emission for the total building is approximately 24.5 × 10⁵ kg. Furthermore, using Equation (10), we can calculate the CO2 uptake ratio of all buildings. After 50 years, the ratio between the absorbed CO2 and the emitted CO2 is approximately 4.61% (11.3 × 10⁴/24.5 × 105 = 4.61%). As shown in Table 1, using slag in the concrete industry can reduce CO2 emissions. As shown in Figure 7, using slag will increase the carbonation depth of concrete and absorb more CO2 from the surrounding environment. On the other hand, note that after the carbonation depth of concrete exceeds the protective layer of steel rebar, corrosion of steel rebar will be initiated. More attention with respect to carbonation-induced corrosion should be paid to slag-blended concrete.

4.3. Discussion about Life Cycle Assessment, Service Life, Carbonation, and CO2 Uptake after Demolitions

The life cycle of the construction system consists of four stages: production stage, construction stage, use stage, and demolition stage. The production stage involves obtaining raw materials and processing them, transport to the concrete plant, concrete mixing, steel bar production, and transport to the building site. The construction stage is the structure building process. The use stage is the longest-lasting stage. Finally, in the demolition stage, the structure is pulled down and the demolished concrete is crushed and recycled. During the use stage, carbon dioxide will be absorbed due to carbonation. During the demolition stage, after concrete is demolished and crushed, the surface area of concrete will significantly increase, fresh uncarbonated concrete will be exposed to the environmental air, a new cycle of carbonation will begin, and more carbon dioxide will be absorbed [22].
On the other hand, durability, such as carbonation, must be considered in the use stage. The service life of RC structures consists of two distinct phases. The first phase is the initiation of corrosion; CO2 penetrates the concrete cover and leads to the loss of reinforcement passivity. The second phase is the propagation of corrosion. Once a limiting state is reached, beyond which the consequences of corrosion cannot be tolerated, the service life ends. We can extend the technical lifetime of an RC structure via maintenance or repair, but this will involve high costs. It is important to consider service life in the life cycle assessment of buildings [22]. As shown in Figure 10, after 50 years of exposure, the carbonation depth of concrete (22 mm) is less than the concrete cover depth (30 mm). This building is in the corrosion initiation phase.
In this article, the crushed concrete is assumed to be used as back filler after demolition. The average diameter of crushed concrete in Korea is 25 mm [24], the average CO2 concentration below the ground is 0.05% [24], and the average relative humidity below the ground is 75% [24]. Using carbonation rate relations, the crushed concrete takes 59.51 years to fully carbonate. Considering carbonation both during the use stage (50 years) and after the demolition stage (59.51 years), the total carbon dioxide uptake ratio is 19.21%. On the other hand, if we only consider carbonation during the use stage (50 years), the carbon dioxide uptake ratio is 4.61%. Hence, a major CO2 uptake will take place when the concrete structures are demolished.

5. Conclusions

(1) This paper presents a numerical procedure for quantitatively evaluating the amount of carbon dioxide emissions and absorption for slag-blended concrete structures. The analysis presents theoretical innovations: first, using a slag-blended cement hydration model, we calculate the reaction degrees of cement and slag and evaluate concrete material properties, such as carbonatable materials content and porosity; second, using a micro-structure-based carbonation model, we calculate the carbonation depth of slag-blended concrete; third, using building drawings and carbonation depth, we calculate the carbon dioxide uptake of concrete. The proposed numerical procedure can be applied for evaluating the CO2 uptake of buildings with different building types, different concrete mixing proportions, and different environment conditions.
(2) Using slag in the concrete industry can reduce CO2 emissions, increase the carbonation depth of concrete, and uptake more CO2 from the surrounding environment. A real building case study that considered CO2 uptake performance was carried out. The calculation results show that for concrete containing 40% slag as binders, 4.61% (113 tons) carbon dioxide will be absorbed during 50 years of service life. CO2 uptake ability closely relates to the surface area of structural elements. Slabs and shear walls have a flat shape and larger surface area than other structural elements and make significant contributions to CO2 uptake. On the other hand, a major CO2 uptake will take place when the concrete structures are demolished and crushed because of the increase in the exposed surface area of uncarbonated concrete to the air.
(3) In the life cycle assessment of concrete buildings, different phases of service life, such as the initiation of corrosion and the propagation of corrosion, should be taken into account. Because slag-blended concrete shows higher carbonation depth than control concrete, more attention with respect to carbonation-induced corrosion should be paid to slag-blended concrete.
(4) The proposed numerical procedure is not perfect and has some limitations: first, the diffusion–reaction process in finishing materials and substrate concrete needs further study. Second, concrete durability includes many aspects, such as freezing and thawing, chloride penetration, carbonation, sulfate attack, and corrosion. The interactions between carbonation and other durability aspects require further study. Third, reinforced concrete structures have many structural styles, such as buildings, bridges, and dams. This paper focuses on the carbon dioxide uptake of RC buildings. For other structural styles, the carbon dioxide uptake amount may differ from that presented in this study.

Acknowledgments

This research was supported by the Basic Science Research Program through the National Research Foundation of Korea (NRF), funded by the Ministry of Science, ICT and Future Planning (No. 2015R1A5A1037548).

Author Contributions

Han-Seung Lee performed the accelerated carbonation experiment; Xiao-Yong Wang analyzed the experimental results; Han-Seung Lee and Xiao-Yong Wang wrote the paper.

Conflicts of Interest

The authors declare no conflict of interest.

References

  1. Jung, Y.B.; Yang, K.H. Mixture-Proportioning Model for Low-CO2 Concrete Considering the Type and Addition Level of Supplementary Cementitious Materials. J. Korea Concr. Inst. 2015, 27, 427–434. [Google Scholar] [CrossRef]
  2. Pacheco-Torgal, F.; Miraldo, S.; Labrincha, J.A.L.; de Brito, J. An overview on concrete carbonation in the context of eco-efficient construction. Constr. Build. Mater. 2012, 36, 141–150. [Google Scholar] [CrossRef] [Green Version]
  3. Sulapha, P.; Wong, S.F.; Wee, T.H.; Swaddiwudhipong, S. Carbonation of concrete containing mineral admixtures. ASCE J. Mater. Civ. Eng. 2003, 15, 134–143. [Google Scholar] [CrossRef]
  4. Elke, G.; van den Philip, H.; de Nele, B. Carbonation of slag concrete: Effect of the cement replacement level and curing on the carbonation coefficient—Effect of carbonation on the pore structure. Cem. Concr. Compos. 2013, 35, 39–48. [Google Scholar]
  5. Sisomphon, K.; Franke, L. Carbonation rates of concretes containing high volume of pozzolanic materials. Cem. Concr. Res. 2007, 37, 1647–1653. [Google Scholar] [CrossRef]
  6. Monkman, S.; Shao, Y. Carbonation Curing of Slag-Cement Concrete for Binding CO2 and Improving Performance. J. Mater. Civ. Eng. 2010, 22, 296–304. [Google Scholar] [CrossRef]
  7. Bernal, S.A.; Provis, J.L.; Gutierrez, R.M.; Deventer, J.S.J. Accelerated carbonation testing of alkali-activated slag/metakaolin blended concretes: Effect of exposure conditions. Mater. Struct. 2015, 48, 653–669. [Google Scholar] [CrossRef]
  8. Papadakis, V.G.; Tsimas, S. Effect of supplementary cementing materials on concrete resistance against carbonation and chloride ingress. Cem. Concr. Res. 2000, 30, 291–299. [Google Scholar] [CrossRef]
  9. Demis, S.; Papadakis, V.G. A software-assisted comparative assessment of the effect of cement type on concrete carbonation and chloride ingress. Comput. Concr. 2012, 10, 391–407. [Google Scholar] [CrossRef]
  10. Hasanbeigi, A.; Price, L.; Lin, E. Emerging energy-efficiency and CO2 emission-reduction technologies for cement and concrete production: A technical review. Renew. Sustain. Energy Rev. 2012, 16, 6220–6238. [Google Scholar] [CrossRef]
  11. Gartner, E.M. Industrially interesting approaches to “low-CO2” cements. Cem. Concr. Res. 2004, 34, 1489–1498. [Google Scholar] [CrossRef]
  12. Miller, S.A.; Horvath, A.; Monteiro, P.J.M.; Ostertag, C.P. Greenhouse gas emissions from concrete can be reduced by using mix proportions, geometric aspects, and age as design factors. Environ. Res. Lett. 2015, 10, 114017. [Google Scholar] [CrossRef]
  13. Roh, S.; Tae, S.; Shin, S. Development of building materials embodied greenhouse gases assessment criteria and system (BEGAS) in the newly revised Korea Green Building Certification System (G-SEED). Renew. Sustain. Energy Rev. 2014, 35, 410–421. [Google Scholar] [CrossRef]
  14. Kim, R.; Tae, S.; Yang, K.; Kim, T.; Roh, S. Analysis of lifecycle CO2 reduction performance for long-life apartment house. Environ. Prog. Sustain. Energy 2015, 34, 555–566. [Google Scholar] [CrossRef]
  15. Tae, S.; Baek, C.; Shin, S. Life cycle CO2 evaluation on reinforced concrete structures with high-strength concrete. Environ. Impact Assess. Rev. 2011, 31, 253–260. [Google Scholar] [CrossRef]
  16. Tae, S.; Shin, S.; Woo, J.; Roh, S. The development of apartment house life cycle CO2 simple assessment system using standard apartment houses of South Korea. Renew. Sustain. Energy Rev. 2011, 15, 1454–1467. [Google Scholar] [CrossRef]
  17. Kim, T.; Tae, S.; Roh, S. Assessment of the CO2 emission and cost reduction performance of a low-carbon-emission concrete mix design using an optimal mix design system. Renew. Sustain. Energy Rev. 2013, 25, 729–741. [Google Scholar] [CrossRef]
  18. Roh, S.; Tae, S.; Shin, S.; Woo, J. Development of an optimum design program (SUSB-OPTIMUM) for the life cycle CO2 assessment of an apartment house in Korea. Build.Environ. 2014, 73, 40–54. [Google Scholar] [CrossRef]
  19. Ji, C.; Hong, T.; Park, H.S. Comparative analysis of decision-making methods for integrating cost and CO2 emission—Focus on building structural design. Energy Build. 2014, 72, 186–194. [Google Scholar] [CrossRef]
  20. Yepes, V.; Marti, J.V.; Garcia-Segura, T. Cost and CO2 emission optimization of precast-prestressed concrete U-beam road bridges by a hybrid glowworm swarm algorithm. Autom. Constr. 2015, 49, 123–134. [Google Scholar] [CrossRef]
  21. Lee, S.; Park, W.; Lee, H. Life cycle CO2 assessment method for concrete using CO2 balance and suggestion to decrease LCCO2 of concrete in South-Korean apartment. Energy Build. 2013, 58, 93–102. [Google Scholar] [CrossRef]
  22. Garcia Segura, T.; Yepes, V.; Alcala, J. Life cycle greenhouse gas emissions of blended cement concrete including carbonation and durability. Int. J. Life Cycle Assess. 2014, 19, 3–12. [Google Scholar] [CrossRef]
  23. Lagerblad, B. Carbon Dioxide Uptake during Concrete Life Cycle—State of the Art; Background Report; Nordic Innovation Center: Palo Alto, CA, USA, 2006. [Google Scholar]
  24. Yang, K.; Tae, S. Carbonation and CO2 uptake of concrete. Environ. Impact Assess. Rev. 2014, 46, 43–52. [Google Scholar] [CrossRef]
  25. Kashef-Haghighi, S.; Shao, Y.; Ghoshal, S. Mathematical modeling of CO2 uptake by concrete during accelerated carbonation curing. Cem. Concr. Res. 2015, 67, 1–10. [Google Scholar] [CrossRef]
  26. Wang, X.Y.; Lee, H.S. Modeling the hydration of concrete incorporating fly ash or slag. Cem. Concr. Res. 2010, 40, 984–996. [Google Scholar] [CrossRef]
  27. Lee, H.S.; Wang, X.Y.; Zhang, K.N.; Koh, K.T. Analysis of the Optimum Usage of Slag for the Compressive Strength of Concrete. Materials 2015, 8, 1213–1229. [Google Scholar] [CrossRef]
  28. Maekawa, K.; Ishida, T.; Kishi, T. Multi-Scale Modeling of Structural Concrete; Taylor & Francis: London, UK; New York, NY, USA, 2009. [Google Scholar]
  29. Ishida, T.; Luan, Y.; Sagawa, T.; Nawa, T. Modeling of early age behavior of blast furnace concrete based on micro-physical properties. Cem. Concr. Res. 2011, 41, 1357–1367. [Google Scholar] [CrossRef]
  30. Van Breugel, K. Numerical simulation of hydration and microstructural Development in hardening cement-based materials (I) theory. Cem. Concr. Res. 1995, 25, 319–331. [Google Scholar] [CrossRef]
  31. Van Breugel, K. Numerical simulation of hydration and microstructural development in hardening cement-based materials: (II) applications. Cem. Concr. Res. 1995, 25, 522–530. [Google Scholar] [CrossRef]
  32. Kwon, S.J.; Na, U.J. Prediction of Durability for RC Columns with Crack and Joint under Carbonation Based on Probabilistic Approach. Int. J. Concr. Struct. Mater. 2011, 5, 11–18. [Google Scholar] [CrossRef]
  33. Lee, H.S.; Wang, X.Y. Prediction of the Carbonation Depth of Concrete with a Mortar Finish. Key Eng. Mater. 2008, 385–387, 633–636. [Google Scholar] [CrossRef]
  34. Lee, S.H.; Lee, H.S.; Park, K.B. Study on an FEM Analysis to Evaluate Restrain-Performance of Surface-Finishes for Carbonation. Key Eng. Mater. 2007, 348–349, 477–480. [Google Scholar] [CrossRef]
  35. Yoda, A. Carbonation of Portland blast furnace slag cement concrete by 40 year natural aging and preventive effect of finishing materials. Cem. Sci. Concr. Technol. 2002, 56, 449–454. [Google Scholar]
  36. Lee, W.J. A Study about the Deterioration Behavior of Surface Finishing Materials and the Depression Effect for Carbonation in the Reinforced Concrete Building. Ph.D. Thesis, The University of Tokyo, Tokyo, Japan, 2009. [Google Scholar]
  37. Korea Meteorological Administration. Available online: http://www.kma.go.kr/ (accessed on 28 March 2016).
Figure 1. Flowchart of numerical process.
Sustainability 08 00312 g001
Figure 2. Reaction degree of cement. (a) Water to binder ratio of 0.5; (b) water to binder ratio of 0.3.
Sustainability 08 00312 g002
Figure 3. Reaction degree of slag. (a) Water to binder ratio of 0.5; (b) water to binder ratio of 0.3.
Sustainability 08 00312 g003
Figure 4. Calcium hydroxide (CH) contents. (a) Water to binder ratio of 0.5; (b) water to binder ratio of 0.3.
Sustainability 08 00312 g004
Figure 5. Calcium silicate hydrate (CSH) contents. (a) Water to binder ratio of 0.5; (b) water to binder ratio of 0.3.
Sustainability 08 00312 g005
Figure 6. Porosity in paste. (a) Water to binder ratio of 0.5; (b) water to binder ratio of 0.3.
Sustainability 08 00312 g006
Figure 7. Carbonation depth of concrete. (a) Water to binder ratio of 0.5; (b) water to binder ratio of 0.3.
Sustainability 08 00312 g007
Figure 8. Plan view of first floor of the building.
Sustainability 08 00312 g008
Figure 9. Elevation view of the building.
Sustainability 08 00312 g009
Figure 10. Carbonation depth of different floors.
Sustainability 08 00312 g010
Figure 11. CO2 uptake of different floors.
Sustainability 08 00312 g011
Figure 12. CO2 uptake ratio of building.
Sustainability 08 00312 g012
Table 1. Emission factor of CO2 in Portland cement production process [1].
Emission RelationshipEmission StyleCO2 Emission Factor (t/t)
Direct emissionCarbonate decomposition from raw material0.527
Kiln dust calcining0.009
Organic carbon burning of raw material0.012
Burning of cement kiln fuel0.235
Indirect emissionCement clinker electricity consumption0.15
Cement flour electricity consumption
Table 2. Summary of CO2 emissions for concrete production [1].
OPCGGBFSSandGravelWaterSuperplasticizerTruckConcrete Mixing
9.31 × 10⁻¹ (kg/kg)3.40 × 10−2 (kg/kg)0.0037 (kg/kg)0.0028 (kg/kg)1.12 × 10−4 (kg/kg)0.25 (kg/kg)3 × 10−5 (kg/kg·km)0.007 (kg/m3)
Table 3. Example of CO2 emissions during the concrete production process.
MaterialTransport
UnitABC = A × BDEF = A × D × E
Item kgCO2 kg/kgkgkmCO2 kg/kg·kmkg
OPC3000.931279.3253.00 × 10−50.225
Sand8900.00373.293153.00 × 10−50.401
Gravel9700.00282.716153.00 × 10−50.436
Water1501.12 × 10−40.0168---
sum285.33sum1.062
Concrete mixing1 m30.71 kg/m30.71
Total287.102 = 285.33 + 1.062 + 0.71
Table 4. Chemical compositions and physical properties of binder materials.
Used MaterialsOPCGGBFS
Chemical compositions (%)SiO219.2935.1
Al2O35.1615.02
Fe2O32.870.53
CaO61.6843.0
MgO4.175.59
SO32.530.06
K2O0.920.28
Na2O0.2050.24
Physical propertiesFineness (cm2/g)32004500
Specific gravity3.152.9
Loss on ignition1.490.02
Table 5. Mix proportions of concrete.
SpecimensUnit Weight (kg/m3)
Water to Binder RatioSlag Replacement LevelsWaterOPCGGBFSSandGravelSuperplasticizer (%)
0.5S00.5017434408119410.68
0.5S300.530%1742411038119410.68
0.5S500.550%1741721728119410.68
0.3S00.3015451407528454.11
0.3S300.330%1543601547528454.11
0.3S500.350%1542572577528454.11
Table 6. Mixing proportions of concrete in building.
FloorStrengthWaterOPCGGBFSFine AggregateCoarse AggregateSuperplasticizer
(MPa)(kg/m3)(kg/m3)(kg/m3)(kg/m3)(kg/m3)
1F~10F64.81652481657808743.5%
11F~30F52.31742091408119411.0%
Table 7. Volume of concrete for different floors.
Concrete Volume (m3)
FloorColumnSlabShear WallBeamStairsTotal
1F–3F77.32160.65150.8834.126.38
4F–30F51.55160.65100.5934.124.25
Total1623.724819.53168.481023.6133.9810,769.28
Table 8. Surface area of concrete for different floors.
Area of Each Structure (m2)
FloorColumnSlabShear WallBeamStairsTotal
1F–3F364.501475.90893.03243.0859.55
4F–30F243.031475.90595.35243.0839.70
Total7654.544,27718,753.637292.41250.5579,228.08

