1. Introduction
Numerous international organizations, such as the United Nations and the European Commission, cite Corporate Social Responsibility (CSR) as a key factor in achieving sustainable economic growth whilst simultaneously working toward greater social cohesion. Efforts by these international organizations to promote CSR within the business community are therefore intensifying [
1,
2].
One of the pillars of CSR is maintaining a dialogue with stakeholders. Therefore, in addition to adopting CSR as part of their mission, organizations have a duty to communicate their CSR strategy and progress to stakeholders [
3]. Organizations communicate their CSR through the Triple Bottom Line, which means adding two dimensions to an organization’s traditional reporting methods focused solely on financial performance [
4]. This triple report is usually known as a sustainability report, and constitutes a key CSR communication tool for organizations [
5]. Kim
et al. [
6] prove written reports, either printed or on-line, are the preferred means of CSR communication by stakeholders, despite the array of communication options available: corporate websites, corporate advertising, corporate media releases,
etc. Sustainability reports play a key role in improving public and investor confidence in an organization, which forms the basis of the organization’s (moral) legitimacy in society [
7]. This need for confidence is even more acutely felt in sectors that deal with society’s basic needs, as is the case with the food sector. Therefore, firms should refrain from using sustainability reports as mere public relations tools or promotional materials [
8,
9], as this may jeopardize the organization’s image and reputation. Occasionally, such a communication process may be perceived as greenwashing, and may have negative repercussions for the organization [
10].
Ziek [
11] pointed out that, although acceptance of CSR behaviors has increased in recent years, the communication process has yet to receive the same level of scrutiny. As a result, the communication of CSR remains a pending research topic because the importance of CSR communication is set to grow as the importance of CSR itself increases. Du
et al. [
12] claimed that, because of the strategic implications these reports may have for organizations, a main demand for future research is the exploration of mechanisms that contribute to effective CSR communication tailored to each stakeholder.
Hence, in light of this need to extend the existing analysis of CSR communication to adopt a multi-stakeholder approach, the main aim of this research is to develop a method capable of assessing the communication quality of sustainability reports, using the Analytic Network Process (ANP) [
13]. Subsequently, this study goes on to apply this methodology in the food sector to analyze the GRI sustainability reports of four firms, with representatives of the main stakeholders participating in the process. This study, thus, seeks to address the following specific objectives:
- (1)
to analyze which criteria permit the quality assessment of the sustainability report as a communication tool, which constitutes the fundamental research question addressed in this study;
- (2)
to identify which of those communication assessment criteria stakeholders value most highly; and
- (3)
to obtain stakeholders’ evaluations of sustainability reports as a tool for organizations to assess their CSR communication.
The criteria considered during the evaluation of the reports embody aspects strictly related to external communication, as in Lock and Seele [
14], as well as factors associated with internal consistency between CSR and its communication, a concern raised by Basu and Palazzo [
15]. A review of the state-of-the-art [
8,
9,
10,
14,
15] reveals a clear interest from many authors in performing such a study, although no such research has ever attempted to address this issue so completely. The set of reports analyzed in this study belong to a single sector, as previous research has shown that reporting practices vary as a function of the activity sector [
16].
According to the European Commission [
17] (p. 6), “most definitions of CSR describe it as a concept whereby companies integrate social and environmental concerns in their business operations and in their interaction with their stakeholders on a voluntary basis. Being socially responsible means not only fulfilling legal expectations, but also going beyond compliance.” McWilliams and Siegel [
18] completed this definition, stating that firms must broaden their objectives of meeting legal obligations and pursuing their own interests by also promoting social well-being. Despite the good intentions of those and other definitions, or precisely because of them, CSR has been contested in different ways. Some authors claim it is nothing but “green washing” as explained beforehand. Some others argue companies should only focus on their business leaving all other aims to specific organizations like public offices, NGOs, business associations,
etc. (see [
4,
7,
9] for some reflections). Or, to finish with other examples, some authors believe CSR should not be more than “good will”, other authors believe CSR is little more than bureaucracy,
etc. [
4,
7,
9]. We believe the European Commission [
1] (p. 6) in 2011 announced a new definition of CSR that can answer all these claims: “the responsibility of enterprises for their impacts on society”.
According to the literature review, for assessing and managing their impacts on society and the environment, a continuous dialogue with stakeholders and a complete communication of the firm’s CSR is of essence [
6]. A stakeholder can be defined as a group or individual that affects, or is effected by, the achievement of a company’s objectives [
19]. Hence, through sustainability reports, on the one hand, stakeholders can value the company’s accountability and performance, and assess the actions undertaken beyond their fulfillment of legal obligations, while in parallel the company shows to the stakeholders its concern towards them. On the other hand, stakeholders can benchmark among offer alternatives and can produce feedback to the company [
20].
Feedback from stakeholders is one of the most valued outcomes of direct/indirect dialogue as it informs the company how to offer more competitive services and goods. In consequence, trustworthy CSR communication can reinforce the company’s reputation, thereby positively differentiating the company from less assiduous peers [
21]. In fact, [
22] shows that CSR practices influence consumer–firm emotional attachment and, in consequence, have an effect on their loyalty to the firm. Finally, from an internal point of view, communicating CSR contributes to employee awareness and engagement, increases team spirit and raises the visibility of employee activities [
23,
24].
Establishing a common reference framework for CSR reports was, and still is, highly demanded, and a range of such initiatives is currently available to enterprises. The most well-known of these initiatives is that of the Global Reporting Initiative (GRI) [
21], a nonprofit organization whose mission is to foster economic, environmental, and social sustainability. The GRI provides a free, public set of complete guidelines for all organizations wishing to produce sustainability reports covering all three dimensions of sustainability and holds worldwide recognition.
The GRI framework (see
http://www.globalreporting.org) is one of the most comprehensive reporting guidelines available with a rigorous multi-stakeholder feedback process and specific reporting principles such as: transparency, inclusiveness, auditability, clarity, completeness, relevance, sustainability context, accuracy, neutrality, comparability, clarity and timeliness. Latest versions of GRI (G4 and following) include the “Materiality Principle” by which, it is assessed if the report covers aspects that reflect the organization’s significant economic/environmental/social impacts and substantively influence the assessments and decisions of stakeholders. Hence, this principle is intended to assure what we will later call the completeness and consistency of the report, related to the organization’s practice.
An important way for any firm to improve its reputation and sustainability focus is communicating sustainability initiatives and their consequences to both internal and external stakeholders. Furthermore, in the current global situation, a focus on sustainability can offer critical long-term strategic advantages [
25]. Communicating CSR practices to different stakeholders also helps companies to position themselves as sustainable and responsible companies [
26].
As explained, in addition to addressing external CSR communication [
14], sustainability reports also tackle the issue of internal consistency within the firm [
15]. Given their dual function, they are open to criticism on both fronts.
The first group of detractors often adheres to the following rationale in their objection to sustainability reports. Fassin [
27] claimed that sustainability reports are merely a publicity tool rather than constituting evidence per se of the existence of CSR. The basis of this argument lies in sustainability reports’ failure to guarantee their content accurately reflects actual practices in the enterprise [
28,
29]. Therefore, this criticism is directed toward the consistency between CSR practices and their communication, especially when the contents of the report contrast with the day-to-day running of the firm. According to the above argumentation, sustainability reports may end up being nothing more than biased public relations tools or promotional materials, aimed at manipulating stakeholders [
9,
30]. Materiality valuation is intended to solve that problem. Although it was not much reported at the time of the research, we have included the materiality assessment in our research. As we explain later, the clusters “Data quality” and “Reliability” include materiality criteria like: Completeness, relevance, accuracy and reliability.
The second major criticism of sustainability reports has to do with the need to communicate organizations’ CSR as effectively as possible [
31]. As in the study of the effectiveness of advertising and other traditional media, further exploration into the most effective forms of CSR communication is necessary [
12]. Ziek [
11] stressed the need to analyze the basic units of linguistic communication used in CSR communication. Furthermore, given that organizations use sustainability reports to communicate with different stakeholder groups with diverse expectations and information needs, it is necessary to analyze how firms manage to communicate effectively to multiple stakeholders and whether they are succeeding in doing so [
32].
This paper thus presents a methodology, based on the ANP, capable of evaluating the quality of sustainability reports from the point of view of both communication to multiple stakeholders and consistency with actual firm CSR practice (materiality).
2. Experimental Section
The methodology is based on ANP, a multi-criteria evaluation aid that has already proven to be successful for the purpose. For example, scholars have used multi-criteria evaluation methods in the food sector to value food companies’ assets [
33], and assess marketing strategies [
34]. Besides, the multicriteria method Analytic Hierarchy Process, a simplified version of ANP, has been recently used to evaluate CSR barriers in the textile sector [
35].
Section 2.1 gives a brief description of the ANP, while
Section 2.2 outlines the evaluation process adopted in this study. Following this, the criteria and the assessment model are described (
Section 2.3).
2.1. Description of the ANP
The Analytic Network Process (ANP) is a method proposed by Saaty [
13]. It provides a framework for dealing with decision making or evaluation problems. It is based on deriving ratio-scale measurements to allocate resources according to their ratio-scale priorities, whereas ratio-scale assessments, in turn, enable considerations based on trade-offs. ANP allows for complex inter-relationships among the decision levels using a network of criteria and alternatives, grouped into clusters. This provides an accurate modelling of complex settings and allows handling the usual situation of interdependence among elements in CSR.
Details on the ANP can be found in [
13], however, the main steps are summarized here for completeness:
- (i)
Pairwise comparisons on the elements and relative weighting estimation.
The determination of relative weightings in ANP is based on the pairwise comparison of the elements in each level. These pairwise comparisons are conducted with respect to their relative importance towards their control criterion based on the principle of AHP and measured using Saaty’s 1-to-9 scale (see
Table 1). The score of
aij in the pairwise comparison matrix represents the relative importance of the element on row (
i) over the element on column (
j),
i.e.,
aij =
wi/
wj where
wi is the weighting of the element (
i).
Table 1.
Saaty’s comparison fundamental scale.
Table 1.
Saaty’s comparison fundamental scale.
| Degree of Importance | Definition | Explanation |
|---|
| 1 | Equal importance | The two elements contribute equally to the objective. |
| 3 | Moderate importance | Experience and judgment slightly favor one element over another. |
| 5 | Strong importance | Experience and judgments strongly favor one element over another. |
| 7 | Very strong importance | An element is favored very strongly over another; its dominance is demonstrated in practice. |
| 9 | Extreme importance | The evidence favoring one element over another is of the highest possible order of affirmation. |
With respect to any criterion, pairwise comparisons are performed in two levels, i.e., the element level and the cluster level comparison.
If there are n elements to be compared, the comparison matrix A is defined as:
After all pairwise comparisons are completed and the consistency of the matrix has been checked [
13], the priority weighting vector (
w) is computed as the principal eigenvector of the pairwise comparisons matrix.
- (ii)
Construction of the unweighted supermatrix.
The resulting relative importance weightings are placed within a supermatrix that represents the interrelationships of all elements in the system.
- (iii)
Construction of the weighted supermatrix.
The following step consists of the weighting of the blocks of the unweighted supermatrix, by the corresponding priorities of the clusters, so that it can be column stochastic (weighted supermatrix).
- (iv)
Calculation of the global priority weightings.
Raising the weighted supermatrix to limiting powers until the weightings converge and remain stable the limit supermatrix will be obtained. In this matrix, the elements of each column represent the final weightings of the different elements considered.
The priority of each alternative is a non-dimensional value that will be considered the quality of the report as a communication tool.
2.2. Description of the Evaluation Process
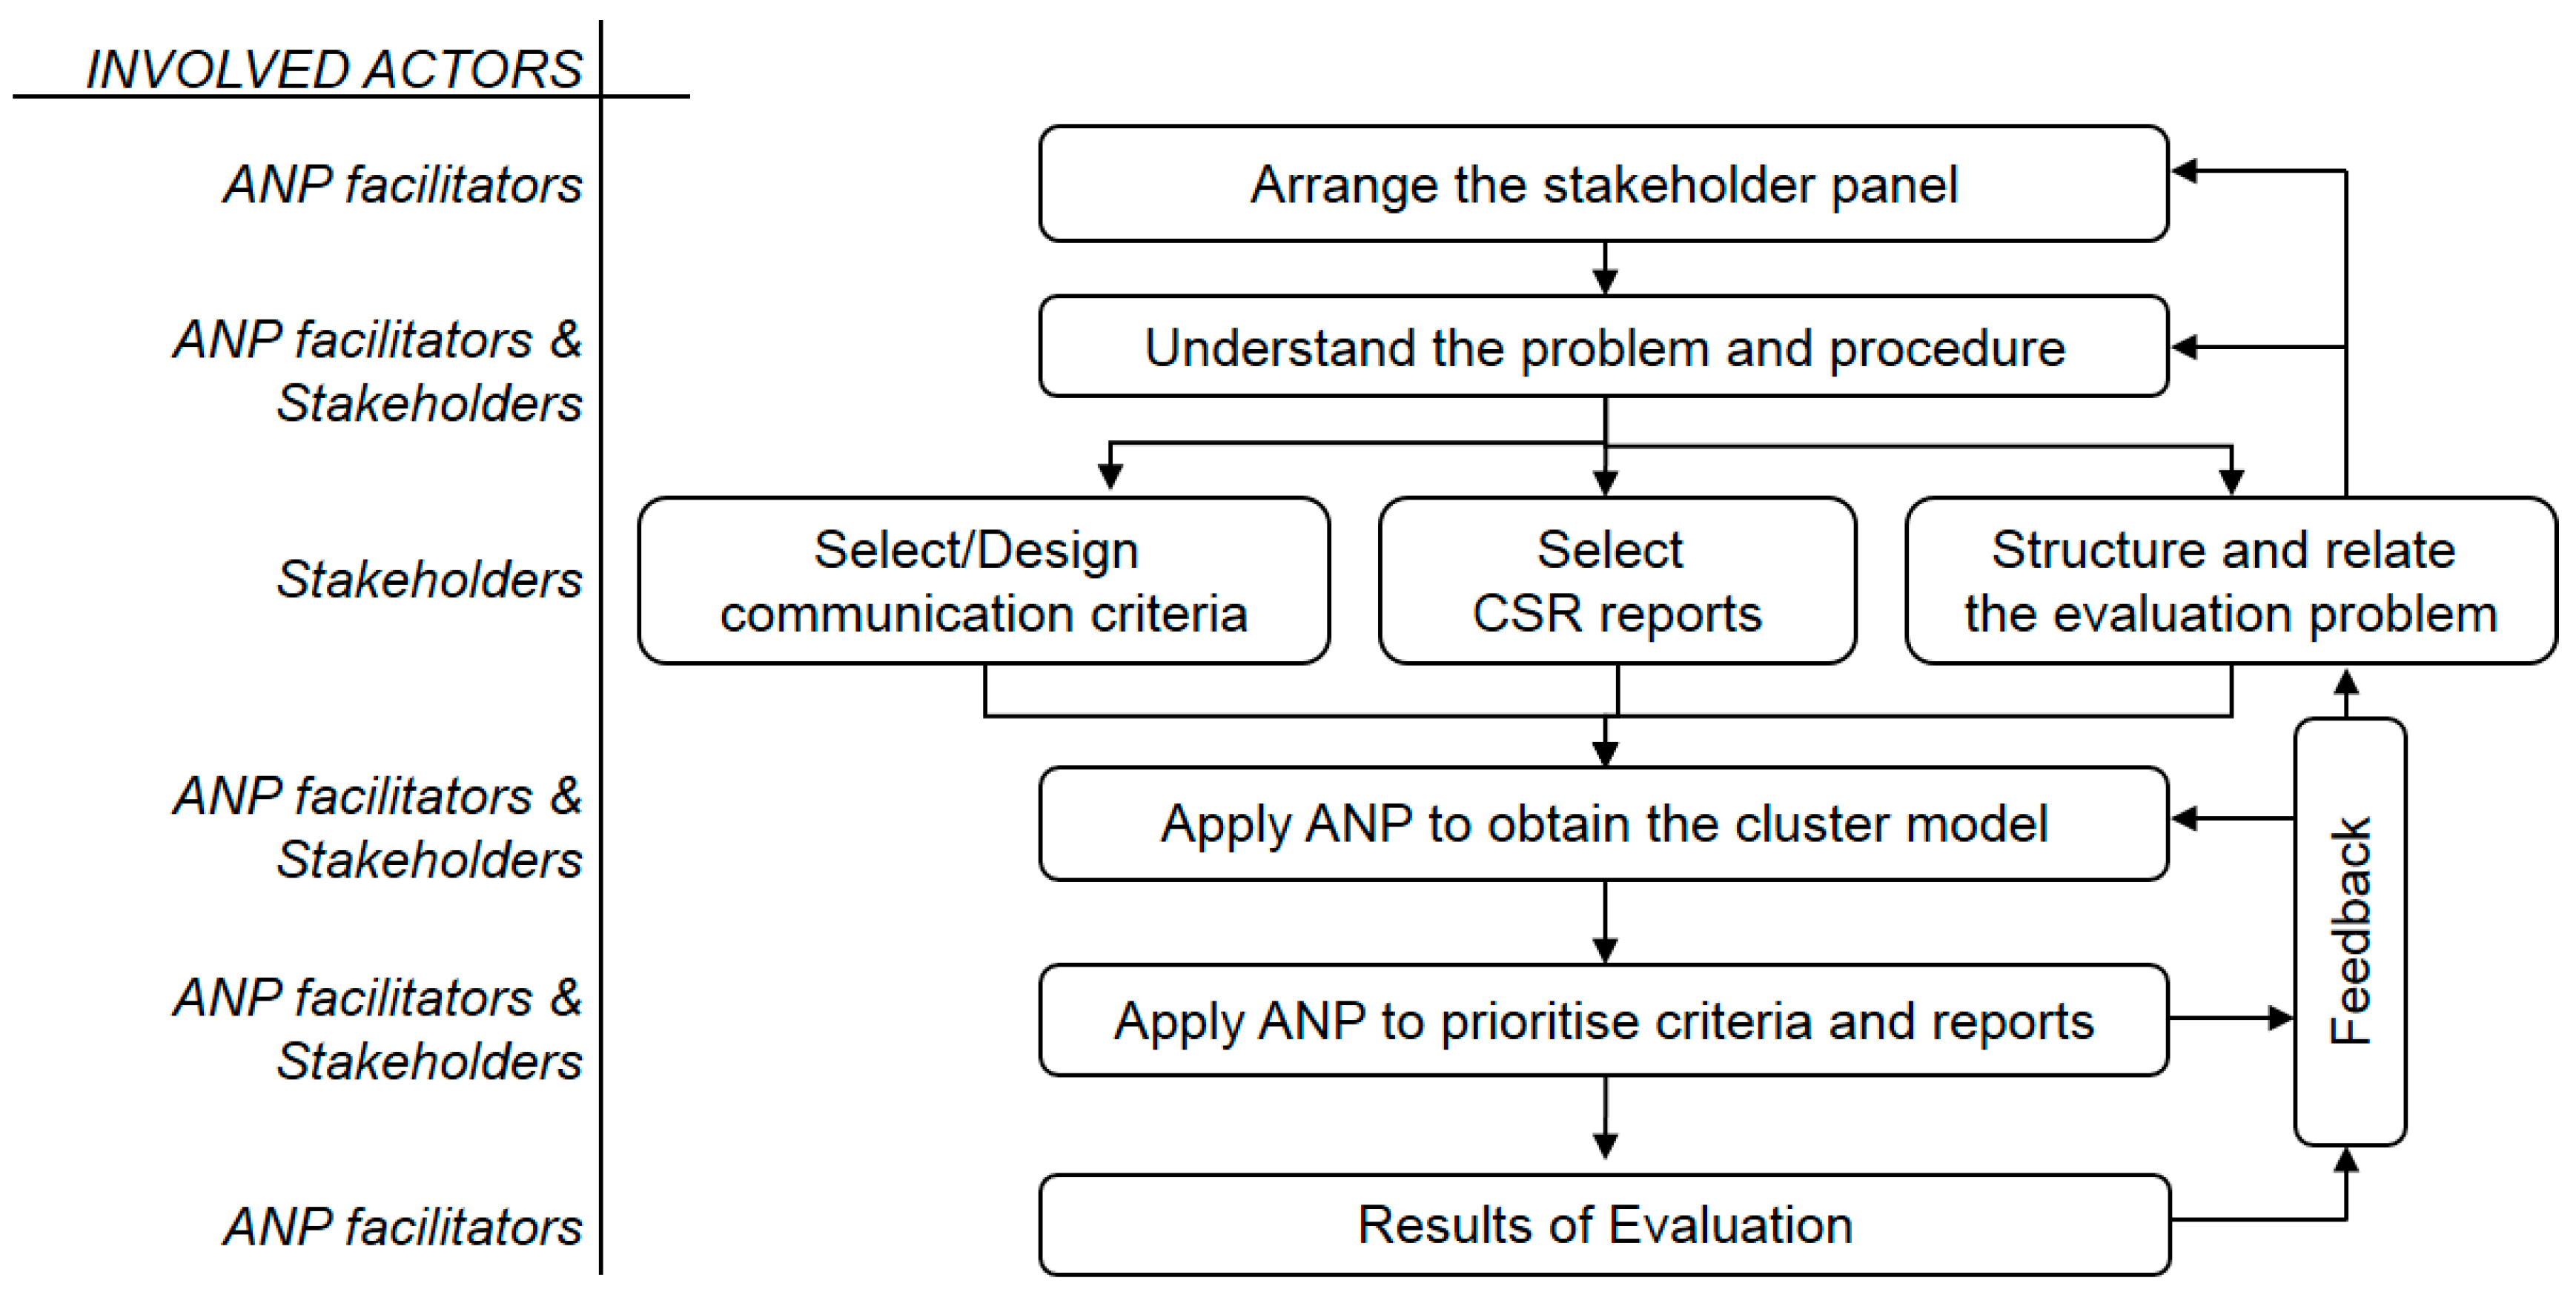
As
Figure 1 shows, this study was conducted in collaboration with the representatives of selected stakeholders. In order to select the proper representatives of the stakeholders in the first place, we chose the most representative groups according to the literature and the assessed CSR reports. In the second place, we chose their representatives who had to be people with some experience in analyzing CSR reports and who voluntarily joined the research process. It is important to rely on the opinion of stakeholders because they offer the potential to defer marketing ideology away from focusing only on customers towards a multiagent approach [
35]. The research team played the role of the ANP facilitators, participating in the decision-making process; that is, assisting the stakeholders in the evaluation and discussion of results throughout the entire procedure.
Figure 1.
Evaluation process.
Figure 1.
Evaluation process.
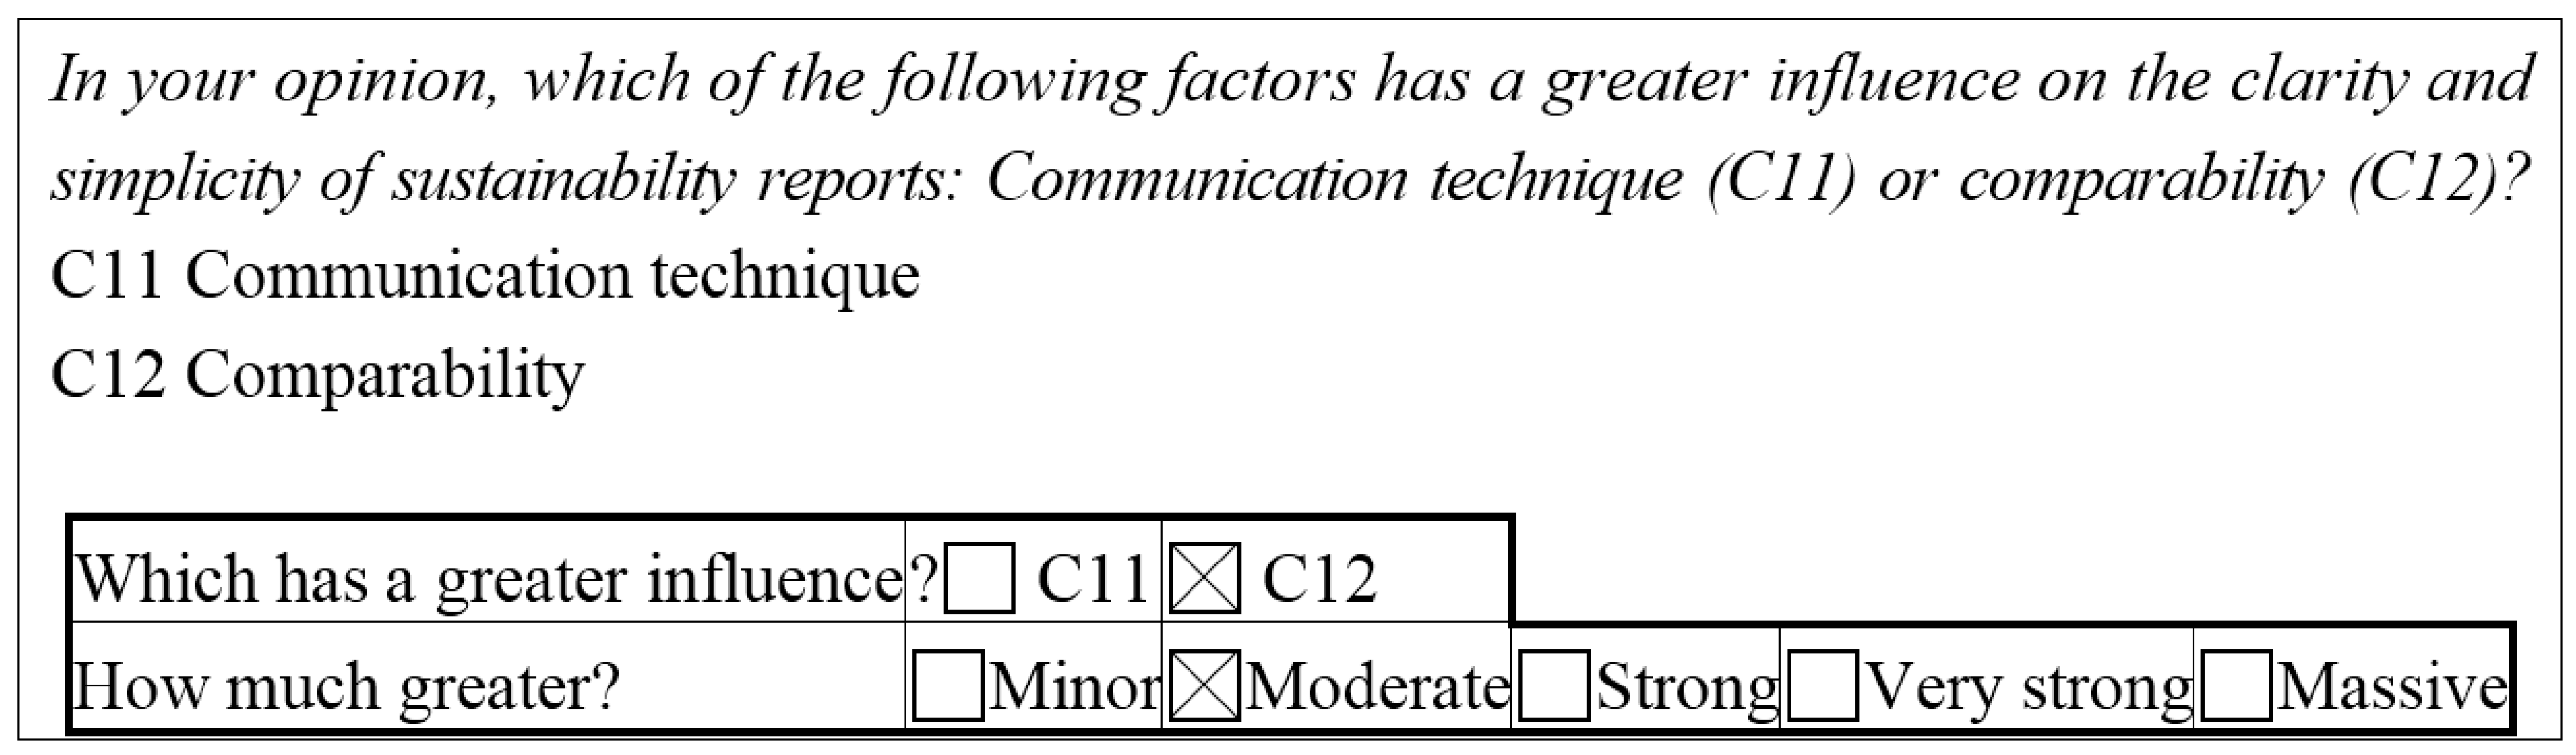
The third step of the evaluation process is to select the decision criteria of the model. Based on the literature, the research team established a series of evaluation criteria to assess the communication capability of the sustainability reports (alternatives), which were then grouped into clusters. Each stakeholder representative then responded to a questionnaire which required respondents to: (i) compare the clusters against one another; (ii) compare criteria against one another (see example in
Figure 2); (iii) analyze each report against the criteria under study; and (iv) compare the reports with one another.
According to the ANP procedure, the consistency of all the pairwise comparison matrices has to be checked. Anytime the inconsistency of the matrix was bigger than 10%, the judgments were reviewed with the stakeholder. Moreover, the individual results of the evaluation model were shown to the stakeholders in order to check if they were meaningful to them and represented their preferences. If the stakeholders did not feel so, the questionnaires could be answered again.
Finally, the stakeholders’ judgements were aggregated using the geometric mean, as outlined in [
13] methodology. This process yielded the individual pairwise comparison matrices and supermatrices.
Figure 2.
Example question from the questionnaire completed by stakeholders.
Figure 2.
Example question from the questionnaire completed by stakeholders.
As the aim of this procedure is to assess sustainability reports’ utility as a communication tool, the study compares different stakeholders’ interpretations of the criteria in the classification of a set of reports. The methodology thus yields a list of the main criteria of good communication, for a specific set of sustainability reports.
2.3. Assessment Criteria
Drawing on the literature review and in an attempt to provide counterarguments to the criticisms brought against sustainability reports, a list of 20 indicators or criteria was designed to assess the quality of communication. A subsequent discussion and selection process reduced this list to 12 evaluation criteria grouped into four clusters. The first two clusters—data comprehension and presentation—seek to evaluate the external communication of the CSR, whereas the other two—data quality and reliability—analyze the internal consistency of the reports (including their materiality).
Cluster 1: Data comprehension
Criterion 1.1. Communication technique. This criterion assesses whether narrative information should be accompanied by visual aids such as bar charts or data tables. Sanfey and Hastie [
36] found that stakeholders understand narrative information better if it is accompanied by data visualization aids. Furthermore, [
12] proposed the addition of cause–effect relationships, since they help readers understand facts, data, or intentions. Finally, [
37] advocated for the advantages of using a mixture of quantitative or aggregated concepts to convey high-quality data to consumers.
Criterion 1.2. Comparability. This criterion assesses whether reports should include comparative information. The results of [
38] experiments show that comparative data influence the extent to which readers actually ponder and use information to justify a choice. [
12,
31] also assert the importance of comparisons with the rest of the sector and the periodicity of the information.
Criterion 1.3. Clarity and simplicity. Numerous authors have observed that good communication is based on employing everyday language and avoiding the use of jargon or technical speech. The inclusion of summaries and highlighted texts also helps making the report more understandable. To achieve this, researchers have called for the use of simple syntax and structures, and an avoidance of the unnecessary use of the third person and the passive voice. For instance, [
39] proposed, among other guidelines, measures such as the use of frequencies rather than probabilities. Information that appears as a frequency instead of a probability conveys more meaning and, consequently, exerts a greater influence on readers’ decisions.
Cluster 2: Presentation
Criterion 2.1. Coherence. CSR reports should display sound logic and consistency in their structure and content [
40].
Criterion 2.2. Design. This criterion includes the design of the presentation, the text layout, highlighted ideas, images, and so forth [
41].
Criterion 2.3. Explanatory data representation. This criterion refers to the inclusion of graphs and figures to help structure the explanation of key concepts and results [
42]. Clearly, the report must also provide adequate explanations of the content of these figures or diagrams.
Cluster 3: Data Quality
Criterion 3.1. Ease of finding specific data. Several studies [
5,
43] have discussed the importance of a good data layout so that stakeholders can easily find information of interest.
Criterion 3.2. Relevance/Completeness. Relevance refers to readers being able to find information that is relevant to their interests [
44]. In addition, reports are more trustworthy as a medium when they exhibit completeness; namely, when stakeholders are able to find answers to all their questions [
44]. Likewise, inclusion is also advisable; that is, information should be provided to all stakeholders [
43].
Criterion 3.3. Accuracy. Accuracy and rigor are, obviously, two of the most demanded characteristics for data included in sustainability reports, for example see [
12,
27]. Besides, precision is also highlighted meaning not only does data must be rigorously managed, but also it has to involve the factual and precise information, even if it may seem or be unfavorable to the organization [
41].
Cluster 4: Reliability
Criterion 4.1. Data reliability. This criterion covers the clear presentation of references [
41], indication of sources (type and repute) of empirical data, and whether the information is verifiable. Reports should include data that can be verified; that is, that can be checked and confirmed [
43,
45]. Finally, this criterion also refers to whether contact information appears in the report, and the disclosure of the communication channels necessary to obtain more details on the provided information [
41].
Criterion 4.2. Stakeholder participation. Reports are more reliable if the data they contain stem, at least to some extent, from the demands, claims, data, or similar, of the firm’s stakeholders [
5,
23,
27].
Criterion 4.3. External audit. The value of sustainability reports increases if they receive verification from an independent, external entity, somewhat analogous to a financial audit [
46].
From the above selection of clusters and criteria, interactions among nodes (criteria level and clusters level) are obtained by consensus and showed in the correlation matrix (see
Table 2).
3. Results and Discussion
The evaluation of sustainability reports of firms in the Spanish food sector is presented in the following sections. First, the decision model is specified (
Section 3.1) and then the different weightings obtained are analyzed (
Section 3.2,
Section 3.3 and
Section 3.4).
3.1. The Decision Model
The procedure outlined above has been applied to a set of comparable sustainability reports. To choose the set, we were looking for the following characteristics:
- -
Business activity of the company: Food sector (we have chosen this business sector because we have experience and understand it, and because in the last years there has been in Spain an increasing demand of information from its customers).
- -
Companies which submitted their sustainability reports to the GRI.
- -
Size of company: Large.
- -
Date of publication of the report: 2011–2013.
Only four Spanish companies met all the specified characteristics:
- -
Brewery A (GRI application level A).
- -
Brewery B (GRI application level B).
- -
Winery C (GRI application level C).
- -
Dairy U (GRI application level undeclared).
We do not specify their name due to confidential reasons. Materiality principle is not applied specifically because the reports follow GRI guidelines prior to the G4 and following it. Most of the companies in the sample put alcoholic beverages to market; in these cases CSR issues are still more in demand, as it can be understood and was mentioned in [
47]. Nevertheless, this did not make those companies incomparable with the dairy, as it will be shown in the discussion of results.
The reference period spans three years because, in 2013, only the two breweries submitted their reports, whereas, in 2011, all four enterprises did so. For the evaluation process, the last submitted report for each company was analyzed.
One of the strengths of this type of multi-criteria methodology, which consults experts and works with their judgements, is its applicability to a small number of alternatives. Analogous methodologies have been applied to small sets of alternatives, for an example see [
48] or, in the field of CSR, see [
35] in the search for CSR indicators when assessing manufacturing operations.
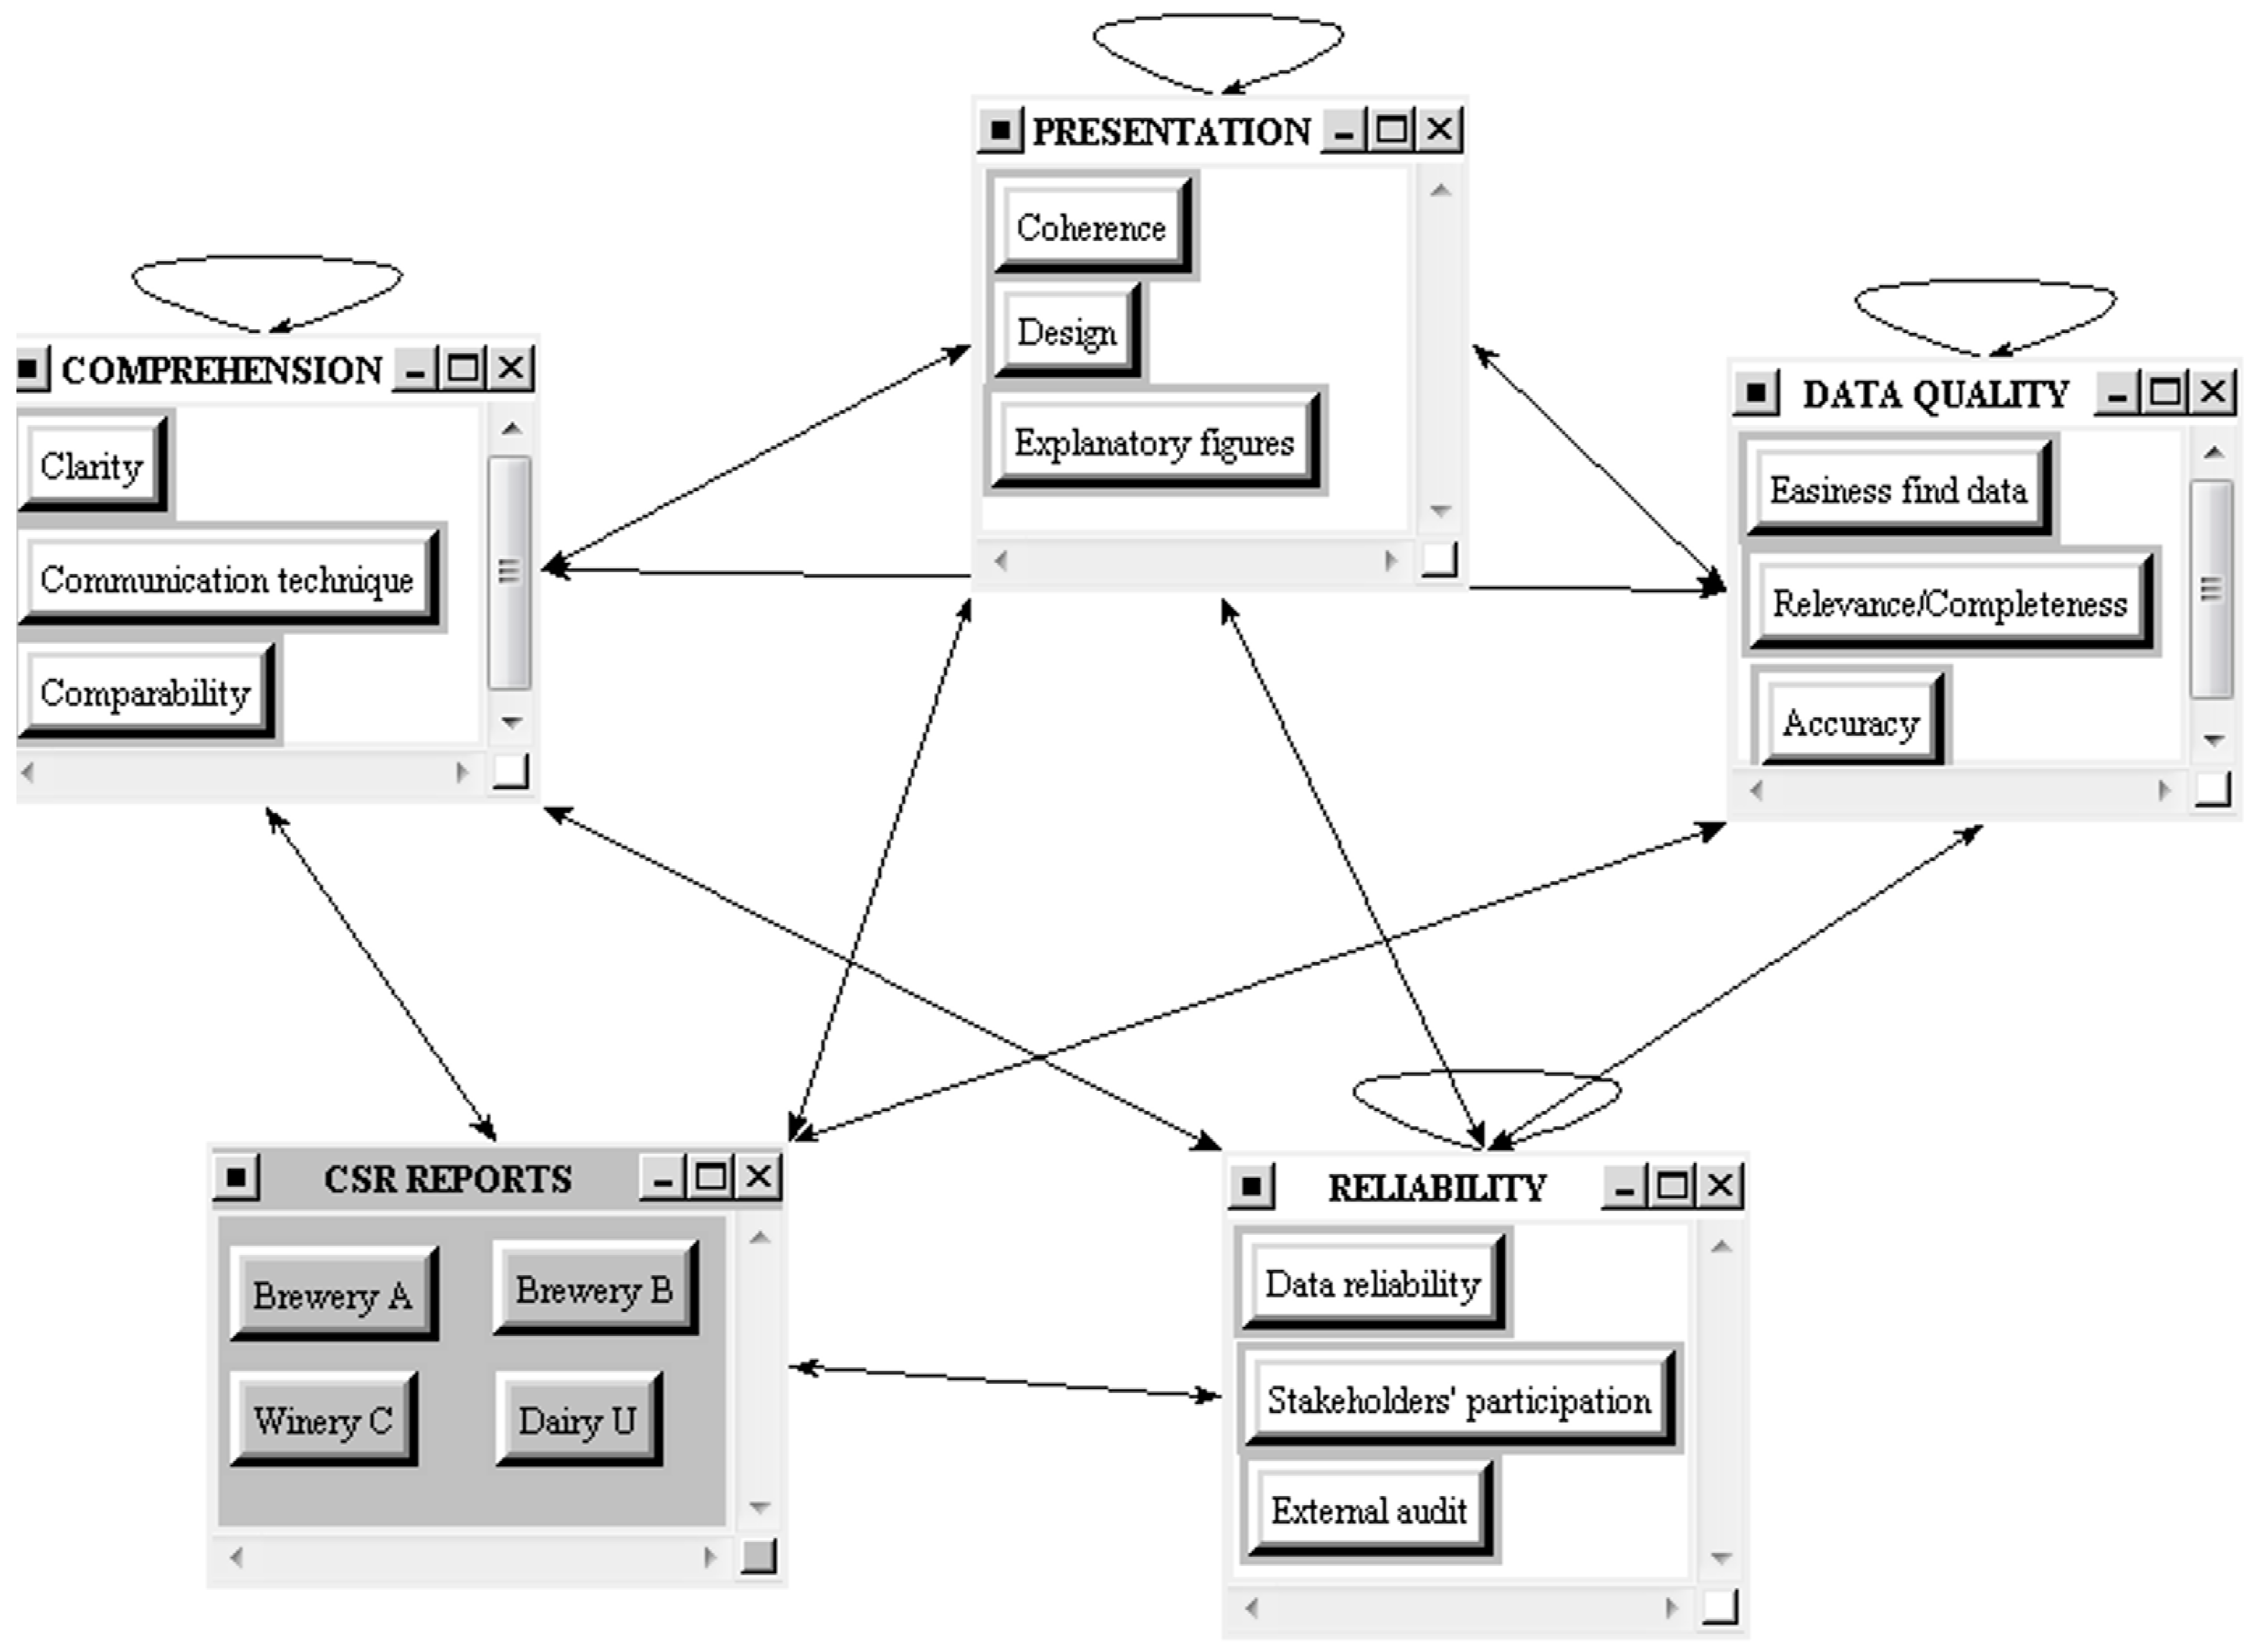
Once the alternatives and the criteria are agreed upon, the evaluation model has to be structured following the ANP procedure. Thus, the following network with five clusters was built with the consensus of the research team and the stakeholders (
Figure 3).
Figure 3.
Network model for the case study.
Figure 3.
Network model for the case study.
The two way arrows indicate bidirectional influences between clusters,
i.e., the elements of one cluster (i) exert some influence on those of another cluster (j). Feedback means that there is influence among the criteria within a cluster. The detailed influences among the elements are shown in
Table 2, where “1” means the element of the row influences the element of the column, and “0” means there is no influence between them. For example, according to this Table, criteria C12 and C32 are the ones that exert more influence over the others.
Table 2.
Correlation matrix.
Table 2.
Correlation matrix.
| Criteria/Alternatives | C1. Data Comprehension | C2. Presentation | C3. Data Quality | C4. Reliability | Alternatives |
|---|
| C11. Communication technique | C12. Comparability | C13. Clarity and simplicity | C21. Coherence | C22. Design | C23. Explanatory data representation | C31. Ease of finding specific data | C32. Relevance/Completeness | C33. Accuracy | C41. Data reliability | C42. Stakeholder participation | C43. External audit | Brewery B | Wine C | Dairy U | Brewery A |
|---|
| C1. Data comprehension | C11. Communication technique | 0 | 0 | 1 | 0 | 1 | 1 | 0 | 0 | 1 | 0 | 0 | 0 | 1 | 1 | 1 | 1 |
| C12. Comparability | 0 | 0 | 1 | 0 | 0 | 1 | 1 | 0 | 1 | 1 | 0 | 0 | 1 | 1 | 1 | 1 |
| C13. Clarity and simplicity | 0 | 0 | 0 | 0 | 0 | 0 | 1 | 0 | 1 | 0 | 0 | 0 | 1 | 1 | 1 | 1 |
| C2. Presentation | C21. Coherence | 0 | 0 | 1 | 0 | 0 | 0 | 0 | 0 | 1 | 1 | 1 | 0 | 1 | 1 | 1 | 1 |
| C22. Design | 0 | 0 | 1 | 0 | 0 | 1 | 1 | 0 | 0 | 0 | 0 | 0 | 1 | 1 | 1 | 1 |
| C23. Explanatory data representation | 1 | 1 | 0 | 1 | 0 | 0 | 1 | 0 | 0 | 0 | 0 | 0 | 1 | 1 | 1 | 1 |
| C3. Data quality | C31. Ease of finding specific data | 0 | 1 | 1 | 0 | 0 | 0 | 0 | 0 | 0 | 1 | 0 | 0 | 1 | 1 | 1 | 1 |
| C32. Relevance/Completeness | 0 | 1 | 0 | 1 | 0 | 0 | 1 | 0 | 1 | 1 | 0 | 0 | 1 | 1 | 1 | 1 |
| C33. Accuracy | 0 | 1 | 0 | 1 | 0 | 0 | 1 | 1 | 0 | 1 | 0 | 1 | 1 | 1 | 1 | 1 |
| C4. Reliability | C41. Data reliability | 0 | 1 | 0 | 1 | 0 | 0 | 0 | 0 | 1 | 0 | 0 | 1 | 1 | 1 | 1 | 1 |
| C42. Stakeholder participation | 0 | 0 | 0 | 1 | 0 | 0 | 0 | 0 | 1 | 1 | 0 | 0 | 1 | 1 | 1 | 1 |
| C43. External audit | 0 | 0 | 0 | 0 | 0 | 0 | 0 | 1 | 1 | 1 | 0 | 0 | 1 | 1 | 1 | 1 |
| Alternatives | Brewery B | 1 | 1 | 1 | 1 | 1 | 1 | 1 | 1 | 1 | 1 | 1 | 1 | 0 | 0 | 0 | 0 |
| Winery C | 1 | 1 | 1 | 1 | 1 | 1 | 1 | 1 | 1 | 1 | 1 | 1 | 0 | 0 | 0 | 0 |
| Dairy U | 1 | 1 | 1 | 1 | 1 | 1 | 1 | 1 | 1 | 1 | 1 | 1 | 0 | 0 | 0 | 0 |
| Brewery A | 1 | 1 | 1 | 1 | 1 | 1 | 1 | 1 | 1 | 1 | 1 | 1 | 0 | 0 | 0 | 0 |
In order to select the main stakeholders who should provide the requested information to evaluate the reports, two strategies were used:
- -
Literature review. As pointed out in several recent contributions to literature on CSR, the relationships of the companies with society should be analyzed through their stakeholders [
49]. We took into consideration the stakeholders proposed by those authors.
- -
Those stakeholders who are most frequently addressed by the food sector’s CSR reports.
The final list of stakeholders included: Consumers, Public Administration, Media, Shareholders, Professional Associations, Customers, Suppliers and Company Staff. Each member of this list represents a group of stakeholders.
After that, we had to choose their representative. The person chosen to be the representative of the group was someone with some experience in analyzing CSR reports and who voluntarily joined the research process.
Should it be necessary, on the one hand the process could be scaled-up easily to add more stakeholders by simply identifying them, selecting the suitable new stakeholders’ representatives and applying the procedure to them. Also, more than one representative for the different stakeholders could be selected, to the point of even arranging a panel of representatives of a stakeholder group. However, according to our experience, that would noticeably increase the costs of the procedure while only slightly affecting the results. Anyway, for companies with existing systematic and close relationships with stakeholders, adding up participants would be natural. The data process would increase but current software is very helpful and does not constitute the bulk of the procedure.
Conversely, if a comparison among organizations of different branches or activity sectors was required, the methodology should be applied from the beginning to such a statement of the study. Although the proposed framework and the selected criteria would be the same, the criteria weightings are dependent on business sector characteristics. The experts (stakeholders) must be selected according to the specific characteristics of the study and, likely, they will not belong to any specific activity sector. Finally, the reports must be comparable despite the differences among activity sectors.
Next, the stakeholder representatives responded to the questionnaires to evaluate the elements of the model; that is, the communication criteria and the sustainability reports of the four companies. To do so, the representatives read the four reports in their entirety. All their judgments were introduced in the Superdecisions® software and the required calculations were computed in order to obtain resulting matrices. In order to obtain the aggregation of all the stakeholders’ judgments, the geometric man was used.
3.2. Weightings of the Criteria and the Sustainability Reports (Preferences)
The limit supermatrix, normalized for each stakeholder, was computed according to the experts’ responses to the questionnaire.
Since in this study we consulted eight experts, a mathematical aggregation of their judgments is needed in order to obtain the group response. There are two synthesizing methods to aggregate evaluations of experts: The geometric mean method proposed by [
13] and the weighted arithmetic mean method proposed by [
50]. We used the geometric mean method in order to preserve the reciprocal property of the judgment matrices.
It is worth noting that the values were normalized in two general groups: criteria and sustainability reports (
Table 3). The results are fairly well spread across criteria and reports, without revealing any clear differences between stakeholders for any of the elements. Notably, on average, the criteria of the Internal Consistency group are 17% more significant than those of the External Communication group (0.54
vs. 0.45). Among the stakeholders, the Suppliers’ representative deemed Internal Consistency (0.627) the most important criterion and External Communication (0.373) the least important, while the opposite is true of the Media representative (External Communication: 0.587
vs. Internal Consistency: 0.413). Those results seem to imply the media prefer clear information for ease of communication, without being so much concerned about its accuracy and reliability. Also, a similar result is obtained for the professional associations (External Communication: 0.516
vs. Internal Consistency: 0.484). However, suppliers pay clearly more attention to the relevance and rigor of the information than to the communication quality of the reports. Similar results were also obtained for the Shareholders and the Staff.
Table 3.
Normalized limit supermatrix.
Table 3.
Normalized limit supermatrix.
| Criteria/Alternatives | Consumers | Public Administration | Media | Shareholders | Professional Associations | Customers | Suppliers | Staff | Average |
|---|
| C1. Data comprehension | C11. Communication technique | 0.077 | 0.080 | 0.157 | 0.057 | 0.077 | 0.066 | 0.040 | 0.079 | 0.077 |
| C12. Comparability | 0.074 | 0.069 | 0.077 | 0.066 | 0.091 | 0.065 | 0.086 | 0.057 | 0.076 |
| C13. Clarity and simplicity | 0.057 | 0.037 | 0.045 | 0.036 | 0.064 | 0.024 | 0.015 | 0.027 | 0.036 |
| C2. Presentation | C21. Coherence | 0.097 | 0.106 | 0.072 | 0.105 | 0.117 | 0.132 | 0.113 | 0.099 | 0.108 |
| C22. Design | 0.063 | 0.063 | 0.083 | 0.043 | 0.058 | 0.054 | 0.034 | 0.049 | 0.057 |
| C23. Explanatory data representation | 0.090 | 0.090 | 0.153 | 0.077 | 0.109 | 0.088 | 0.084 | 0.089 | 0.100 |
| C3. Data quality | C31. Ease of finding specific data | 0.072 | 0.092 | 0.086 | 0.036 | 0.037 | 0.061 | 0.042 | 0.058 | 0.060 |
| C32. Relevance/Completeness | 0.097 | 0.078 | 0.089 | 0.065 | 0.068 | 0.063 | 0.072 | 0.093 | 0.081 |
| C33. Accuracy | 0.157 | 0.123 | 0.094 | 0.169 | 0.135 | 0.109 | 0.140 | 0.106 | 0.132 |
| C4. Reliability | C41. Data reliability | 0.108 | 0.113 | 0.051 | 0.125 | 0.108 | 0.142 | 0.159 | 0.174 | 0.121 |
| C42. Stakeholder participation | 0.063 | 0.104 | 0.047 | 0.069 | 0.052 | 0.150 | 0.093 | 0.063 | 0.078 |
| C43. External audit | 0.045 | 0.045 | 0.047 | 0.150 | 0.084 | 0.046 | 0.121 | 0.106 | 0.075 |
| Alternatives | Consumers | Public Administration | Media | Shareholders | Professional Associations | Customers | Suppliers | Staff | Average |
| Reports | Brewery B | 0.181 | 0.369 | 0.381 | 0.245 | 0.275 | 0.279 | 0.271 | 0.254 | 0.282 |
| Winery C | 0.133 | 0.168 | 0.107 | 0.213 | 0.157 | 0.163 | 0.184 | 0.243 | 0.170 |
| Dairy U | 0.438 | 0.273 | 0.166 | 0.232 | 0.294 | 0.310 | 0.243 | 0.251 | 0.273 |
| Brewery A | 0.248 | 0.191 | 0.346 | 0.309 | 0.275 | 0.249 | 0.302 | 0.253 | 0.274 |
The clusters also exhibit fairly uniform results across the board. The cluster of Reliability (0.274) is the most important, closely followed by Data quality (0.272) and Presentation (0.265), with Data comprehension (0.189) scoring much less favorably. Therefore, on average, stakeholders consider all the clusters and criteria important although some meaningful differences are found among them. For example, for the Media representative, the order is C2 > C1 > C3 > C4, with C2 more than doubling C4. However, for the supplier it is C4 > C3 > C2 > C1 with C4 nearly tripling C1. The methodology not only allow finding out and measuring those kind of differences but it explains why as it is completely traceable. Afterwards, this feature is further discussed.
The most prized criterion is “Accuracy” (0.132), followed by “Data reliability” (0.121) and “Coherence” (0.108) in accordance with the general preferences towards rigor already mentioned. At the other end of the scale, the least-valued criteria are “Clarity and simplicity” (0.036), “Design” (0.057), and “Ease of finding specific data” (0.060). Interestingly, those are some of the, seemingly, most valued criteria among GRI practitioners according to most of the published sustainability reports.
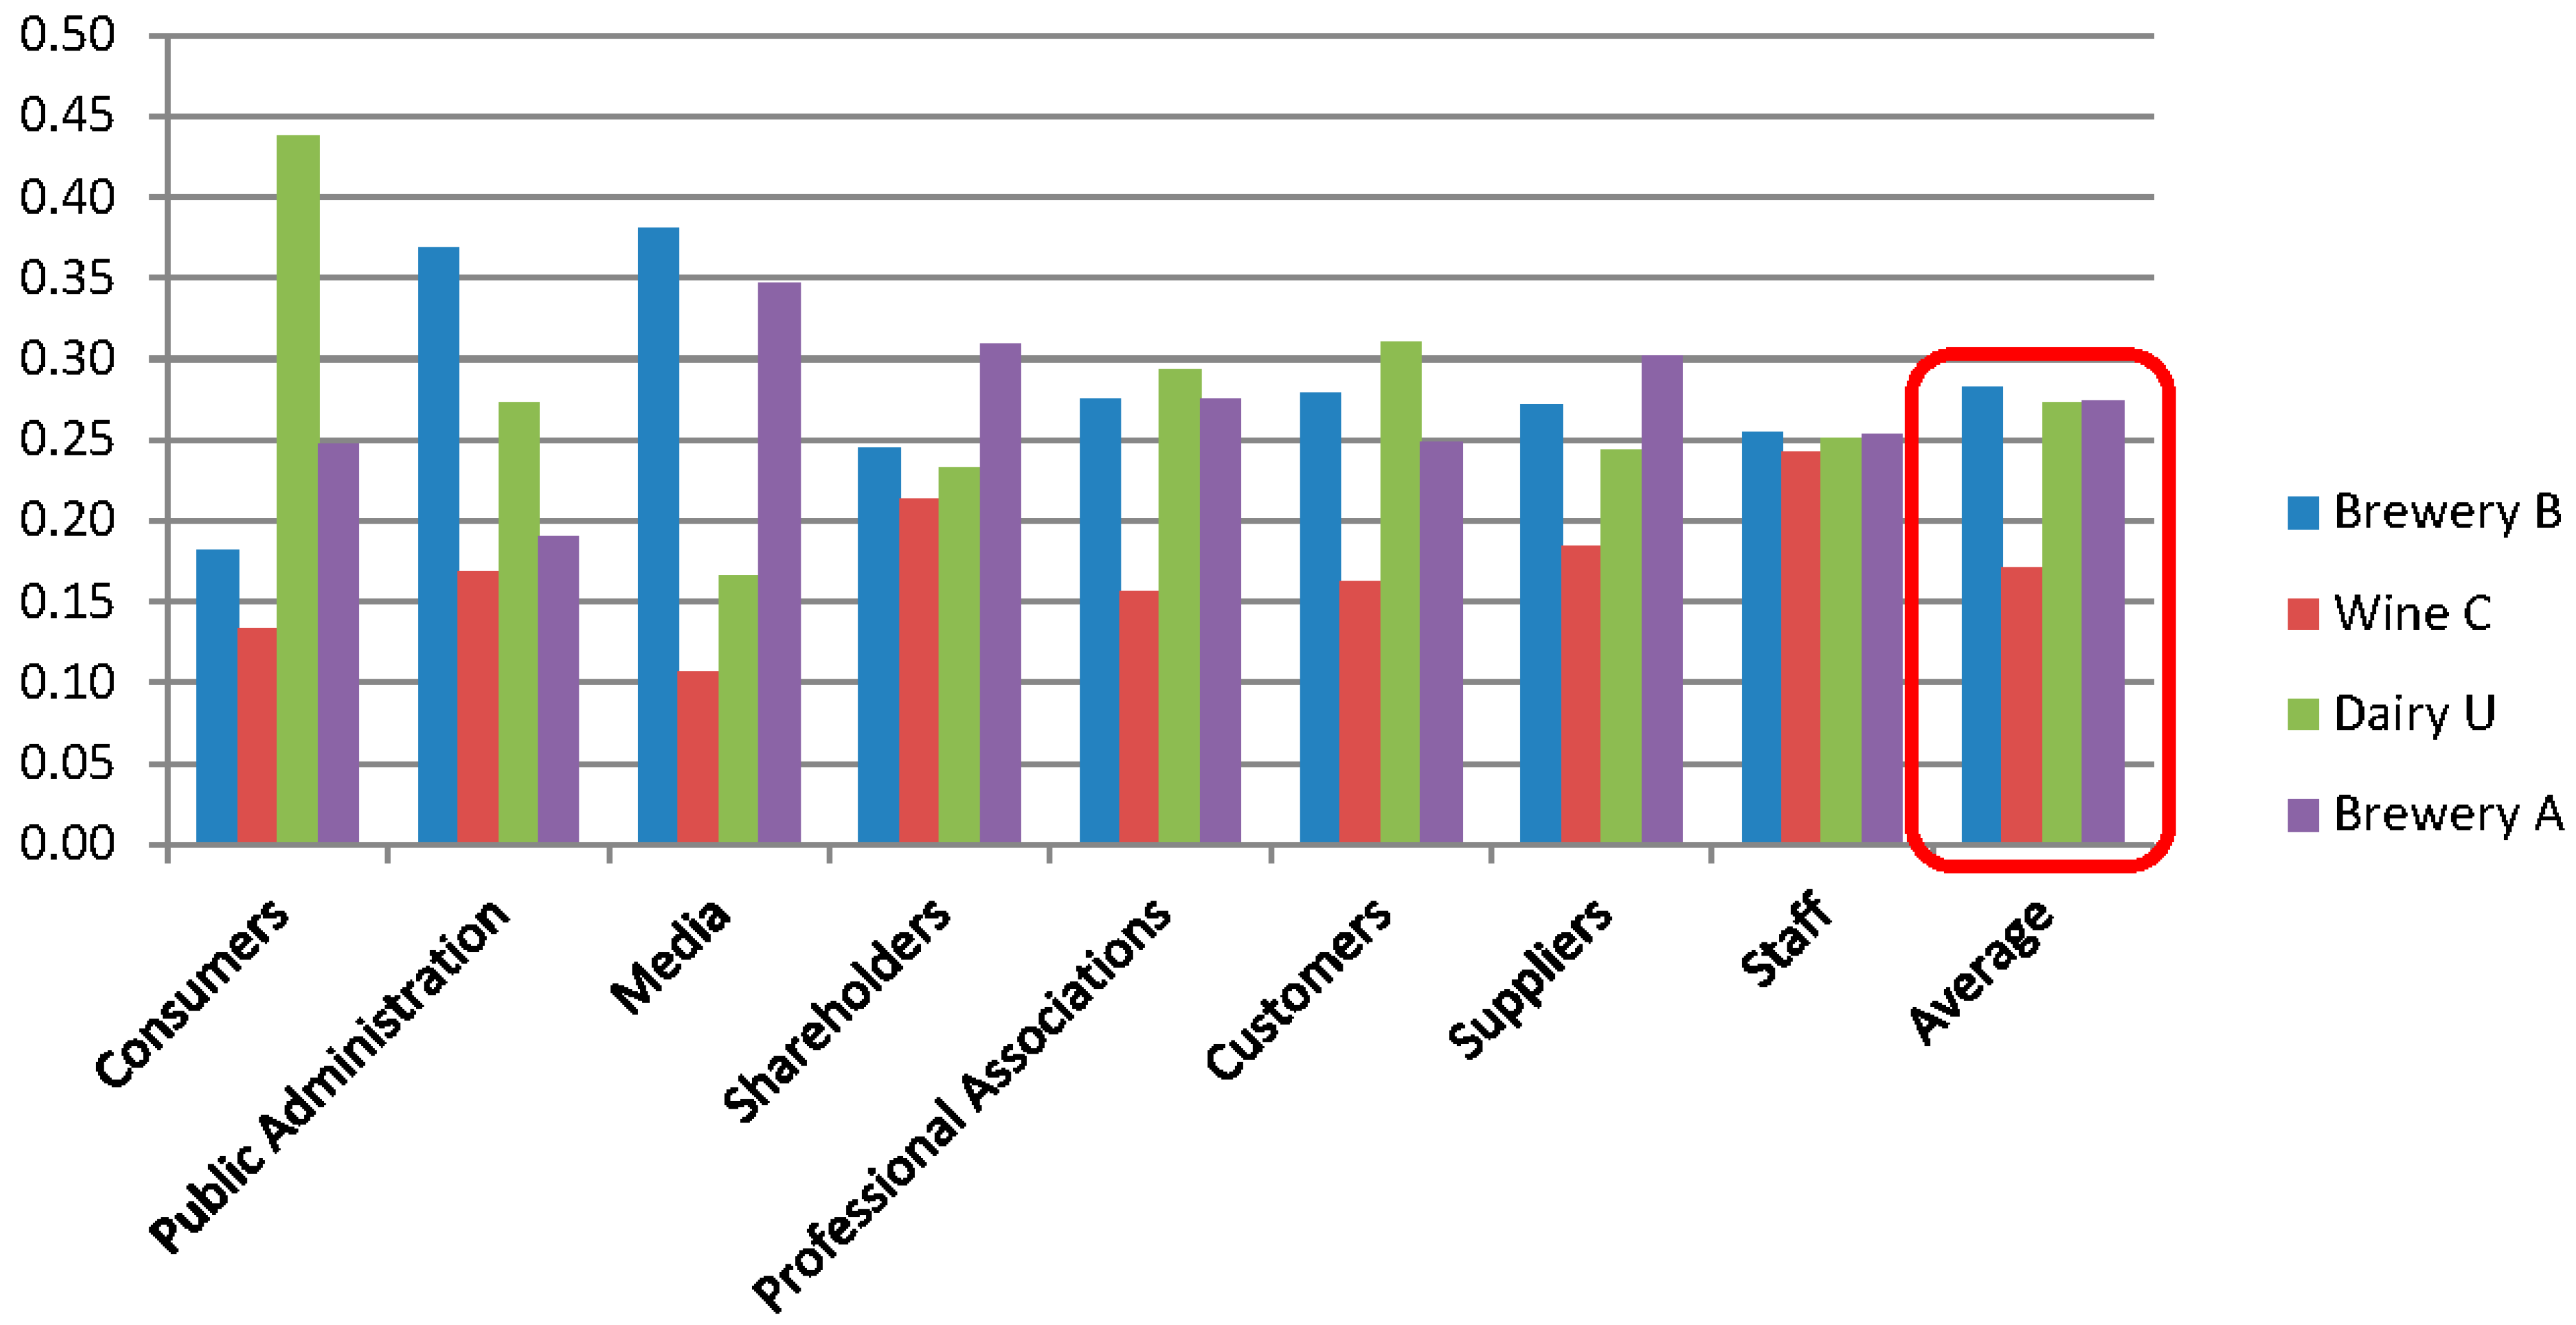
The reports of Brewery B (0.282), Brewery A (0.274), and Dairy U (0.273) received similar scores, while the report of Winery C (0.170) scored significantly worse. In fact, all stakeholders assigned Winery C the lowest score, while they differ slightly in their allocation of the highest score to one of the other three reports. As it can be seen in
Figure 4, the representative from the Consumer stakeholder group marked the biggest difference between the reports, (0.438 for Dairy U and 0.133 to winery C), whereas the score from the Shareholders representative is the most similar across all reports (from 0.213 to 0.309).
Figure 4.
Preferences for sustainability reports by stakeholder and as an aggregate.
Figure 4.
Preferences for sustainability reports by stakeholder and as an aggregate.
A final remark has to do with the issue of putting to market alcoholic beverages and its relationship with social impacts like alcoholism, illegal consumption, driving drunk, etc. It was found almost irrelevant. Companies only mentioned it specifically in the social sections of the reports, experts did not show special interest and there were no significant differences with the dairy group. Therefore, the companies were totally comparable in terms of reports, although they have different social, environmental and economical claims.
3.3. Analysis of the Weightings Assigned to the Criteria by Stakeholder
The criteria weightings can be further analyzed comparing the stakeholders’ preferences.
Figure 5,
Figure 6 and
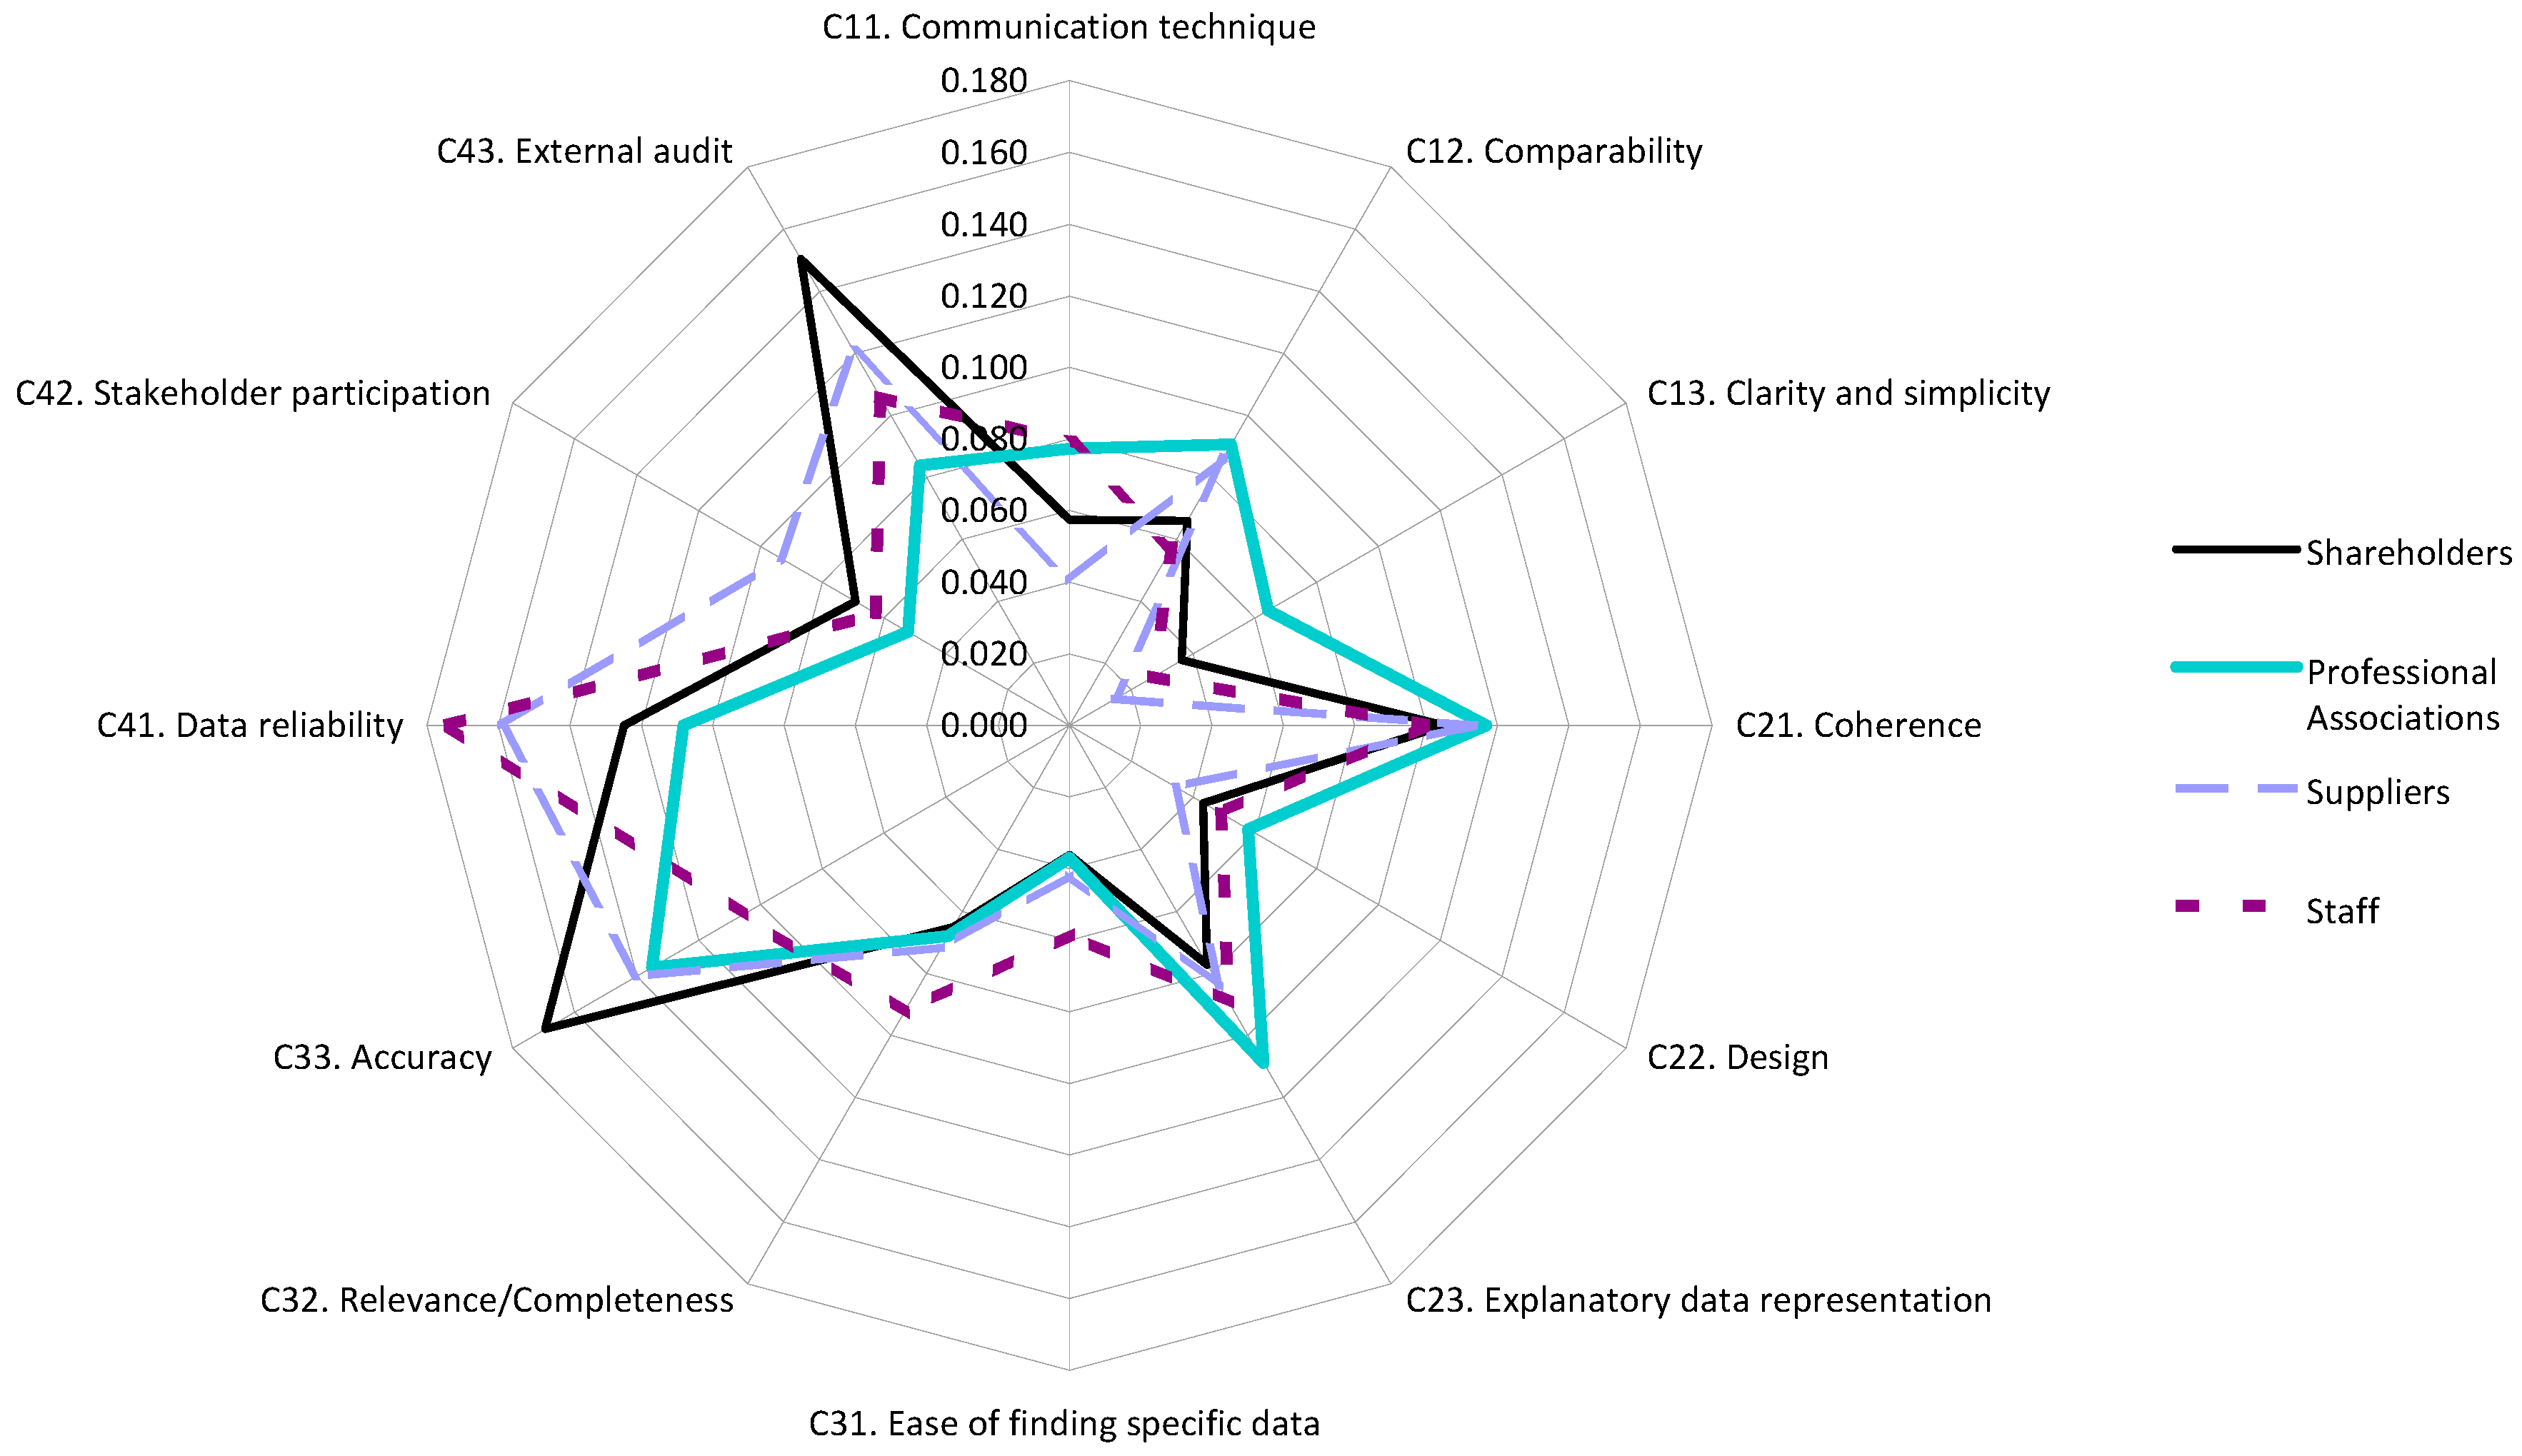
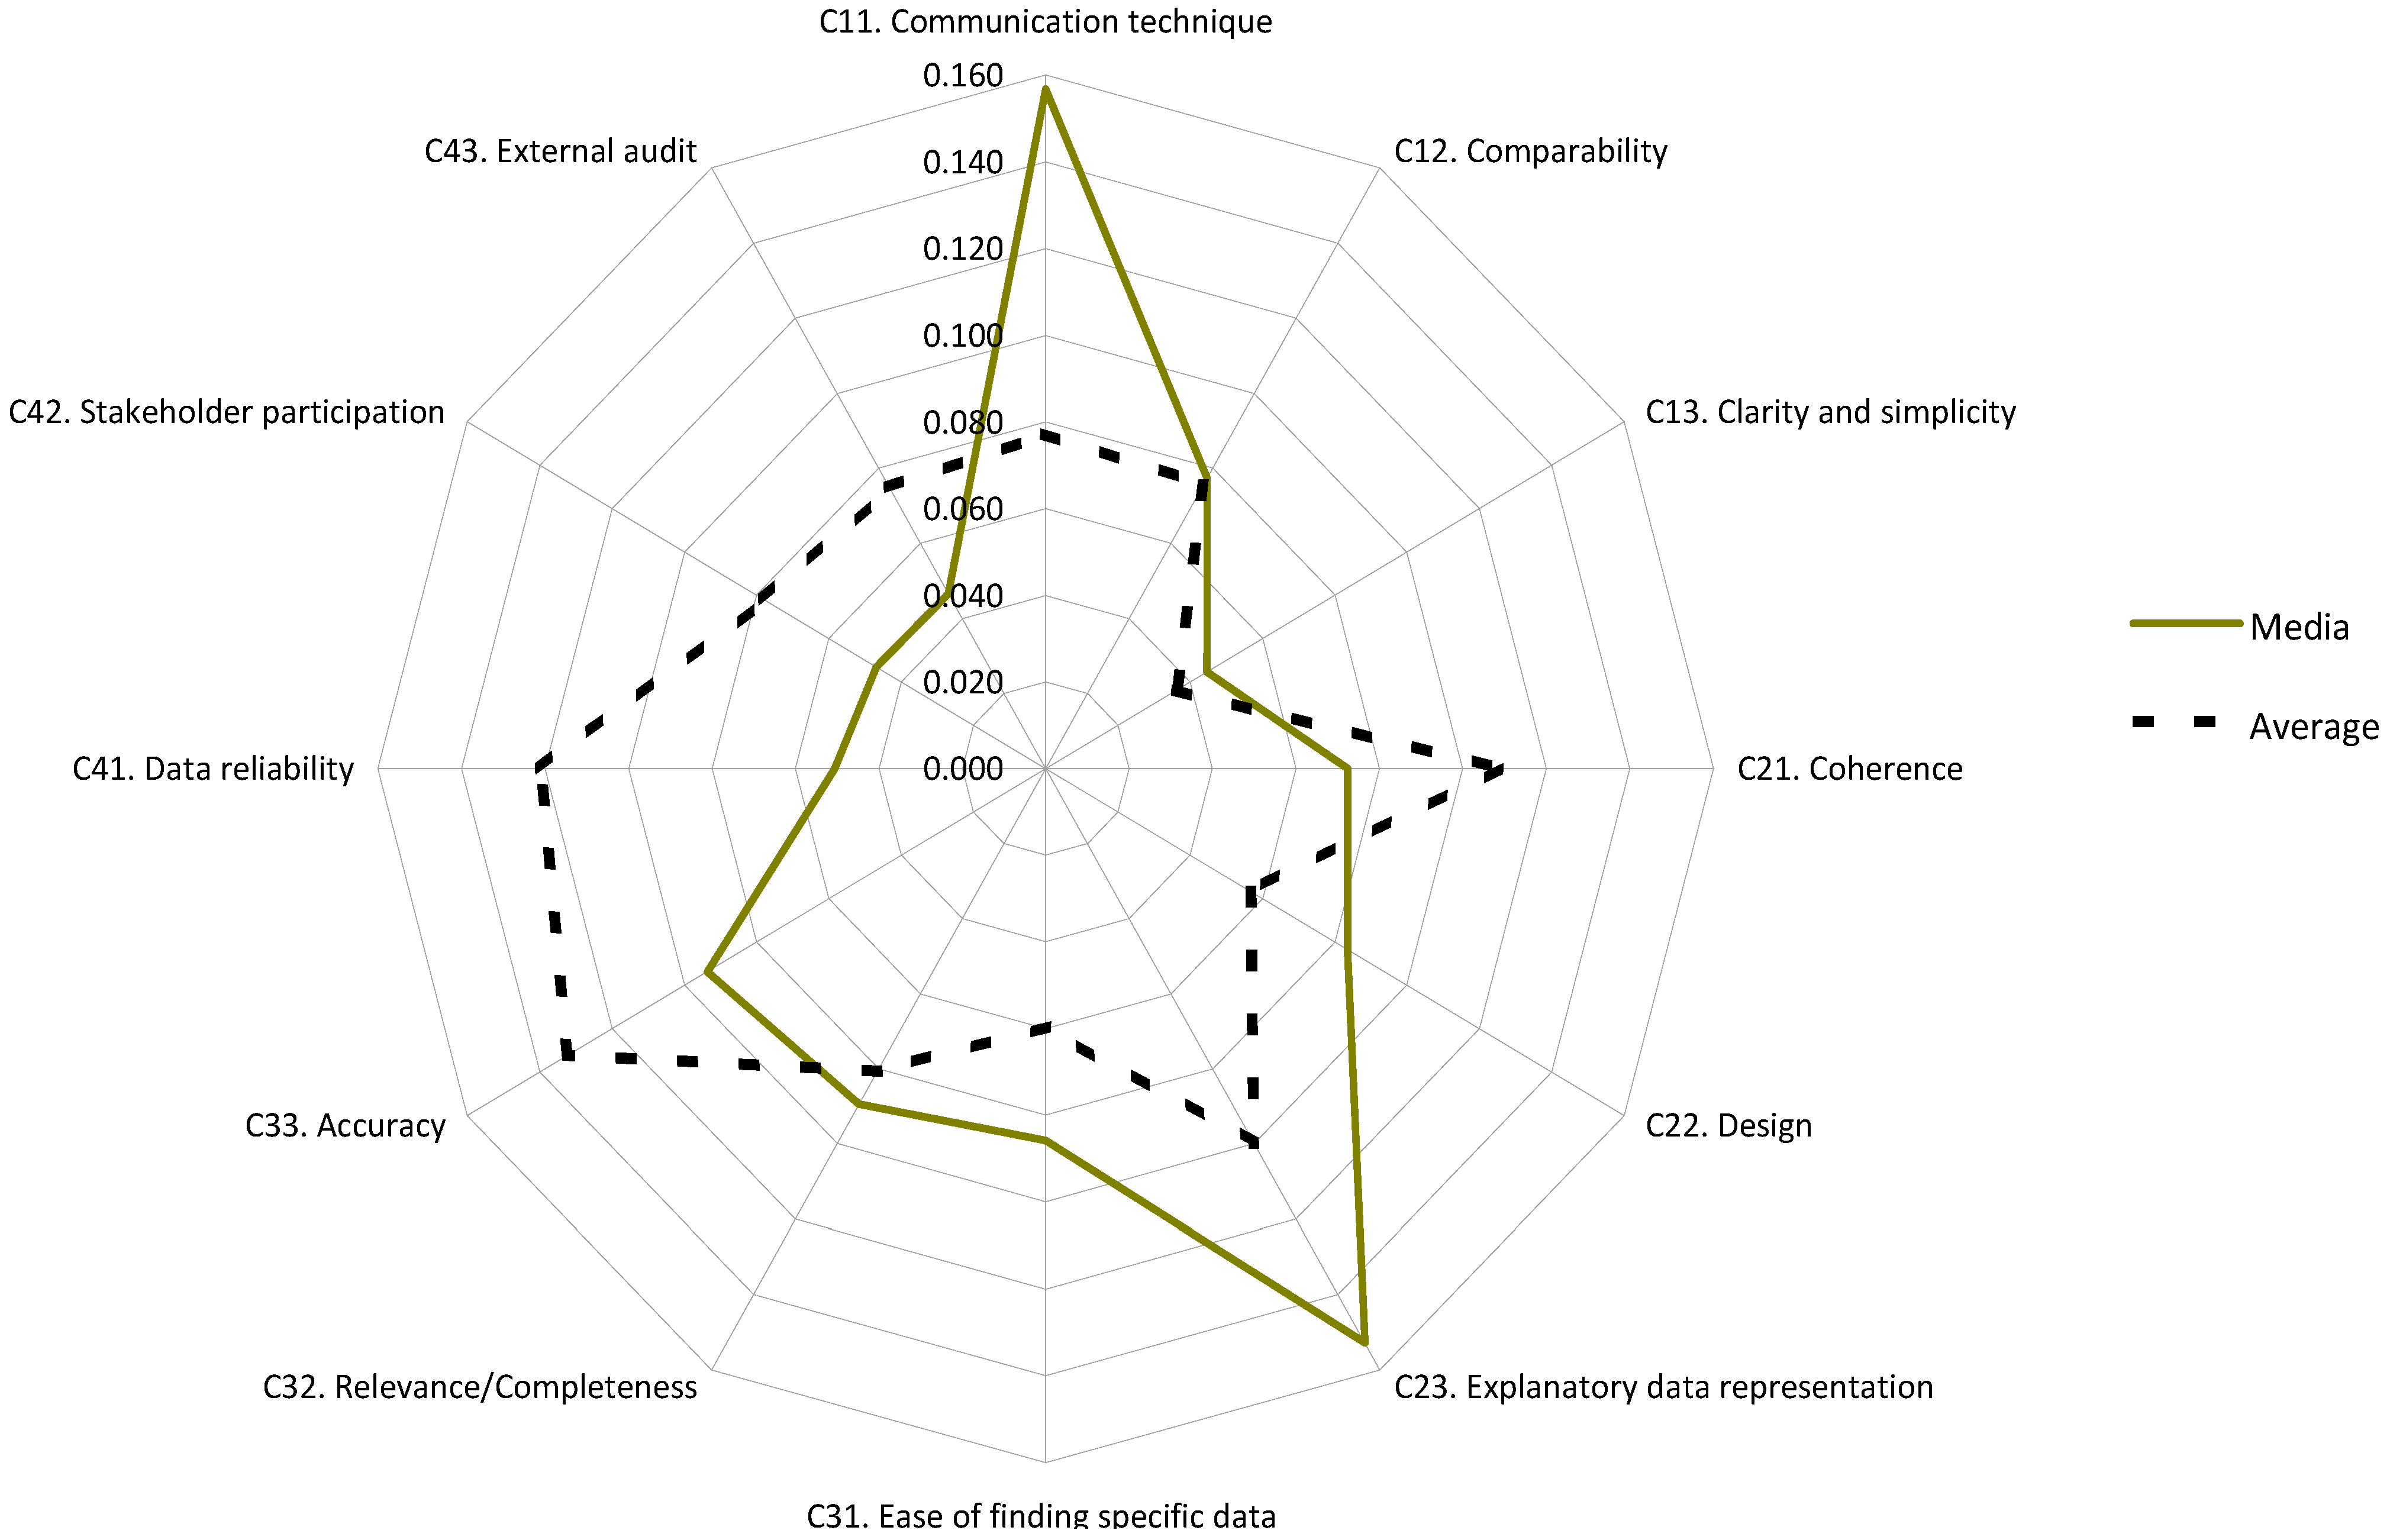
Figure 7 show the different relative weightings assigned to the criteria by each stakeholder. There are again meaningful differences among stakeholders. The Shareholders’ representative values most criterion 4.3: “External audits” to which surprisingly nobody else assigns a high preference except the Staff, and obtains a low average of 0.075. The Media representative values most the C11: “Communication technique” (0.157), which obtains a low average of 0.077. The Customers’ representative prefers C42: “Stakeholders participation” that, also surprisingly, obtained a low average of 0.078 and was not preferred by anybody but the Public administrations. Also, just to add another example, C41: “Data reliability” obtains the highest importance (0.174) for a single representative, the one of the Staff, showing Staff concern for the company’s reliability. All those results made sense to the experts and prove the utility and consistency of the methodology.
Figure 5.
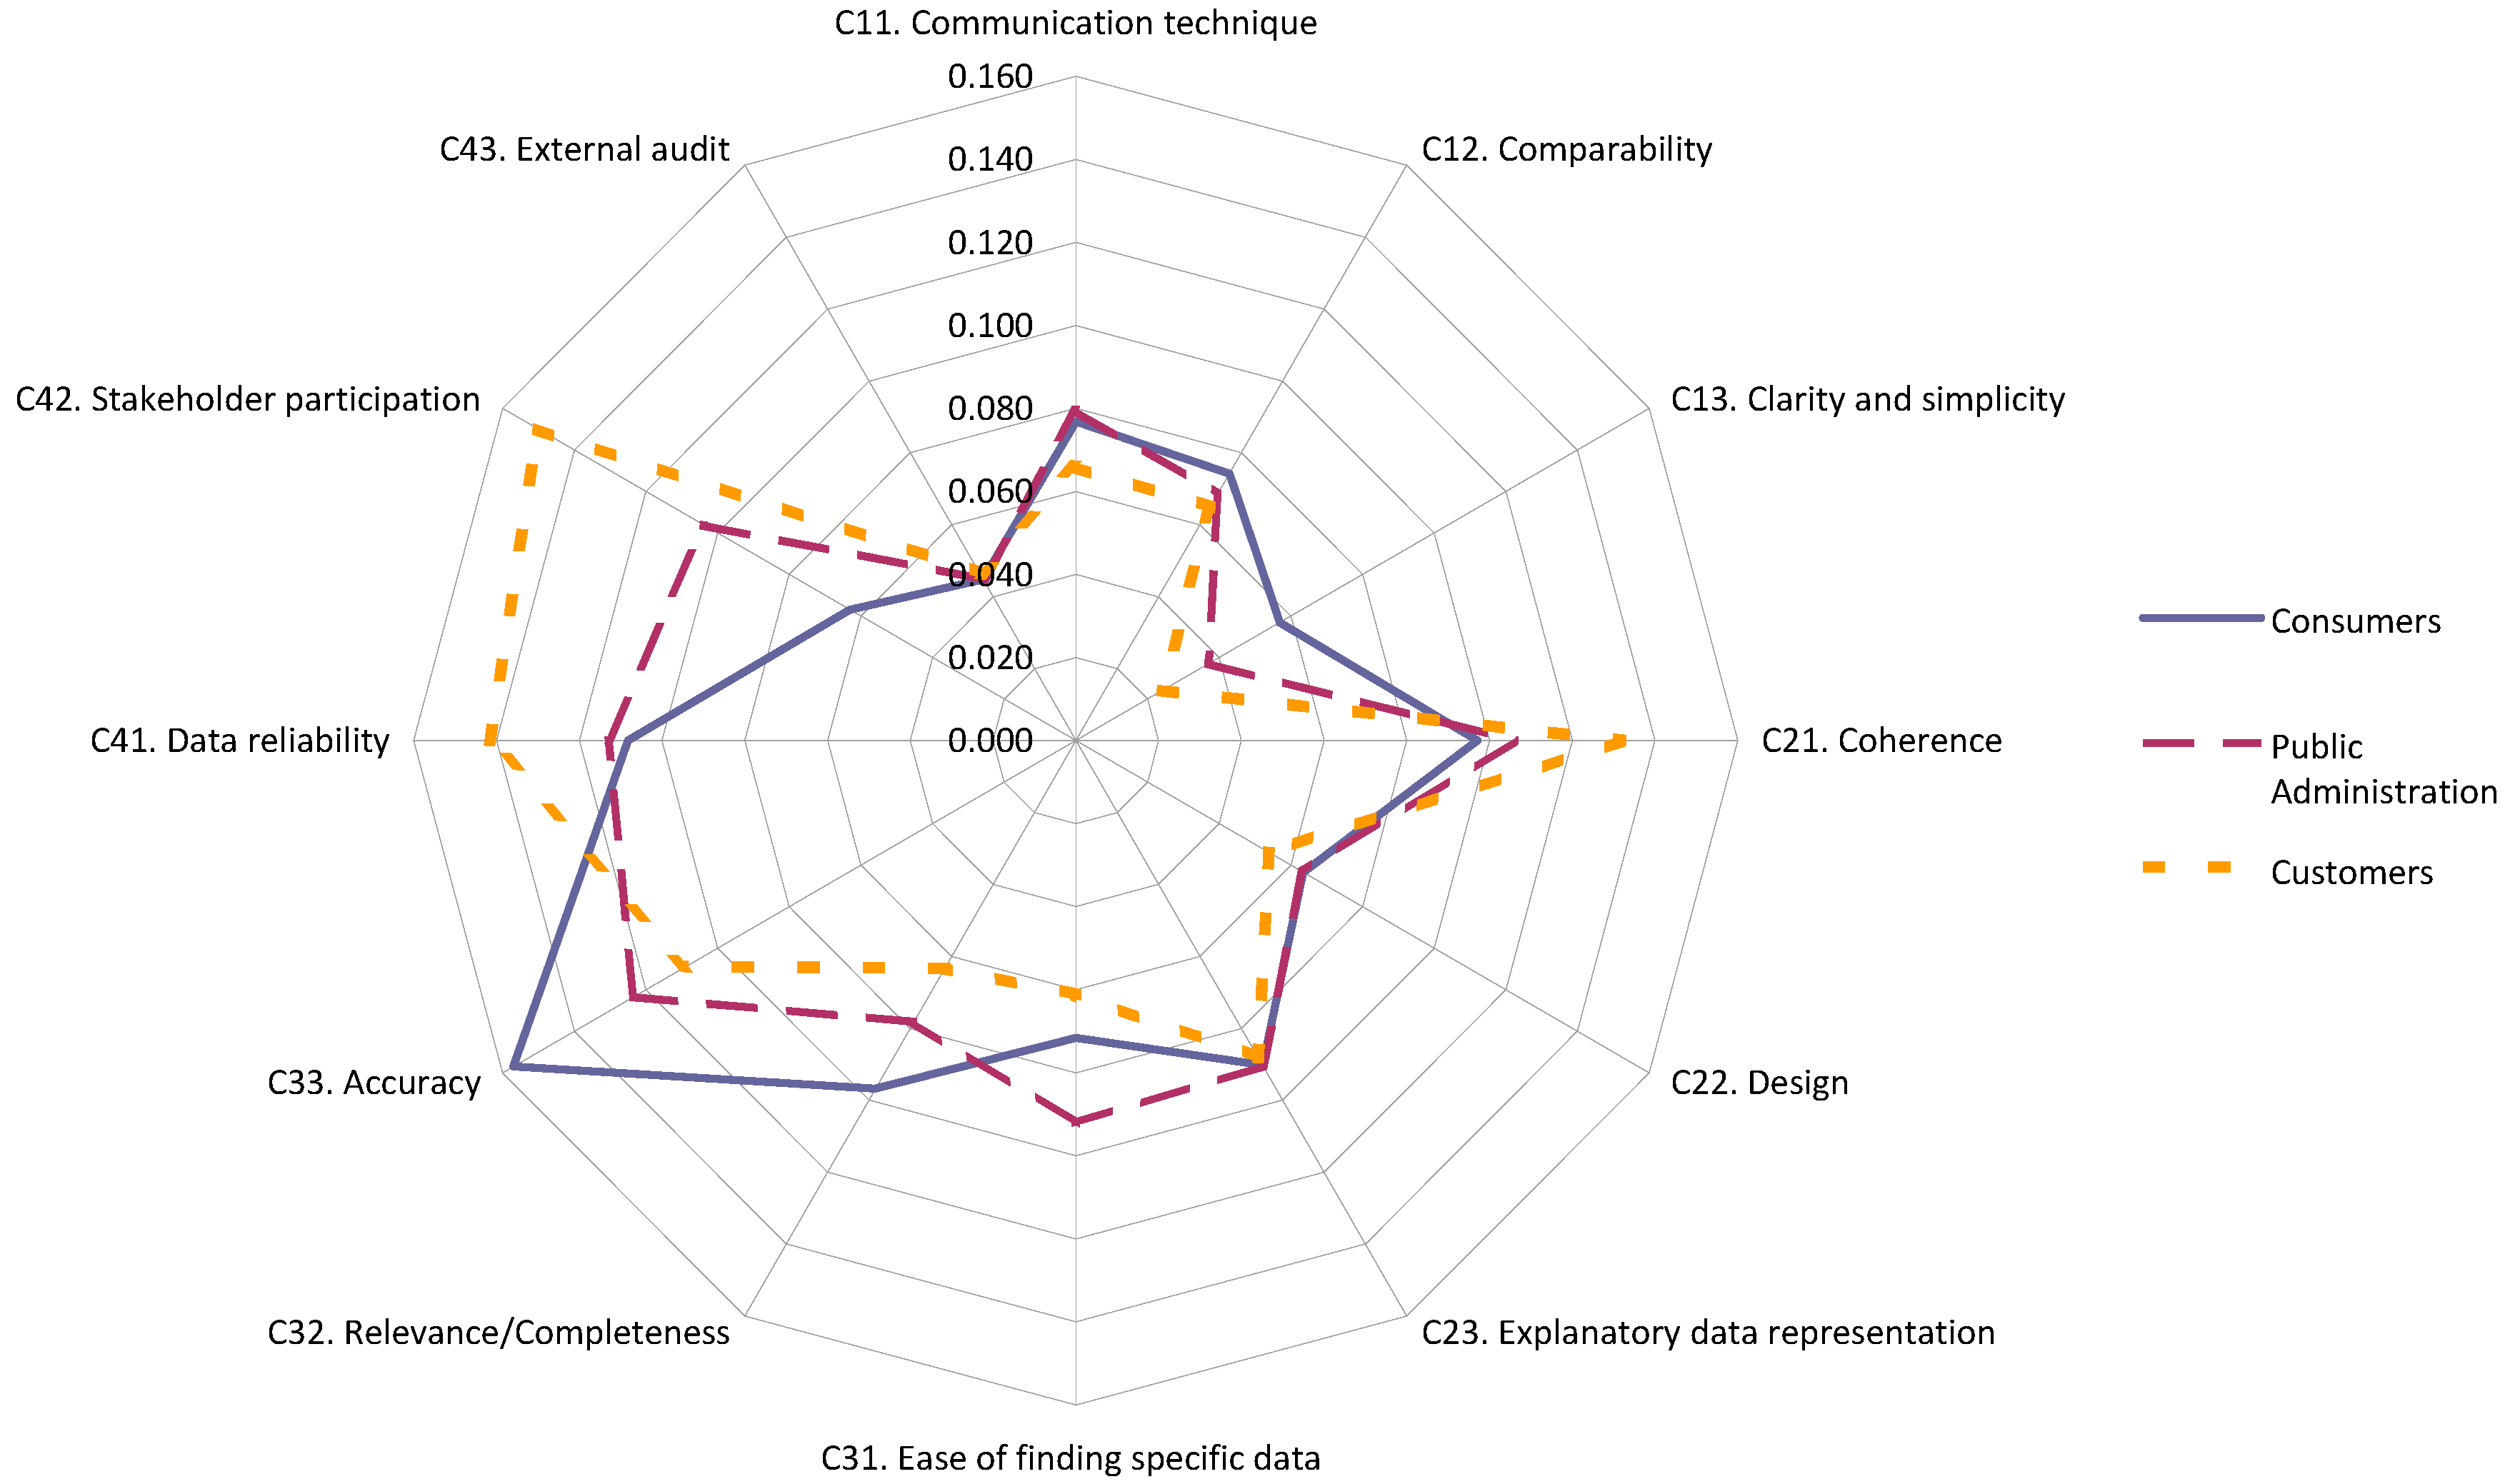
Relative weightings for consumers, public administration, and customers.
Figure 5.
Relative weightings for consumers, public administration, and customers.
Figure 6.
Relative weightings for shareholders, professional associations, suppliers, and staff.
Figure 6.
Relative weightings for shareholders, professional associations, suppliers, and staff.
Figure 7.
Relative weightings for media, and the overall average based on the geometric mean.
Figure 7.
Relative weightings for media, and the overall average based on the geometric mean.
Finally, comparing the stakeholders’ profiles like in
Figure 5,
Figure 6 and
Figure 7, it can be observed that representatives of the Consumers, Public administration, Professional Associations and Customers present a similar profile,
i.e., share similar interests in this case study. Shareholders, Suppliers and Staff have similar profiles too, but are different from the previous ones. Finally, the Media representative obtained a completely different profile. The methodology allows analyzing the stakeholders’ preferences towards the reports, thus helping to better adapt the design of the report to the main stakeholders, should this be the company’s strategy.
3.4. Analysis by Criteria of the Evaluation of the Sustainability Reports
As introduced in
Section 3.2., ANP allows determining the reasons for the results,
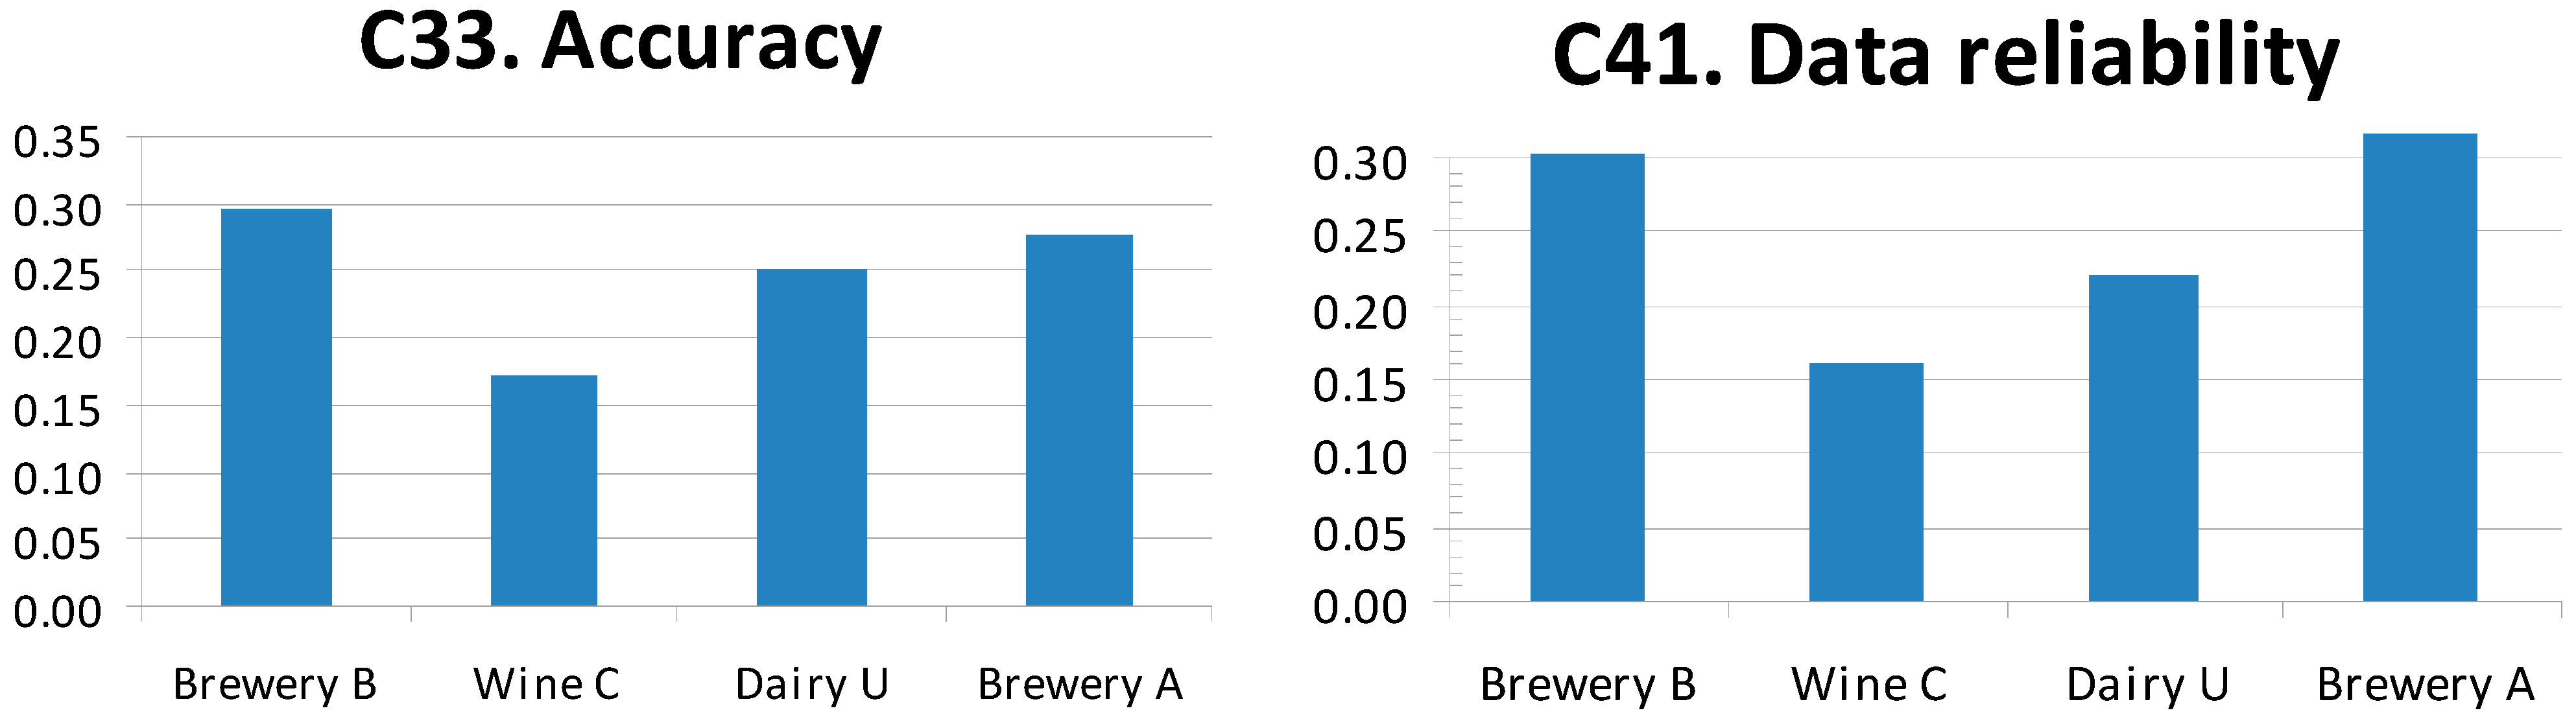
i.e., who prefers what and how much. For example, intermediate results of the analysis can show which alternative (or report) performs best for each criterion. In other words, the value of each report in terms of just one particular criterion—without considering dependencies among criteria—can also be analyzed. This is the way some other multi-criteria techniques, such as the weighted sum or the AHP, proceed. To show its interest, results are analyzed according to each of the two most important criteria on average (“Accuracy” and “Data reliability”). For example, considering only the “Accuracy” of the reports, the most accurate report is Brewery B. Similarly, isolating the evaluation of the "Data reliability" of the reports, the most reliable report is Brewery A (
Figure 8). Therefore, it can be concluded that, although the reports of Brewery A and Brewery B obtain close scores, the reasons for these scores are different. This in depth analysis could be carried out for any of the studied criteria.
Figure 8.
Evaluation of the reports according to the criteria of “Accuracy” and “Data reliability”.
Figure 8.
Evaluation of the reports according to the criteria of “Accuracy” and “Data reliability”.
4. Conclusions
The research results answer the main assertions found in the literature review. On the one hand, a framework has been put forward for assessing the communication quality and the accountability quality of the CSR reports. On the other hand, the methodology reveals the preferences of the different stakeholders in regards to communication by means of CSR reports. Besides, the results can be used to better design the CSR reports according to the demands for communication and accountability of the main stakeholders for each organization. Finally, to the knowledge of the authors, this is the only paper addressing all these topics together.
Indeed, the methodology described herein allows different stakeholders to assess sustainability reports depending on their communication capability. Results show varying degrees of quality in the communication of different enterprises from the same sector. This assessment highlights the weaknesses and areas for improvement of each of the reports analyzed from a multi-stakeholder point of view. These results give those responsible for producing sustainability reports for Spanish food companies a reference template for writing and developing better reports in the future on the basis of the criteria studied and the preferences of each stakeholder. The systematic and rigorous application of the procedure will help in the professionalization of the reporting practice of CSR as practitioners will have a tool for getting feedback from other reports, including their own, and for suggesting communication improvements based on evidence and facts. In parallel, the procedure drives and guides the dialogue with stakeholders regarding the report as a means of communication in itself.
Another of the main findings of the research is the criteria framework itself. Without the weightings, it could be applied to different CSR reports. This research is based on the GRI guidelines although it does not criticize the GRI methodology but its application in producing reports. Other guidelines and requirements’ lists can be used to fulfill sustainability reports like those of the Dow Jones Sustainability Index, the Global Compact, etc. The procedure here presented could be applied directly to those other options. The division into two approaches (communication and accountability) and the selected criteria are perfectly suitable and measurable in those reports. As such, the weightings of the criteria could vary as the stakeholders may have different preferences regarding those approaches.
The strength of the proposed methodology lies in the use of the ANP, as this process sorts the assessment criteria in order of importance (i.e., relative weighting) and ranks the reports according to the preferences of the expert consultants (i.e., the stakeholder representatives). The ANP provides a method of performing transparent, traceable multi-criteria analysis. Each stage of the procedure is documented so that learning can be derived from both the results of the research and the process itself. The study examines the assessment criteria used to evaluate the reports, as well as the relationships between these criteria, measuring their importance as a function of their influence. Finally, ANP makes it possible to work with both quantitative and qualitative data, even though, at times, this information is somewhat incomplete or uncertain as it is based on stakeholder experience or preferences.
Nonetheless, the proposed methodology has some limitations. On the one hand, ANP ranks the alternatives by comparing them with one another. Therefore, rather than providing an absolute classification, the results are relative. That means ANP should not be used to classify the reports into, say, “Excellent”, “Good”, “Acceptable” or “Poor”. Rather, ANP allows classifying the reports as, for example, “the best”, “among the best”, “average”, “among the worst” or “the worst”. In our case study, we have found three reports to be almost equally “better”, and another to be quite “worse”. Another limitation of this methodology is the use of longer, more complex questionnaires compared to other similar methods such as AHP. Despite these shortcomings, the stakeholders showed their satisfaction with the procedure and the results of the analysis which, in their opinion, justified the resources required for the study.
As a side result of this study, it was confirmed stakeholders value sustainability reports highly. Also, results show that GRI guidelines are valuable for organizing information, ensuring relevance and completeness, enabling the consultation and comparison of data, auditing reports, and so forth. Nevertheless, very few enterprises from the food sector publish sustainability reports, and even fewer adhere to the GRI standards. Furthermore, the results of the analysis imply that firms do not seem to channel their CSR management towards fulfilling the CSR actions detailed in the sustainability report, a criticism that has repeatedly arisen in the literature. For example, the challenges of selling alcohol were lightly addressed in the reports. However, to be fair, stakeholders’ representatives did not pay much attention to it.
This lack of materiality is reflected in the scoring of the reports, as the experts’ evaluations are uncorrelated with the application level of the GRI—A, B, C, and undeclared. This leads to the conclusion that stakeholders do not deem the amount of information (number of indicators) in the reports to be crucial. Indeed, they valued more favorably the reports that included, without oversights, all relevant indicators with appropriate levels of communication quality, rigor, and trustworthiness.
On average, experts have a slight preference for the Consistency criteria over the Communication criteria. Organizations should therefore dedicate more effort to the consistency of their reports as opposed to the quality of their external communications, which contradicts standard practice and confirms what is reported in the literature (see, among others: [
11,
12]). Lately, GRI guidelines have added the materiality principle to partially reveal and prevent this bad practice although, at the time of our case study, the materiality principle had not yet been demanded.
Proposals of further research now follow three main strategies: On the one hand, as Ishizaka and Labib [
51] proposed, one strategy is to design a simplified version of the ANP maintaining its analytical properties, in order to increase the feasibility of ANP adoption. On the other hand, the relative importance of the stakeholders could be included in the ANP model by weighting their preferences among the average results. Finally, as more case studies are carried out, good and bad reporting practices can be identified according to the stakeholders’ preferences. That would allow putting forward guidelines to improve the communication quality of the reports according to each specific criterion.
The evaluation focused solely on the food sector. As said, the methodology is applicable to other sectors. The assessment criteria are perfectly suitable to applications in other sectors, although the same is not true of their relative weightings, because the sector characteristics should affect the way experts assign weighting to the criteria. In other sectors, the stakeholder profile, the demands of the sector, the firms themselves, and the repercussions of their activities, among other factors, may differ.


 and
and 


