Article

Preferences Matter: A Constructive Approach to Incorporating Local Stakeholders’ Preferences in the Sustainability Evaluation of Energy Technologies

by
Stelios Grafakos
1,*,
Alexandros Flamos
2 and
Elena Marie Enseñado
3
1
Institute for Housing and Urban Development Studies (IHS) and Dutch Research Institute for Transitions (DRIFT), Erasmus University Rotterdam (EUR), Burgemeester Oudlaan 50, 3062PA Rotterdam, The Netherlands
2
Department of Industrial Management, University of Piraeus, 80, Karaoli & Dimitriou str, PC18534 Piraeus, Greece
3
Institute for Housing and Urban Development Studies (IHS), Erasmus University Rotterdam (EUR), Burgemeester Oudlaan 50, 3062PA Rotterdam, The Netherlands
*
Author to whom correspondence should be addressed.
Sustainability 2015, 7(8), 10922-10960; https://doi.org/10.3390/su70810922
Submission received: 25 May 2015 / Revised: 24 July 2015 / Accepted: 30 July 2015 / Published: 11 August 2015
(This article belongs to the Section Energy Sustainability)

Abstract

:
This research paper aims at developing and applying a constructive weighting methodology for the elicitation of local stakeholders’ preferences regarding a set of sustainability evaluation criteria during the assessment of low-carbon energy technologies. The overall methodology has been applied and tested for the sustainability evaluation of selected low-carbon energy technologies in Europe from a local stakeholders’ perspective. The researchers applied a constructive weighting methodology based on different Multiple Criteria Analysis (MCA) techniques to test the consistency of stakeholders’ preferences. The methodology was piloted based on a small-scale European local stakeholders’ survey within the framework of Covenant CapaCITY, an Intelligent Energy Europe project that supports the development of Sustainable Energy Action Plans (SEAPs). It became evident that the local stakeholders who participated placed high priorities on aspects such as CO2eq emissions reduction, ecosystem damages reduction, and resilience to climate change during the evaluation of low-carbon energy technologies. Considering the overall energy technologies assessment, wind off-shore, solar PV, hydropower, and wind on-shore achieved the highest scores and better reflected the priorities of local stakeholders considering a large set of multiple sustainability criteria. The high number of criteria led to some inconsistencies of stakeholders’ preferences, confirming the need for consistency checks and/or combining different methods of preference elicitation.

1. Introduction

Evaluation of energy technologies and energy planning necessitates the participation of relevant stakeholders, from electricity producers and energy associations to environmental groups and local communities. Urban energy stakeholders include those who have legitimate responsibilities for energy projects (e.g., government authorities—national, regional, and local), those who support or oppose these initiatives (e.g., non-governmental organizations or NGOs, consumer associations, homeowner groups), and those who depend on it (e.g., energy users and customers). Each stakeholder group, however, has its own objectives, priorities, and preferences that should be taken into account during the process of energy technologies evaluation and planning.
One method for structuring and analyzing a multi-actor and multi-objective complexity is Multiple Criteria Analysis (MCA). MCA has been widely used for sustainable energy planning, as a useful tool in facilitating decision making among different stakeholder groups, in expanding the range of possible outcomes, and in assessing the performance of technologies against a set of evaluation criteria [1,2,3].
However, a universal ranking of energy technologies, as has been attempted already [4,5,6], would not be applicable in all cases and geographical contexts. Different geographical and jurisdictional levels would lead to selection of different criteria and therefore to evaluation from different perspectives with possibly different outcomes. Analysis of local energy stakeholders’ preferences at the European level, which to the best of our knowledge has not been previously performed, could provide useful insights for energy planning.
In many MCA applications, the direct inclusion of stakeholders is not considered. Often experts attempt to deduce stakeholders’ preferences instead of including them directly in the decision-making process. Most applications on energy issues focus on technical aspects, without involving stakeholders in the decision-making process in a constructive way [2].
Our review of the energy planning literature showed that MCDA methods have been used extensively in Europe in the assessment of different energy options at different levels. MCDA approaches have been applied in the assessment of energy and low-carbon options mainly at the micro (project) level, but also at the meso (local/regional) and macro (national/international) levels.
Table 1 and Table 2 summarize the studies that have applied MCDA approaches in meso and macro levels for assessing future and current energy options in Europe. Furthermore, the table provides information on the level of inclusion of stakeholders in the phase of criteria weighting. Detailed reviews of MCDA applications in energy planning have been done by different authors [1,2,3,7] In addition, analysis of the potentials and opportunities of using MCA in sustainability assessment [8].
Table 1. MCDA applications in energy planning in Europe at the local/regional level.
LevelStudyThematic AreaMCA MethodologyCurrent vs. Future Energy OptionsWeighting MethodCriteria SelectionActors Involved in Weighting ProcessReal Application
Chios Island, Greece[9]Renewable energy projectsPromethee IICurrentDirect weightsBy researchersWeight factors reflecting the analysts' previous experienceProposed methodology
Sardinia Island, Italy[10]Renewable energy technologiesElectre IIICurrentSIMOS approachBy researchersThree different scenarios by the researchersProposed methodology
Salina Island, Italy[11]Wind energy plantsNaiade methodCurrentDoes not incorporate a traditional weighting techniqueBy researchersDoes not incorporate a traditional weighting techniqueYes
Catalonia, Spain[12]Wind farm locationsSocial multi-criteria evaluationCurrentEqual weightsBy researchers and stakeholdersEqual weights were assignedYes
Metropolitan Borough of Kirklees in Yorkshire, United Kingdom[13]Small-scale energy technology applicationsMACBETHCurrentDirect allocationBy researchersFive (5) professionals in the energy sectorYes
Norway (local case study)[14]Future energy-supply infrastructureEquivalent attribute technique (EAT)FutureSwingBy researchersSix (6) professionals in the energy and research industryProposed methodology
Crete, Greece[15]Sustainable energy planningPrometheeCurrentDirect allocationSelected by researchersLocal authorities, local communities, potential investors, academic institutions, environmental groups, and government and European UnionYes
Urnasch, Switzerland[16]Future energy systemsAnalytic heirarchy processFuture (2035)AHPBy researchers and stakeholdersEnergy consumers, experts and academics, and energy industry actorsYes
Thassos, Greece[17]Renewable energy sourcesREGIMECurrentDirect allocationBy researchersCriteria weights were determined based on the (1) combination of environmental, social, and economic characteristics of the technologies and (2) local and regional characteristics of the area under investigation.Proposed methodology
Crete, Greece[18]Strategic electricity generation planningDelphi approachCurrentDirect allocation through DelphiBy researchersA total of 30 experts (from the academe, national energy research centers, and power corporation).Yes
Table 2. MCDA applications in energy planning in Europe at the national/international level.
LevelStudyThematic AreaMCA MethodologyCurrent vs. Future Energy OptionsWeighting MethodCriteria SelectionActors Involved in Weighting ProcessReal Application
Bosnia and Herzegovina[19]Selection of energy systemASPIDCurrentDirect allocationBy researchersWeighting factors were allocated to the different indicators by the researchers.Yes
Turkey[20]Future electricity resourcesPromethee I and IIFuturePairwise comparisonsBy researchersCriteria weighting was carried out by the researchersProposed methodology
Greece[21]Alternative power generation scenariosPrometheeCurrentDirect allocationBy researchersFour different weighting sets were used by researchers.With attributes of real-world application
United Kingdom[22]National energy policySimple multi-criteria evaluationFuture (2050)Direct allocationBy stakeholdersMembers of the general public by way of citizen panels and through (1) small group settings and (2) plenary for comparison of evaluationsYes
Austria[23]Energy scenariosPrometheeFuture (2020)SIMOSSelected by researchers and stakeholdersNational case study stakeholders include government bodies, private firms, power distributers, NGOs and research institutes, while local case study stakeholders were energy experts, mayors, and citizens.Yes
Greece[24]Sustainable technological energy prioritiesLinguistic variablesFuture (2021)Direct allocationBy stakeholdersDecision makersProposed methodology
Spain[25]Selection of renewable energy projectVIKOR, Analytic Heirarchy ProcessCurrentPairwise comparisonsBy researchersThree groups of stakeholders: government, banks, and development companies.Proposed methodology
Turkey[26]Energy planningmodified fuzzy TOPSISCurrentPairwise comparisonsBy researchersThree (3) energy planning expertsProposed methodology
Lithuania[27]Energy generation technologiesAHP and Additive Ratio Assessment (ARAS) methodCurrentAHpBy expertsA group of 25 experts (managers and lawyers of energy enterprises, financial specialists, and scientists).Yes
Europe[28,29,30]Assessment of electricity supply optionsWeb-based MCDAFuture (2050)Hierarchical weightingBy stakeholdersStakeholders, ranging from energy suppliers and consumers to non-government organizations and government authorities.Yes
Based on our review, assessing future energy technologies while integrating and mapping local stakeholders’ perspectives at a wider scale (i.e., European level) is lacking. The only European-wide MCA study that was conducted, which is the New Energy Externalities Development for Sustainability (NEEDS) project, applied a MCDA of future energy technologies in four countries, namely France, Germany, Italy, and Switzerland [31,32] for the year 2050. The MCA aimed to assess energy technologies, considering the varied national stakeholders’ preferences for the trade-offs between different criteria [33].
Nevertheless, like in other research areas, a trend towards increased inclusion of stakeholders can be observed in energy research as well. The steps of criteria selection and weighting wherein stakeholders express subjective judgments are steps that could foster direct participation of stakeholders and inclusion of their preferences into the decision-making process [7,34]. However, the design and implementation of such interaction with stakeholders is considered a major challenge and should be carried out carefully [28].
In addition, several studies have shown that well-articulated and preconceived preferences regarding unfamiliar and complex issues cannot apply [35]. Instead, in these settings, respondents construct their preferences during the process of elicitation. Preference construction process should be considered when some of the decision elements are unfamiliar and where there are conflicts among the choices to be made [36]. Energy planning and sustainability evaluation of energy systems are complex issues that also entail difficult decisions and trade off considerations. Moreover, preferences change under different contextual conditions [37], while different methods (procedure) and different descriptions (framing) can give rise to systematically different responses [38]. Hence, this indicates that respondents (and in our case local energy stakeholders) need a method to help them to articulate their preferences, and any attempt to derive their preferences should be based on an active procedure of preference construction [36].
The combination of different methods during preferences’ elicitation and concluded, among other things, that combining different techniques could (a) provide a form of consistency testing and (b) lead to more reliable and acceptable elicitation of preferences has been investigated [33]. The use of multiple methods to explore method invariance has been suggested as different methods can yield different results [35]. Such inconsistencies are an opportunity to reflect on results from different framings of the issue at hand, whereas that opportunity is lost when a single method is used [33]. Furthermore, as has been shown, some respondents may react negatively to the chosen approach, lessening acceptance of the process.
Moreover, it is argued that elicitation of preferences should be an iterative process, whereby the elicited values may have to be adjusted due to deviations from theoretical expectations or to an increased understanding of the problem and the context by the respondent [39]. In addition, combined use of different methods and provision of technical support during the entire process results in minimization of potential biases, enhances appropriate use of the MCA methods, and facilitates confident expression of stakeholders’ preferences [7,33].
The current paper presents the development of a constructive criteria weighting approach that utilizes a consistency test of respondents’ preferences by incorporating different techniques to elicit local stakeholders’ preferences. At the same time, it builds an integrated sustainability criteria framework for the assessment of reference low-carbon energy technologies that would be deployed in 2030 in Europe. When respondents perform a series of choices during a weighting elicitation process, research has shown that it is very difficult to establish preference consistency [39]. This article presents a constructive weighting process that tests respondents’ consistency and enables them to consistently express their preferences. This paper builds on a previous study by the authors [7,40] that incorporated stakeholders’ preferences in an energy and climate change policy context.
Moreover, this research identifies and analyzes the preferences of local energy stakeholders at the European level, which, to the best of our knowledge, has not been previously studied. The constructive weighting methodology and sustainability evaluation of low-carbon energy technologies was applied within the framework of Covenant CapaCITY, a European project that involved and supported different local stakeholders in the energy sector in Europe in developing Sustainable Energy Action Plans. The findings of this study, despite the limited survey sample, may advance the practice of a local stakeholder-driven process in the evaluation of low-carbon energy options in Europe and provide a framework to support group decision-making situations and policy design, two frequent and significant issues in the energy sector.
The paper is structured as follows: Section 2 describes the main methodological aspects and data collection methods that were deployed for this research. Section 3 reports the results of the pilot application of the constructive weighting methodology for eliciting local stakeholders’ preferences while also presenting the final ranking of low-carbon energy technologies. The final section includes the main implications of the research findings, future research directions, and concluding remarks.

2. Methodology

2.1. Energy Technologies under Investigation

The energy technologies under investigation were selected by reviewing the most prominent current and future energy technologies that could reduce carbon emissions by 2030 in Europe. Advanced fossil fuel-based energy technologies were also selected in order to provide an overall and complete comparative assessment framework. The selected technologies, which are considered as average and representative reference technologies in Europe, reflect the state of the art in electricity production. To a large extent, the selected energy technologies and their characteristics are based on a previous study [41]. Table 3 shows the selected energy technologies and summarizes their characteristics.
Table 3. Reference European electricity generation technologies under investigation for 2030.
Low-Carbon Energy TechnologiesDescriptions
1Integrated Gasification Combined Cycle (IGCC) coalFuture reference technology for 2030 is an IGCC power plant. IGCC technology is an emerging advanced power generation system having the potential to generate electricity from coal with high efficiency and lower air pollution (NOx, SO2, CO and PM10) than other current coal-based technologies.
2IGCC coal with Carbon Capture and Storage (CCS)IGCC technology lends itself very well to carbon capture and storage (CCS) due to the higher pressure of the gas stream and the possibility to achieve the highly concentrated formation of CO2 prior to combustion. For this to be possible then after having been cleaned of particulates the syngas enters a shift reaction unit in which the methane is reacted with steam to produce hydrogen and CO2. The preferred technique for CO2 separation in applications at higher pressure (i.e. IGCC) is currently physical absorption using solvents commonly used in commercial processes. Once captured, the CO2 can then be treated in the same way as for the other technologies incorporating CCS. The resulting power plant net efficiency for this technology scenario is 48.5%. CO2 transport and storage is modelled in the same way as for Pulverized Coal power plants.
3Gas Turbine Combined Cycle (GTCC)GTCC power plant involves the direct combustion of natural gas in a gas turbine generator. The waste heat generated by this process is then used to create steam for use in a steam generator, in a similar manor to that of IGCC technologies. In this combined cycle power plant around two-thirds of the overall plant capacity is provided by the gas turbine. Reference technology for large natural gas power plants is a 500 MW Combined Cycle (CC) unit. The analysis focuses on a base load power plant. Technology development until 2030 is taken into account with higher power plant efficiencies.
4GTCC with CCSThe electricity generation aspect of this technology is exactly the same as the GTCC without CCS. The flue gas from the GTCC then enters the same CO2 separation, stripping, drying, transportation and sequestration process to that used for coal and lignite CO2 capture.
5Nuclear European Pressure Water Reactor (EPR)This ‘Generation III’ design of nuclear reactor uses either uranium oxide enriched to 4.9% fissile material (uranium-235) or a mix of uranium-235 and mixed uranium plutonium oxide (MOX), with pressurized water as the moderator and cooling agent. The heat from the reaction is used to produce steam to drive a steam turbine generator. It features not only superior reliability and safety over its current ‘Generation II’ counterparts but also higher efficiency. This results in less high-level radioactive waste per unit of electricity generated that requires either reprocessing or long term storage in geological repositories.
6Wind onshoreThe exploitation of wind energy has increased exponentially during the last decades, and there is still large unexploited wind energy potential in many parts of the world—both onshore and offshore. However, the success story of onshore wind energy has led to a shortage of land sites in many parts of Europe, particular in north-western Europe. Vestas’ V80 2 MW turbine serves as current reference technology for onshore wind power in Germany The capacity factor for a generic optimal site near to the coast of the North Sea is assumed to be 0.29. Future wind turbines in 2030 with higher capacities are assumed to be located at the same or similar sites.
7Wind offshoreThe shortage of land sites for onshore wind energy has spurred the interest in exploiting offshore wind energy. Offshore wind farms consisting of multiple wind turbines all connected to a single transformer station are more financially viable than individual turbines. Offshore sites also enjoy the advantage of having significantly more stable and higher wind speeds than onshore sites and which leads to a longer turbine life. Future wind turbines in 2030 with higher capacities than the current ones are assumed to be located at the Danish part of the North Sea (HornsRev) or similar sites. The whole park is assumed to consist of eighty Vestas V80 turbines with monopile steel foundations.
8Solar Photovoltaics (PVs)-crystalline siliconThe PV installation is small and integrated onto a new or existing building. At 420 kW, this is suited to the roof of a public or commercial building and is too large for most domestic residences. Photovoltaic (PV) reference technology for crystalline silicon is the laminated, integrated slanted-roof multicrystalline-Si module in, which is adapted to the electricity production of 850 kWh kWp. Not only efficiency increase for the PV-cells as such, but also reduced energy demand in the production steps of the PV chains are taken into account for the modeling of the future 2030 reference PV units.
9HydropowerThe hydro plant Illanz/Panix (Switzerland) is used as the reference reservoir site. Lifetime of the dam is assumed to be 150 years.
10Biogas CHPBiogas (SNG) from forest wood gasification is assumed to fuel CHP units. Basis for the production of SNG via wood gasification is the assessment of a 50 MW demonstration plant. A commercialized methanation unit with double capacity and increased efficiency, as well as improved CHP unit SNG combustion, reflect the expected technology development until 2030.

2.2. Sustainability Criteria Selection, Validation, and Refinement

The study modified the “3S” indicators’ validation methodology [42] and applied it to the current research context by undertaking the following steps for validating the sustainability criteria and indicators:
-
Literature review and screening
-
Self-validation (desk study and internal peer review)
-
Scientific validation (survey of external experts’ views)
-
Stakeholders’ validation (survey of local stakeholders’ views)

2.2.1. Initial Selection of Criteria

The selection of evaluation criteria and indicators was based on an extensive literature review of studies in the field of energy planning and integrated sustainability assessment of energy options. During the selection process, the evaluation criteria had to meet certain conditions as described by various authors [7,40,43,44,45]: operationality, value relevance, decomposability, reliability, measurability, non-redundancy, minimum in size, completeness, understandability, preferential independence, comprehensiveness, directness, and unambiguousness. In addition to these general conditions, we introduced a few more attributes that specifically apply to assessment of low-carbon energy technologies in Europe such as geographical coverage, local context, and data availability.

2.2.2. Different Levels of Validation

After an extensive literature review and screening of the initial long list of indicators against the aforementioned attributes, the authors initiated a self-validation process based on several interactions and iterations. That process led to narrowing down the number of indicators from 40 to 33.
The set of 33 indicators was then reviewed by 10 European experts in the energy planning sector for further refinement and feedback. After the experts’ validation and further internal discussions, the set of indicators came down to 23.
After completing the scientific (experts’) validation phase, local stakeholders’ views were incorporated in the final set of indicators. Therefore, various stakeholders from the field of urban energy in Europe, especially those who were part of the Covenant CapaCITY project, were invited to be part of the stakeholders’ validation and refinement phase.
Thirty respondents from different European countries participated in the survey on refinement and validation of evaluation criteria and indicators. The survey respondents were asked to improve the set of evaluation criteria and indicators under investigation (see Table 4). The results of the stakeholders’ validation established the wide acceptance of the indicator set with the range of energy stakeholders who participated in the process.
Table 4. Final set of selected and validated evaluation criteria and indicators.
CriteriaCategoriesIndicatorsDescription
EconomicLevelized costs (including capital, operations and maintenance, fuel costs)Levelized costs of energy (LCOE): investment costs, operational and maintenance costs, capacity factor, efficiency, material use
Employment (short run)The extent to which the application of the technology can create jobs at the investment stage. Furthermore, the criterion of employment reflects partly the extent of the impact that the technology has to the local economic development by providing jobs and generating income
Employment (long run)The extent to which the application of the technology can create jobs at the operation and maintenance stage
EnvironmentalCO2 emissionsThe indicator reflects the potential impacts of global climate change caused by emissions of GHGs for the production of 1 kwh
Climate resilienceThe degree of resilience of the energy technology to the future climactic changes and extreme weather events
Noise pollutionPart of population feeling highly affected by the noise caused due to the function of the energy facility. This indicator is case sensitive and could have been measured as a factor of the noise generation by the energy technology estimated in dB multiplied by the number of people affected by the noise. However, since we are investigating different energy technologies and systems at a European scale we cannot measure precisely this indicator and therefore we will use an ordinal relevant scale to measure the perceived noise
(Radioactive) wasteAmount of (radioactive) waste generated by the plant divided by energy produced
Waste disposal (infrastructure)Waste generation during the life cycle of the fuel and technology or availability of waste disposal infrastructure
Ecosystem damagesThis criterion quantifies the impacts of flora and fauna due to acidification and eutrophication caused by pollution from the production of 1 kWh electricity by the energy system and technology
Land use requirementThe land required by each power plant and technology to be installed
Fuel useAmount of fuel use per kWh of final electricity consumption
SocialLevel of public resistance/oppositionEnergy system induced conflicts that may endanger the cohesion of society (e.g., nuclear, wind, CCS). Opposition might occur due to the perceptions of people regarding the catastrophic potential or other environmental impacts (aesthetic, odor, noise) of the energy technology/system. This indicator also integrates the aspect of participatory requirement for the application of the technology. The higher the public opposition, the higher the participatory requirement is.
Aesthetic/functional impactPart of population that perceives a functional or aesthetic impairment of the landscape area caused by the energy system. The aesthetic impairment is judged subjectively and therefore this criterion fits in the social category than the environmental one. In addition this is also a very location specific indicator and therefore an average metric will be determined measured in relative ordinal scale.
SocialMortality and morbidityMortality and morbidity due to air pollution caused by normal operation of the technology. This indicator is considered as an impact and composite indicator since it integrates all human health impacts caused from air pollution emissions as NOx, SO2, and PM.
Accidents and fatalitiesLoss of lives of workers and public during installation and operation. Surrogate for risk aversion. This criterion partly integrates the catastrophic potential of the energy system/technology.
EnergyEnergy cost stability/sensitivity to fuel price fluctuationThe sensitivity of technology costs of electricity generation to energy and fuels prices fluctuations. The fraction of fuel cost to the overall electricity generation cost.
Stability of energy generationStability of output of electric power generated depending on the technology used. This reflects whether the energy supply is being interrupted. The presence of these interruptions impacts the electricity network stability. This criterion reflects whether the energy supply faces any interruptions due to the type of energy technology. This criterion reflects whether the energy supply faces any interruptions due to the type of energy technology.
Peak load responseTechnology specific ability to respond swiftly to large variation of demand in time/% representing the possibility to satisfy the required load.
Market concentration on supplyThe market concentration on the supply of primary sources of energy that could lead to disruption due to economic or political re
TechnologicalTechnological maturityThe extent to which the technology is technically mature. The criterion refers to the level of technology’s technological development and furthermore the spread of the technology at the market.
Market size (domestic)Demand for final products (of energy technologies) and potential market size internationally.
Market size (potential export)Demand for final products (of energy technologies) and potential market size domestically. The potential market size plays an important role to establish industrial competitiveness and stimulate economic growth.
Innovative abilityFlexibility and potential of the technology to integrate technological innovations.

2.3. Impact Assessment and Measurement of Sustainability Indicators

The measurement of performance of the examined energy technologies against the sustainability evaluation criteria and indicators was based on different sources and methods. Both primary and secondary data collection methods were used. Data for the projected levelized costs of the energy generation technologies under investigation were collected from International Energy Agency (IEA) [46]. Data on employment generation were obtained by studies [47,48] on future energy technologies. Data on CO2 emissions, noise pollution, radioactive waste, waste disposal, ecosystems damages, fuel use, mortality and morbidity, accident fatalities, and energy cost sensitivity to fuel prices were obtained from the NEEDS project [30,41,49]. The average reference technologies of this study were identical with some of the technologies evaluated in NEEDS project under common criteria. Different authors provided data on land use requirement of different energy technologies [50,51] as well as performance scores of the energy technologies against the peak load response criterion [52].
An experts’ judgment survey of 40 European experts was conducted to obtain the expected impact values of the low-carbon energy technologies under investigation [53]. The impact assessment matrix in Appendix 1 illustrates the performance of energy technologies against the selected evaluation criteria.

2.4. The Proposed Constructive Weighting Methodology

The constructive weighting methodology that was employed to elicit stakeholders’ preferences is an elaborated and advanced version of an integrated weighting methodology [7,40] that was developed and applied for the assessment of climate and energy policy interactions. The current methodology further strengthens constructive elements and steps to reduce the cognitive burden to the stakeholders, while at the same time utilizing an iterative process.
In testing the proposed constructive weighting methodology, which was made available through a computer-aided Excel tool, the study targeted representatives of local governments who were part of the Covenant CapaCITY project. Through this purposive stakeholder sampling, which has identified local European governments who are involved in developing SEAPs, the authors mailed the computer-aided Excel tool with accompanying instructions to the targeted respondents. The study generated 16 responses from local energy stakeholders. The 16 respondents were grouped into three broad categories, namely public authorities (n = 5), energy industry actors (n = 5), and technical professionals (n = 5). There was one respondent from an NGO.
The elaborated constructive weighting methodology consists of the following steps (Figure 1):
(1)
Criteria sorting according to their level of importance: The respondents were asked to rate the evaluation criteria according to their level of importance: low, moderate, and high. The reason for introducing this step was to reduce the cognitive burden of respondents when examining all criteria simultaneously [54,35]. The criteria were presented to the respondents along with their units of measurement, the worst and best performance for each criterion, as well as the impact range, which shows the potential for improvement when moving the technology from its worst to best performance.
(2)
Initial Ranking: A simple initial ranking step is introduced for stakeholders to be familiarized with the notion of criteria importance. For each level of importance (high, moderate, low), the respondents carried out direct ranking by assigning numbers (1 as the most important criterion, 2 as the second most important criterion, and so on through the least important criterion). An example for the criteria group with high level of importance, including the ranking of each individual criterion, is illustrated in Appendix 2.
The rankings of the three different levels of criteria importance were consolidated into one overall criteria ranking for an individual respondent. In order to get the overall criteria ranking of each individual respondent, we applied the following formulas for each level of importance:
  • Overall RCj(H) = RCj(H)
  • Overall RCj(M) = RCn(H) + RCj(M)
  • Overall RCj(L) = Final RCn(M) + RCj (L).
Figure 1. Schematic representation of the constructive weighting methodology.
Sustainability 07 10922 g001
The last numerical rank position for the high-importance criterion serves as the base for calculating the ranking of moderately important criteria.
In order to estimate the overall ranking of the moderately important criteria (Overall RCj(M)), the last numerical rank position of the highly important criteria, RCn (H), was added to each of the numerical rank positions of moderately important criteria, RCj (M).
For instance, assuming that a respondent has indicated 10 highly important criteria, clearly the last ranked numerical position of this level is 10. Then the 1st ranked criterion of the moderately important criteria would be converted to 11th (10 + 1), the 2nd ranked criterion to 12th (10 + 2) and so forth.
In the same way, by adding the last overall numerical rank position of the moderately important criteria (e.g., 16th) to each of the ranked numerical positions of low important criteria, we also convert the ranking of the criteria of the low important criteria. Therefore the resulting of the overall ranking of an individual respondent will be as follows:
Overall RCj = Overall RCj (H), Overall RCj(M), Overall RCj(L).
This initial ranking of criteria was introduced not only to familiarize the respondents with the process of criteria weighting but also to provide a basis for checking the consistency of respondents’ preferences.
In order to get the overall ranking position of each criterion according to all 16 respondents, the average ranking position (based on arithmetic mean) was estimated [55]. Based on the average ranking position values, the overall ranking according to all stakeholders was determined.
(3)
Pairwise comparisons: The overall initial ranking was followed by a series of pairwise comparisons (n-1) based on an abbreviated format [7,40]. To avoid path dependency [56], pairs were sequentially assigned (as a-b, b-c, c-d, etc.), where the initial criterion a is the first-ranked criterion by the respondent, criterion b is the second-ranked criterion, c is the third-ranked criterion. First, the respondents selected the criterion they prefer between a pair of criteria. The respondents then expressed their preferences (a) verbally, by selecting the level of preference on a verbal scale (equally, almost equally, moderately, strongly, very strongly); (b) numerically, by associating the verbal expressions with preference values (in a 10-point scale from 0 to 10) [7,57] as well as (c) graphically, by the automatic provision of a graphical representation of respondent’s preferences expressed in a numerical scale (Figure 2).
Each respondent was requested to express the ratio (percentage) of the least preferred criterion comparing to the most preferred one, according to the level of his/her preference (Figure 2). This process continued for all sequential pairwise comparisons by applying the following formula:
R S n + 1 = R S n × L P n + 1  
where RSn + 1 indicates the Relative Score of criterion n + 1, RSn indicates the Relative Score of criterion n, and LPn + 1 indicates the Level of Preference of criterion n + 1 (in comparison to Relative Score of criterion n). The Relative Score of the 1st criterion (n = 1) was specified as 1 in order to be the basis reference Relative Score value for the calculation of the relative scores of the criteria determined by the sequential pairwise comparisons.
Figure 2. Pairwise comparisons (example of two sequential pairs from excel based tool).
Sustainability 07 10922 g002
The survey tool (Appendix 2) also enabled the generation of criteria weights as well as final ranking based on the results of the pairwise comparisons.
The relative scores for the criteria were transformed into weights using the formula:
W i =   R S i n 1 R S
The formula denotes that RSi is the relative score of criterion i in comparison to criterion j. Ʃ(RS), on the other hand, is the summation of the relative scores of all criteria (n) after the completion of the pairwise comparisons (n − 1). Survey respondents were able to observe the relative scores and weighting factors as well as the graphical representation of the criteria weights for reference.
(4)
Consistency test and revision: The elicitation of weighting preferences included a consistency test and possibility for revision. Sometimes sources of error (e.g., fatigue) might affect a participant’s responses during one measurement scale or approach, but might not affect his/her responses on another occasion. Therefore, in order to enhance internal consistency and reliability, more than a single measurement occasion could be used. It should also be acknowledged that in the case of a constructed scale, low consistency could indicate problems in how the scale was constructed [58]. The ranking derived from the series of pairwise comparisons was compared with the initial ranking. A consistency check, which is based on Spearman’s rank order correlation coefficient, was generated [7,40].
The value of the consistency threshold was set at 0.7. Low consistency was equivalent to or less than 0,5. Moderate consistency ranged from 0.5 and 0.7, while high consistency equaled or exceeded 0,7. The survey respondents were asked to revise their preferences should the consistency index be below the threshold value. If the consistency index equaled or exceeded the threshold value, the weighting process was completed (step 5). Otherwise, the respondents had to revise the initial ranking or the pairwise comparisons in order to achieve high consistency. In conditions where low consistencies were observed, as well as preferences for initial ranking over the pairwise comparisons, the procedure was simplified to reduce cognitive burden and time required and therefore the elicitation of weights was determined taking into account only the initial ranking. During preferences’ elicitation “one must also keep in mind that practical techniques for elicitation are to a great extent a matter of balancing the obtained quality of elicitation with the time available and cognitive effort demand on the users for extracting all the required information” [39].
(5)
Weights elicitation: The weights of the respondents who have achieved high consistencies as well as those who have preferred pairwise comparisons were retained and considered as final weights. In cases where respondents achieved low and moderate consistency, and they expressed preference for the initial ranking, the ranking outcome of the pairwise comparisons was not considered. Given the large number of pairwise comparisons, a high cognitive burden on the respondents is sometimes expected. In cases of time pressure, lack of knowledge, or imprecise data, respondents’ limited processing capacity then rank ordering can be used to approximate the criteria weights [59,60]. Therefore, weights were adjusted based on respondents’ initial ranking. Ranking methods can be used if only ordinal information of respondents’ preferences is available. In our case, initial ranking that has been preferred by the respondent can be used to obtain numerical weights from the rank order using the rank sum method [61]. The normalized weight wj of criterion j is calculated by
w j   ( R S ) = n r j   + 1 k = 1 n n r k   + 1
where r j is the rank of the j-th criterion and n is the number of criteria.
The study utilized the linear weighted summation method expressed in the aggregation additive rule to determine the overall value of each alternative energy technology. The weighted summation approach, which is the summation of weighted scores based on stakeholders’ elicited criteria weights and energy technologies’ scores, was selected because it is consistent with the weighting method used, which utilizes criteria weights as scaling factors [8,44]. The respondents were able to review the final scores for low-carbon energy technologies, including the contribution of each criterion through the Excel-based tool.

3. Results and Empirical Analysis

3.1. Initial Ranking

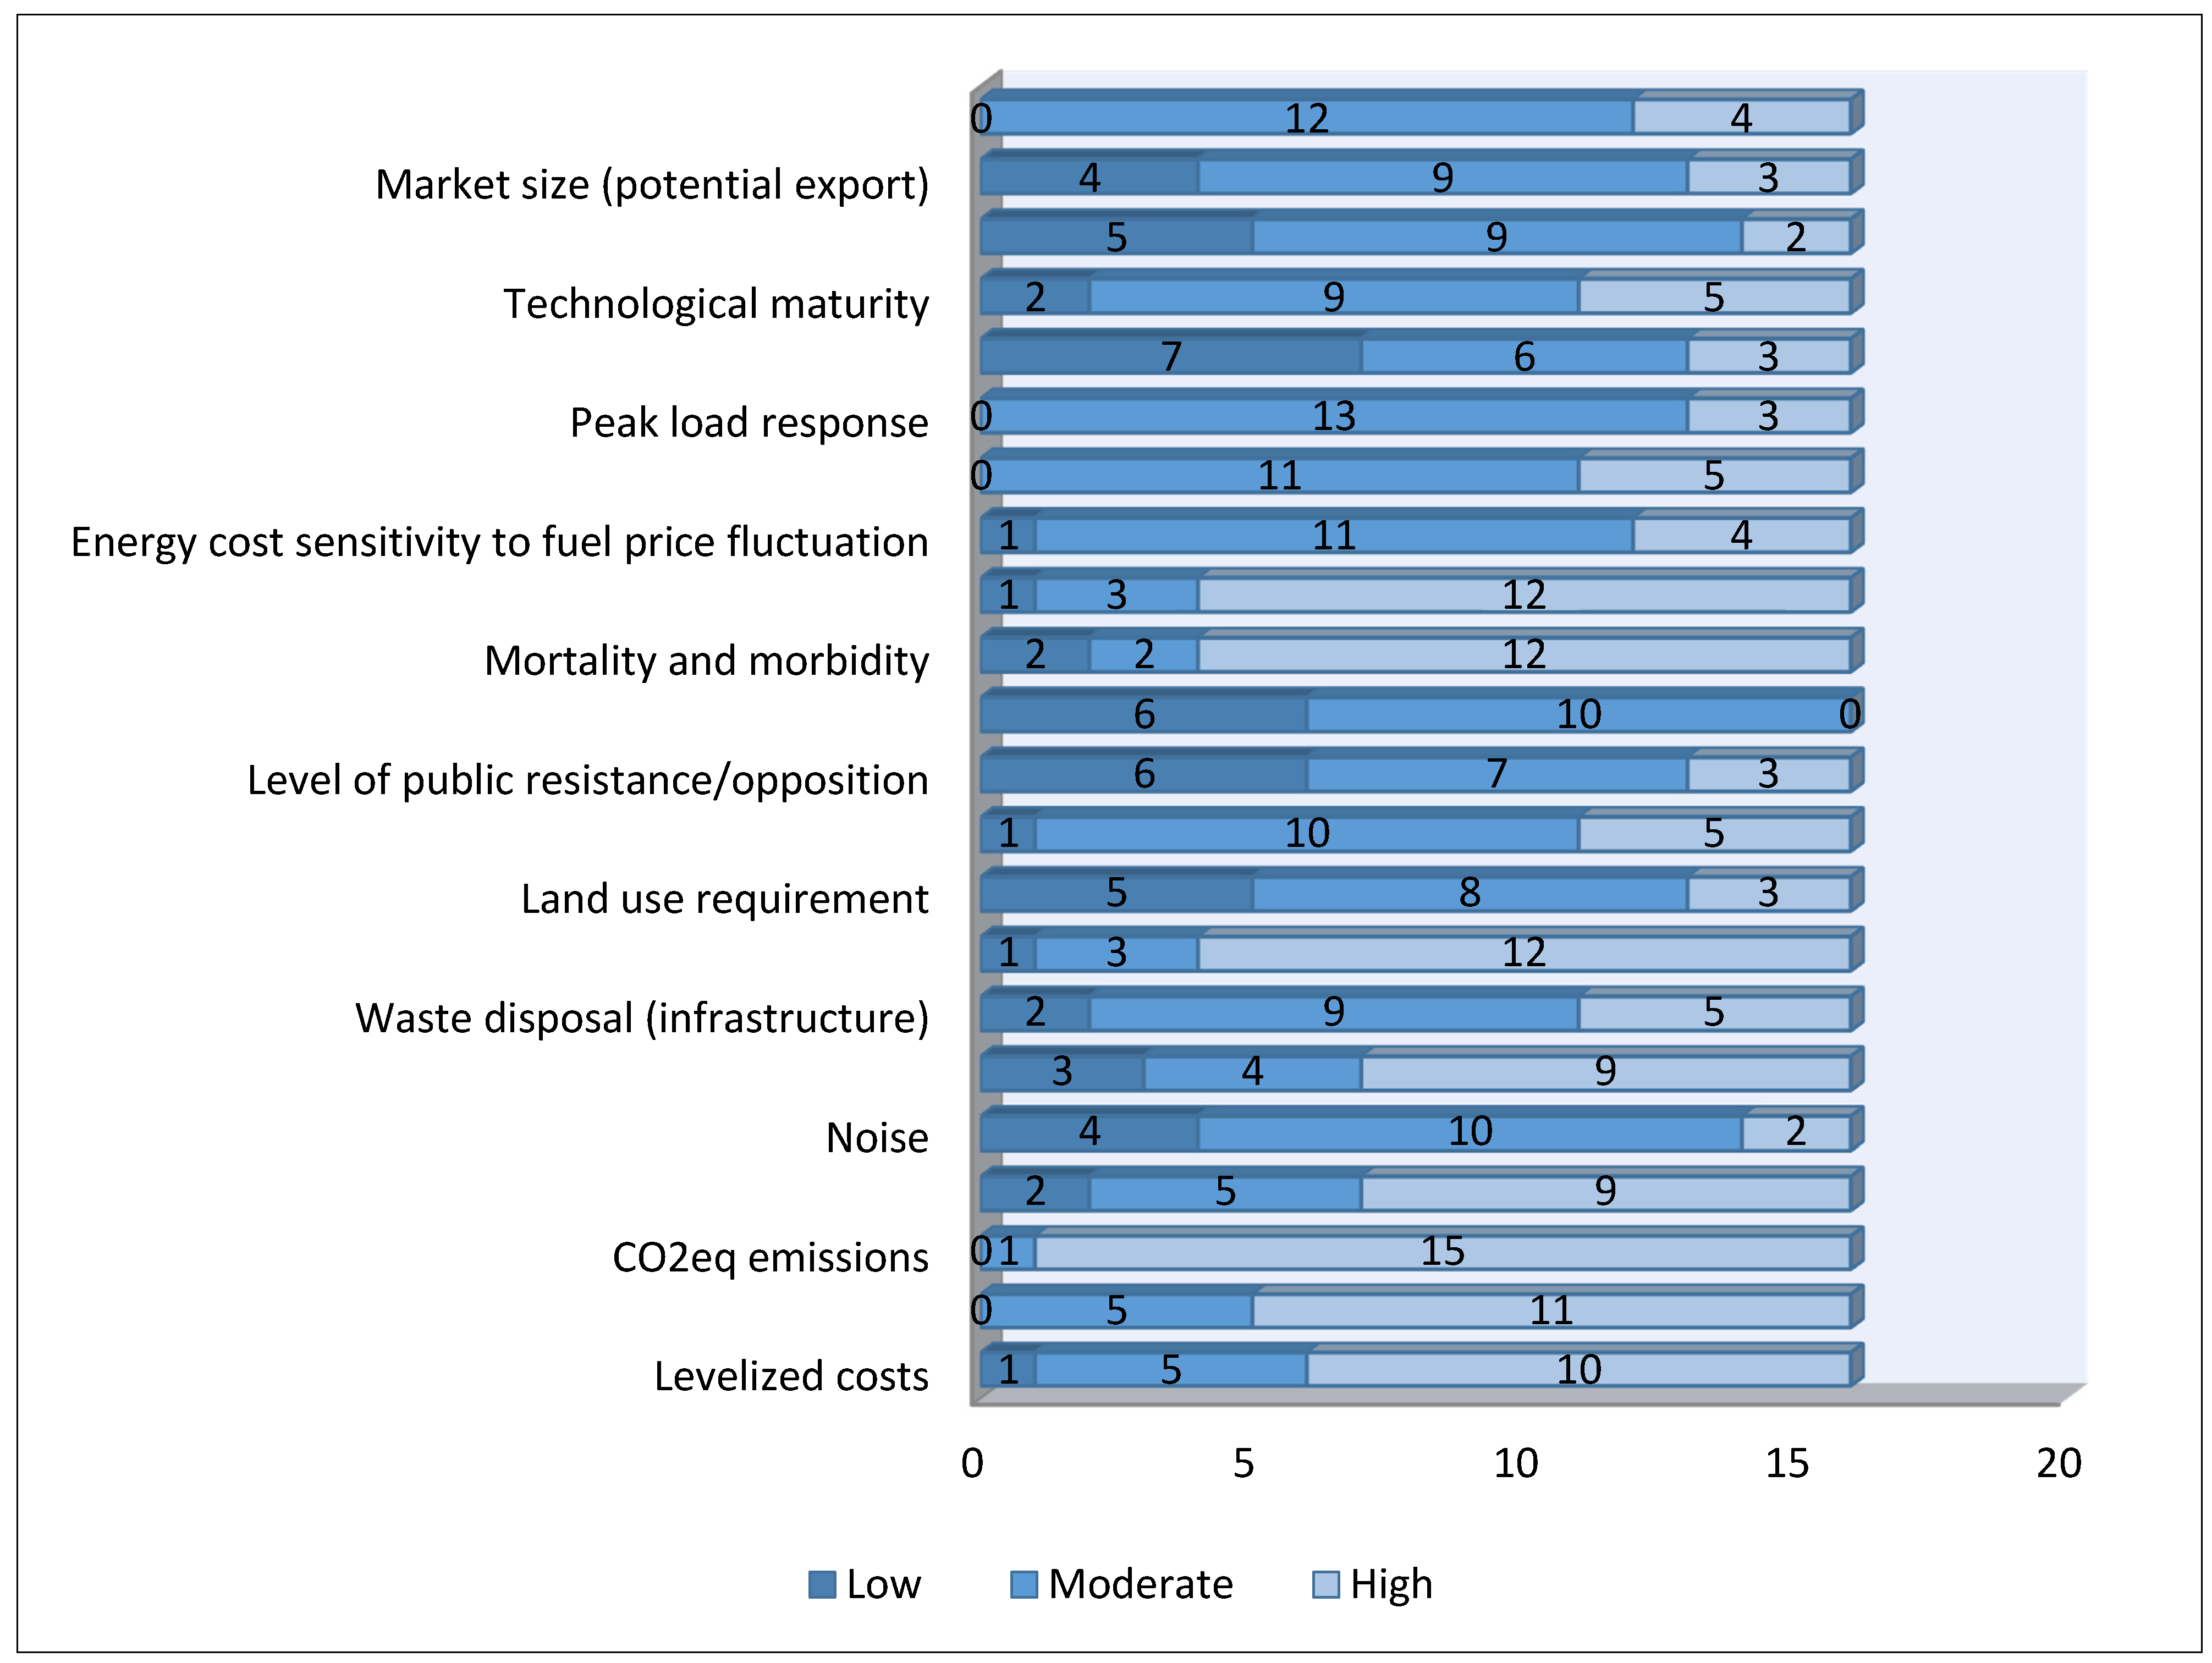
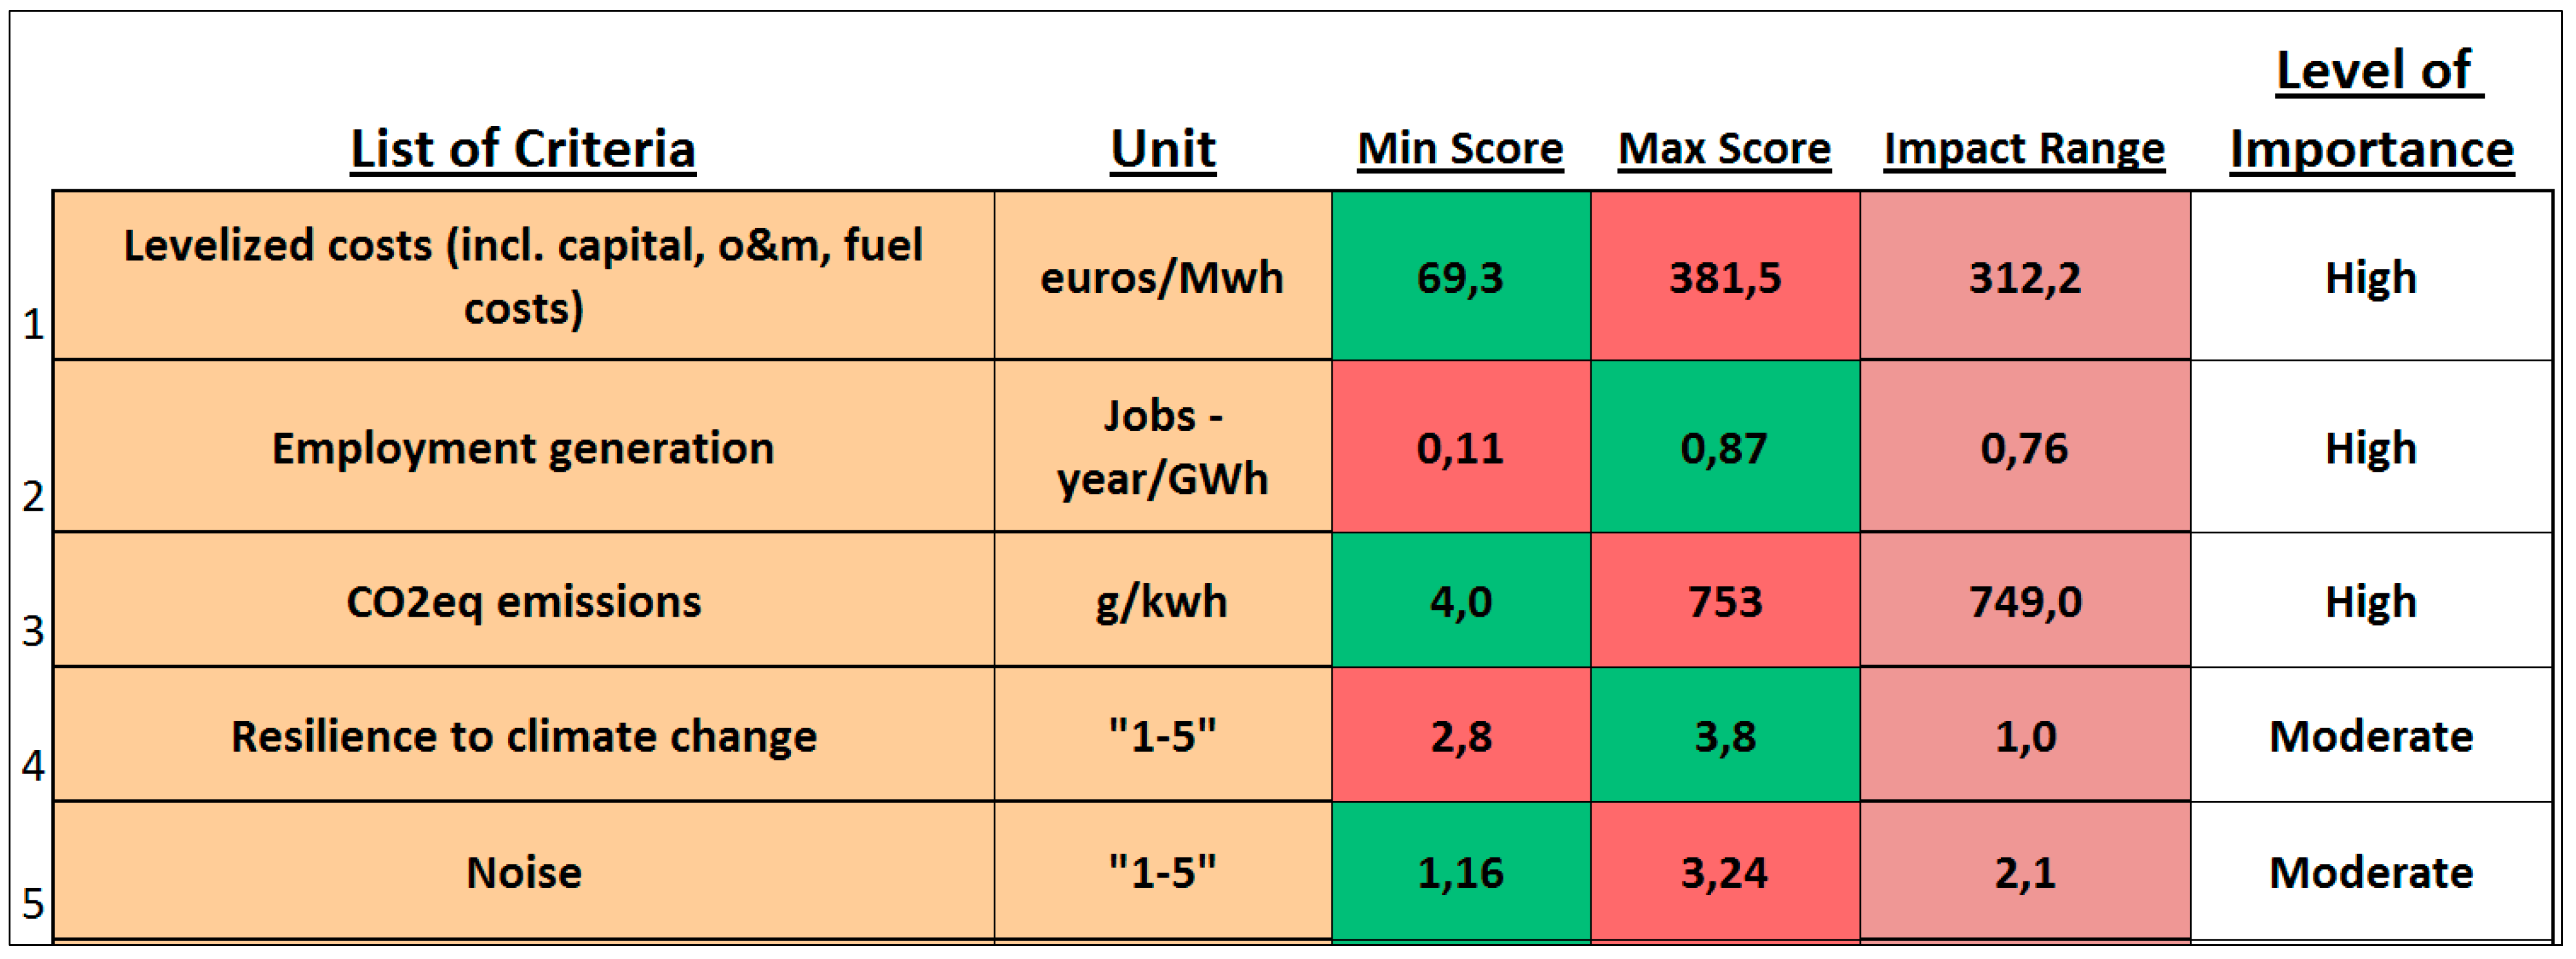
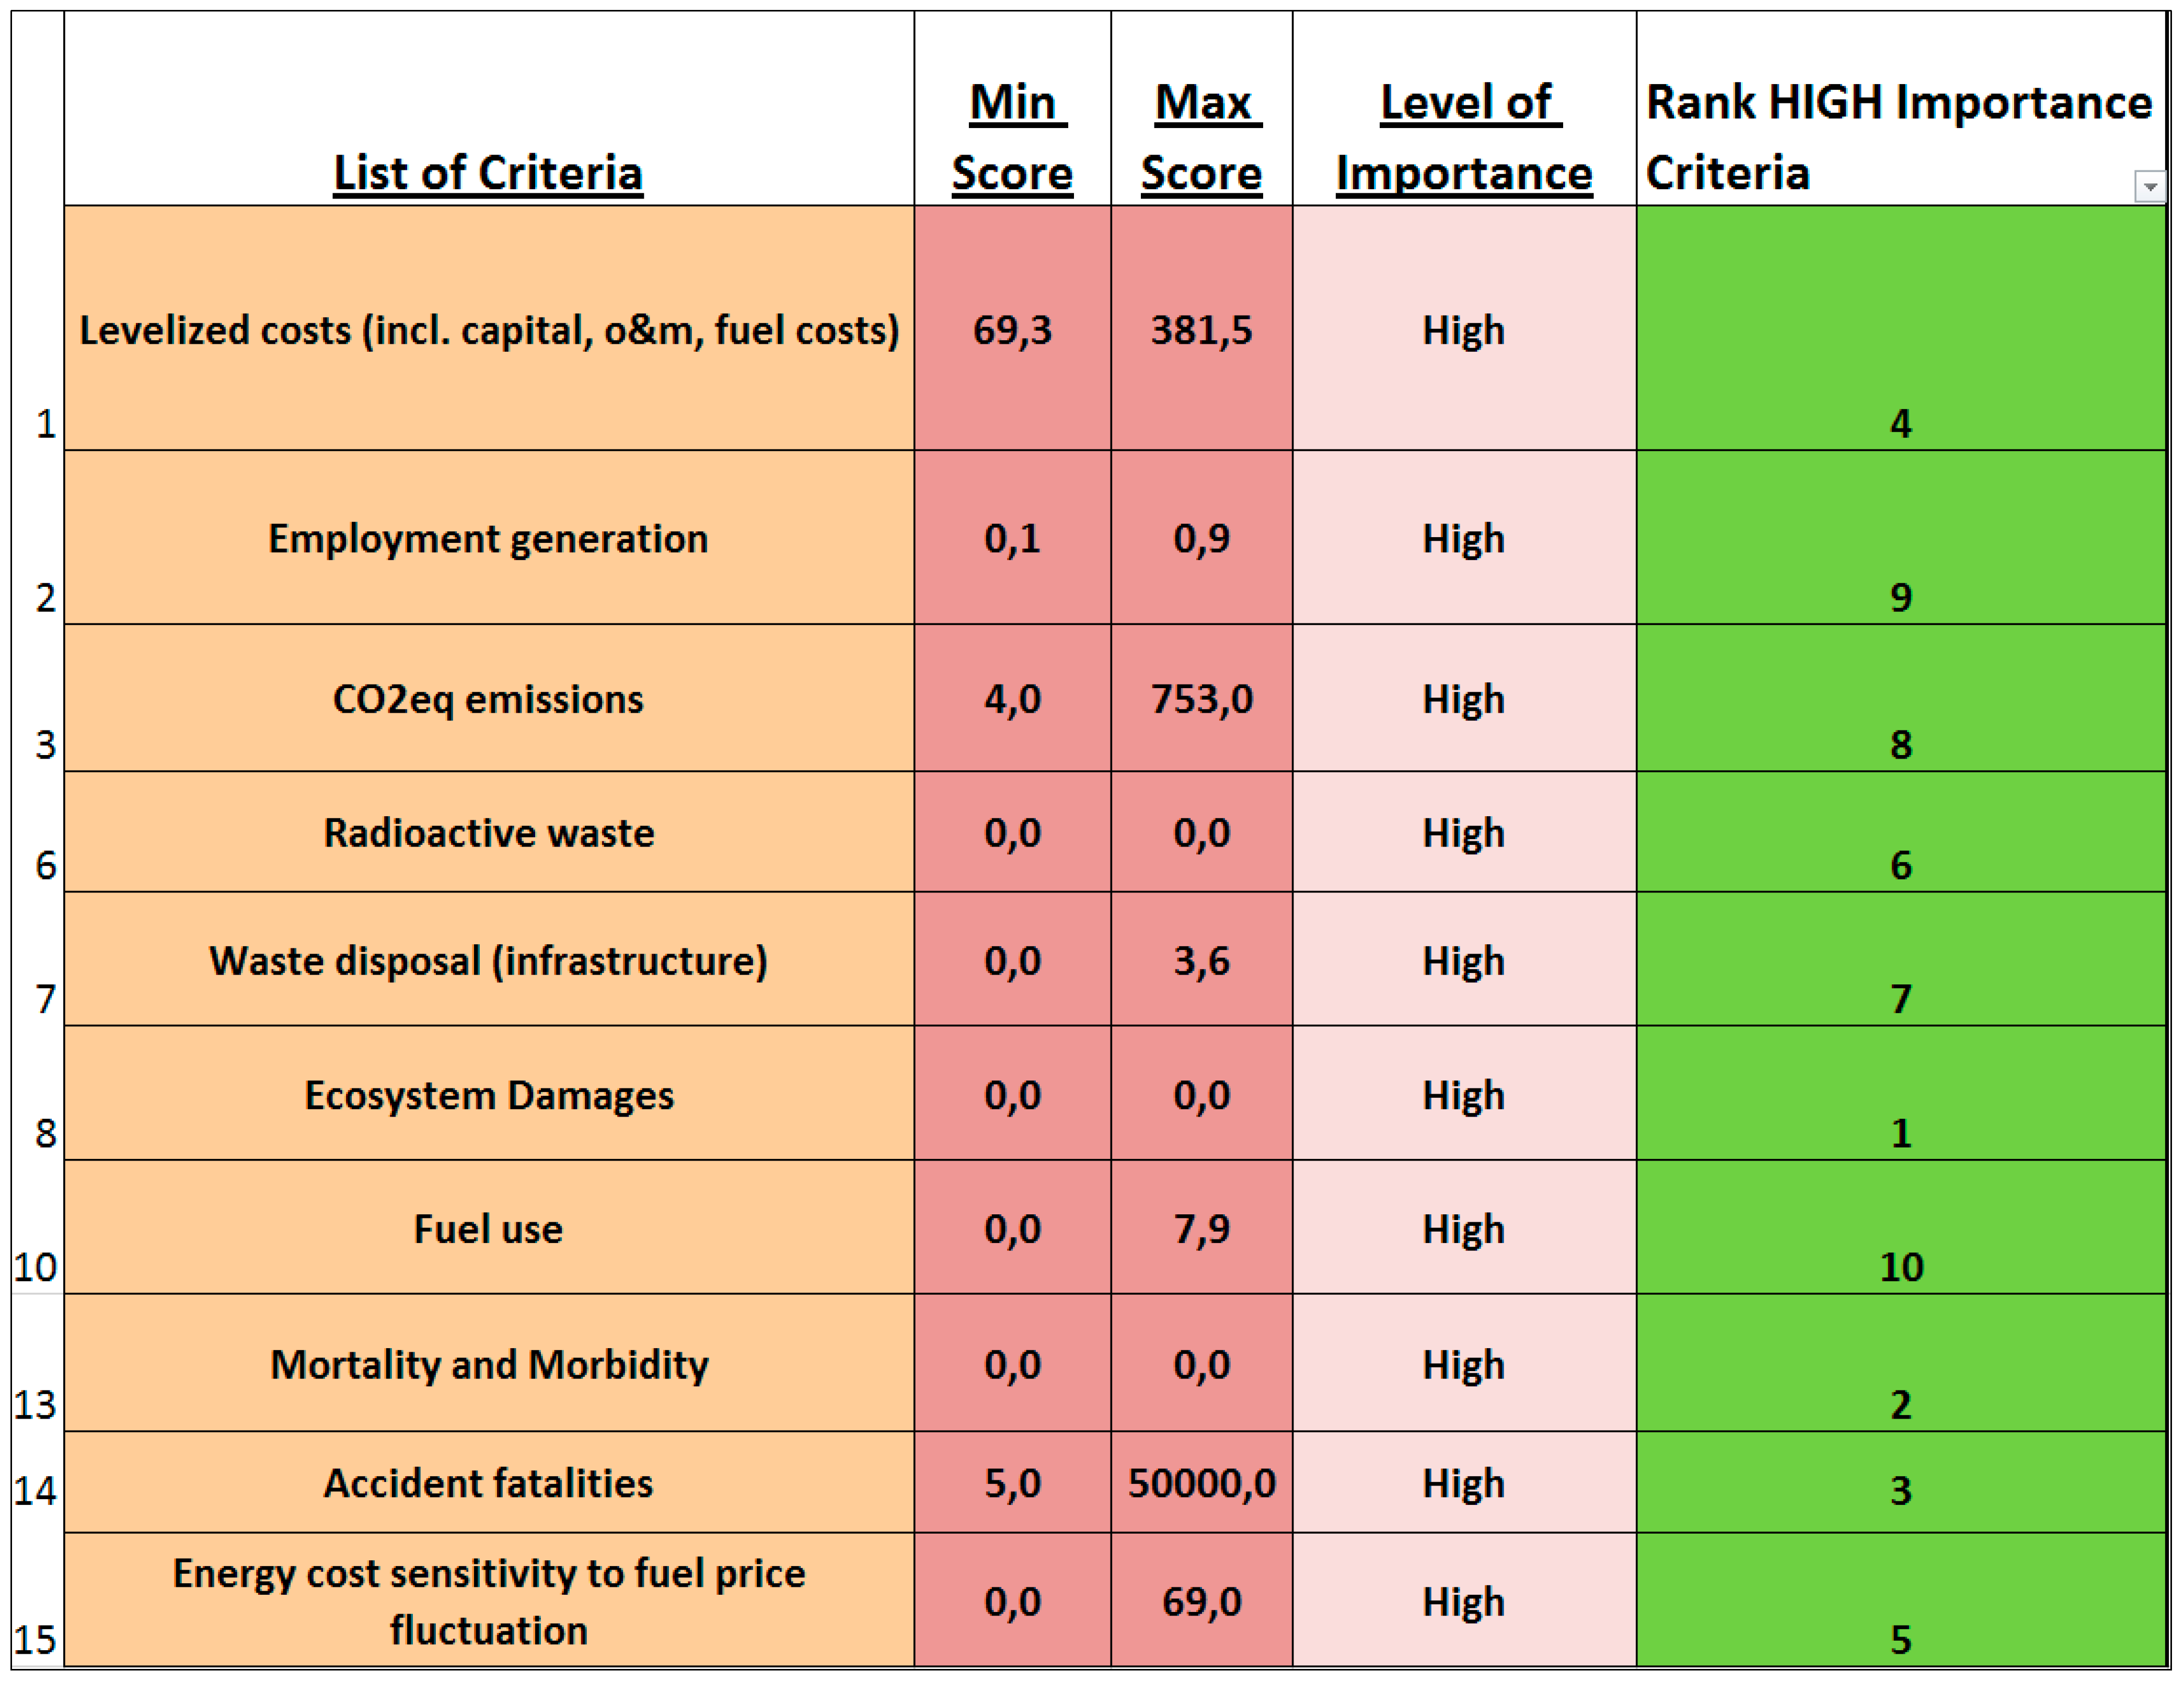
Based on frequency count and percentages, the criteria that were considered to be of high importance by the weighting survey respondents were as follows: CO2eq emissions, ecosystem damages, mortality and morbidity, accident fatalities, employment generation, levelized costs, resilience to climate change, and radioactive waste (Figure 3). 
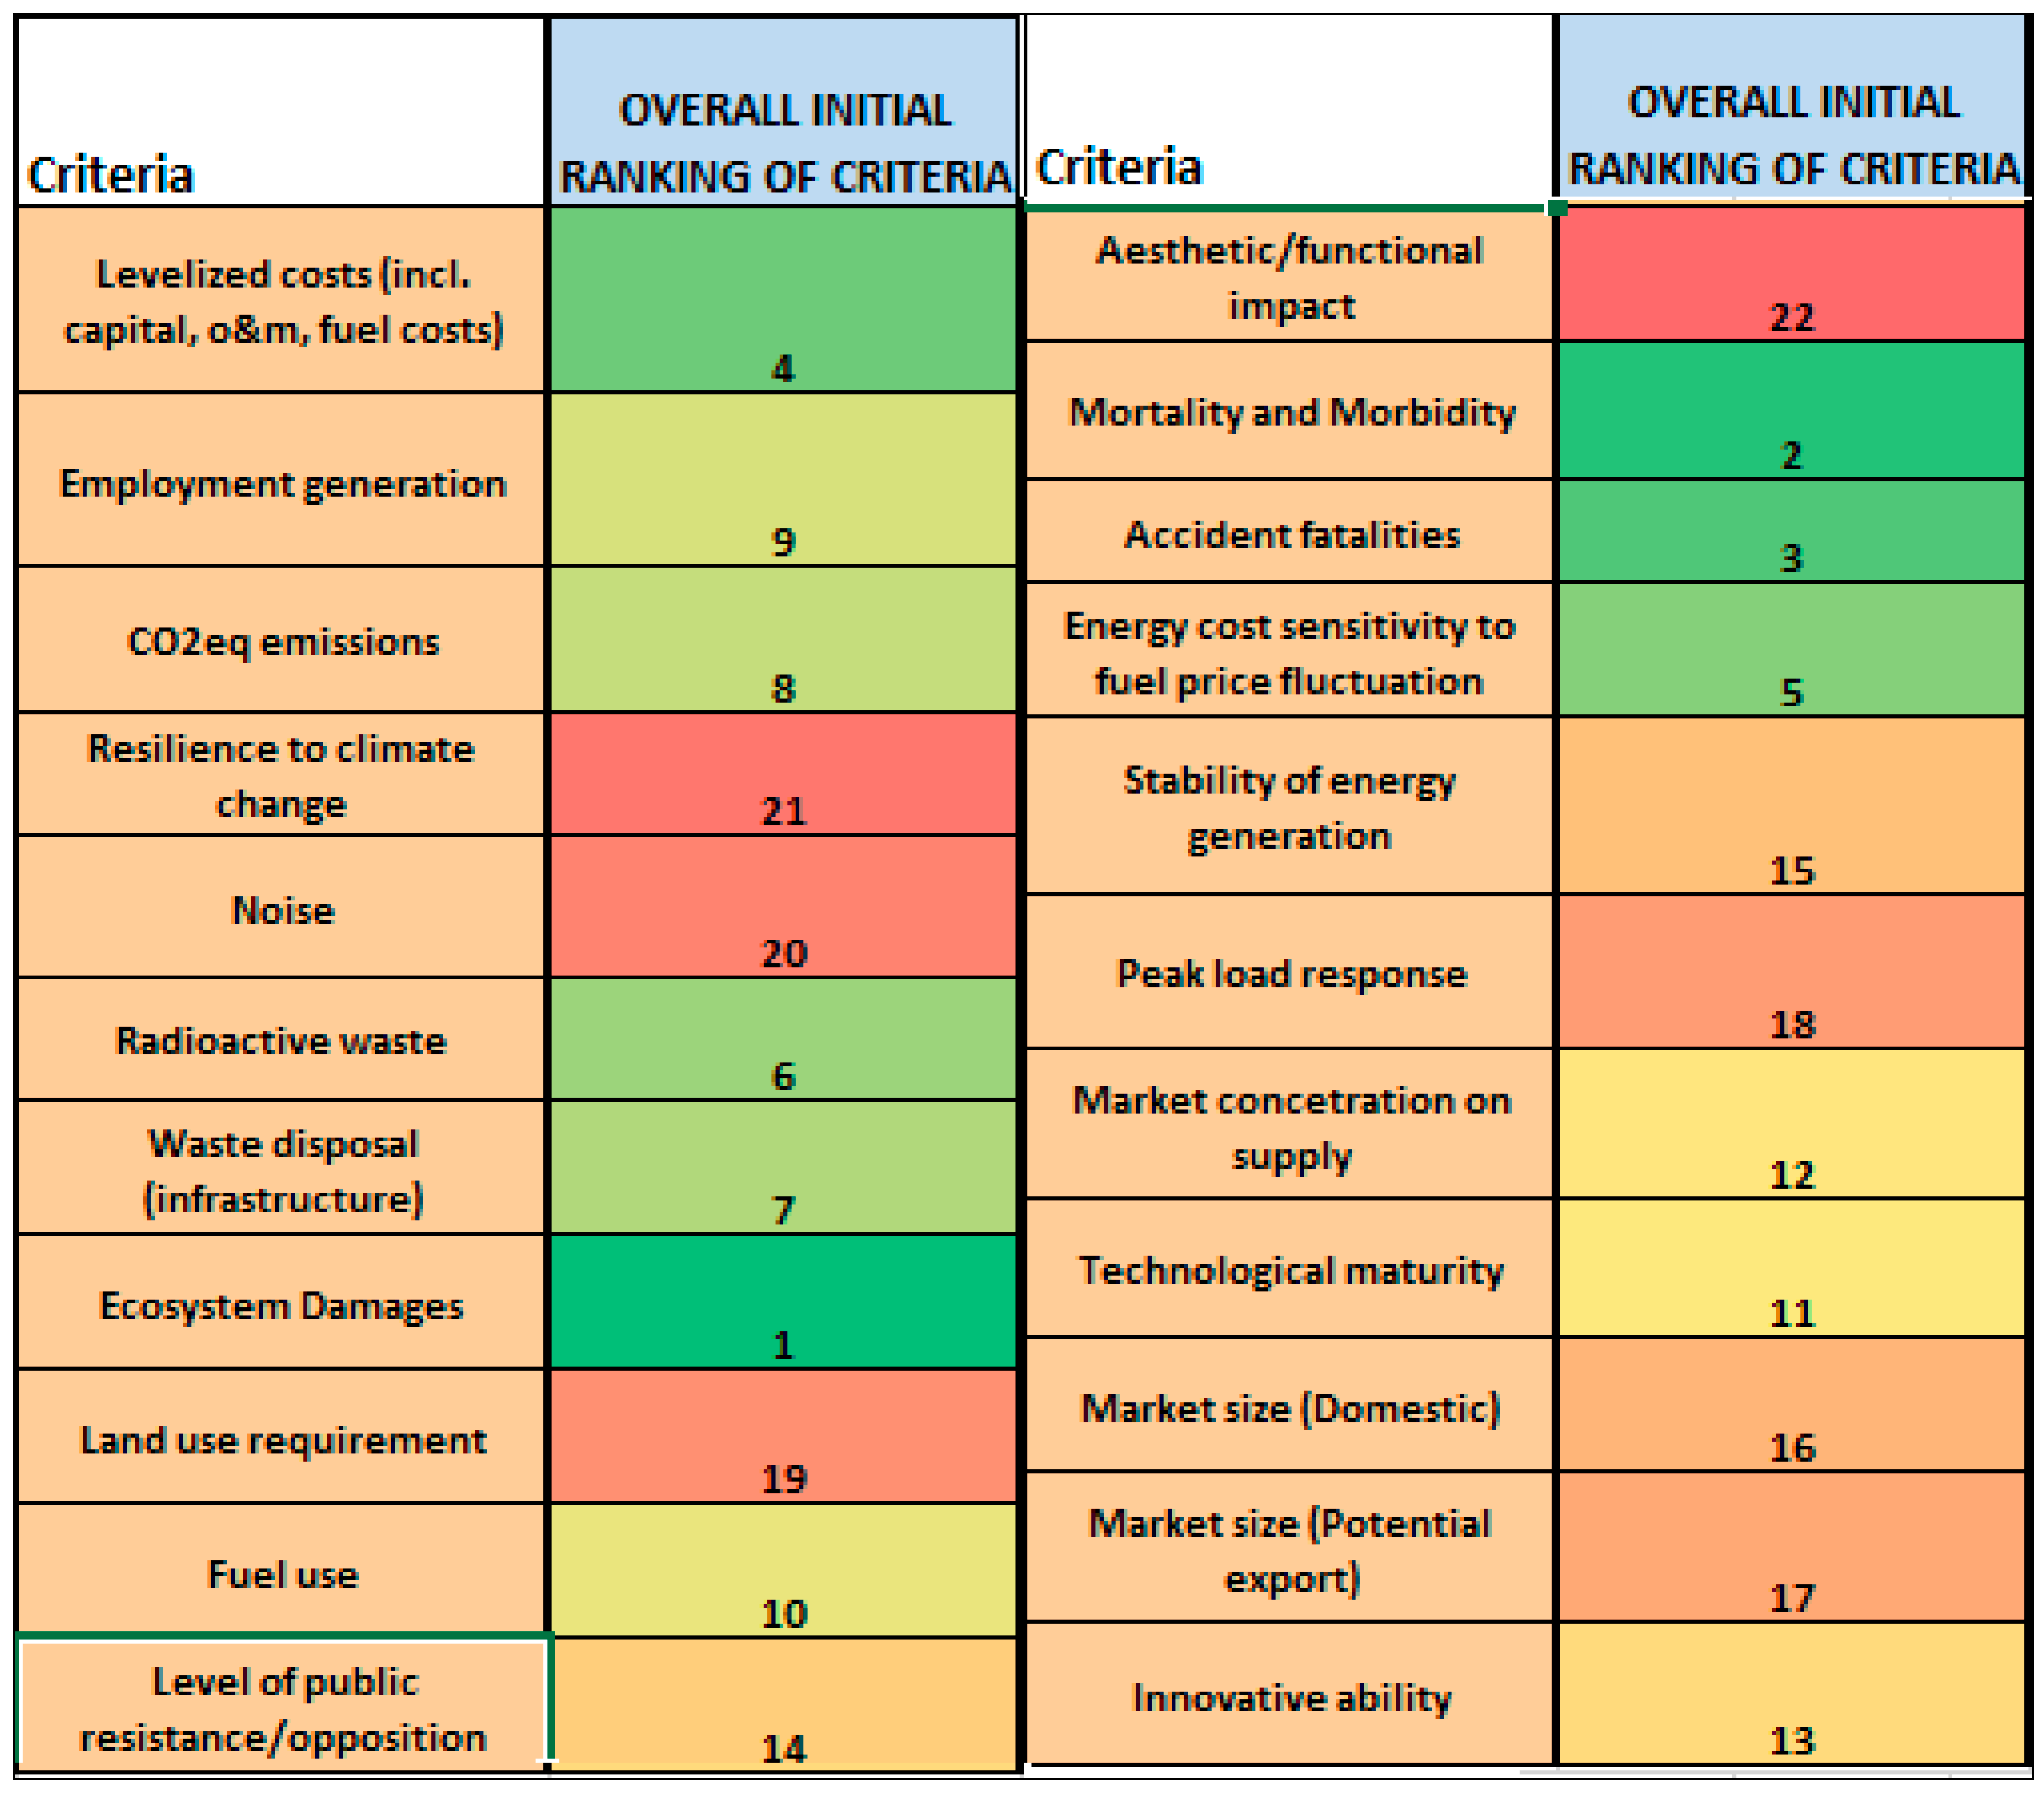
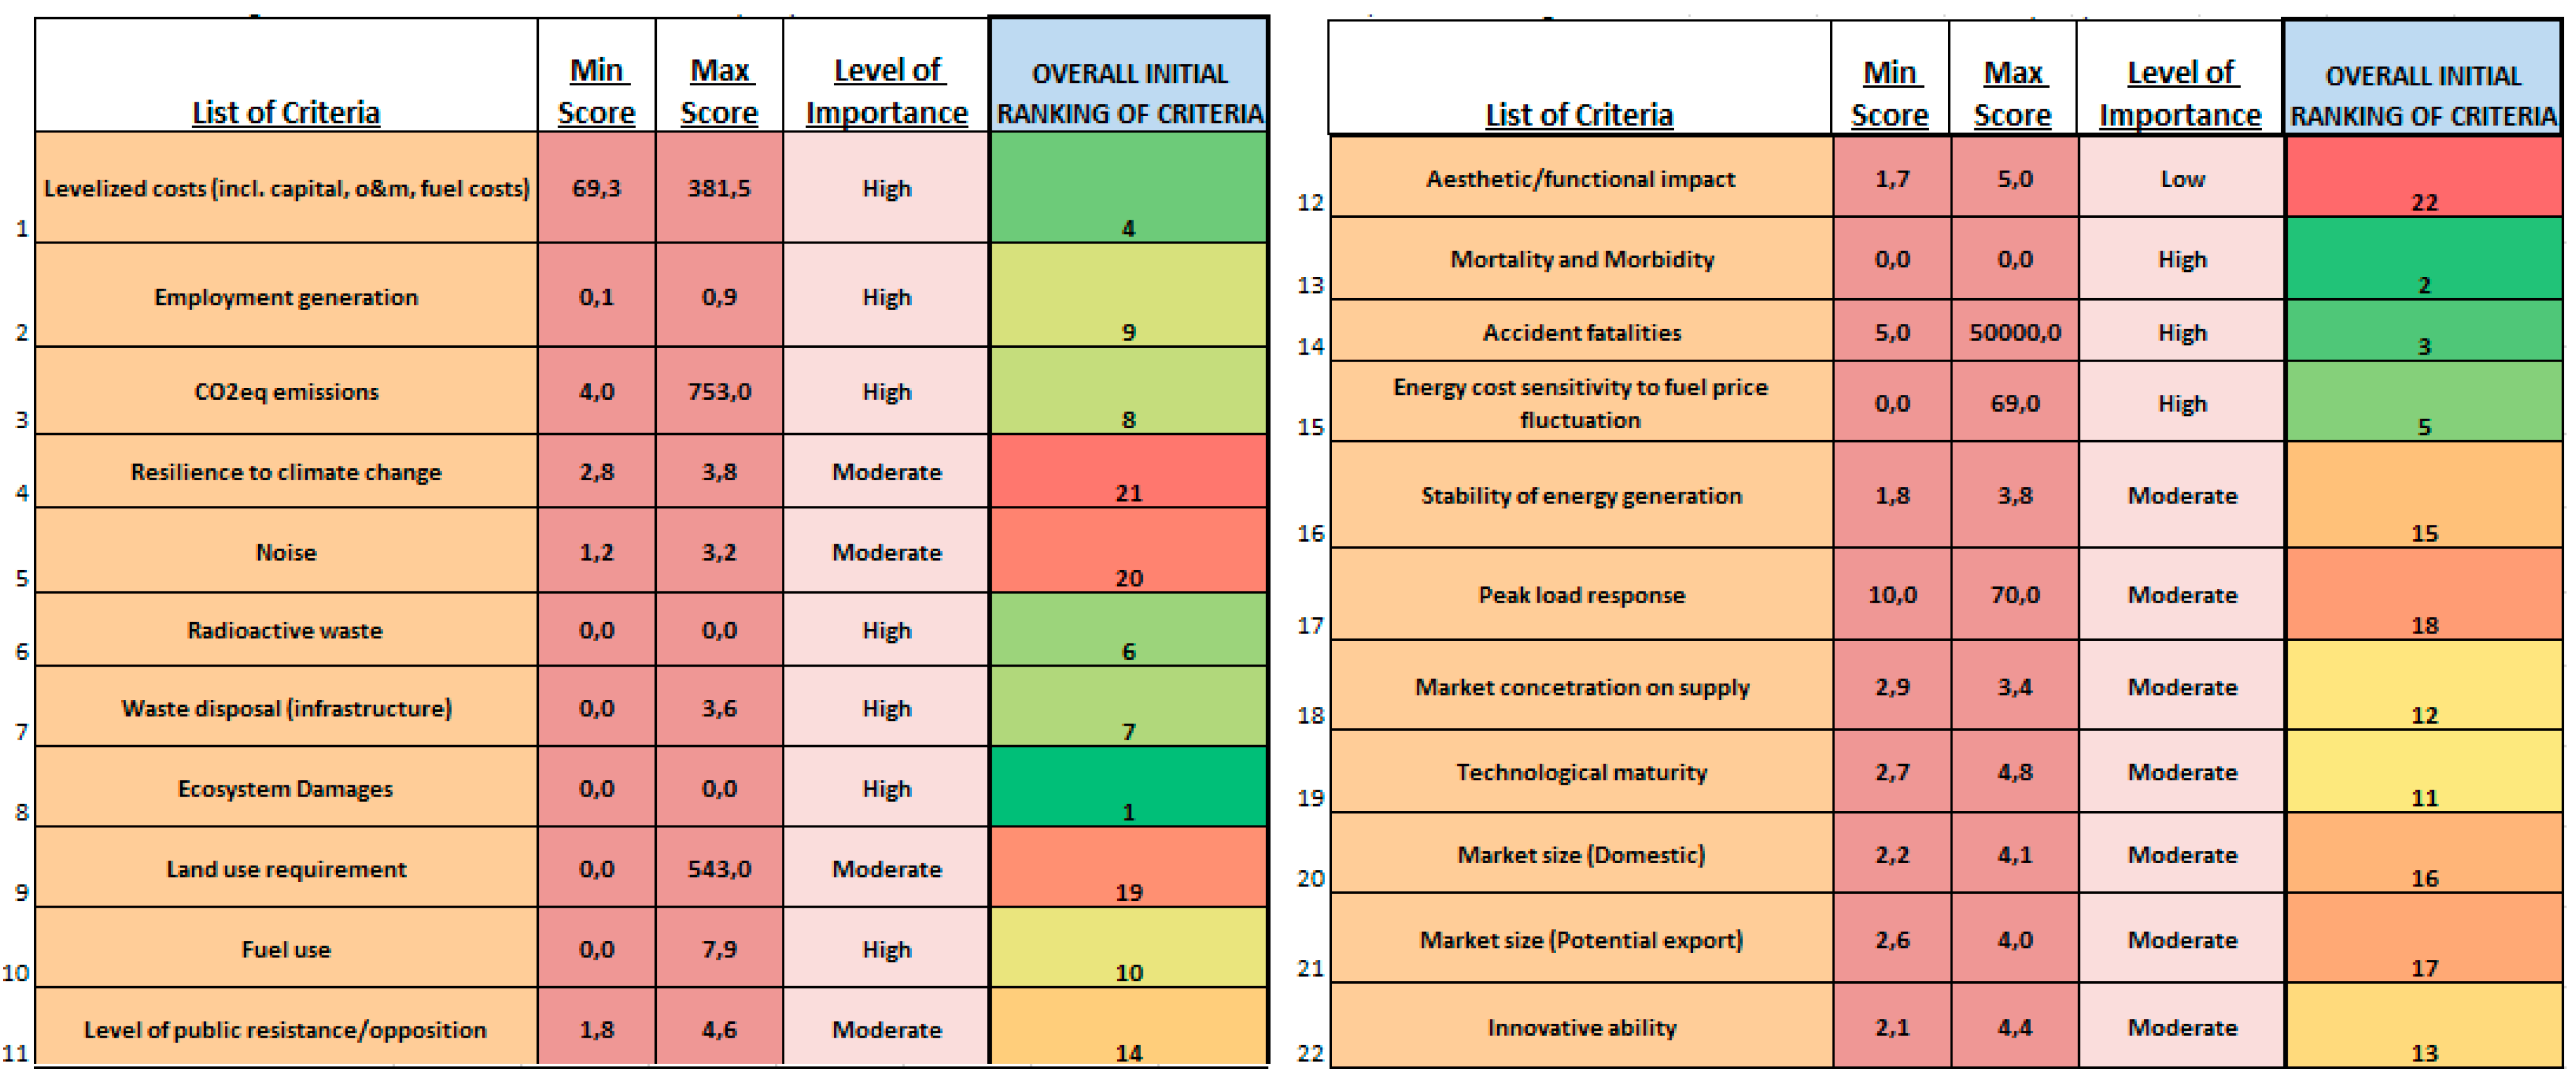
Table 5 shows the results of the initial ranking and corresponding average ranking positions of the different evaluation criteria.
Figure 3. Level of importance of the evaluation criteria.
Sustainability 07 10922 g003
Table 5. Initial ranking and corresponding average ranking positions of the evaluation criteria based on respondents’ preferences.
Initial RankingCriteriaAverage Ranking Position
1CO2eq emissions3.50
2Levelized costs5.06
3Ecosystem damages5.94
4Accident fatalities6.75
5Mortality and morbidity7.19
6Employment generation7.38
7Radioactive waste9.38
8Fuel use9.63
9Resilience to climate change9.75
10Energy cost sensitivity to fuel price fluctuation10.50
11Stability of energy generation10.88
12Waste disposal (infrastructure)11.06
13Innovative ability11.13
14Technological maturity12.19
15Peak load response12.69
16Noise14.25
17Land use requirement14.50
18Market size (potential export)14.69
19Level of public resistance/opposition15.13
20Market concentration on supply15.38
21Market size (domestic)15.81
22Aesthetic/functional impact17.63
The initial ranking shows that CO2eq emissions is the most preferred criterion, with an average ranking position of 3.5 (Table 5). This is followed by levelized costs, ecosystem damages, accident fatalities, mortality and morbidity, employment generation, radioactive waste, fuel use, resilience to climate change, and energy cost sensitivity to fuel price fluctuation. Rounding off the list are stability of energy generation, innovative ability, waste disposal (infrastructure), technological maturity, peak load response, noise, land use requirement, market size (potential export), level of public resistance/opposition, market concentration on supply, market size (domestic), and lastly, aesthetic/functional impact.

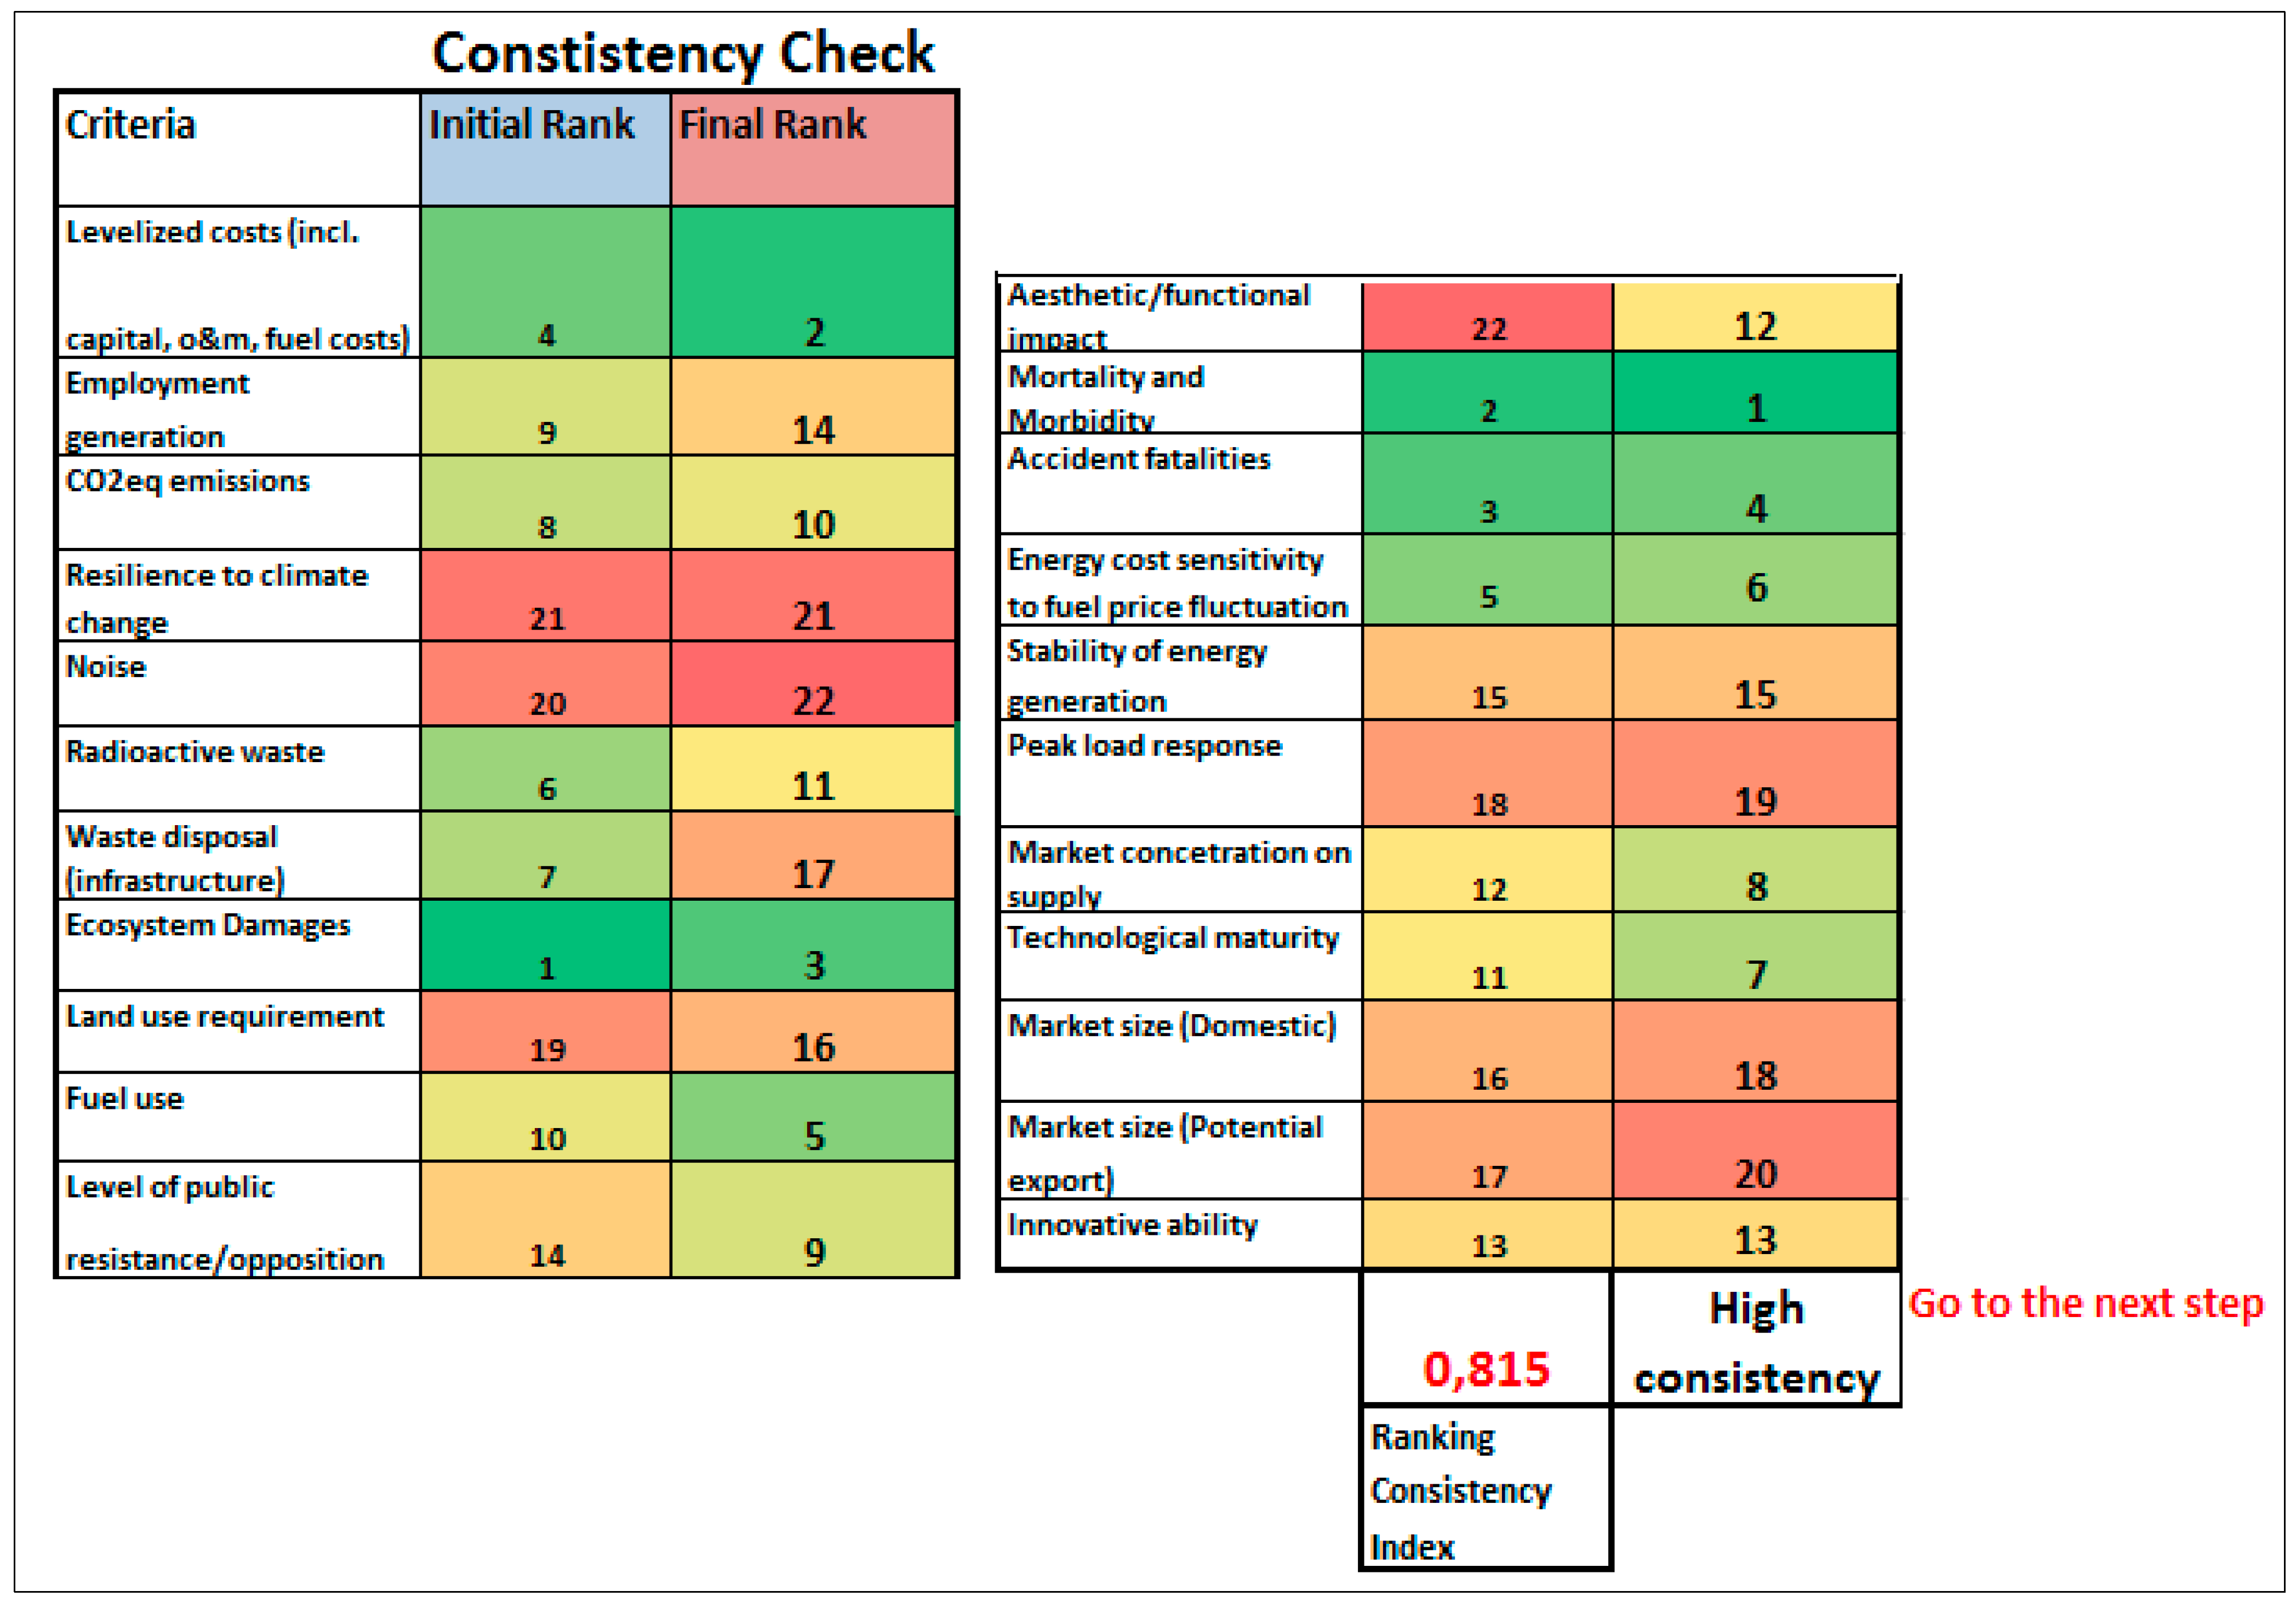
3.2. Pairwise Comparisons Results

The initial ranking provided the basis for the consistency check. As such, the results of the initial ranking were compared with the results (final ranking) of the series of pairwise comparisons. Table 6 presents the consistency levels that respondents achieved.
Table 6. Respondents’ consistency levels.
ValuesNumber of Respondents
Low<0.55
Moderate0.5–0.74
High>0.77
As there were some respondents who achieved low and moderate consistency, where few of them were in favor of the initial ranking, the ranking outcome of the pairwise comparisons was not considered. The large number of pairwise comparisons in these cases probably imposed a high cognitive burden on the respondents who proved inconsistent. Therefore, in these cases, weights were determined based on respondents’ initial ranking by applying Formula (2). The constructive process that was integrated in the weighting method on one hand tested the consistency of stakeholders’ preferences and on the other hand “forced” the stakeholders to rethink, revise their initial preferences, and better evaluate the issue of criteria importance.
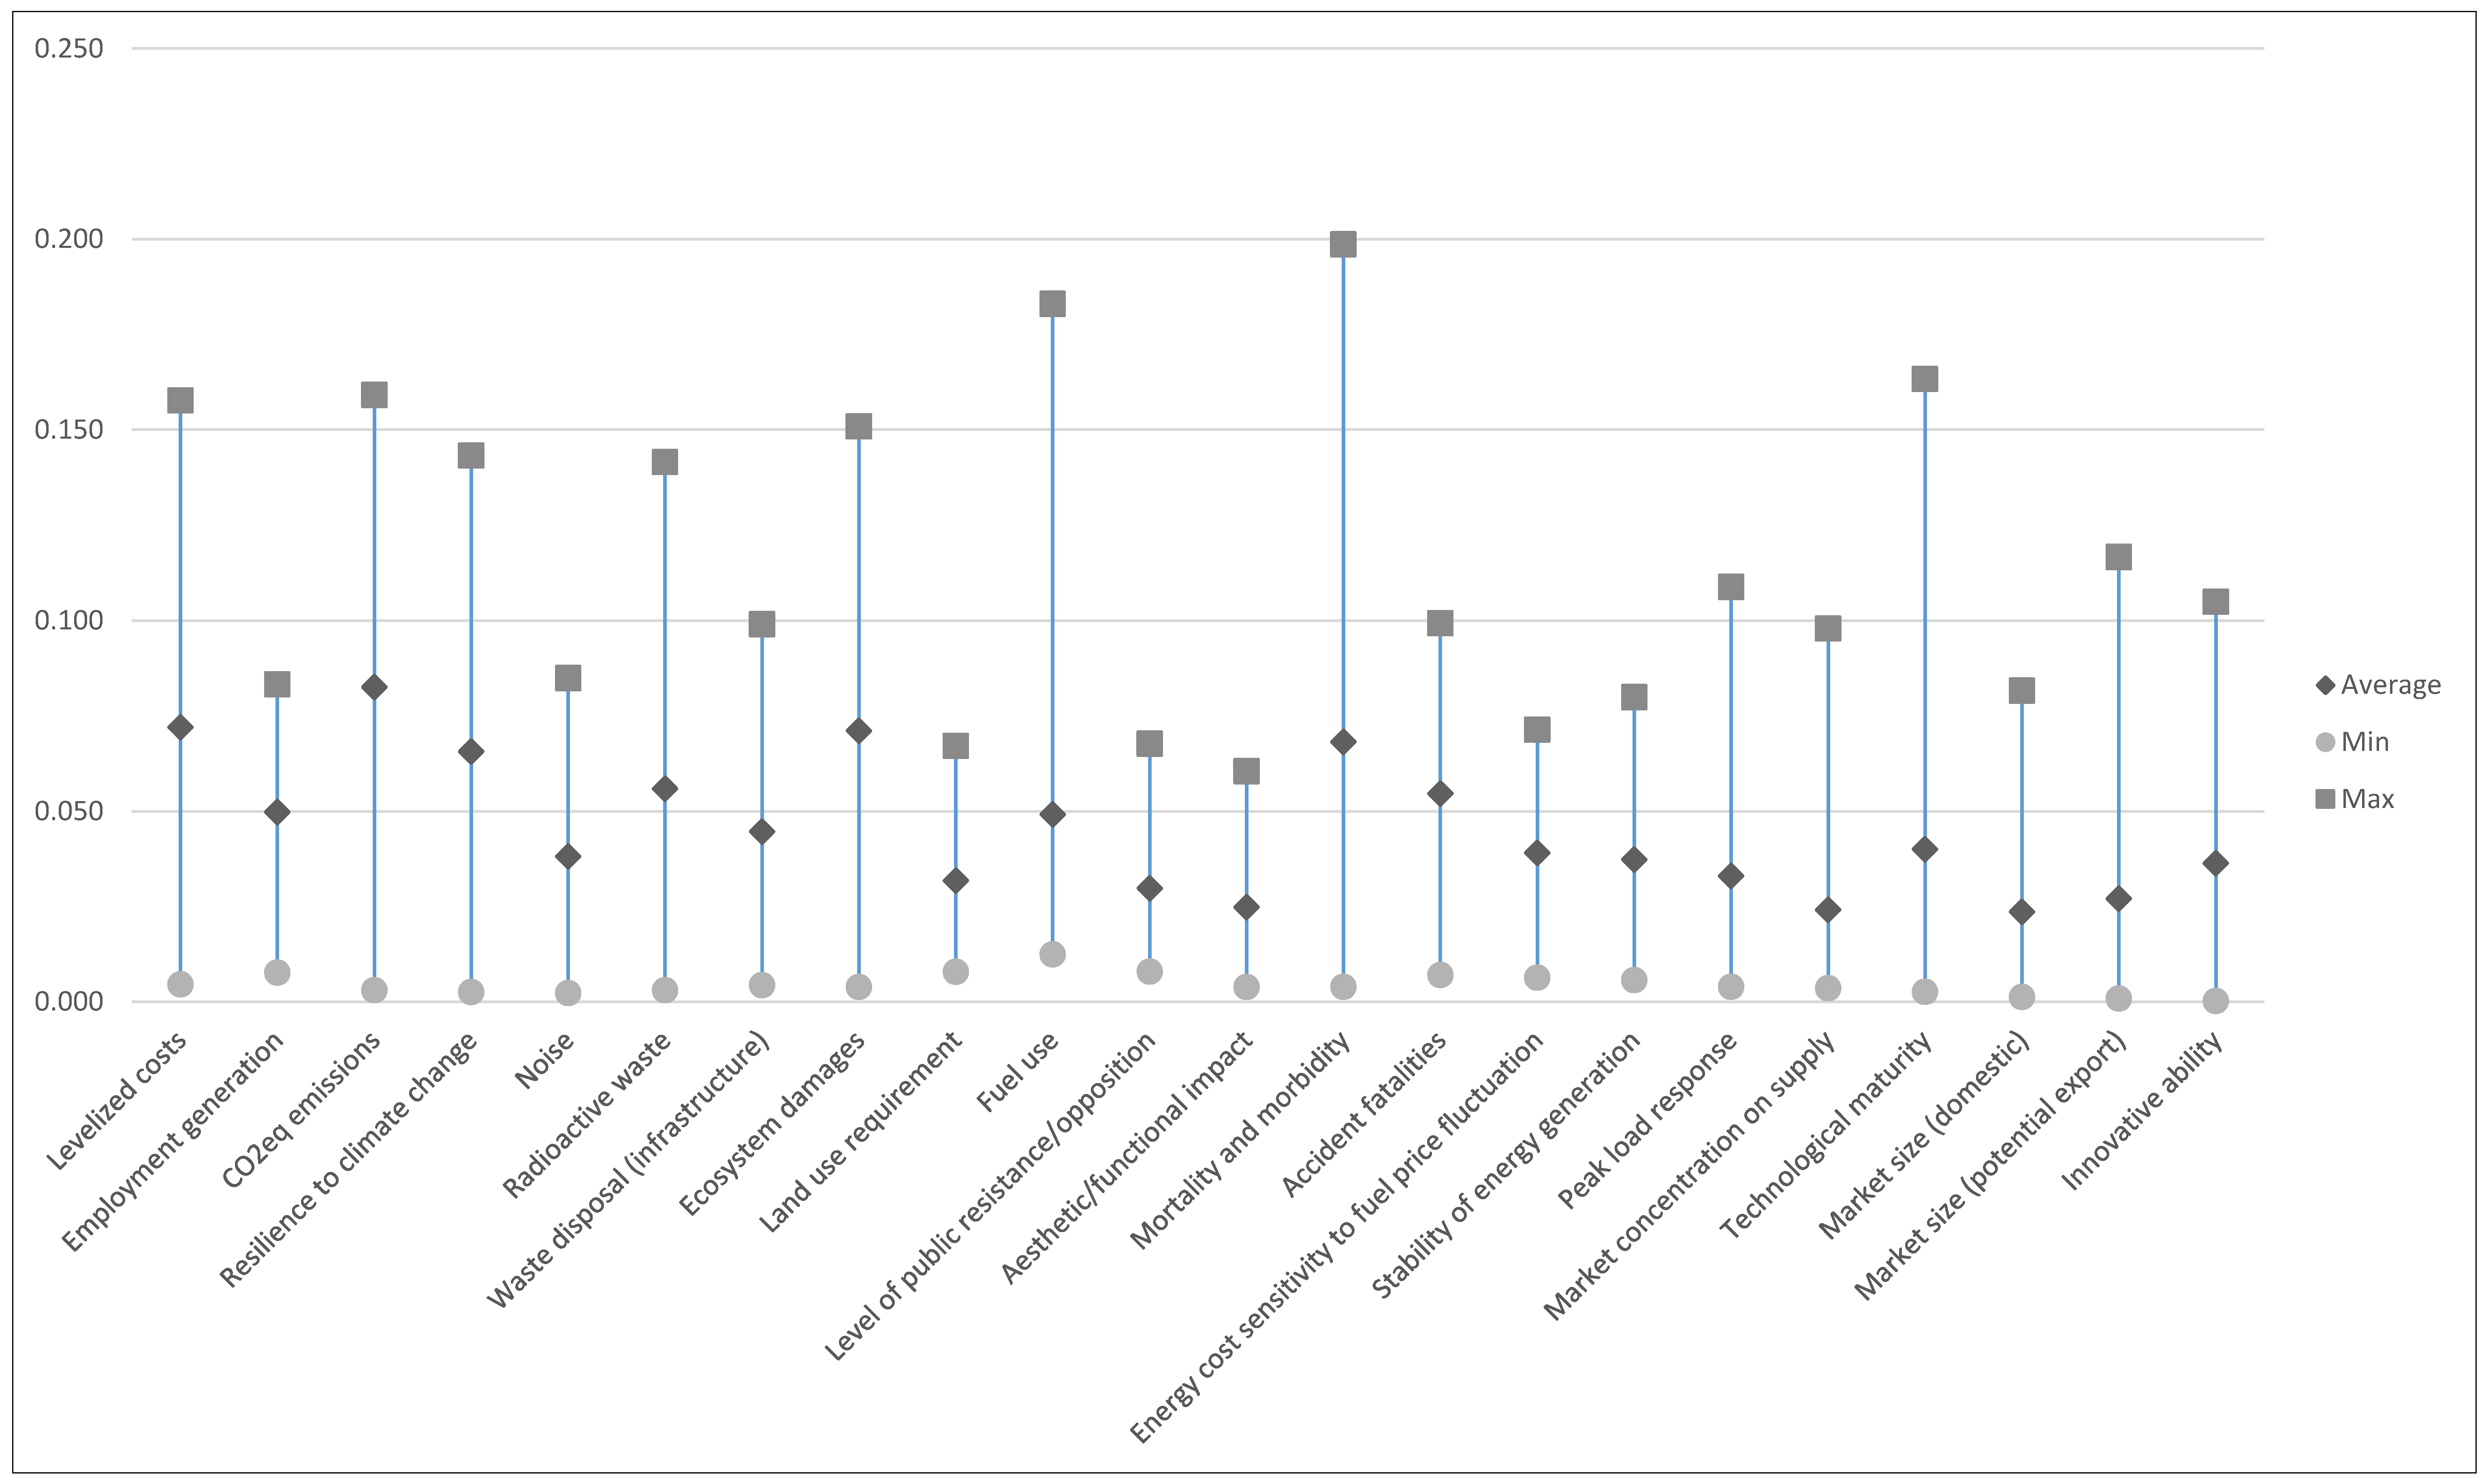
Based on the results of the approach, CO2eq emissions topped the list, with an average weighting score of 0.083. Levelized costs, ecosystem damages, mortality and morbidity, and resilience to climate change were on the list of top five preferred criteria. Figure 4 illustrates the final criteria weights based on stakeholders’ preferences. These results, though, should be further tested through a larger sample, whereby trends and patterns of local stakeholders’ preferences can be revealed.

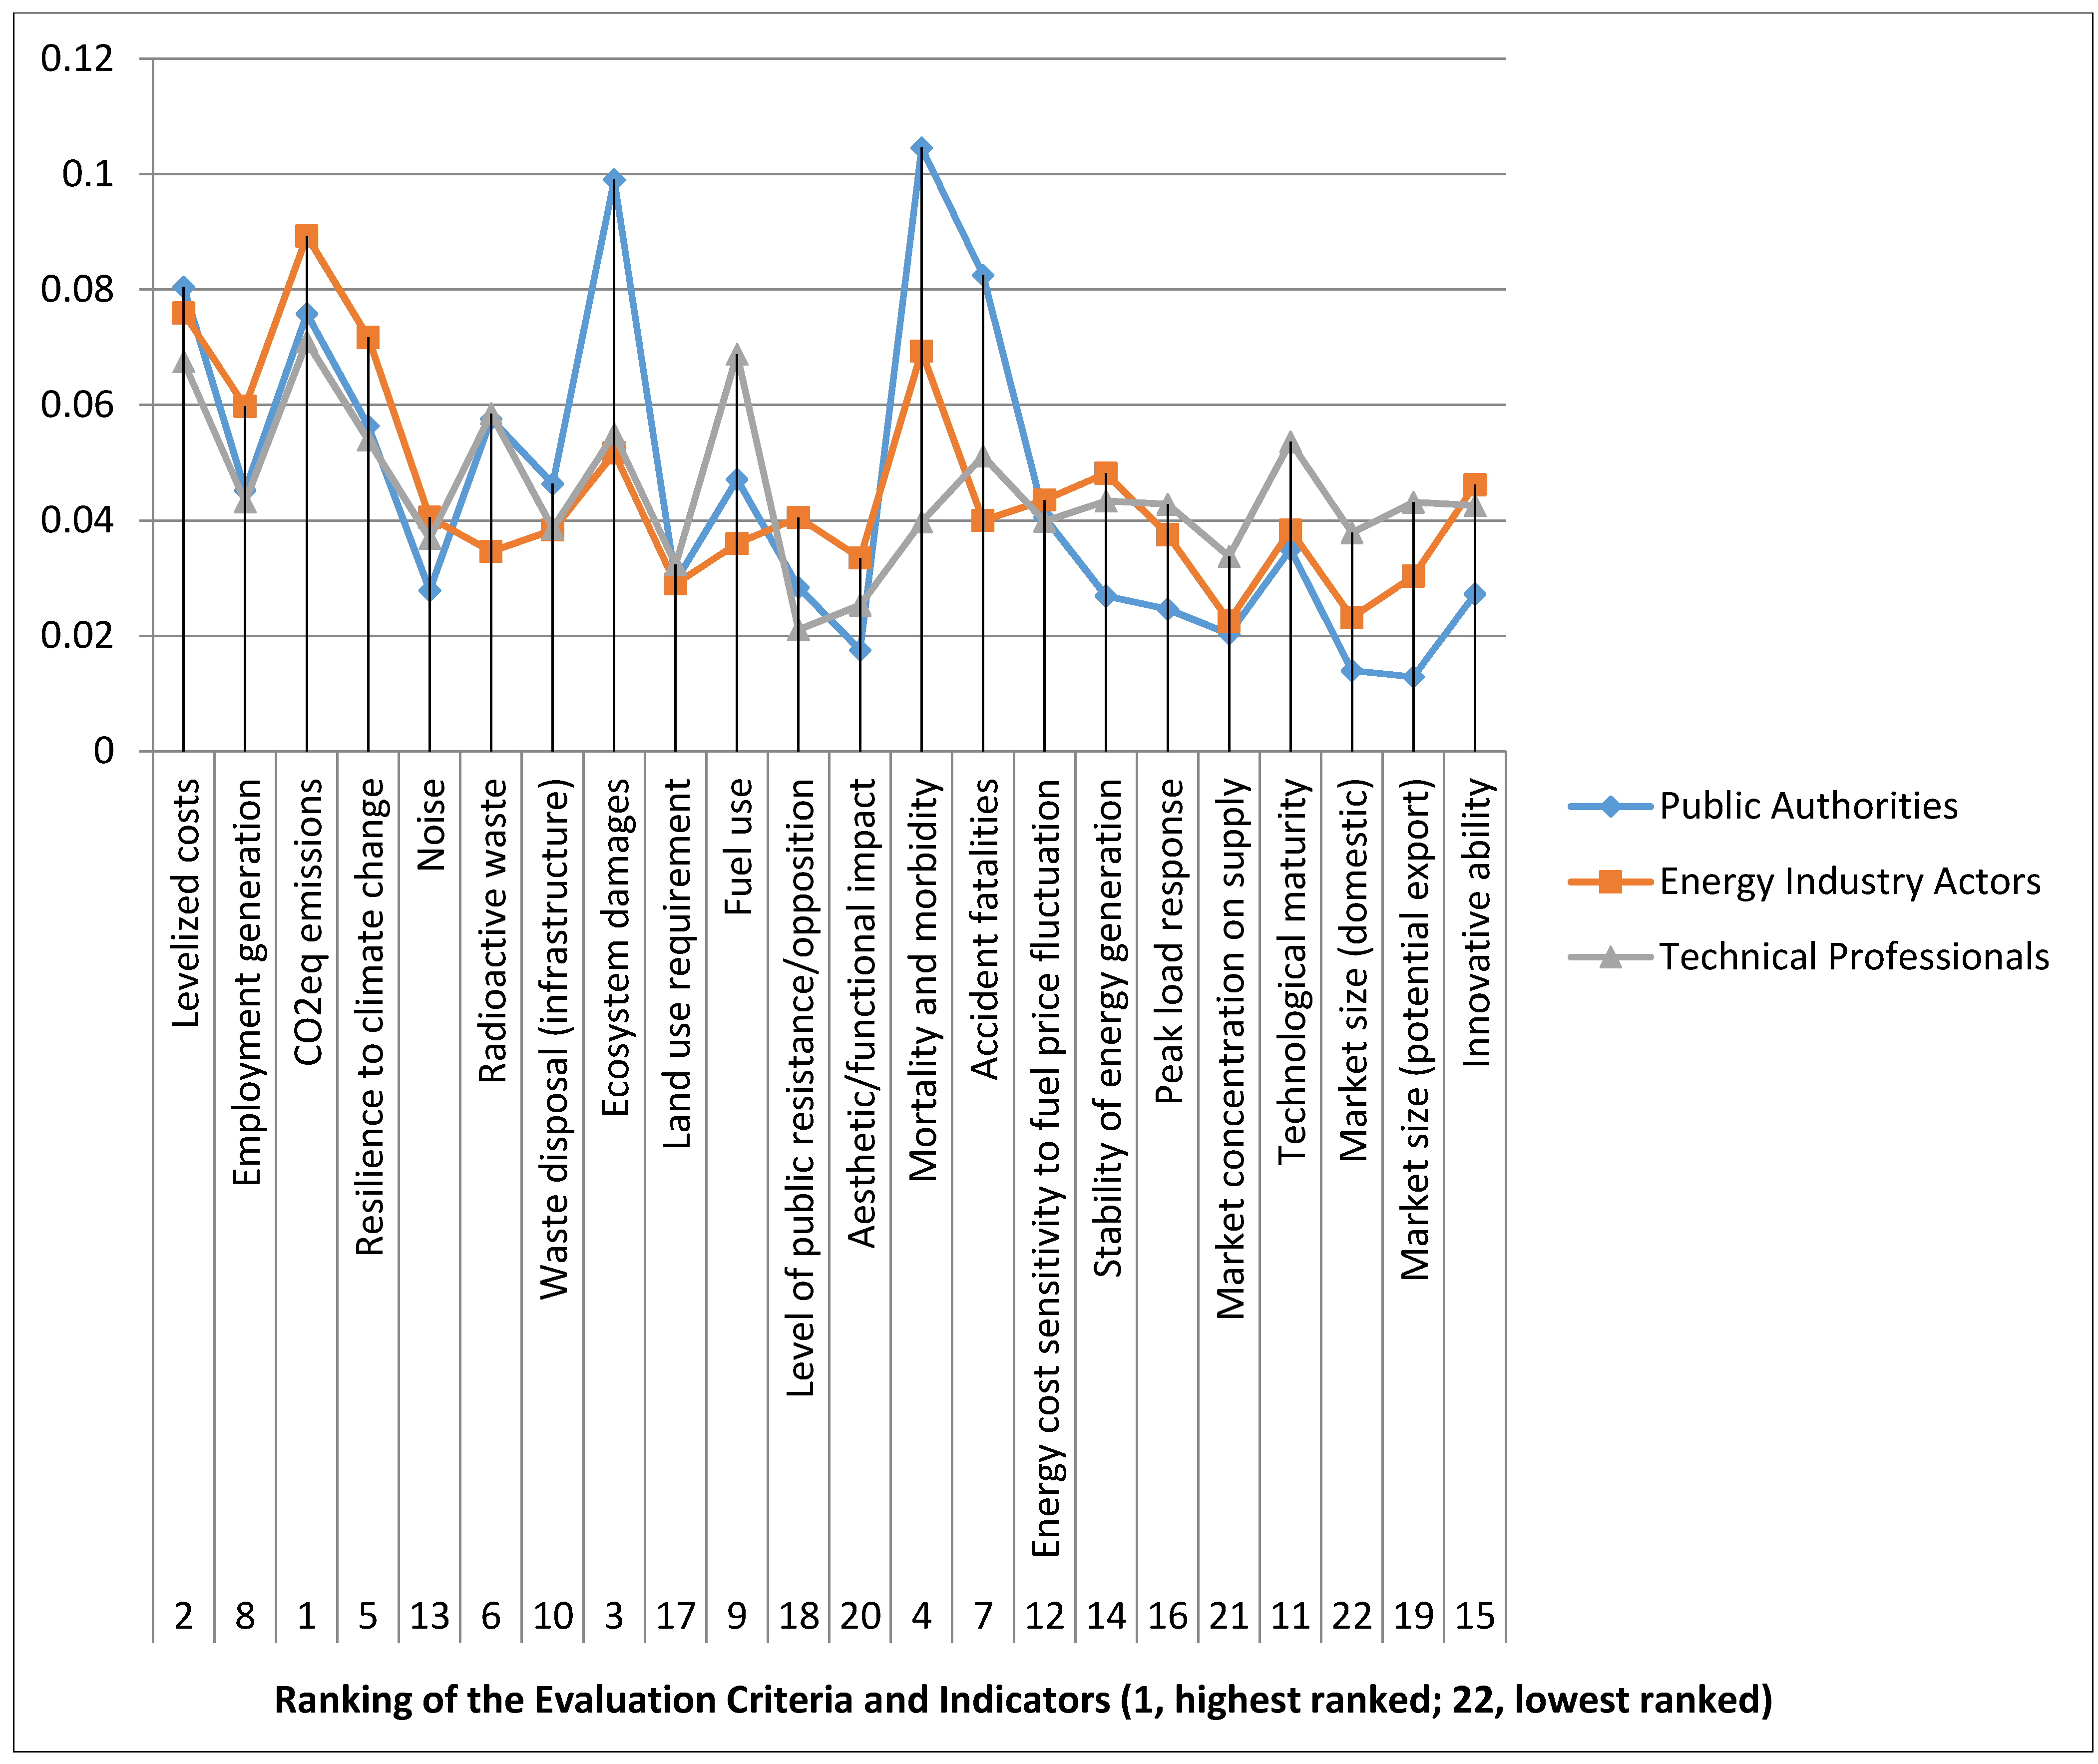
3.3. Stakeholder Groups Preferences

From the distribution of weighting scores in Figure 5, all three groups of local stakeholders expressed high preferences for CO2eq emissions, levelized costs, ecosystem damage, and resilience to climate change. CO2eq emissions was the most preferred criterion by both energy industry actors and technical professionals, while this ranked fifth among public authorities. Figure 5 also shows the convergence and divergence of preferences among the three different local stakeholder groups.
It could be observed that public authorities gave more importance to ecosystem damage, which ranked second on the list. Moreover, public authorities expressed high preferences for social criteria. Mortality and morbidity was considered as the number one criterion, while accident fatalities ranked third.
Energy industry experts also showed high preference for mortality and morbidity. However, this criterion was not given much importance by technical professionals. Accident fatalities, however, was ranked eighth among technical professionals and twelfth among energy industry actors. Meanwhile, technical professionals had expressed high preferences for fuel use, which ranked second among this stakeholder group. It could also be observed that, compared to public authorities and energy industry experts, technical professionals expressed a preference for certain energy and technological criteria.
Technological maturity and market size—both domestic and potential exports, for example, received more weight from technical professionals compared to the other stakeholder groups. It could also be observed that public authorities, compared to energy industry experts and technical professionals, gave relatively low weight to certain energy and technological criteria, such as market size—domestic and potential export, stability of energy generation, and peak load response.
Also, energy public professionals and technical professionals gave the same weight to radioactive waste, while energy industry experts gave a relatively lower weight to this criterion. Technical professionals also gave relatively lower weight to social criteria, such as mortality and morbidity and accident fatalities, compared to the other two stakeholder groups. Interestingly, energy and industry actors gave relatively higher weight to the level of public resistance/opposition and aesthetic/functional impact compared to the other groups.
Figure 4. Criteria weights including average, max, and min values.
Sustainability 07 10922 g004
Figure 5. Criteria weights according to the three stakeholder groups.
Sustainability 07 10922 g005

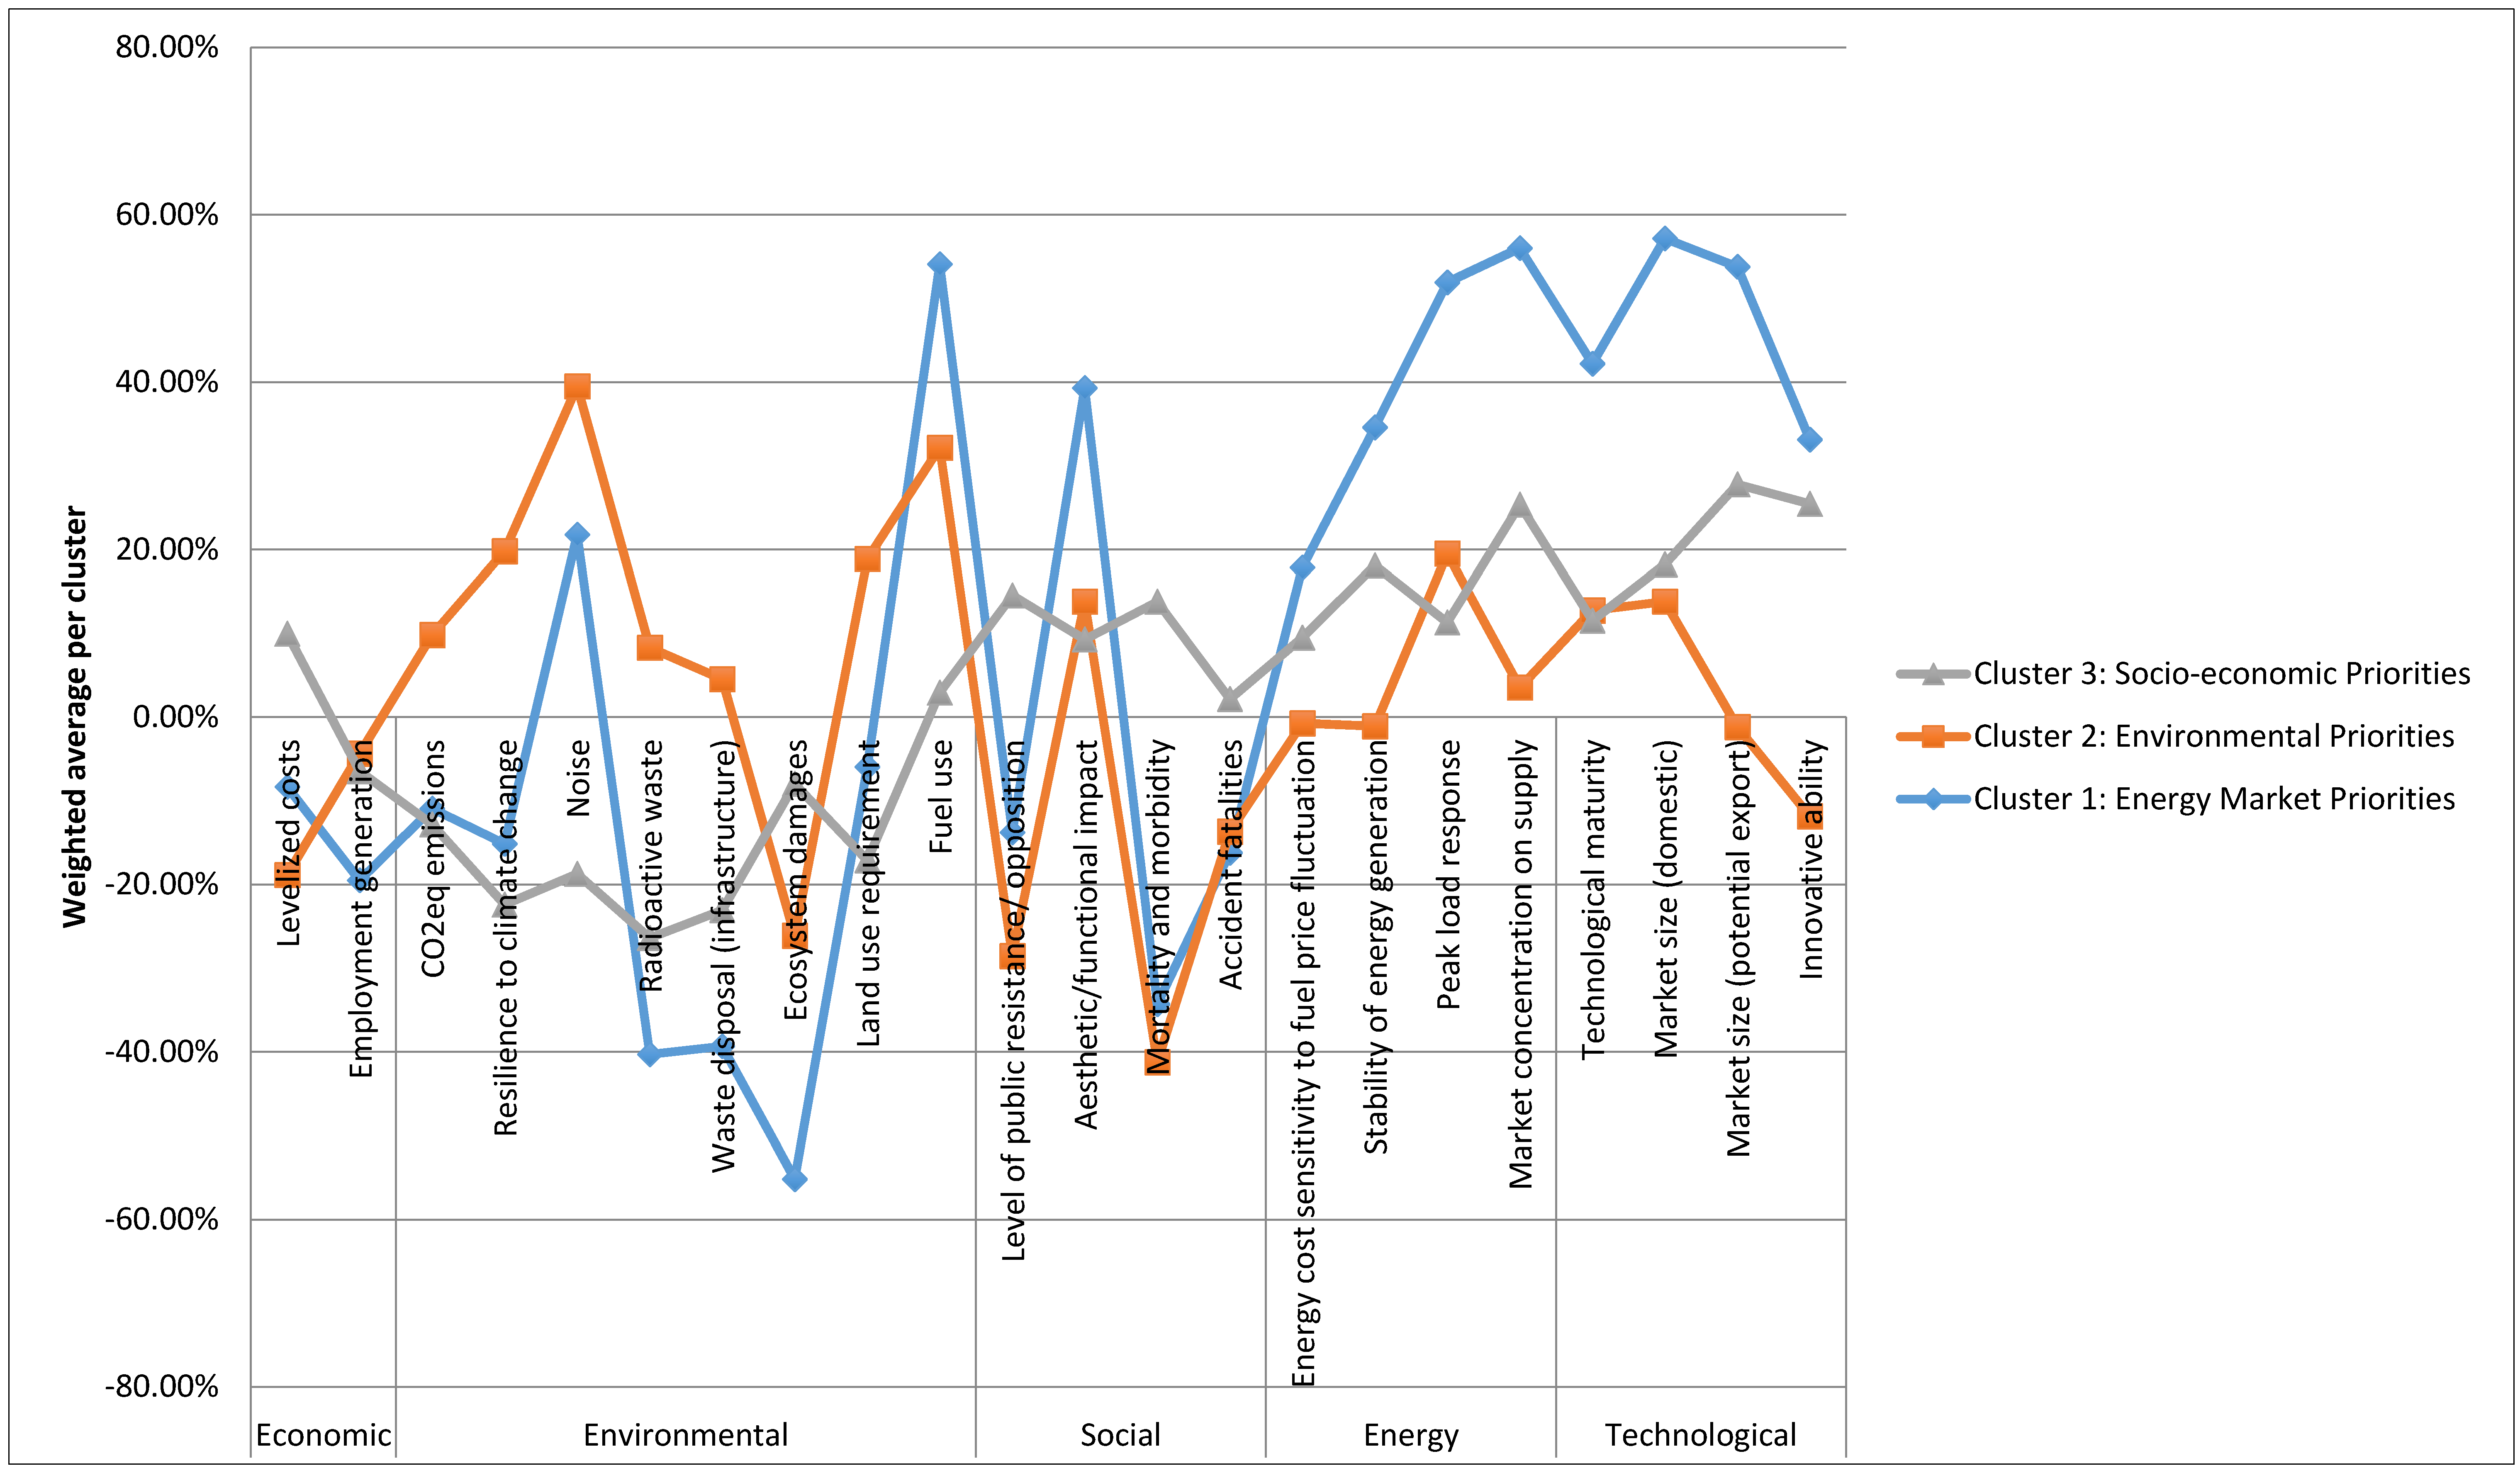
3.4. Clustering Priorities

Although the above analysis of weights and stakeholders’ priorities is insightful, this data can be analyzed further to see the level of homogeneity of stakeholder groups and if there are any identifiable “priority bundles” or groupings of criteria that respondents tend to prioritize. It can further be examined to see if certain “types” of stakeholders tend to give more weight to certain criteria categories. Cluster analysis was conducted on the survey data with these objectives in mind. Hierarchical agglomerative clustering methods were employed. First, each individual stakeholder was considered as an individual cluster, and then close pairs of clusters were merged using Ward’s method for clustering and the squared Euclidean distance to measure the distance between different observations. The resulting dendrogram suggests a three-cluster solution (Table 7). Stakeholders (respondents) in each cluster have weighted similar groups of criteria and utilize similar priorities when evaluating low-carbon energy options (see Figure 6). According to cluster weights and their average values, three “priority clusters” were created:
(1)
Energy market priorities: Stakeholders (respondents) in this cluster gave higher priority (weight) to energy and technological criteria.
(2)
Environmental priorities: Stakeholders (respondents) in this cluster gave higher priority (weight) to most of the environmental criteria.
(3)
Socioeconomic priorities: Stakeholders (respondents) in this cluster gave higher priority (weight) to most of the social and economic criteria.
Table 7. Cluster analysis results.
Criteria CategoriesCriteriaCluster 1: Energy Market PrioritiesCluster 2: Environmental PrioritiesCluster 3: Socio-economic Priorities
MaximumAverageMinimumMaximumAverageMinimumMaximumAverageMinimum
EconomicLevelized costs0.090.070.000.090.060.030.160.090.06
Employment generation0.070.040.010.080.060.040.080.050.02
EnvironmentalCO2eq emissions0.130.070.000.160.100.050.090.060.03
Resilience to climate change0.130.060.000.140.090.020.080.040.00
Noise0.080.050.010.080.040.010.040.020.00
Radioactive waste0.060.030.000.140.080.020.060.040.02
Waste disposal (infrastructure)0.040.030.000.100.060.030.070.030.01
Ecosystem damages0.060.030.000.150.090.050.140.080.05
Land use requirement0.060.030.010.070.040.020.030.020.01
Fuel use0.180.080.020.060.040.020.070.030.01
SocialLevel of public resistance0.040.030.020.050.030.010.070.040.01
Aesthetic/ functional impact0.060.030.020.040.020.000.040.020.00
Mortality and morbidity0.090.040.020.110.060.020.200.110.00
Accident fatalities0.080.050.020.100.060.010.100.060.03
EnergyEnergy cost sensitivity to fuel price fluctuation0.070.050.020.060.030.010.060.040.02
Stability of energy generation0.080.050.030.040.020.010.080.040.01
Peak load response0.110.050.020.040.020.000.050.030.01
EnergyMarket concentration on supply0.100.040.020.020.010.000.050.030.01
TechnologicalTechnological maturity0.160.060.020.090.030.000.060.040.02
Market size (domestic)0.080.040.010.030.010.000.060.020.01
Market size (potential export)0.120.040.010.030.010.000.070.030.01
Innovative ability0.110.050.010.050.020.000.070.050.02
Regarding the homogeneity of stakeholder groups, the following observations can be drawn from the cluster analysis (see also Table 8). The highest homogeneity was observed in the Public Authorities group, where four out of five respondents belong in cluster 2, which places more emphasis on environmental priorities. Technical experts proved to be relatively homogenous: three out of five respondents belong in cluster 1, which places more emphasis on energy market priorities; the other two respondents belong in cluster 2, which emphasizes environmental priorities. Energy industry actors also proved to be relatively homogenous, as three out of five respondents belong in cluster 3, which emphasizes socioeconomic priorities, whereas the other two belong in cluster 1, which gives priority to energy market considerations.
Table 8. Type of stakeholders in each cluster (priorities).
Technical ExpertsEnergy Industry ActorsPublic AuthoritiesTotal
Energy Market Priorities 3205
Environmental Priorities 2046
Socioeconomic Priorities 0314
Total55515

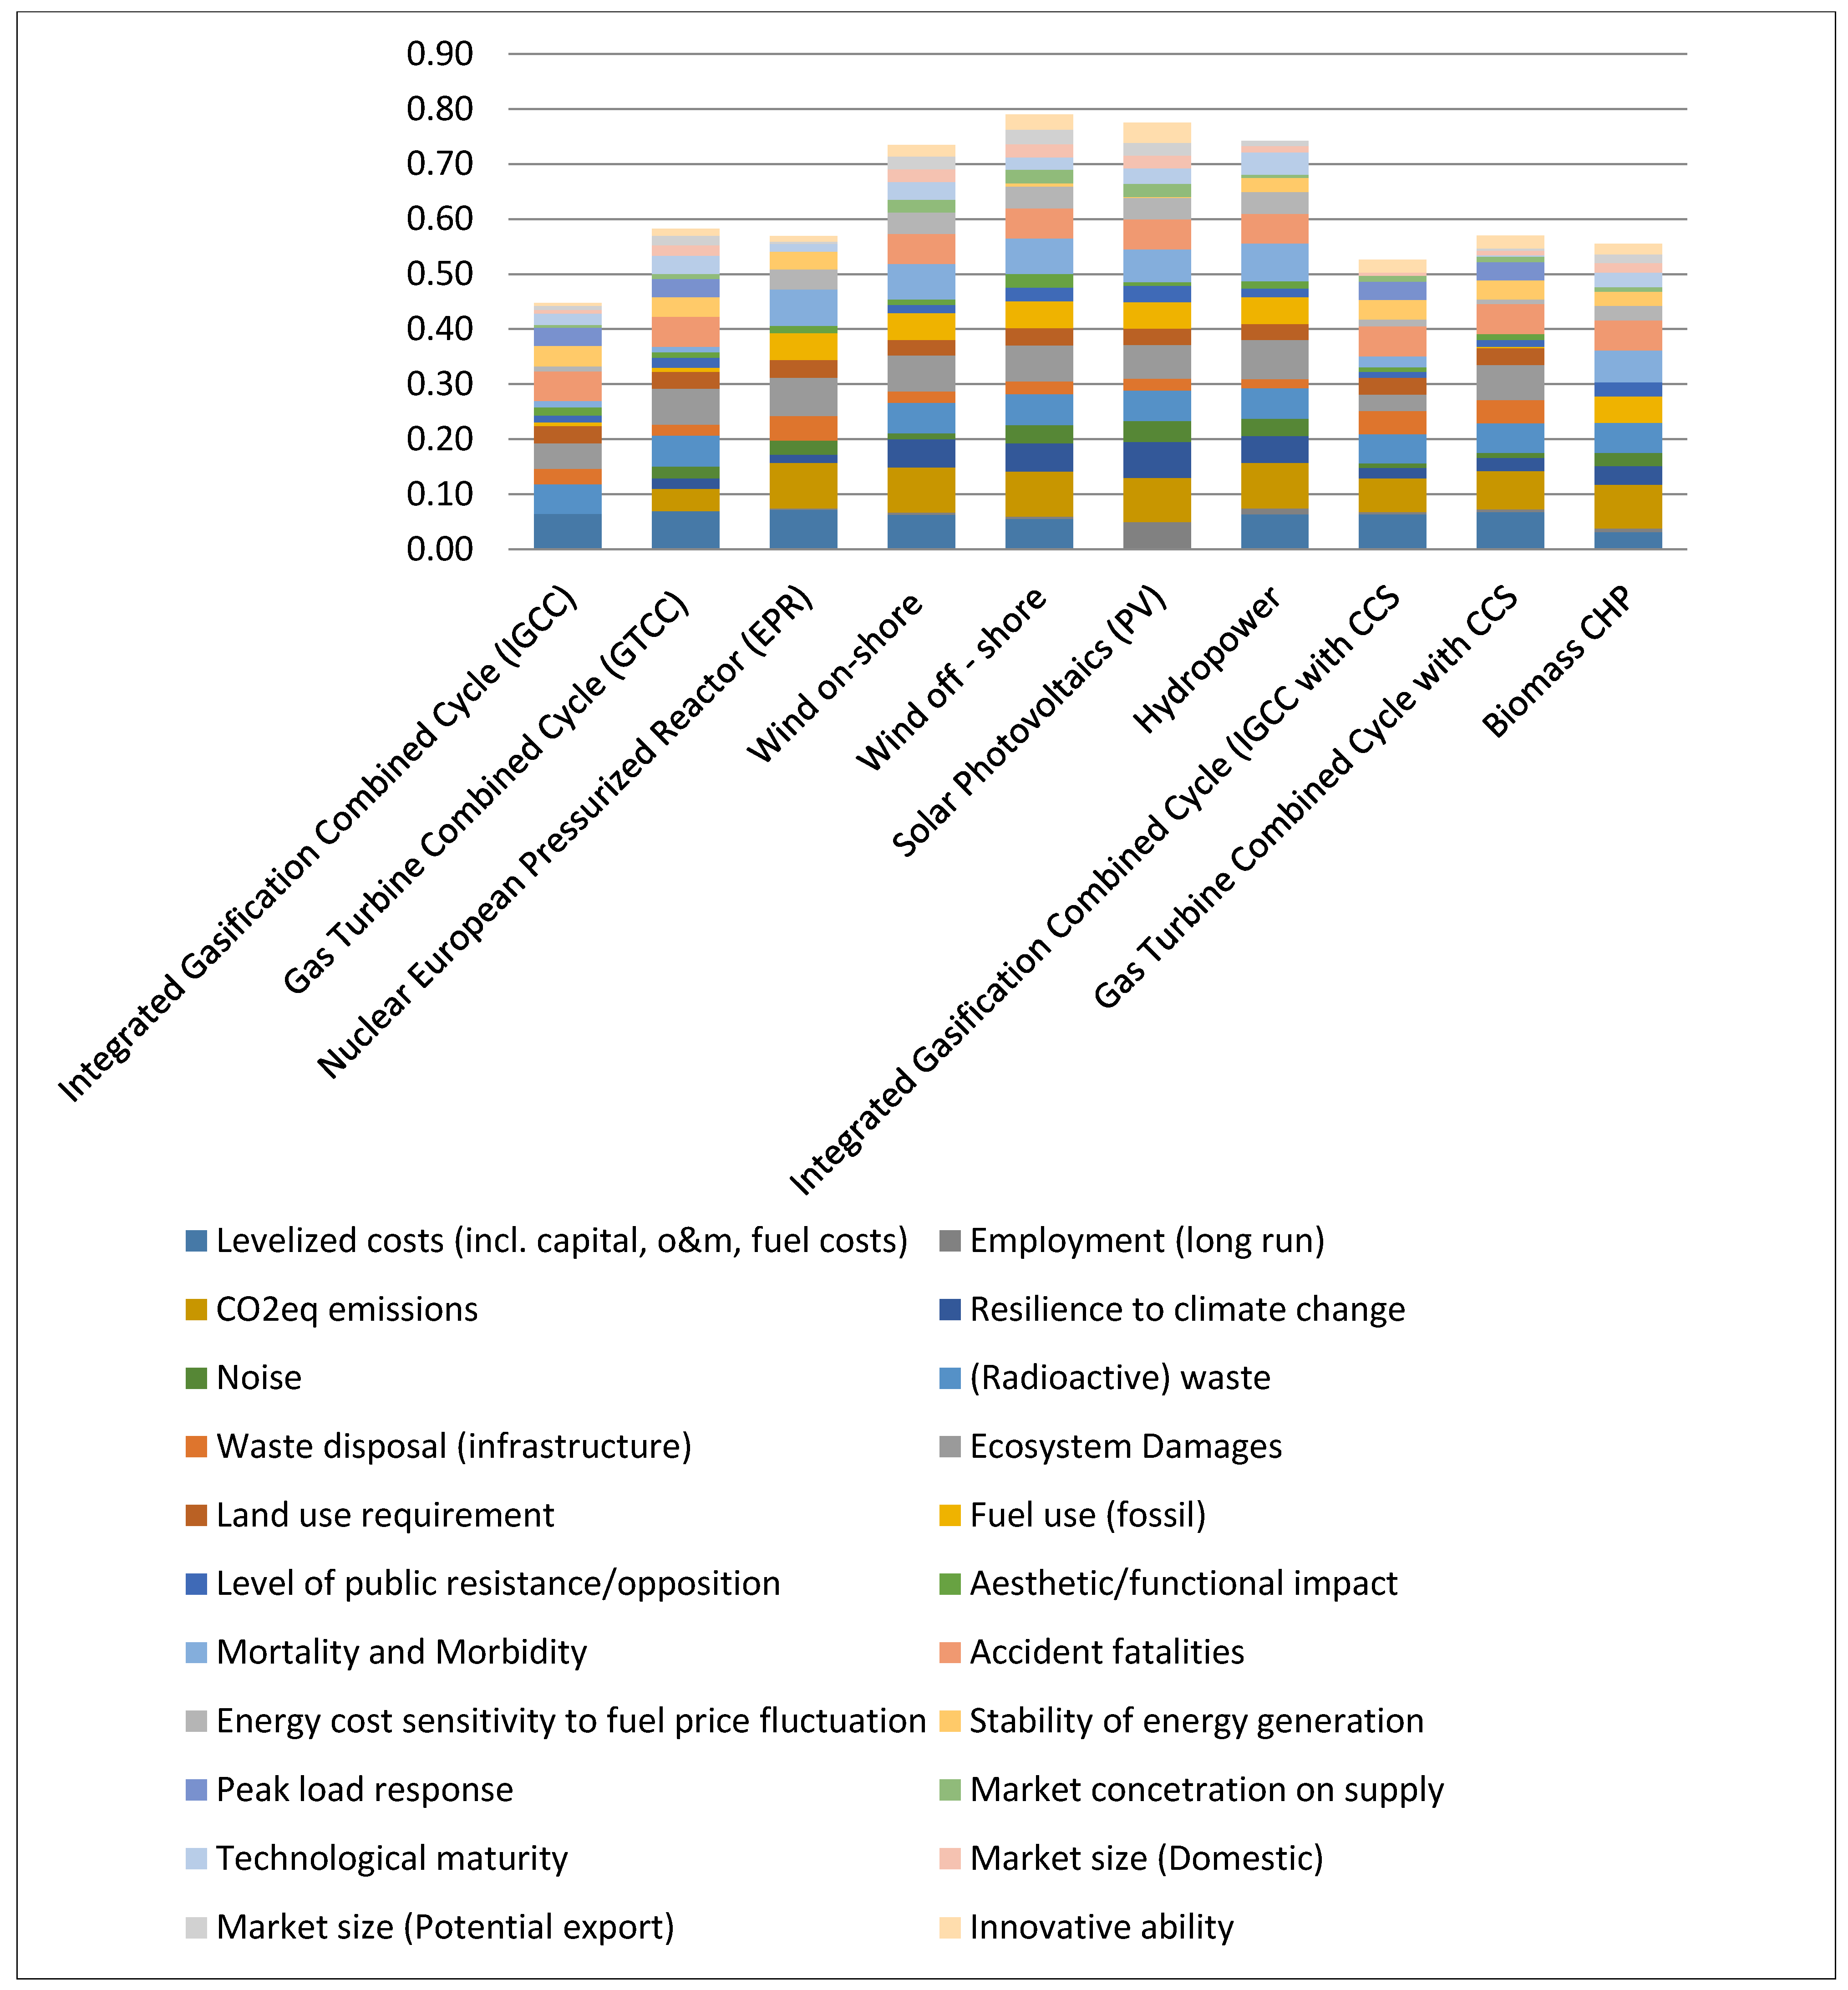
3.5. Evaluation of Energy Technologies

The evaluation of low-carbon energy technologies was conducted, and it was found that the highest ranked low-carbon energy technology is wind off-shore (0.79), followed by solar PVs (0.78), hydropower (0.74), wind on-shore (0.73), GTCC (0.58), GTCC with CCS (0.57), EPR (0.57), biomass (0.56), IGCC with CCS (0.53), and IGCC (0.45). Figure 7 shows the final scores of each low-carbon energy technology, illustrating the contribution of each evaluation criterion to the final score. As can be observed from Figure 7, technologies with high scores at the most important criteria, weighted by the stakeholders, in principle achieve higher overall final scores.
Figure 6. Cluster analysis—clusters’ weighted averages.
Sustainability 07 10922 g006
Figure 7. Final scores of the low-carbon energy technologies and contribution of evaluation criteria based on local stakeholders’ preferences.
Sustainability 07 10922 g007
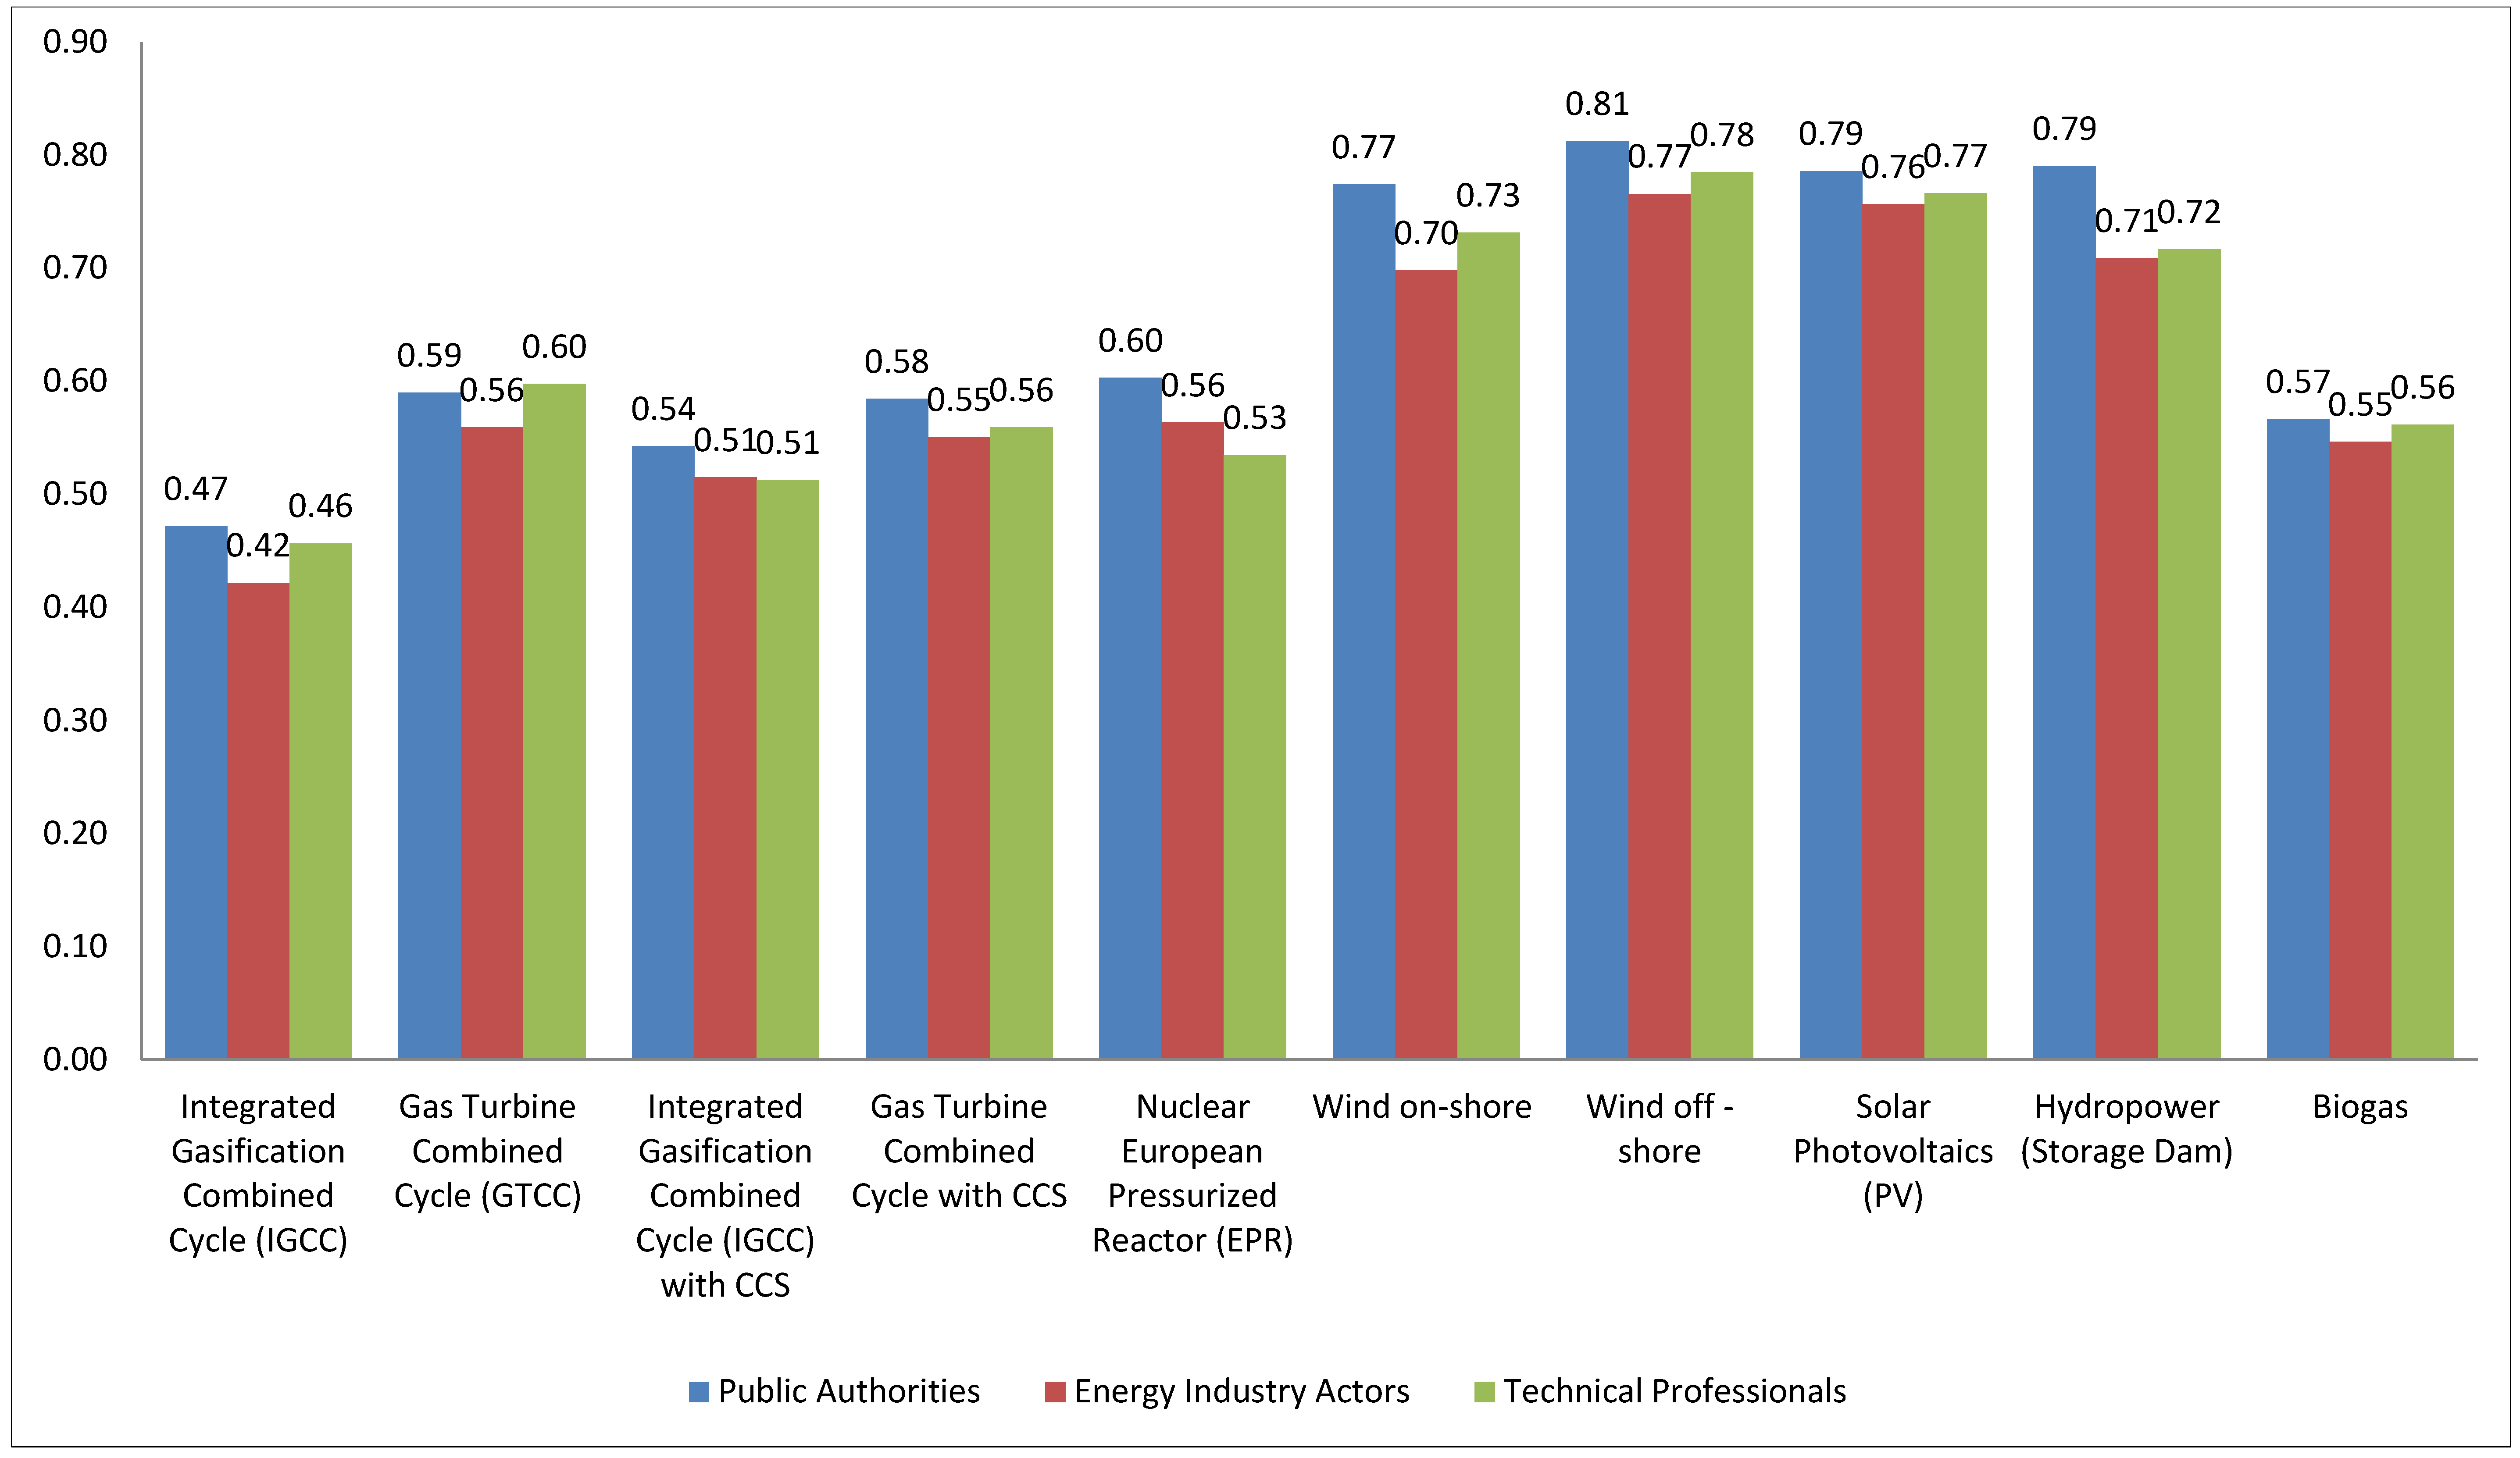
It could be observed (Figure 8) that among the three stakeholder groups, wind off-shore is the highest ranked low-carbon energy technology. Solar PV is the second-ranked technology for energy industry actors and technical professionals, while public authorities favored hydropower. Solar PV is the third-ranked technology among public authorities, while energy industry actors favored hydropower. Meanwhile, wind on-shore is the third-ranked technology among technical professionals, while public authorities and energy industry actors ranked it fourth. It could be observed from the rankings among the three local stakeholder groups that renewable energy technologies outrank other technologies, such as fossil-fuel based ones (e.g., IGCC and GTCC) and nuclear technology (EPR).
Figure 8. Overall weighted scores of low-carbon energy technologies per stakeholder group.
Sustainability 07 10922 g008

4. Discussion

4.1. Criteria Weighting

As the initial ranking provided the basis for the consistency check, the results of the pairwise comparisons were checked in order to assure their consistency and reliability. By applying different ranking and weighting techniques, an opportunity for a consistency check was established to enhance the consistency of stakeholders’ preferences. Most of the time, this is neglected [33]. By using different methods we were able to detect inconsistencies by comparing the different ranking results. Such inconsistencies are an opportunity to reflect on different framings of the issue at hand [33]. By using a single method, such an opportunity is lost. Furthermore, MCA practitioners often apply a “one-size-fits-all” approach even though different methods work better for some people and situations than for others [33].
It is important to note that 31% of the respondents achieved low consistencies between their initial and final rankings. As has also been stated by various authors [7,39,62], the study conveyed that the difference in consistency between weighting methods could be related to the large number of criteria for comparison, particularly common in the case of pairwise comparisons. This research study involved 22 pairs of criteria for comparison, which resulted in a high cognitive burden on the respondents. Hence, with the large number of pairs for comparison, inconsistencies inevitably arose. This was expected as during prescriptive decision analysis processes, perceptions change and evolve, and the representation of these perceptions are not static [39]. The respondents were then asked to modify their preferences should their weighting scores not reach the consistency threshold value. However, having to repeat the pairwise comparisons could have been a challenge for some of the respondents since this would have required additional time.
Furthermore, it could be observed that due to the cognitive demands as well as time constraints, the respondents were more comfortable with providing the ranking order directly for a list of criteria rather than selecting which criteria are relatively more important for each pairwise comparison. As other authors [59,60] suggest for the elicitation of weights, ranking methods using surrogate weights proved to be less cognitively demanding. In a previous study by the main author [7], a sample of individual stakeholders and experts in the climate and energy policy field has expressed satisfaction as well as approval for combining ranking and pairwise comparisons as approaches in weighting energy and climate criteria. The study showed that the initial ranking facilitated a gradual approach to the evaluation problem. The pairwise comparisons, on the other hand, enabled a more accurate expression of the respondents’ preferences. The number of criteria (14) in that study was significantly fewer than the number of criteria (22) selected to be assessed in this study.
Cognitive limit is one of the challenges in stakeholders’ preference elicitation. In a decision problem that involves a small set of alternatives and criteria, most people can make their selection intuitively. However, with a large set of alternatives and criteria, relying on intuition and/or experience seems inadequate and thus needs further support. The conclusions correspond to the additional challenge of the mix of qualitative and quantitative indicators as well as of preferences that are often times irregular, non-sequential, and with threshold values [28]. The computerized interaction was considered important in helping stakeholders to construct their preferences. This provided stakeholders with support in analyzing their desired objectives in relation to the outcomes of the elicitation process. Practical techniques for elicitation are to a great extent a matter of balancing the quality of elicitation results with the time available and cognitive burden on the respondents for eliciting all the required information [39].

4.2. Stakeholders’ Preferences on Sustainability Evaluation Criteria

Local stakeholders, in general, expressed high preferences for CO2eq emissions, levelized costs, ecosystem damages, employment generation, resilience to climate change, fuel use, and waste disposal, which shows implied responsibility towards local benefits and negative externalities. Mortality and morbidity, accident fatalities, and radioactive waste were also high priorities for the respondents, which shows how local stakeholders value the welfare of the public, including workers, during project installation and operation. The potential impact of energy technologies on human health and safety is considered a priority.
Local stakeholders, and society in general, are still concerned about radioactive waste because of its potential to cause catastrophic accidents—whether likely or unlikely—or be used in terrorist attacks. In the aftermath of the Fukushima nuclear disaster in Japan in 2011, radioactive waste and nuclear safety remain controversial topics. Aesthetic/functional impact was not a significant preference among the local stakeholders. Although debate is inevitable regarding the aesthetics of current infrastructure of specific renewable energy technologies (e.g., wind and solar), mechanisms are available for the deployment of these technologies in unobtrusive ways [63].
Public authorities prioritize public health protection and safety—and in general, certain social criteria—as proven by their preference for mortality and morbidity and accident fatalities. Public authorities also give significant priority to ecosystem damage, CO2eq emissions, and levelized costs, which reflects their concern for local environmental protection as well as economic outlay.
In spite of sharing similar preferences with public authorities and energy industry experts, technical professionals have a unique high preference for fuel use. This research study also concludes that technical professionals, when compared to other stakeholder groups, have higher preferences for certain energy and technological criteria. On the other hand, public authorities give the least priority to certain energy and technological criteria, while technical professionals have the lowest preferences for certain social criteria. However, this sample of the stakeholders does not allow for generalization of the results and indicates the need to apply this methodology in a larger sample of different local stakeholder groups around Europe.
With regard to the homogeneity of stakeholders’ groups and according to the cluster analysis that was conducted, public authorities proved to be the most homogeneous group, with a clear focus on environmental priorities. This is considered reasonable since the composition of the group of respondents was to a large extent linked to the Covenant CapaCITY European project, which has a clear focus on environmental aspects. Technical experts proved to be a relatively homogenous group, with emphasis on energy market and environmental priorities. The energy industry actors group also proved to be relatively homogenous, as most of the respondents emphasized socioeconomic priorities, whereas few more emphasized energy market priorities. These results provide the first insights on local stakeholders’ preferences typology. This typology and results need to be further explored on a larger scale in order to be able to generalize and come up with valuable recommendations for energy policy making.

4.3. Ranking of Energy Technologies

This research concludes that wind off-shore, solar PV, hydropower, wind on-shore, and GTCC are the low-carbon energy technologies that rank highest while considering the preferences of local stakeholders. On the other hand, IGCC with CCS and IGCC were the least significant low-carbon energy technologies among all three stakeholder groups.
The results of the NEEDS project [30] also showed high preferences for renewables, such as solar, wind, and biomass technologies. Centralized gas options (e.g., combined cycle and combined heat and power CHP) as well as nuclear technologies were the mid-performing group of technologies, while coal and lignite technologies were considered the worst performers. In Turkey [20], wind power proved to be the preferred option in their ranking of alternative energy sources. Wind was also the highest ranked alternative, followed by biomass and PV, in an MCA in Greece [17].
The results of the study also show how certain technologies (e.g., renewables) that rank relatively low in cost-based assessments are otherwise most preferred and highly ranked if multiple sustainability criteria are considered in the assessment. One can surmise that economic costs certainly play a role in decision making, regardless of stakeholders’ propensity for choosing other sustainability criteria. As demonstrated in the results of the study, costs matter, but only up to a certain point. Other sustainability criteria, such as social and environmental ones, should also drive the assessment process.

4.4. Implications for Sustainable Energy Policy

As for low-carbon energy policy, it can be concluded that based on the overall preferences of stakeholders, there should be a focus on policies that enable the local deployment of renewable energy technologies reflecting preferred local priorities, such as levelized costs, ecosystem damages, and employment generation. Moreover, key differences regarding local stakeholder preferences could be highlighted during local low-carbon energy planning. Within the decision-making context, relevant stakeholders and decision makers would have informed opinions about the value judgments of local stakeholders that need to be taken into account in the process of developing low-carbon energy policies and sustainable energy action plans.

5. Conclusions

The constructive weighting methodology applied in this study allows for a thorough process for eliciting weighting preferences. The methodology requires survey respondents to be consistent in their preferences. Moreover, the use of different techniques enhances the reliability of the results as respondents had the opportunity to check and revise their preferences. The low consistencies of respondents’ preferences could be attributed to the large number of criteria involved and the cognitive burden this imposes to respondents. However, the demonstration of the constructive weighting methodology shows great potential for better decision making, supporting stakeholders’ efforts to gradually construct their preferences.
Overall, the research study was able to map, albeit in a limited manner, the preferences of local energy stakeholders. Based on the elicited preferences, the low-carbon energy technologies that best meet the evaluation criteria prioritized by local energy stakeholders were assessed. This study shows which sustainability (i.e., economic, environmental, social, energy, and technological) criteria local energy stakeholders prioritize during the assessment of low-carbon technologies. Furthermore, considering stakeholders’ priorities and preferences of sustainability criteria, a final ranking for low-carbon energy technologies is determined.
The results show clearly that there are converging stakeholders’ views on many aspects of sustainability assessment of low-carbon energy technologies, which implies the possibility of reaching a consensus between different local stakeholders in energy planning and finding the right balance between economic, environmental, social, energy, and technological considerations. The fact that renewable energies (RE) proved to perform best within the proposed integrated assessment framework leads to the conclusion that European and national policies should further enable RE deployment, not only to achieve low-carbon development objectives but also to meet local stakeholders’ priorities.
In this study, a constructive weighting methodology was applied to elicit European local stakeholders’ preferences on the evaluation criteria of future low-carbon energy technologies. However, this research study merited a small number of respondents based on a European project that aims at supporting local governments in conducting Sustainable Energy Action Plans. This research study mapped three broad categories, namely public authorities, energy industry actors, and technical professionals. It would be useful to map the preferences of distinct local stakeholder groups that apply within a larger local energy context in Europe. As such, there is a need for further application of the constructive weighting methodology to a large number of local energy stakeholders at the European level and, even better, to stakeholders groups’ decision-making process.
The constructive weighting methodology for this study can also be applied in a group decision context, wherein local stakeholders and decision makers meet face-to-face, e.g., workshops or consultation meetings. Furthermore, this weighting methodology could be carried out through an online process of interaction, e.g., webinar. Furthermore, different weighting methods could be tested to compare any differences in the results. Also, by applying different weighting methods, researchers can also examine the level of consistency of stakeholder preferences and how this is affected by the type of weighting methodology and framing.
Lastly, in situations where decision makers have to engage in the development of low-carbon energy strategies and sustainable energy action plans, local stakeholders’ preferences can be mapped out by applying this methodology. This is crucial also for the identification of potential conflicts and resolution of actual ones in order to reach consensus on the development of local sustainable energy strategies.

Acknowledgments

This research study was supported by the Covenant CapaCITY, a project co-funded by the Intelligent Energy Europe program, and supported by the ICLEI—Local Governments for Sustainability European Secretariat. Duration of the project: 2011–2014. Furthermore, the authors would like to thank Carsten Rothballer, Giorgia Rambelli, and Maryke van Staden, energy and climate officials of ICLEI, for their continuous support during this study. In addition, the authors would like to thank all 86 European participants (stakeholders and experts in the local energy field) who were involved in the process of validation, selection, and weighting of the evaluation criteria and impact assessment of energy technologies. The authors would like also to thank the three anonymous reviewers for their valuable comments and suggestions.

Author Contributions

Stelios Grafakos Sustainability criteria selection, validation and refinement; impact assessment and measurement of sustainability indicators; development of the constructive weighting methodology; analysis of results; and writing of the manuscript.
Alexandros Flamos Sustainability criteria selection, validation and refinement, development of the constructive weighting methodology, analysis of results and writing of the manuscript.
Elena Marie Enseñado Review of MCDA applications in energy planning, stakeholders’ validation (survey of local stakeholders’ views), elicitation of stakeholders’ preferences, analysis of results, and writing of the manuscript.

Conflicts of Interest

The authors declare no conflicts of interest.

Appendix 1: Impact Assessment Matrix

Table A1. Performance (impact) of the low carbon energy technologies against the evaluation criteria.
Economic CategoryEnvironmental CategorySocial CategoryEnergy CategoryTechnological Category
CriteriaLevelized costs (1)Employment (long-term) (2)CO2eq emissions (3)Climate resilience (4)Noise pollution (3)Radioactive waste (3)Waste disposal (infrastructure) (3)Ecosystem damages (3)Land use requirement (5)Fuel use (3)Level of public resistance/opposition (4)Aesthetic/functional impact (4)Mortality and morbidity (3)Accidents and fatalities (3)Energy cost sensitivity to fuel price fluctuation (3)Discontinuity of energy generation (4)Peak load response (6)Market concentration on supply (4)Technological maturity (4)Market size (domestic) (4)Market size (potential export) (4)Innovative ability) (4)
Technologies
Measurement Uniteuros/MwhJobs-year/GWhg/kwh“1–5”“1–5”m3/kwhkg/kwhPDF·m2·a/kWhkm2/TWh-yearMj/kwh“1–5”“1–5”YoLL/kWhdeaths%“1–5”%“1–5”“1–5”“1–5”“1–5”“1–5”
1IGCC99.90.117532.83.01.1 × 10−92.30.0139.76.903.43.47 × 10−8434531.8703.23.82.83.02.4
2GTCC78.90.113883.02.23.5 × 10−111.70.003318.66.792.92.87 × 10−8109691.9703.14.43.73.52.8
3EPR69.30.14.02.92.00.03.60.02.40.074.63.40.0500004.52.1103.53.42.22.82.7
4Wind on-shore107.20.17163.52.78.4 × 10−111.70.003472.10.063.23.67 × 10−9503.8102.64.44.13.83.4
5Wind off-shore140.10.17103.41.56.3 × 10−111.90.003400.052.32.66 × 10−91003.5102.93.94.14.03.8
6Solar Photovoltaics (PV)381.50.87303.71.32.7 × 10−101.70.0054370.141.82.31 × 10−81003.8102.74.24.13.84.3
7Hydropower (Storage Dam)104.80.2743.51.74 × 10−111.40.0003540.003.23.51 × 10−928502.4103.04.83.23.12.1
8IGCC with CCS105.50.182053.02.71.4 × 10−93.50.0229.77.873.63.46 × 10−8434471.9703.22.72.72.63.3
9GTCC with CCS87.80.181203.12.38.6 × 10−103.50.004518.67.443.53.19 × 10−8109551.9703.22.92.92.83.3
10Biomass244.90.237.03.32.00.00.00.0543.00.112.22.00.0522.02.5102.94.03.73.43.4

Appendix 2: Main Steps of Excel-Based Weighting Tool

Figure A1. Criteria sorting according to their level of importance.
Sustainability 07 10922 g009
Figure A2. Initial ranking for each level of importance.
Sustainability 07 10922 g010
Figure A3. Overall initial ranking of criteria.
Sustainability 07 10922 g011
Figure A4. Overall results based on the pairwise comparisons.
Sustainability 07 10922 g012
Figure A5. Consistency check.
Sustainability 07 10922 g013

References

  1. Pohekar, S.; Ramachandran, M. Application of Multi-Criteria Decision Making in Sustainable Energy Planning—A Review. Renew. Sustain. Energy Rev. 2003, 8, 365–381. [Google Scholar]
  2. Kowalski, K.; Stagl, S.; Madlener, R.; Omann, I. Sustainable energy futures: Methodological challenges in combining scenarios and participatory multi-criteria analysis. Eur. J. Oper. Res. 2009, 197, 1064–1074. [Google Scholar]
  3. Braune, I.; Pinkwart, A.; Reeg, M. Application of Multi-Criteria Analysis for the Evaluation of Sustainable Energy Systems—A Review of Recent Literature. In Proceedings of the 5th Dubrovnic Conference on Sustainable Development of Energy, Water and Environment Systems, Dubrovnik, Croatia, 30 September–3 October 2009.
  4. Chatzimouratidis, A.; Pilavachi, P. Multicriteria evaluation of power plants impact on the living standard using the analytic hierarchy process. Energy Policy 2008, 36, 1074–1089. [Google Scholar]
  5. Evans, A.; Strezov, V.; Evans, T.J. Assessment of sustainability indicators for renewable energy technologies. Renew. Sustain. Energy Rev. 2009, 13, 1082–1088. [Google Scholar]
  6. Shen, Y.-C.; Lin, G.; Li, K.-P.; Yuan, B. An assessment of exploiting renewable energy sources with concerns of policy and technology. Energy Policy 2010, 38, 4604–4616. [Google Scholar]
  7. Grafakos, S.; Flamos, A.; Oikonomou, V.; Zevgolis, D. Multi-Criteria Analysis Weighting Methodology to Incorporate Stakeholders’ Preferences in Energy and Climate Policy Interactions. Int. J. Energy Sector Manag. 2010, 4, 434–461. [Google Scholar]
  8. Cinelli, M.; Coles, S.; Kirwan, K. Analysis of the potentials of multi criteria decision analysis methods to conduct sustainability assessment. Ecol. Indic. 2014, 46, 138–148. [Google Scholar] [CrossRef]
  9. Haralambopoulos, D.A.; Polatidis, H. Renewable energy projects: Structuring a multi-criteria group decision-making framework. Renew. Energy 2003, 28, 961–973. [Google Scholar] [CrossRef]
  10. Beccali, M.; Cellura, M.; Mistretta, M. Decision making in energy planning: The ELECTRE method at regional level for the diffusion of renewable energy technology. Renew. Energy 2003, 28, 2063–2087. [Google Scholar] [CrossRef]
  11. Cavallaro, F.; Ciraolo, L. A Multi-criteria approach to evaluate wind energy plants on an Italian island. Energy Policy 2005, 33, 235–244. [Google Scholar] [CrossRef]
  12. Gamboa, G.; Munda, G. The problem of windfarm location: A social multi-criteria evaluation framework. Energy Policy 2007, 35, 1564–1583. [Google Scholar] [CrossRef]
  13. Burton, J.; Hubacek, K. Is small beautiful? A multicriteria assessment of smallscale energy technology applications in local governments. Energy Policy 2007, 35, 6402–6412. [Google Scholar] [CrossRef]
  14. Loken, E.; Botterud, A.; Hoken, A. Use of the equivalent attribute technique in multi-criteria planning of local energy systems. Eur. J. Oper. Res. 2009, 197, 1075–1083. [Google Scholar] [CrossRef]
  15. Tsoutsos, T.; Drandaki, M.; Frantzeskaki, N.; Iosifidis, E.; Kiosses, I. Sustainability Energy Planning by Using Multi-Criteria Analysis Application in the Island of Crete, Greece. Energy Policy 2009, 37, 1587–1600. [Google Scholar] [CrossRef]
  16. Trutnevyte, E.; Stauffacher, M.; Scholz, R. Supporting energy initiatives in small communities by linking visions with energy scenarios and multi-criteria assessment. Energy Policy 2011, 39, 7884–7895. [Google Scholar] [CrossRef]
  17. Mourmouris, J.C.; Potolias, C. A Multi-criteria methodology for energy planning and developing energy sources at a regional level: A case study Thassos, Greece. Energy Policy 2013, 52, 522–530. [Google Scholar] [CrossRef]
  18. Kaldellis, J.; Anestis, A.; Koronaki, I. Strategic planning in the electricity generation sector through the development of an integrated Delphi-based multi-criteria evaluation model. Fuel 2013, 106, 212–218. [Google Scholar] [CrossRef]
  19. Begic, F.; Afgan, N.H. Sustainability assessment tool for the decision making in selection of energy system—Bosnian case. Energy 2007, 32, 1979–1985. [Google Scholar] [CrossRef]
  20. Topcu, Y.I.; Ulengin, F. Energy for the future: An integrated decision aid for the case of Turkey. Energy 2004, 9, 137–154. [Google Scholar] [CrossRef]
  21. Diakoulaki, D.; Grafakos, S. Multi-criteria Analysis. In European Commission ExternE—Externalities of Energy: Extension of Accounting Framework and Policy Applications; Directorate—General for Research: Luxembourg, 2004. [Google Scholar]
  22. Stagl, S. Multicriteria evaluation and public participation: The case of UK energy policy. Land Use Policy 2006, 23, 53–62. [Google Scholar] [CrossRef]
  23. Madlener, R.; Kowalski, K.; Stagl, S. New ways for an integrated valuation of national energy scenarios: The case of renewable energy use in AusOtria. Energy Policy 2007, 35, 6060–6074. [Google Scholar] [CrossRef]
  24. Doukas, H.; Andreas, B.; Psarras, J. Multi-criteria decision aid for the formulation of sustainable technological energy priorities using linguistic variables. Eur. J. Oper. Res. 2007, 182, 844–855. [Google Scholar] [CrossRef]
  25. San Cristobal, J.R. Multi-criteria decision-making in the selection of a renewable energy project in Spain: The Vikor method. Renew. Energy 2011, 36, 498–502. [Google Scholar] [CrossRef]
  26. Kaya, T.; Kahraman, C. Multicriteria decision making in energy planning using a modified fuzzy TOPSIS methodology. Expert Syst. Appl. 2011, 38, 6577–6585. [Google Scholar] [CrossRef]
  27. Sliogeriene, J.; Turskis, Z.; Streimikiene, D. Analysis and choice of energy generation technologies: The multiple criteria assessment on the case study of Lithuania. Energy Proc. 2013, 32, 11–20. [Google Scholar] [CrossRef]
  28. Makowski, M.; Granat, J.; Ren, H.; Schenler, W.; Hirschberg, S. Requirement Analysis and Implementation of Multi Criteria Analysis in the NEEDS Project; International Institute for Applied Systems Analysis: Laxenburg, Austria, 2009. [Google Scholar]
  29. Gallego Carrera, D.; Mack, A. Sustainability assessment of energy technologies via social indicators: Results of a survey among European energy experts. Energy Policy 2010, 38, 1030–1039. [Google Scholar] [CrossRef]
  30. Schenler, W.; Hirschberg, S.; Burgherr, P.; Policy and Science Interface (PSI); Makowskis, M.; International Institute for Applied Systems Analysis (IIASA); Grant, J.; Polish National Institute of Technologies. New Energy Externalities Developments for Sustainability Deliverable D10.2—RS 2b—Final Report on Sustainability Assessment of Advanced Electricity Supply Options; New Energy Externalities Developments for Sustainability (NEEDS): Brussels, Belgium, 2009. [Google Scholar]
  31. Hirschberg, S.; Bauer, C.; Burgherr, P.; Dones, R.; Schenler, W.; Bachmann, T.; Gallego Carrera, D. New Energy Externalities Developments for Sustainability Deliverable D3.1—RS2b—Environmental, Economic and Social Criteria and Indicators for Sustainability Assessment of Energy Technologies; New Energy Externalities Developments for Sustainability (NEEDS): Brussels, Belgium, 2007. [Google Scholar]
  32. Hirschberg, S.; Bauer, C.; Burgherr, P.; Dones, R.; Simons, W.; Schenler, W.; Bachman, T.; Gellego Carrera, D. New Energy Externalities Developments for Sustainability Deliverable D3.2—RS 2b—Final Set of Sustainability Criteria and Indicators for Assessment of Electricity Supply Options; New Energy Externalities Developments for Sustainability (NEEDS): Brussels, Belgium, 2008. [Google Scholar]
  33. Bell, M.L.; Hobbs, B.F.; Ellis, H. The use of multi-criteria decision-making methods in the integrated assessment of climate change: Implications for IA practitioners. Socio. Econ. Plan. Sci. 2003, 37, 289–316. [Google Scholar] [CrossRef]
  34. Borges, P.C.; Villavicencio, A. Avoiding academic and decorative planning in GHG emissions abatement studies with MCDA: The Peruvian case. Eur. J. Oper. Res. 2004, 152, 641–654. [Google Scholar] [CrossRef]
  35. Fischoff. Handbook of Environmental Economics; Volume 2, Mäler, K.-G., Vincent, J.R., Eds.; Elsevier B.V.: Amsterdam, The Netherlands, 2005. [Google Scholar]
  36. Lichtenstein, S.; Slovic, P. (Eds.) The Construction of Preference; Cambridge University Press: Cambridge, UK, 2006.
  37. Norton, B.G.; Costanza, R.; Bishop, R. The Evolution of Preferences: Why “Sovereign” Preferences May Not Lead to Sustainable Policies and What to Do about It. Ecol. Econ. 1998, 24, 193–212. [Google Scholar] [CrossRef]
  38. Gregory, R.; Slovic, P. A constructive approach to environmental valuation. Ecol. Econ. 1997, 21, 175–181. [Google Scholar] [CrossRef]
  39. Riabacke, M.; Danielson, M.; Ekenberg, L. State-of-the-Art Prescriptive Criteria Weight Elicitation. Adv. Dec. Sci. 2012. [Google Scholar] [CrossRef]
  40. Grafakos, S.; Flamos, A.; Oikonomou, V.; Zevgolis, D. Integrating environmental, socio-political, economic and technological dimensions for the assessment of climate policy instruments. In The Economic, Social and Political Elements of Climate Change; Leal Filho, W., Ed.; Springer Verlag: Berlin, Germany, 2011; pp. 623–648. [Google Scholar]
  41. Roth, S.; Hirschberg, S.; Bauer, C.; Burgherr, P.; Dones, R.; Heck, T.; Schenler, W. Sustainability of electricity supply technology portfolio. Ann. Nuclear Energy 2009, 36, 409–416. [Google Scholar] [CrossRef]
  42. Cloquell-Ballester, V.A.; Monterde-Diaz, R.; Santamarina-Siurana, M.C. Indicators validation for the improvement of environmental and social impact quantitative assessment. Environ. Impact Assess. Rev. 2006, 26, 79–105. [Google Scholar] [CrossRef]
  43. Hajkowicz, S.; Young, M.; Wheeler, S.; MacDonald, D.H.; Young, D. Supporting Decisions, Understanding Natural Resource Management Assessment Techniques, a Report to the Land and Water Resources Research and Development Corporation; CSIRO Land and Water: Adelaide, SA, Australia, 2000. [Google Scholar]
  44. Belton, V.; Stewart, T. Multiple Criteria Decision Analysis: An Integrated Approach; Kluwer Academic Publishers: Boston, MA, USA, 2002. [Google Scholar]
  45. Keeney, R.; Gregory, R. Selecting Attributes to Measure the Achievement of Objectives. Oper. Res. 2005, 53, 1–11. [Google Scholar] [CrossRef]
  46. Projected Costs of Generating Electricity, 2010 Edition. Available online: https://www.iea.org/publications/freepublications/publication/projected_costs.pdf (accessed on 30 July 2015).
  47. Ragwitz, M.; Schade, W.; Breitschopf, B.; Walz, R.; Helfrich, N. The Impact of Renewable Energy Policy on Economic Growth and Employment in the European Union 2009. Available online: http://ec.europa.eu/energy/renewables/studies/doc/renewables/2009_employ_res_report.pdf (accessed on 30 July 2015).
  48. Wei, M.; Patadia, S.; Kammena, D.M. Putting renewable sand energy efficiency to work: How many jobs can the clean energy industry generate in the US? Energy Policy 2010, 38, 919–931. [Google Scholar] [CrossRef]
  49. Paul Scherrer Institut (PSI). Facts for the Energy Decisions of Tomorrow, Energie-Spiegel, No. 20; Paul Scherrer Institut (PSI): Villigen, Switzerland, 2010. [Google Scholar]
  50. McDonald, R.I.; Fargione, J.; Kiesecker, J.; Miller, W.M.; Powell, J. Energy sprawl or energy efficiency: Climate policy impacts on natural habitat for the United States of America. PLoS ONE 2009, 4, e6802. [Google Scholar] [CrossRef] [PubMed]
  51. Andrews, C.J.; Dewey-Mattia, L.; Schechtman, J.M.; Mayr, M. Alternative energy sources and land use. In Climate Change and Land Policies; Ingram, G.K., Hong, Y.H., Eds.; Lincoln Institute of Land Policy: Cambridge, MA, USA, 2011. [Google Scholar]
  52. Streimikiene, D. Comparative assessment of future power generation technologies based on carbon price development. Renew. Sustain. Energy Rev. 2010, 14, 1283–1292. [Google Scholar]
  53. Grafakos, S.; Flamos, A. Assessing low carbon energy technologies against Sustainability and Resilience criteria: Results of a European experts survey. Int. J. Sustain. Energy 2015. [Google Scholar] [CrossRef]
  54. Miller, G.A. The magical number seven, plus or minus two: Some limits on our capacity for processing information. Psychol. Rev. 1956, 63, 81–97. [Google Scholar] [CrossRef] [PubMed]
  55. Tobiszewski, M.; Orłowski, A. Multicriteria decision analysis in ranking of analytical procedures for aldrin determination in water. J. Chromatogr. A 2015, 1387, 116–122. [Google Scholar] [CrossRef] [PubMed]
  56. Saaty, T.L. Concepts, theory, and techniques rank generation, preservation and reversal in the analytic hierarchy decision process. Decis. Sci. 1987, 18, 157–177. [Google Scholar] [CrossRef]
  57. Akadiri, P.O.; Olomolaiye, P.O. Development of sustainable assessment criteria for building materials selection. Eng. Construct. Arch. Manag. 2012, 19, 666–687. [Google Scholar] [CrossRef]
  58. Furr, R.M. Scale Construction and Psychometrics for Social and Personality Psychology; SAGE Publications Ltd.: London, UK, 2011. [Google Scholar]
  59. Barron, F.; Barrett, B.E. Decision Quality Using Ranked Attribute Weights. Manag. Sci. 1996, 42, 1515–1523. [Google Scholar] [CrossRef]
  60. Roszkowska, E. Rank ordering criteria weighting methods—A comparative overview. Optimum. Stud. Ekono. 2013, 5, 65. [Google Scholar]
  61. Stillwell, W.G.; Seaver, D.A.; Edwards, W. A Comparison of Weight Approximation Techniques in Multiattribute Utility Decision-Making. Organ. Behav. Hum. Perform. 1981, 28, 62–77. [Google Scholar] [CrossRef]
  62. Borcherding, K.; Eppel, T.; von Winterfeldt, D. Comparison of weighting judgements in multiattribute utility measurement. Manag. Sci. 1991, 37, 1603–1619. [Google Scholar] [CrossRef]
  63. Kaldellis, J.; Kapsali, M.; Kaldelli, E.; Katsanou, E. Comparing recent views of public attitude on wind energy, photovoltaic and small hydro applications. Renew. Energy 2013, 52, 197–208. [Google Scholar] [CrossRef]

