Article

Addressing the Impact of Environmental Xenobiotics in Coal-Fired Flue Gas

by
Cornelia A. Bulucea
1,*,†,
Marc A. Rosen
2,†,
Nikos E. Mastorakis
3,†,
Carmen A. Bulucea
4,†,
Corina C. Brindusa
4,† and
Andreea C. Jeles
5,†
1
Faculty of Electrical Engineering, University of Craiova, Craiova 200440, Romania
2
Faculty of Engineering and Applied Science, University of Ontario Institute of Technology, Oshawa, ON L1H 7K4, Canada
3
Technical University of Sofia, Industrial Engineering Department, Sofia, Bulgaria & Military Institutions of University Education (ASEI), Hellenic Naval Academy, Piraeus 18539, Greece
4
University of Medicine and Pharmacy of Craiova, Craiova 200349, Romania
5
Technical College of Arts and Crafts "Constantin Brancusi" of Craiova, Craiova 200135, Romania
*
Author to whom correspondence should be addressed.
These authors contributed equally to this work.
Sustainability 2015, 7(3), 2678-2694; https://doi.org/10.3390/su7032678
Submission received: 20 December 2014 / Revised: 21 February 2015 / Accepted: 27 February 2015 / Published: 5 March 2015

Abstract

:
Dangerous and unstable situations can result from the presence of environmental xenobiotics since their harmful effects on humans and ecosystems are often unpredictable, and building awareness of the environmental risk should be a main concern of humankind. The environmental xenobiotics in the flue gas from a fossil fuel-fired electrical generating station, such as particulate matter (PM), sulfur dioxide (SO2), nitrogen oxides (NOx), and carbon dioxide (CO2), are analyzed in this study, since these xenobiotics are persistent pollutants. Mathematical models of the environmental pollutant vector, estimating the emission factors specific to fossil fuel combustion, are applied to the operation of thermal units in the Turceni electrical generating station, each of which produces a net electrical power of 330 MW. For each stack gas component in the pollutant vector, emission factors and pollutant concentrations are determined. A pattern is also examined depicting the mathematically modelled processes of resonant absorption of an environmental xenobiotic harmonic oscillation by an organism modulated as an absorbing oscillator structure. The xenobiotic concentration degree is represented through a spatial concentration vector, which allows further modelling and simulation of the oscillating regime of environmental xenobiotic absorption.

1. Introduction

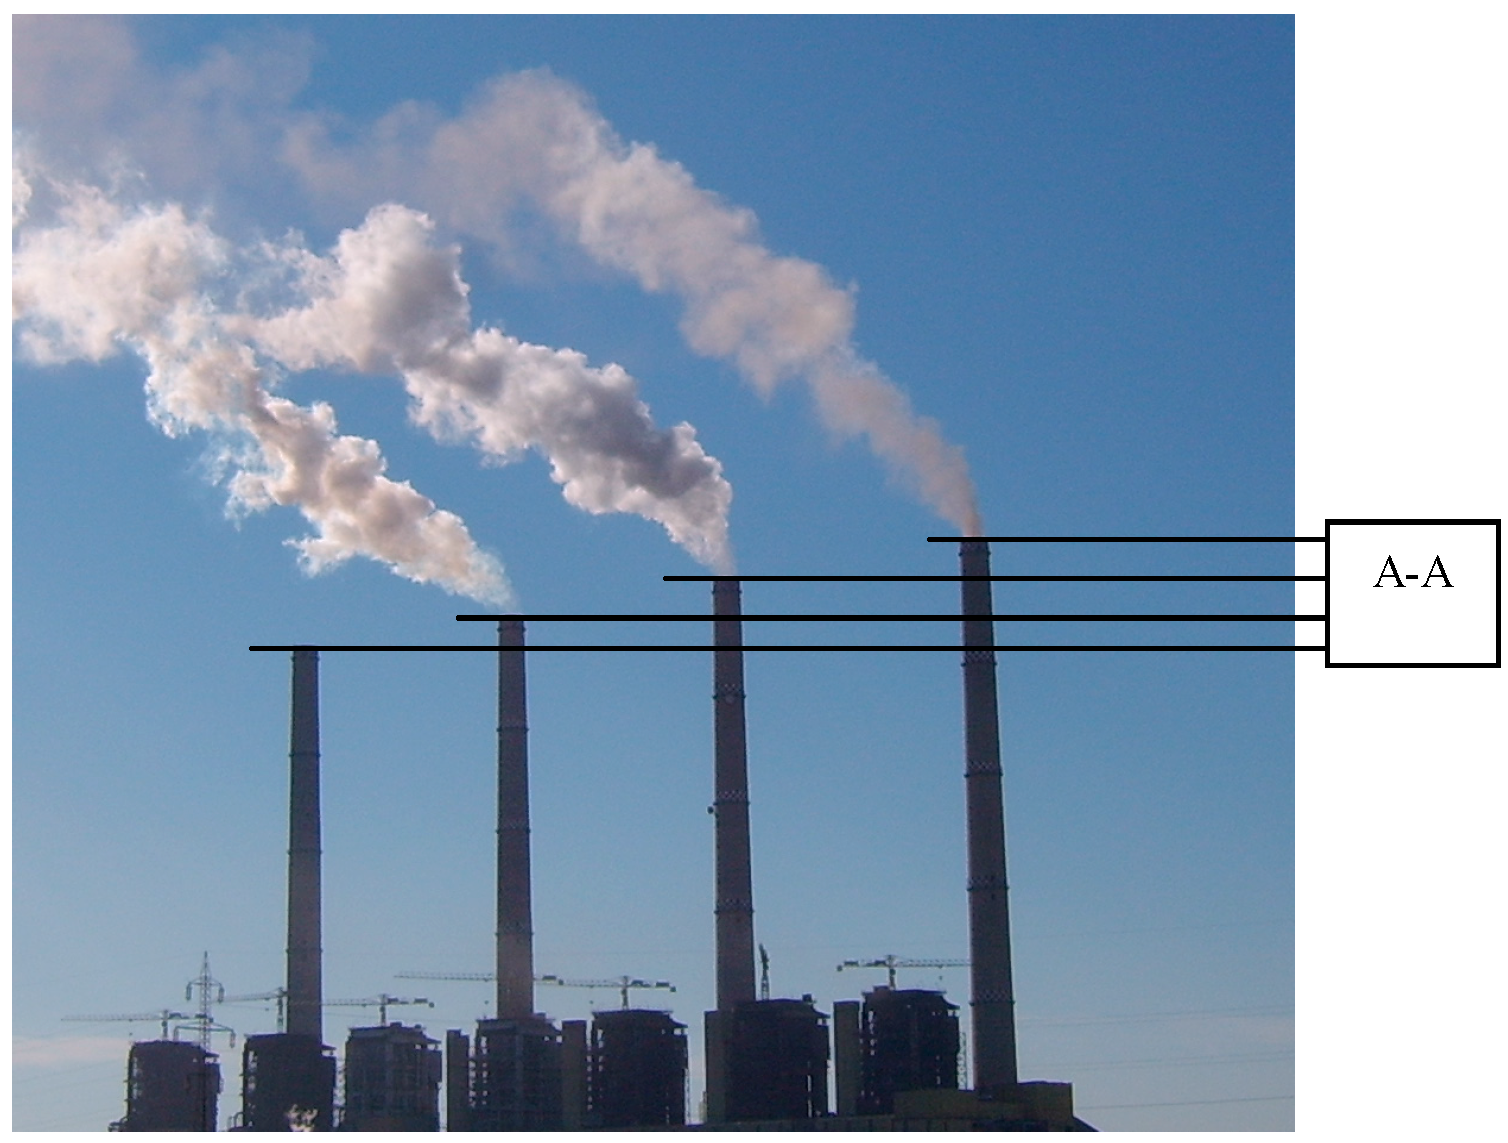
Thermoelectric power generation in a coal-fired plant involves the conversion of thermal energy to electrical energy. Coal is used to heat a liquid to produce a high pressure vapour (usually water is heated to produce steam) which is then expanded through a turbine that drives an electric generator [1,2,3]. The combustion or flue gas is emitted to the outside through a chimney. Flue gas is usually composed of carbon dioxide, water vapour and nitrogen, as well as sulfur oxides, nitrogen oxides, particulate matter and carbon monoxide [1,2,3,4].
It is increasingly accepted globally that, within the present industrial metabolism, electric and thermal energy generation, as a main consumer of fossil fuels in general and coal in particular, is causing environmental problems because of emissions [1,5,6]. As a major source of sulfur oxides, coal-fired electrical generating stations represent a large contributor to acid precipitation. Coal-fired industrial operations are also a significant source of nitrogen oxides, with an impact comparable to that of transportation [4,5,6]. Hence, the combustion of coal strongly contributes to acid precipitation and climate change associated with global warming [5], due to the high carbon content of coal which, in turn, causes CO2 emissions.
Furthermore, the health of humans and other life forms is impacted by burning coal in electrical generating stations, and is a serious concern.
Over the last several decades, the term xenobiotic has become increasingly accepted as relating to environmental impact [7,8]. Environmental xenobiotics are substances foreign to a biological system, which did not exist in nature before their synthesis by humans. In this context, xenobiotics are persistent pollutants, and the components of flue gas fall within this scope. Dangerous and unstable situations can result from the presence of environmental xenobiotics since their harmful effects on humans and ecosystems are often unpredictable [7,8,9]. Hence, the immune system as a whole can be the target for xenobiotic induced toxicity, since environmental xenobiotics have the capacity to suppress the body’s defense against reactive chemicals and pathogenic microorganisms. This suppression can cause increased susceptibility to cancer or autoimmune diseases. Moreover, environmental xenobiotics may be associated with endocrine alterations in people and wildlife. Yet, few studies on environmental xenobiotics from energy systems have been reported, and more information is needed to avoid the potential problems they can cause. In this paper, therefore, we use mathematical models for the metabolism analysis of environmental xenobiotics represented by the environmental emissions (particulate matter, sulfur dioxide and nitrogen oxides) during the operation of coal-fired power stations.

2. Flue Gas Pollutant Vector for a Coal-Fired Electrical Generating Station

Flue gas monitoring during the operation of a coal-fired power plant is an essential step in assessing the impact of environmental xenobiotics. Here, we examine the case of the Turceni electrical generating station [4,10] in Romania, which is lignite-fired. Three distinct operating conditions are considered:
(1)
Operation of the Turceni power plant at 33.33% of the installed power capacity (i.e., at 660 MW), which corresponds to two thermoelectric units (n = 2) of 330 MW; flue gas from the two thermoelectric units pass through one chimney.
(2)
Operation of the Turceni power plant at 66.66% of the installed power capacity (i.e., at 1320 MW), which corresponds to four thermoelectric units (n = 4) of 330 MW; flue gas from the four thermoelectric units pass through two chimneys.
(3)
Operation of the Turceni power plant at full installed power capacity (i.e., at 1980 MW), which corresponds to six thermoelectric units (n = 6) of 330 MW; flue gas from the six thermoelectric units pass through three chimneys in this case.

2.1. Flue Gas Assessment with SEDD Methodology

This study deals with the flue gas pollutant vector, and the assessment of the pollutant emissions (as a source of environmental xenobiotics), from the Turceni power plant. We use the Strategy and Economic Development Division (SEDD) methodology, which is described in the Romanian Electrical Department as calculation method PE-1001 [11]. The methodology is based on the models that depict the emission factors for fuel combustion processes [12] and has been applied since 1994. For distinct pollutants, the emission factors are determined experimentally.
The flow rate of a pollutant released to the atmosphere EPol is determined (in kg/h) as [1,4,10,12]:
E P o l = B · H i C · e P o l
where B is the fuel flow rate (in kg/h), HiC is the lower calorific value of the fuel (in kJ/kg), and ePol is the emission factor (in kJ/kg).
The mass concentration of a pollutant released by combustion is determined (in mg/mN3) as:
C m P o l = E P o l · 10 6 / D G a z e
where DGaze is the volumetric flow rate of combustion gases (in mN3/h).
Mathematical models in the SEDD methodology have been used to depict emission factors for fuel combustion in the thermoelectric units of the Turceni power plant. The following operating conditions are assumed in this case study:
(1)
The fuel is lignite (a type of coal) with a lower calorific value H i L = 6280 kJ/kg and the following composition: sulfur S = 0.8%, carbon C = 20%, ash A = 25.5%, total moisture W = 45%, and other components (bringing the total to 100%).
(2)
The consumption rate of coal for a 330 MW thermoelectric unit is determined on the basis of the medium flow rate of pulverized coal by the 5 coal mills (5 × 92.6 t/h = 463 t/h), and accordingly the lignite flow rate is BL = 463 t/h.
(3)
Oil is utilized as a fuel support and has a lower calorific value H i P = 39,770 kJ/kg and the following composition: sulfur S = 3% and carbon C = 76%.
(4)
The consumption rate of oil for a 330 MW thermoelectric unit is BP = 10 × 103 kg/h.
The flue gas pollutant vector has four main environmental xenobiotic components: sulfur dioxide SO2, carbon dioxide CO2, particulate matter PM and nitrogen oxides NOx.

2.1.1. Component SO2 of Pollutant Vector

The SEDD methodology yields the following results: the emission factor for the pollutant SO2 by lignite combustion e L S O 2 [kg/kJ], the flow rate of SO2 from by lignite combustion E L S O 2 [kg/h], the emission factor for SO2 by oil combustion e P S O 2 [kg/kJ], the flow rate of SO2 from oil combustion E P S O 2 [kg/h], the total flow rate of SO2 from combustion E S O 2 [kg/h], and the mass concentration of pollutant SO2 from combustion C m S O 2 [ m g / m N 3 ] . In Table 1, the resulting data for this case study are listed for the xenobiotic component SO2 of the flue gas pollutant vector.
Table 1. Data for SO2 component of flue gas.
ParameterSymbolUnitFuel typeReference value (n = 1)Case I (n = 2)Case II (n = 4)Case III (n = 6)
Lignite: fuel flow rateBLkg/hlignite463 × 103926 × 1031852 × 1032778 × 103
Oil: fuel flow rateBPkg/hoil10 × 10320 × 10340 × 10360 × 103
Lignite: SO2 emission factoreLSO2kg/kJlignite2.04 × 10−62.04 × 10−62.04 × 10−62.04 × 10⁻⁶
Lignite: SO2 pollutant flow rateELSO2kg/hlignite593011.86023.72035.580
Oil: SO2 emission factorePSO2kg/kJoil1.51 × 10−61.51 × 10−61.56 × 10−61.51 × 10⁻⁶
Oil: SO2 pollutant flow rateEPSO2kg/hoil600120024003600
Total flow rate of SO2 pollutantESO2kg/hall fuels653013.06026.12039.180
Concentration of SO2 pollutantCmSO2mg/m3Nall fuels3840384038403840

2.1.2. Component CO2 of Pollutant Vector

Based on the same methodology, the resulting data for carbon dioxide are listed in Table 2.
Table 2. Data for CO2 component of flue gas.
ParameterSymbolUnitFuel typeReference value (n = 1)Case I (n = 2)Case II (n = 4)Case III (n = 6)
Lignite: fuel flow rateBLkg/hlignite463 × 103926 × 1031852 × 1032778 × 103
Oil: fuel flow rate Bpkg/hoil10 × 10320 × 10340 × 10360 × 103
Lignite: CO2 emission factor eLCO2kg/kJlignite116.8 × 10−6116.8 × 10−6116.8 × 10−6116.8 × 10−6
Lignite: CO2 pollutant flow rate ELCO2kg/hlignite33.96067.920135.840203.760
Oil: CO2 emission factor ePCO2kg/kJoil70.1 × 10−670.1 × 10−670.1 × 10−670.1 × 10⁻⁶
Oil: CO2 pollutant flow rate EPCO2kg/hoil27.88055.760111.520167.280
Total flow rate of CO2 pollutant ECO2kg/hall fuels61.840123.680247.360371.040
Concentration of CO2 pollutant CmCO2mg/m3Nall fuels36.38036.38036.38036.380

2.1.3. Component PM of Pollutant Vector

Table 3 shows the resulting data for the particulate matter (PM) component of the pollutant vector.
Table 3. Data for the particulate matter (PM) component of flue gas.
ParameterSymbolUnitFuel typeReference value (n = 1)Case I (n = 2)Case II (n = 4)Case III (n = 6)
Lignite: fuel flow rateBLkg/hlignite463 × 103926 × 1031852 × 1032778 × 103
Oil: fuel flow rateBPkg/hoil10 × 10320 × 10340 × 10360 × 103
Lignite: PM emission factorePMkg/kJlignite0.345 × 10−60.345 × 10−60.345 × 10−60.345 × 10⁻⁶
Lignite: PM pollutant flow rateEPMkg/hlignite1003200640126018
Concentration of PM pollutantCmPMmg/m3Nall fuels590590590590

2.1.4. Component NOx of Pollutant Vector

Based on the same methodology, the resulting data for nitrogen oxides are listed in Table 4.
Table 4. Data for NOx component of flue gas.
ParameterSymbolUnitFuel typeCase I (n = 2)Case II (n = 4)Case III (n = 6)
Lignite: fuel flow rateBLkg/hlignite926 × 1031852 × 1032778 × 103
Oil: fuel flow rateBPkg/hoil20 × 10340 × 10360 × 103
Lignite: NOx emission factore80LNOxkg/kJlignite2.44 × 10−72.44 × 10−72.44 × 10−7
Lignite: NOx pollutant flow rateELNOxkg/hlignite142028404260
Oil: NOx emission factore80PNOxkg/kJoil2.52 × 10−62.52 × 10−62.52 × 10−6
Oil: NOx pollutant flow rateEPNOxkg/hoil200400600
Total flow of NOx pollutantENOxkg/hall fuels162032404860
Concentration of NOx pollutantCmNOxmg/m3Nall fuels480480480

2.2. Projection in Mirror of Flue Gas Pollutant Vector

The flue gas pollutant vector is depicted [4,10,12,13,14] by origin, direction, sense and magnitude:
  • the pollutant vector origin is represented by the gases exiting from the power plant chimney;
  • the pollutant vector direction has a temporal character and is affected mainly by climatic factors, wind speed being the most important;
  • the pollutant vector sense is defined by the evacuation chimney for the combustion gases; and
  • the pollutant vector magnitude is determined by the concentration of pollutants and varies spatially, decreasing with increasing distance from the chimney.
The projection in mirror of the pollutant vector allows the evaluation of the mass concentration of ash in the flue gases leaving the chimney, at distances of several hundred meters [4,10,12,13,14]. The combustion gas inside the chimney represents the flue gas, which once it is dispersed into the air becomes an environmental pollutant vector. From the viewpoint of contaminating the surroundings, it is important to estimate the dispersion in the atmosphere of the pollutant components of the flue gas. One could accept an optical representation of the flue gas pollutant vector as a projection in mirror of the chimney flue gas, with the symmetry axis as the tangent to the top of stack (see Figure 1).
Figure 1. Symmetry axis A-A for combustion gas chimney. Combustion gas wedge α = 45°.
Sustainability 07 02678 g001
For this purpose, we note that the longitudinal section of a power station chimney has a trapezoidal shape, the chimney height is roughly 300 m, and on the chimney surface there are markings at intervals of 50 m. In line with same idea, one could note that the flue gas component concentrations increase with height of chimney. This approach permits the flue gas leaving the chimney (representing the environmental pollutant vector) to be equated to a symmetrical body like a truncated cone (see Figure 2).
Due to this optical analogy, on the truncated cone that models the flue gas exhausted by the chimney, we can establish iso-mass domains of ash (PM) concentration.
Note that the concentrations of ash and combustion gases are inversely proportional to the truncated cone height.
In the present case study of the 330 MW units of the Turceni thermoelectric generating station, the projection in mirror is developed for distances of 300 m (see Figure 2 and Table 5).
The distribution of iso-mass curves in the case of the projection in the mirror for isomorphic curves on the order of 100 m g / m N 3 in the flue gas is depicted in Figure 2.
Figure 2. Iso-mass curves: Iso500, Iso400, Iso300, Iso200, Iso100. (The colours in Figure 2 correlate with the colors in Table 5, which describe the distances on the iso-mass curves).
Sustainability 07 02678 g002
Table 5. Distribution of iso-mass curves in flue gas pollutant vector.
No.iso-mass curvesIso = iso-mass indicativeCm[mg/m3N] = maximum concentationk[m−2] = correction factorz − zc [m] = distance on iso-mass curve
1Iso5005005900.0000285
2Iso4004005900.00002135
3Iso3003005900.00002185
4Iso2002005900.00002235
5Iso1001005900.00002300
To determine the mass concentration evolution via the projection in mirror of the flue gas pollutant vector, patterns of diffusion predictions are developed [12,13,15] that permit appropriate comparisons with experimental data from laboratory tests.
To model the ascendant flue gas exhausted by the chimney in this paper according to the projection in mirror at a distance of 300 m, we use the pattern of probability density function (PDF), elaborated by Weil [13]. This model allows parameters to be input for phenomena that govern pollutant dispersion into the atmosphere. As an example, the overall nomogram for the mass concentration of ash-particulate matter from the Turceni power plant is depicted in Figure 3 when two thermal units are in operation (n = 2).
Figure 3. Overall nomogram of mass concentration for ash-particulate matter from the Turceni power plant (n = 2).
Sustainability 07 02678 g003
The simulation takes into account two variables:
  • the variable x which is represented by the distance on the iso-mass curve (z − zc) [m];
  • the variable y which is denoted by k = correction factor, with values in the range 10−5 to 10−4 [m−2].
Note also that: z [m] represents the calculation height of the flue gases leaving the chimney; zc [m] is the chimney height; and (z − zc) [m] is the distance on the iso-mass curve. The simulation result is the value of the multivariable function denoted by C [mg/m3] which represents the mass concentration remaining at the distance (z − zc) [m] from the flue gas chimney. Furthermore, Cm [mg/ m3] is the maximum mass concentration at the point in which the flue gases are leaving the chimney.

2.3. Testing Validation and Discussion

For the above mentioned conditions, to validate the acceptability of the results from the SEDD methodology, it is necessary to compare the simulation results with experimental data. For this purpose, we developed an experimental validation of the mathematical pattern evaluation of flue gas xenobiotic components using data obtained by the Calcination Evaluation Stand together with data from the Chemical Laboratory—Coal Section of the Turceni electrical generating station [10,12].
The concentrations of flue gas xenobiotics leaving the chimney as sulfur dioxide (SO2), carbon dioxide (CO2), particulate matter (PM) and nitrogen oxides (NOx) are depicted in Table 6, Table 7, Table 8 and Table 9, respectively.
Table 6. Testing data for SO2 xenobiotic component of flue gas.
ParameterSymbolUnitSample ISample IISample III
SO2 emission factoreLSO2kg/kJ2.02 × 10−62.06 × 10−62.1 × 10−6
Concentration of pollutant SO2 CmSO2mg/m3N380238783955
Table 7. Testing data for CO2 xenobiotic component of flue gas.
ParameterSymbolUnitSample ISample IISample III
CO2 emission factoreLCO2kg/kJ114.5 × 10−6119.1 × 10−6120.3 × 10−6
Concentration of pollutant CO2CmCO2mg/m3N35,65237,10837,471
Table 8. Testing data for PM xenobiotic component of flue gas.
ParameterSymbolUnitSample ISample IISample III
PM emission factorePMkg/kJ0.335 × 10−60.355 × 10−60.359 × 10−6
Concentration of pollutant PMCmPMmg/m3N572608614
Table 9. Testing data for NOx xenobiotic component of flue gas.
ParameterSymbolUnitSample ISample IISample III
NOx emission factoreLNOxkg/kJ2.41 × 10−72.49 × 10−72.51 × 10−7
Concentration of pollutant NOxCmNOxmg/m3N475490495
The analysis was carried out for three samples and, according to the data depicted as above, the following mean values are determined from burning lignite for each xenobiotic component of the flue gas pollutant vector:
(a)
Sulfur dioxide (SO2) xenobiotic: emission factor e L S O 2 = 2.06 × 10⁻⁶ kg/kJ; pollutant concentration C m S O 2 = 3878 mg/m3N; average error εmean ≤ 1%; maximum error εmax ≤ 3%.
(b)
Carbon dioxide (CO2) xenobiotic: emission factor e L C O 2 = 118 × 10−6 kg/kJ; pollutant concentration C m C O 2 = 36744 mg/m3N; average error εmean ≤ 1%; maximum error εmax ≤ 3%.
(c)
Particulate matter (PM) xenobiotic: emission factor ePM = 0.35 × 10⁻⁶ kg/kJ; pollutant concentration CmPM = 598 mg/m3N; average error εmean ≤ 1.5%; maximum error εmax ≤ 4%.
(d)
Nitrogen oxides (NOx) xenobiotic: emission factor e L N O x = 2.47 × 10⁻⁷ kg/kJ; pollutant concentration C m N O x = 487 mg/m3N; average error εmean ≤ 1.5%; maximum error εmax ≤ 3%.
The errors between the calculated and experimental results are within the range accepted by environmental regulations, supporting the reliability of SEDD methodology.

3. Linear Mathematical Model of Xenobiotics Absorption Process

Xenobiotics have been extended to the environment over the last several decades, with many studies [7,8,9] demonstrating that xenobiotics relate to environmental impact. This is especially valid in the context of pollutants, many of which are substances foreign to a biological system that did not exist in nature before their synthesis by humans.
Environmental xenobiotics are becoming increasingly problematic in medicine and environmental systems, since they are relatively new substances and difficult to categorize, and since it is challenging to assess their effects on human health and the environment [7,8].
As shown in previous sections, coal-fired power plants emit particulate matter, SO2, NOx as well as gases that undergo chemical reactions to form fine particles in atmosphere [3,4,5,14,16]. These reactive chemicals (particulate matter, sulfur dioxide and nitrogen oxides) represent environmental xenobiotics, which spread over hundreds to thousands of kilometers downwind of power plants. In addition to the environmental harm caused by greenhouse gases and other emissions, the air emissions of coal-fired power stations encompass a certain amount of toxic xenobiotics that result in significant numbers of human deaths and diseases [7,8,9]. Through exposure to these environmental xenobiotics, people can experience heart disease, respiratory illness and lung cancer, as well as such other health problems as adverse reproductive outcomes, infant death, chronic bronchitis, asthma, and other lung diseases [4,6,17]. As a consequence, the pollutant load from environmental xenobiotics concerns researchers in medical and environmental fields.
The immune system is extremely vulnerable and sensitive to modulation by environmental xenobitics. Various experimental assays can be performed to ascertain the immunotoxic potential of environmental xenobiotics, accounting for genetic factors, xenobiotic penetration route, and amount and duration of exposure, as well as the xenobiotic wave shape [7,8]. In this paper, we propose an approach for the analysis of xenobiotic metabolism using mathematical models and corresponding methods. Here, we focus on a pattern depicting mathematically modelled processes of resonant absorption of a xenobiotic harmonic oscillation by an organism modulated as an absorbing oscillator structure [18]. We represent the xenobiotic concentration degree through a spatial concentration vector, and model and simulate the oscillating regime of environmental xenobiotic absorption.
By analogy with thermal physics, where the temperature difference gives the sense and magnitude of the transferred energy, the main vector of behavioural analysis in the event of an environmental xenobiotic “attack” is represented by the xenobiotic concentration c(t). That is, to create a homogenous framework and problem definition, we address the percentage representation of the xenobiotic concentration through the spatial concentration vector c(t). The mathematic model depicting such a vector could be linear or non-linear, as evidenced by the relation between the system input and output [19]. Note that a linear pattern respects the superposition principle and the homogeneity property.
Consider a mathematical model with the input quantities x i ( t ) and the output quantities z i ( t ) . According to the superposition principle, the mathematical model is linear if the input x ( t ) = x 1 ( t ) + x 2 ( t ) determines an output z ( t ) = z 1 ( t ) + z 2 ( t ) . Also, one can define the homogeneity property if for an input α · x i ( t ) the resulting output is α · z i ( t ) , where α denotes the transfer coefficient or attenuation factor. Note that if we are dealing with nonlinear models, the pattern linearization through the tangent to the curve at an operation point can be achieved by developing a Taylor series of the function near this point.

4. Modelling and Simulation of Oscillating Regime of Environmental Xenobiotics Absorption

We have shown [14,18,20] that a mathematical model described by a differential equation of order 2 with concentration parameters [20,21] is adequate for a complex process of environmental xenobiotic absorption by a linear structure. We have defined a hypothetical situation in which, from an environmental xenobiotic source with harmonic behaviour, the xenobiotic is absorbed by the biological organism modelled as a system with a linear structure [18,20]. The xenobiotic concentration has been subsequently denoted z(t).
Within the structure of a modulated absorption system corresponding to the biological organism (the target of a xenobiotic), one can identify specific elements of xenobiotic compounds that are of a dissipating type or an accumulating type [18,20]. As stated earlier, a mathematical model depicting a xenobiotic absorption process could be a differential equation of order 2. Consequently, we have considered [18,20] an analogous pattern of physics, namely an electrical structure type RLC series circuit, where the accumulating elements are described by the capacity C and the inductance L, while the dissipating elements are characterized by the resistance R [18,20,21,22]. Note that we have considered a simplified hypothesis referring to a concentrated parameters circuit, connected to a harmonic source, with the possibility of defining the elements RLC in various ways.
The differential equation corresponding to this transient regime is as follows:
L C d 2 z d t 2 + R C d z d t + z = Z m sin ( ω t + ψ )
for which the simplified solution for xenobiotic concentration [18,20] is expressed as:
z ( t ) = Z m cos ω t Z m cos ω 0 t
This expression emphasizes the superposition of two oscillating components, with the harmonic xenobiotic pulsation ω and the biologic system pulsation ω0 = ωe, respectively.
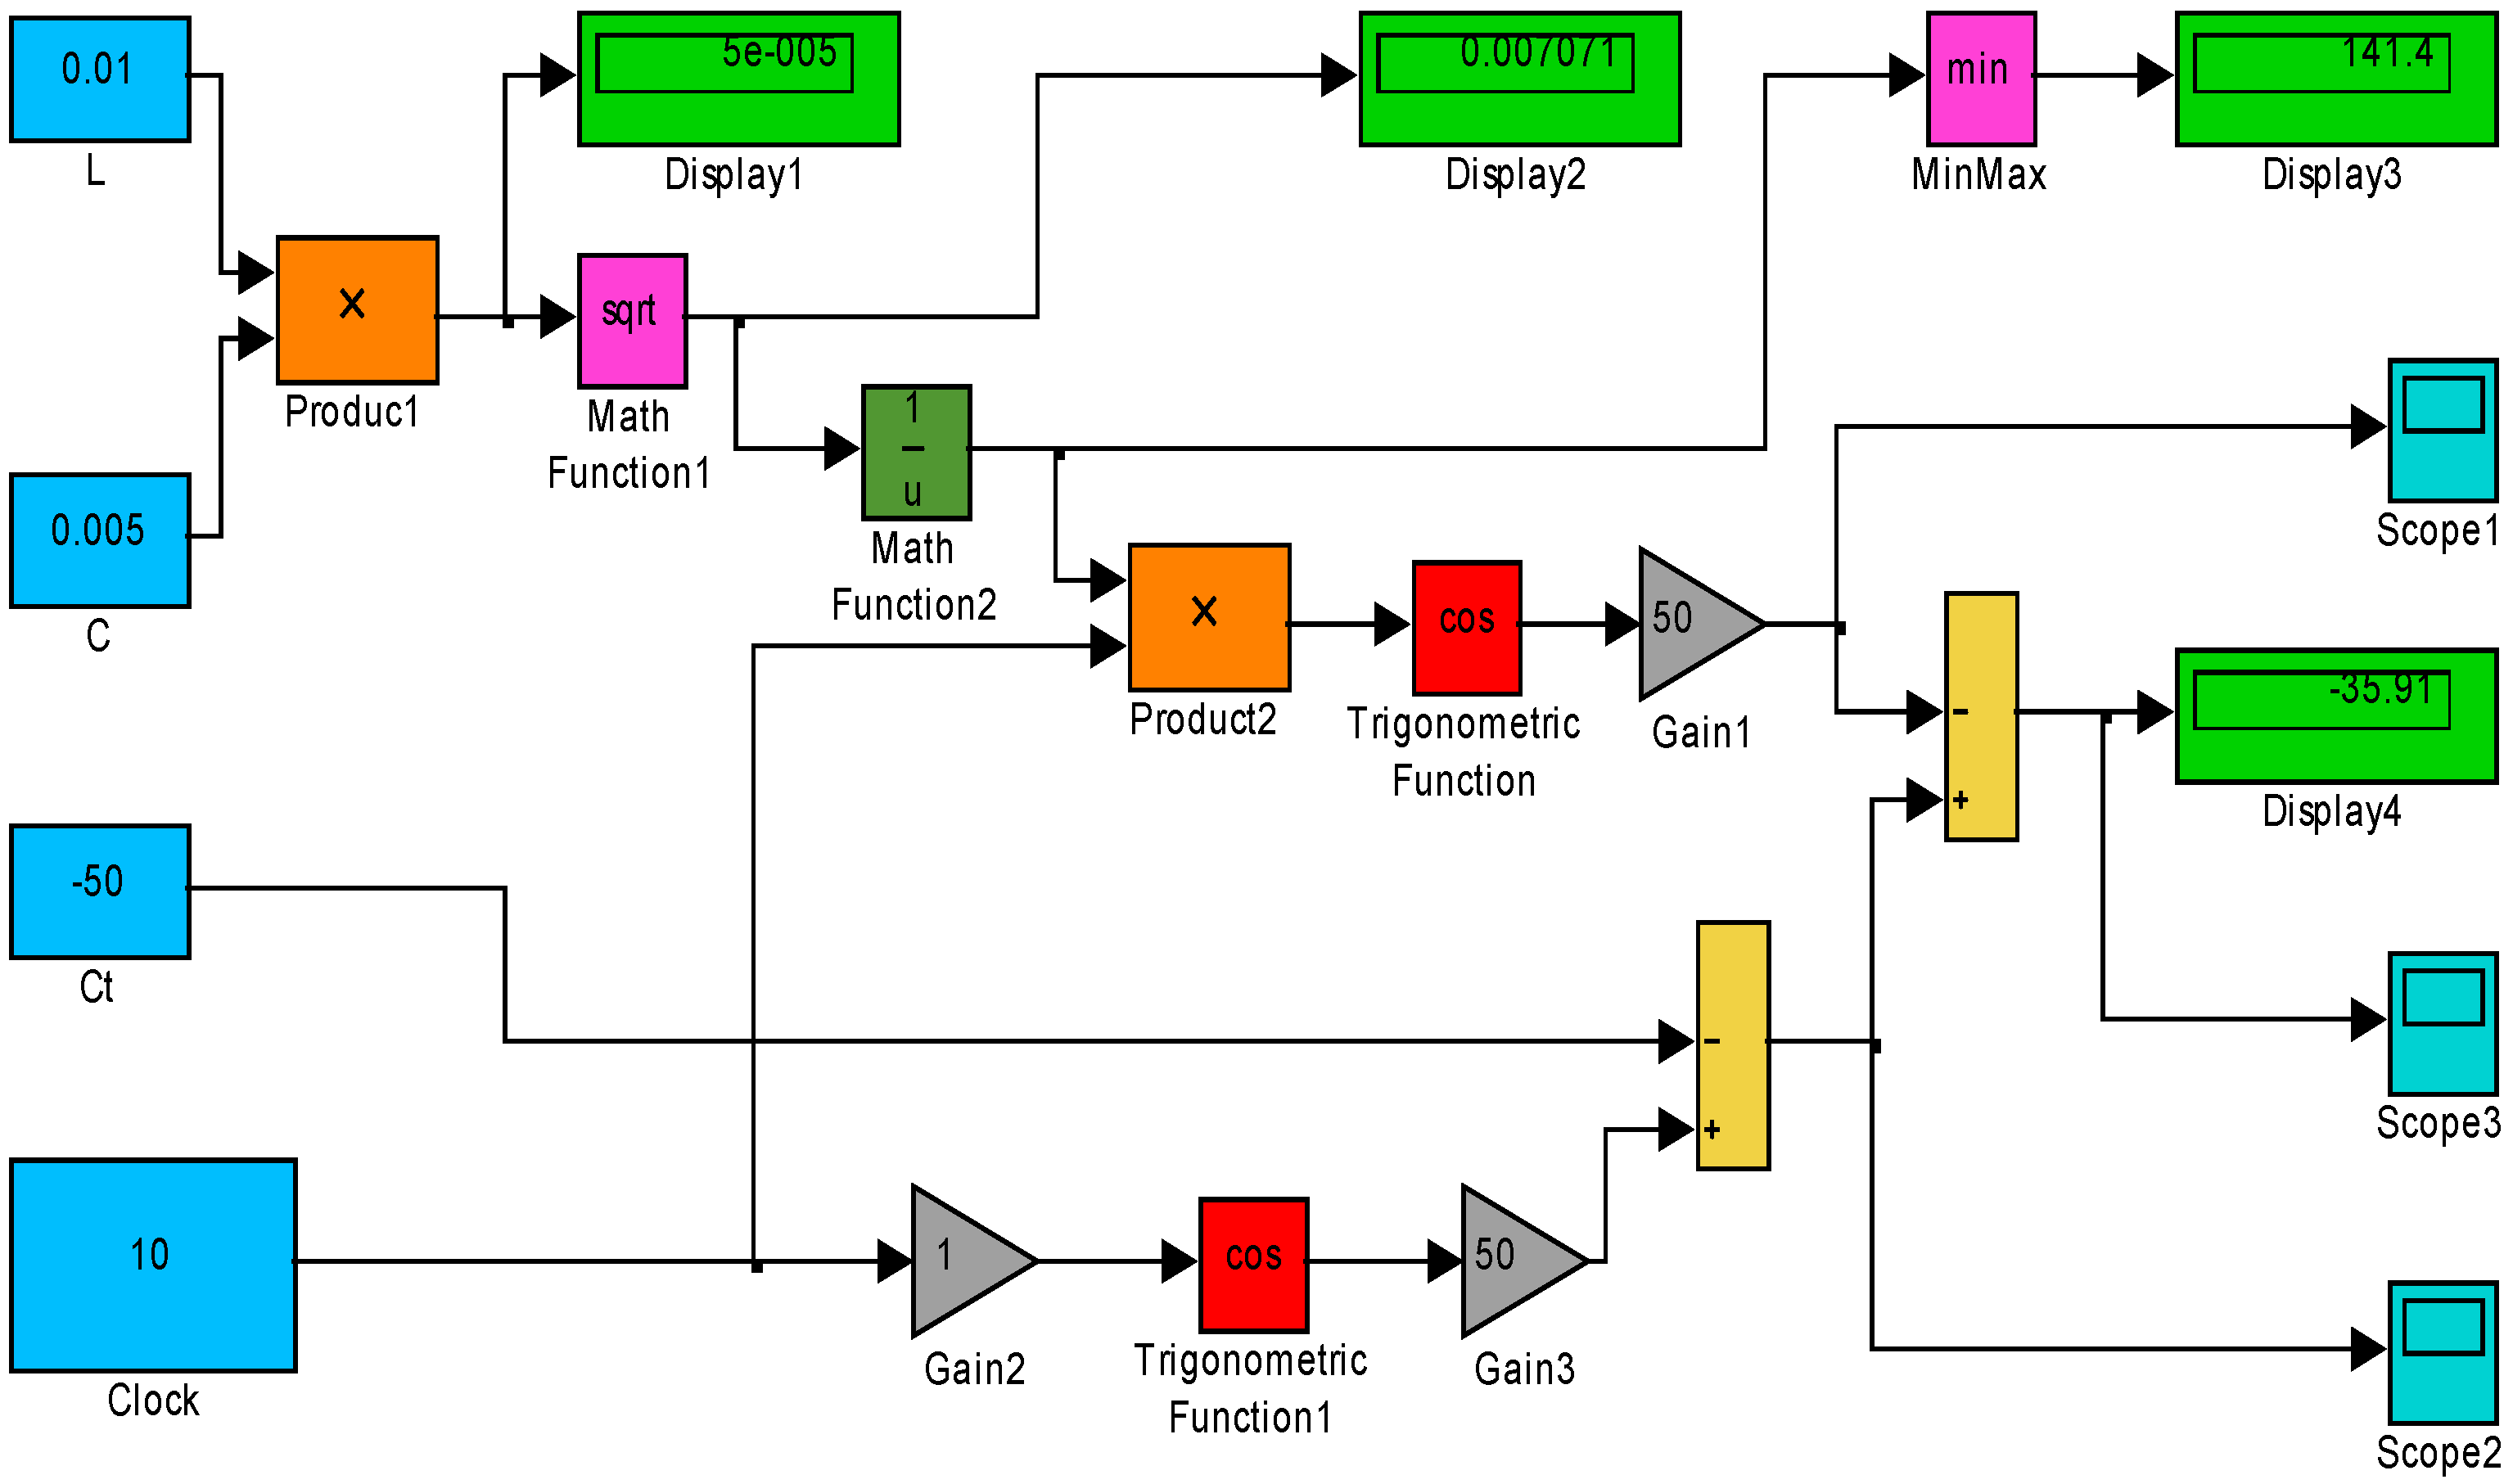
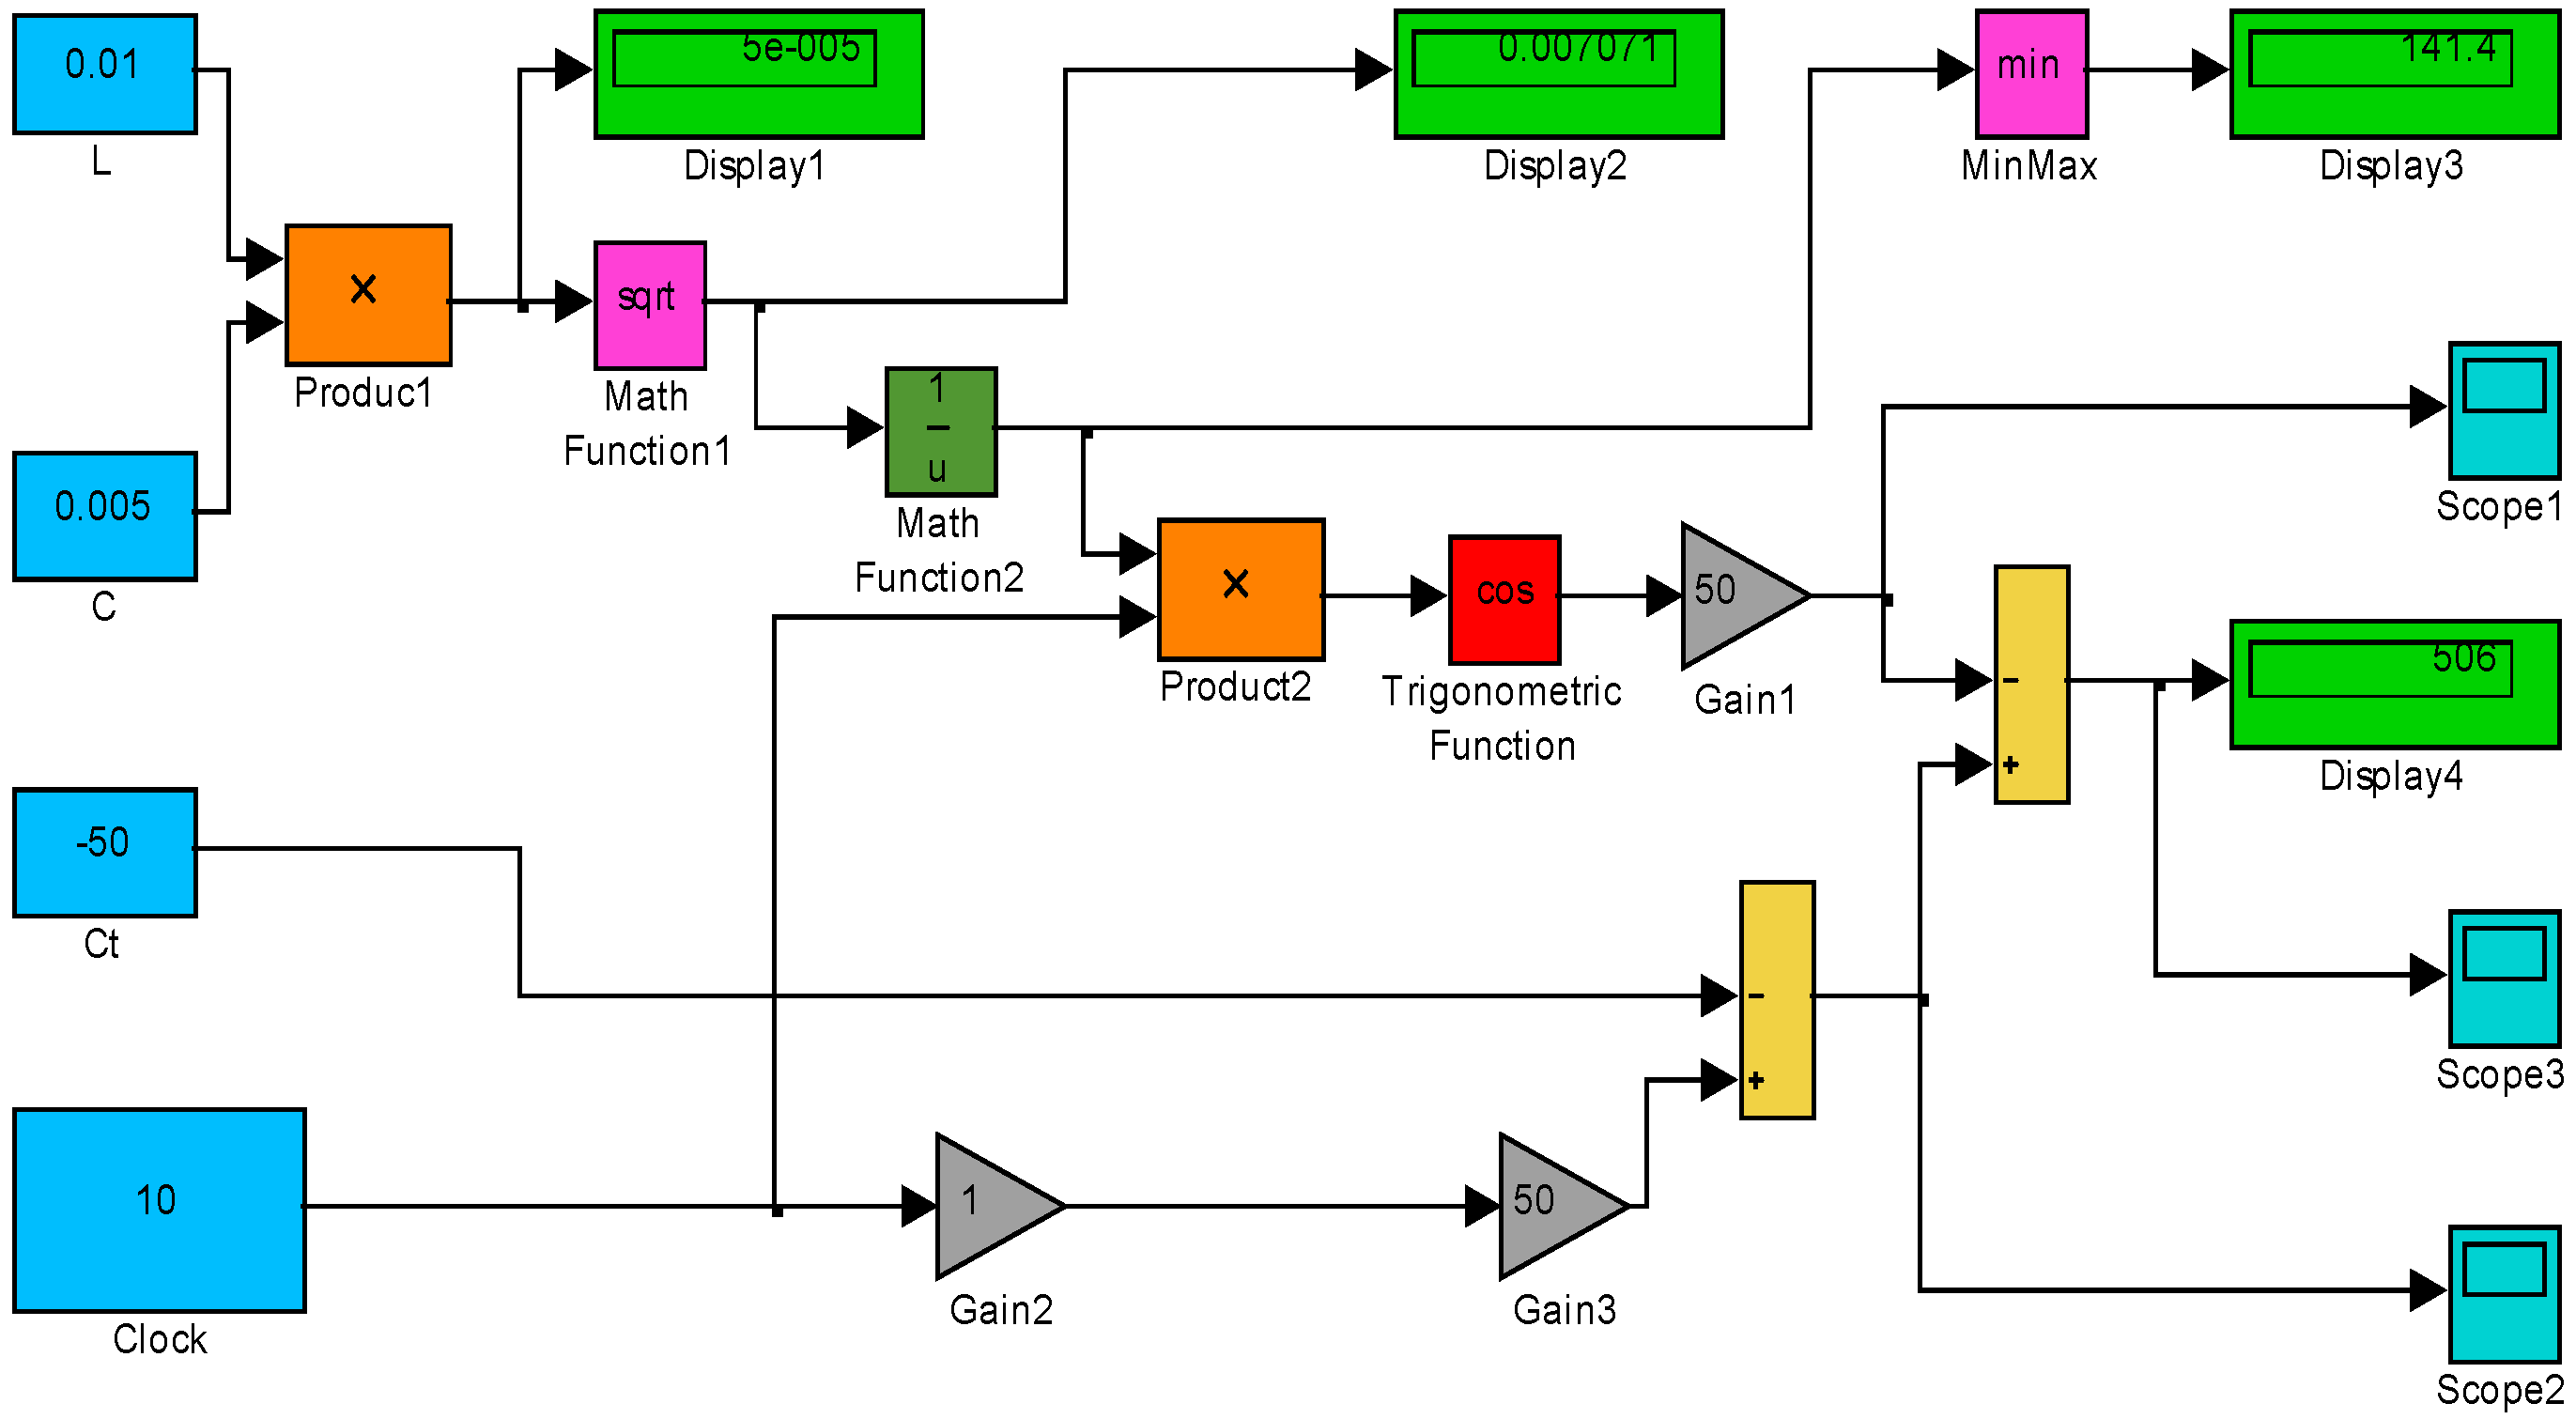
The mathematical modelling stage is followed by the simulation of specific phenomena, using appropriate software. For instance, one could use MATLAB software with SIMULINK and SimPowerSystems extensions. Here, we developed a SIMULINK model entailing specific blocks generated by the SIMULINK library.
The explicit Function (4) leads, based on the MATLAB-SIMULINK utility, to the simulation model for the spatial vector of concentration z(t), depicted in Figure 4. Based on the resulting simulation pattern, the representations of Figure 5, Figure 6 and Figure 7 are obtained.
Figure 4. Simulation model for spatial vector of concentration. Case 1.
Sustainability 07 02678 g004
Figure 5. Modulating signal obtained on the basis of absorption circuit elements. Case 1.
Sustainability 07 02678 g005
Figure 6. Harmonic oscillation of xenobiotic. Case 1.
Sustainability 07 02678 g006
Figure 7. Simulation diagram for spatial vector of concentration z ( t ) . Case 1.
Sustainability 07 02678 g007
Figure 5 depicts the modulating signal obtained on the basis of absorption circuit elements corresponding to the biological system with resonant pulsation ω0.
In Figure 6, the xenobiotic harmonic oscillation, with the pulsation ω, is presented.
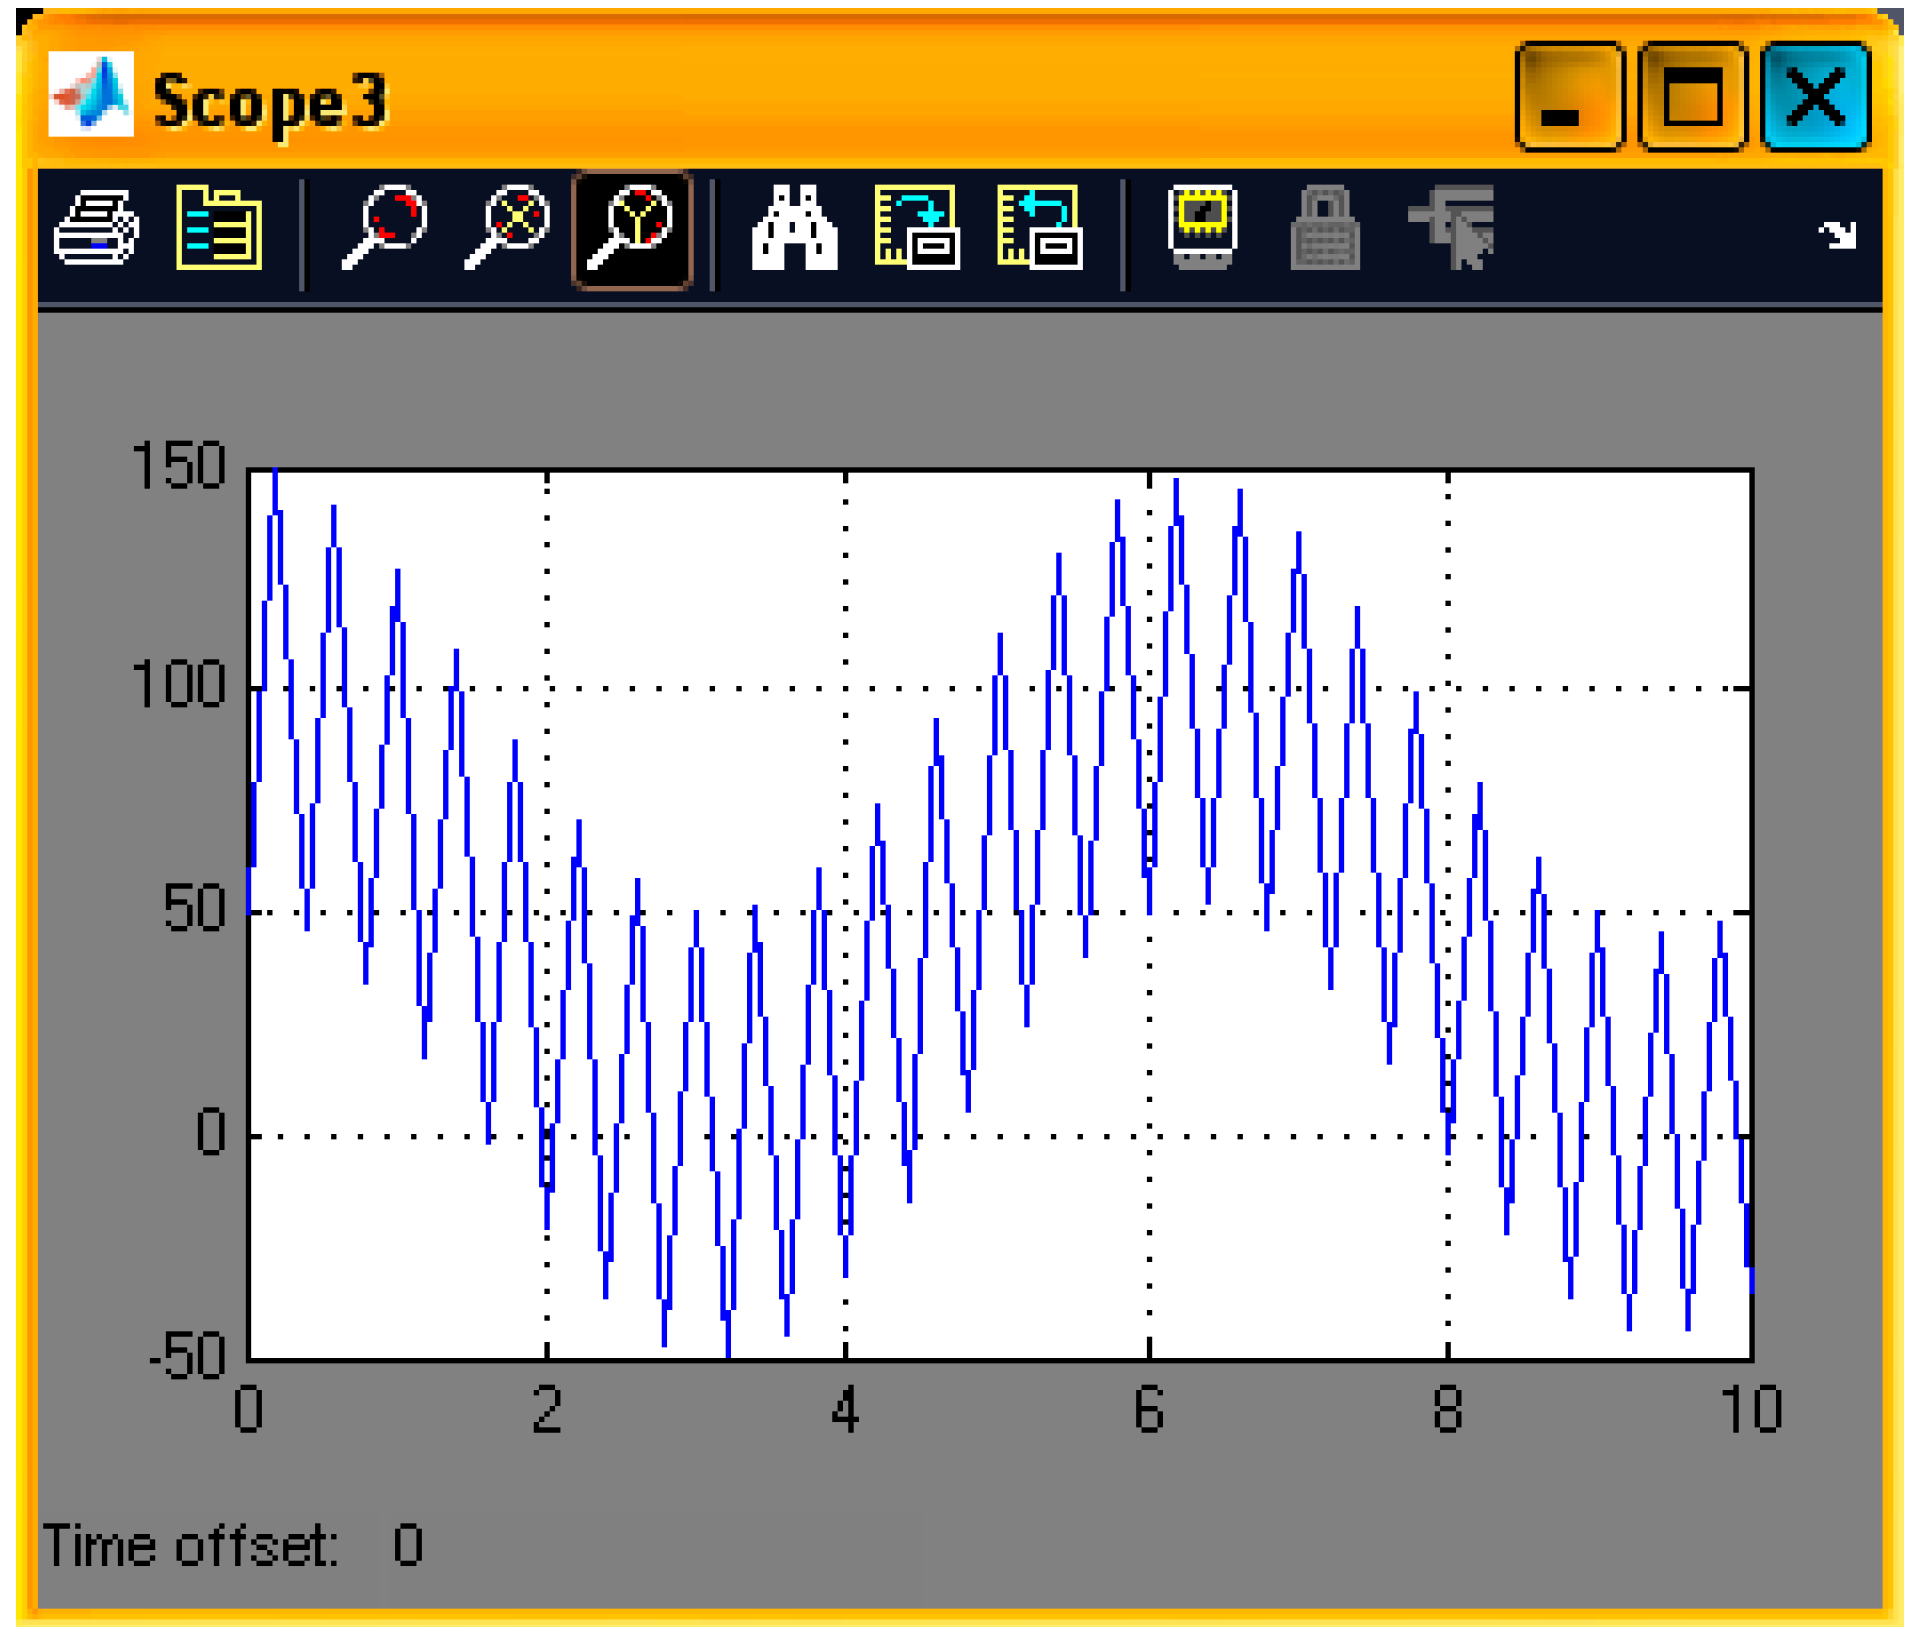
Figure 7 shows the simulation diagram for the spatial vector of concentration z(t), as resultant oscillation wave depicting the resonant absorption process of the environmental xenobiotic. This representation shows that, in the particular case of the resonant absorption of the harmonic environmental xenobiotic, the output can be amplified up to three times relative to the input. Note that to maintain a good degree of generality in this study we use quantities with relative values.
The results determine the variation in time of the spatial concentration vector z(t) as periodic, with the wave shape determined by taking into consideration a modulation of the main excitation harmonic provided by the xenobiotic, and the resulting high frequency modulating signal on the basis of elements specific to a xenobiotic absorption circuit. It is observed that the spatial vector of concentration has a temporal variation of a harmonic modulated type, defined by the absorption medium.
The curves vary when the input parameters are changed.
Over time, practical technical difficulties have been observed in removing the impurities from the solid fuel prior to combustion, because of the chemical composition and structure of coal. Advanced technologies are continually being developed, with the aim of either (1) reducing power station emissions by implementing desulphurization technology, coal washing, and flue gas scrubbers and electrostatic precipitators that treat exhaust gases; or (2) applying carbon capture and storage to emissions from coal power stations. Even so, the environmental and human health impacts caused by the pollutant emission vector of coal-fired power plants are often unpredictable and dangerous if we consider the scenario of a sudden failure of its pollution prevention technology. In line with this idea, we consider a second case study, with the simulation model for the spatial vector of concentration z(t) depicted in Figure 8 and the modulating signal obtained on the basis of absorption circuit elements represented in Figure 9, in which the xenobiotic concentration shape exhibits a steep linearly rising slope (see Figure 10). This increase of environmental xenobiotic concentration can determine (over a short time interval) an output amplification up to six times relative to the input, according to Figure 11 (for the same study assumption, in which quantities with the same relative values are utilized so as to maintain a good degree of generality).
Figure 8. Simulation model for spatial vector of concentration. Case 2.
Sustainability 07 02678 g008
Figure 9. Modulating signal obtained on the basis of absorption circuit elements. Case 2.
Sustainability 07 02678 g009
Figure 10. Xenobiotic shape evolution. Case 2.
Sustainability 07 02678 g010
Figure 11. Simulation diagram for spatial vector of concentration z ( t ) . Case 2.
Sustainability 07 02678 g011

5. Conclusions

Flue gas monitoring during the operation of a coal-fired electrical generating station is an essential step in assessing the environmental and human health impact of pollutants.
Environmental xenobiotics from the flue gas of the coal-fired electrical generation stations are becoming increasingly problematic in medicine and environmental systems since, in addition to the environmental harm caused by greenhouse gases and other emissions, the flue gases contain toxic xenobiotics that result in significant perturbations of the immune system of humans and other life forms. The xenobiotic concentration evolution within a biological system is determined in the first case study assuming an environmental xenobiotic source with a harmonic behaviour, and an analogy with a linear structure characterized by xenobiotic compounds of both dissipating and accumulating types. It is anticipated that the results could be used to facilitate the assessment of the processes of environmental xenobiotic absorption, distribution, biotransformation and removal within the framework of compartmental analysis, by establishing appropriate mathematical models and simulations.
The simulations obtained in the second case study make it evident that some life forms surrounding an electrical generating station could be dramatically affected by a linear increase in the concentration of an environmental xenobiotic, represented by a compound of coal-fired flue gas, if pollution prevention equipment fails.
More generally, procedures should be implemented worldwide to estimate yearly emissions of primary particulate matter, sulfur oxides and nitrogen oxides, along with total electricity generation, for power plants. Also, since the flue gas from coal-fired power plants is dispersed over large areas, the population living around power plants should be included in databases. To improve sustainability, coal-fired electrical generating station should employ modern pollution control technology, where these end-of-pipe treatments can reduce environmental and human health impacts and avoid or retard the process of degradation of life on Earth, and cleaner production methods should be utilized to prevent pollution and reduce fuel consumption.
This study demonstrates the need for joint efforts by researchers in medicine, environmental engineering and computing to build knowledge of the impacts of environmental xenobiotics on humans and other life forms.

Acknowledgments

The authors gratefully acknowledge the support provided by their respective institutions in support of this research.

Author Contributions

Cornelia A. Bulucea designed the research and drafted the manuscript. Marc A. Rosen developed the method of projection in mirror of the flue gas pollutant vector for a coal-fired electrical generating station. Nikos E. Mastorakis developed the mathematic model of xenobiotics absorption process. Carmen A. Bulucea carried out the analysis and simulation of oscillating regime of environmental xenobiotics absorption. Corina C. Brindusa analyzed the environmental xenobiotics and particularized the mathematical models for the oscillating regime of xenobiotics. Andreea C. Jeles performed the assessment of flue gas components with SEDD methodology and participated in the experimental tests. All authors read, enhanced and approved the final manuscript

Conflicts of Interest

The authors declare no conflict of interest.

References and Notes

  1. Dincer, I.; Rosen, M.A. Exergy: Energy, Environment and Sustainable Development, 2nd ed.; Elsevier: Oxford, UK, 2013. [Google Scholar]
  2. Rosen, M.A.; Bulucea, C.A. Using exergy to understand and improve the efficiency of electrical power technologies. Entropy 2009, 11, 820–835. [Google Scholar] [CrossRef]
  3. Istrate, M.; Gusa, M. Impactul Producerii, Transportului si Distributiei Energiei Electrice asupra Mediulu (Environmental Impact of Electric Energy Generation and Transportation); AGIR Publishing House: Bucharest, Romania, 2000. (In Romanian) [Google Scholar]
  4. Rosen, M.A.; Dincer, I. Exergy analysis of waste emissions. Int. J. Energy Res. 1999, 23, 1153–1163. [Google Scholar] [CrossRef]
  5. Mishra, U.C. Environmental impact of coal industry and thermal power plants in India. J. Environ. Radioact. 2004, 72, 35–40. [Google Scholar] [CrossRef] [PubMed]
  6. Cohen, A.J.; Anderson, H.R.; Ostro, B.; Pandey, K.D.; Krzyzanowski, M.; Kunzli, N.; Gutschmidt, K.; Pope, A.; Romieeu, I.; Samet, J.M.; et al. The global burden of disease due to outdoor air pollution. J. Toxicol. Environ. Health Part A 2005, 68, 1301–1307. [Google Scholar] [CrossRef]
  7. Nagarkatti, P.S.; Nagarkatti, M. Immunotoxicology: Modulation of the immune system by xenobiotics. Def. Sci. J. 1987, 37, 235–244. [Google Scholar] [CrossRef]
  8. Koller, L.D. Immunotoxicology today. Toxicol. Pathol. 1987, 15, 346–351. [Google Scholar] [CrossRef] [PubMed]
  9. Danzo, B.J. Environmental xenobiotics may disrupt normal endocrine function by interfering with the binding of physiological ligands to steroid receptors and binding proteins. Environ. Health Perspect. 1997, 105, 294–301. [Google Scholar] [CrossRef] [PubMed]
  10. Bulucea, C.A.; Jeles, A.; Mastorakis, N.E.; Bulucea, C.A.; Brindusa, C. Assessing the environmental pollutant vector of combustion gases emission from coal-fired power plants. In Proceeding of the 4th WSEAS Int. Conf. on EMESEG'11, 2nd Int. Conf. on WORLD-GEO'11, 5th Int. Conf. on EDEB'11—Recent Researches in Geography, Geology, Energy, Environment and Biomedicine, Corfu Island, Greece, 14–16 July 2011; pp. 35–43.
  11. Metodologie de evaluare operativă a emisiilor de SO2, NOx, pulberi (cenuşă zburătoare) şi CO2 din centrale termice şi termoelectrice (Methodology for operative evaluation of emissions of SO2, NOx, particulate matter (fly ash) and CO2 in the thermal and electric power stations), Romanian Autonomous Electricity RENEL, Bucharest, 1994.
  12. Brînduşa, A.; Kovacs, J. Thermoenergetic block on coal. Pollution vector: Burning gas. Ann. Univ. Petrosani 2007, 9, 218–221. [Google Scholar]
  13. Weil, J.C. A diagnosis of the asymmetry in top-down and bottom-up diffusion using a Lagrangian stochastic model. J. Atmos. Sci. 1990, 47, 501–515. [Google Scholar] [CrossRef]
  14. Bulucea, C.A.; Rosen, M.A.; Mastorakis, N.E.; Bulucea, C.A.; Brindusa, C.C.; Jeles, A.C. Building Awareness of the Impact of Environmental Xenobiotics in Coal-Fired Flue Gas. In Proceedings of the 4th World Sustainability Forum, 1–30 November 2014; Volume 4.
  15. Breuil, J.M. Input-output analysis and pollutant emissions in France. Energy J. 1992, 13, 173–184. [Google Scholar] [CrossRef]
  16. Hnatiuc, E. Procedes Electriques de Mesure et de Traitment des Polluant (Electrical Methods for Measurement and Treatment of Pollutants); Lavoisier Publishing House: Paris, France, 2002. (In French) [Google Scholar]
  17. Penney, S.; Bell, J.; Balbus, L. Estimating the health impacts of coal-fired power plants receiving international financing. Available online: http://www.edf.org/sites/default/files/9553_coal-plants-health-impacts.pdf (accessed on 2 March 2015).
  18. Bulucea, C.A.; Rosen, M.A.; Mastorakis, N.E.; Bulucea, C.A.; Brindusa, C. Approaching Resonant Absorption of Environmental Xenobiotics Harmonic Oscillation by Linear Structure. Sustainability 2012, 4, 561–573. [Google Scholar]
  19. Niculescu, T. The Study of RLC Circuits Transitory Phenomena Using Matlab—Simulink Software; University of Petroşani Publishing House: Petrosani, Romania, 2005. [Google Scholar]
  20. Bulucea, C.A.; Mastorakis, N.E.; Rosen, M.A.; Brindusa, C.; Bulucea, C.A.; Jeles, A. Enhancing Understanding of the Environmental Xenobiotics in Coal-Fired Flue Gas. In Proceedings of the 6th International Conferences on Energy and Development-Environment-Biomedicine (EDEB’12), Vouliagmeni, Greece, 7–9 March 2012; pp. 58–67.
  21. Nicola, D.A.; Bulucea, C.A. Electrotehnica, Echipamente si Masini Electrice (Electrotechnics, Electrical Equipment and Machines); Electrotehnica Teoretica (Theoretical Electrotechnics); SITECH Publishing House: Craiova, Romania, 2005; Volume I. (In Romanian) [Google Scholar]
  22. Boashash, B. (Ed.) Time-Frequency Signal Analysis and Processing: A Comprehensive Reference; Elsevier Science: Oxford, UK, 2003.

