1. Introduction
With the increasing environmental awareness, much attention has been paid to the greenhouse emissions, especially the carbon dioxide (CO
2) emissions, among governments and scholars all over the world [
1]. Building industry has become a target for environmental improvement as the building sector accounted for about 40% of the world’s energy consumption and 33% of the related global greenhouse gas emissions [
2].
As the process of industrialization and urbanization is speeding up in China, the ever-growing demand for buildings has inevitably led to a series of issues associated with resources and the environment, particularly with a rapid growth in CO
2 emissions because of the huge energy consumption [
3]. Due to the increasing awareness on environmental issues and pressure from various government bodies and environmental activists, many attempts have been made to assess building carbon emissions and to reduce building energy consumption [
4]. However, most prior research into building carbon emissions focused on the situations at the national level or provincial level whereas research at the city level was often neglected due to the limited data samples. Therefore, it is important to pay much attention to the carbon emissions assessment at the city level, which may be beneficial to accurately calculate the total carbon emissions.
Additionally, heated discussions have been made by researchers on the methods of identifying relevant factors in affecting carbon emissions reduction [
5]. China is facing a tough challenge to reduce carbon emissions, further research on exploring the key factors influencing the building energy consumption are also necessary as it is crucial for a better understanding of the causes of carbon emissions and its current environmental impacts on the building industry at the city level.
In this study we conduct the life cycle carbon emissions assessment of the building sector in Wuhan, a city in Hubei province of China, and identify the key factors influencing the changes of building energy consumption and building carbon emissions using Logarithmic Mean Divisia Index (LMDI) decomposition analysis. Furthermore, this paper proposes several policy implications for promoting carbon emissions reduction and low-carbon development for the building sector in Wuhan. This study may contribute to achieving regional sustainable development for low-carbon buildings, as well as the carbon emissions reduction target for 2020 in the “new normal” economy of China.
2. Literature Review
Models for building carbon emissions assessment are mostly based on the life cycle theory in previous studies. Adalberth [
6] calculated the life cycle energy consumption of buildings at different stages. Michiya, Tatsuo, and Kiyoshi [
7] calculated the life cycle energy consumption of Japanese residential buildings, and further calculated the carbon dioxide emissions. Nassen, Holmberg and Wadeskog [
8] compared the characteristics and the application range between life cycle and input-output methods. The results revealed that the life cycle method was applicable to the carbon emissions calculation for a single building, while the latter was suitable for analyzing buildings’ carbon emissions in the community. Chen [
9] analyzed the factors influencing the life cycle carbon emissions of low-carbon buildings and it established a low-carbon assessment system. Chen and Luo [
10] revealed that the energy consumption of the building materials preparation stage and the operation stages were important parts of the life cycle building energy consumption.
The mainstream method analyzing the impacting factors of CO
2 emissions is to analyze the annual time series data with different kinds of factor decomposition methods [
11,
12,
13]. Wang
et al. [
14] adopted the LMDI method to decompose the CO
2 emissions from 1957 to 2000. The results showed that the energy intensity, which was regarded as the technical factor, was the most important factor for the carbon emissions reduction, and the energy structure to some extent contributed to the reduction as well, and economic growth increased the carbon emissions. Fan
et al. [
15], Xu, Liu, and Jiang [
16], Tang, Zhang, and Wang [
17] decomposed the scale, structure, and the technology factors influencing China’s carbon emissions with different methods and data. Although studies reviewed above are vital for the carbon emissions research with distinctive features, they also have some limitations: (1) limited data may lead to uncompleted decomposition; (2) regional differences in terms of the variables that affecting carbon emissions; and (3) a lack of consistent analytic framework.
As for the driving factors of the building carbon emissions, in general, there are four major categories from the published literature. They are: (a) demographic factors, including population number, urbanization rate, and the age structure,
etc.; (b) economic development factors, including GDP, gross output value of construction [
18],
etc.; (c) the level of urban construction factors, including actual building area, gas penetration, and the central heating area,
etc.; and (d) the residents’ living factors, including the per capita living space, per capita disposable income, and residents’ consumption level [
19],
etc. Some scholars analyze the driving factors in two aspects, which are the positive and the negative driving factors affecting the carbon emissions. The positive driving factors caused the carbon emissions increase are residents’ consumption level, the energy consumption structure, and the building area [
20]. While the key negative driving factors,which decreased the carbon emissions, are the energy efficiency [
21], energy structure [
22], technology, emissions reduction policy, and energy-saving behaviors. As analyzed above, the highly-cited driving factors on the building carbon emissions growth are population, urbanization rate, building area, and the consumption level, and the driving factors on the carbon emissions reduction are energy efficiency, energy structure, and the technical factor.
In terms of the research regions, the current low-carbon building studies mostly focuses on the data at the national or provincial level. Zhang, Zhou, and Lu [
23] constructed a carbon emissions measurement model to analyze the present situation of the urban building carbon emissions. Chen and Zhu [
24] quantitatively analyzed the building carbon emissions indexes of Shanghai’s residential and public buildings and predicted the future development goals with the scenario analysis method. However, there are few studies assessing the carbon emissions at the provincial level, city level and even the county level considering the situation of China’s statistic problems such as limited data access, incomplete statistic data and data deficient,
etc. Therefore, this paper selects Wuhan, a secondary city in the middle of China, as the research subject and constructs a mathematical model for the life cycle carbon emissions assessment, which provides evidence for assessing carbon emissions at the small and medium-sized city level. It is a significant step to identify scientific policy implications for Wuhan’s low-carbon building development.
3. Life Cycle Building Carbon Emissions Assessment
3.1. Life Cycle Assessment Concept in the Building Sector
Life cycle assessment (LCA) is accepted worldwide as a tool to measure industrial products or service related environmental factors by quantitatively evaluating CO
2 emissions and its environmental and ecological impacts, and to evaluate alternatives for environmental improvement in the building industry [
25,
26].
Nowadays, research on LCA in the building system has increased considerably from building materials to the end-of-life of the building [
27]. The implementation of life cycle carbon emissions assessment of the building sector can maximize the overall environmental benefits by facilitating designers, engineers, users, and decision-makers with accurate evaluation of carbon emissions, as well as specific emission reduction plans during different stages [
28].
3.2. Stages of LCA in the Building Industry
Energy consumption and carbon emissions in the building industry are more difficult to assess as the construction materials are massive, diverse and their production methods are inconsistent [
29]. There are many different methods in dividing the stages of LCA in the building sector. Many attempts on building environmental evaluation primarily focus on the carbon emissions from the production and transportation of the building materials, construction process and operational process, while the environmental impacts from other states are often neglected. Generally, this study on LCA carbon emissions assessment in the building industry intends to consider the total amount of carbon emissions that exhausted in the full life cycle of buildings, which includes the phases of design and planning, resources input, manufacturing, operation and use, maintenance, demolition and recycling [
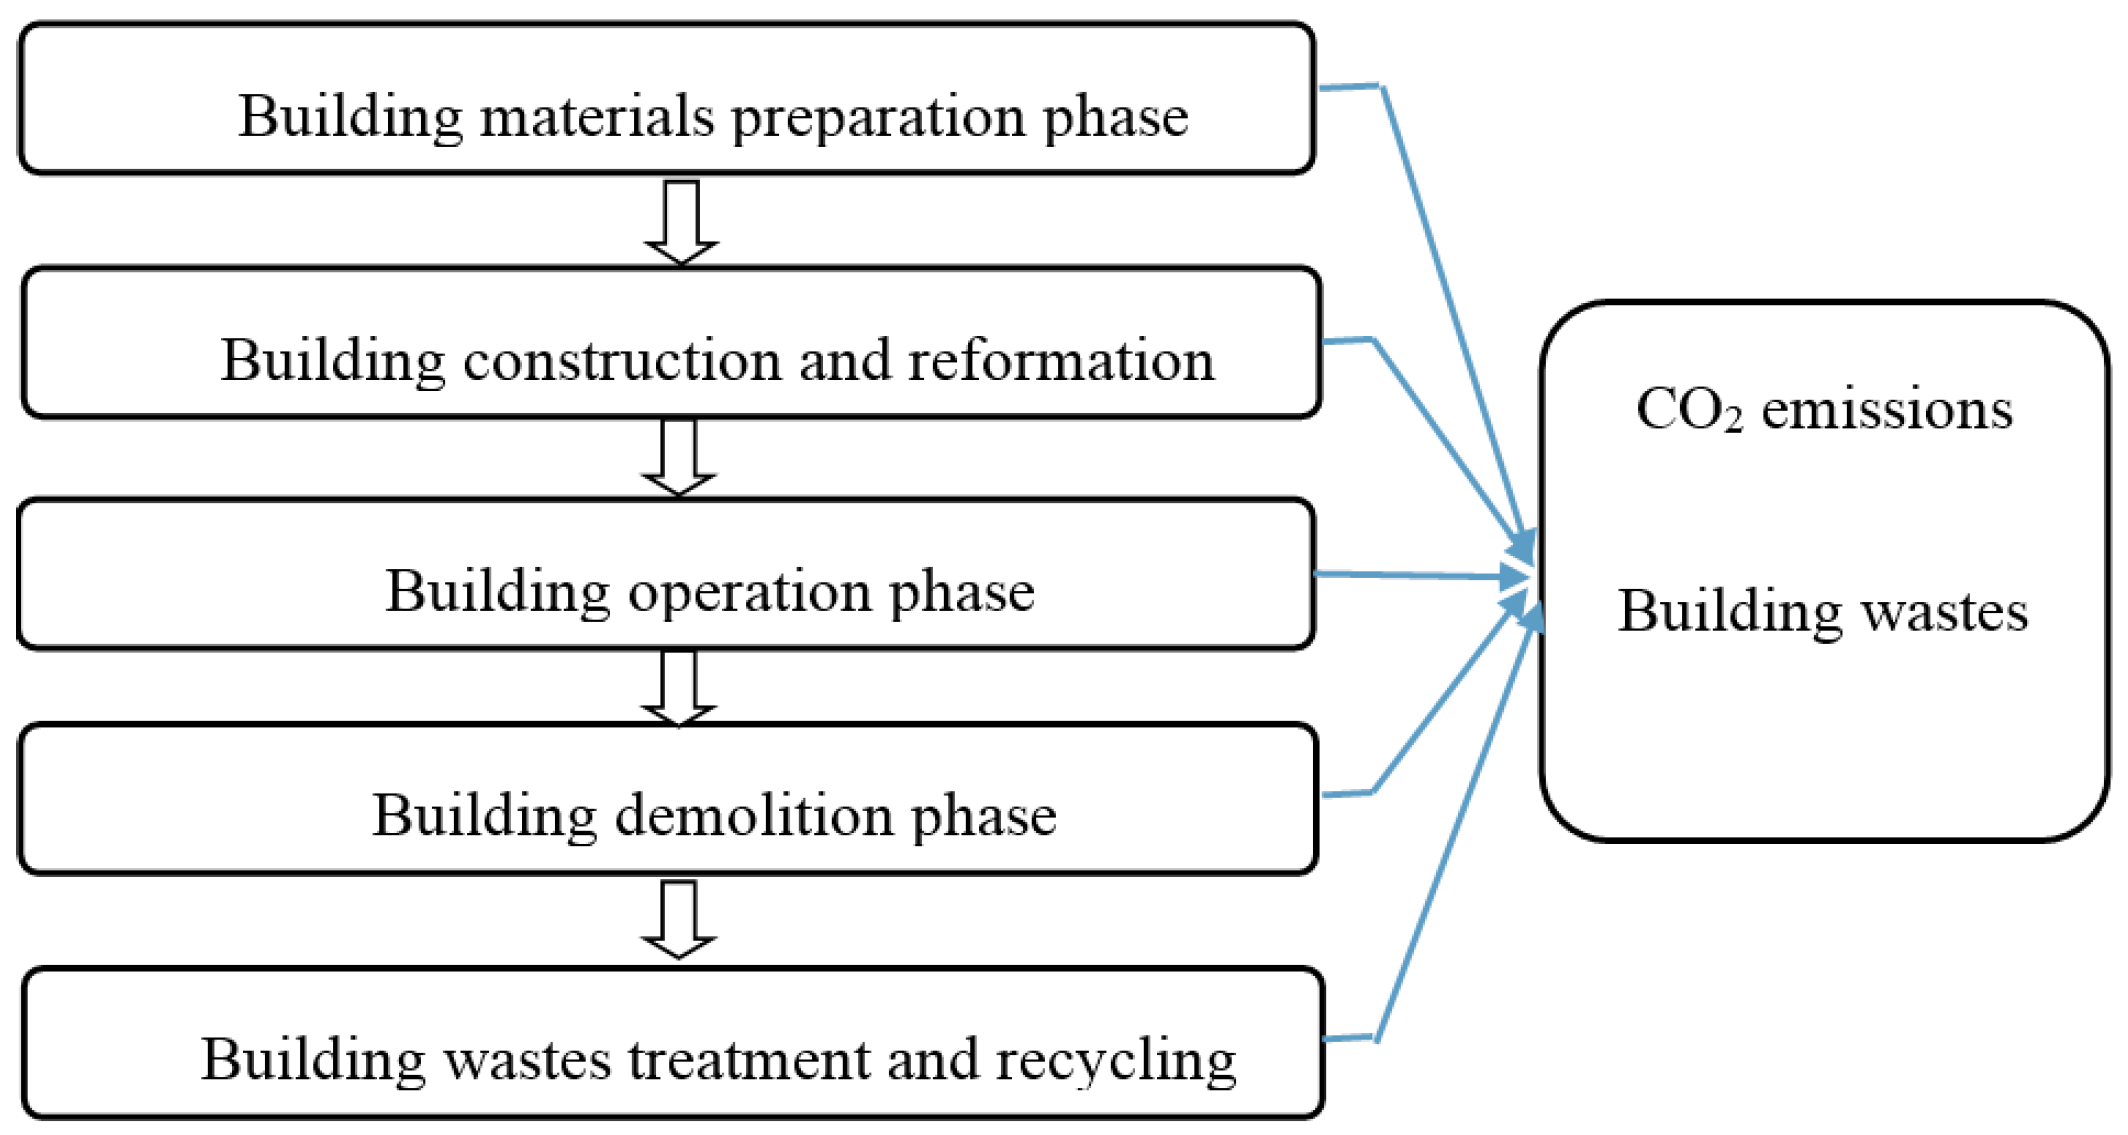
30]. However, the amount of carbon emissions in the design and planning phase is small and hard to measure, this paper will not consider the emissions from the building design and planning stage. Therefore, the life cycle carbon emissions in the building sector can be divided into five stages, which are the stages of material preparation, construction and reformation, operation (including the use and maintenance of the building), demolition, wastes treatment, and recycling [
31] (as seen in the
Figure 1).
Figure 1.
Conceptual couplings between a building life cycle stages and CO
2 emissions (Revised from You
et al. (2011) [
31] and Chau
et al. (2015) [
1]).
Figure 1.
Conceptual couplings between a building life cycle stages and CO
2 emissions (Revised from You
et al. (2011) [
31] and Chau
et al. (2015) [
1]).
Meanwhile, the building equipment production, building materials transportation, as well as the production, processing, and the transportation of the energy that are required during the building construction, known as indirect emissions, can consume energy and CO2 emission as well. Consequently, it is necessary to add the indirect emissions into the building life cycle carbon emissions assessment.
3.3. Methodology
3.3.1. Life Cycle Carbon Emissions Assessment
From the perspective of LCA, energy consumption in the life cycle of urban building system can be represented by aggregating the energy consumption of each stage. It can be represented mathematically by:
where
Ew represents the life cycle energy consumption of the building sector in Wuhan city and
Ei represents the energy consumption of the building sector during the phase
i of the life cycle. Carbon emissions can be mathematically determined from the following:
where
Ew is the life cycle building energy consumption from different phases of the life cycle building. For the convenience of computing, all the energy consumption data are converted into an equivalent of standard coal,
K is the carbon emission coefficient of the standard coal. Due to the differences of technical conditions and energy structures in different countries and regions, the standards of the coefficient
K are different. Generally, it adopts the average default value provided by the National Greenhouse Gas Emissions Inventory Guide (IPCC) [
32] and the data provided by the national authoritative organizations, which can reduce the deviation of the data provided by different organizations. Therefore, this paper adopts 2.69 tons as the conversion standard, which is viewed as the average value of the CO
2 emission coefficients of energy fuels with an equivalent of standard coal provided by several research agencies. In other words, this means that one ton of standard coal combustion exhaust about 2.69 tons of CO
2 [
33].
3.3.2. Data Sources
In this study, data for the life cycle energy consumption of the urban building industry come from the annual
China Statistical Yearbook (2001–2013) [
34],
China Energy Statistical Yearbook (2001–2013) [
35],
Hubei Statistical Yearbook (2001–2013) [
36], and
Wuhan Statistical Yearbook (2001–2013) [
37]. Due to the availability of data, this study selects the data from the year of 2000 to 2012.
3.4. Life Cycle Energy Consumption Assessment
The life cycle energy consumption assessment of urban building system in Wuhan is calculated in two aspects, including the direct and the indirect energy consumption of the five phases of the life cycle.
3.4.1. Direct Life Cycle Energy Consumption
The direct life cycle energy consumption of the building sector covers the phases of building material preparation, construction and demolition, operation, treatment, and recycling. The following part illustrates the detailed energy consumption in each phase.
Energy Consumption in the Building Material Acquisition Stage
The energy consumption of construction materials include the energy consumption that is produced during the manufacturing processes of building materials such as steel, non-metallic building materials, non-ferrous metal materials, and chemical building materials that needed in the process of building construction (see the
Table 1) [
38]. All of these construction material data comes from the
China Statistical Yearbook (2001–2013) [
34]. As the specific consumption data of the building materials at the city level is difficult to obtain, this research uses the proportion of energy consumed by building materials to the total national materials to calculate the energy consumption of Wuhan’s building materials. On the basis of the previous studies, the percentage of steel, non-metallic materials, non-ferrous metal materials, and chemical building materials consumption accounted for 41% [
39], 98% [
40], 25% [
41], and 25% [
42] respectively. In the various energy consumption calculation, it is assumed that the annual building material consumption ratio remaines the same. The direct energy consumption
E1 of Wuhan’s building materials preparation stage can be estimated by the following formula:
where
mi is the consumption proportion of the building material
i.
Qi is the total energy consumption consumed in the production of the material
i.
Sw is the total building area of Wuhan city and
Sz is the total building area of China.
Table 1.
Raw materials consumed in the building material acquisition stage.
Table 1.
Raw materials consumed in the building material acquisition stage.
| Categories | Content |
|---|
| Steel | ferrous metal acquisition |
| black metal smelting and rolling |
| Non-metallic building materials | non-metallic mineral |
| non-metallic mineral products |
| timber processing |
| Non-ferrous metal materials | non-ferrous metal selecting |
| non-ferrous metal smelting and rolling |
| Chemical building materials | plastic |
Energy Consumption in the Buildings Operation Stage
The direct energy consumption in the operation stage of the building system is the heating energy consumption. In consideration of the differences between the south and the north in the terms of the heating system, energy consumption in the operation phase to the north of the Yangtze river covers the heating energy consumption
Ec (including the urban coal consumption of the living consumption, heating coal consumption, transportation, warehousing, and postal service coal consumption and the wholesale and retail trade and catering industry coal consumption), the residential energy consumption except the heating energy consumption
Ez (including the consumption of electricity, natural gas and liquefied petroleum gas), and the public buildings energy consumption without consisting of the heating energy consumption of
Eg (including the power consumption of transportation, warehousing and postal service, wholesale, retail and accommodation, catering and others). Therefore, the direct energy consumption
E3 in the operation stage of Wuhan’s urban construction can be represented by the following formula:
As the energy consumption balance data of Wuhan is not available and the heating energy consumption is different from the north to the south, this study employed the data of Hubei province as it is the closest way to estimate Wuhan’s situation. Therefore, the energy consumption data in the operation phase mainly come from the energy consumption balance of
Hubei Statistical Yearbook (2001–2013) [
36]. In addition, this study unified the unit of all the energy consumption into ten thousand tons of standard coal when was calculating the energy consumption for the statistical convenience. The electricity, natural gas, and liquefied petroleum gas (LPG) data were converted accordingto the referenced standard coal coefficients of all kinds of energy in the appendix of
China Statistical Yearbook (2013) [
34].
Energy Consumption in the Construction and Demolition Phases
The actual energy consumption data in the construction and demolition stage is not easy to obtain. In the case of the limited data, usually it is a better way to estimate it based on existing research results. Zhang, Zhou, and Lu [
23] adopted the energy consumption of the construction industry in the
China Statistical Yearbook (2001–2013) [
34] as the sum of the energy consumption
E2 in the construction phase and the energy consumption
E4 in the demolition phase of urban building system. Their study calculated the direct energy consumption of the construction and demolition phases according to the percentage of Wuhan’s construction area out of the national construction area.
Energy Consumption in the Building Treatment and Recycling Phases
Urban construction treatment and recycle stage are mainly to classify and recycle the plastic, glass, metal, and other easy-to-recycle materials. The CO
2 emissions in this process mainly includes the waste transportation and processing [
15], which are classified as the indirect energy consumption. On the contrary, the recycle stage can reuse some building materials, which are able to offset some carbon emissions of the energy consumption. However, as the relevant data is difficult to obtain and China’s present construction waste recycling rate is less than 5%, this study did not consider the energy consumption that was offset during the recycling phase.
3.4.2. Indirect Life Cycle Energy Consumption
The indirect energy consumption of urban construction is the life cycle energy consumption during the various stages of the building, including the energy consumption of all kinds of construction equipment, construction machinery manufacture, building materials transportation, and the energy production, processing, and transportation. Therefore, the total indirect life cycle energy consumption
Qw of buildings in Wuhan can be represented by the formula:
where
xi is the proportion of the energy consumption of the
i kind of indirect energy consumption in the building section,
yi indicates the
i kind of total indirect energy consumption of life cycle buildings,
Sw is urban construction area in Wuhan,
Sz is the total national building area. As the indirect energy consumption statistical data is difficult to obtain, this research adopts the existing research results to calculate the indirect energy consumption [
40,
41,
42]. The data of the three parts is from
China Energy Statistical Yearbook (2001–2013) [
35]. Specifically, as seen in
Table 2, transportation energy consumption covers the total energy consumption of transportation, warehousing and postal service. Energy processing industry includes coal mining and washing industry, oil and gas industry, oil processing and coking industry, nuclear fuel processing industry energy consumption and the production and supply of electricity and heat. Machinery manufacturing includes total energy consumption of the metal products industry, general equipment energy consumption industry, and total energy consumption of the special manufacturing equipment industry [
38]. In conclusion, the indirect energy consumption of the buildings in Wuhan can be computed as the product of the indirect energy consumption of national buildings and the proportion of Wuhan’s building area out of the total national building area.
Table 2.
Indirect life cycle energy consumption of buildings.
Table 2.
Indirect life cycle energy consumption of buildings.
| Categories | Content |
|---|
| Transportation energy consumption | total energy consumption of transportation, warehousing, and postal service |
| Energy consumption in the energy processing industry | coal mining and washing industry, oil and gas industry, oil processing and coking, and nuclear fuel processing industry energy consumption and the production and supply of electricity and heat |
| Energy consumption in the machinery manufacturing | metal products industry total energy consumption, general equipment energy consumption and special manufacturing equipment total energy consumption |
3.4.3. Total Life Cycle Energy Consumption
According to the above analysis, the energy consumption of urban building is mainly composed of the energy consumption in the building materials preparation stage, the building operation stage and the indirect energy consumption stage, which is consistent with the most domestic studies. Thus, the energy consumption of life cycle buildings in Wuhan can be defined as the following formula:
where
Ew denotes the total life cycle of building energy consumption in Wuhan City,
E1 is the energy consumption of the building materials preparation phase,
E3 is the energy consumption of the building operation phase, (
E2 +
E4) is the sum of building energy consumption of the construction and demolition stages, and
Qw stands for the indirect energy consumption that analyzed in the Equation (5).
3.5. Discussions on Life Cycle Building Carbon Emissions Assessment
As the various stages of life cycle energy consumption in the construction industry has converted into standard coal, according to the Equation (2), carbon emissions of life cycle energy consumption of building in Wuhan can be calculated by the product of energy consumption and the corresponding energy consumption coefficient.
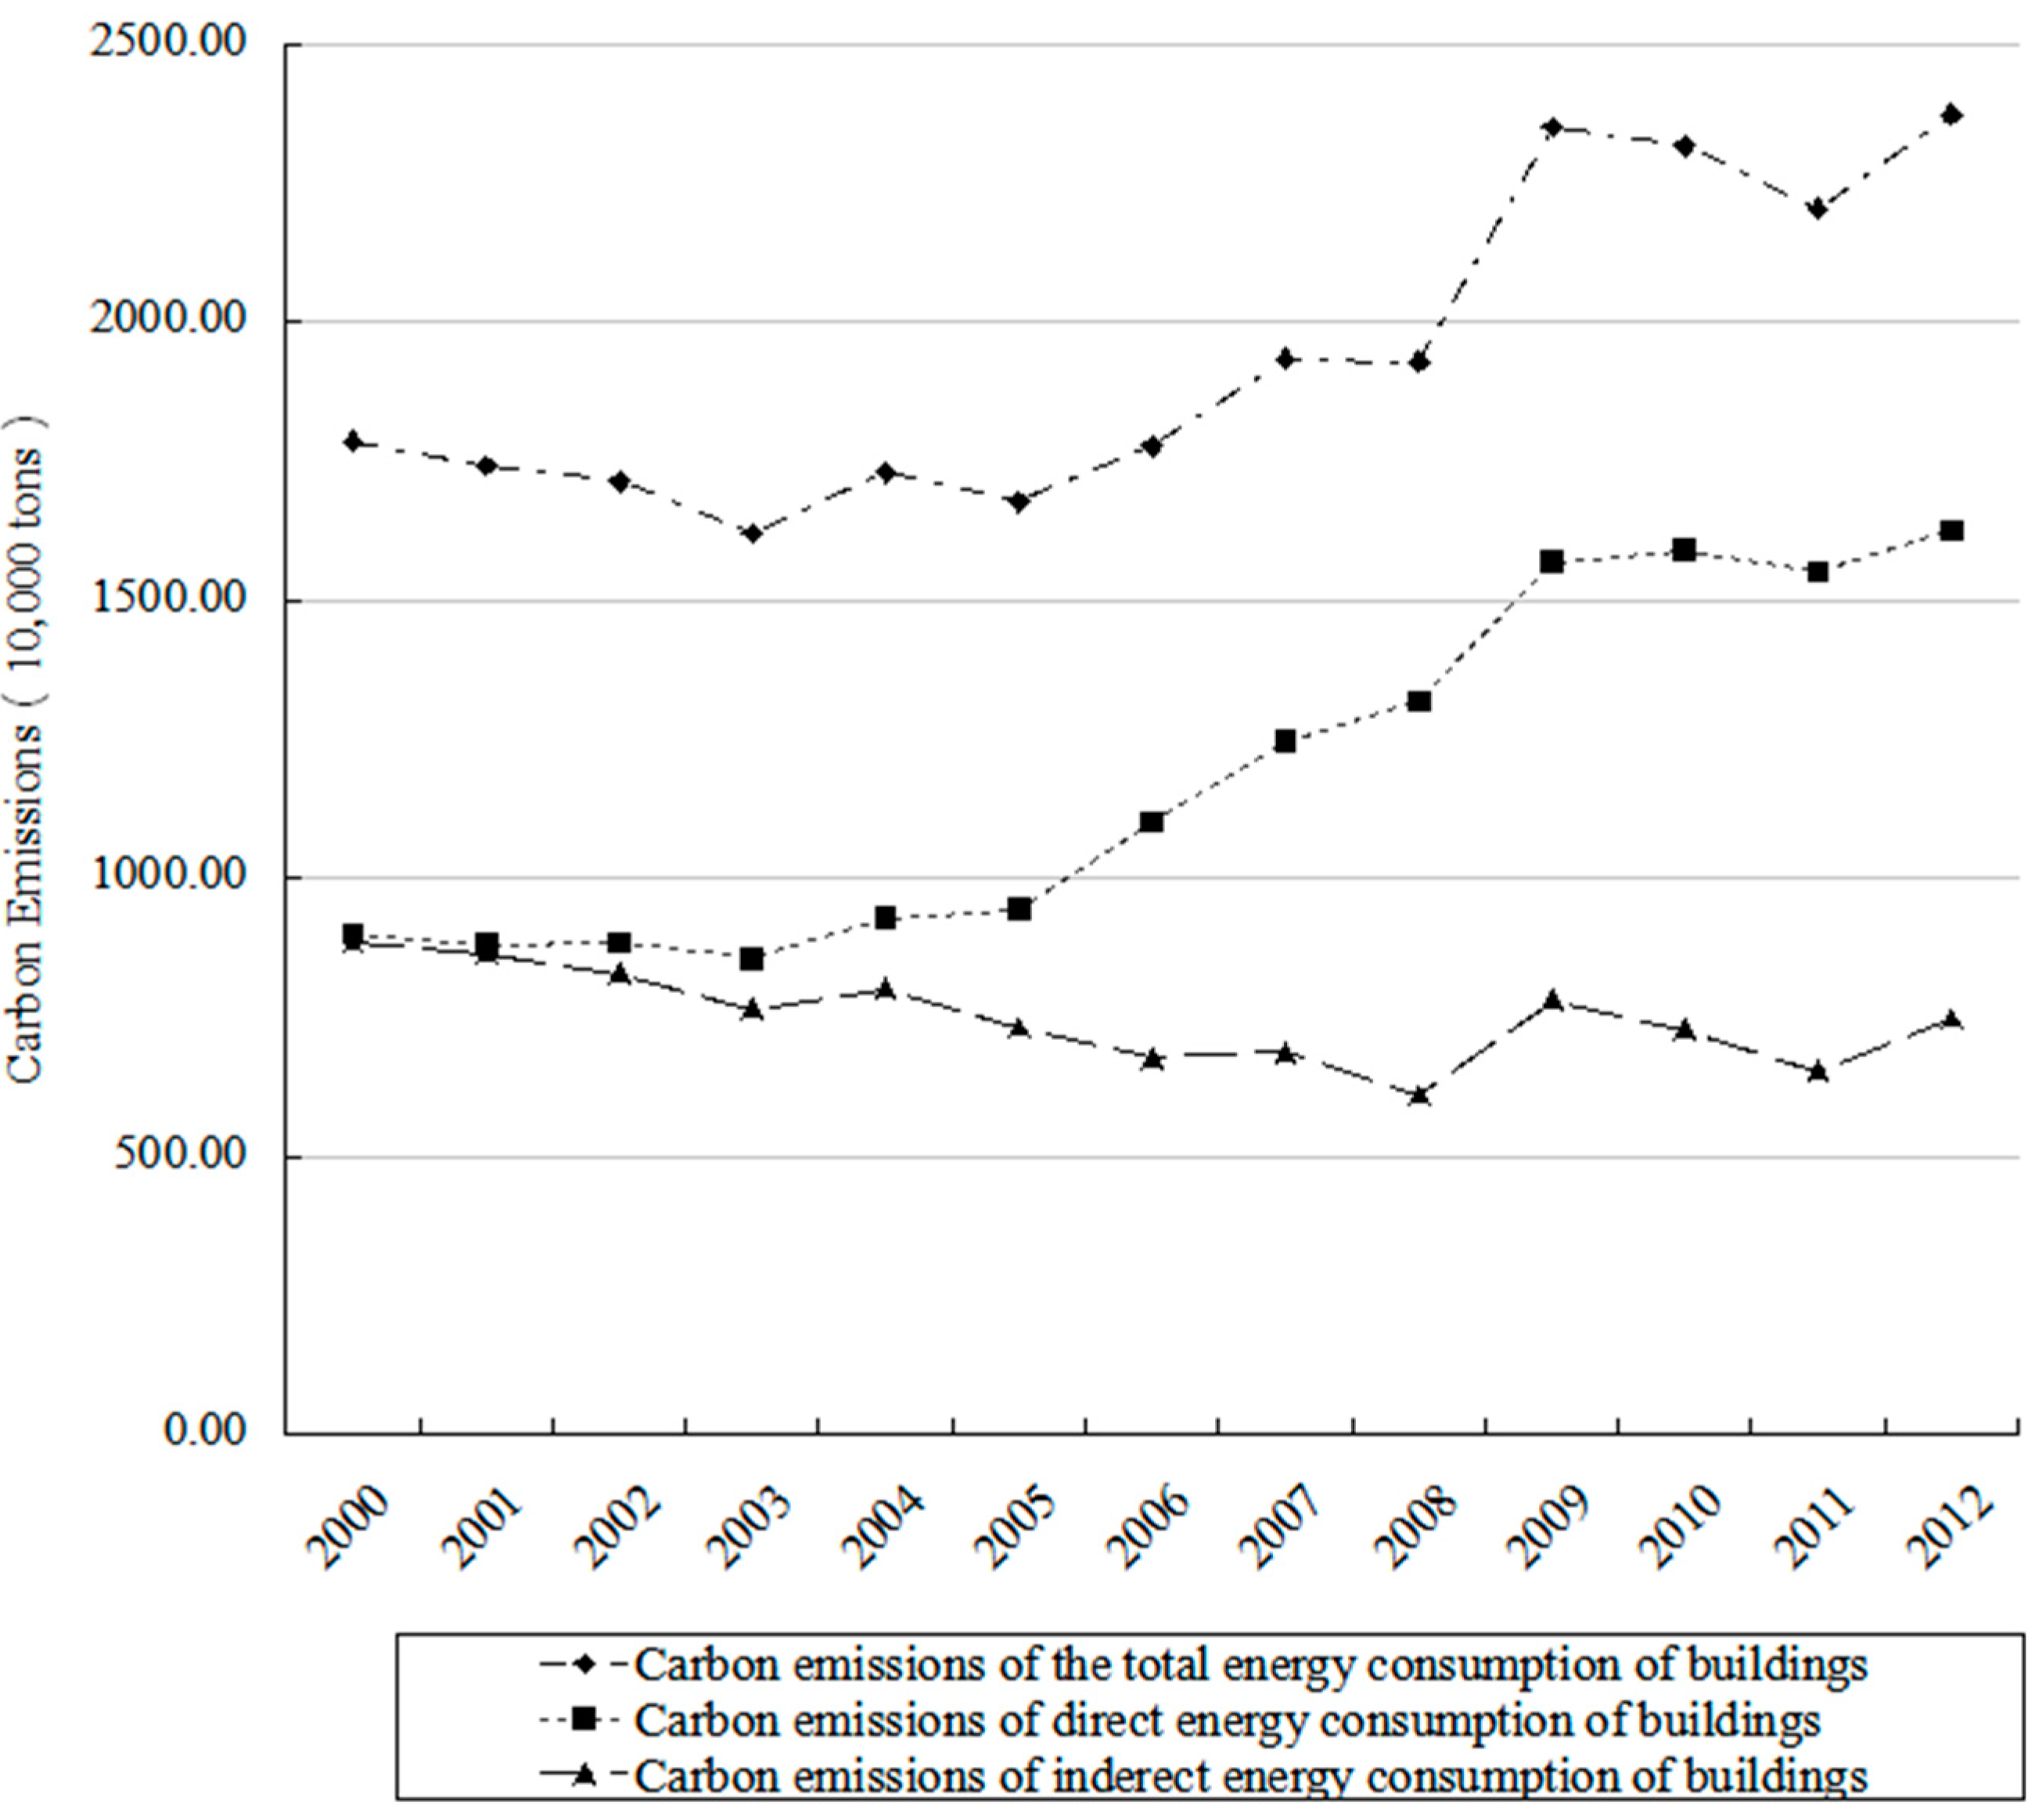
As shown in
Figure 2, the carbon emissions of total life cycle energy consumption of building increased with a fluctuation from 2000 to 2012 in Wuhan. The carbon emission rose from 17.8459 million tons of CO
2 in 2000 to 23.7226 million tons of CO
2 in 2012, which has increased by 33%. Among them, the carbon emissions of direct energy consumption (including the energy consumption from the phases of building material preparation, construction and demolition, operation, treatment, and recycling) and the carbon emissions of total energy consumption of buildings were both on a rise. Compared with 2000, the direct energy consumption carbon emissions increased by 81% in 2012. Obviously, the carbon emissions of energy consumption were growing rapidly during this period. This is mainly because of the industry’s energy consumption is relatively stable as the indirect energy consumption mainly comes from the machinery manufacturing industry, transportation industry and energy industry. On the contrary, the carbon emissions of indirect energy consumption (including the energy consumption of all kinds of construction equipment, construction machinery manufacture, building materials transportation, and the energy production, processing and transportation) changed a little and had a slight decline, where the carbon emissions of indirect energy consumption dropped by 16% from 2012 to 2000. According to the division of the direct and indirect energy consumption emissions, the direct energy consumption carbon emissions was the major contributor of the total energy consumption carbon emissions of the building industry, while the indirect energy consumption accounted for about a third of the total carbon emissions.
Figure 2.
Carbon emissions of life cycle building energy consumption in Wuhan.
Figure 2.
Carbon emissions of life cycle building energy consumption in Wuhan.
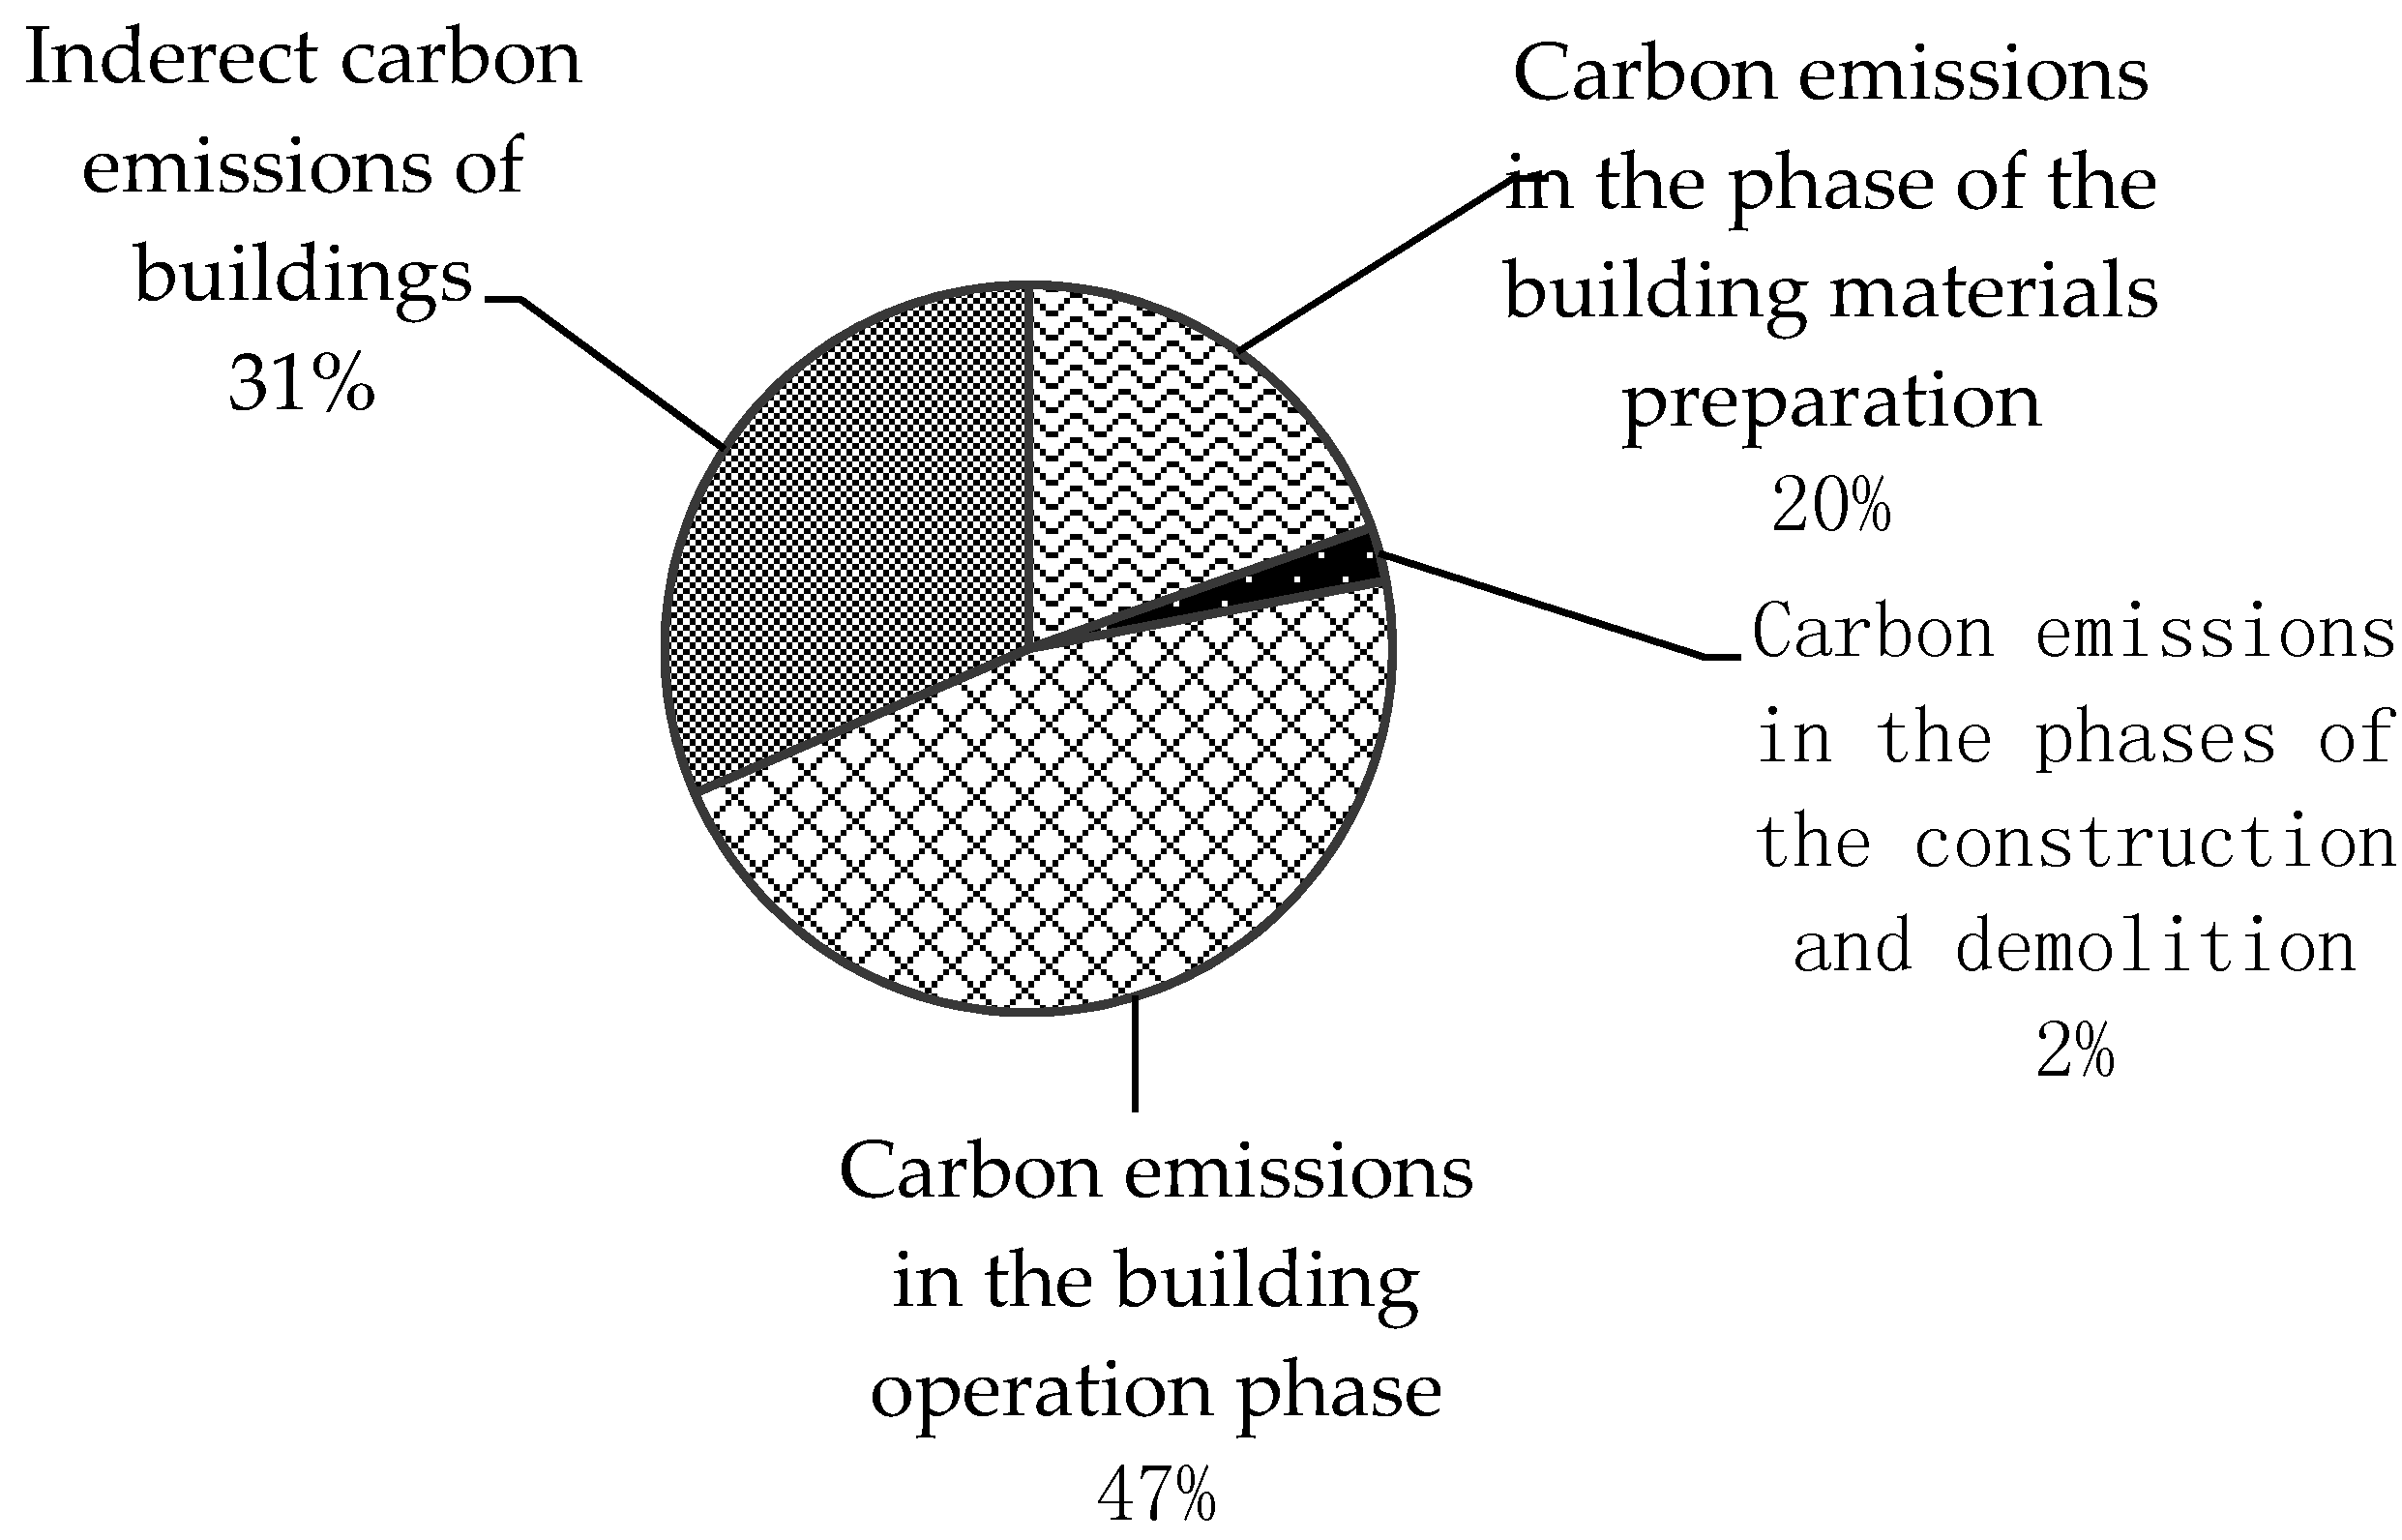
Figure 3 shows the proportions of various stages’ carbon emissions of life cycle energy consumption of buildings in Wuhan city in the year of 2012. Among them, the direct energy consumption and the operation stage accounted for the largest amount of carbon emissions and accounted for 47% of total carbon emissions. Most literature in China has shown a similar result, which viewed that the carbon emissions from the operation stage accounted for the 60%–80% emissions of life cycle building carbon emissions [
43]. It was followed by the indirect energy consumption carbon emissions, accounting for 31%. The percentage of the carbon emissions in the material preparation stage was 20%. However, this calculation result was not consistent with previous studies. Li and Jiang held the opinion that energy consumption in the preparation stage was higher than the indirect energy consumption in China [
38]. That is to say, it consumed more energy in the production, processing and shipment of the construction equipment and building materials. Carbon emissions of construction and demolition phases occupied the smallest proportion, which accounted for 2% of the total carbon emissions.
Figure 3.
Proportion of each phase’s life cycle building carbon emissions in Wuhan in 2012.
Figure 3.
Proportion of each phase’s life cycle building carbon emissions in Wuhan in 2012.
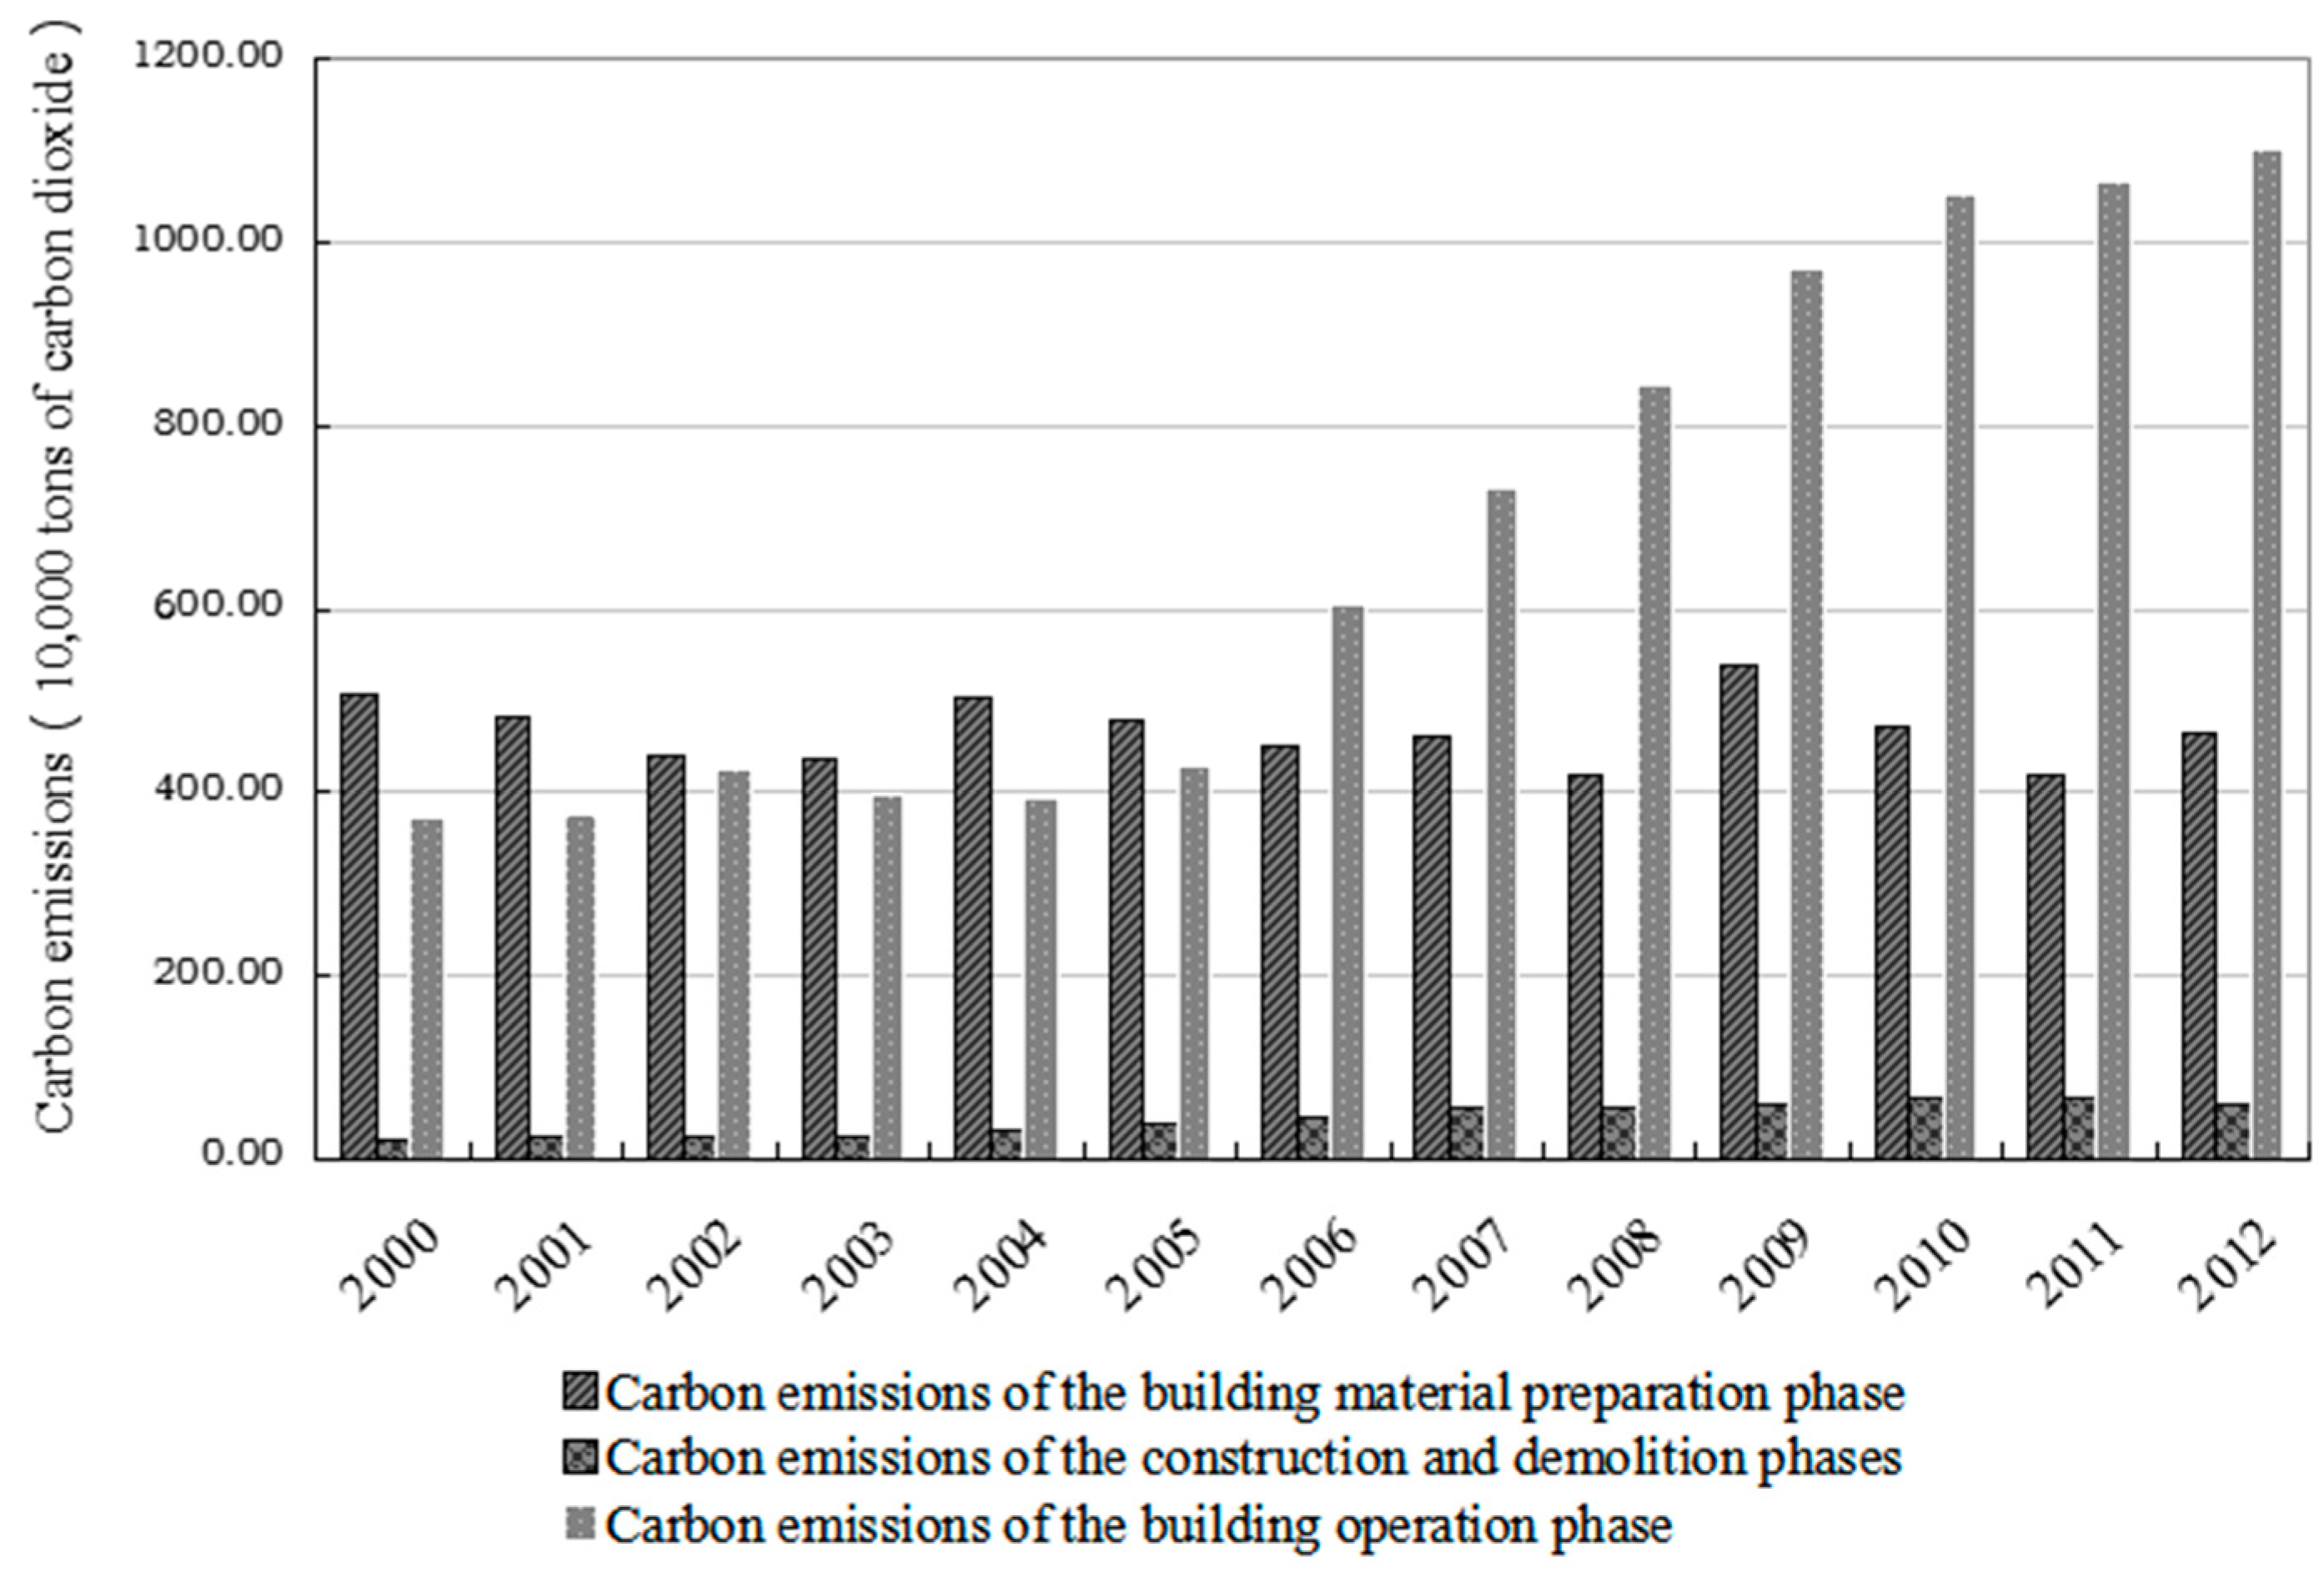
In the context of direct carbon emissions of the building energy consumption in Wuhan city, the carbon emissions of building materials preparation phase maintained at a similar level, which basically fluctuated up and down around five million tons of CO
2 emissions (as shown in
Figure 4). Carbon emissions of construction and demolition phases stayed around 220,000 tons of CO
2 from 2000 to 2003. It began to rise steadily since 2004, and it rose to 57.5100 tons of CO
2 till 2012. However, the carbon emissions in the building operation phase rose significantly. It basically stayed at the level of four million tons carbon emissions before 2005. It began to rise rapidly since 2006 that went over 10 million tons carbon emissions and jumped to 11.0315 million tons of CO
2 emissions with the growth rate of 197% in 2012.
Figure 4.
Major phases’ life cycle building carbon emissions in Wuhan.
Figure 4.
Major phases’ life cycle building carbon emissions in Wuhan.
4. Driving Factors of Building Carbon Emission Growth in Wuhan
4.1. Factor Decomposition Analysis
Decomposition method is widely applied to identify the driving factors that change energy consumption and carbon emissions. Structural decomposition analysis (SDA) and index decomposition analysis (IDA) are two broad categories of decomposition techniques to examine the driving factors on the changes of carbon emissions quantitatively. SDA method has its advantages in analyzing detailed industrial sector emissions but requires the complete input-output table [
44], which is a big challenge for one special industry. It is therefore mainly used at the national level. IDA method uses index number concept in decomposition analysis and has its advantages in temporal analysis [
45,
46].
In comparison with several different IDA methods, such as the divisia index decomposition analysis and the Laspeyres index decomposition analysis, LMDIis considered as a relatively superior method due to its advantages in theoretical background, practicability [
47], adaptability [
48], results interpretation [
49], and its ability to handle zero-value problem [
50,
51]. Therefore, this study adopted the LMDI method to decompose the driving factors influencing the changes of the life cycle building carbon emissions in Wuhan City.
Among all the data analysis methods for the index decomposition, there are mainly two kinds of methods named the time series manner and the period-wise manner [
19]. Period-wise manner compares indices between the first and the last year of a given period without considering the details during the study period. As the decomposition analysis results are sensitive to the choices of the baseline year and the final year, it is sometimes unable to track the changes of the effects on the decomposed factors over the study period [
45]. On the other hand, the time-series analysis can solve this problem by comparing the indices on the annual basis. Therefore, this study employed the time-series LMDI methods to study on the driving factors that can change the life cycle energy consumption of buildings in Wuhan City.
4.2. Driving Factors
In the study of the factors that changes the energy consumption and carbon emissions, IPAT model is frequently adopted in many studies. Ehrlich and Holdren’s study was the first with the idea of IPAT to study the relationship among economic growth, resources and environment of the form. The equation can be described as I = P × A × T, where
P refers to population,
A represents per capita level of consumption or affluence, and
T is the environmental impact per unit of consumption under the existing technology [
52]. IPAT’s main strengths are because it is a specification of the key driving forces behind the environmental change, and it further identifies the relationship between those driving forces and impacts precisely [
53]. It continues to be widely utilized as a framework for analyzing the driving forces of environmental change (see, e.g., Raskin, 1995 [
54]; York, Rosa, Dietz, 2002 [
55]). However, IPAT model has certain restrictions on studying the effects of human factors acted on the environment. Thus, different scholars reconstructed and extended the IPAT model according to their requirements. Schulze assumed behavioral choices was an important factor affecting the environmental pressure, while the IPAT model did not attach great value to the function of behavior. An extended model with the behavior factor was suggested, and the IPAT model was turned into the I-PBAT model [
56].
The leading factors in promoting building energy consumption and carbon emissions growth are total population, urbanization rate, construction area and consumption level. Energy efficiency studies in buildings are not only influenced by the energy consumption per unit building area, but also affected by the behavior factor. For instance, the improvement of resident’s living standard will lead to the increase of the energy consumption per unit building area. Therefore, this study considered population, including the total population and the urbanization rate, building area, residents’ behaviors, and the technical level as the driving factors of life cycle building carbon emissions growth in Wuhan.
4.3. Methodology
4.3.1. Decomposition Model
According to the above analysis of the driving factors that caused the carbon emissions growth of the life cycle building energy consumption in the case of Wuhan, this research employed I-PABT model to further analyze the quantitative relationship among the driving factors. The decomposition analysis model of the driving factors can be conducted through the following equation:
where
E is the energy consumption of the building sector,
P is the total population in Wuhan,
U is the proportion of the urban population,
A is the per capita floor area of the urban residents,
B is the behavioral impact factor, and
T is energy consumption per unit floor area. Specifically,
B is used to evaluate the influences of the building energy consumption given by the behavioral factor. Assuming that the influence degree of the residents’ behavioral factors on building energy consumption is proportional to the index
I of per capita building energy consumption, and it is given as follows:
where
k is the coefficient which will not affect the calculation of the decomposition factors
B and
T as
k will be balanced out during the calculative process.
I is the per capita building energy consumption index indicating the changes in terms of direction and degree of per capita building energy consumption during different time periods. It can be expressed by:
where
It is the per capita building energy consumption index in the period
t, per capita building energy consumption index in the base period is indicated by
I0 = 100,
Et is per capita building energy consumption in the
t time period,
E0 is the per capita building energy consumption in the base period.
T in the Equation (7) is the per capita comparable building energy consumption which is used to measure the effective factor of the buildings. The following equation shows the per capita comparable building energy consumption by eliminating the behavioral factor B [
57]:
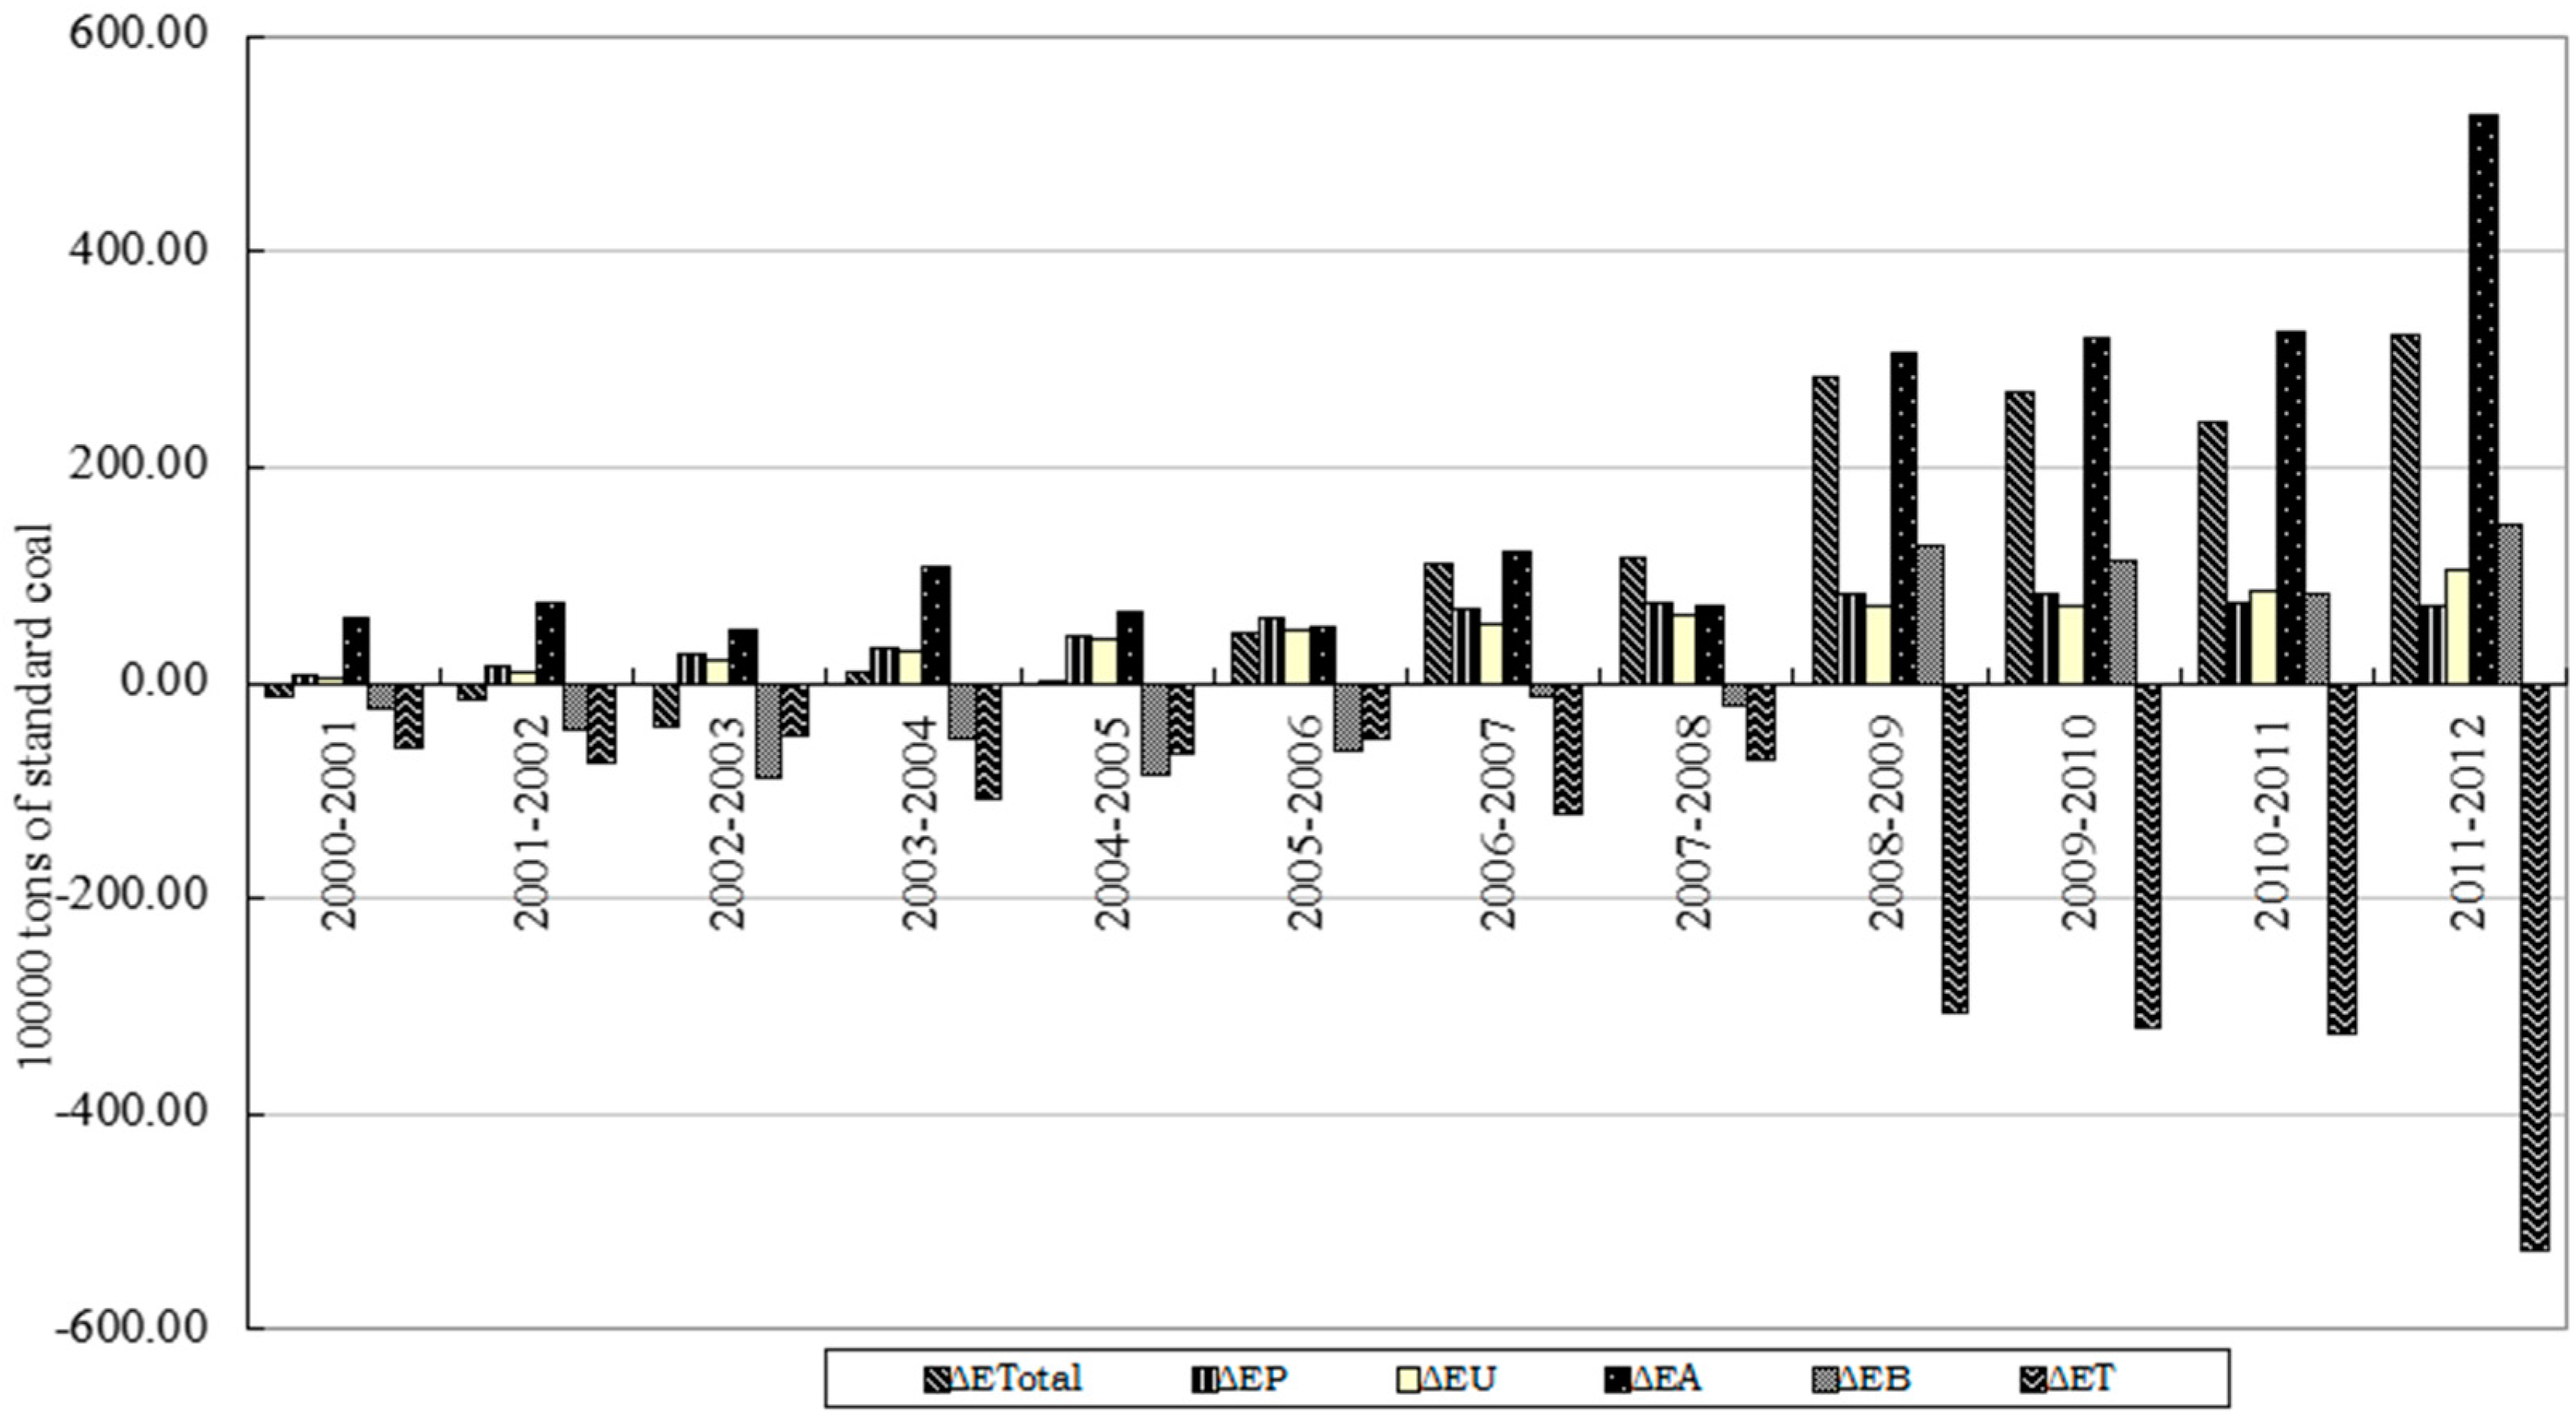
In the time period of (0, t), the contribution of the building energy consumption variation to the total population, urbanization rate, building area, behavioral factor, and building energy efficiency are respectively represented by ∆EP, ∆EU, ∆EA, ∆EB, ∆ET, and the changes in proportion of each factor can be denoted by DP, DU, DA, DB, DT.
4.3.2. Data Sources
The model in this study uses the data ranging from the year of 2000 to 2012. The total construction energy consumption data come from the above calculation results, and the total population, urban population and construction area can be obtained from the
Wuhan Statistical Yearbook (2001–2013) [
37]. In the light of these statistical data, the proportion of urban population, per capita urban building area and the energy consumption per unit floor area can be computed. Per capita building energy consumption index can be calculated according to the Equation (9).
4.4. Discussions on Factor Decomposition Analysis
In order to study the effects of various factors on building energy consumption changes, as shown in
Figure 5, this study decomposed the driving factors based on the building energy consumption data from 2000 to 2012 in Wuhan City.
Figure 5.
Driving factors decomposition of construction energy consumption changes in Wuhan.
Figure 5.
Driving factors decomposition of construction energy consumption changes in Wuhan.
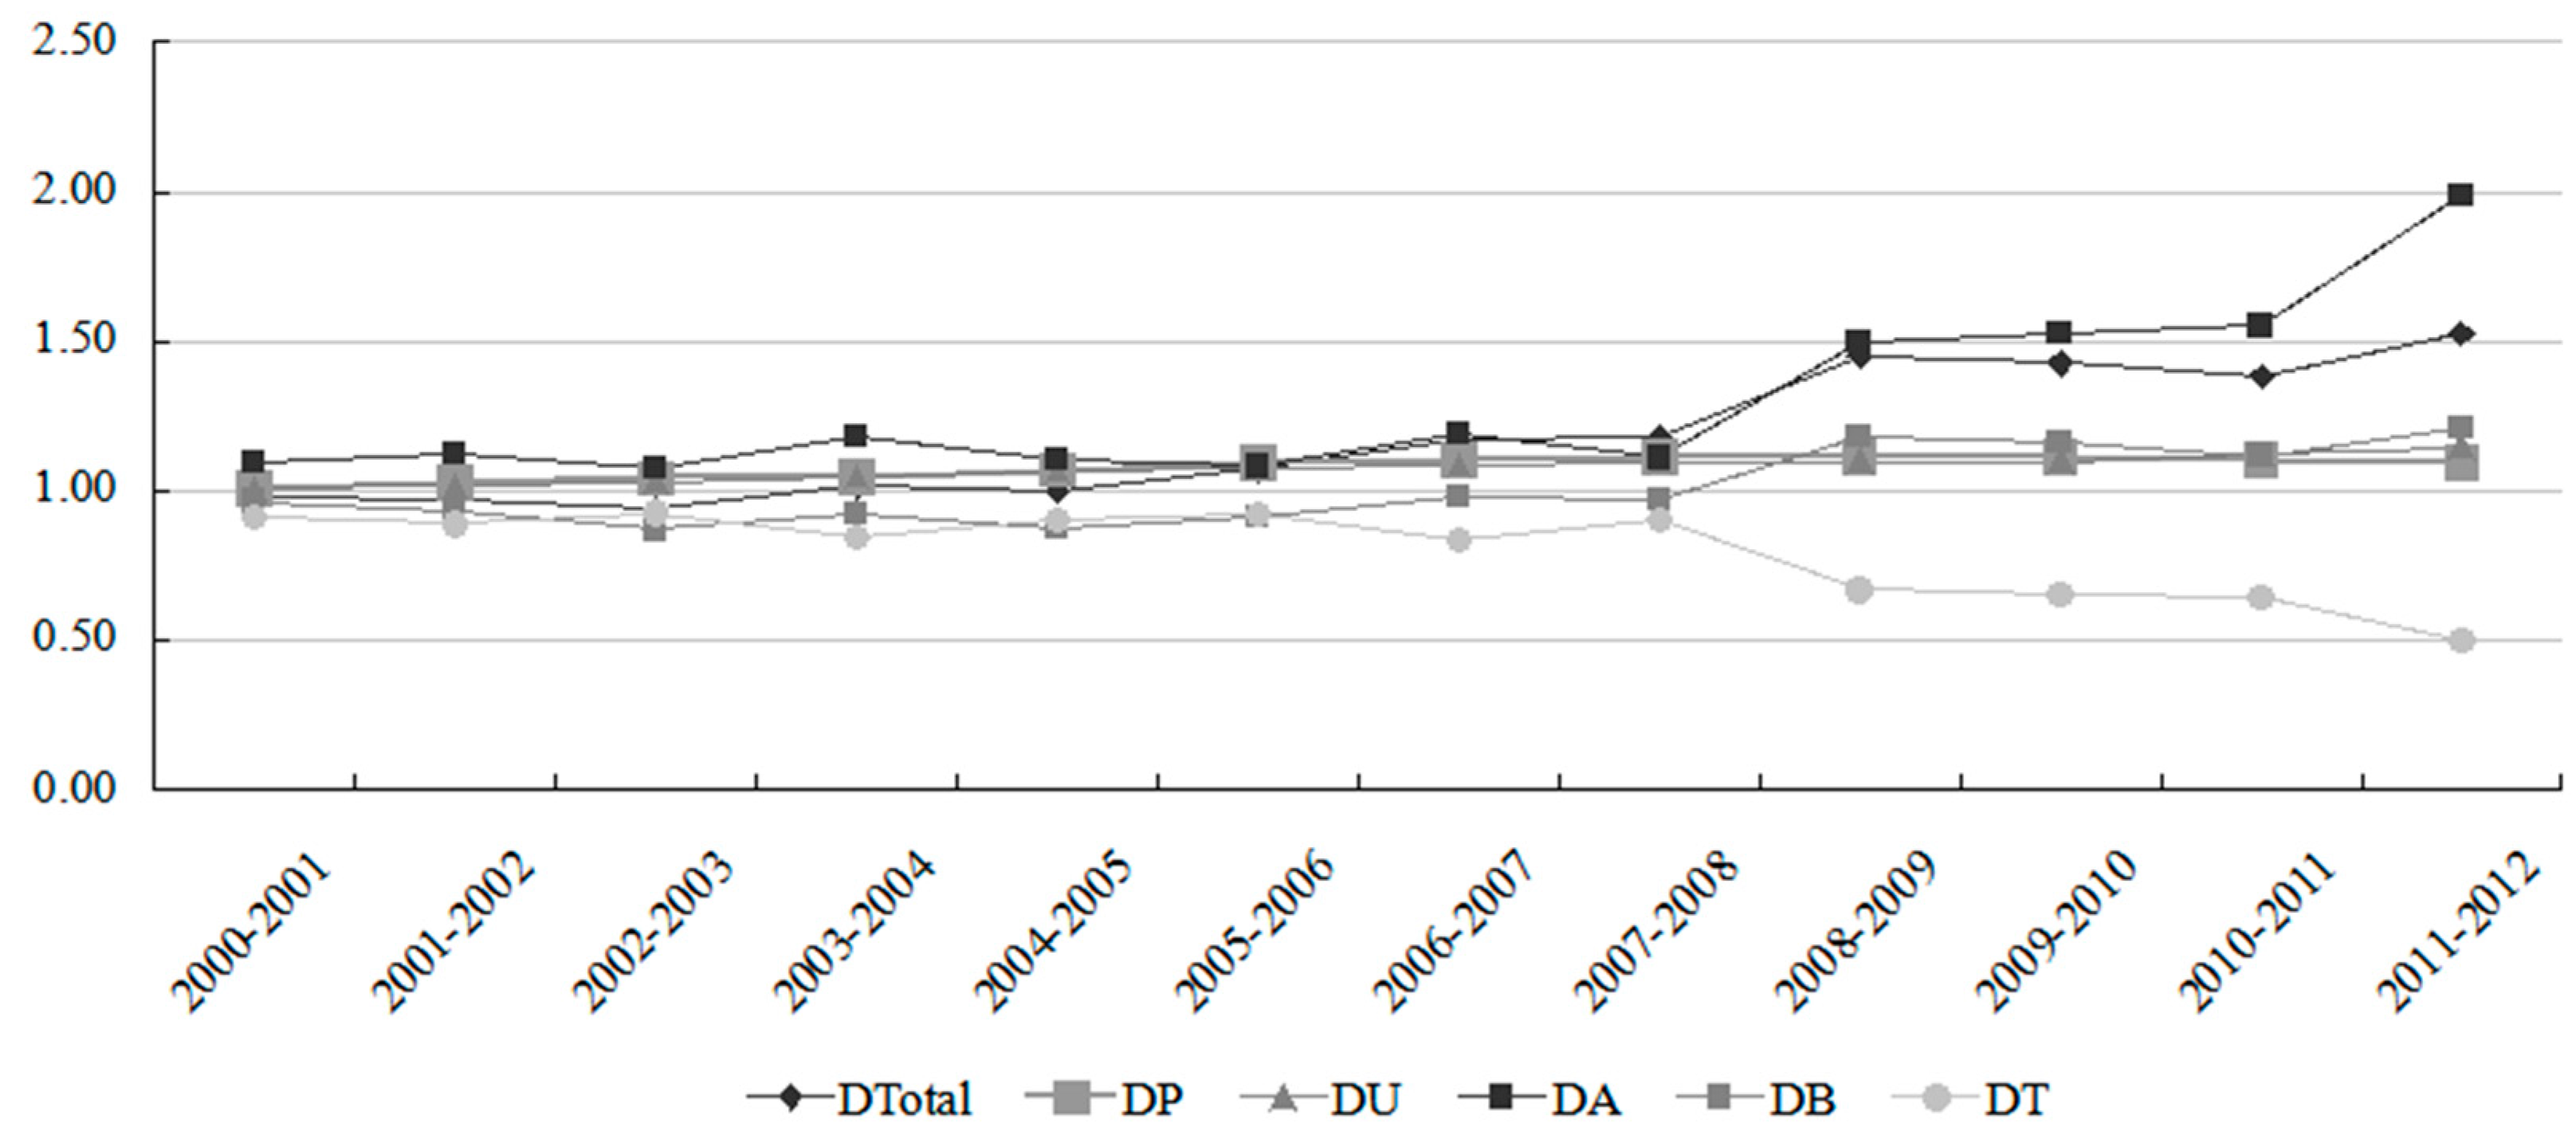
Through the driving factors decomposition of construction energy consumption change, it can be concluded that the increase of construction area is the leading contributor for the increase of building energy consumption and carbon emissions in Wuhan. From
Figure 6 we can see, the building energy consumption variation
∆EA caused by the building area factor remains a higher position. Especially since 2008, its change of proportion went over 1.5 and reached 2.0 in the period from 2011 to 2012.
Figure 6.
Changes of the proportion of the influencing factors decomposition of the building energy consumption in Wuhan.
Figure 6.
Changes of the proportion of the influencing factors decomposition of the building energy consumption in Wuhan.
The contribution of the behavior factors on the increase of building energy consumption remained the second place, which became the second major contributor on building energy consumption and carbon emissions increases in Wuhan. However, Hu and Guo considered that residents’ consumption level was the core driving force on the carbon emission growth, while the energy consumption structure and the building area were the secondary factors [
20]. As shown in
Figure 6, behavior factor and building energy consumption were negatively correlated before 2008. But the building energy consumption began to grow rapidly since 2008. The influence coefficient of behavior factor
DB on building energy consumption change surpassed 1.0, while the average annual influence coefficient was 1.17 ranging from 2008 to 2012. The improvement of residents’ living standards was the main reason for the building energy consumption growth. That is, the improvement of people’s living standard has improved the demand for buildings and, thus, it further pushed the construction energy consumption as well as the carbon emissions to rise.
Population growth and urbanization, to some extent, also made contributions to the increase of Wuhan’s building energy consumption. This was consistent with Cai’s study [
19]. In specific, the contribution of the population factor on the changes of the building energy consumption
∆EP was greater than the contribution of urbanization factor on the changes of the building energy consumption
∆EU. Whereas, the impacts of urbanization surpassed the impacts of population factor after 2010 as shown in
Figure 5.
Figure 6 showed that the impacts of population factor and urbanization factor on building energy consumption growth were relatively small. Both influence coefficients remained around 1.0 and they wandered up and down around 1.1 after 2005, which indicated that the total population had greater influence on the growth of building energy consumption in the earlier stage, while the population structure had greater impacts on the building energy consumption growth than the total population since 2010.
Building energy efficiency factor was the dominant factor in inhibiting building energy consumption growth. Most researchers agreed with this results that energy efficiency is vital for the carbon emission reduction [
20,
22]. As can be seen from
Figure 5, the contribution of energy efficiency on the building energy consumption was negative, indicating that the technical factors, to a large extent, could reduce the energy consumption and the carbon emissions.
Figure 6 revealed that the influence coefficient of energy efficiency on building energy consumption growth reduced gradually, and the influence coefficient became smaller especially after 2007. This could be due to the continuous technological progresses and the impacts of energy efficiency on reducing building energy consumption gradually became weaker.
5. Recommendations for Wuhan’s Low-Carbon Building Development
In order to achieve building energy conservation and emissions reduction, it is necessary to consider all aspects of the whole life cycle of buildings, from the project planning and design, construction, use and operation, to the demolition and recycling. According to the above life cycle building carbon emissions assessment and the factor decomposition analysis, energy consumption in the building operation phase, indirect energy consumption and energy consumption in the material preparation stage need to be reduced with special attention in order to reduce the life cycle building carbon emissions. After considering the building energy efficiency factor, the dominating emission reduction factor, as well as the key driving factors such as the building area and the behavior factor, it is suggested to reduce carbon emissions from the major perspectives of improving the building energy efficiency, using new energy and promoting energy-saving behaviors.
Firstly, it is wise to enhance building’s operational efficiency to reduce the energy consumption in the use stage of buildings. Wuhan, on the one hand, should pay great attention to developing the cutting edge green low-carbon building technologies with the assistant of the Donghu National Independent Innovation Demonstration Zone, and to taking full advantage of scholars and researchers from universities in the intellectual cluster with the aim of fully promoting the development of low carbon buildings. On the other hand, Wuhan should design and build the heat preservation and insulation of the building envelopes well and improve the efficiency of the heating, lighting, ventilation, and air conditioning systems according to the climate characteristics of the Yangtze river.
Secondly, it is suggested to use the clean energy to reduce the indirect energy consumption caused by the production, processing and transportation of the building materials. Wuhan should make full use of the advanced science and technology to realize building materials’ reuse and recycling with the aim of low consumption, low emission and high efficiency. Additionally, it is highly recommended to produce and generalize the energy conservation materials. Additionally, it is necessary to take full advantage of the building materials from the areas nearby Wuhan that can shorten the shipment distance and clean energy, such as natural gas, electronic, and solar power, which should be used to further reduce the energy consumption during the transportation.
Thirdly, energy behavior improvement is vital for enhancing the efficiency of the energy-saving and emission reduction. Government, enterprises and the public should take the responsibility and remain fully engaged throughout the energy saving and carbon emissions reduction action. Concretely speaking, the local government should influence the public’s low-carbon behaviors by thoroughly instilling the low carbon architectural idea, formulating and completing the relevant laws, regulations and standards. At the enterprise level, architectural design companies, the research and development institutions, producers, suppliers, and the construction units of the construction materials should establish or implement the low-carbon construction technical standard system strictly. Furthermore, the public should form the low-carbon living habits and choose the low-carbon buildings in the terms of purchasing patterns. This are significant steps in achieving the regional sustainable development in terms of resources and the environment in the building sectors.
6. Conclusions
The primary objective of this study is to assess the carbon emissions of the life cycle energy consumption and further identify the main factors driving carbon emissions growth in the building sector at the city level. In this paper, it calculated the life cycle energy consumption and carbon emissions of the building industry based on the life cycle theory in a case of Wuhan City, China. The results showed that the proportion of carbon emissions in the building operation phase remained the largest, and the carbon emissions of the indirect energy consumption and the construction material preparation phase were the second largest contributors. In order to analyze the driving factors of the construction carbon emissions, this paper adopted the decomposition analysis with the LMDI method. The findings indicated that the increasing buidling area was the main driver of the energy consumption and the carbon emissions increase, and it followed by the behavior factor. Population growth and urbanization, to some extent, increased the carbon emissions as well. On the contrary, energy efficiency contributed to the carbon emissions reduction of the life cycle buildings. It also provided some relevant policy recommendations for carbon emissions mitigation in Wuhan.
However, there exists several limitations in terms of data collection and interpretation. The construction area data of Wuhan City is not available due to the limited statistics at the city level in China. Given the lack of data, this paper adopted an indirect method, employing the proportion of Wuhan’s building area out of the total national building area instead of using the real data, which is acceptable considering the situation of China’s statistic problem. Further research is needed to examine the differences of the carbon emissions with more accurate data of different building types by regions. Diverse driving factors should also be investigated to gain a more comprehensive understanding of the reasons affecting the carbon emissions of different building types. Despite these challenges, this study provides insight into a standardized methodology for life cycle building carbon emissions assessment at the city level under the condition of limited data, which enables policy makers, designers, engineers and building users to make more sensible judgements in promoting sustainable development in the future.


