Article

Influencing Factors of Energy-Related CO2 Emissions in China: A Decomposition Analysis

1
College of Earth and Environmental Science, Lanzhou University, Lanzhou 730000, China
2
Department of Geography, University of Toronto Mississauga, Mississauga, ON L5L 1C6, Canada
*
Author to whom correspondence should be addressed.
Sustainability 2015, 7(10), 14408-14426; https://doi.org/10.3390/su71014408
Submission received: 11 September 2015 / Revised: 7 October 2015 / Accepted: 21 October 2015 / Published: 26 October 2015

Abstract

:
China is the largest CO2 emitter in the world and is still reliant on energy consumption for economic growth. Research has focused on effective approaches of reducing and mitigating CO2 emissions. This paper undertakes a decomposition study of energy-related CO2 emissions from the industrial and household sectors during the period 1996–2012, with the objectives of investigating trends of the changes in energy-related CO2 emissions, the driving forces of these changes, and approaches of mitigating CO2 emission. Results show the following: (1) the expansion of economic activity is the dominant stimulatory factor of the increase of CO2 emissions in China and that a sustained increase in CO2 emissions can be expected; (2) the decline in energy intensity and the adjustment of energy mix and industrial structure effectively mitigate CO2 emissions; and (3) the government should give more attention to enhancing the energy utility efficiency and reducing CO2 emissions in rural households.

1. Introduction

Global warming has caused widespread concern in the international community. According to the Fourth Assessment Report of the Intergovernmental Panel on Climate Change [1], increase in anthropogenic CO2 emissions is a main contributor of global climate change. China, the largest CO2 emitter in the world, was responsible for 106.43 million tonnes of CO2 emissions, which account for 25.09% of global CO2 emissions, in 2012 [2]. Over the last few decades, Chinese authorities and economic actors have adopted and implemented many advanced technologies, equipment, and mitigation policies in order to reduce energy consumption and CO2 emissions. However, high-consumption and high-emission problems still persist in China because of accelerating industrialization and urbanization. Faced with intense pressures, the Chinese government promised during the Copenhagen Climate Change Conference in 2009 to reduce its CO2 emissions per unit of the gross domestic product (GDP) by 40% to 45% in 2020 relative to 2005 levels. Thus, it is necessary to know overall changes of CO2 emission. Moreover, it is necessary to know what factors in recent years are driving these changes in order to find effective approaches of reducing and mitigating CO2 emissions.
Decomposition of CO2 emission has recently been an actively researched topic. Researchers have quantified the impact of different factors on the change of CO2 emissions from the regional [3,4,5,6] to the sectoral [7,8,9] perspective, and generally divided the factors into energy mix, energy intensity, industrial structure, economic activity, and population scale. Pani and Mukhopadhyay [3] undertook a decomposition study of CO2 emission of the top ten emitting countries and indicated that although rising income and population are the main driving forces, they are neither necessary nor sufficient for increasing emission, rather, energy structure and emission intensities are the crucial determinants. Mahony [4] decomposed the effects of changes in CO2 emissions in Ireland and found that scale effects of affluence and population growth action increase emissions and are countered primarily by energy intensity and fossil fuel substitution. Zhang et al. [10] analyzed the changes in carbon emissions in Beijing and indicated that under current practices, carbon emissions will increase as a result of rapid growth of the economy, the population, and the energy consumption per capita and the main routes to reduce CO2 emissions will be to adjust the economic structure and energy mix, and to reduce the energy intensity of each sector. Shao et al. [11] explored the main factors affecting CO2 emissions from industrial energy consumption in Tianjin and found that improvements in energy utilization efficiency are the most important contributors to effective industrial energy conservation and emission reductions. Li et al. [7] explored the impacts of factors on the CO2 emissions from road freight transportation in China and found that economic growth is the most important factor in increasing CO2 emissions, whereas the ton kilometer per value added of industry and the market concentration level contribute significantly to decreasing CO2 emissions.
In addition, the influence of CO2 emissions from households should not be neglected. Influencing factors of CO2 emissions from households can be divided into energy mix, energy intensity (energy consumption per capita), population structure (the urban and rural population distribution structure), and population scale.
This study applies the logarithmic mean Divisia index decomposition (LMDI) method to analyze the main factors that influence energy-related CO2 emissions from the industrial and household sectors.
The object of this paper is to investigate (1) trends of energy-related CO2 emissions, (2) the driving forces of the changes in energy-related CO2 emissions from the industrial and household sectors and (3) approaches of mitigating CO2 emission in order to help the governments to formulate future CO2 emission reduction policies.
The rest of this paper is organized as follows: Section 2 introduces the research methods. Section 3 presents the data used. Section 4 discusses the results of the decomposition of energy-related CO2 emissions. Section 5 concludes the study and proposes several policy recommendations.

2. Methodology

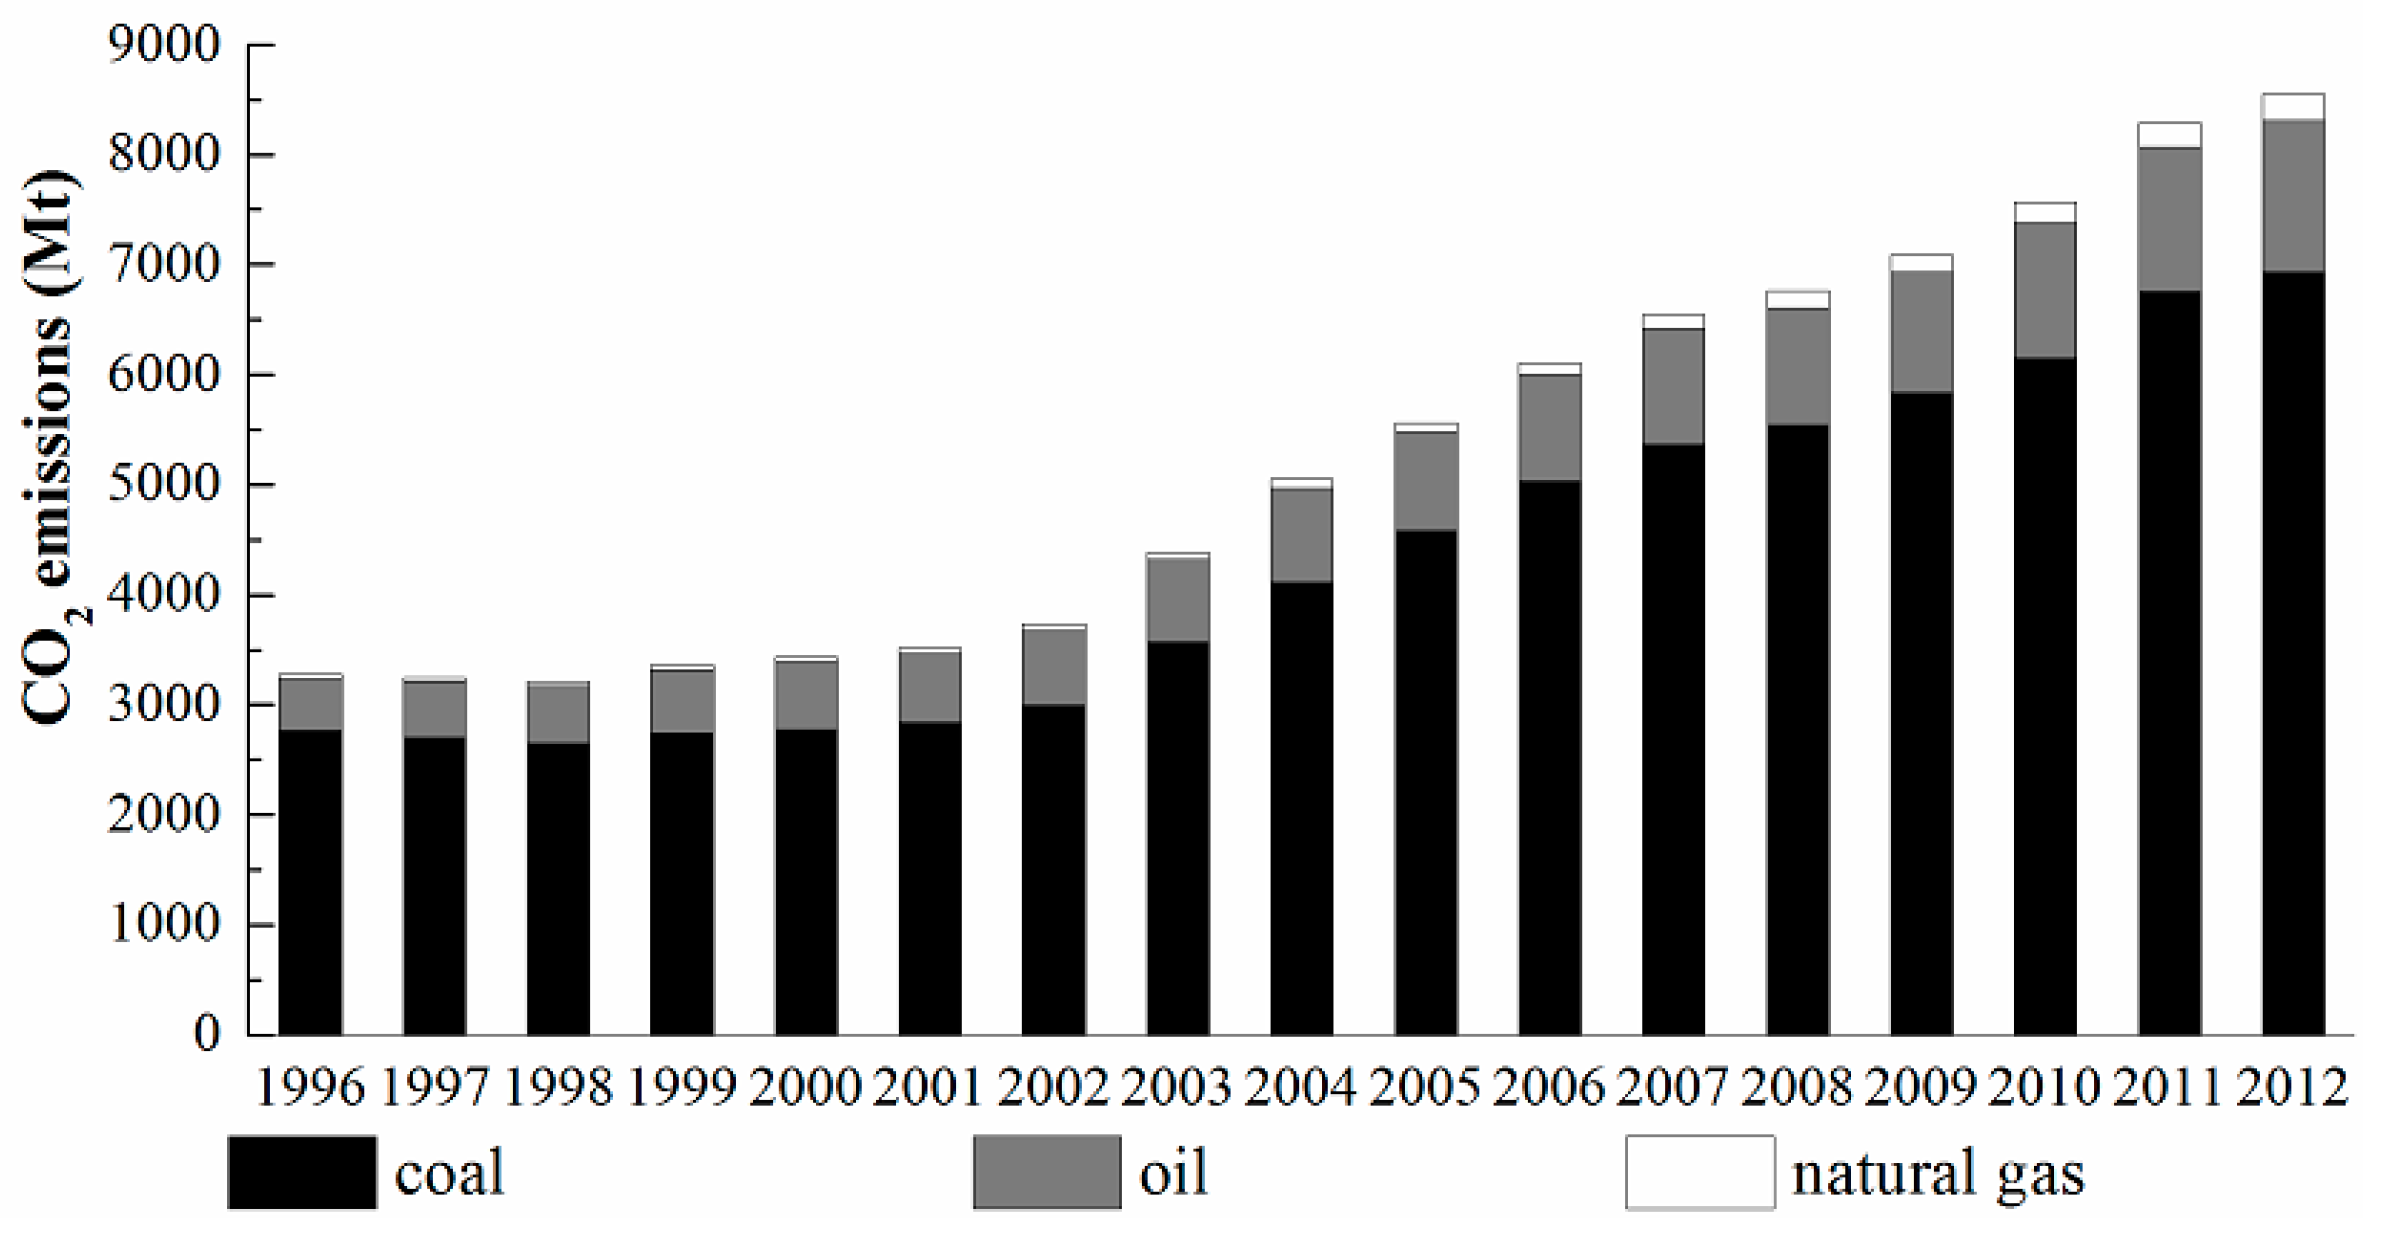
2.1. Estimation of CO2 Emissions

According to the method described in the 2006 Intergovernmental Panel on Climate Change guidelines for national greenhouse gas inventories [12], the energy-related CO2 emissions in a given year may be estimated as follows:
C t o t = C I + C H = ij C ij + ik C ik = ij E ij × F i × K + ik E ik × F i × K
where Ctot represents the total amount of CO2 emissions, CI represents the amount of industrial CO2 emissions, and CH represents the amount of household CO2 emissions. Subscripts i, j, and k represent the energy type (i = 1, 2, 3, and 4), industrial sector (j = 1, 2, 3, … 8), and household sector (k = 1, 2) respectively. Cij represents the amount of CO2 emissions based on energy type i by industrial sector j, and Cik represents the amount of CO2 emissions based on energy type i by household sector k. Eij and Eik are the energy consumptions based on energy type i by industrial sector j and household sector j, respectively. Fi is the coefficient of CO2 emissions of the ith energy type (Table 1), and K is the molecular weight ratio of CO2 to carbon (44/12). In this study, CO2 emissions are measured in million tonnes (Mt). The coefficient of CO2 emissions (Fi) is given by the Energy Research Institute of the National Development and Reform Commission, China.
Table 1. Coefficient of CO2 emissions of different energies.
CoefficientUnitsCoalOilNatural Gas
Fi10.74760.58250.4435

2.2. Decomposition of CO2 Emission

Two kinds of decomposition techniques for the influencing factors of CO2 emissions are available in the literature: structural decomposition analysis, which is based on final demands from input-output tables [13,14,15], and index decomposition analysis (IDA), which uses aggregate data at the sector level [16,17,18]. Ang [19] presented a useful summary of the different indexing methods used in IDA and concluded that the LMDI method is the most preferred and widely used method because of its theoretical foundation, adaptability, ease of use, interpretation of results, and other desirable properties in the context of decomposition analysis.
This study adopts the LMDI method proposed by Ang [19] to decompose CO2 emission impact factors. The energy-related CO2 emissions establish the following decomposition model:
  C t o t = i j C i j E i j × E i j E j × E j V j × V j G D P × G D P + i k C i k E i k × E i k E k × E k P k × P k P × P = i j C F × E I s t r × E I int × V s t r × G D P + i j C F × E H s t r × E H int × P s t r × P
where Ctot represents the total amount of CO2 emissions; the subscripts i, j, and k represent the energy type (i = 1, 2, 3, 4), industrial sector (j = 1, 2, 3,…, 6), and household sector (k = 1, 2), respectively; Cij represents the amount of CO2 emissions based on energy type i by industrial sector j; Eij represents the amount of energy consumption based on energy type i by industrial sector j; Ej represents the total energy consumption of the jth industrial sector; Vj represents the output value of the jth industrial sector at constant (2005) prices; GDP represents the gross domestic product at constant (2005) prices; Cik represents the amount of CO2 emissions based on energy type i by household sector k; Eik represents the amount of energy consumption based on energy type i by household sector k; Ek represents the total energy consumption of the kth household sector; Pk represents the population of the kth household sector; and P represents the total population.
The definition of other variables can be found in Table 2.
Table 2. Meaning of each coefficient in decomposition.
VariablesUnitsDefinition
CF1The CO2 emission factor for energy type i by industrial sector j or household sector k, CF = Cij/Eij = Cik/Eik
EIstr%The proportion of the total energy consumption by industrial sector j accounted for by the consumption of energy type i, EIstr = Eij/Ej
EIinttce/104 RMBThe energy intensity of industrial sector j, EIint = Ej/V
Vstr%The proportion of GDP accounted for by the output value of industrial sector j, Vstr = Vj/V
EHstr%The proportion of the total energy consumption by household sector k accounted for by the consumption of energy type i, EHstr = Eik/Ek
EHinttce/personThe energy consumption per capita of household sector k, EHint = Ek/Pk
Pstr%The proportion of the total population accounted for by the population of household sector, Pstr = Pk/P
The changes in energy-related CO2 emissions from years t-1 to t can be calculated using the following equation:
Δ C t o t = C t C t 1          = Δ C I + Δ C H          = Δ C C F + Δ C E I s t r + Δ C E I int + Δ C V s t r + Δ C G D P + Δ C C F + Δ C E H s t r + Δ C E H int + Δ C P s t r + Δ C P
where subscripts t and t-1 denote the values for years t and t-1, respectively; ΔCtot denote the changes in CO2 emissions from years t-1 to t; Ct and Ct-1 denote the total CO2 emissions in years t and t-1, respectively; ΔCI and ΔCH represent the changes in industrial and household CO2 emissions, respectively; and ΔCCF, ΔCEIstr, ΔCEIint, ΔCVstr, ΔCGDP, ΔCEHstr, ΔCEHint, ΔCPstr, and ΔCP refer to the effect of CO2 emission factors, industrial energy mix, industrial energy intensity, industry structure, economic activity, household energy mix, household energy intensity, population structure, and population scale, respectively.
The CO2 emission factors for different energy types in this study are assumed to be constant over time. Therefore, the effect of CO2 emission factors (ΔCCF) on the decomposition is always zero. These factors have changed over time because of the changes in fuel grade, but these changes are so extremely small that they are negligible in the analysis of the macro changes in CO2 emissions [11].
Thus, Equation (3) can be rewritten as follows:
Δ C t o t = Δ C E I s t r + Δ C E I int + Δ C V s t r + Δ C G D P + Δ C E H s t r + Δ C E H int + Δ C P s t r + Δ C P
Applying additive decomposition, the CO2 factors for the consumption of energy type i by industrial sector j or household sector k can be decomposed as follows:
Δ C E I s t r = ij L ( C i j t , C i j t 1 ) ln ( E I s t r t E I s t r t 1 )           Δ C E I int = i j L ( C i j t , C i j t 1 ) ln ( E I int t E I int t-1 ) Δ C V s t r = i j L ( C i j t , C i j t 1 ) ln ( V s t r t V s t r t 1 )               Δ C G D P = i j L ( C i j t , C i j t 1 ) ln ( G D P t G D P t 1 ) Δ C E H s t r = i k L ( C i k t , C i k t 1 ) ln ( E H s t r t E H s t r t 1 )        Δ C E H int = i k L ( C i k t , C i k t 1 ) ln ( E H int t E H int t 1 ) Δ C P s t r = i k L ( C i k t , C i k t 1 ) ln ( P s t r t P s t r t 1 )             Δ C P = i k L ( C i k t , C i k t 1 ) ln ( P t P t 1 )
where function L(x, y) is the logarithmic average of the two positive numbers x and y, defined as
L ( x , y ) = { ( x y ) / ( ln x ln y ) , x , 0 , x y x = y x = y = 0
In order to calculate the contribution of each effect on total amount of CO2 emissions, we form
( Δ C E I s t r Δ C + Δ C E I int Δ C + Δ C V s t r Δ C + Δ C G D P Δ C + Δ C E H s t r Δ C + Δ C E H int Δ C + Δ C P s t r Δ C + Δ C P Δ C ) × 100 % = 100 %

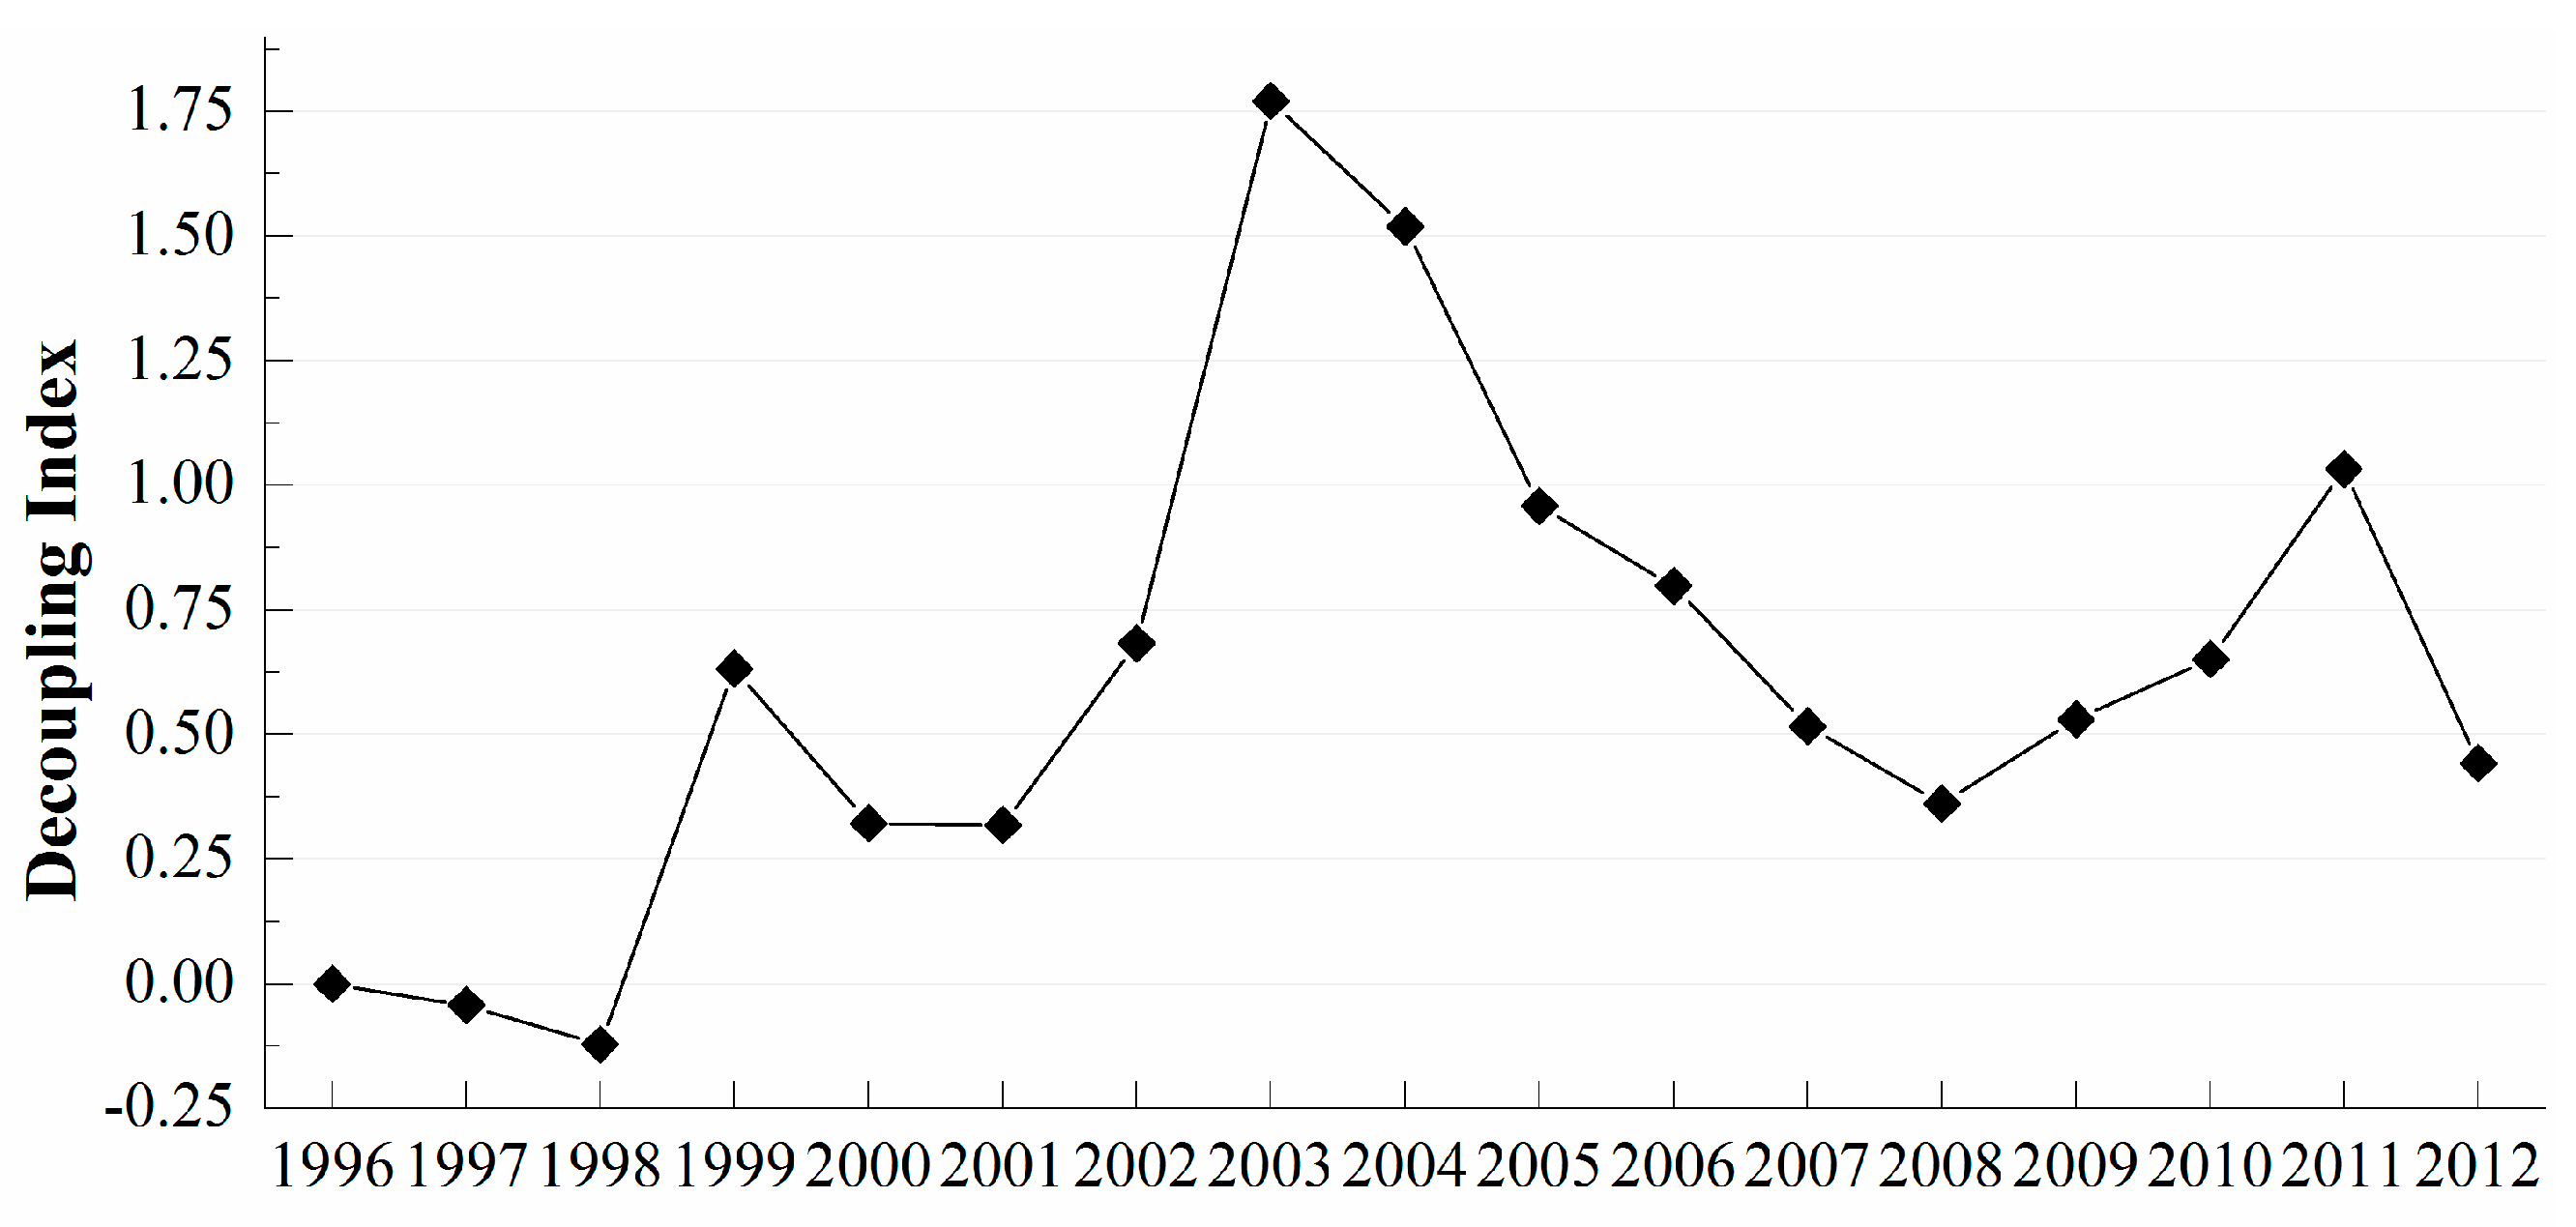
2.3. Decoupling CO2 Emissions from Economic Growth

The relationship between energy-related CO2 emissions and economic growth can be examined using a decoupling index [20]. The term decoupling refers to breaking the link between CO2 emissions and economic performance. The decoupling indicator is defined as follows:
D i = % Δ C % Δ G D P = ( C t C t 1 ) / C t ( G D P t G D P t 1 ) / G D P t
where subscripts t and t-1 denote the values for years t and t-1, respectively; Di is the decoupling indices of CO2 emissions from years t-1 to t; ΔC denote the changes in CO2 emissions from years t-1 to t; Ct and Ct-1 denote the total CO2 emissions in years t and t-1, respectively; ΔGDP denote the changes in gross domestic product at constant (2005) prices from years t-1 to t; GDPt and GDPt-1 represent the gross domestic product at constant (2005) prices in years t and t-1, respectively.
According to the relationship between CO2 emission changes and economic development, the growth rate of GDP and indicator of CO2 emissions can be decoupled or negatively decoupled [21]. Decoupling can be further divided into three logical possibilities: weak decoupling occurs when GDP and CO2 emissions both increase (and 0 ≤ Di ≤ 1); strong decoupling occurs when GDP increases and CO2 emissions decrease (and Di < 0); and recessive decoupling occurs when GDP and CO2 emissions both decrease (and Di > 1). Negative decoupling similarly includes three logical possibilities: expansive negative decoupling occurs when GDP and CO2 emissions both increase (and Di > 1); strong negative decoupling occurs when GDP decreases and CO2 emissions increase (and Di < 0); and weak negative decoupling occurs when GDP and CO2 emissions both decrease (and 0 ≤ Di ≤ 1).

3. Data Description

Based on the classification of China Statistical Yearbooks 1996–2013 [22], this study analyzes six industrial sectors and two household sectors: (1) agriculture, (2) industry, (3) construction, (4) transport, (5) wholesale and retail, (6) other industrial sectors, (7) urban households, and (8) rural households. Agriculture includes forestry, animal husbandry, and fishery; transport refers to storage and post; wholesale and retail include wholesale, retail, accommodation and catering.
Given the availability of data, this study classifies all fossil energy into three types: coal, oil, and natural gas, which constitute 93.35% of the total primary energy consumption in China according to the BP Statistical Review of World Energy [23]. Given that thermal power and heat are secondary energy that have already been calculated based on the type of fuel consumed to generate electricity and heat, the present study considers only hydropower, wind power, and solar power and defines them as renewable energy to avoid tautologically calculating the consumption of coal, oil, and natural gas in the electricity generation process. The data on the energy consumption for each sector used in this study mainly come from China Energy Statistical Yearbooks 1996–2013 [24], and the data on population and economy come from China Statistical Yearbooks 1996–2013 [22]. In the calculation of calorific value, the GDP and energy data are in billion yuan at constant 2005 prices and in million tonnes of coal equivalent (Mtce), respectively.

4. Results and Discussion

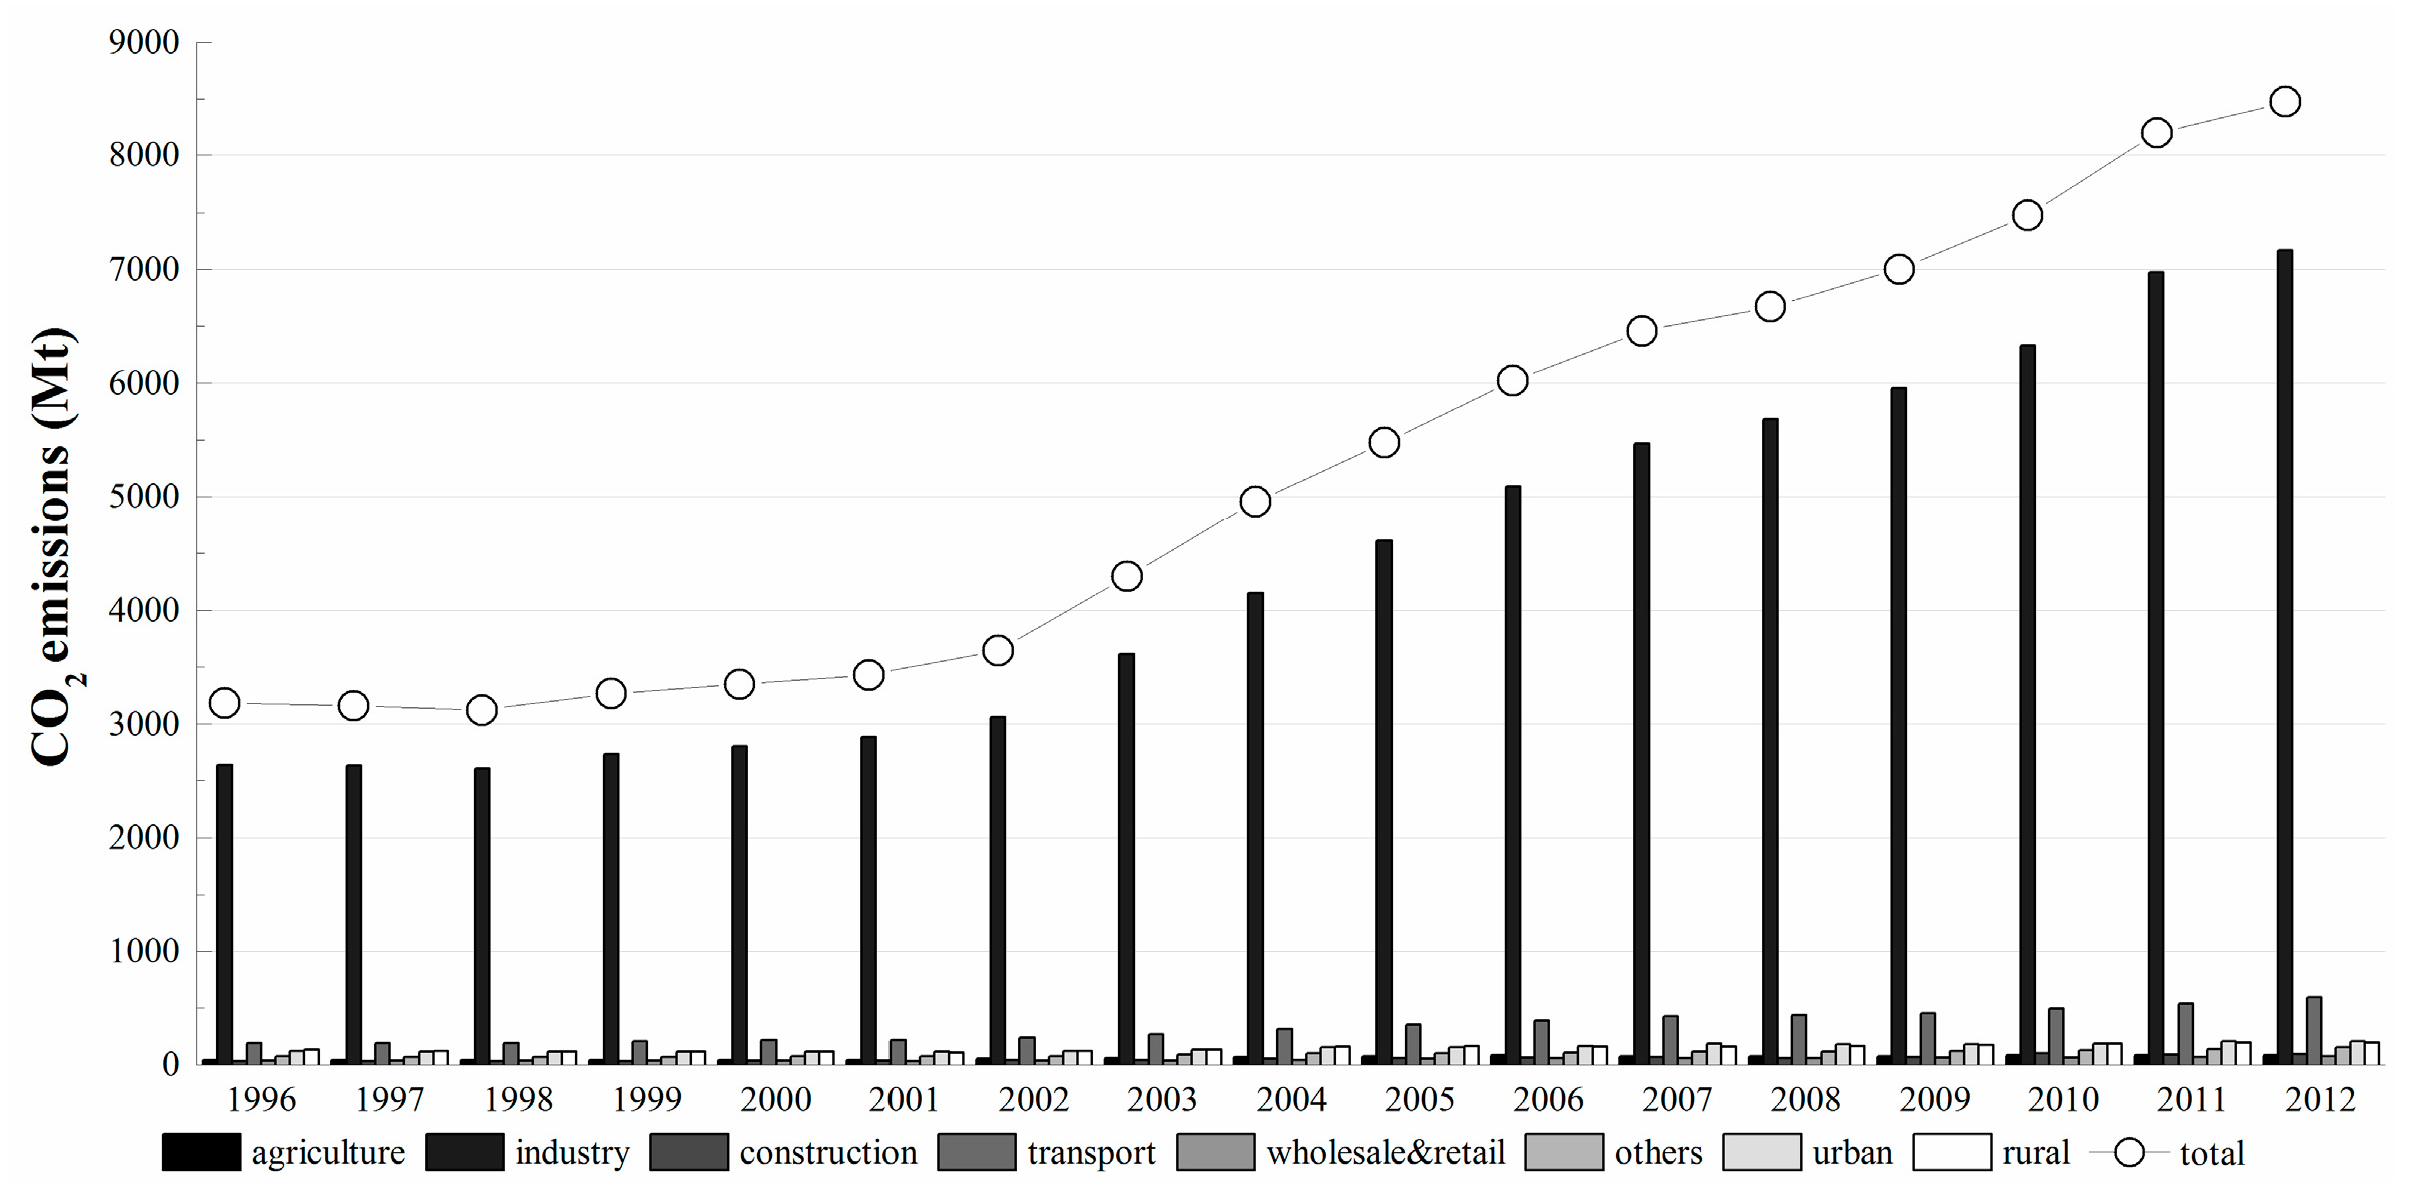
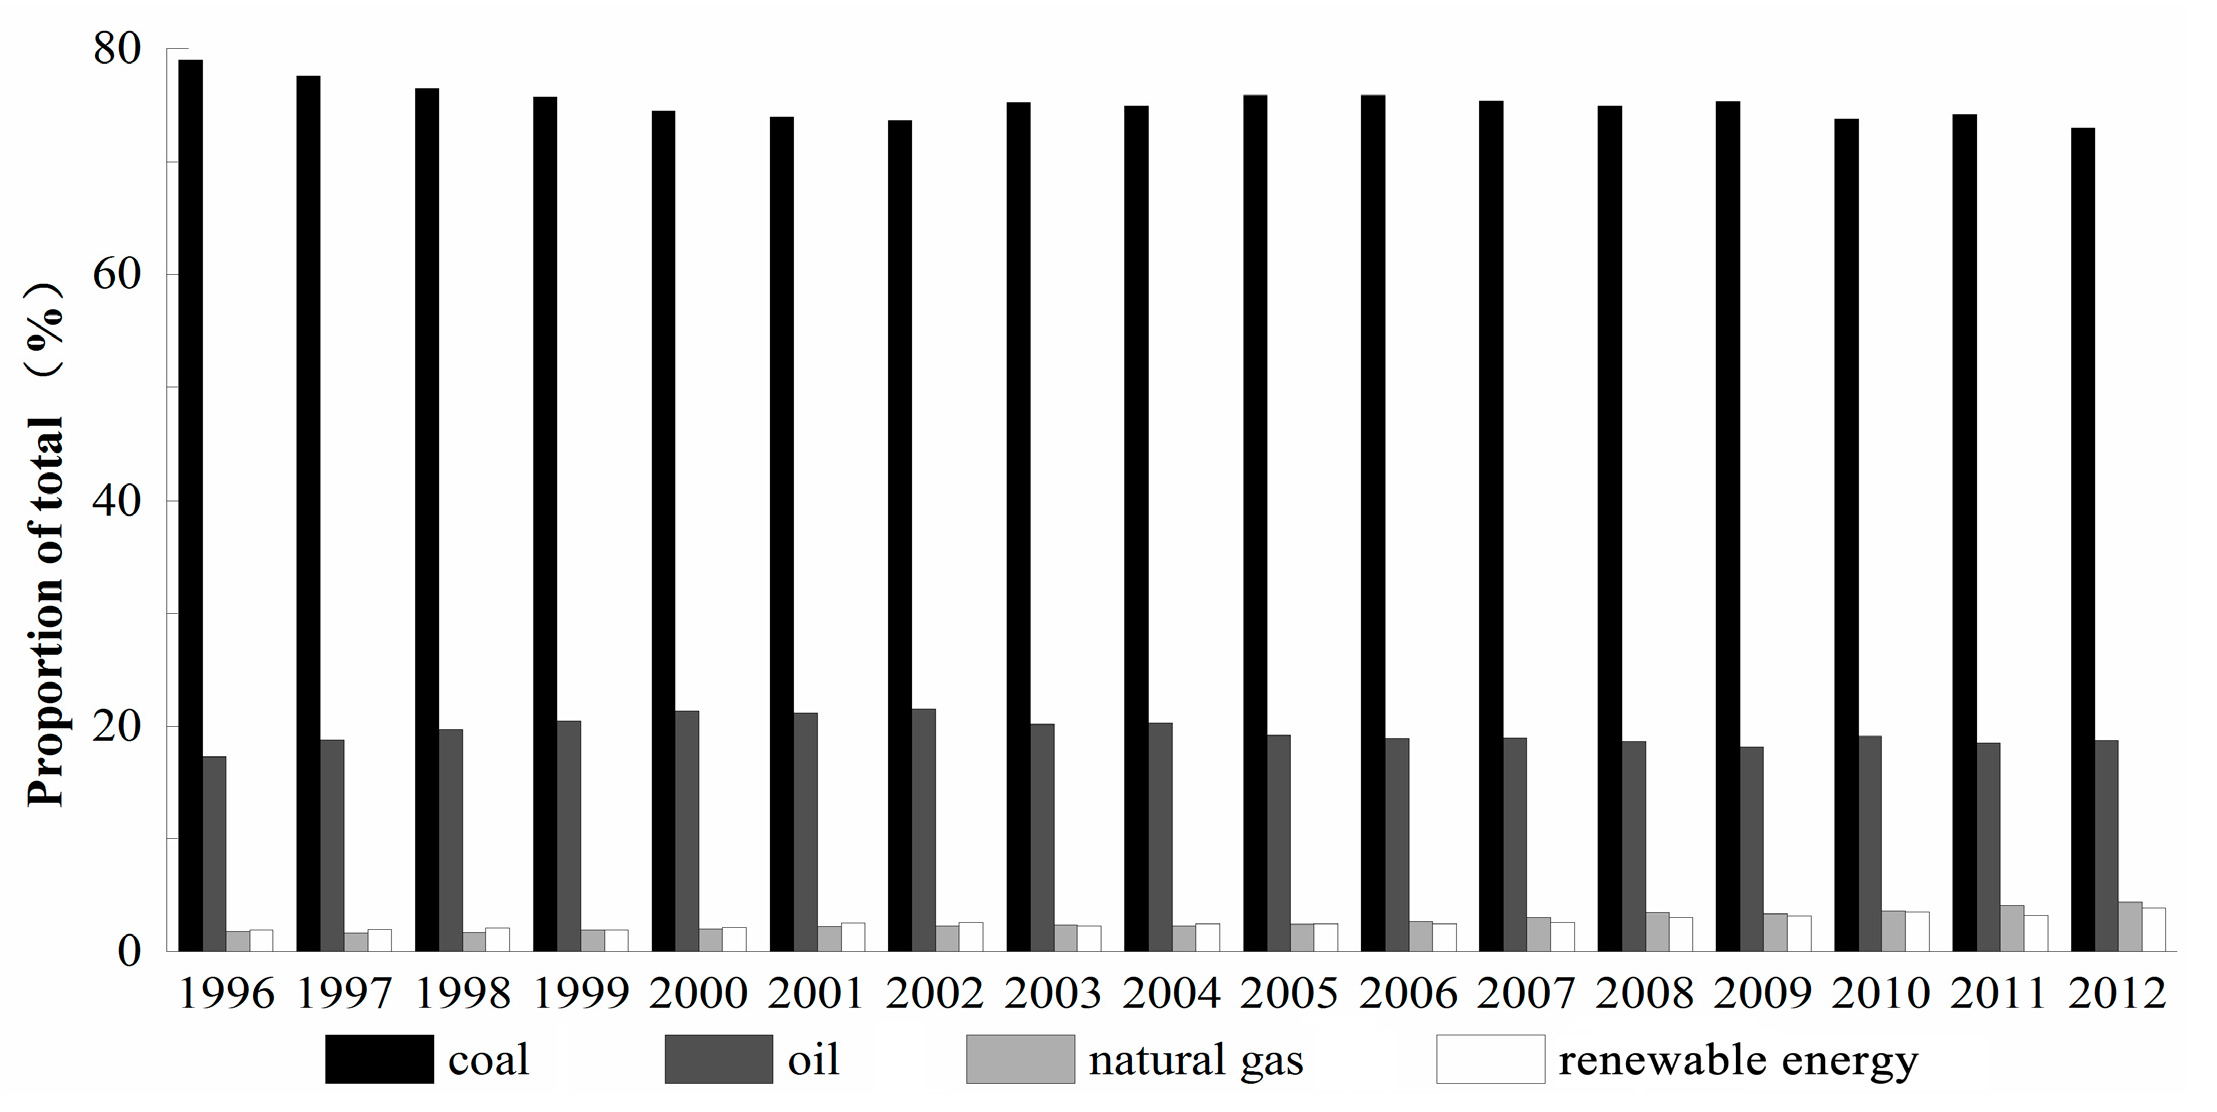
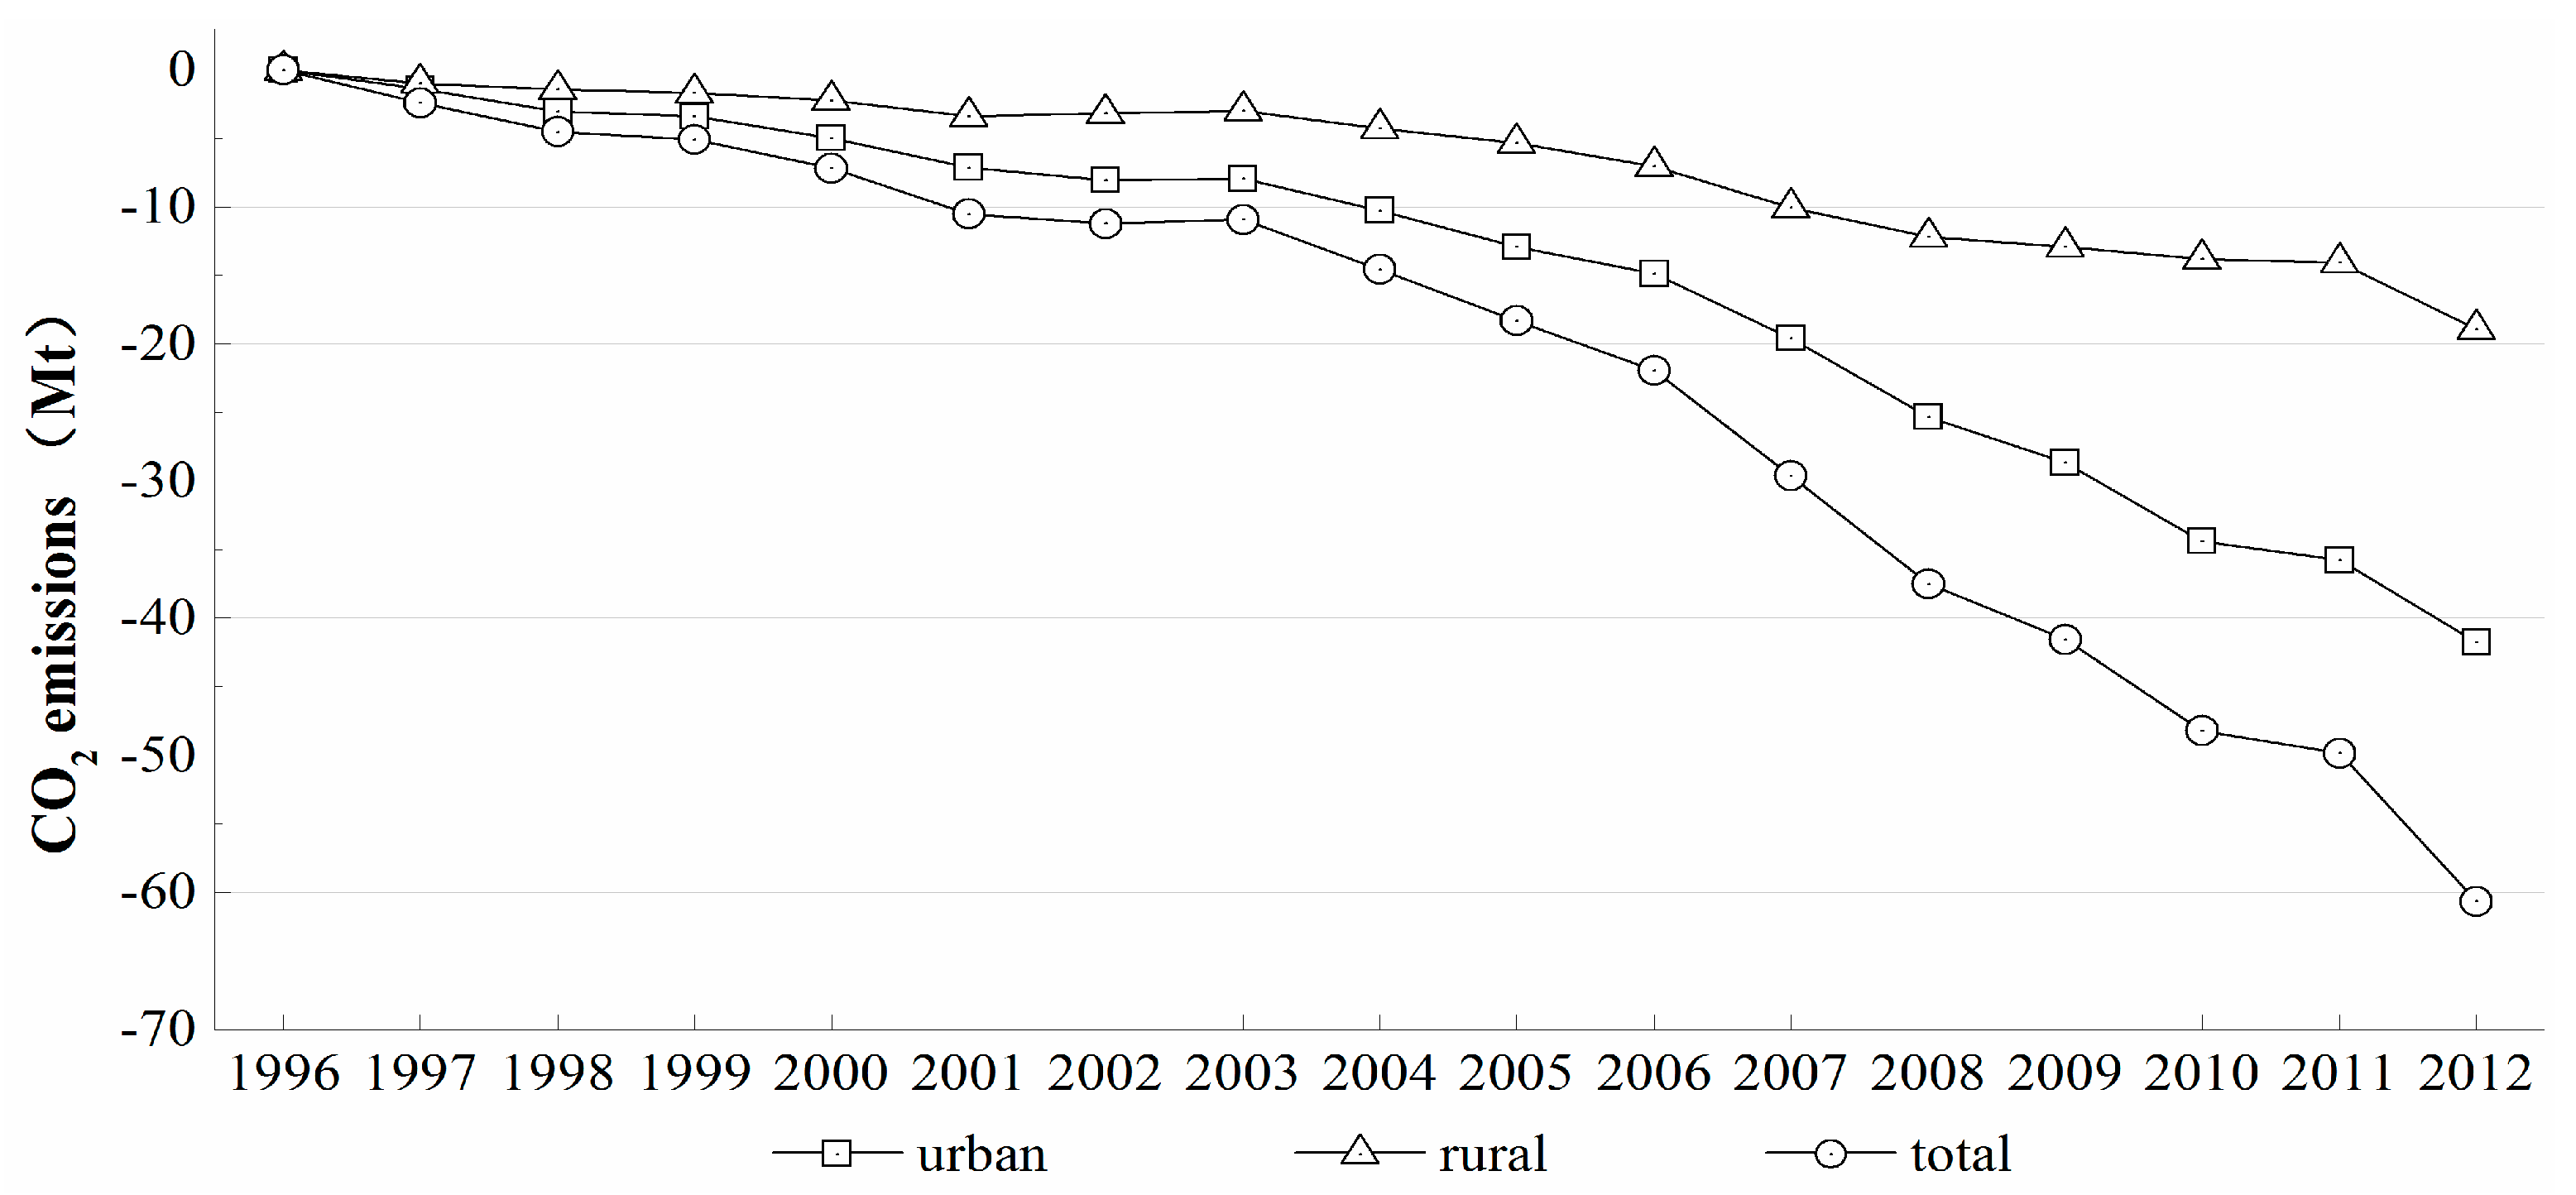
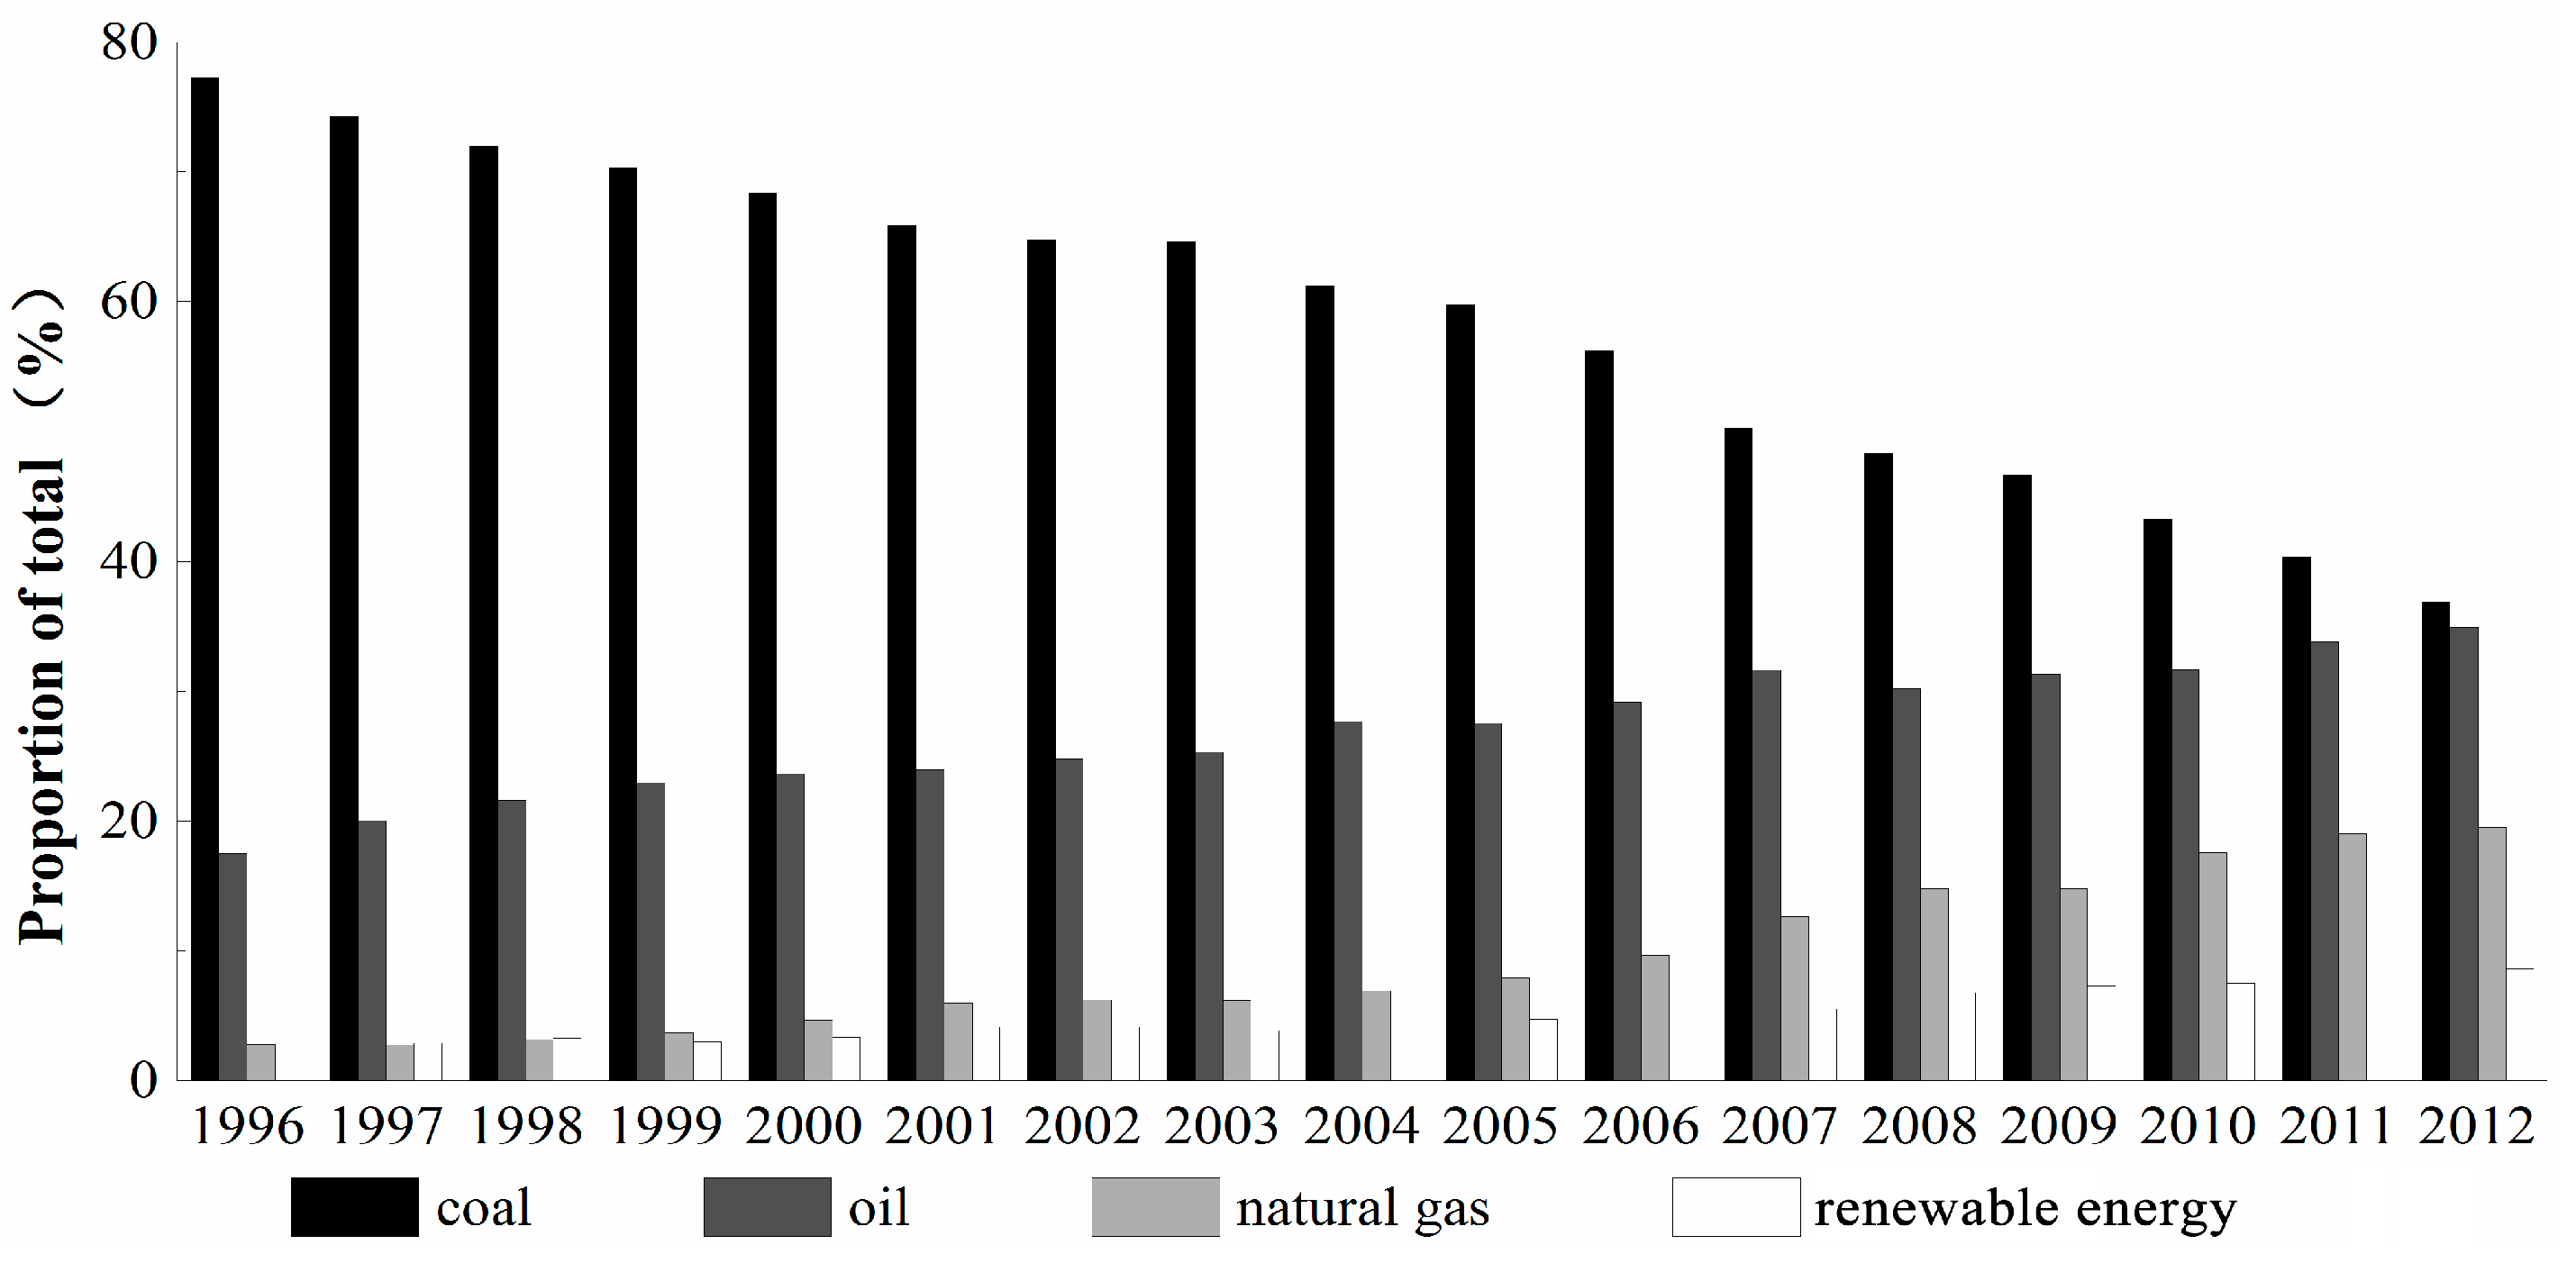
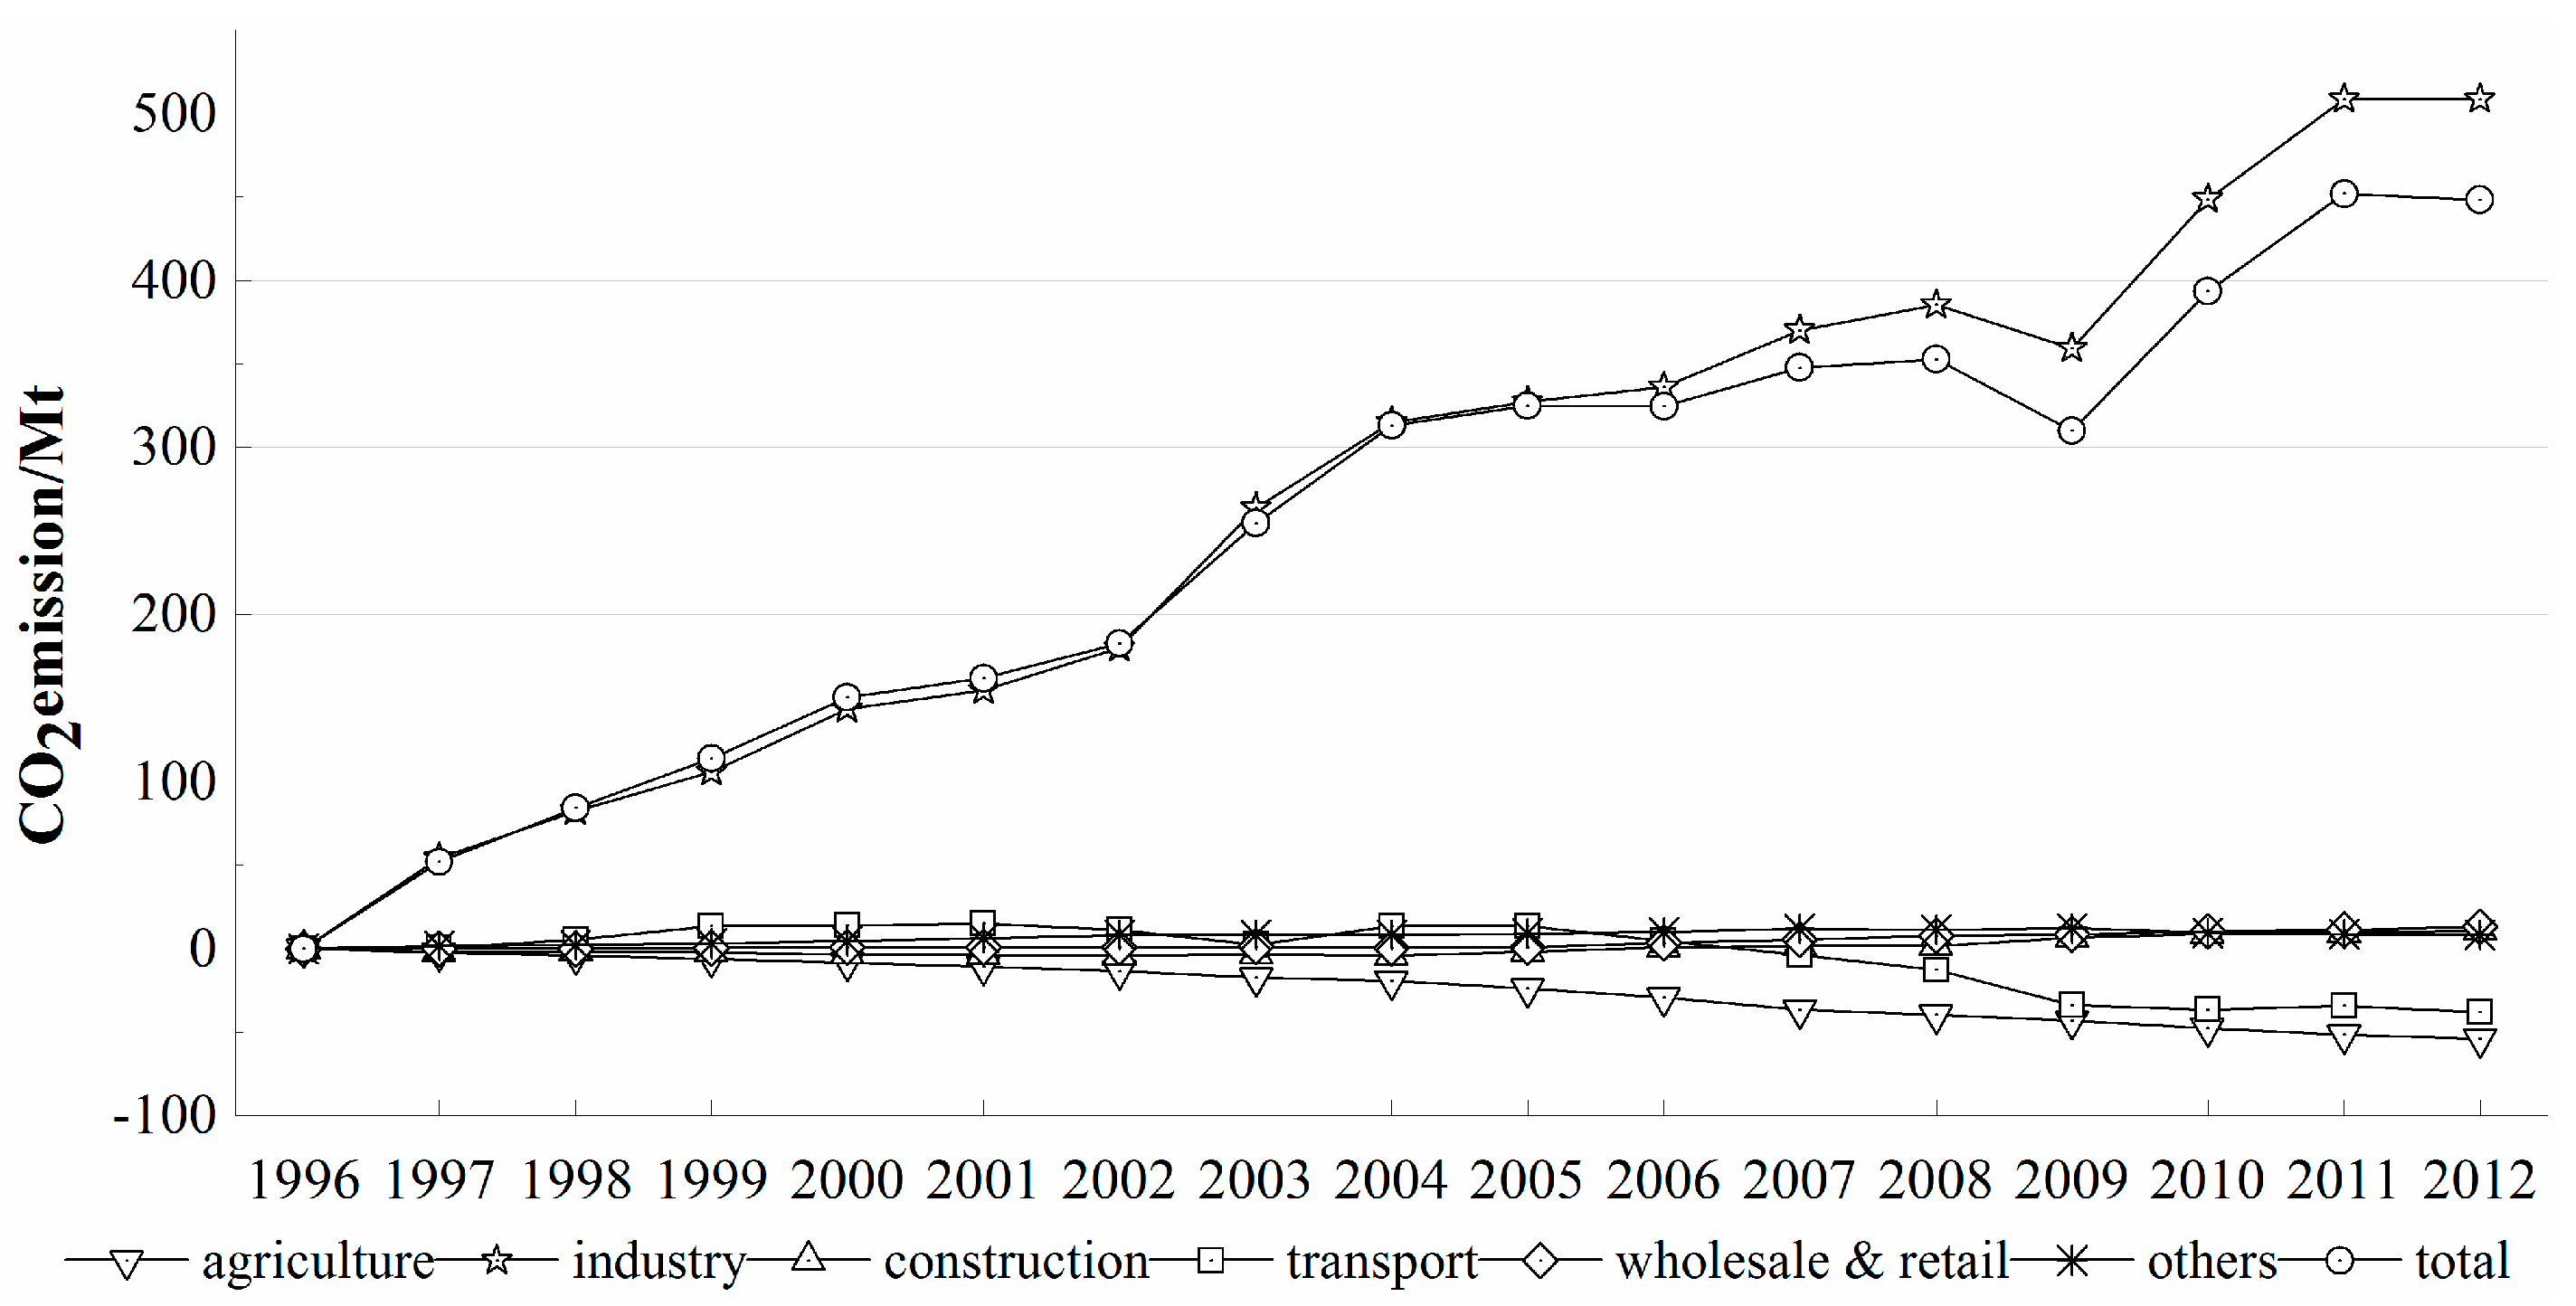
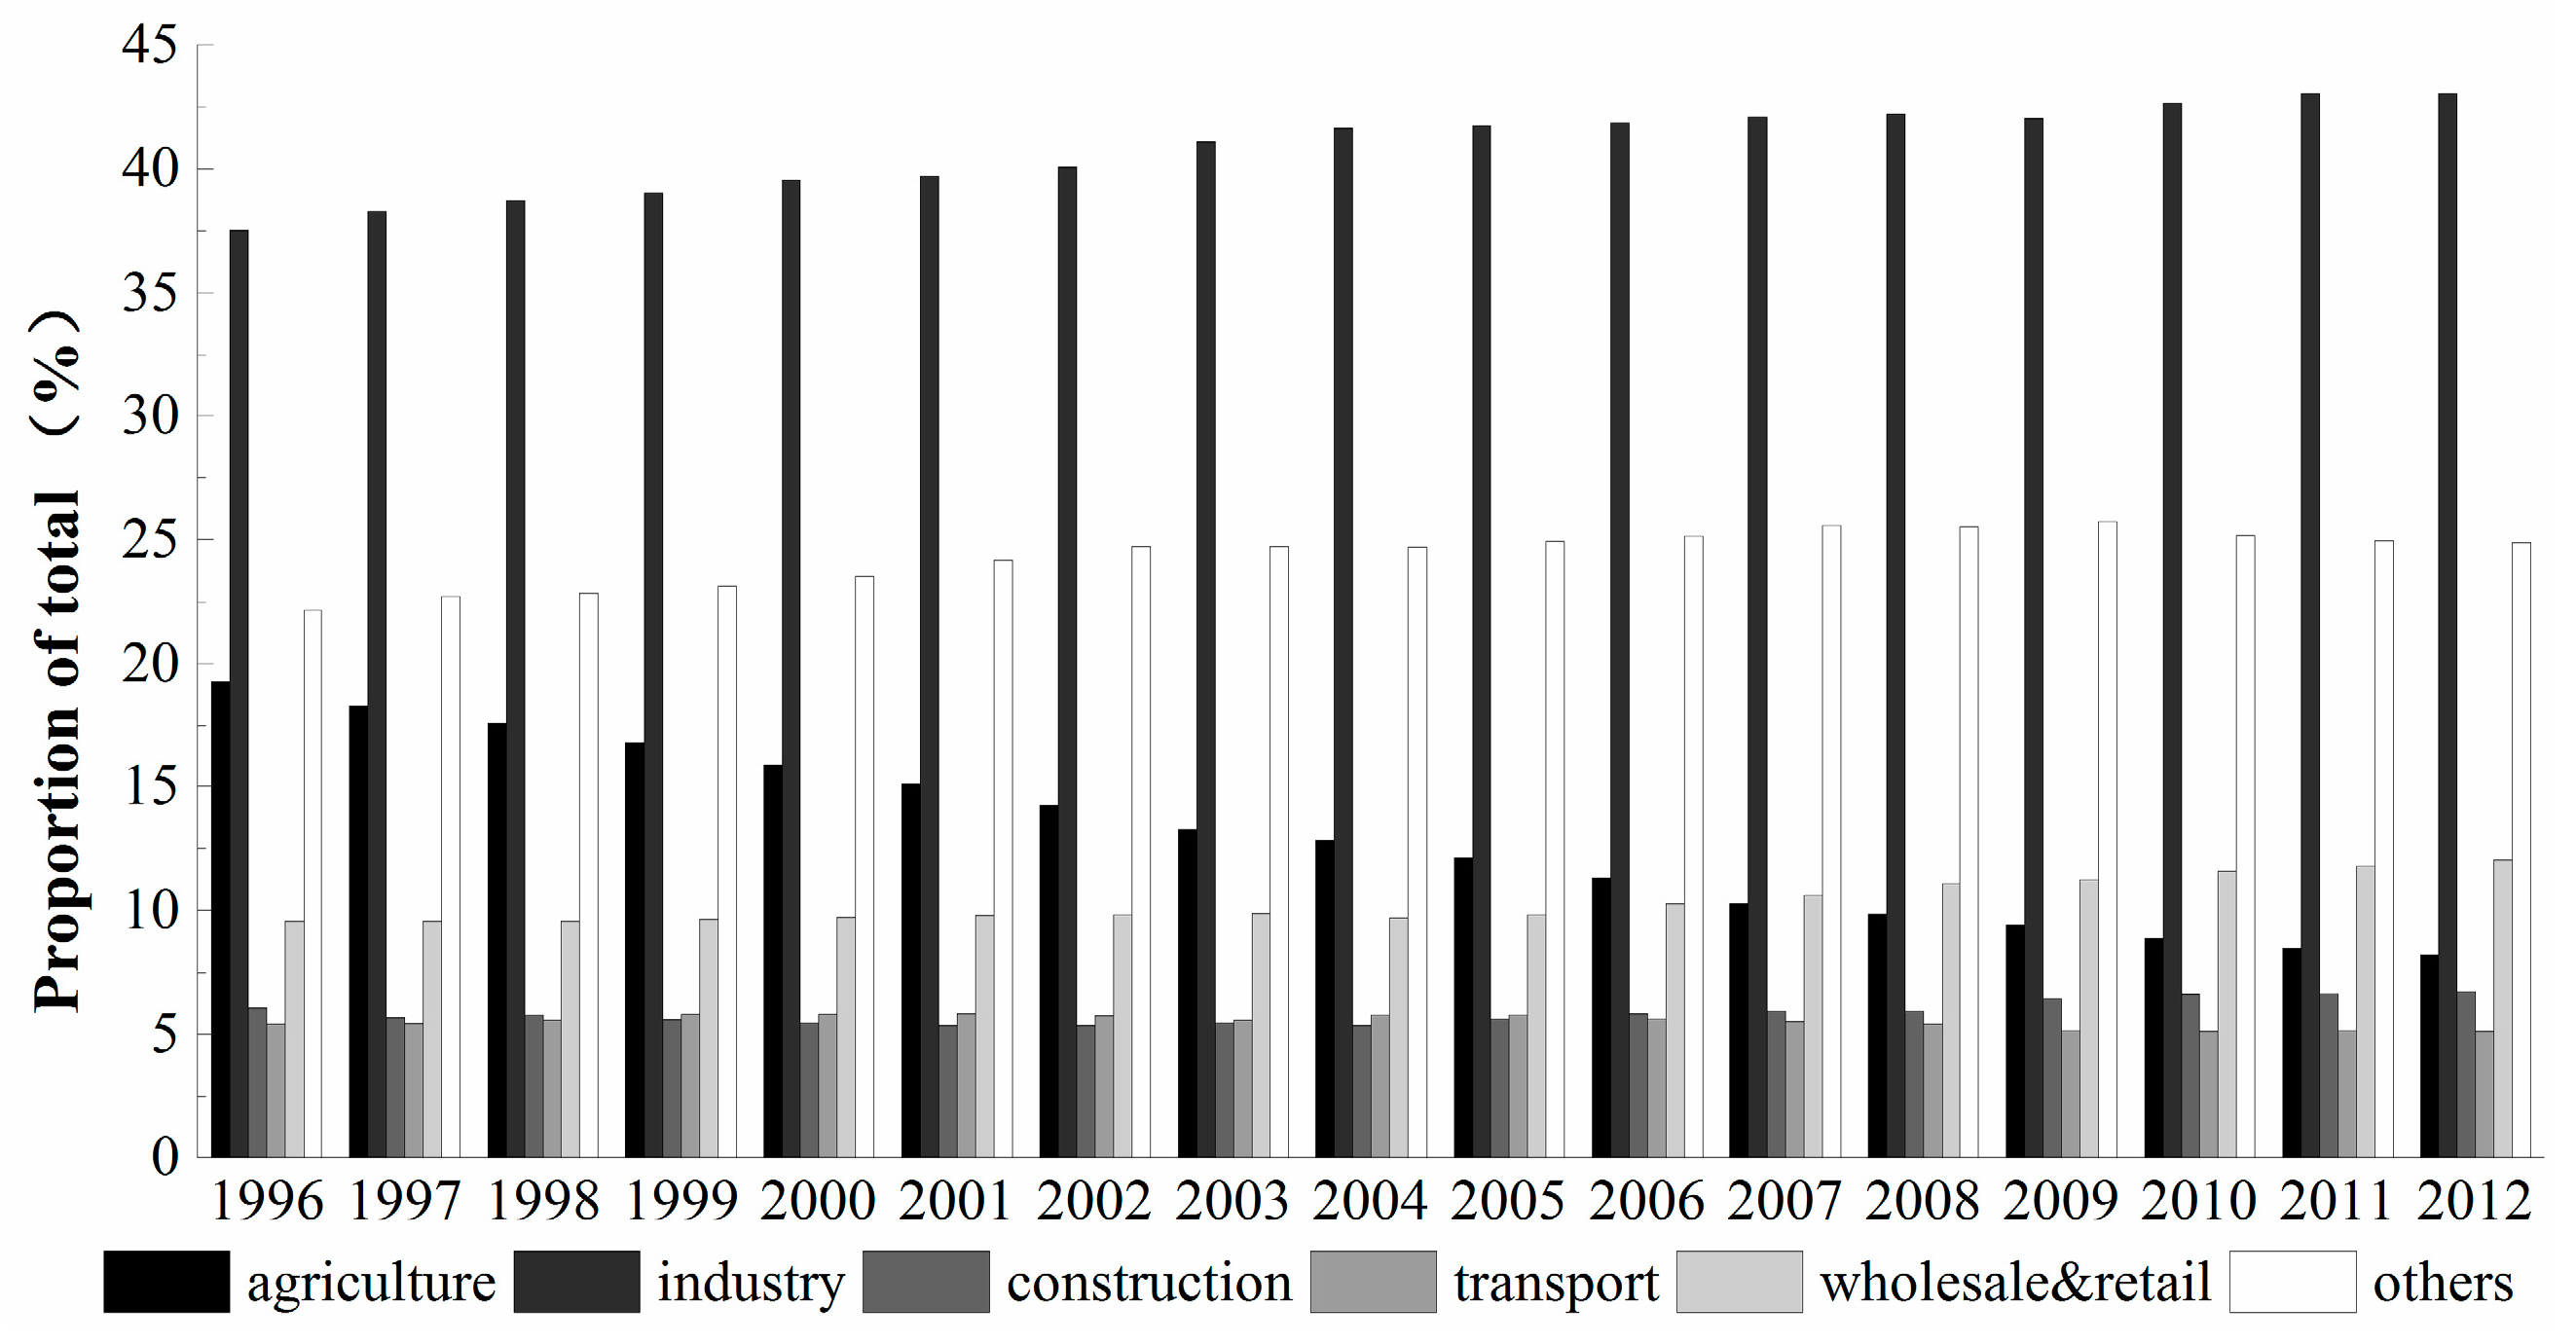
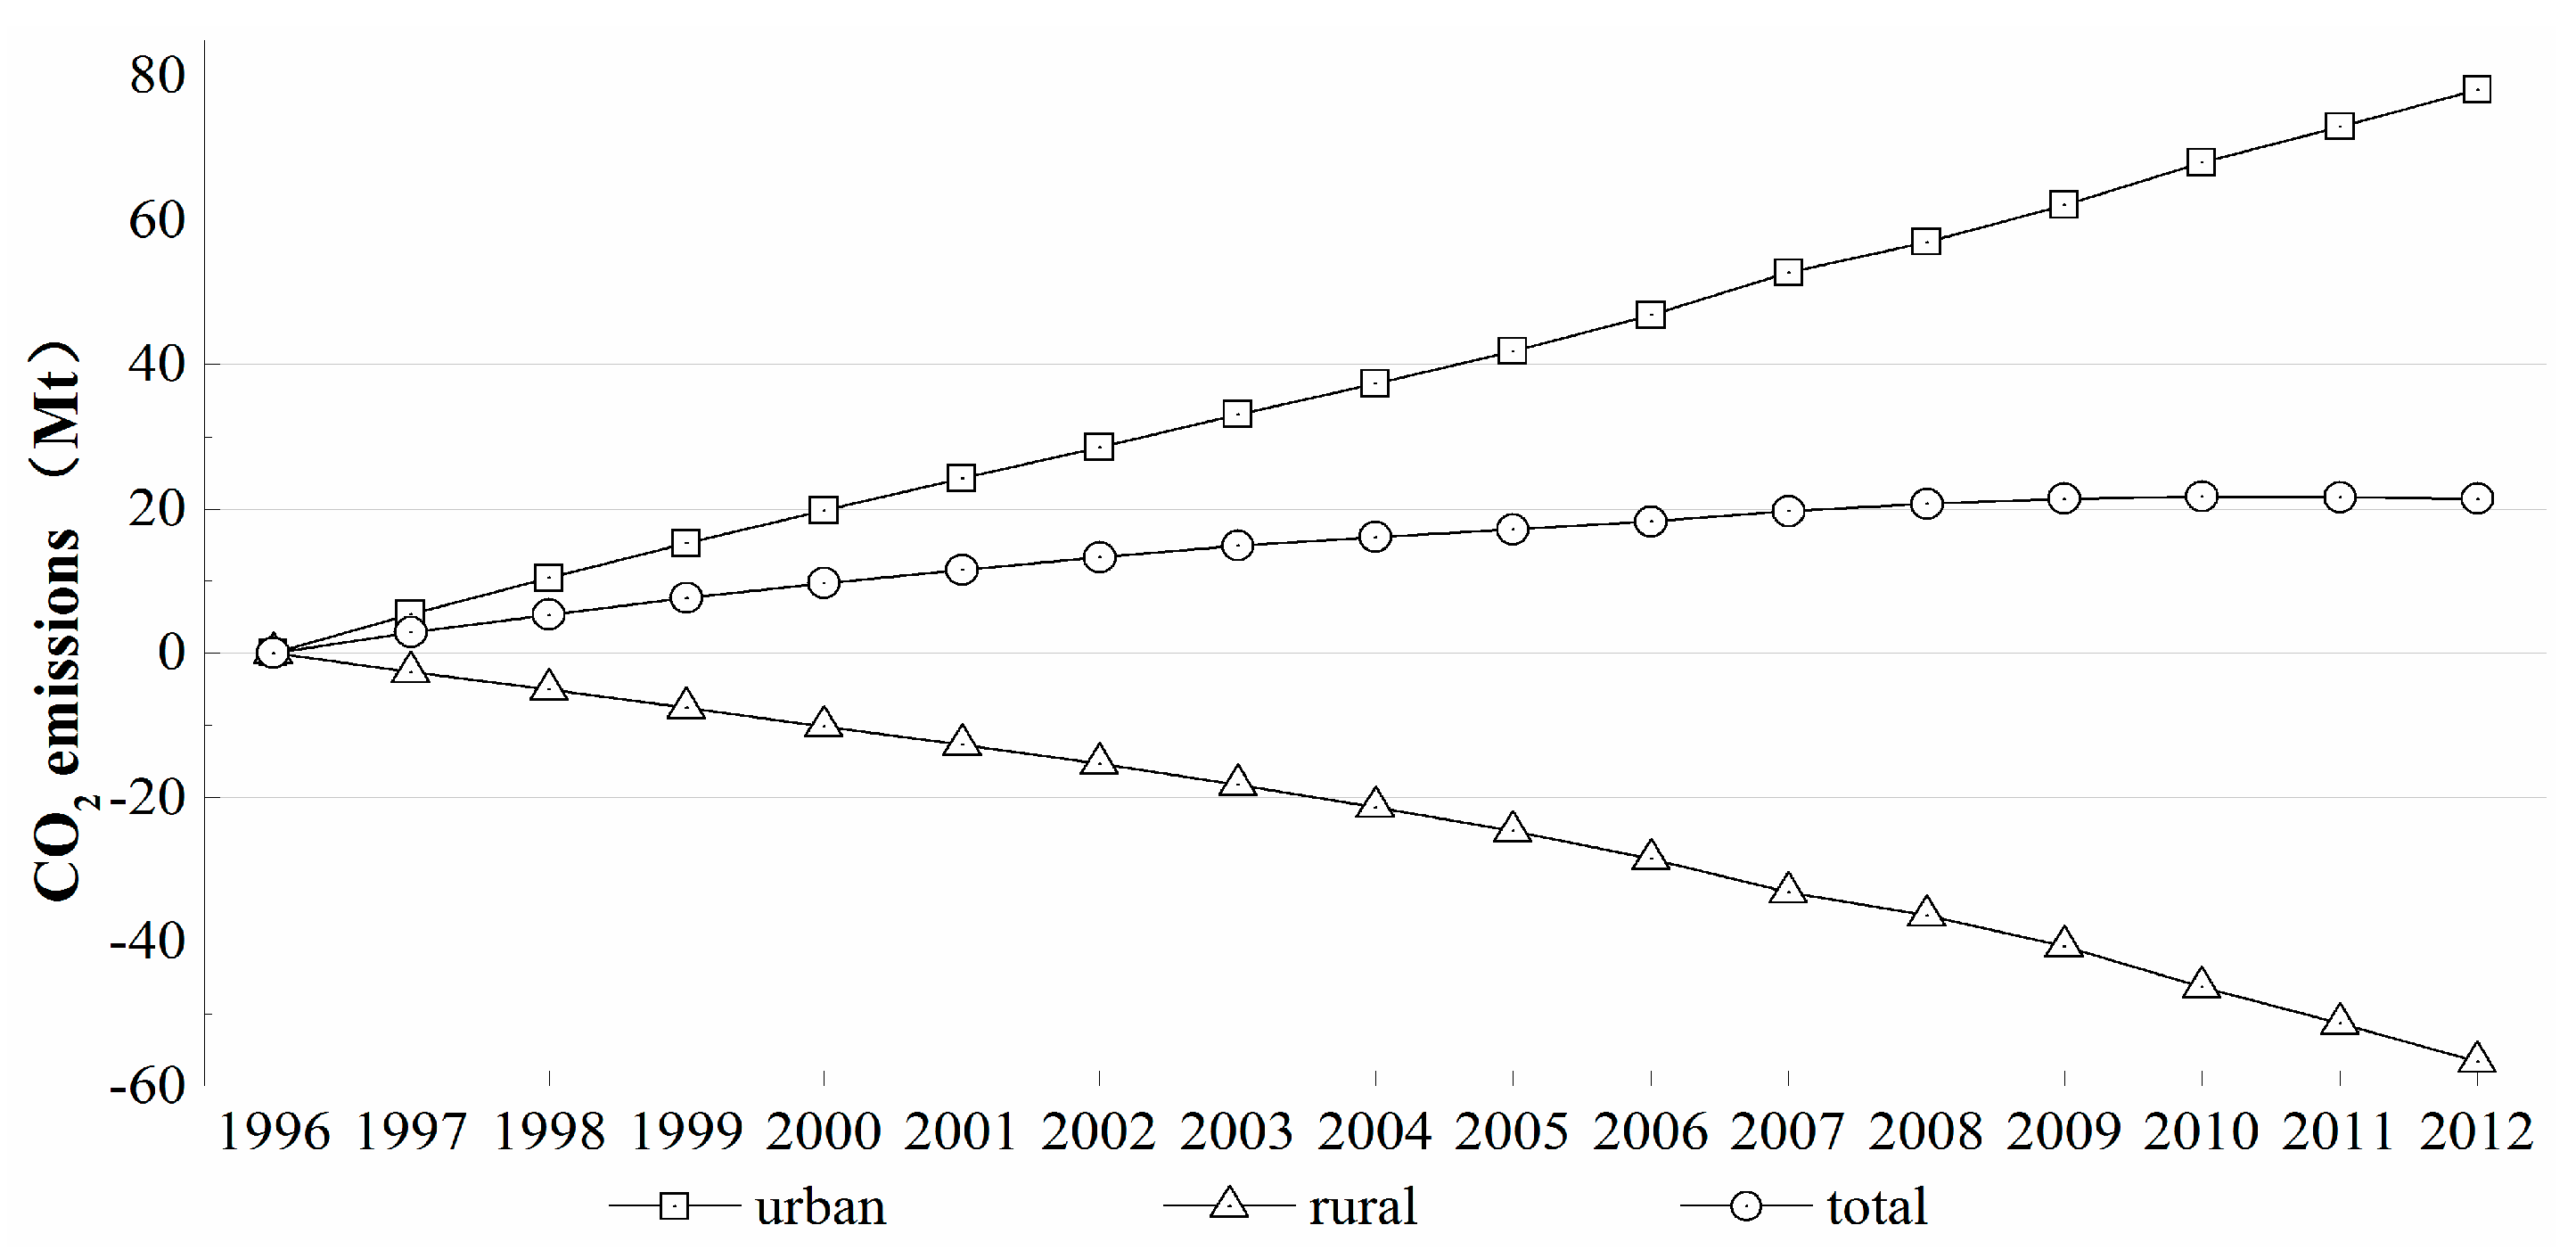
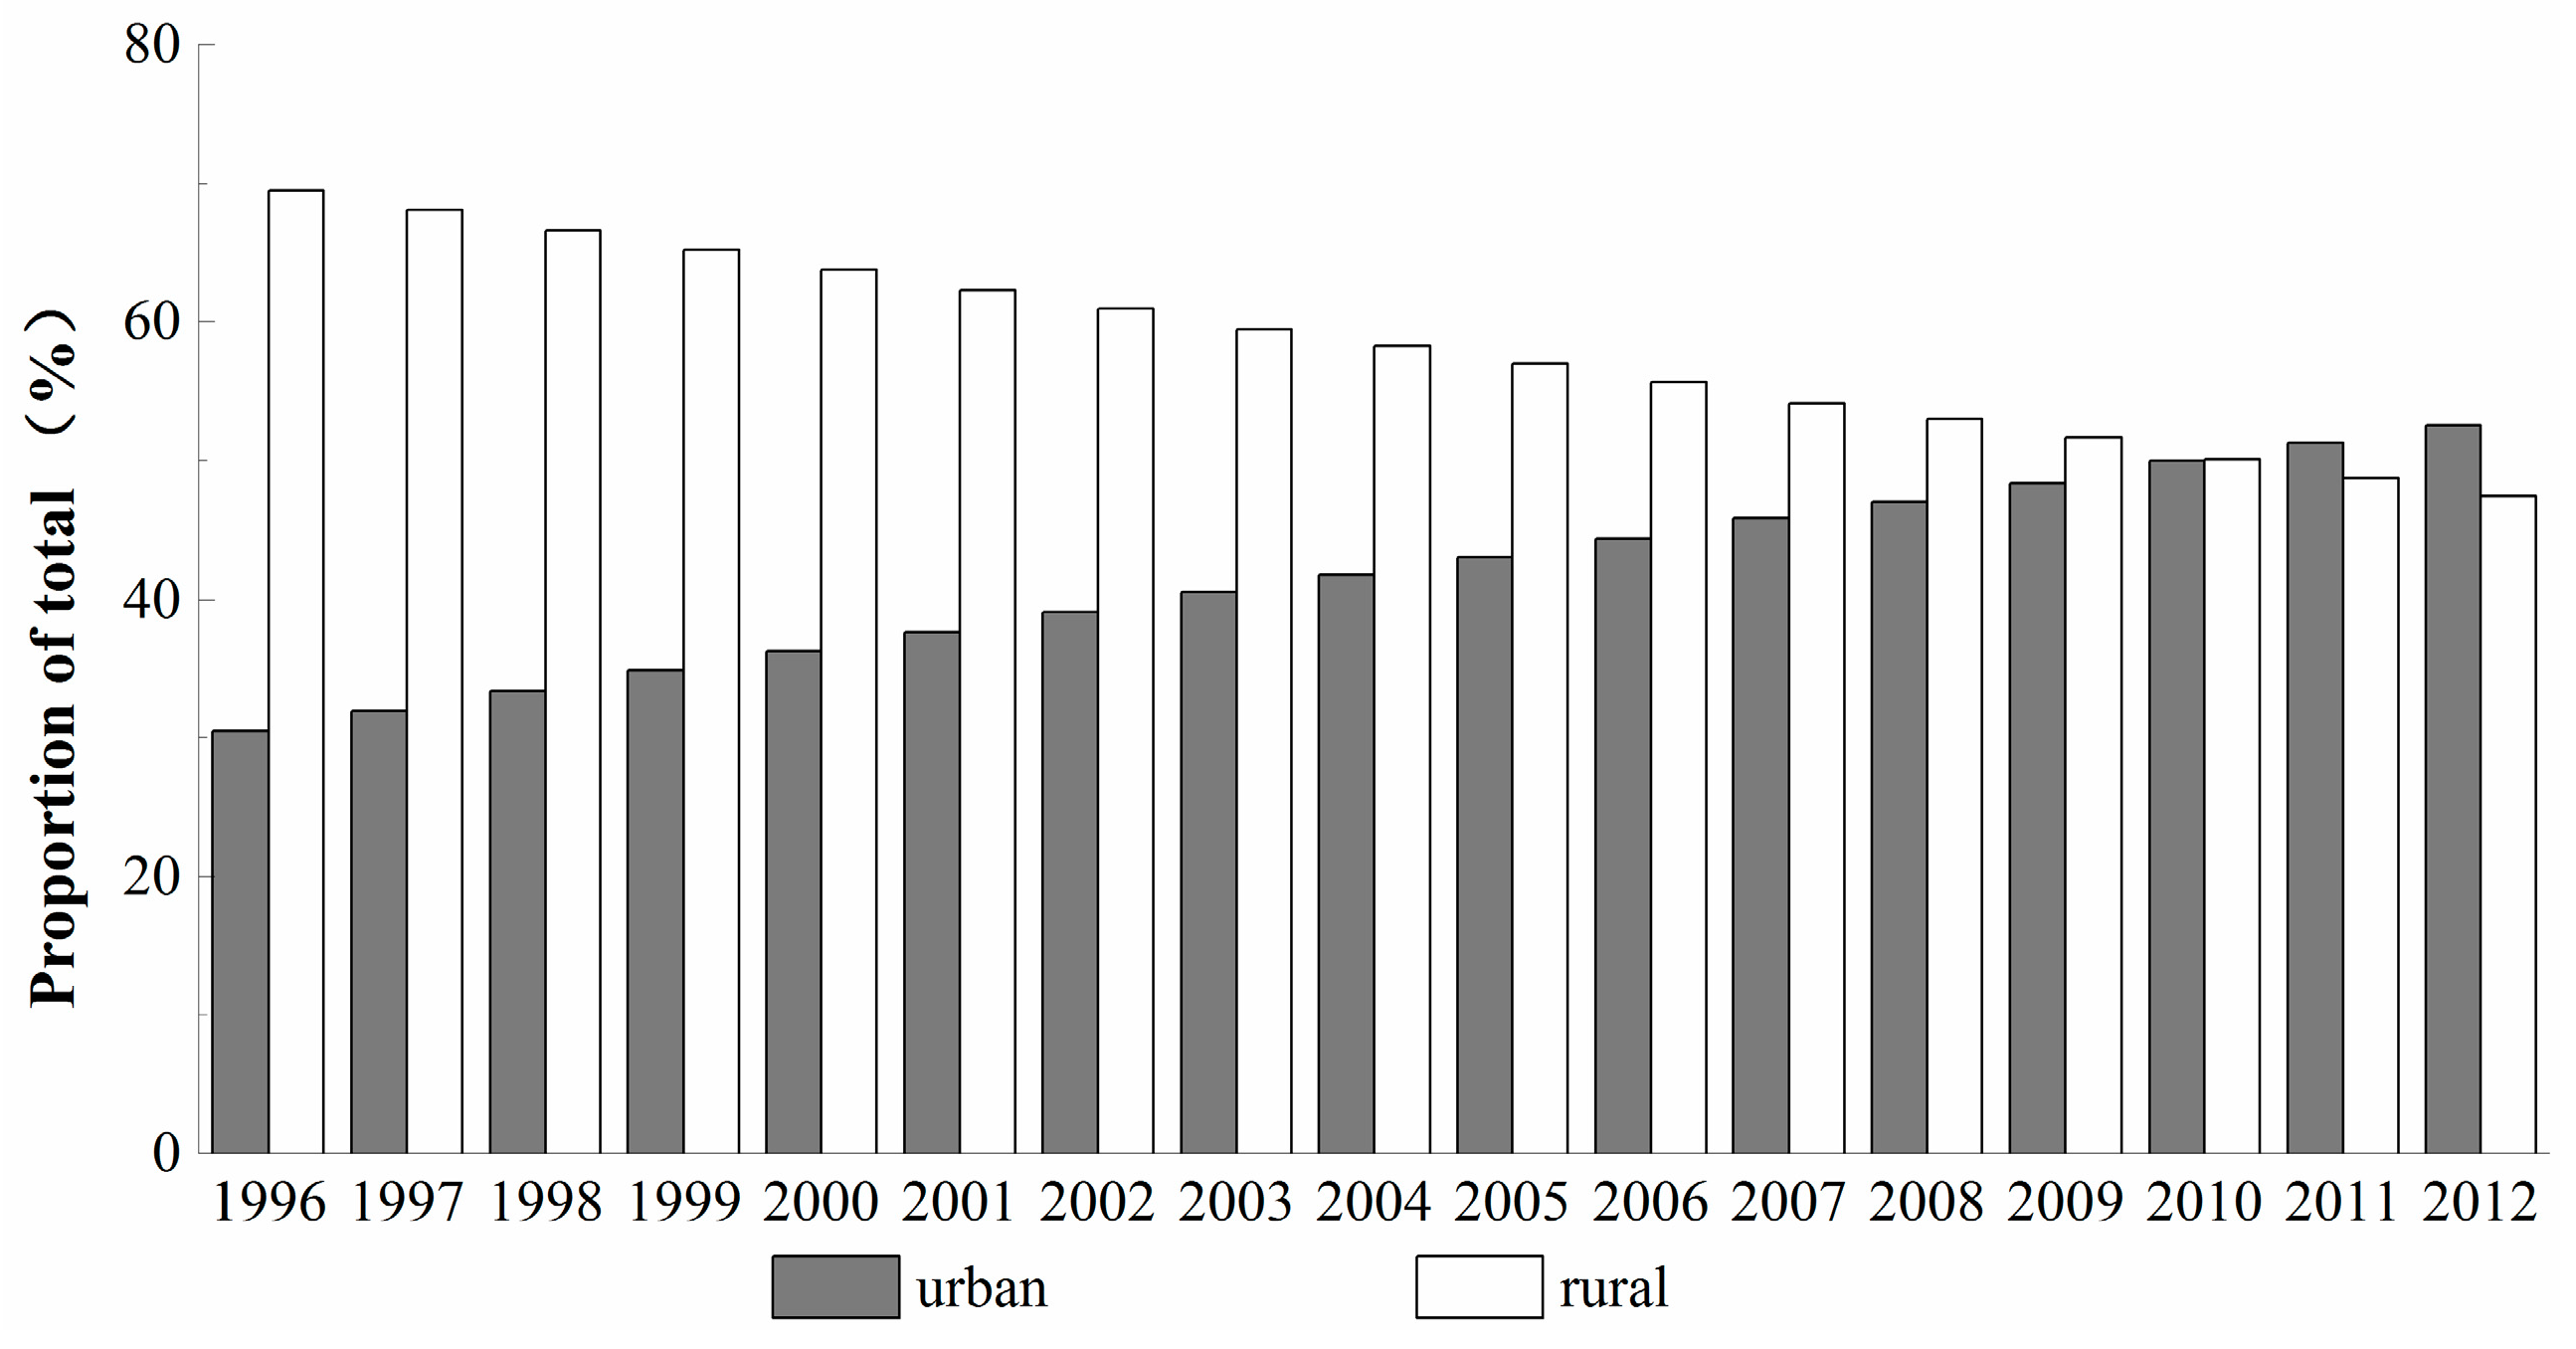
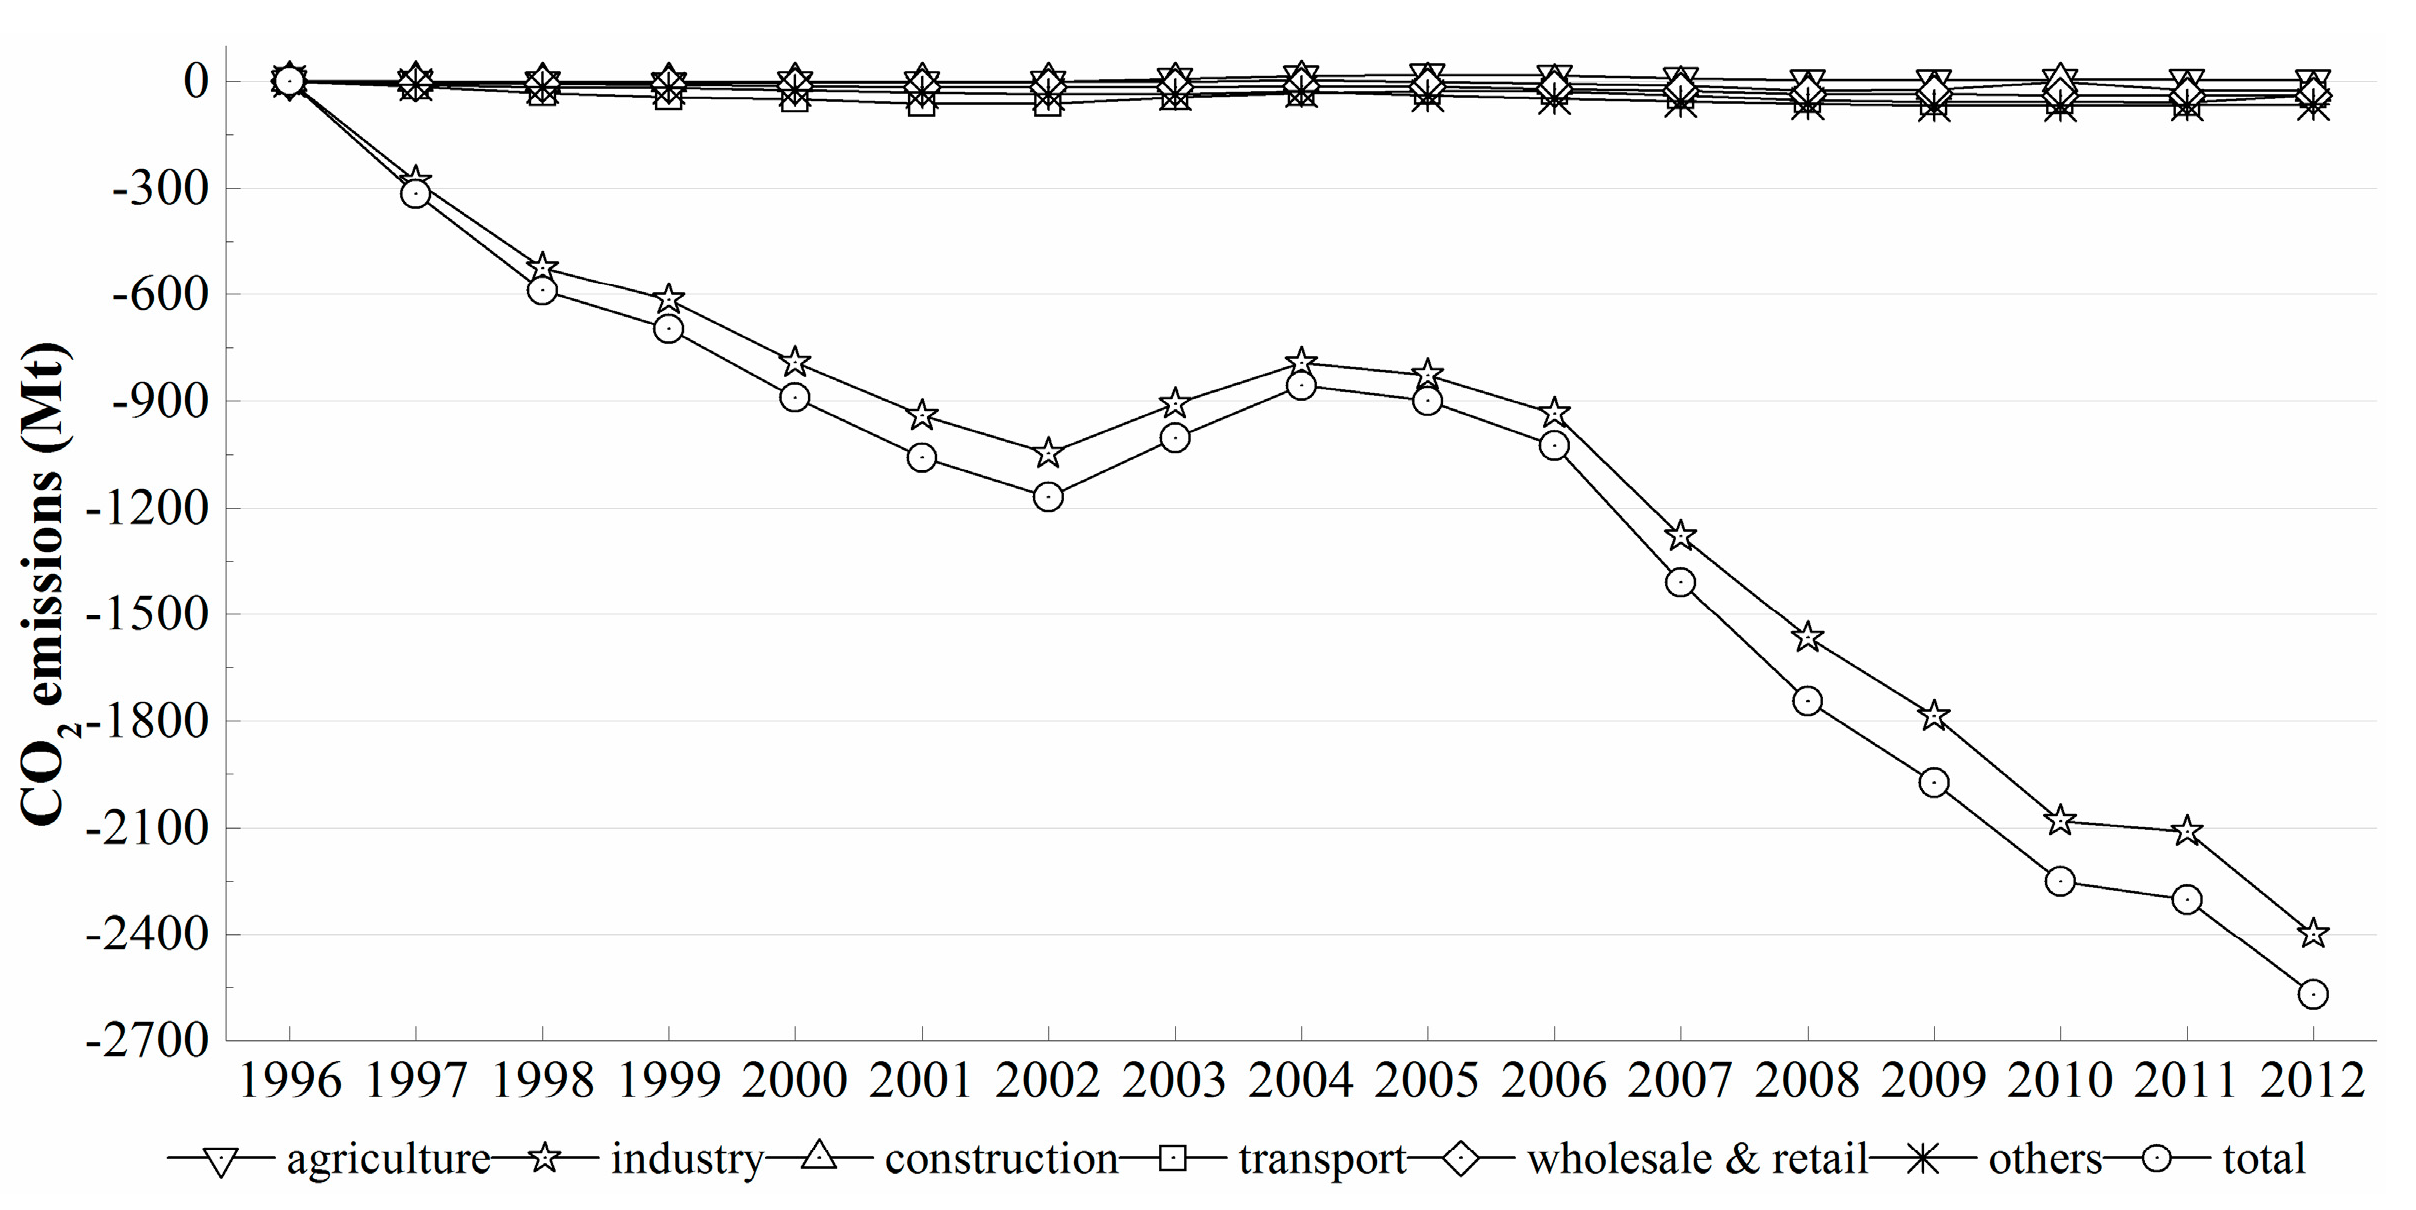
4.1. CO2 Emission Analysis

According to Equation (1) and Table 1, the resultant energy-related CO2 emissions in China over the period 1996–2012 are presented in Figure 1. The aggregate CO2 emissions increased from 3273.81 Mt in 1996 to 8557.03 Mt in 2012, as a result of an annual growth rate of 6.19%. According to the growth rate of CO2 emissions, the changes in CO2 emissions in China can be divided into three stages: 1996–1998, 1999–2002, and 2003–2012. The amount of CO2 emissions decreased by 64.52 Mt from 1996 to 1998. From 1999 to 2002, CO2 emissions slowly increased, from 3354.77 Mt to 3732.38 Mt, following an annual growth rate of 3.62%. Since 2003, the increasing trend of CO2 emissions rapidly increased to about 95.33% from 2003 to 2012, following an annual growth rate of 7.72%.
Figure 1 also shows that the main energy type for CO2 emissions in China is coal, which accounts for more than 80% of CO2 emissions. The proportion of the total CO2 emissions accounted for by coal continuously decreased from 84.46% in 1996 to 80.94% in 2012. However, between 1996 and 2012 that accounted for by oil increased from 14.4% to 16.18% and gas increased from 1.14% to 2.88%.
Figure 2 illustrates that the proportion of the total CO2 emissions accounted for by industry continuously increased and reached 83.7% in 2012. Therefore, the industry sector has the largest influence on the total CO2 emissions and thus directly impacts changes in the total CO2 emissions. Transport is the second most significant source of CO2 emissions whose emissions increased from 5.86% in 1996 to 6.94% of total emissions in 2012. The proportion of total CO2 emissions accounted for by the household sector decreased from 7.68% in 1996 to 4.65% 2012. Meanwhile, the proportion accounted for by agriculture, construction, wholesale and retail, and other industrial sectors remained constant at around 1% during the study period.
Figure 1. CO2 emissions of different energy types in China (1996–2012).
Sustainability 07 14408 g001
Figure 2. CO2 emissions of different industrial and household sectors in China (1996–2012).
Sustainability 07 14408 g002

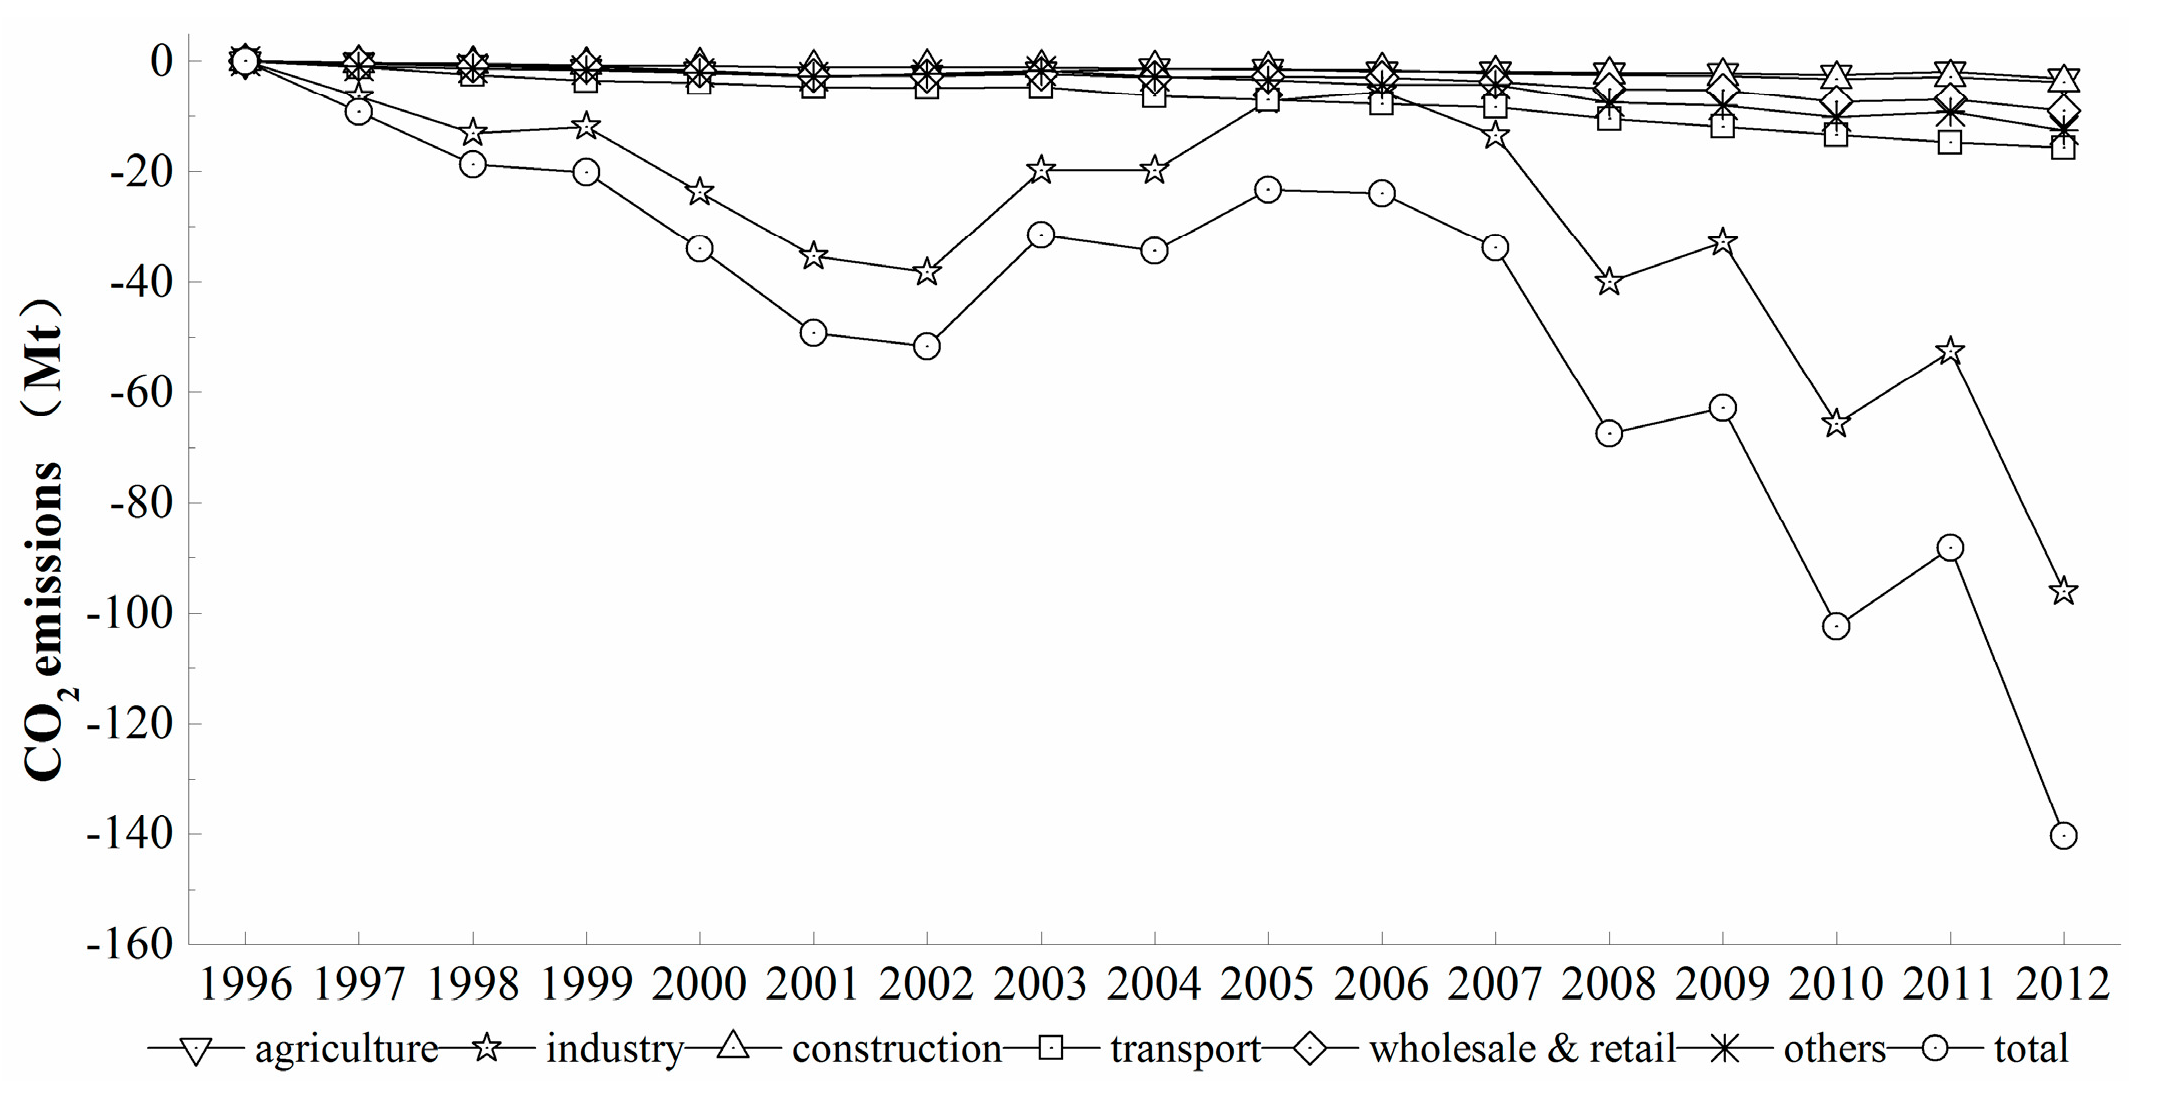
4.2. Decomposition Analysis

Influencing factors of energy-related CO2 emissions in China can be decomposed using Equation (7). The results, presented in Table 3, reveal that industrial structure, economic activity, household energy intensity, population structure, and population scale are the main drivers of CO2 emissions, whereas industrial energy intensity, industrial energy structure, and household energy structure are the inhibitory factors. These factors can be divided into three types of effect: effect of structure, effect of energy intensity, and effect of scale.
Table 3. Complete decomposition of changes in the CO2 emissions of China (Mt).
PeriodΔCEIstrΔCEIintΔCVstrΔCGDPΔCEHstrΔCEHintΔCPstrΔCP
1996–1997−9.2821−315.875851.8288261.6062−2.4301−21.26072.85452.4330
1997–1998−9.4789−274.182932.4619222.8043−2.0840−8.53442.52002.1009
1998–1999−1.3883−108.501829.6769222.9388−0.5708−0.79102.24961.8678
1999–2000−13.9002−191.717936.6080252.5029−2.1095−5.52312.05591.7260
2000–2001−15.1920−169.740711.3728257.8307−3.3343−1.31561.88161.5651
2001–2002−2.3580−108.493620.7447293.3042−0.73849.23001.72101.4864
2002–200320.1254163.466472.2540359.85640.343529.37371.56151.5161
2003–2004−2.9444148.912758.4589422.9138−3.640039.28471.22901.6897
2004–200511.1119−44.039611.8508532.5274−3.72698.03101.04841.8326
2005–2006−0.6199−125.8071−0.3884657.8085−3.651614.40811.08871.6964
2006–2007−9.8497−383.637523.2405793.4318−7.709417.43931.48001.7278
2007–2008−33.7610−335.66345.0480580.5531−7.89092.92020.96841.7274
2008–20094.6299−226.9426−43.1376579.6338−4.033612.72390.72991.6765
2009–2010−39.4707−277.155483.3648691.6362−6.640423.16180.31421.7201
2010–201114.1999−51.846458.5884676.1523−1.626825.6261−0.04511.8264
2011–2012−52.2247−269.7120−3.6908593.8974−10.858012.8807−0.22841.9623

4.2.1. Impact Analysis of Structure

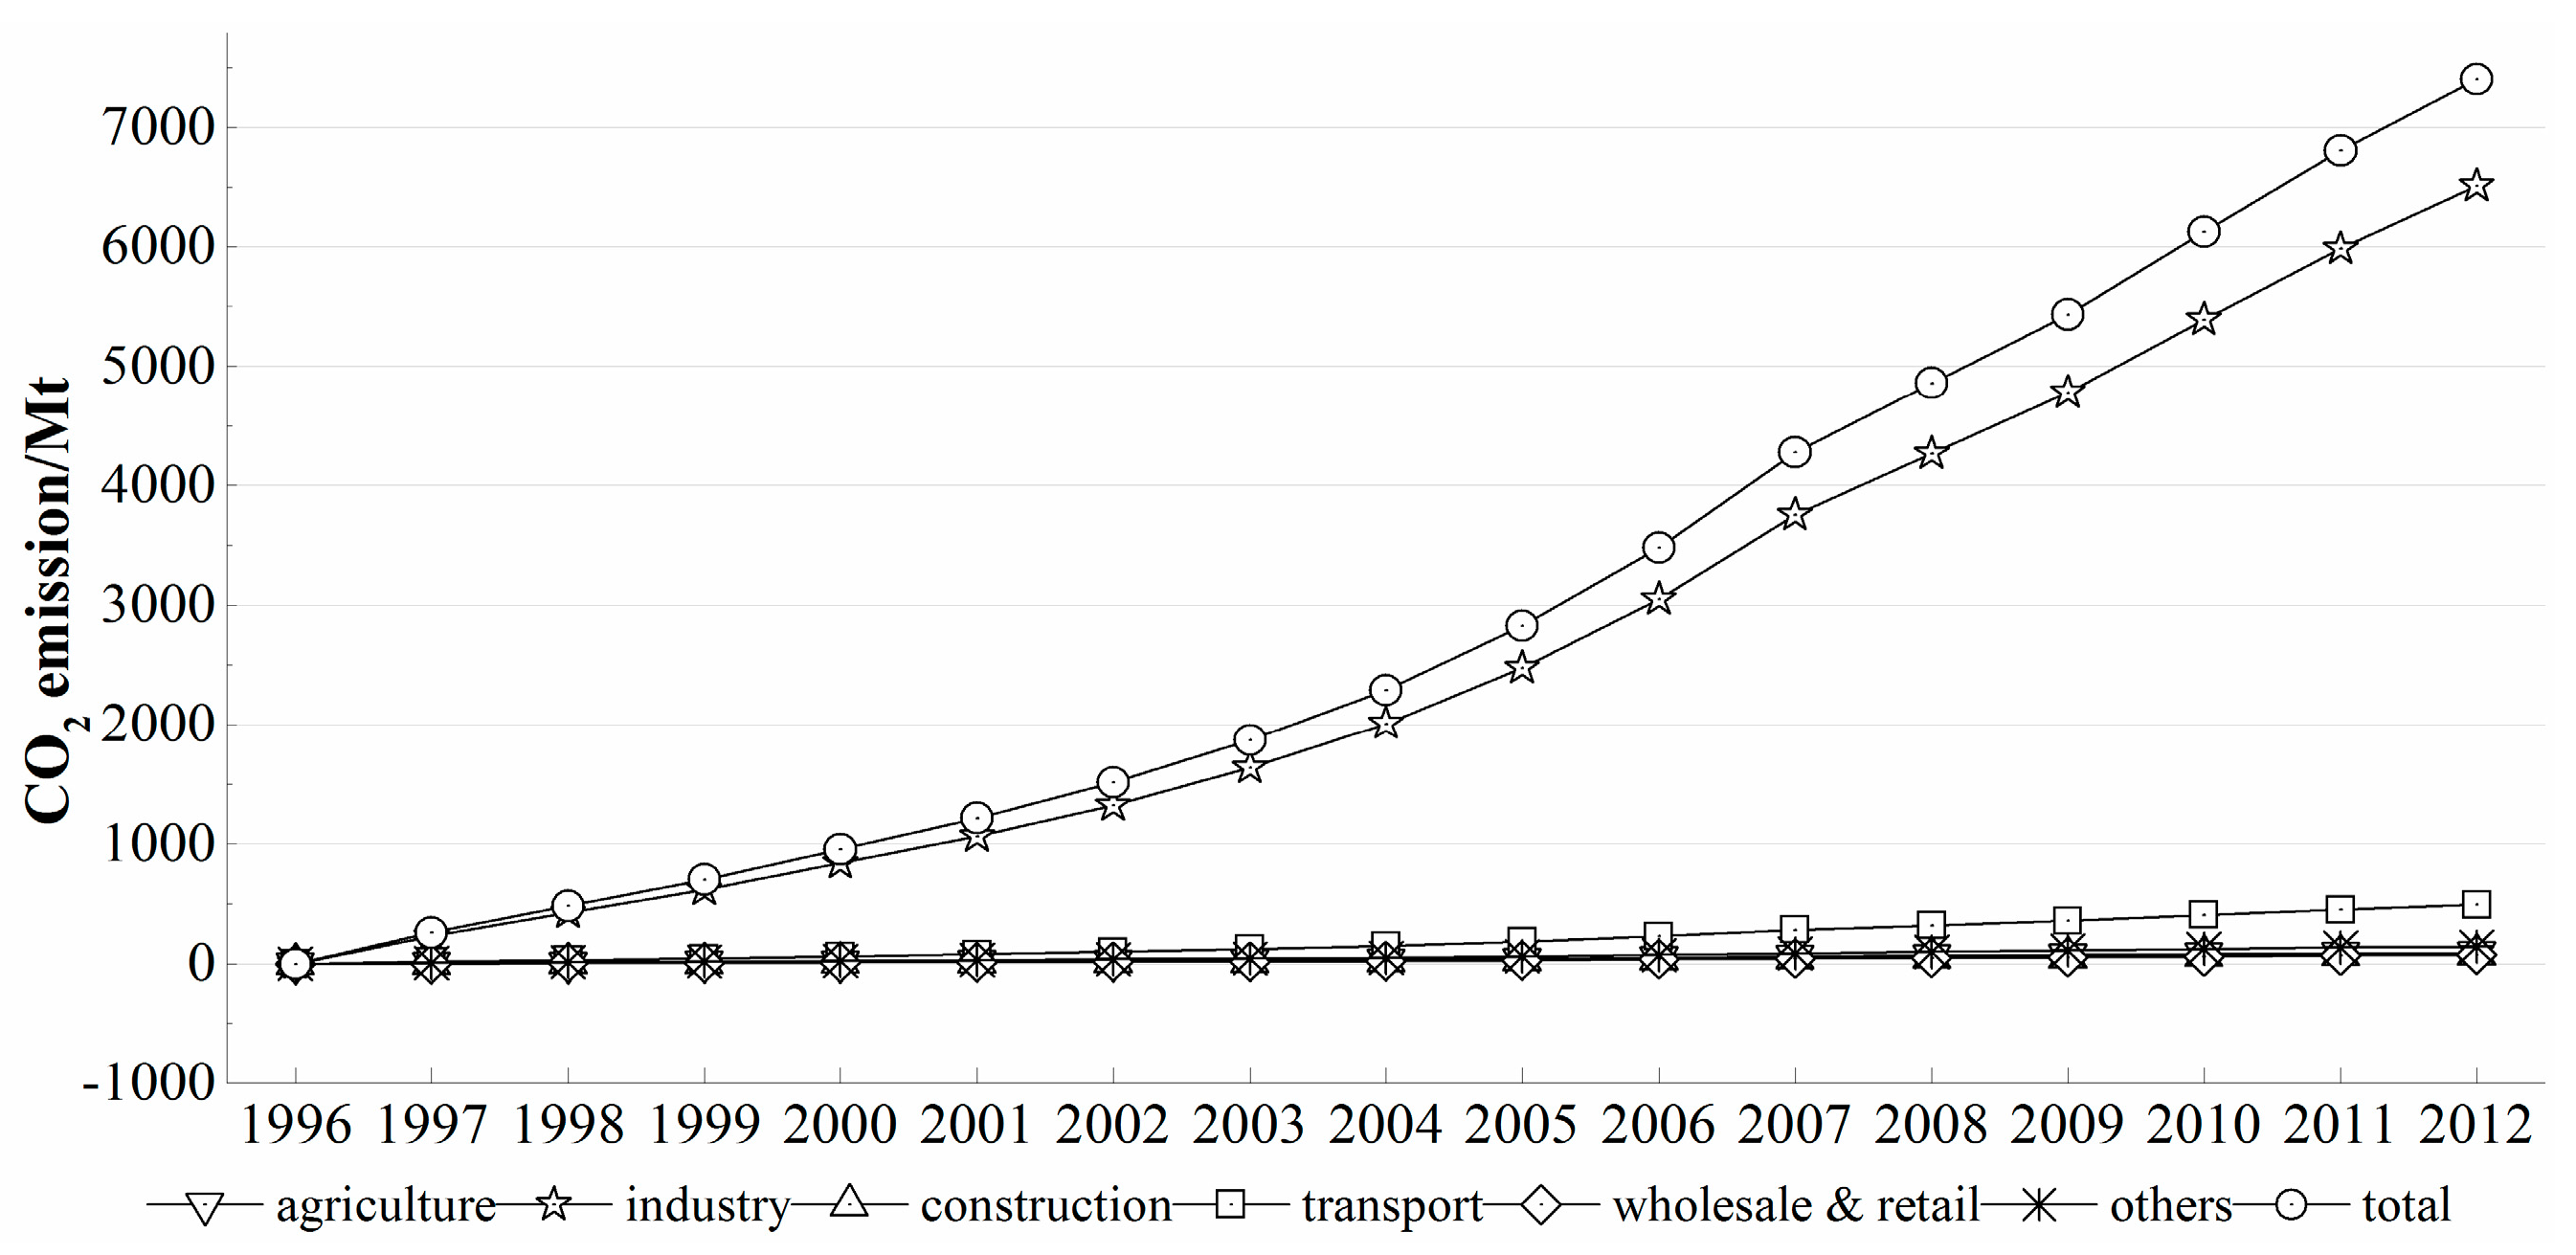
Impact Analysis of Industrial Energy Mix

Figure 3 reveals that the industrial energy mix effect on energy-related CO2 emissions was negative in most of the years of the study period, except for 2003, 2005, 2009, and 2011. The accumulated changes in CO2 emissions from the industrial energy mix effect decreased to 140.4 Mt from 1996 to 2012, which accounted for 2.66% of the total changes in CO2 emissions in absolute value. Therefore, the industrial energy mix effect was finite and did not have a significant role in decreasing CO2 emissions mainly because the long-term industrial energy structure in China prioritized coal and did not change. As shown in Figure 3, the dominant industrial energy type in China was coal, but the proportion of total energy consumption accounted for by coal decreased from 79% in 1996 to 73.03% in 2012. By contrast, between 1996 and 2012 that accounted for by oil increased from 17.29% to 18.73, natural gas increased from 1.8% to 4.39%, and renewable energy source increased from 1.91% to 3.85%. However, the effect of industrial energy mix on CO2 emissions was positive in 2003, 2005, 2009, and 2011. A direct cause of these results is that the proportion of total energy consumption accounted for by coal increased in these years.
Comparing Figure 3 and Figure 4 shows the trend of the industrial energy mix effect and annual changes in coal consumption are consistent across the whole study period. If other factors remain unchanged, then a decrease in the proportional consumption of coal and an increase in the proportional consumption of natural gas and renewable energy sources reduce CO2 emissions, and vice versa [25]. If the long-term industrial energy structure in China prioritizes coal and remains unchanged, the extensive application of renewable energy sources becomes an effective approach to reduce CO2 emissions in China.
Figure 3. Accumulated effect contribution values of CO2 emissions from the industrial energy mix factors in China (1996–2012).
Sustainability 07 14408 g003
Figure 4. Trends of the energy mix of the Chinese industrial sector (1996–2012).
Sustainability 07 14408 g004

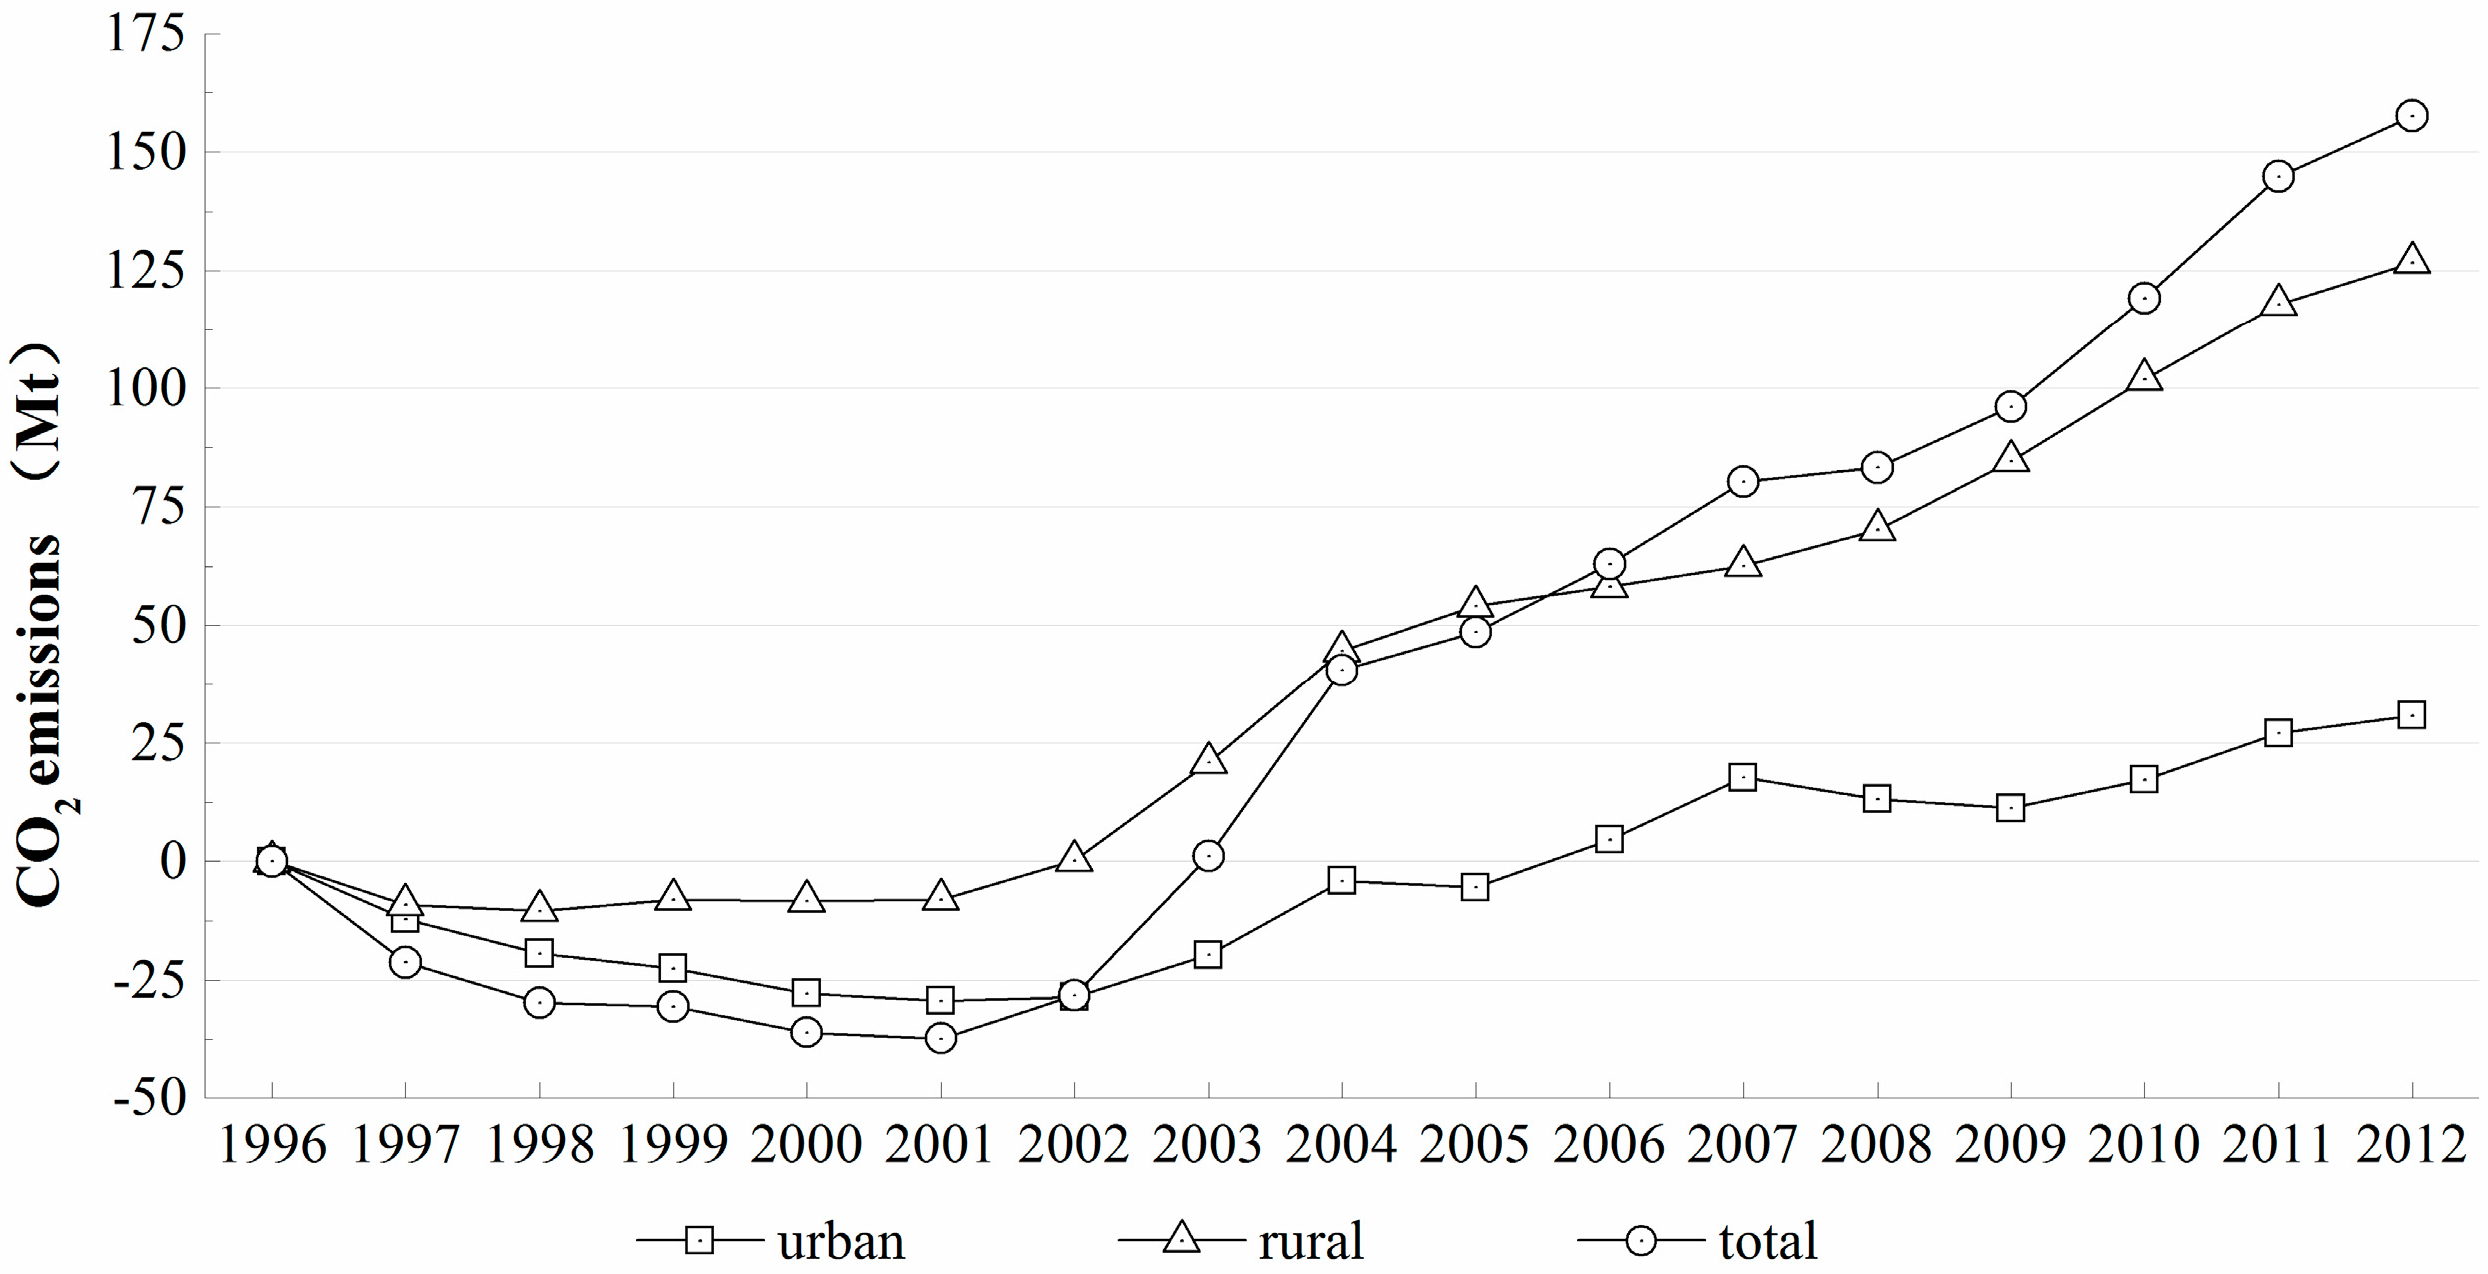
Impact Analysis of Household Energy Mix

Figure 5 reveals that the household energy mix effect on energy-related CO2 emissions was negative during the study period and that the accumulated changes in CO2 emissions from the household energy mix effect decreased to nearly 60.7 Mt, which accounted for 1.15% of the total changes in CO2 emissions in absolute value. The change in household energy mix was very significant such that the proportion of total energy consumption accounted for by coal decreased from 77.26% in 1996 to 36.91% in 2012. It particularly decreased in the urban area from 62.43% in 1996 to 13.37% in 2012, following an average annual rate of 9.18%. Between 1996 and 2012, the proportion of total energy consumption accounted for by oil increased from 17.51% to 34.9%, natural gas increased from 2.79% to 19.52%, and renewable energy source increased from 2.45% to 8.67%, respectively following an average annual rate of 4.41%, 12.94%, and 8.23% (Figure 6).
Moreover, the amount of household energy consumption was less than 8.5% of the industrial energy consumption, but the accumulated changes in CO2 emissions of the household energy mix effect exceeded 43% of that of the industrial energy mix effect, which indirectly reveals that the improvement of energy mix is a significant way to mitigate CO2 emissions.
Figure 5. Accumulated effect contribution values of CO2 emissions from the household energy mix effect in China (1996–2012).
Sustainability 07 14408 g005
Figure 6. Trends of the energy mix of Chinese households (1996–2012).
Sustainability 07 14408 g006

Impact Analysis of Industrial Structure

Figure 7 shows that the industrial structure effect on energy-related CO2 emissions was positive during 1996–2005, 2007–2008, and 2010–2011 but negative in 2006, 2009, and 2012. The accumulated changes in CO2 emissions from the industrial structure effect increased by 448.28 Mt during 1996–2012, which accounted for 8.49% of the total changes in CO2 emissions in absolute value. From the perspective of structural changes in industry, the proportion of GDP accounted for by industry continued to exhibit an increasing trend, whose contribution counteracted the inhibitory effect of agriculture and transport on CO2 emissions. The proportion of GDP accounted for by the tertiary industry (including transport, wholesale and retail, and other industrial sectors) increased by 13.06% from 1996 to 2012, whereas the CO2 emissions of the tertiary industry decreased by 0.74%, which coincided with the low energy consumption characteristics of this industry (Figure 8).
China is undergoing an economic transformation, and improvements in the industrial structure is a significant strategy to maintain the growth of the economy and reduce CO2 emissions. The government should adopt moderate industrialization policies, eliminate backward production capacity, and develop low-carbon industries. Moreover, increasing the proportion of GDP accounted for by the tertiary industry should be prioritized by the Chinese government.
Figure 7. Accumulated effect contribution values of the CO2 emissions from the industrial structure effect in China (1996–2012).
Sustainability 07 14408 g007
Figure 8. Trends of the Chinese industrial structure (1996–2012).
Sustainability 07 14408 g008

Impact Analysis of Population Structure

Figure 9 reveals that the population structure effect on energy-related CO2 emissions was positive during 1996–2010 but negative from 2011 to 2012. The accumulated changes in CO2 emissions from the population structure effect increased by 28.55 Mt over the whole period, which accounted for 0.41% of the total changes in CO2 emissions in absolute value. Comparing Figure 9 and Figure 10 shows that the increase in the urbanization rate of China slowly increased CO2 emissions at the beginning and then began decreasing when the Chinese urban population surpassed the rural population in 2011. The accumulated changes in CO2 emissions from the population structure effect in urban households increased by 78.08 Mt, whereas those in rural households decreased by 56.64 Mt. A probable cause is that the energy intensity of urban households was higher than that of rural households, and the increase in CO2 emissions caused by the growth of urban population was greater than the decrease in CO2 emissions caused by the reduced rural population. However, the energy mix of urban households was more rational than that of rural households, which means that the reduction of CO2 emissions in the former is more efficient than that in the latter. For example, the proportion of total energy consumption accounted for by coal, oil, natural gas, and renewable energy sources in urban households was 13.37%, 43.81%, 34.12%, and 8.7% in 2012 but 68.2%, 23.04%, 0.12%, and 8.63% in rural households.
Figure 9. Accumulated effect contribution values of CO2 emissions from the population structure effect in China from 1996 to 2012.
Sustainability 07 14408 g009
Figure 10. Trends of the Chinese population structure from 1996 to 2012.
Sustainability 07 14408 g010

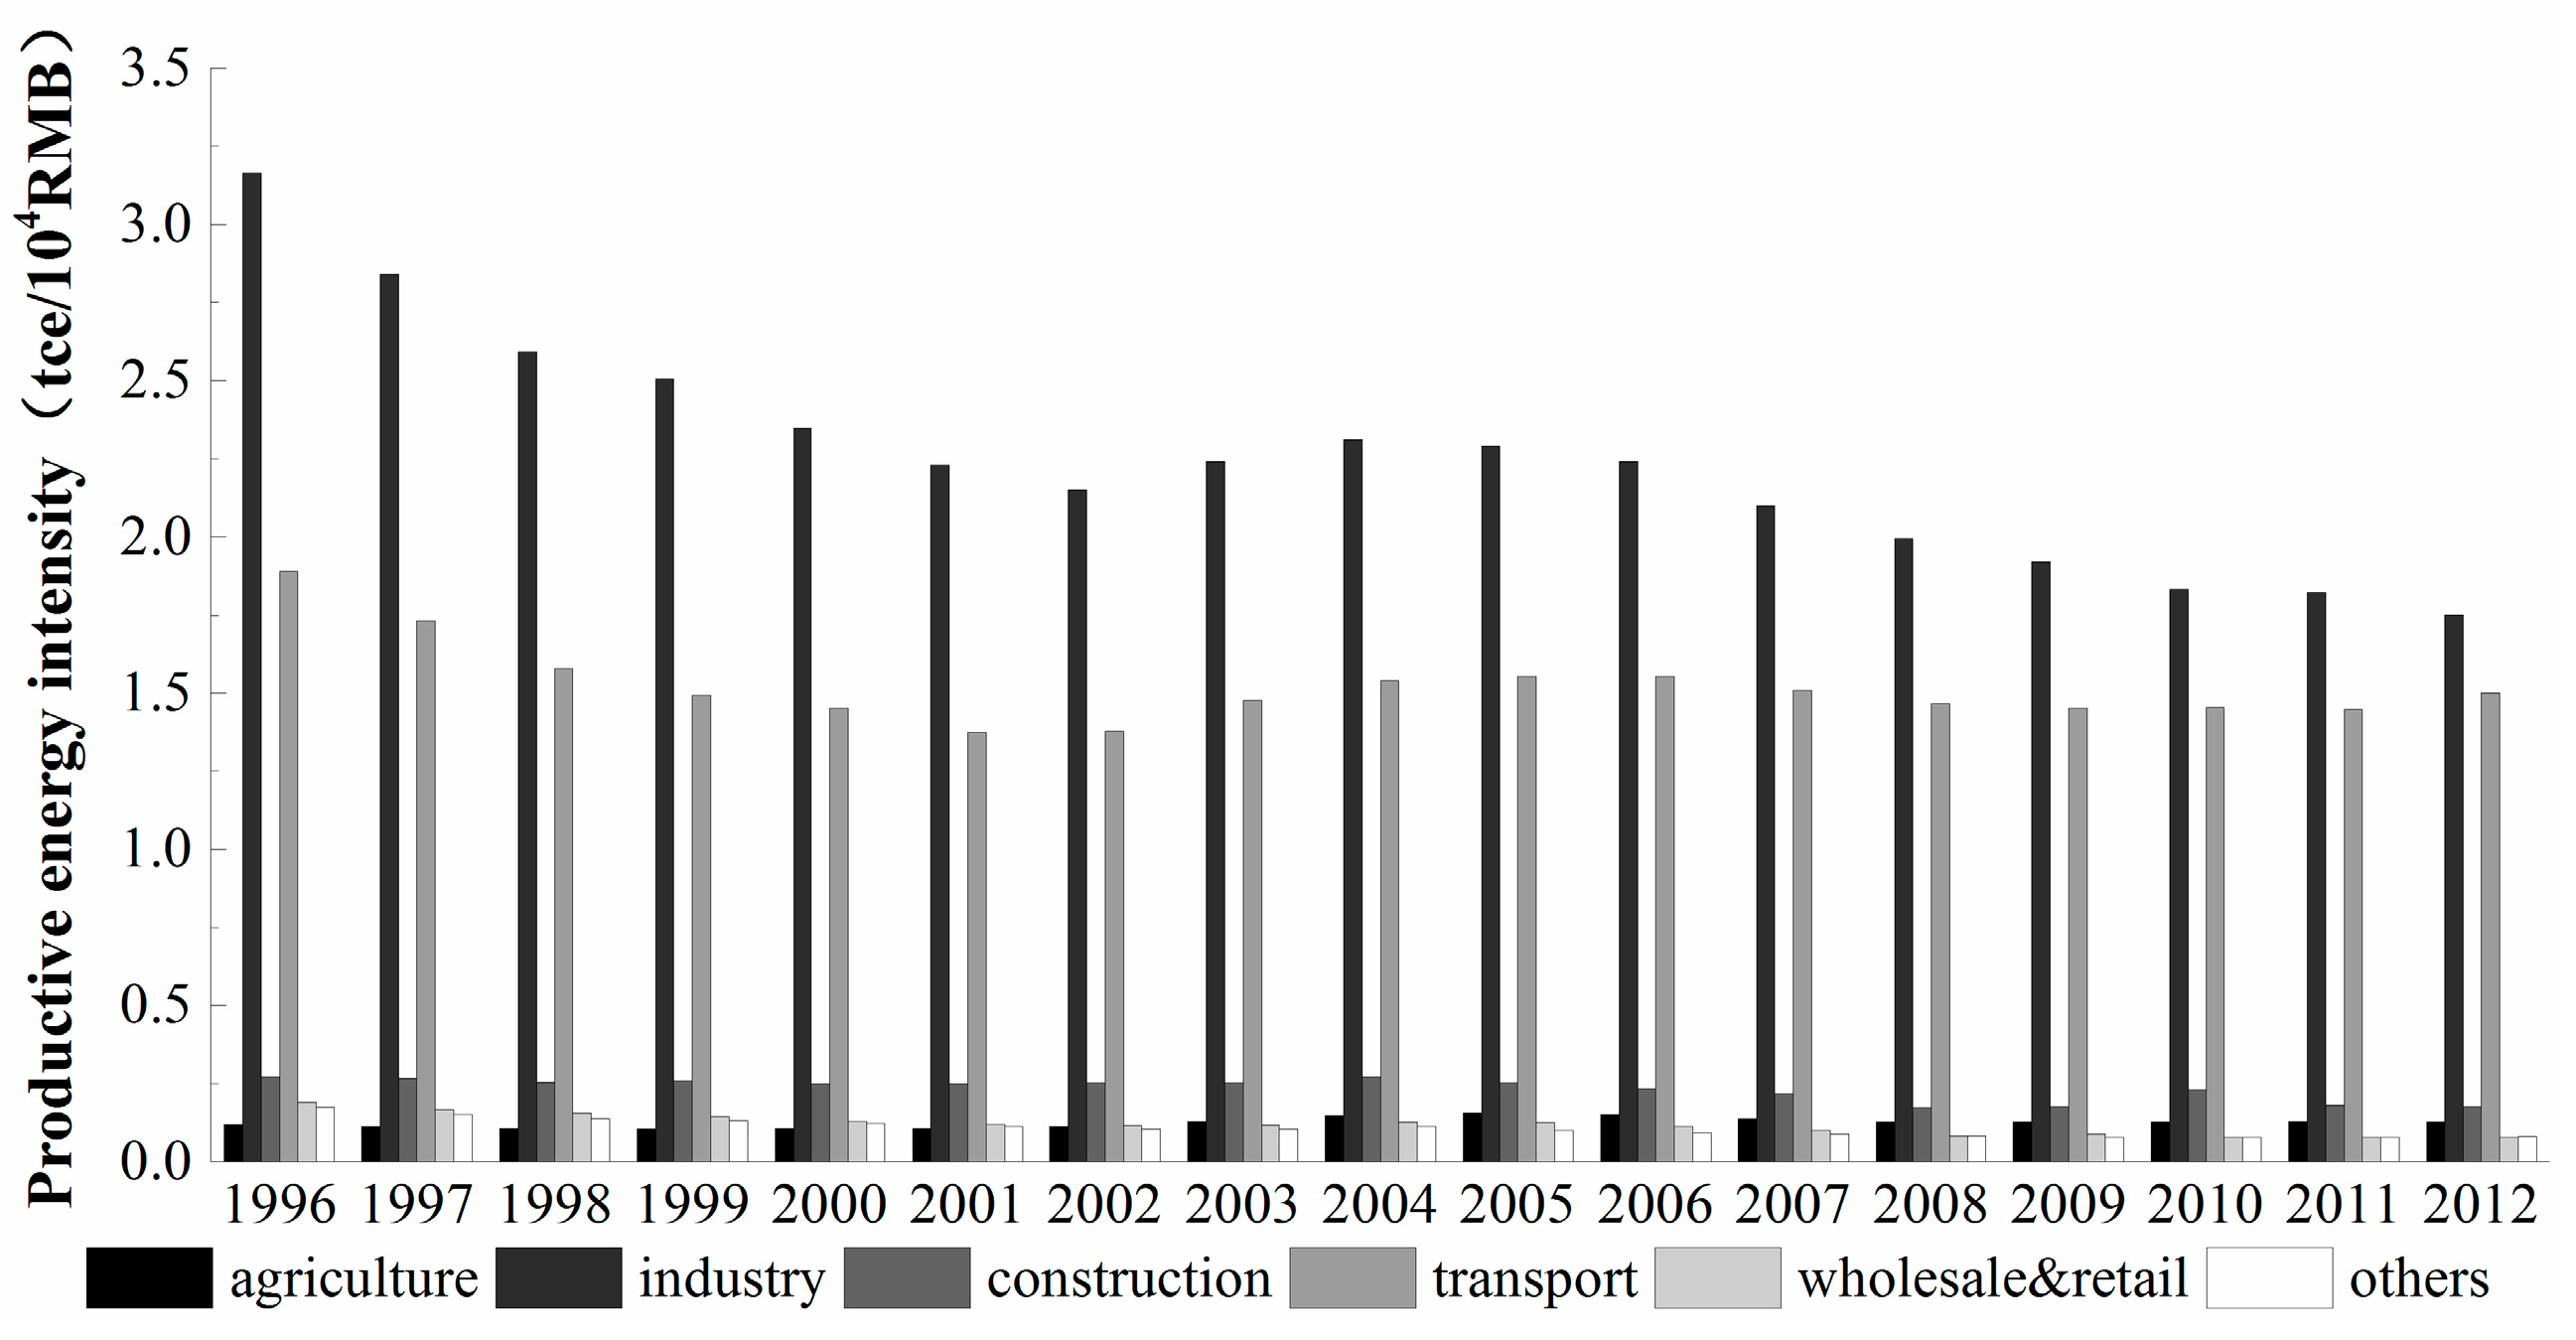
4.2.2. Impact Analysis of Energy Intensity

Impact Analysis of Industrial Energy Intensity

Industrial energy intensity can be described as a measure of the overall efficiency of energy and economic activity in units of GDP energy consumption. Theoretically speaking, a decrease in industrial energy intensity indicates an improvement in energy efficiency, which generally results from technological progress [26]. Figure 11 shows that the industrial energy intensity effect on energy-related CO2 emissions was negative during the period of 1996–2002 and 2005–2012 but positive in 2003 and 2004. The accumulated changes in CO2 emissions from the industrial energy intensity effect decreased by 2570.94 Mt during the study period, resulting in a contribution to total changes in CO2 emissions of 48.66% in absolute value. From 1996 to 2002, industrial energy intensity showed a significantly decreasing trend, which implies that the energy utility efficiency in China continuously improved after the Chinese government launched a series of energy-saving and emission reduction policies, including the closure of energy-intensive industries and reorganization of the energy market [27]. Meanwhile, the Chinese industrial production increased to 77%, whereas the total industrial energy consumption only increased by 4%. The amount of changes in CO2 emissions caused by the industrial energy intensity effect from 1996 to 1998 particularly exceeded that caused by the economic activity effect, which led to the decline in total CO2 emissions in China. However, industrial energy intensity increased in 2003 and 2004 over the previous year, indicating that energy utility efficiency in China decreased during this period. A probable cause is that the accelerated urbanization and industrialization, along with excessive demand for high-energy products, led to rapid and sustained growth in energy consumption, which in turn resulted in an increase in energy intensity [28]. The industrial energy intensity maintained a decreasing trend again in 2005, which had much to do with the Chinese government giving attention to the development of low-carbon economy and utilization of clean energy technology.
Therefore, if other factors remain unchanged, then a decline in industrial energy intensity reduces CO2 emissions, and vice versa. Chinese industrial energy intensity has presented a protracted downward trend (Figure 12) but is still relatively high. Energy efficiency can still be greatly improved, and the Chinese government should not only propel the rise of its own technologies but also strengthen international exchange and cooperation and introduce advanced energy efficient technologies, equipment, and experience to mitigate CO2 emissions.
Figure 11. Accumulated effect contribution values of CO2 emissions from the industrial energy intensity effect in China (1996–2012).
Sustainability 07 14408 g011
Figure 12. Trends of the energy intensity of the Chinese industrial sector (1996–2012).
Sustainability 07 14408 g012

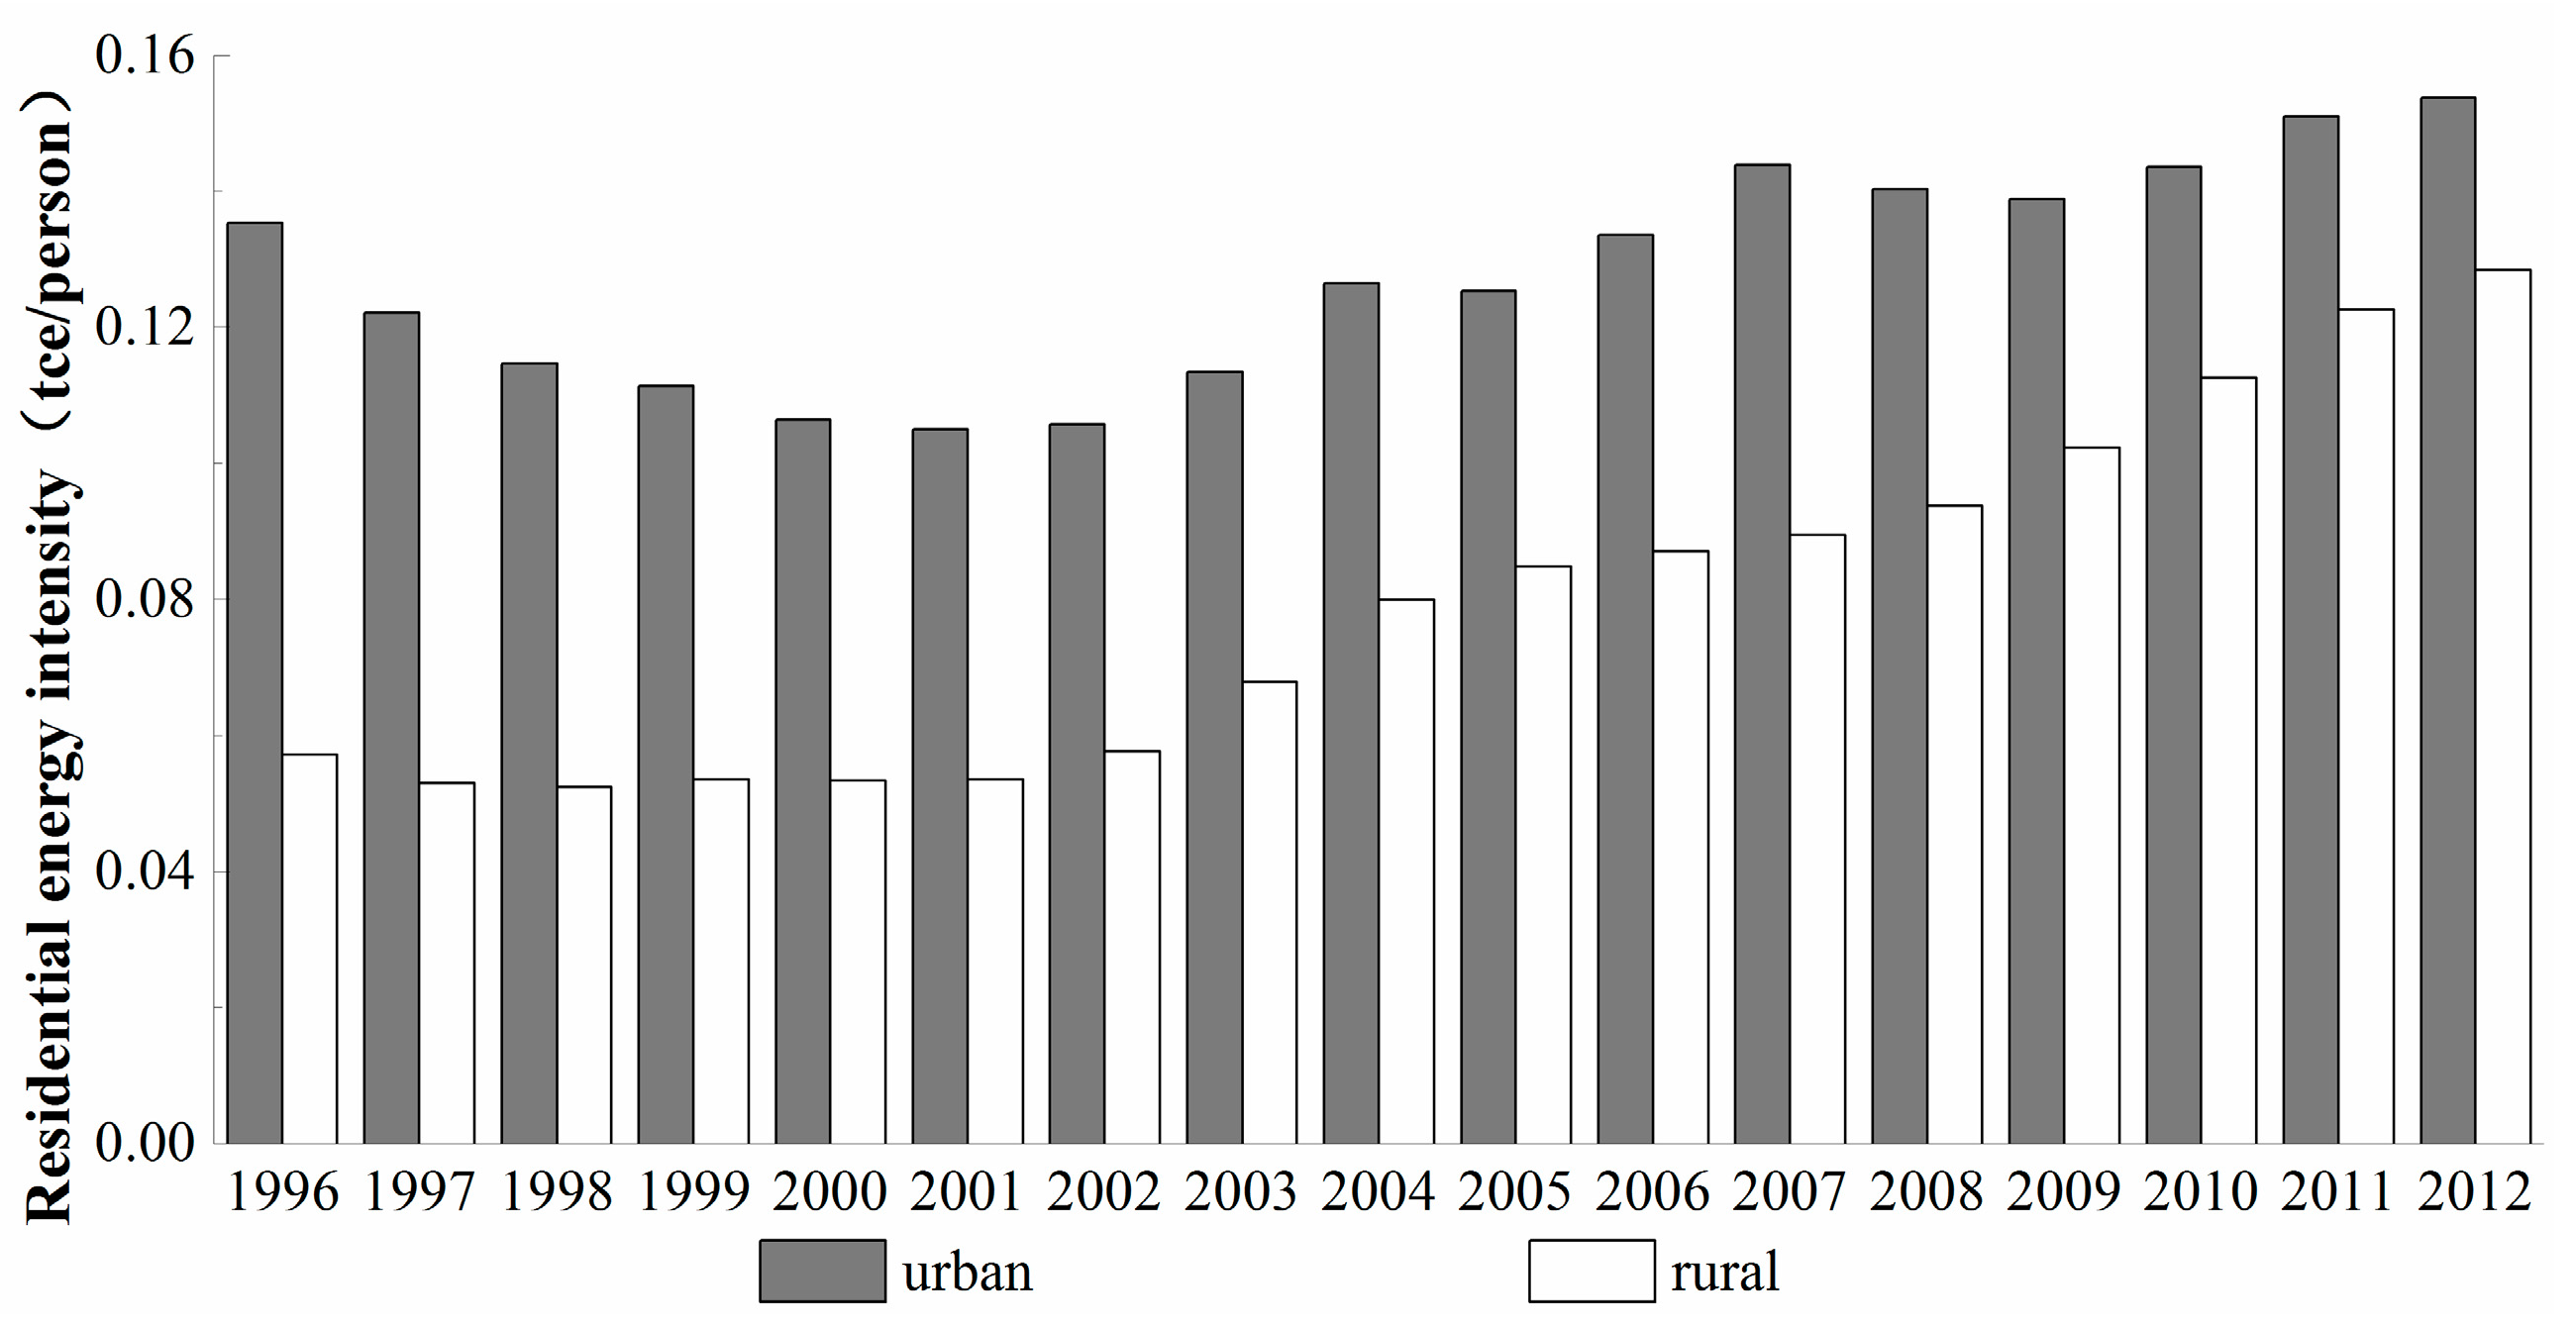
Impact Analysis of Household Energy Intensity

Figure 13 shows that the household energy intensity effect on energy-related CO2 emissions was negative from 1996 to 2001 but positive from 2002 to 2012. During 1996–2001, the accumulated changes in CO2 emissions from the household energy intensity effect decreased by 37.42 Mt, which accounted for 2.98% of the total changes in CO2 emissions in absolute value. One probable cause is the series of energy-saving policies launched by the Chinese government, which resulted in a decrease in the total amount of household energy consumption. The accumulated changes in CO2 from the household energy intensity effect since 2002 increased by 195.08 Mt, because the rapid growth in the demand for home appliances and private car ownership increased the household energy consumption to some extent. Therefore, if other factors remain unchanged, then a decline in household energy intensity reduces CO2 emissions, and vice versa. In the future, using energy-efficient appliances and new energy vehicles is an efficient approach to reduce CO2 emissions.
Comparing Figure 13 and Figure 14 shows a narrowing of the gap between rural and urban energy intensity, but the energy intensity effect of rural households was significantly greater than that of urban households. This indicates that, as the standards of living rise, the per capita energy consumption of rural households gradually approaches that of the urban households, whereas the energy utility efficiency of rural households remains lower than that of urban households. Thus, the government should give more attention to the issue of energy utilization in rural households, such as improving the infrastructure of natural gas supply and promoting solar power utilization.
Figure 13. Accumulated effect contribution values of CO2 emissions from the household energy intensity effect in China (1996–2012).
Sustainability 07 14408 g013
Figure 14. Trends of energy intensity in the Chinese household sector (1996–2012).
Sustainability 07 14408 g014

4.2.3. Impact Analysis of Scale

Impact Analysis of Economic Activity

Table 3 and Figure 15 show that the economic activity effect on energy-related CO2 emissions was positive and had the largest contribution to CO2 emissions during the whole study period. The accumulated changes in CO2 emissions from the economic activity effect increased by 7399.39 Mt from 1996 to 2012, which accounted for 140.05% of the total changes in CO2 emissions in absolute value. Thus, the economic activity effect is the dominant stimulatory factor of CO2 emissions in China. If other factors remain unchanged, then an expansion of the economic scale increases CO2 emissions, and vice versa.
Further analysis using the decoupling index reveals how energy-related CO2 emissions have changed alongside the trends of economic growth. As shown in Figure 16, the overall CO2 emissions in China presented weak decoupling with GDP growth during the study period, which implies that the stress of CO2 emissions can still increase, albeit necessarily at a lower rate than the growth of the economy. The value of the decoupling indices specifically represents a strong decoupling effect from 1997 to 1998, an expansive negative decoupling effect in 2003, 2004, and 2011, and a weak decoupling effect in other years. On the premise of a growing GDP, a smaller value of decoupling indices can be more conducive to sustainable development. However, the decoupling indices of CO2 emissions in China have been more than 0.25 since 1999, which implies that China is still reliant on energy consumption for economic growth and that a sustained increase in CO2 emissions can be expected.
Figure 15. Accumulated effect contribution values of CO2 emissions from the economic activity effect in China (1996–2012).
Sustainability 07 14408 g015
Figure 16. Decoupling index of CO2 emissions in China (1996–2012).
Sustainability 07 14408 g016

Impact Analysis of Population Scale

Figure 17 shows that the population scale effect on energy-related CO2 emissions was positive during the whole study period. From 1996 to 2012, the accumulated changes in CO2 emissions from the population scale effect increased to 28.55 Mt, contributing only 0.54% to the total changes in CO2 emissions in absolute value. This indicates that the expanding population of China positively affected CO2 emissions but that such effect was quite limited. The annual growth rate of the Chinese population was only 0.63% during the study period, which is related to the family planning policy. If other factors remain unchanged, then an increase in the population increases energy consumption and CO2 emissions, and vice versa. Given that the two-child policy will be implemented by the Chinese government in the future, the fertility rate in China is expected to increase and the population expansion effect on increasing CO2 emissions will gradually be enhanced.
Figure 17. Accumulated effect contribution values of CO2 emissions from the population scale effect in China (1996–2012).
Sustainability 07 14408 g017

5. Conclusions

Since sustainable development has become an important topic in the 21st century, the Chinese government has tried to address and solve the problems inherent to high consumption and high emissions. This study used the LMDI model to analyze the influencing factors of energy-related CO2 emissions in China, thereby providing the basis for the policy-making process to reduce energy consumption and mitigate CO2 emissions. The principal conclusions drawn from this study are summarized as follows:
(1) From 1996 to 2012, the energy-related CO2 emissions in China increased from 3273.81 Mt to 8557.03 Mt, following an annual growth rate of 6.19%. The expansion of economic activity is the dominant driving factor of CO2 emissions, China is still reliant on energy consumption for economic growth and a sustained increase in CO2 emissions can be expected. Coal is the main fuel type for CO2 emissions in China, accounting for more than 80% of the CO2 emissions. Industry is the main industrial sector for CO2 emissions in China, also accounting for more than 80% of the CO2 emissions.
(2) Based on such findings, several policy recommendations for reducing energy consumption and mitigating CO2 emissions are now suggested. First, improving energy utilization efficiency and decreasing energy intensity are the most effective approaches to reducing CO2 emissions. Policy makers should not only develop Chinese technologies but also strengthen international exchange and cooperation by introducing advanced energy efficient technologies and equipment. Second, if the long-term industrial energy structure in China prioritizes coal and this remains unchanged, the extensive development of renewable energy source should be prioritized by the Chinese government. Third, adopting moderate industrialization policies to eliminate backward production capacity and develop low-carbon industries are efficient strategies for the Chinese government to keep the economy growing and reduce CO2 emissions. In addition, the Chinese government should focus on increasing the proportion of GDP accounted for by the tertiary industry.
(3) The reduction of the CO2 emissions of rural households is relatively weak, and the government should give more attention to enhancing the energy utility efficiency of rural households, such as improving the infrastructure of natural gas supply and promoting solar power utilization.
This study reveals the driving force of CO2 emissions and qualitatively analyzes the approaches of reducing CO2 emissions in China. In our future research, we plan to conduct a quantitative study on the potential for reducing energy-related CO2 emissions, providing a more specific basis for policy-makers to develop emission-reduction policies.

Acknowledgments

This work is supported by the National Natural Science Foundation of China (41471462, 41301652), and the Fundamental Research Funds for the Central Universities (13LZUJBWZB003, lzujbky-2015-147).

Author Contributions

Guokui Wang and Xingpeng Chen designed the research; Guokui Wang, Xingpeng Chen, Zilong Zhang, Chaolan Niu conducted the research. All authors wrote the paper and read and approved the final manuscript.

Conflicts of Interest

The authors declare no conflict of interest.

References

  1. Parry, M.L.; Canziani, O.F.; Palutikof, J.P.; van der Linden, P.J.; Hanson, C.E. Contribution of Working Group II to the Fourth Assessment Report of the Intergovernmental Panel on Climate Change, 2007; Cambridge University Press: Cambridge, UK, 2007. [Google Scholar]
  2. U.S. Energy Information Administration. Available online: http://www.eia.gov (accessed on 14 April 2015).
  3. Pani, R.; Mukhopadhyay, U. Management accounting approach to analyze energy related CO2 emission: A variance analysis study of top 10 emitters of the world. Energy Policy 2013, 52, 639–655. [Google Scholar] [CrossRef]
  4. O’Mahony, T. Decomposition of Ireland’s carbon emissions from 1990 to 2010: An extended Kaya identity. Energy Policy 2013, 59, 573–581. [Google Scholar]
  5. Wang, W.X.; Kuang, Y.Q.; Huang, N.S. Study on the Decomposition of Factors Affecting Energy-Related Carbon Emissions in Guangdong Province, China. Energies 2011, 4, 2249–2272. [Google Scholar] [CrossRef]
  6. Wang, C.J.; Wang, F.; Zhang, H.O. Carbon Emissions Decomposition and Environmental Mitigation Policy Recommendations for Sustainable Development in Shandong Province. Sustainability 2014, 6, 8164–8179. [Google Scholar] [CrossRef]
  7. Li, H.Q.; Lu, Y.; Zhang, J; Wang, T.Y. Trends in road freight transportation carbon dioxide emissions and policies in China. Energy Policy 2013, 57, 99–106. [Google Scholar] [CrossRef]
  8. Liu, L.C.; Fan, Y.; Wu, G; Wei, Y.M. Using LMDI method to analyze the change of China’s industrial CO2 emissions from final fuel use: An empirical analysis. Energy Policy 2007, 35, 5892–5900. [Google Scholar] [CrossRef]
  9. Yang, J.; Chen, B. Using LMDI method to analyze the change of industrial CO2 emission from energy use in Chongqing. Front. Earth Sci. 2011, 5, 103–109. [Google Scholar] [CrossRef]
  10. Zhang, J.Y.; Zhang, Y.; Yang, Z.F.; Fath, B.D.; Li, S.S. Estimation of energy-related carbon emissions in Beijing and factor decomposition analysis. Ecol. Model. 2013, 252, 258–265. [Google Scholar] [CrossRef]
  11. Shao, C.F.; Guan, Y.; Wan, Z.; Guo, C.X.; Chu, C.L.; Ju, M.T. Performance and decomposition analyses of carbon emissions from industrial energy consumption in Tianjin, China. J. Clean. Prod. 2013, 64, 590–601. [Google Scholar] [CrossRef]
  12. IPCC. 2006 IPCC Guidelines for National Greenhouse Gas Inventories. Available online: http://www.ipcc-nggip.iges.or.jp/public/2006gl/index.html (accessed on 4 April 2015).
  13. Achão, C.; Schaeffer, R. Decomposition analysis of the variations in residential electricity consumption in Brazil for the 1980e2007 period: Measuring the activity, intensity and structure effects. Energy Policy 2009, 37, 5208–5220. [Google Scholar] [CrossRef]
  14. Wachsmann, U.; Wood, R.; Lenzen, M.; Schaeffer, R. Structural decomposition of energy use in Brazil from 1970 to 1996. Appl. Energy 2009, 86, 578–587. [Google Scholar] [CrossRef]
  15. Zhang, H.; Qi, Y. A Structure decomposition analysis of China’s production source CO2 emission: 1992–2002. Environ. Resour. Econ. 2011, 49, 69–77. [Google Scholar] [CrossRef]
  16. Rutger, H.; Jeroen, C.J.M. Comparing structural decomposition analysis and index. Energy Econ. 2003, 25, 39–64. [Google Scholar]
  17. Hatzigeorgiou, E.; Polatidis, H.; Haralambopoulos, D. CO2 emissions in Greece for 1990–2002: A decomposition analysis and comparison of results using the Arithmetic Mean Divisia Index and Logarithmic Mean Divisia Index techniques. Energy 2008, 33, 492–499. [Google Scholar] [CrossRef]
  18. Ma, C.; Stern, D.I. China’s changing energy intensity trend: A decomposition analysis. Energy Econ. 2008, 30, 1037–1053. [Google Scholar] [CrossRef]
  19. Ang, B.W. Decomposition analysis for policymaking in energy: Which is the preferred method? Energy Policy 2004, 32, 1131–1139. [Google Scholar] [CrossRef]
  20. Wang, C.M. Decoupling Analysis of China Economic Growth and Energy Consumption. China Popul. Resour. Environ. 2010, 20, 35–37. (In Chinese) [Google Scholar]
  21. Vehmas, J.; Kaivo-oja, J.; Luukkanen, J. Global trends of linking environmental stress and economic growth. Available online: http://www.utu.fi/fi/yksikot/ffrc/julkaisut/tutu-julkaisut/Documents/Tutu_2003-7.pdf (accessed on 21 October 2015).
  22. National Bureau of Statistics of the People’s Republic of China. China Statistical Yearbooks 1996–2013; China Statistical Press: Beijing, China, 1996–2013.
  23. BP. Statistical Review of World Energy 2015. Available online: http://www.bp.com (accessed on 14 April 2015).
  24. National Bureau of Statistics of the People’s Republic of China. China Energy Statistical Yearbooks 1996–2013; China Statistical Press: Beijing, China, 1996–2013.
  25. Xu, S.C.; Xi, R.; He, Z.X. Influential Factors and Policy Implications of Carbon Emissions for Energy Consumption in China. Resour. Sci. 2012, 34, 2–12. (In Chinese) [Google Scholar]
  26. Xu, S.C.; He, Z.X.; Long, R.Y. Factors that influence carbon emissions due to energy consumption in China: Decomposition analysis using LMDI. Appl. Energy 2014, 127, 182–193. [Google Scholar] [CrossRef]
  27. He, X.G.; Zhang, Y.H. Influence factors and environmental Kuznets curve relink effect of Chinese industry’s carbon dioxide emission-empirical research based on STIRPAT model with industrial dynamic panel data. China Ind. Econ. 2012, 1, 26–35. [Google Scholar]
  28. Zhang, C.G.; Lin, Y. Panel estimation for urbanization, energy consumption and CO2 emissions: A regional analysis in China. Energy Policy 2012, 49, 488–498. [Google Scholar] [CrossRef]

