Article

Seismic Performance Evaluation of Multistory Reinforced Concrete Moment Resisting Frame Structure with Shear Walls

1
Department of Civil and Environmental Engineering, South Dakota State University, Brookings, SD 57007, USA
2
Department of Civil and Environmental Engineering, Incheon Disaster Prevention Research Center, Incheon National University, 12-1 Songdo-dong, Yeonsu-gu, Incheon 22012, Korea
*
Author to whom correspondence should be addressed.
Sustainability 2015, 7(10), 14287-14308; https://doi.org/10.3390/su71014287
Submission received: 18 August 2015 / Revised: 7 October 2015 / Accepted: 11 October 2015 / Published: 22 October 2015

Abstract

:
This paper is intended to evaluate the seismic performance of a twelve-story reinforced concrete moment-resisting frame structure with shear walls using 3D finite element models according to such seismic design regulations as Federal Emergency Management Agency (FEMA) guideline and seismic building codes including Los Angeles Tall Building Structural Design Council (LATBSDC) code. The structure is located in Seismic Zone 4, considered the highest-seismic-risk classification established by the U.S. Geological Survey. 3D finite element model was created in commercially available finite element software. As part of the seismic performance evaluation, two standard approaches for the structure seismic analysis were used; response spectrum analysis and nonlinear time-history analysis. Both approaches were used to compute inter-story drift ratios of the structure. Seismic fragility curves for each floor of the structure were generated using the ratios from the time history analysis with the FEMA guideline so as to evaluate their seismic vulnerability. The ratios from both approaches were compared to FEMA and LATBSDC limits. The findings revealed that the floor-level fragility mostly decreased for all the FEMA performance levels with an increase in height and the ratios from both approaches mostly satisfied the codified limits.

1. Introduction

Earthquake has been known as one of the critical natural disasters for thousands of years. Recent major earthquakes have caused severe social disruption in the vicinity of the epicenter, especially due to structural failures causing damage to the people and properties in urban area where the structures are concentrated. For instance, 2015 Nepal earthquake with a magnitude of 7.8 Mw followed by a series of continued aftershocks that occurred in Nepal has led to the significant damage to the structures, resulting in critical social disruption in the affected area [1]. A proper structural design and analysis accounting for sufficient strength and ductility under the influence of earthquakes must be considered to assure the structural safety [2]. In fact, the number of multistory reinforced concrete moment-resisting frame structures with shear walls that enable their seismic energy to dissipate in a secure manner has rapidly been increased over the past half century around the world including the United States. Hence, the seismic performance on such structures should be appropriately assessed within the range of standard seismic building code-based simulation procedures and then be stochastically evaluated using reliable technique.
Since the Uniform Building Code (UBC) was first published in 1927 by the International Council of Building Officials, seismic design codes for multistory reinforced concrete structures have been developed in line with continuous outcomes from relevant experimental and computational studies [3]. A current building code, the International Building Code (IBC), has been used nationwide for seismic design and analysis. This code provides the guidelines for four standard seismic simulation approaches including response spectrum analysis, linear dynamic analysis, nonlinear static analysis and nonlinear time history analysis [4]. Specifically, the response spectrum approach allows using the response spectrum defined as a graphical representation of peak response versus natural period for a given accelerogram to the reinforced concrete structure. This approach has served as the basis for seismic design and analysis to ensure that the peak response of a structure is satisfactory according to the codified limit states. On the other hand, the nonlinear time history analysis approach that could provide an insight into the structural behavior resulting from specific ground motions as a function of acceleration and time is regarded as the most reasonably time-consuming means to determine the nonlinear responses in time domain [5].
The nonlinear time-history approach has been frequently incorporated into stochastic seismic performance assessment frameworks for different types of multistory structures in the form of fragility curves [2,6,7,8,9,10,11,12,13]. Fragility curve is the probability of exceeding a limit state for a structural system or component at damage state for a given ground motion intensities [14]. The frameworks coupled with fragility curves are now common to evaluate multistory structure seismic vulnerability. For example, Tantala and Deodatis [6] developed seismic fragility curves of a 25-story reinforced concrete moment-resisting frame structure to investigate its seismic vulnerability accounting for uncertainty of ground motions and structural characteristics that were modeled as a stochastic process. It was demonstrated that the duration of strong ground motion had an influential impact on the vulnerability of reinforced concrete structure. Such seismic performance assessment frameworks that go beyond the standard codified seismic analysis are significant in forecasting the overall seismic vulnerability to the multistory structures from every potential earthquake scenario.
To evaluate the seismic performance of multistory reinforced concrete structures in a codified and stochastic manner, both codified response spectrum analysis and nonlinear time-history analysis in conjunction with a conventional fragility theory were used for this study. This paper is composed of six sections. Section 2 focuses on describing a target reinforced concrete building that consists of shear walls and moment-resisting frames. Section 3 is dedicated to describing the 3D computational model of the structure as well as its dynamic characteristics through modal analysis. Section 4 is devoted to outlining each procedure for the codified response spectrum analysis and nonlinear time-history analysis-based fragility estimate. Section 5 presents the comparison of seismic performance in terms of inter-story drift ratios and displacements for the structure between both approaches with seismic building codes. The last section presents the conclusions regarding seismic response and performance of the structure.

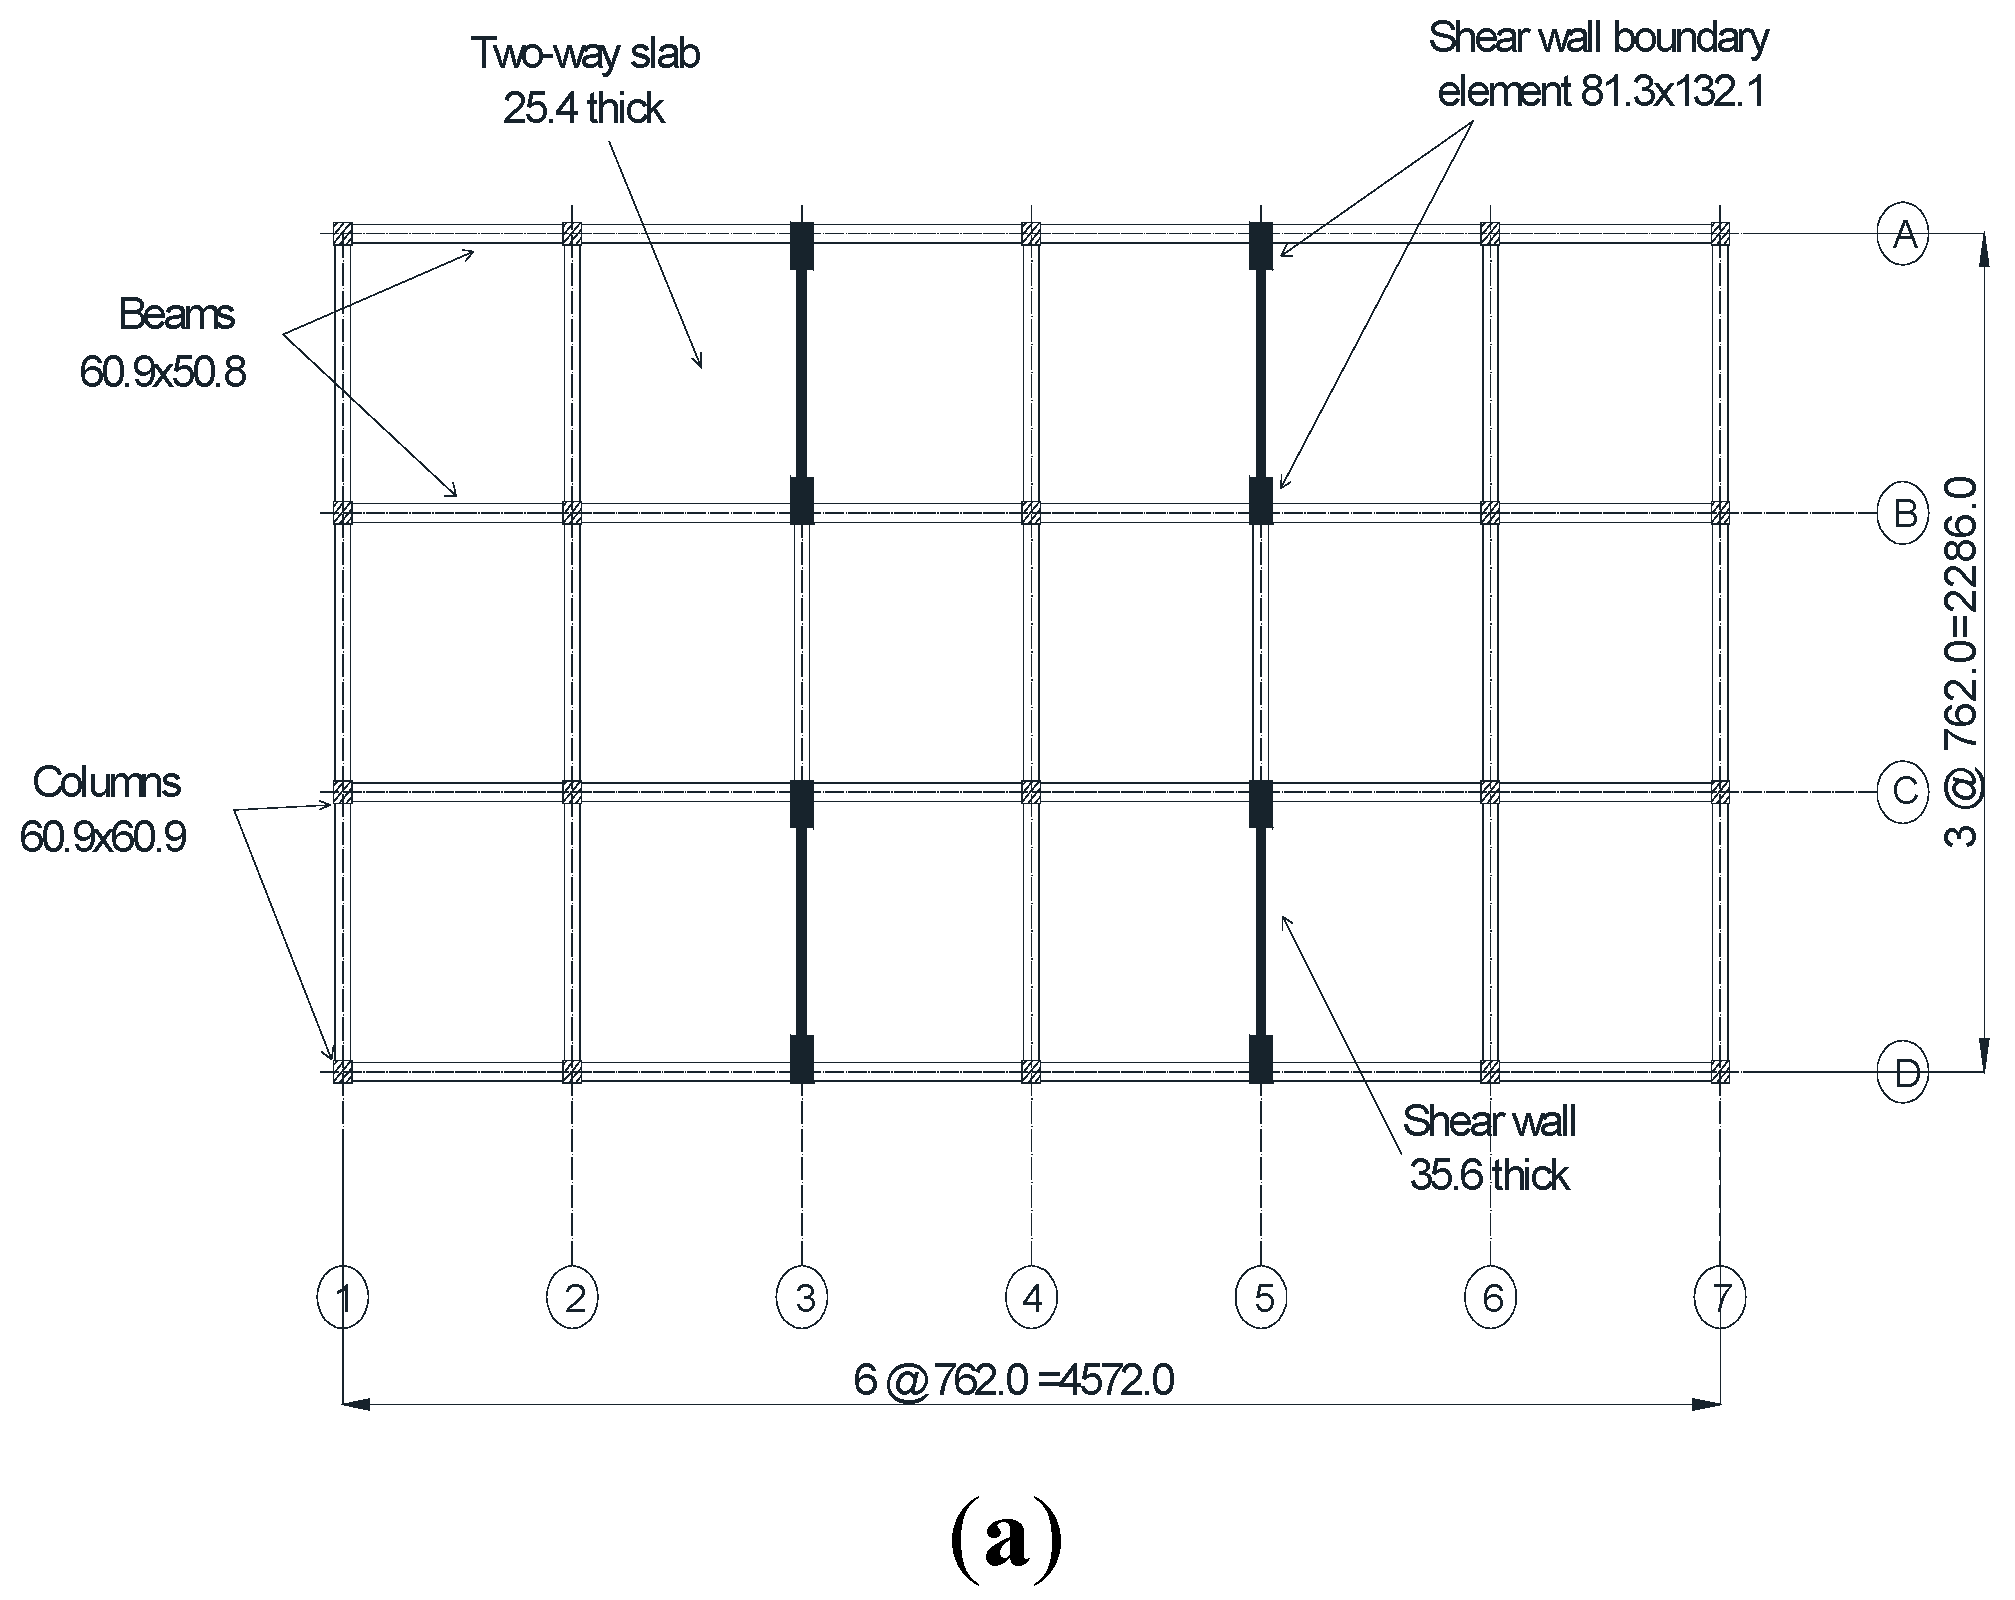
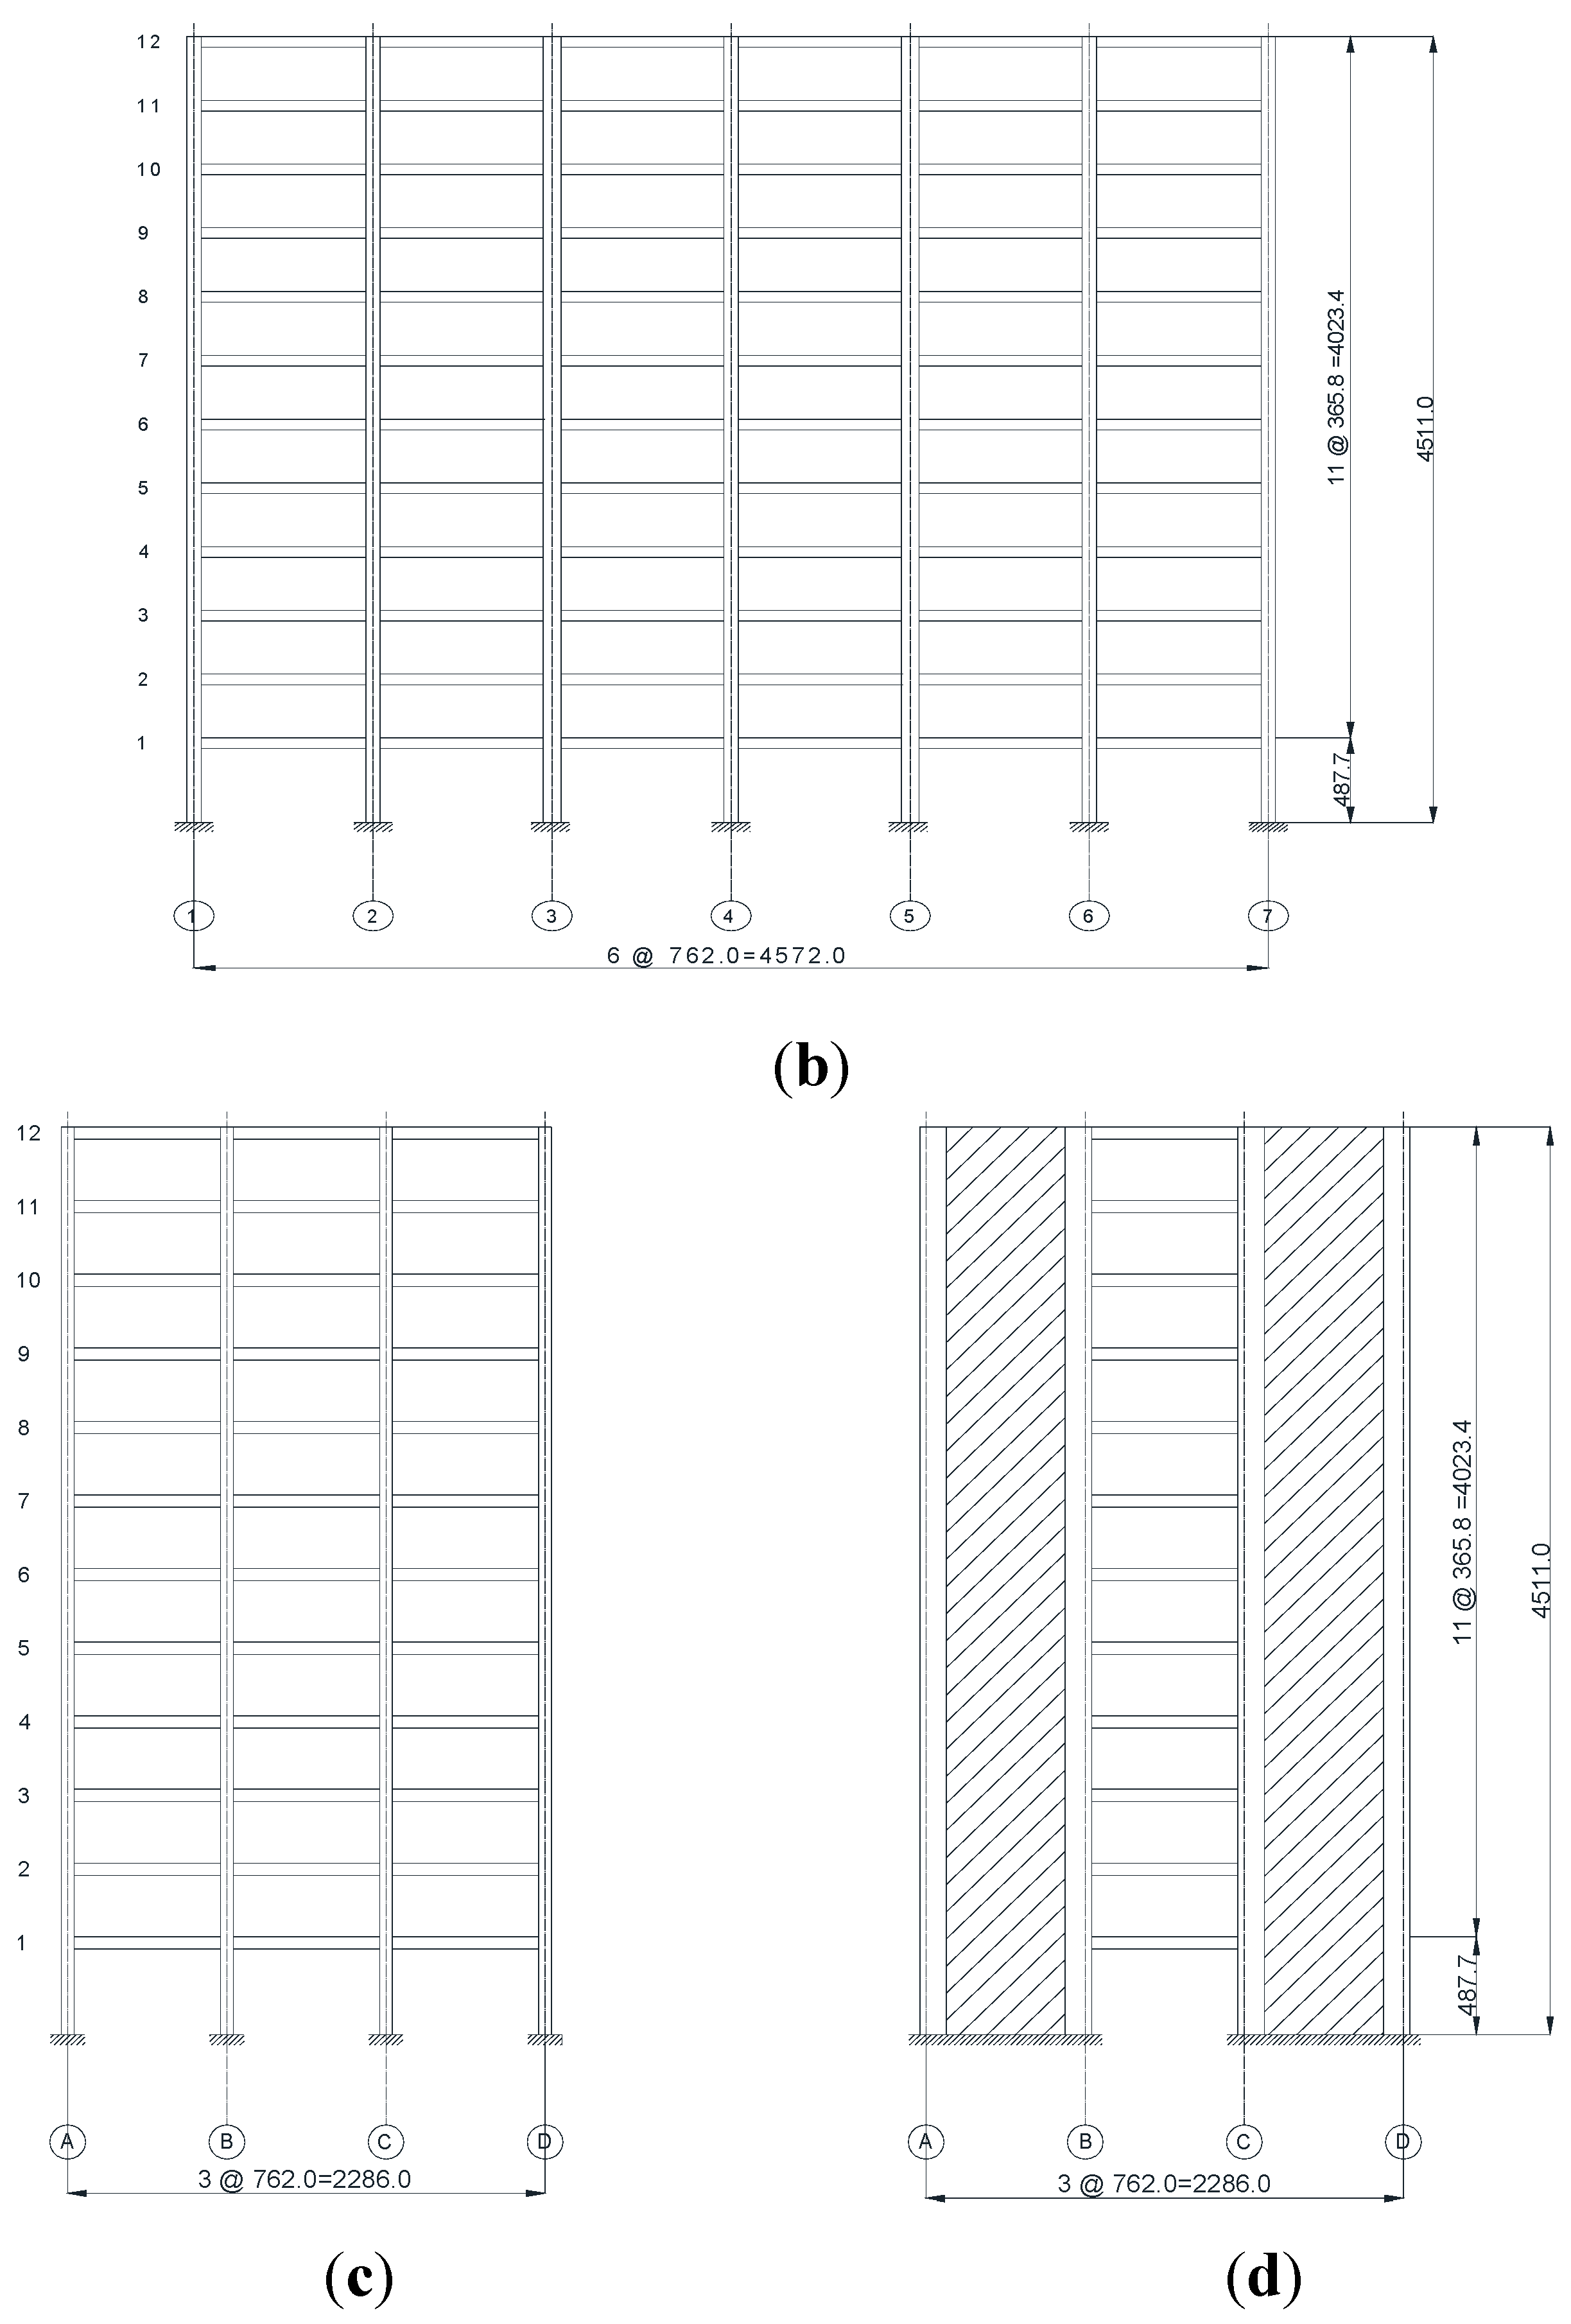
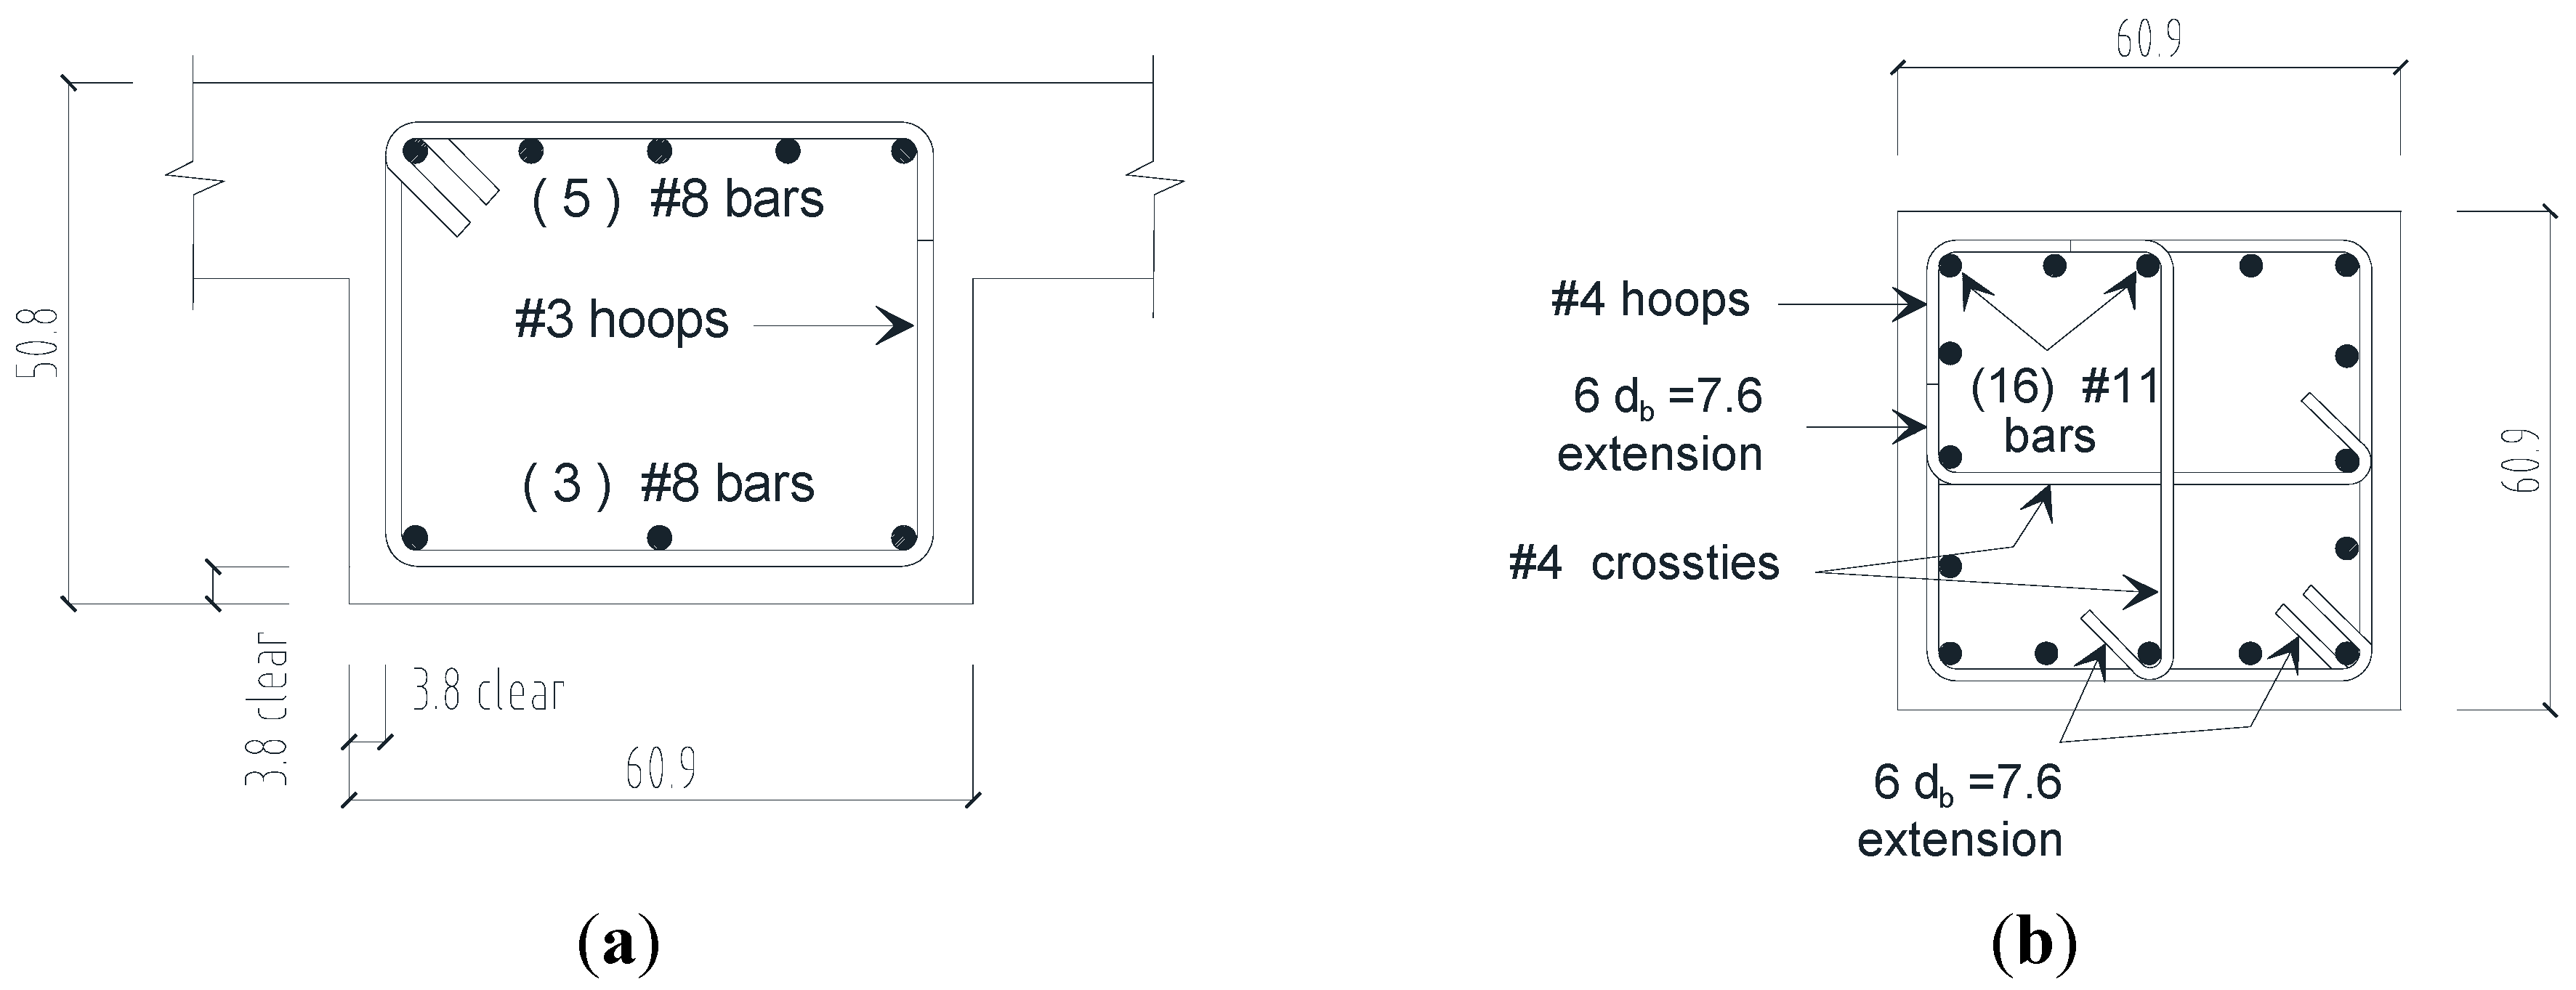
2. Description of Studied Reinforced Concrete Structure

A twelve-story reinforced concrete structure that is located in California categorized as Seismic Zone 4 defined as the most seismically active zone in the United States [4] was selected as the model structure for investigation in this study. The structure primarily uses a dual system, which includes moment-resisting frames in both longitudinal and transverse directions and shear walls in transverse direction [15]. Overall height of structure is 45.11 m. The first floor height is 4.87 m, while remaining floors are 3.67 m each. The planform of structure is a rectangular shape as shown in Figure 1a and the evaluation view in the longitudinal direction is as Figure 1b. The structure has a total length of 45.72 m with six 7.62 m-long bays and the total width of 22.86 m with three 7.62 m-long bays. The transversal evaluation views for the structure with or without shear walls are as Figure 1c,d, respectively. The sizes and details for columns and beams along with shear walls were formerly determined by designing them based on rectangular and symmetrical floor plan according to UBC 1991 [15,16]. The section of 0.609 m × 0.508 m was utilized for all beams on each floor and all columns on each floor were sized at 0.609 m × 0.609 m. The beam and column details with reinforcements are as Figure 2a,b, respectively. All structural members used have the normal weight concrete (wc = 2402.8 kg/m3) with compressive strength ( f c ´ ) of 48.3 MPa and nominal yield strength of steel reinforcement ( f y ) of 413.7 MPa.
Figure 1. Overall configuration of twelve reinforced concrete structure (unit: cm): (a) plan view; (b) elevation view in longitudinal direction; (c) elevation view with no shear walls in longitudinal direction; and (d) elevation view with shear walls in transverse direction.
Sustainability 07 14287 g001aSustainability 07 14287 g001b
Figure 2. Structure design details (unit: cm): (a) beam section with reinforcements; and (b) column section with reinforcements.
Sustainability 07 14287 g002

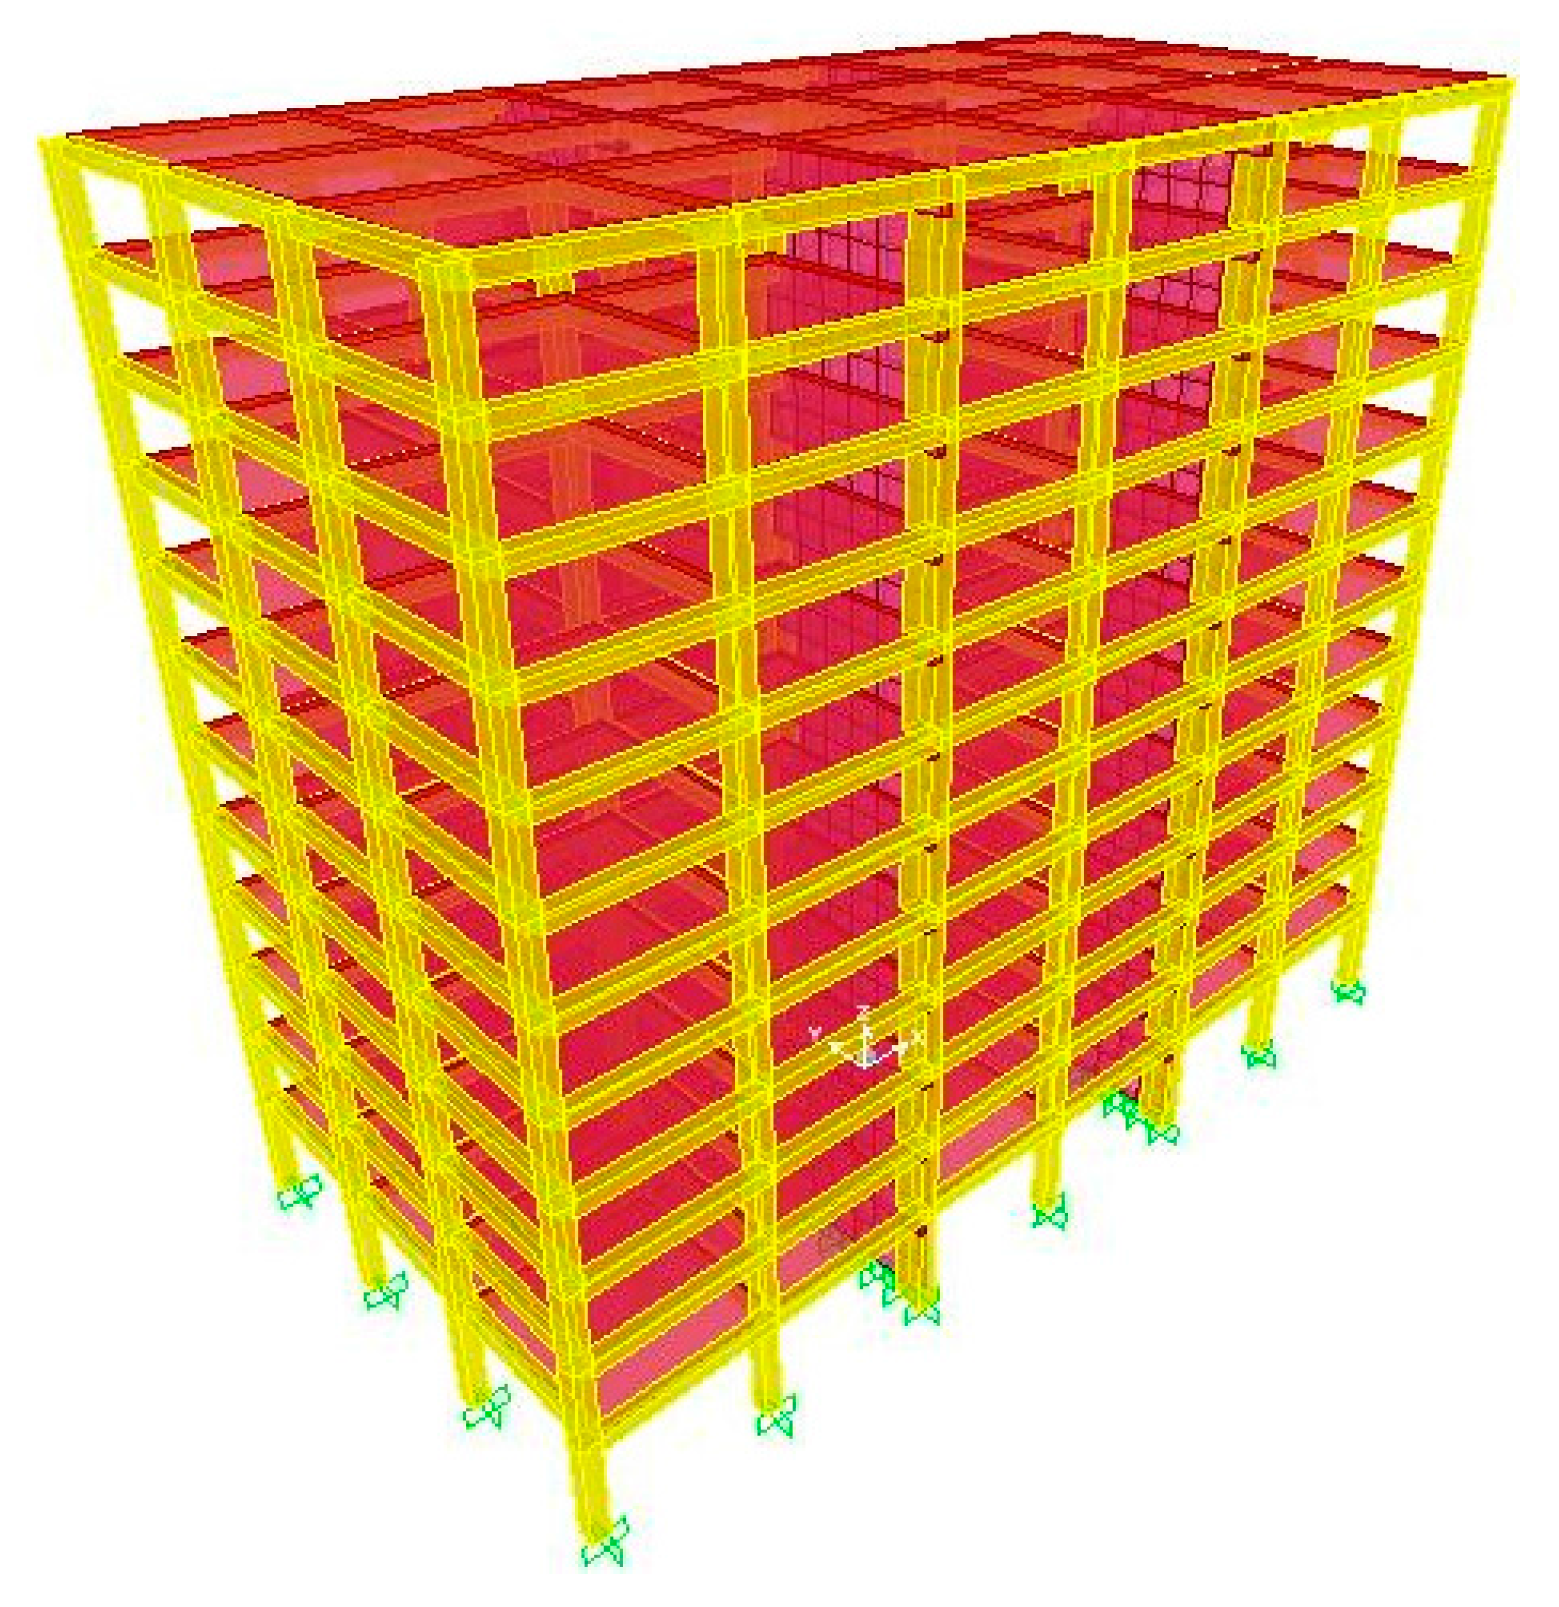
3. 3D Computational Model

Description of 3D computational model of the selected structure as well as modal analysis results are detailed as below.

3.1. Model Generation
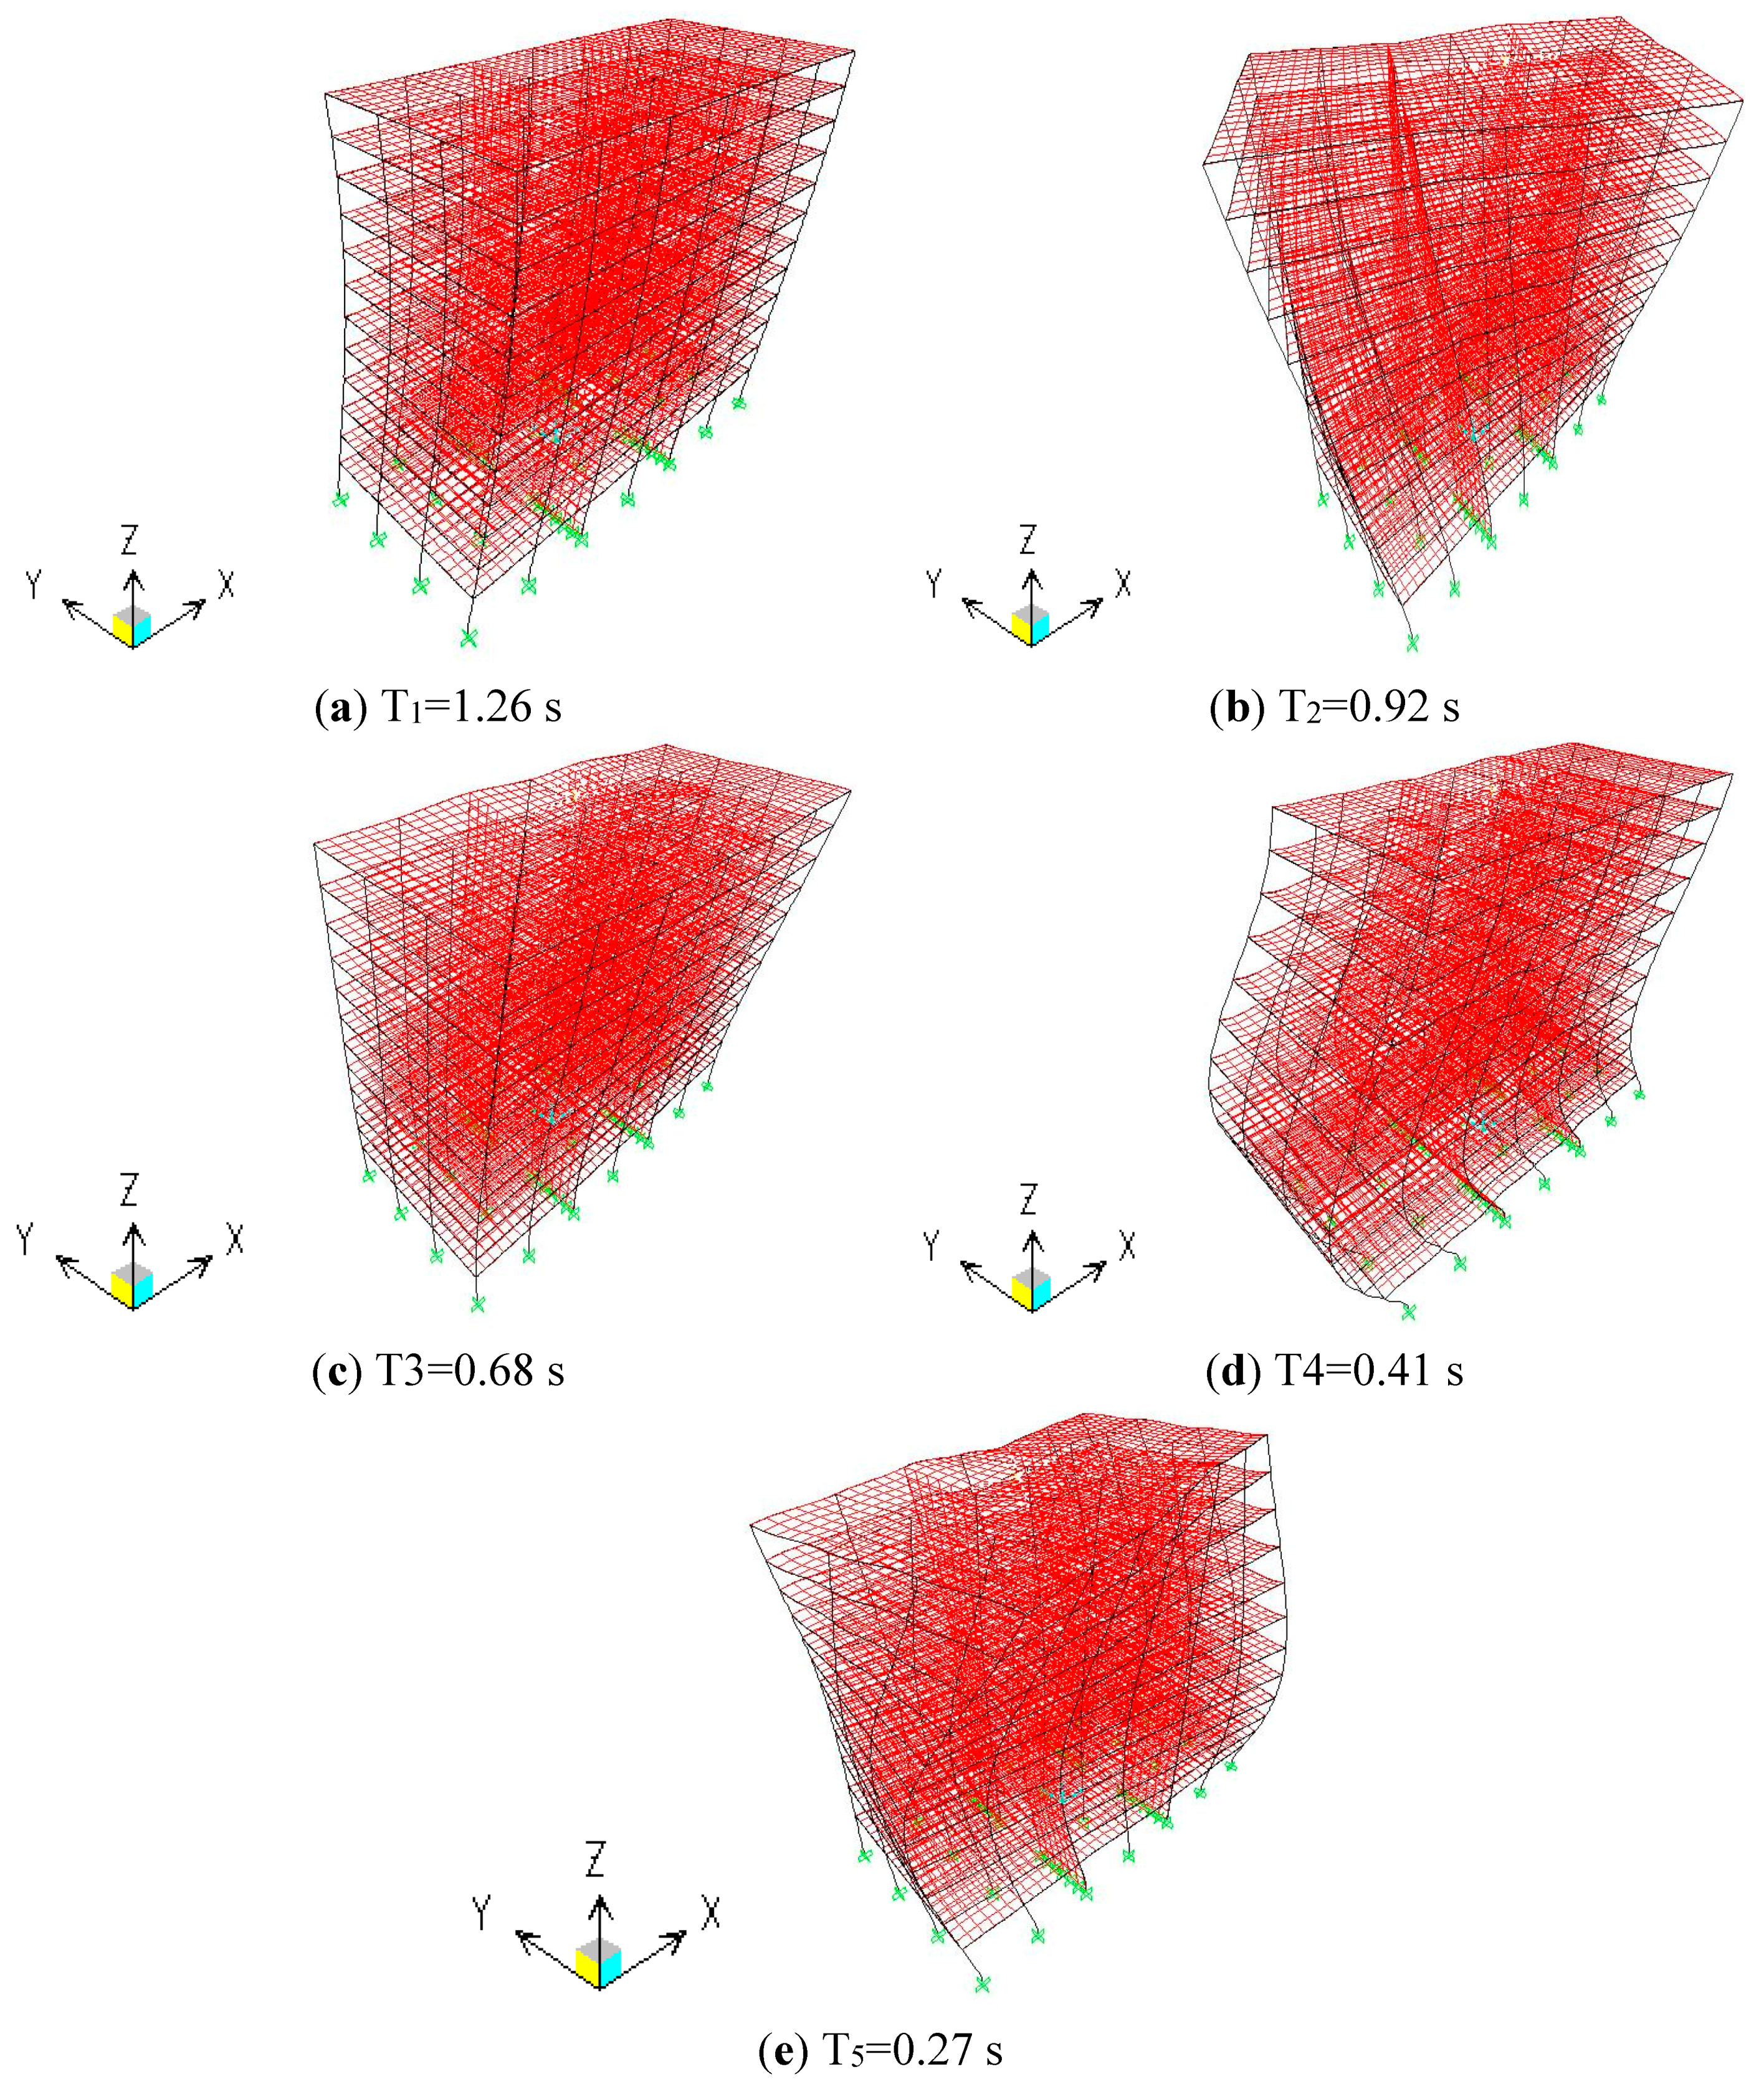
A 3D finite element model was developed through commercially available finite element software, SAP2000 software, which is developed by Computers and Structures, Inc. (CSI, Walnut Creek, CA, USA) [17]. A 3D model was generated according to the approaches provided by previous study [18] for multistory reinforced concrete structures. Frame elements available in the software were used to represent the beams and columns. To idealize the concrete slab and shear walls on each floor of the structure, shell elements were employed accounting for their properties both in plane and out of plane stiffness. All the beams were idealized as T-beams to take into account of the effective width of the slab. The structure was assumed to be fixed to the base. An automatic mesh generation enabling to efficiently mesh all the elements was utilized and the meshes were properly fine to meet the accuracy of the model. The slab was modeled as rigid diaphragms to constrain all the nodes on each floor facilitating equal plane displacement. To account for cracked section properties of all the members, flexural stiffness modifiers, 0.35 were applied to the gross cross-section of the beams while the values of 0.7 were used for the columns. 3D computational model created is as Figure 3.
Figure 3. 3D computational model.
Sustainability 07 14287 g003

3.2. Modal Analysis

Computational modal analysis, which is part of the effort to identify the structural dynamic characteristics along with the 3D model, was performed within the SAP 2000 software. Periods and corresponding mode shapes during this free vibration were determined for the structure. It is well known that a multistory structure has multiple degrees of freedom (DOFs) and mode shapes that describe the modes of vibration for the structure in terms of relative amplitudes and angles [17] and the model shapes are typically characterized by structural properties. The mode shapes of the structure considered for this study were at first obtained prior to performing its seismic analysis. Referring to Figure 4, the first five mode shapes of the structure were identified. The first (see Figure 4a) and third mode shapes (see Figure 4c) have the greatest modal mass along the translational x (longitudinal) and y (transverse) directions, respectively. The second mode shape appears to be the first torsional mode as shown in Figure 4b, while the fourth mode shape shows a double curvature bending mode as illustrated in Figure 4d. It is apparent in Figure 4e that the fifth mode is the second torsional mode.
Figure 4. Mode shapes: (a) first mode; (b) second mode. (c) third mode; (d) fourth mode; and (e) fifth mode.
Sustainability 07 14287 g004
According to the American Society of Civil Engineers (ASCE) 7–10 Standards for Minimum Design Loads for Buildings and Other Structures [19], modal analysis shall include a sufficient number of modes to obtain a combined modal mass participation of at least 90 percent of the actual mass in each of the orthogonal horizontal directions. Therefore, the modal participation factors for 25 modes of the structure that were assembled to be satisfactory with the ASCE code requirement are listed in Table 1. The table enables to identify the dominate direction of vibration for each of the first 25 modes. It is obvious from this table that the first four mode mass participation factors exceed 90 percent of the total mass of the structure in a longitudinal direction, while the first 25 modes has a sum of the mass participation factors that is greater than the limit in a transverse direction. The difference in the mass participation factors between longitudinal and transverse directions can be attributed to the difference in stiffness and mass only because there are no shear walls in the longitudinal direction.
Table 1. Modal participation factors for selected structure.
ModePeriod (s)X-TranslationalY-TranslationalZ-TranslationalSum XSum YSum Z
11.260.830.000.000.830.000.00
20.920.000.000.000.830.000.00
30.680.000.700.000.830.700.00
40.410.100.000.000.930.700.00
50.270.000.000.000.930.700.00
60.230.030.000.000.960.700.00
70.170.000.190.000.960.890.00
80.160.020.000.000.980.890.00
90.140.000.000.340.980.890.34
100.140.000.000.180.980.890.52
110.130.000.000.000.980.890.52
120.120.000.000.170.980.890.70
130.120.010.000.030.980.890.73
140.120.000.000.000.980.890.73
150.110.000.000.000.980.890.73
160.10.000.000.000.980.890.73
170.090.000.000.000.980.890.73
180.090.000.000.010.980.890.74
190.090.000.000.000.990.890.74
200.090.000.000.010.990.890.75
210.090.000.000.010.990.890.75
220.090.000.000.000.990.890.75
230.080.000.000.000.990.890.75
240.080.000.000.000.990.890.75
250.080.000.060.000.990.950.75
Note: the number in bold means the first mode having the sum of modal mass participation factors that exceeds 90 percent in both x- and y-translational directions.

4. Seismic Analysis Approaches

Two standard seismic analysis approaches for the structure are described herein. This description deals with the details on applied loads and considered codes, response spectrum analysis, and nonlinear time history analysis specific to the structure in following subsections.

4.1. Applied Loads and Codes

All loads that serve as the basis for the seismic design and investigation of the structure were basically determined according to ASCE 7–10 Standards [19]. Dead loads include the weight of the structure, excluding the loads related to partition and cladding components. Area loads representing the dead and live loads were assigned to each floor of the structure. The live load was taken as 958 kN/m2 and the roof live load was taken as 2394 kN/m2. Earthquake load, which was assigned to the entire structure, was determined according to [4]. The mapped maximum considered earthquake spectral response accelerations for a short period (Ss) and 1-second period (S1) were taken as 2.028 g and 0.753 g, respectively. According to ASCE 7–10, [4] and Los Angeles Tall Building Structural Design Council (LATBSDC) code [20], following load combinations were considered for the analysis of the structure:
1.4 D
1.2 D   +   1.6 L   +   0.5 L r
1.2 D   +   1.6 L r +   L
1.0 D   +   L e x p ±   1.0 E x +   0.3 E y
1.0 D   +   L e x p ±   0.3 E x ±   1.0 E y
1.0 D   +   L e x p +   1.0 E
where, D, L, Lr, Lexp, Ex, Ey, and E are the service dead load, service live load, service roof live load, expected service live load, earthquake load in x direction (longitudinal), earthquake load in y direction (transverse) and earthquake load in either x or y directions, respectively. Based upon the aforementioned codes’ recommendation, Equations (1)–(5) were used for the response spectrum analysis, while Equations (1) to (3) and (6) were applied to the nonlinear time history analysis. Ground motions necessary for the nonlinear time history analysis to capture the nonlinear seismic response were applied to the ground floor of structure in each direction. The structure was analyzed to investigate seismic behavior in accordance with the regulations for general building system [4] and assessed seismic performance according to the LATBSDC code and Federal Emergency Management Agency (FEMA) guideline [21].

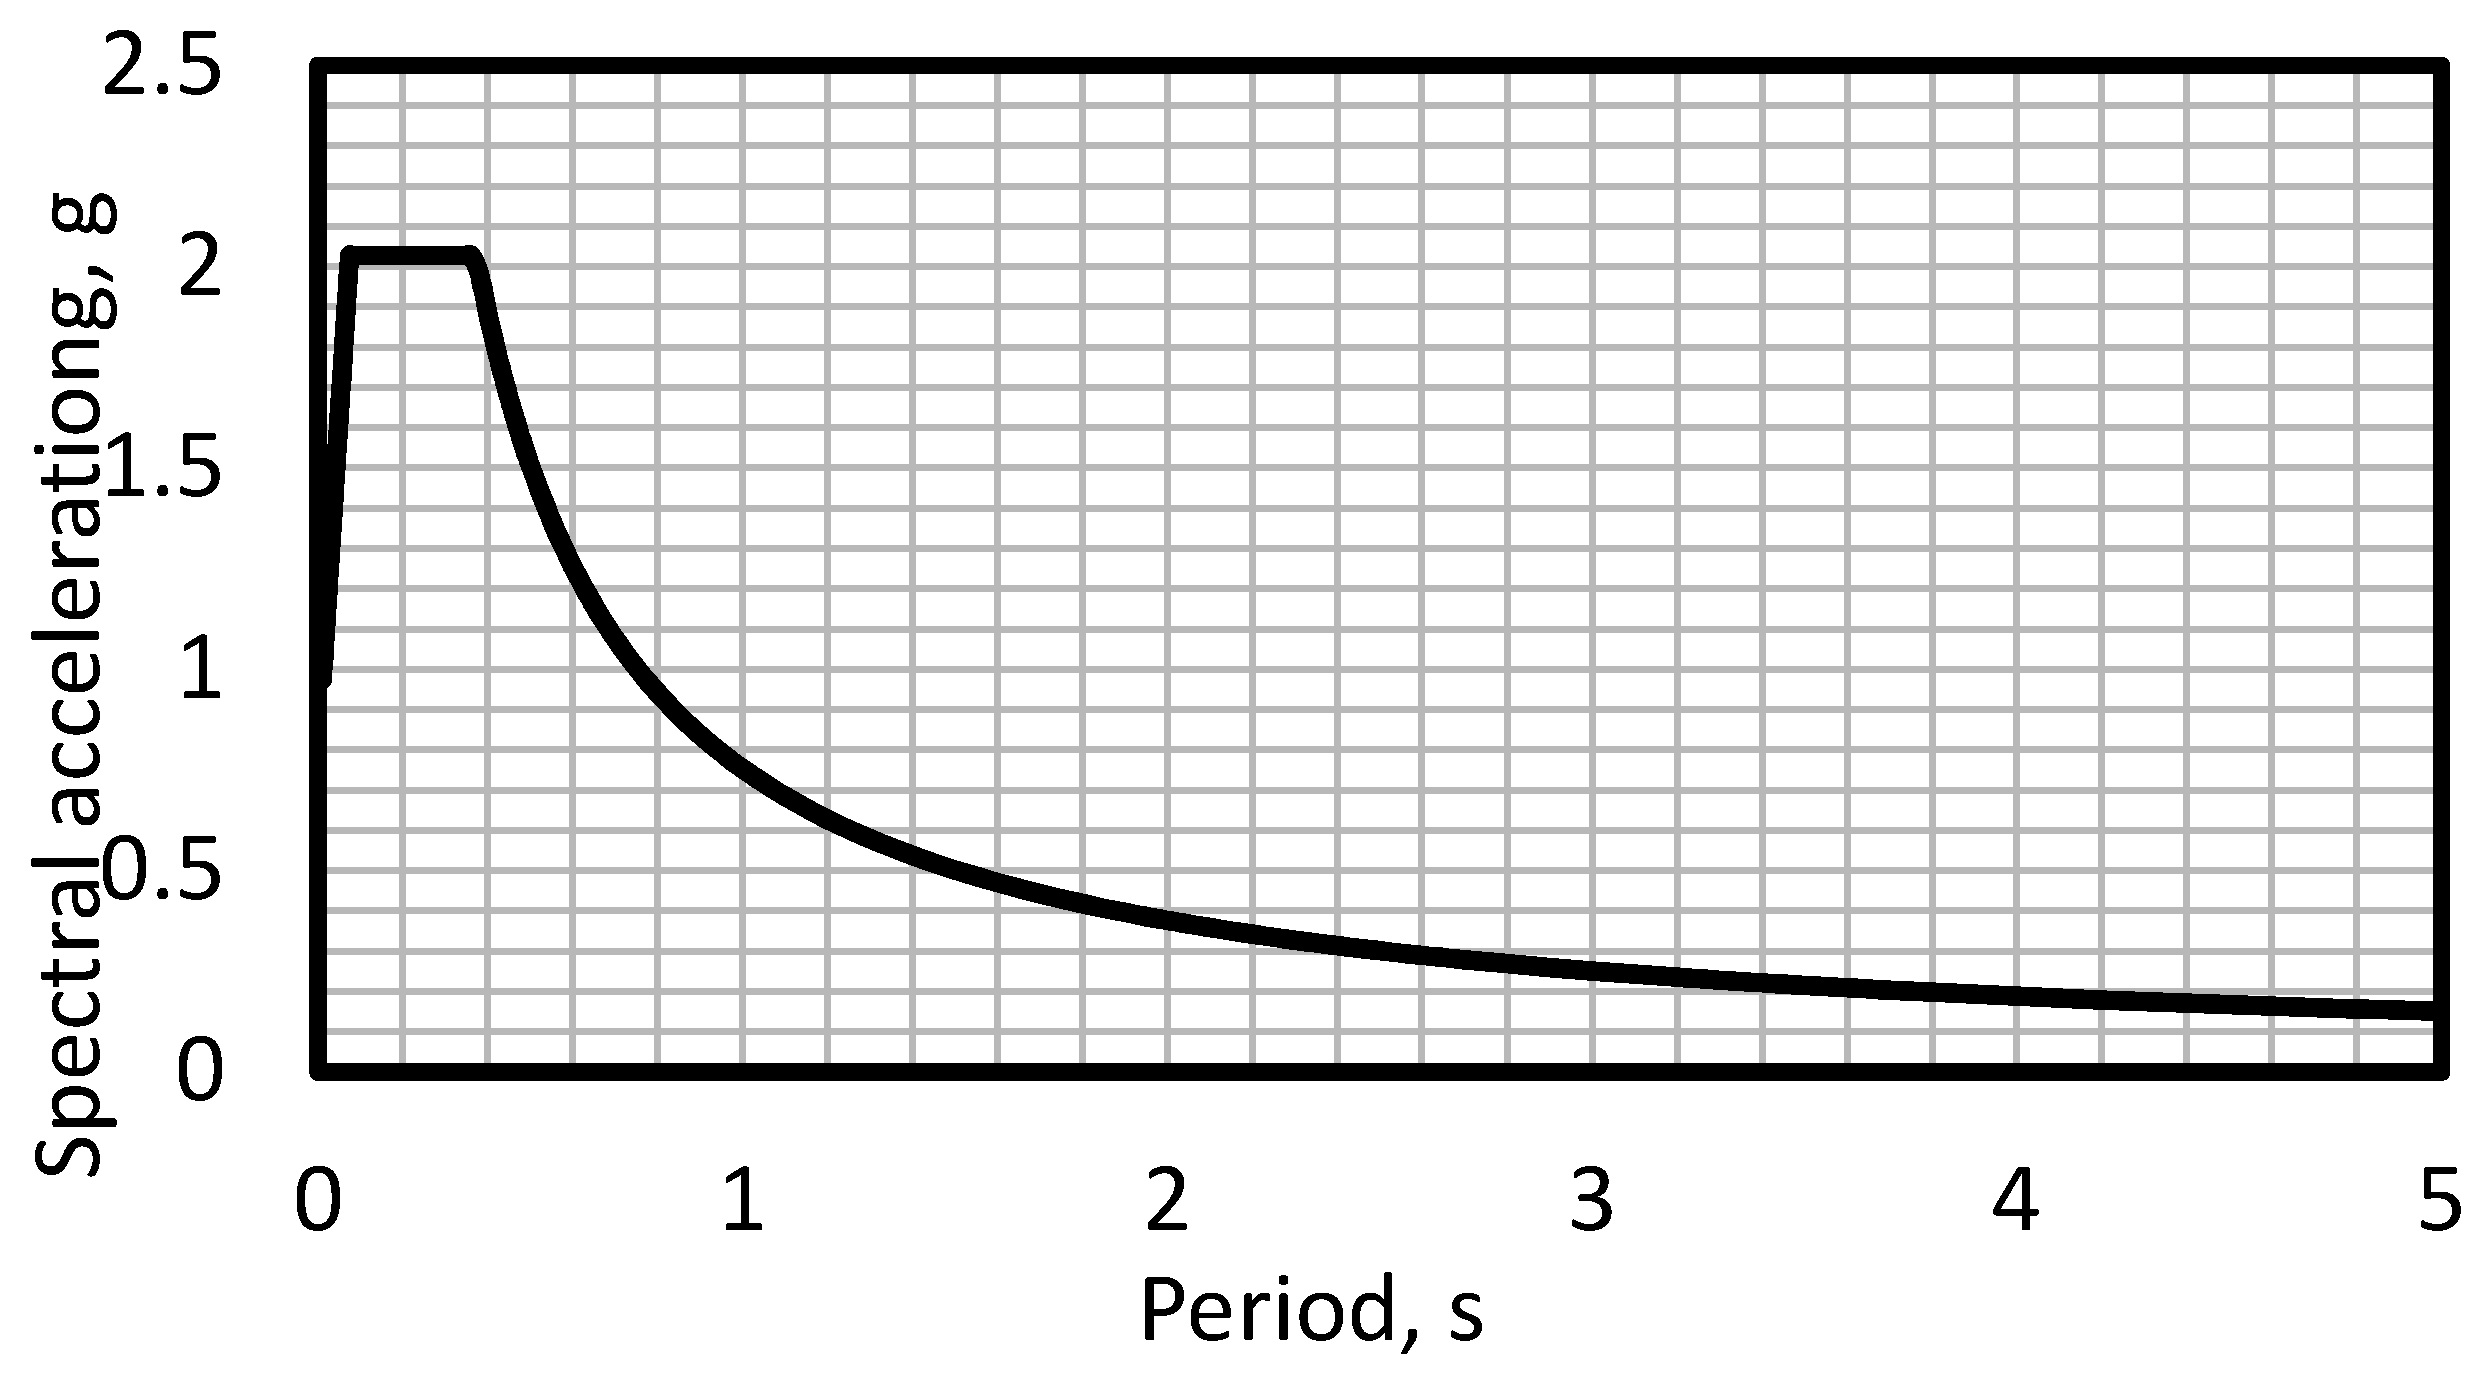
4.2. Response Spectrum Analysis

The response spectrum analysis plays a key role in seismic design and analysis of structures because this analysis is easy to learn and use to provide the peak response of all possible linear structure systems to seismic loading [22]. The response spectrum corresponding to 5% damping and 10% probability of exceedance in 50 years with a return period of 475 years was generated for the structure that is used in this investigation. The response spectrum can be used to approximately calculate seismic forces for the structure during a particular period [23]. Seismic ground motions of target site design spectrum were determined according to the [4] and ASCE 7–10. The site class used for the structure that was assumed to be located in Los Angeles, California was named C and the importance factor (Ie) was taken as 1.0 based upon the IBC and ASCE 7–10, respectively. Maximum considered earthquake (MCE) spectral response accelerations for a short period (Ss = 2.028 g) and one-second (S1 = 0.753 g) adjusted for site class effects are computed as follows:
S M S = F a S s = 2.028   g
S M 1 = F v S 1 = 0.979   g
where, Fa and Fv are the site amplification coefficients for Ss and S1 and the S M s , and S M 1 are the corresponding MCE spectral accelerations. The design response spectrum was then calculated for short and one-second periods as follows:
S D S = 2 / 3 S M S = 1.352 g
S D 1 = 2 / 3 S M 1 = 0.653 g
Generated spectrum is illustrated in Figure 5. As stated previously, Equations (4) and (5) with the spectrum were used for seismic analysis of structure within SAP2000 software.
Figure 5. Design response spectrum.
Sustainability 07 14287 g005

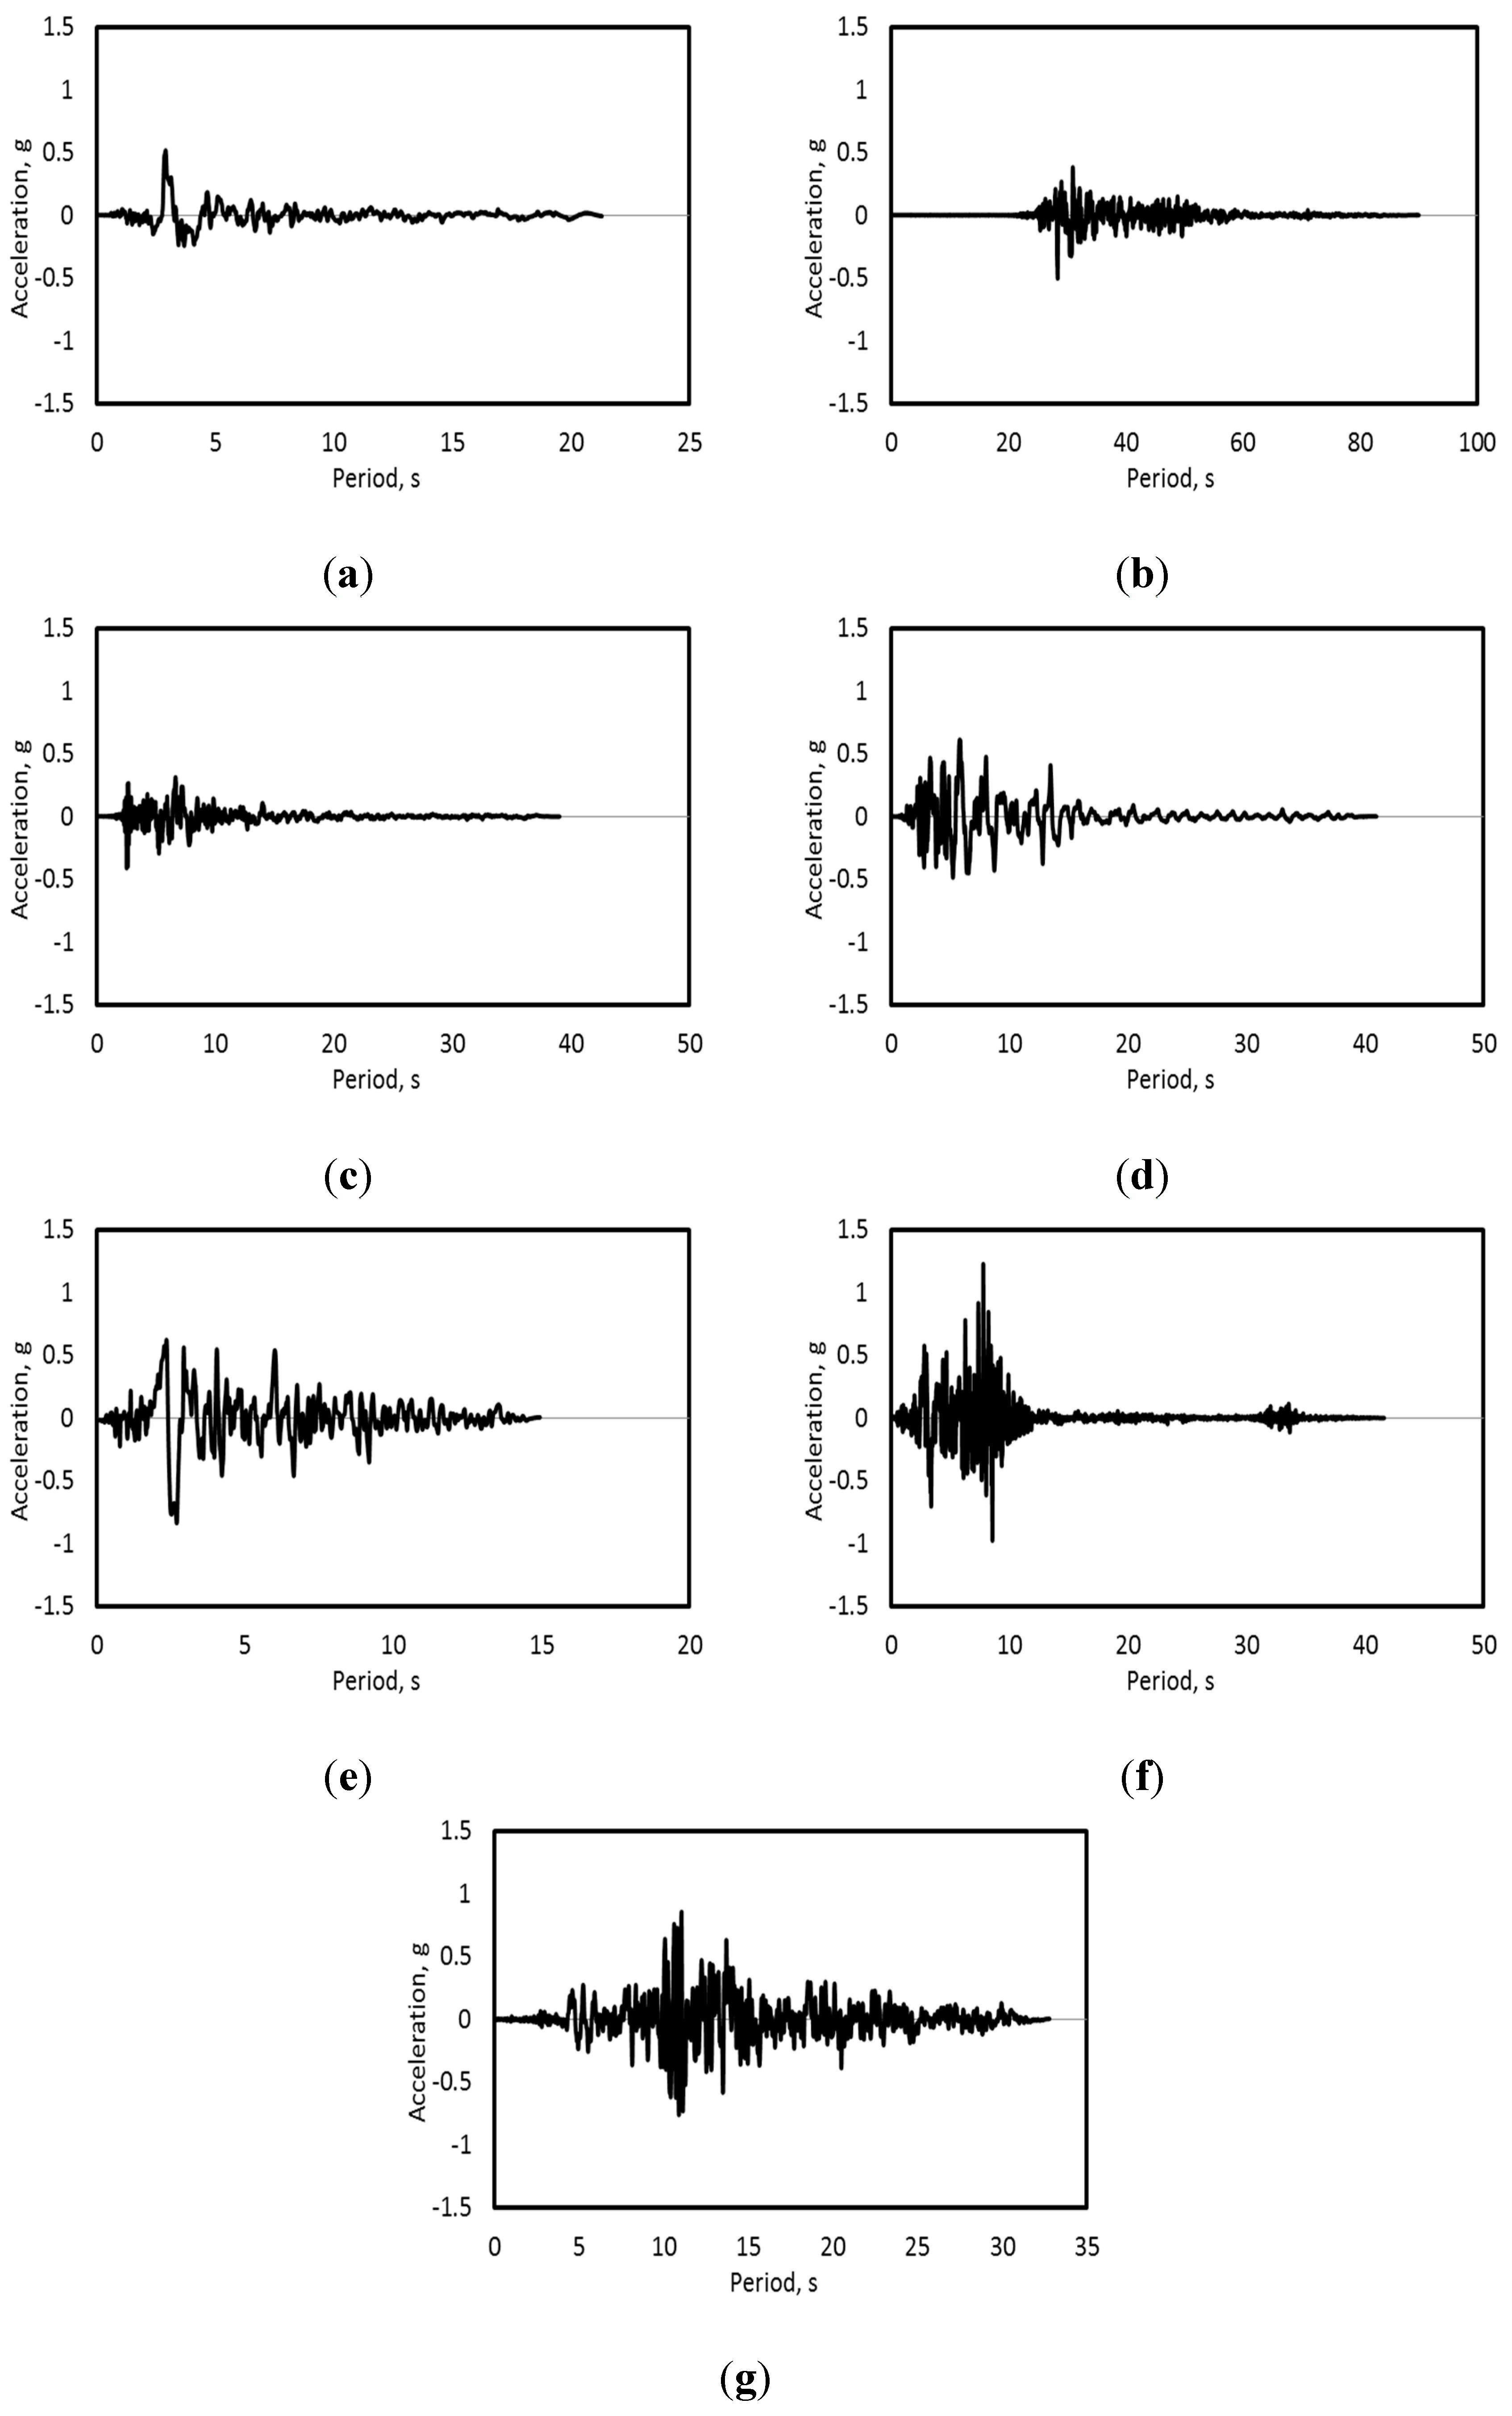
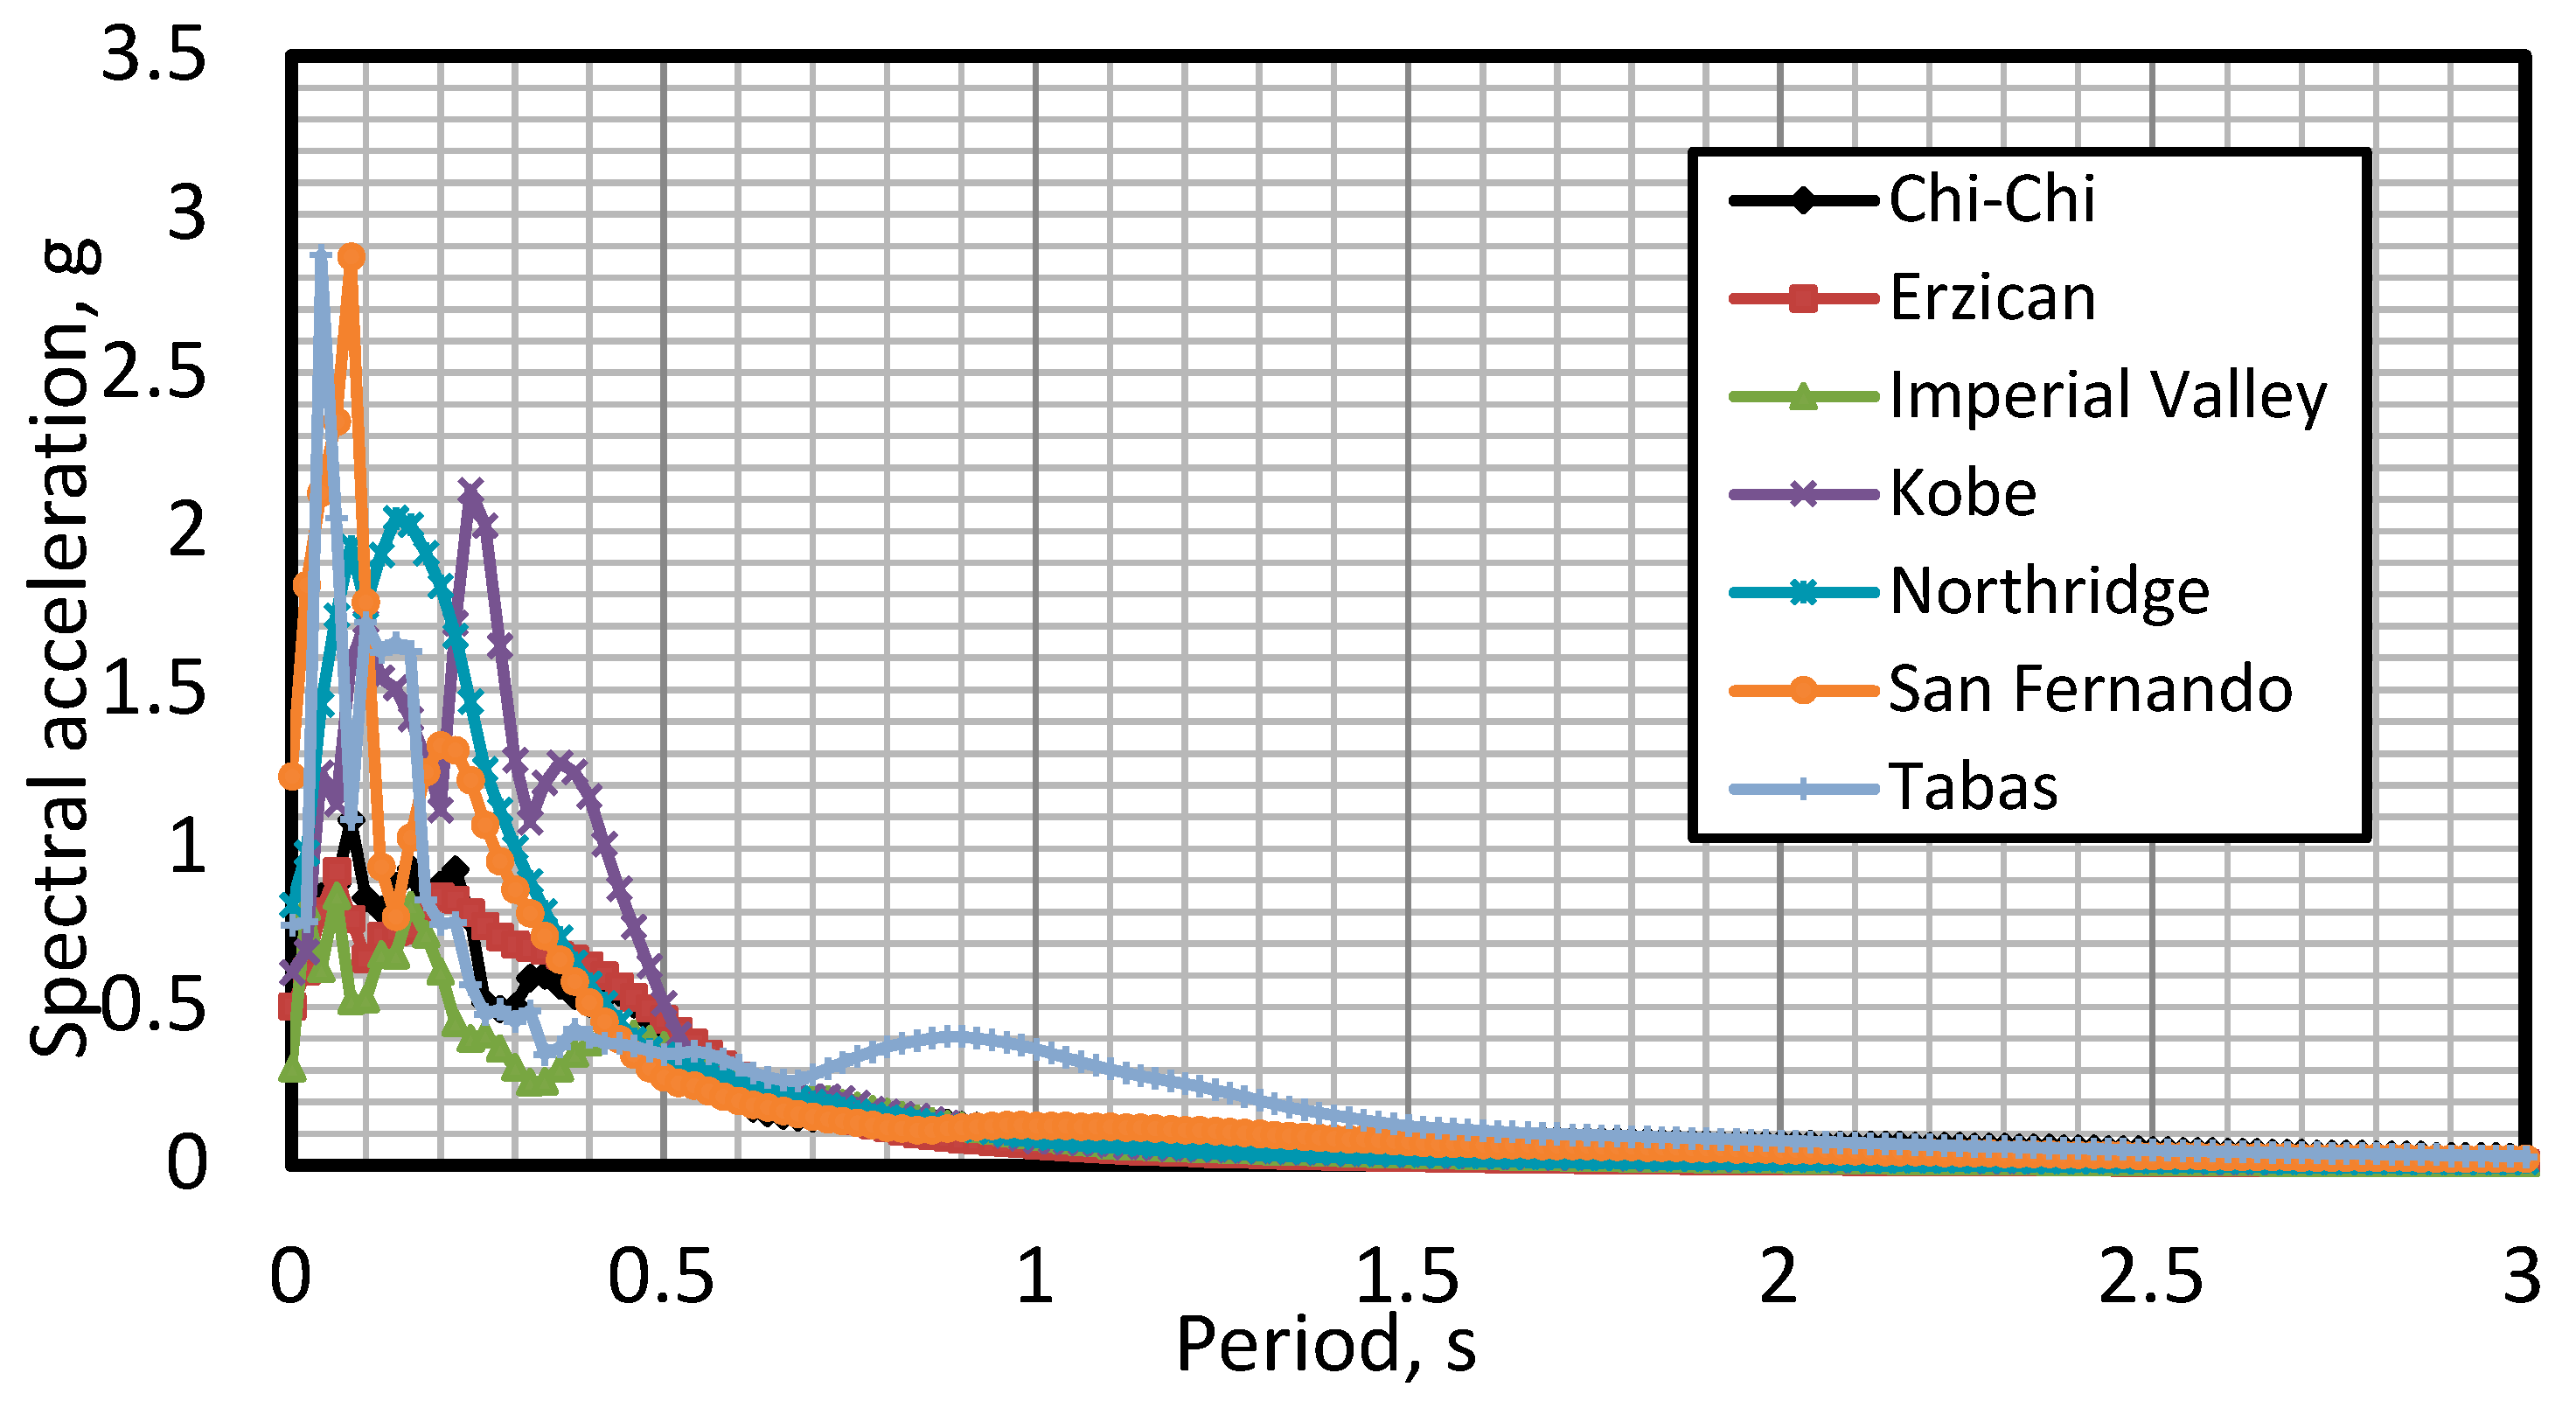
4.3. Nonlinear Time History Analysis

The inelastic behavior of multistory reinforced concrete structures under the high intensity of earthquake might occur due to the change in geometric and material features [24]. The nonlinear time history analysis that takes material and geometric nonlinearities of structures into account has been commonly used for the nonlinear seismic response computation and vulnerability assessment on such structures [25,26,27]. Hence, all of the material and geometric nonlinearities of the structure were considered for 3D finite element model that was previously created for this study. The nonlinearities were simulated during nonlinear direct-integration time history analysis available in SAP2000 software [17]. Concentrated plastic hinges were assigned to the frame and shell elements to account for the material nonlinearity and the geometrical nonlinearity was reflected during the nonlinear direct-integration analysis in conjunction with P-delta analysis provided by SAP2000 software. SAP2000 software provides the features of default plastic hinges based on FEMA-356 guidelines for practically nonlinear seismic modeling and analysis.
According to FEMA-356 guidelines that have specified the basic assumptions for normal concrete buildings, the overall illustrative relationship between force and deformation can be seen in Figure 6. This figure includes three structural performance states, including Immediate Occupancy (IO), Life Safety (LS), and Collapse Prevention (CP). The features of default plastic hinges were implemented into this research for the simplicity in the seismic analysis to the structure. It is worthwhile to note that the performance states were not specified in the seismic analyses using some quantifiable percentage of plastic hinge deformation capacity because they did not influence any of seismic simulation results. The inelastic behavior resulting from the nonlinearities during time history analysis of the structure was attained via integration of the plastic strain and curvature according to past work [17,21]. In the meantime, Rayleigh damping, mass and stiffness proportional damping, was used in the seismic analysis [28,29,30]. The mass and stiffness proportional damping equivalent to 5% of critical damping was assumed during this analysis.
Figure 6. General force-deformation relationship for a plastic hinge for reinforced concrete structures.
Sustainability 07 14287 g006
To assess the stochastic seismic performance of the structure under the pertinent seismic loads, a suite of seven near fault actual ground motions measured by strong motion instruments during each earthquake [31] was selected as listed in Table 2. According to the LATBSDC code [20], each ground motion was scaled to MCE levels of the site of interest through the next generation of ground-motion attenuation (NGA) models through the Pacific Earthquake Engineering Research Center [32] based upon ASCE 7–10 [19]. The appropriate scale factors corresponding to each motion are also included in Table 2. The ground accelerations and spectral accelerations of the selected and scaled earthquakes can be seen in Figure 7 and Figure 8, respectively. The suite of scaled ground motions were used as input loads in nonlinear history analysis of the 3D model under the aforementioned load combinations, which include Equations (1) to (3) and (6).
Figure 7. Selected earthquake ground accelerations: (a) Chi-chi; (b) Erzican; (c) Imperial Valley; (d) Kobe. (e) Northridge; (f) San Fernando; and (g) Tabas.
Sustainability 07 14287 g007
Figure 8. Spectral acceleration of the selected earthquake ground motions.
Sustainability 07 14287 g008
Table 2. Characteristics of selected earthquakes and scale factors.
EarthquakeCountryOccurrencePGA (g)Time Step (s)Scale Factor
Chi-ChiTaiwan19990.410.0051.02
ErzicanTurkey19920.490.0051.12
Imperial ValleyUSA19790.430.0050.86
KobeJapan19950.650.0100.62
NorthridgeUSA19940.630.0050.68
San FernandoUSA19711.160.0100.67
TabasIran19780.810.0200.55

5. Comparison in Seismic Performance with Building Codes

The seismic response of the structure was computed using 3D computational model following the recommended two seismic analysis approaches in the seismic building codes [4,20] and the performance was evaluated based on the seismic building codes [20,21]. Further detailed discussion on seismic response and performance are presented in following subsections.

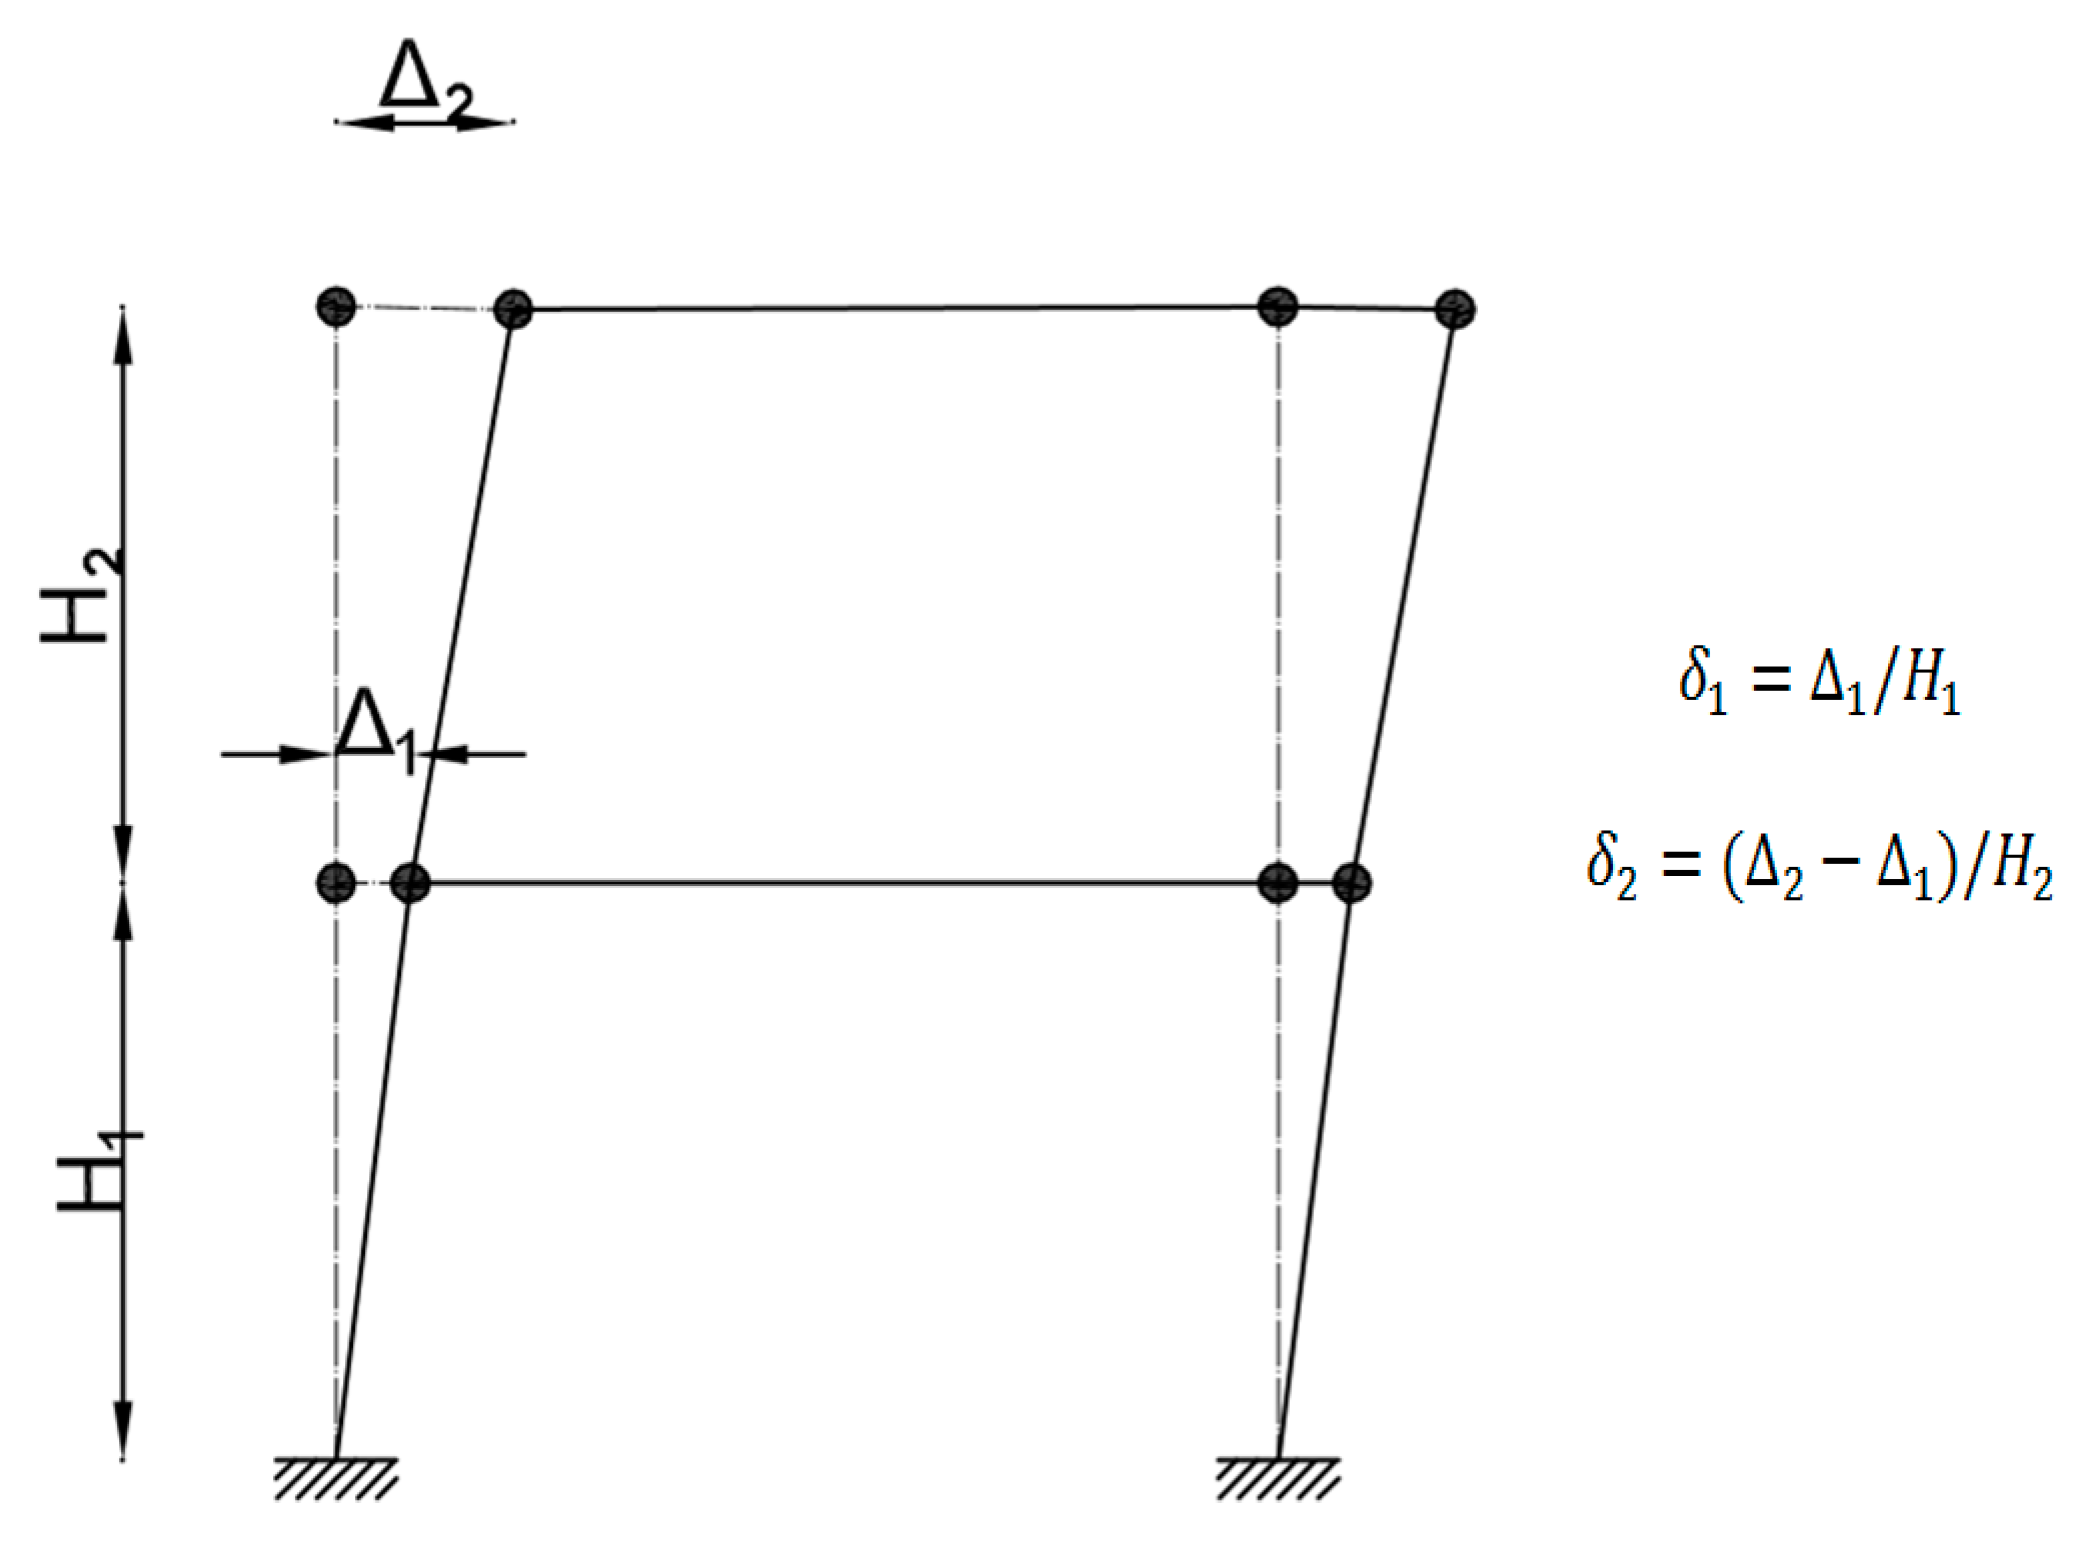
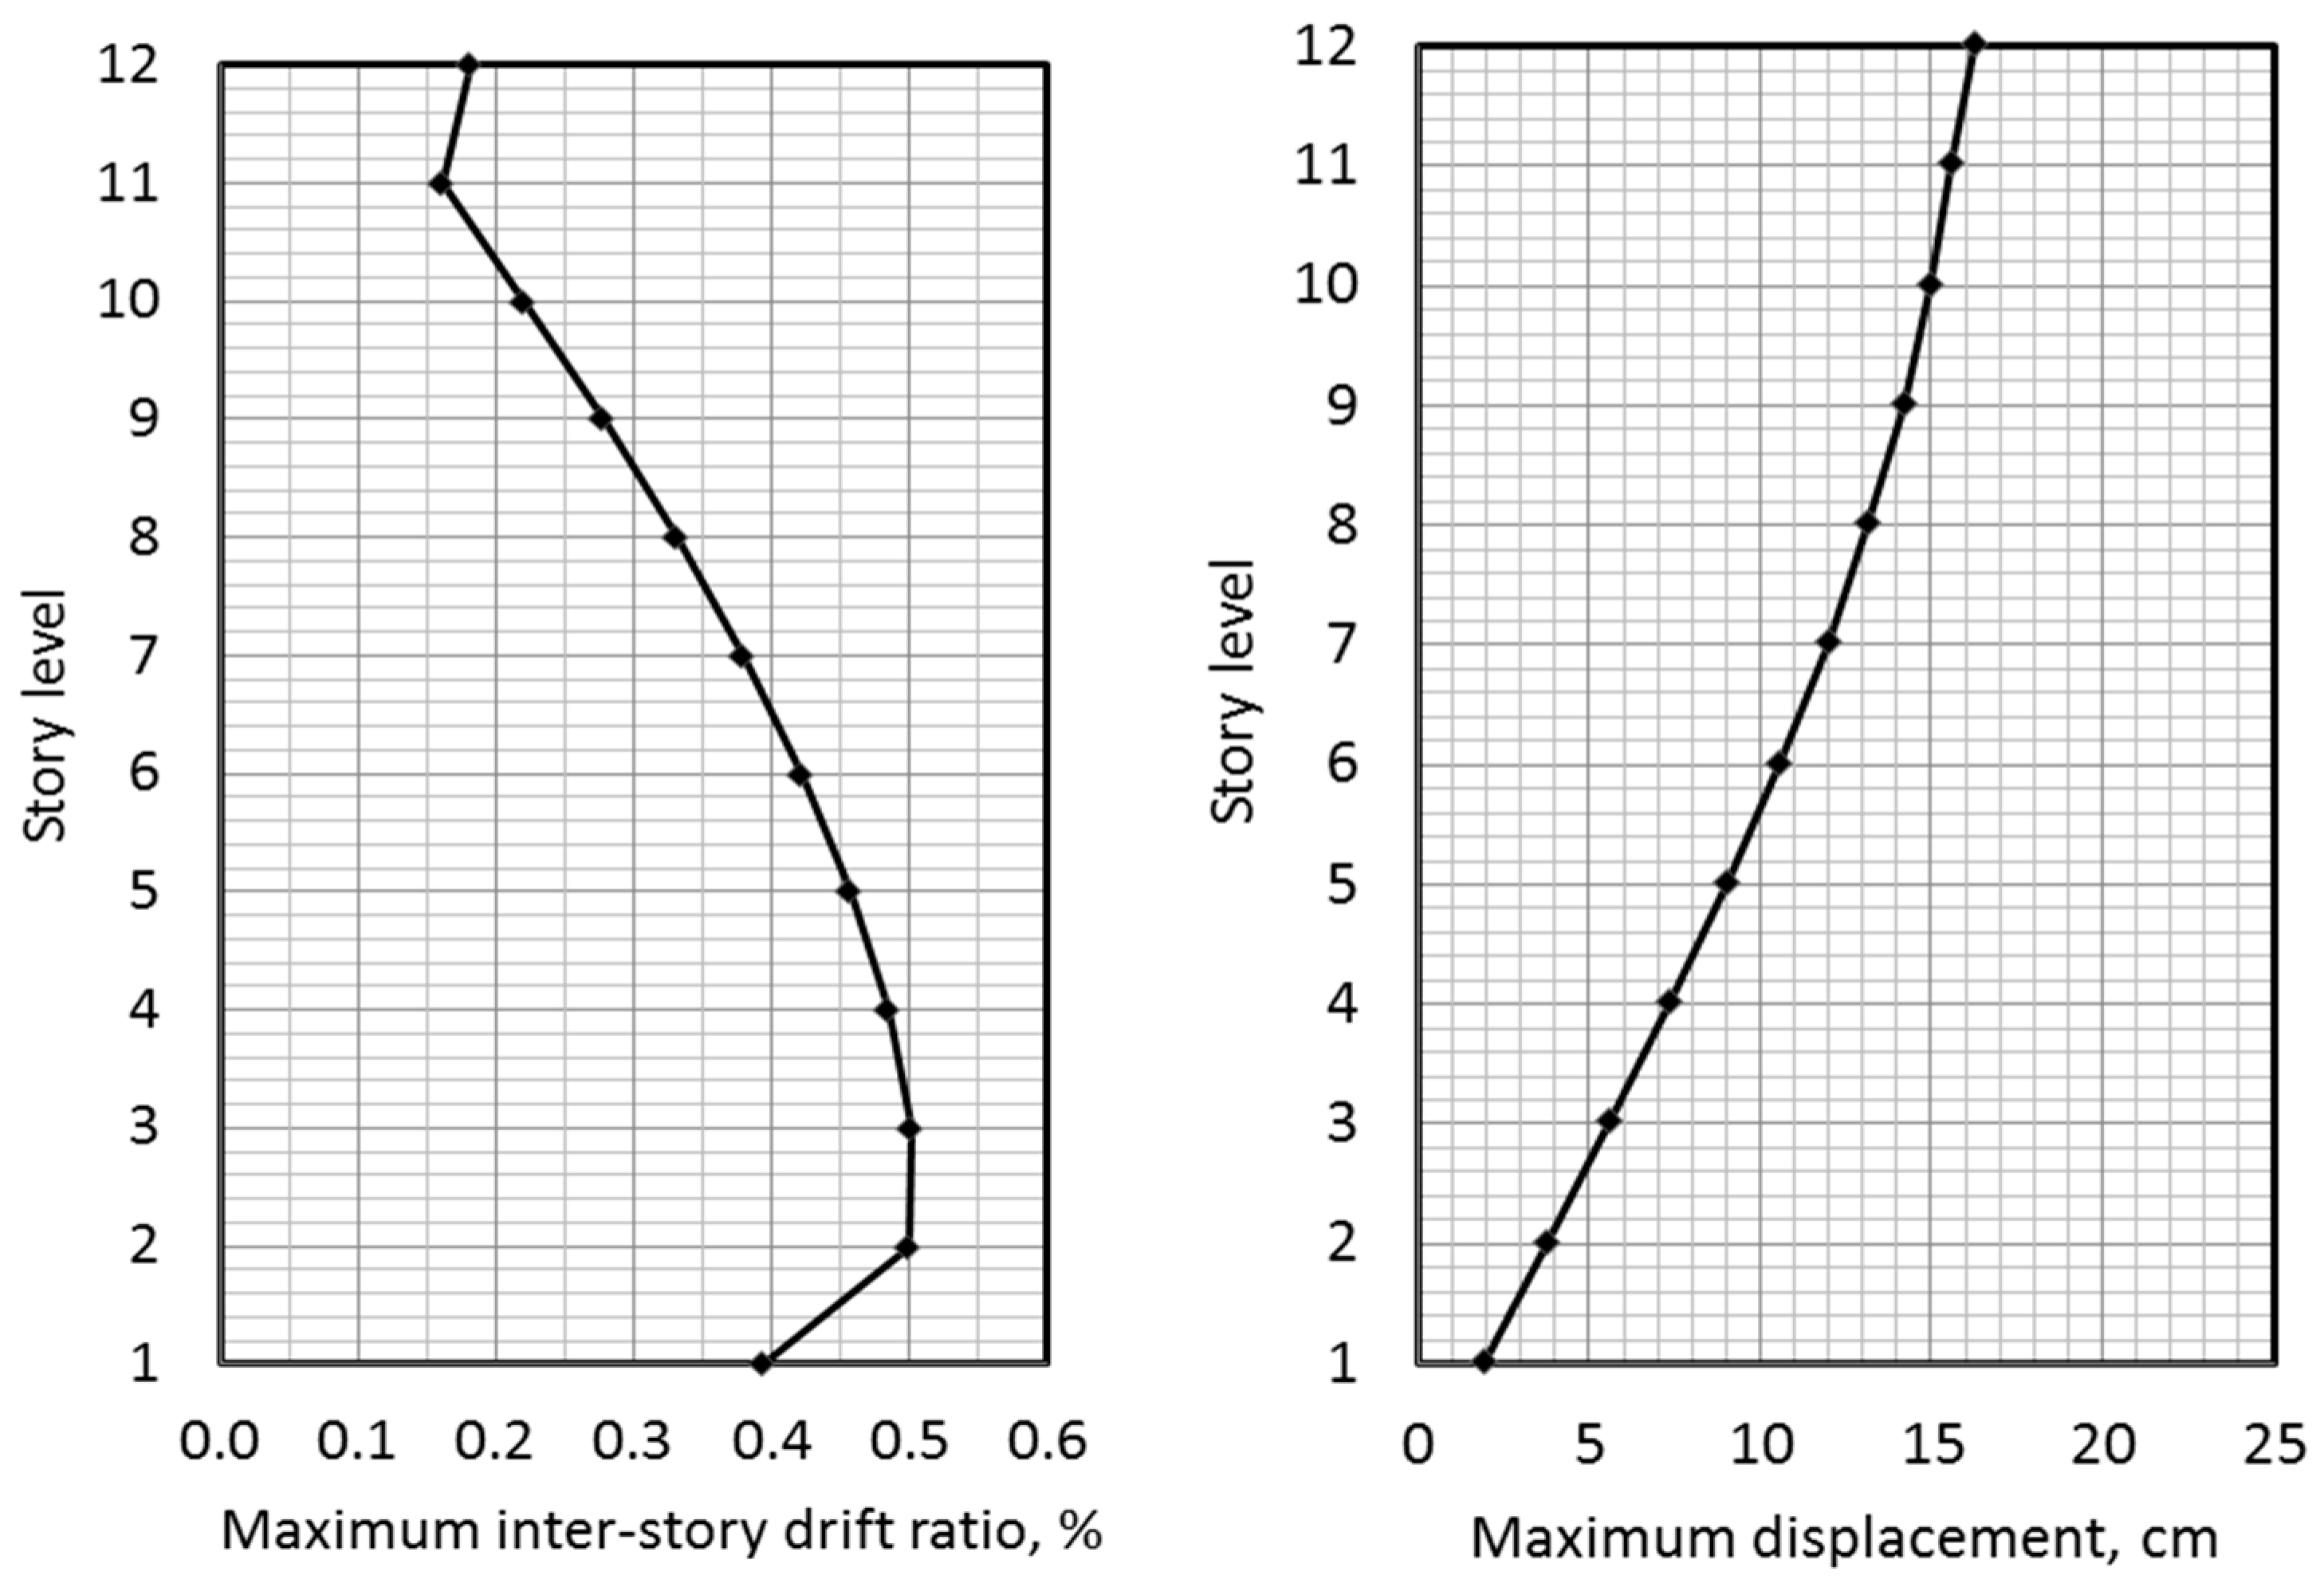
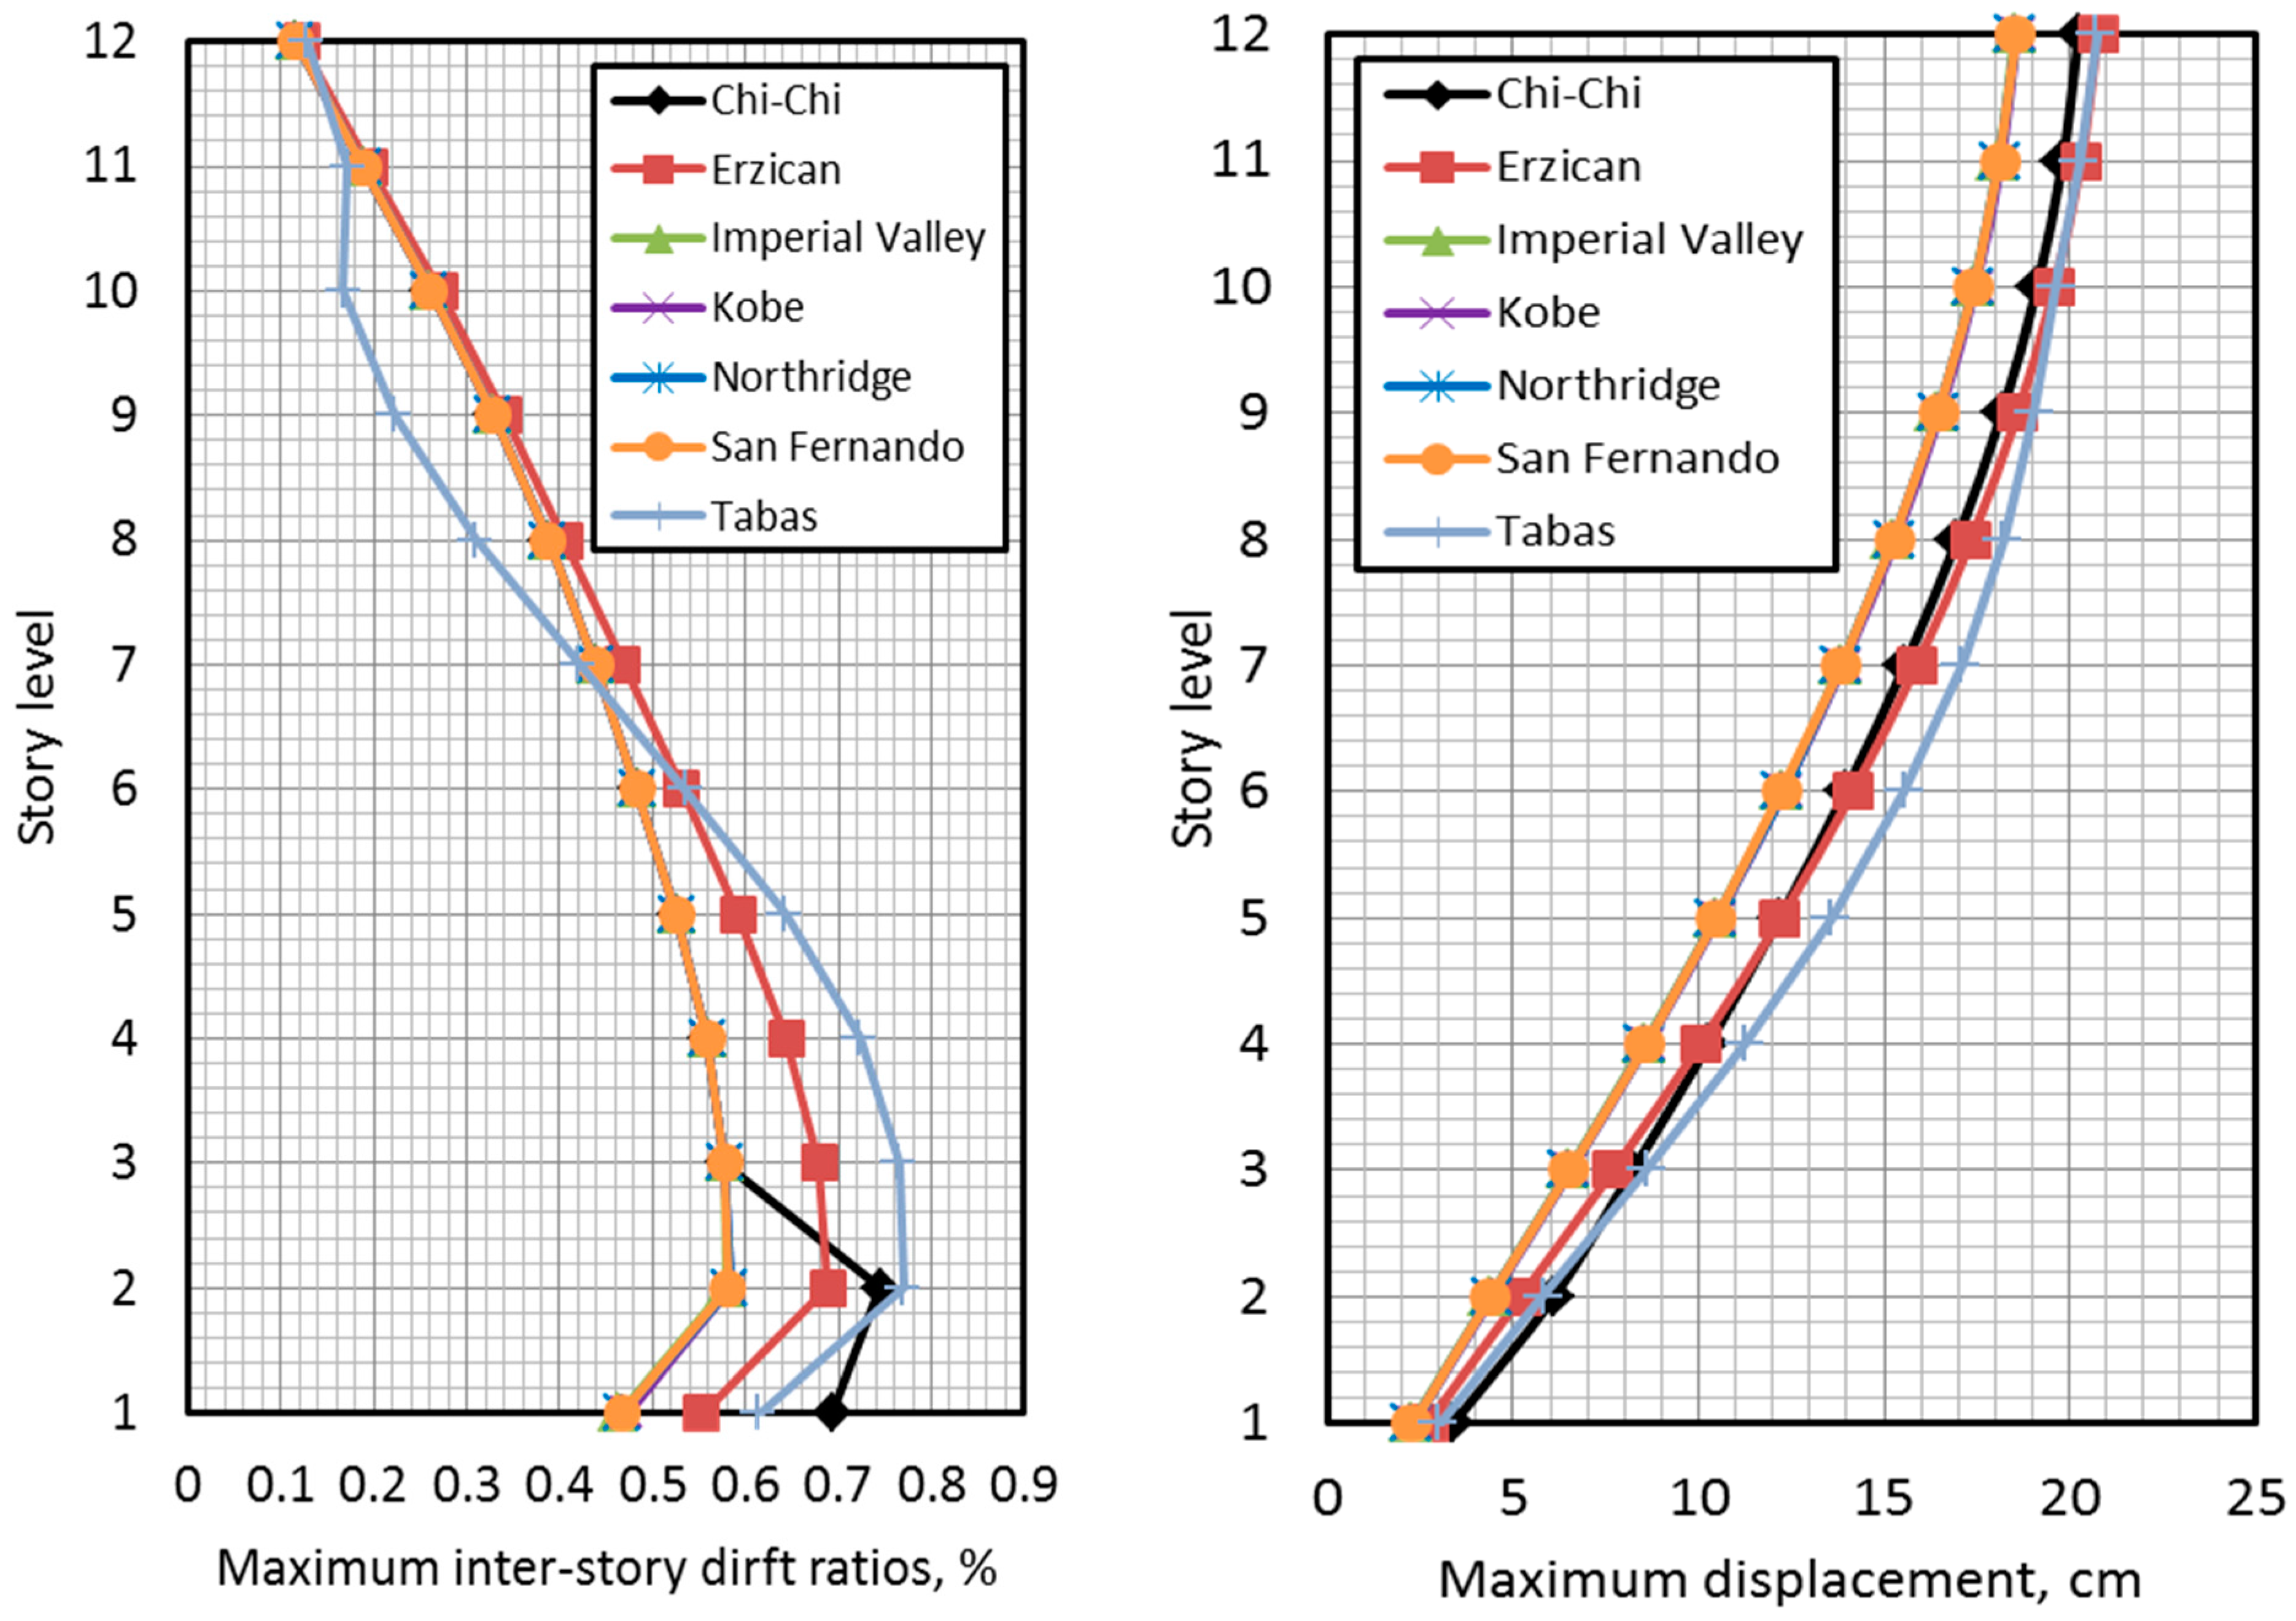
5.1. Seismic Response

Seismic response examinations of the structure that serve as the basis to seismic performance evaluation were made using two approaches in conjunction with 3D model. Maximum inter-story drift ratios deemed to be the representative seismic response and performance indicator specific to multistory structures [11,21] were calculated using lateral displacements for each floor. Illustration for the inter-story drift ratio calculation in a two-story framing structure is as Figure 9. This figure indicates that the drift ratio is the ratio of maximum seismic story displacement and floor height of the structure.
Following the calculation strategy of the drift ratio, maximum displacements and corresponding inter-story drift ratios for both the response spectrum analysis and nonlinear time history analysis on each floor were determined and each of the distributions along the story level was illustrated in Figure 10 and Figure 11, respectively. As revealed in the distributions in these figures, the maximum displacements for both analyses increase along the height of structure as the story level of the structure is higher. However, the distributions of corresponding inter-story drift ratios for both analyses are slightly different from those of maximum displacements because these ratios vary depending on the relative story displacements and heights. The maximum displacement of 16.24 cm, which is equivalent to 0.36% of the total height of the structure, was found from the response spectrum analysis, while the value obtained from the nonlinear time history analysis is 20.8 cm, which is equal to 0.46% of the height. The maximum inter-story drift ratio of 0.50 that occurs at the third floor was found from the response spectrum analysis, while the value of 0.77 which is found at the second floor was obtained from the nonlinear time history analysis. The nonlinear time history analysis of the 3D structure model provided 28.1% and 54.0% greater values of the maximum displacements and drift ratios compared to those for the response spectra analysis.
Figure 9. Graphical representation for inter-story drift ratio calculation.
Sustainability 07 14287 g009
Figure 10. Distributions for maximum inter-story drift ratios and displacements for response spectrum analysis.
Sustainability 07 14287 g010
Figure 11. Distributions for maximum inter-story drift ratios and displacements for nonlinear time history analysis.
Sustainability 07 14287 g011

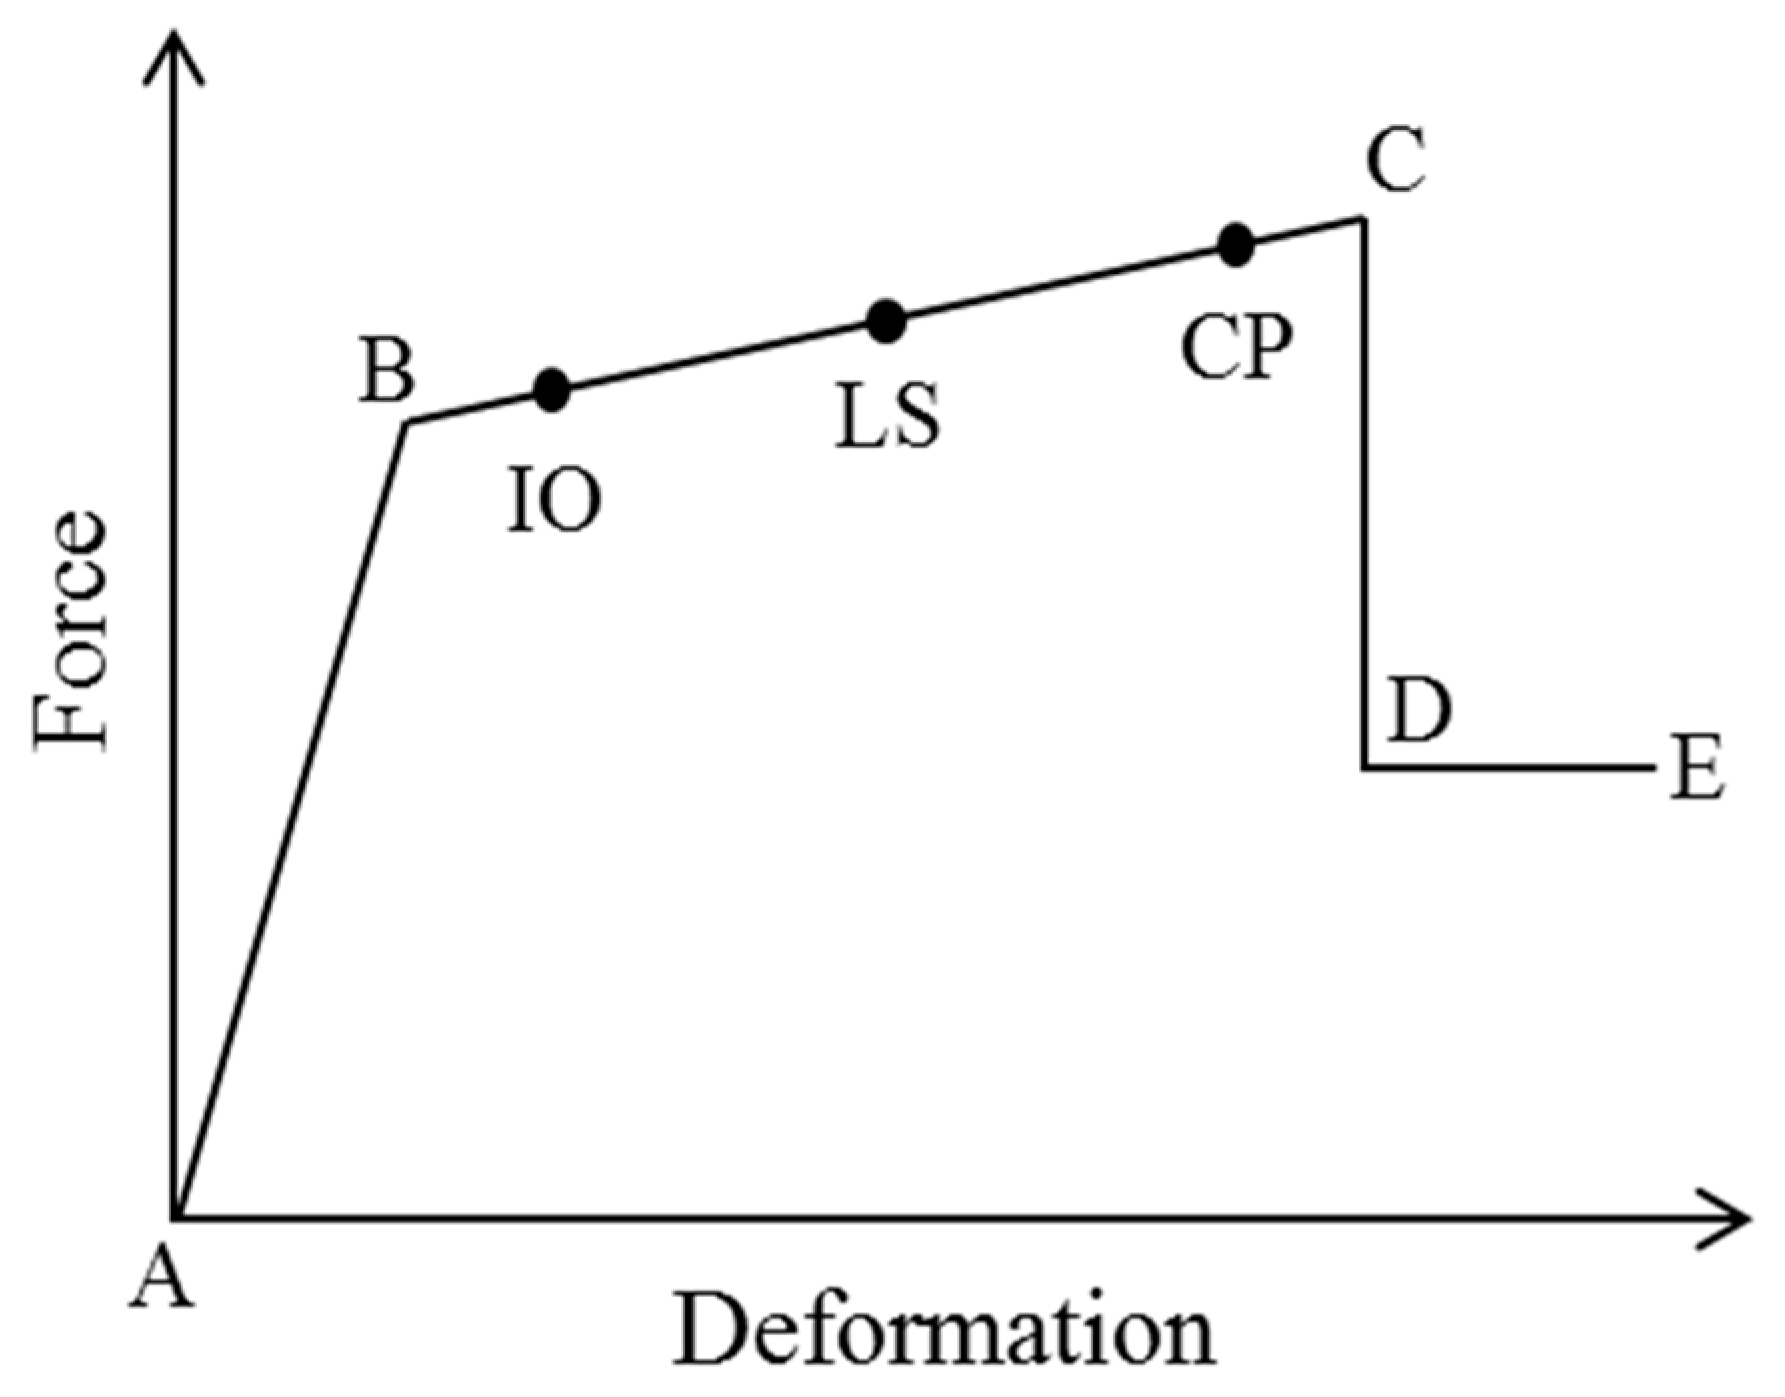
5.2. Seismic Performance

Most of the studies in seismic performance evaluation using the nonlinear time history analysis approach that incorporates the classical fragility concept were on typical steel [11] or reinforced concrete moment-resisting framing structures [26,30]. The fragility curves created based on the fragility concept provide conditional probability exceeding a certain limit state at each seismic performance state for a given seismic intensity level [2,18]. Recent literature deals with a number of applications on different types of structures including bridges [11,33,34,35] and wind turbines [36]. However, relatively less examination of seismic performance of multistory reinforced concrete moment resisting-framing structures with shear walls in the form of fragility curves have been carried out in previous work. To better understand seismic performance of the structure under the broad spectrum of ground motion intensities, seismic vulnerability was evaluated using fragility curves.
A fragility curve can be typically generated with the use of a mathematical function related to seismic capacity and demand of the structure, accounting for their uncertainties [37]. Mathematical function of fragility curves can be expressed as follows:
p f = Φ [ l n ( S d S c ) β d 2 + β c 2 ]
where Pf is the conditional probability of exceeding a certain performance limit state; Sd is the seismic demand caused by seismic loads; Sc is the median value of structural capacity for predefined damage state; βd is the logarithmic standard deviation of the demand; βc is the logarithmic standard deviation for the capacity; and Ф[ ] is the standard normal distribution function. βc was assumed to be 0.3 following the recommendations from HAZUS [38], while βd was calculated as the logarithmic standard deviation of seismic responses gained for each floor of the studied structure from the nonlinearly time history analyses. As aforementioned, the maximum inter-story drift ratios have been widely and efficiently used to generate fragility curves for multistory framing structures at pre-described FEMA different performance levels. FEMA 356 [21] provides quantitative and descriptive structural performance levels specific to concrete frames and walls using drift ratios as listed in Table 3. The FEMA 356 has three performance levels for the extent of structural damage including IO, LS and CP. Therefore, a certain drift value, Sc, for a given performance level was employed to identify seismic performance and create seismic fragility curves of the structure considering the uncertainties of structural capacity and demand according to the guideline recommended by the Hazards US Multi-Hazard [38].
The seismic demand of the studied building can be determined by [39]:
S d =   x a e b
where x is the selected ground motion intensity variable, spectral acceleration, and a and b are the regression coefficients of the seismic responses obtainable from the nonlinear time history analyses. Equation (12) can be expressed in the logarithmic form as follows:
ln ( S d ) = a   ln ( x ) + b
The certain regression coefficients in the Equation (13), which is the probabilistic seismic demand model for inter-story drift ratios of the studied building, were obtained via regression analysis with simulation results. The detailed procedure for the determination of the coefficients can be found elsewhere [40].
Through the aforementioned procedure, a number of floor-level fragility curves that enable the quantification of the structure vulnerability specific to moment resisting framing system (longitudinal direction) and shear wall system (transverse direction) of the studied structure are yielded as separately illustrated in Figure 12 and Figure 13. Each figure has three sets of the floor-level fragility curves sets, including (a), (b), and (c) for the IO, LS, and CP performance levels, respectively. It appears that the second and third floors that have almost identical exceedance probability are the most fragile among all the floors at all performance levels for both systems. In Figure 12a, the second and third fragility curves for IO performance level have an exceedance probability of 0.50 (i.e., median probability) for Sa of 0.652 g and 0.648 g, while the fragility curves of remaining floors having Sa up to 1.00 g failed to reach its probability. As shown in Figure 12b,c, the second and third fragility curves for LS and CP performance levels have an exceedance probability of 0.25 (i.e., estimate of probability to the 25th percentile) for Sa of 0.780 g and 0.775 g and 0.05 (i.e., estimate of probability to the 5th percentile) for Sa of 0.054 g and 0.055 g, respectively. The longitudinal fragility curves are then compared to the transverse fragilities (see Figure 13) at each performance level, resulting in the reduction in the seismic vulnerability of the selected structure. The importance of the use of the shear walls to enhance the seismic performance, leading to the increase in the sustainability on such a structural system in the structure is underlined. As also indicated in these figures, the floor-level fragility, in most cases, decreases at all the performance levels with an increase in height as a result of reduced maximum inter-story drift ratios.
Table 3. Structural performance levels for concrete structures (FEMA 2000).
ElementsTypeStructural Performance Levels
Collapse Prevension (CP)Life Safety (LS)Immediate Occupancy (IO)
Concrete FramesPrimaryExtensive cracking and hinge formation in ductile elements. Limited cracking and/or splice failure in some nonductile columns. Extensive damage to beams. Spalling of cover and shear cracking (<1/8″ width) for ductile columns.Minor hairline cracking. Limited yielding possible at a few locations. No crushing (strains below 0.003).
SecondaryExtensive spalling in columns (limited shortening) and beams. Severe joint damage. Some reinforcing buckled.Extensive cracking and hinge formation in ductile elements. Limited cracking and/or splice failute in some nonductile columns. Severe damage in short columns.Minor spalling in a few places in ductile columns and beams. Flexural cracking in beams and columns. Shear cracking in joints <1/16” width.
Drift ratio4%2%1%
Concrete WallsPrimaryMajor flexural and shear cracks and voids. Sliding at joints. Extensive crushing and buckling of reinforcement. Failure around openings. Severe boundary element damage. Coupling beams shattered and virtually disintegrated.Some boundary element stress, including limited buckling of reinforcement. Some sliding at joints. Damage around openings. Some crushing and flexural cracking. Coupling beams: extensive shear and flexural cracks; some crushing, but concrete generally remains in place.Minor hairline cracking of walls, <1/16″ wide. Coupling beams experience cracking <1/8″ width.
SecondaryPanels shattered and virtually disintegrated.Major flexural and shear cracks. Sliding at joints. Extensive crushing. Failure around openings. Severe boundary element damage. Coupling beams shattered and virtually disintegrated.Minor hairline cracking of walls. Some evidence of sliding at construction joints. Coupling beams experience cracks <1/8″ width. Minor spalling.
Drift ratio2%1%0.5%
Figure 12. A set of inter-story drift ratio-based longitudinal fragility curves of the structure (moment resisting framing system): (a) Immediate Occupancy (IO); (b) Life Safety (LS); (c) Collapse Prevension (CP).
Sustainability 07 14287 g012
Along with the seismic fragility evaluation, the values of inter-story drift of the structure subject to seismic loads which are one of the important indicators to check the stability of the structure and evaluate potential damage to nonstructural elements were used to assess the structure seismic performance according to the seismic building codes and relevant performance assessment guidelines. According to LATBSDC code, the allowable inter-story drift shall not exceed 0.5% of story height and all the values obtained from the response spectrum analysis are satisfactory with the code listed in Table 4. However, the values for the first to sixth floors resulting from the nonlinear time history analysis are slightly larger than the limit so that they are inadequate with the code. Additionally, all the values from both response spectrum and nonlinear time history analyses are compared to the FEMA limits for inter-story drifts that area also listed in Table 3. Similar to the comparison with the LATBSDC code, the first to sixth floors drifts from the time history analysis are greater than those of the shear walls for the IO performance, although the drifts for the remaining floors are less than IO limit as shown in Table 4. The drifts for all the floors are less than those of both concrete frames or and shear walls for LS and CP performance levels. This tendency is consistent with the results from the seismic fragility analysis of the structure.
Figure 13. A set of inter-story drift ratio-based transverse fragility curves of the structure (shear wall system): (a) IO; (b) LS; (c) CP.
Sustainability 07 14287 g013
Table 4. Comparison of satisfactory performance in terms of maximum inter-story drift ratios obtained from the response spectrum analysis and nonlinear time history analysis following seismic design codes.
FloorsMaximum Inter-Story Drift Ratios (%)LATBSDC CodeFEMA Guideline
RS/NTHCPLSIO
120.18/0.13S/SS/SS/SS/S
110.16/0.20S/SS/SS/SS/S
100.22/0.27S/SS/SS/SS/S
90.28/0.34S/SS/SS/SS/S
80.33/0.40S/SS/SS/SS/S
70.38/0.47S/SS/SS/SS/S
60.42/0.53S/NS/SS/SS/N
50.46/0.64S/NS/SS/SS/N
40.48/0.72S/NS/SS/SS/N
30.50/0.76S/NS/SS/SS/N
20.50/0.77S/NS/SS/SS/N
10.39/0.69S/NS/SS/SS/N
Note: RS, NTH, S, and N indicate response spectrum analysis, nonlinear time history analysis, satisfactory, and non-satisfactory performance under each code, respectively.

6. Conclusions

Seismic performance evaluation of a twelve-story reinforced concrete structure located in Seismic Zone 4 was carried out according to seismic regulations such as Federal Emergency Management Agency (FEMA) pre-standard and commentary for the seismic rehabilitation of buildings [21] and Los Angeles Tall Building Structural Design Council [20] code. The structure consists of a moment-resisting frame system with shear walls for lateral resistance to horizontal seismic loads. A 3D finite element model was created in commercially available finite element software. As part of the seismic performance evaluation, two seismic approaches were used as follows: (1) response spectrum analysis coupled with a codified design spectrum and (2) nonlinear time history analysis, accounting for nonlinearity of material and geometry of the structure subjected to seven near-fault ground motions that closely match the design spectrum. Seismic vulnerability of the structure was evaluated using the nonlinear time history analysis following a conventional fragility analysis theory coupled with the FEMA limits. The following results from this study are obtained:
(1) Modal analysis showed that the first and third mode shapes had the most dominant modal mass along the longitudinal and transverse directions and the rest of the modes had some effects on the modal characteristics of the structure. The discrepancy of the mass participation factors of the structure between longitudinal and transverse directions occurred because of the difference in stiffness and mass due to only inclusion of shear walls in the transverse direction.
(2) The maximum displacements for both response spectrum and nonlinear time history analyses increased along the height of structure as the story level of the structure was higher. However, the distributions of corresponding inter-story drift ratios for both analyses are slightly different from those of maximum displacements because these ratios vary depending on relative story displacements and heights. The nonlinear time history analysis provided 28.1% and 54.0% greater values in maximum displacements and drift ratios compared to those for the response spectra analysis.
(3) The seismic fragility analysis demonstrated that the second and third floors that have a higher exceedance probability than the first floor are the most fragile among all the floors at all performance levels. Generally, the floor-level fragility of the structure decreased at all the FEMA performance levels with an increase in height as a result of reduced maximum inter-story drift ratios. The inter-story drifts resulted from both the analyses are in most cases satisfactory with FEMA and LATBSDC limits, although the values for some specific floors resulting from the nonlinear time history analysis were slightly larger than the FEMA limit for shear walls at IO performance level.
A key benefit of this case study with the use of two existing approaches is to provide earthquake engineers who have little experience in the seismic building performance evaluation with a detailed procedure on how to apply them to an actual reinforced concrete building for its seismic vulnerability assessment. The limitations of this study are associated with the application of the approaches to only one building with shear walls and lack of experimental seismic data to be compared with computational results. In future work, some parametric studies with structural and geometric variables along with structural types should be performed to explore their seismic performance sensitivity and the influence of the variables on seismic vulnerabilities.

Acknowledgments

This work was supported by the Incheon National University (INU) Research Grant in 2014. The authors gratefully acknowledge this support.

Author Contributions

All the authors made contributions to write, revise and proofread the manuscript.

Conflicts of Interest

The authors declare no conflict of interest.

References

  1. The Weather Channel. Powerful Aftershock Hits Nepal; Officials Tell Residents to Evacuate Damaged Buildings. Available online: http://www.weather.com/news/news/nepal-earthquake-may122015 (accessed on 13 May 2015).
  2. Ji, J.; Elashai, A.S.; Kuchma, D.A. Seismic fragility relationships of reinforced concrete high-rise buildings. Struct. Des. Tall Spec. Build. 2007, 18, 259–277. [Google Scholar] [CrossRef]
  3. Taranath, B.S. Wind and Earthquake Resistant Buildings: Structural Analysis and Design; Marcel Dekker: Boca Raton, FL, USA, 2005. [Google Scholar]
  4. International Building Code. Available online: http://publicecodes.cyberregs.com/icod/ibc/2009f2cc/index.htm (accessed on 10 October 2015).
  5. Magliulo, G.; Maddaloni, G.; Cosenza, E. Comparison between non-linear dynamic analysis performed according to EC8 and elastic and non-linear static analyses. Eng. Struct. 2007. [Google Scholar] [CrossRef]
  6. Tantala, M.W.; Deodatis, G. Development of Seismic Fragility Curves for Tall Buildings. In Proceedings of 15th ASCE Engineering Mechanics Conference, Columbia University, New York, NY, USA, 2–5 June 2002.
  7. Rossetto, T.; Elnashai, A. Derivation of vulnerability functions for European-type RC structures based on observational data. Eng. Struct. 2003, 25, 1241–1263. [Google Scholar] [CrossRef]
  8. Erberik, M.A. Fragility-based assessment of typical mid-rise and low-rise RC buildings in Turkey. Eng. Struct. 2008, 30, 1360–1374. [Google Scholar] [CrossRef]
  9. Gulec, C.K.; Whittaker, A.S.; Hooper, J.D. Fragility functions for low aspect ratio reinforced concrete walls. Eng. Struct. 2010, 32, 2894–2901. [Google Scholar] [CrossRef]
  10. Shafei, B.; Zareian, F.; Lignos, G.D. A simplified method for collapse capacity assessment of moment-resisting frame and shear wall structural systems. Eng. Struct. 2011, 33, 1107–1116. [Google Scholar] [CrossRef]
  11. Seo, J.; Dueñas-Osorio, L.; Craig, J.I.; Goodno, B.J. Metamodel-based regional vulnerability estimate of irregular steel moment-frame structures subjected to earthquake events. Eng. Struct. 2012, 45, 585–597. [Google Scholar] [CrossRef]
  12. Porter, K.; Kennedy, R.; Bachman, R. Creating fragility functions for performance-based earthquake engineering. Earthq. Spectra 2007, 23, 471–489. [Google Scholar] [CrossRef]
  13. Vamvatsikos, D.; Cornell, C.A. Incremental dynamic analysis. Earthq. Eng. Struct. Dyn. 2007, 31, 491–514. [Google Scholar] [CrossRef]
  14. Liel, A.B.; Haselton, C.B.; Deierlein, G.G.; Baker, J.W. Incorporating modeling uncertainties in the assessment of seismic collapse risk of buildings. Struct. Saf. 2009, 31, 197–211. [Google Scholar] [CrossRef]
  15. Livingstone, G.S. Dynamic Response of Tall Concrete Structures to Earthquake. Ph.D. Thesis, University of Illinois, Chicago, IL, USA, 1993. [Google Scholar]
  16. Uniform Building Code. Available online: http://metal-lite.net/PDF/Code/PDF_Uniform_Building_Code.pdf (accessed on 5 September 2014).
  17. CSI Reference Manual for SAP2000, Computers and Structures, Inc.: Berkeley, CA, USA, 2009.
  18. Ji, J.; Elashai, A.S.; Kuchma, D.A. An analytical framework for seismic fragility analysis of RC high-rise buildings. Eng. Struct. 2007, 29, 3197–3209. [Google Scholar] [CrossRef]
  19. American Society of Civil Engineers. Minimum Design Loads for Buildings and Other Structures (ASCE 7-10); American Society of Civil Engineers: Reston, VA, USA, 2010. [Google Scholar]
  20. An Alternative Procedure for Seismic Analysis and Design of Tall Buildings Located in the Los Angeles Region. Available online: http://www.tallbuildings.org/PDFFiles/2014-LATBSDC-CRITERIA.pdf (accessed on 14 January 2015).
  21. Federal Emergency Management Agency. FEMA 356: Prestandard and Commentary for the Seismic Rehabilitation of Buildings; Federal Emergency Management Agency: Washington, DC, USA, 2000.
  22. Taranath, B.S. Reinforced Concrete Design of Tall Buildings; CRC Press: Boca Raton, FL, USA, 2010. [Google Scholar]
  23. Bolander, J. Investigation of Torsional Effects on Thirteen-story Reinforced Concrete Frame-wall Structure Modeled in ETABS and SAP2000 Using Linear and Nonlinear Static and Dynamic Analysis. Master’s Thesis, University of California, San Diego, CA, USA, 2014. [Google Scholar]
  24. Calugaru, V. Earthquake Resilient Tall Reinforced Concrete Buildings at Near Fault Sites Using Base Isolation and Rocking Core Walls. Ph.D. Thesis, University of California Berkeley, Berkeley, CA, USA, 2014. [Google Scholar]
  25. Liao, W.I.; Loh, C.H.; Wan, S. Earthquake responses of RC moment frames subjected to near-fault ground motions. Struct. Des. Tall Build. 2001, 10, 219–229. [Google Scholar] [CrossRef]
  26. Leon, O.D. Seismic Vulnerability Assessment of a High Rise Reinforced Concrete Buildings in the Mid-America Region. Master’s Thesis, Southern Methodist University, Dallas, TX, USA, 2010. [Google Scholar]
  27. Bai, J.B. Seismic Fragility Analysis and Loss Estimation for Concrete Structures. Ph.D. Thesis, Texas A&M University, College Station, TX, USA, 2010. [Google Scholar]
  28. Jehel, P.; Léger, P.; Ibrahimbegovic, A. Initial versus tangent stiffness-based Rayleigh damping in inelastic time history seismic analyses. Earthq. Eng. Struct. Dyn. 2014, 43, 467–484. [Google Scholar] [CrossRef]
  29. Jehel, P. A critical look into Rayleigh damping forces for seismic performance assessment of inelastic structures. Eng. Struct. 2014, 78, 28–40. [Google Scholar] [CrossRef]
  30. Jehel, P.; Léger, P.; Ibrahimbegovic, A. Structural seismic fragility analysis of RC frame with a new family of Rayleigh damping models. In Computational Methods Stochastic Dynamics; Springer: Amsterdam, Netherlands, 2013; pp. 267–291. [Google Scholar]
  31. Naeim, F. The Seismic Design Handbook; Springer: New York, NY, USA, 2001. [Google Scholar]
  32. PEER Ground Motion Database. Next Generation of Ground-Motion Attenuation Database. Available online: http://ngawest2.berkeley.edu/ (accessed on 12 November 2014).
  33. Seo, J.; Linzell, D. Use of response surface metamodels to generate system level fragilities for existing curved steel bridges. Eng. Struct. 2013, 52, 642–653. [Google Scholar] [CrossRef]
  34. Seo, J.; Linzell, D. Nonlinear seismic response and parametric examination of horizontally curved steel bridges using 3D computational models. J. Bridge Eng. 2013, 18, 220–231. [Google Scholar] [CrossRef]
  35. Seo, J.; Linzell, D. Horizontally curved steel bridge seismic vulnerability assessment. Eng. Struct. 2012, 34, 21–32. [Google Scholar] [CrossRef]
  36. Quilligan, A.O.; Connor, A.; Pakrashi, V. Fragility analysis of steel and concrete wind turbine towers. Eng. Struct. 2012, 36, 270–282. [Google Scholar] [CrossRef]
  37. Ellingwood, B.R. Earthquake risk assessment of building structures. Reliab. Eng. Syst. Saf. 2001, 74, 251–262. [Google Scholar] [CrossRef]
  38. Advanced Engineering Building Module Technical and User’s Manual. Available online: http://www.fema.gov/media-library-data/20130726-1716-25045-9101/aebm_user_manual.pdf (accessed on 10 October 2015).
  39. Seo, J.; Kim, Y.; Zandyavari, S. Response surface Metamodel-based performance reliability for reinforced concrete beams Strengthened with FRP Sheets. American Concrete Institute: Farmington Hills, MI, USA, 2015; unpublished work. [Google Scholar]
  40. Choi, E. Seismic Analysis and Retrofit of Mid-America Bridges. Ph.D. Thesis, Georgia Institute of Technology, Atlanta, GA, USA, 2002. [Google Scholar]

