1. Introduction
The current accelerated urbanization process in Europe has been accompanied by a number of environmental and social problems arising from consumption patterns and lifestyle, such as greenhouse gas emissions, waste and wastewater and environmental noise. These problems have significant impacts on the environment, public health and people’s quality of life. Noise pollution is a current public health problem associated with modern life and urbanization. This urban problem continues to increase in extent, frequency and severity as a result of urbanization, population growth and technological development.
Although the concept of sustainability has been in existence and use for nearly 30 years, even today it is still easier to define the concept than to apply it in practice.
Environmental noise can be regarded as one of the agents of deterioration in people’s quality of life in an urban environment [
1]. In Europe, noise achieves a significant level and is considered an environmental problem of major proportions and great impact. Accordingly, the European Noise Directive was established in 2002. The European Network on Noise and Health (ENNAH) is a Network funded by the European Union that gathers expert groups on noise and health in Europe. The network brings together some 33 European research centers located in 16 countries to support public policies to cope with noise and health, specifically, traffic noise [
2]. The World Health Organization (WHO) estimates that Disability-Adjusted Life Years (DALYs) lost due to environmental noise are “6000 years for ischemic heart disease, 45,000 years for cognitive impairment of children, 903,000 years for sleep disturbance, 21,000 years for tinnitus and 587,000 years for annoyance” [
3]. In addition, noise exposure is increasing in Europe.
Scientific evidence has proved that noise affects human health. On the other hand, it can be observed that large multinational organizations are increasingly concerned about this type of urban pollution. On the other hand, attention given to this topic focuses particularly on sources such as urban traffic, occupational exposure and wind turbines. Yet, little or no attention has been given to low-frequency noise originating from power poles.
After considering the literature review, it can be stated that, in general, the effects of low-frequency noise are not as well researched as other noise sources. Some authorities, such as the WHO, recognize the importance of environmental noise [
3]. Nevertheless, the assessments adopted for low-frequency components and their effects on human health have received less focus than those of high frequencies in the academic literature, even though low frequencies are considered more annoying for humans [
4,
5,
6,
7,
8]. Moreover, the United Kingdom has been progressing towards tackling the issues surrounding Low-Frequency Noise (LFN).
Noise and its impacts on health must be considered as quality of life indicators in sustainable cities. Studies on low-frequency noise emitted by power poles and its influence on human health are scarce, even if noise exposure has harmful effects and is a risk factor for human health. In Portugal, studies concerning low-frequency noise have focused on sources such as traffic, wind turbines and occupational exposure, specifically research carried out by the Center for Human Performance, Alverca/Portugal, on vibroacoustic disease [
9,
10]. This research is motivated by the absence of studies regarding low-frequency sources, such as power poles and their effects on human health. This leads us to pose the following questions: (1) Do power poles and power lines cause noise? (2) Do power poles and power lines cause discomfort? (3) Do power poles and power lines cause discomfort due to noise? (4) Do power poles and power lines cause an impact on human health?
The main objective of this paper is to analyze the exposure of the population to low-frequency noise from power poles in residential areas, especially in the village of Serzedelo (Municipality of Guimarães, northwestern Portugal), and its impacts on human health.
To accomplish this objective, two groups were considered: the “near the source” (e.g., distance to 400 kV power poles less than 50 m) group and the “away from the source” (e.g., distance to 400 kV power poles more than 250 m) group. In the second approach, a more in-depth analysis was carried out. which consisted of taking measurements for 72 h. All the measurement values were compared with the values of the criterion curve proposed by the Department of Environment, Food and Rural Affairs [
11] to evaluate whether the measured values cause annoying conditions.
This study followed the sequence of an exploratory one, using surveys undertaken in 2010 in the village of Serzedelo using the same two groups: the “near the source” group (118 individuals were interviewed) and the “away from the source” group (55 individuals were interviewed) [
12]. Although this study did not focus on the influence of low-frequency noise pollution, respondents only in the “near the source” group stated that they experienced discomfort from the noise.
This paper is organized as follows:
Section 2 presents a literature review of low-frequency noise and human well-being; the material and methods are discussed in
Section 3; the results and analysis are presented in
Section 4; in
Section 5, the evaluation of the perception of noise discomfort is presented. Finally,
Section 6 presents the discussion and conclusions are drawn in
Section 7.
2. Low-Frequency Noise and Human Well-Being
After the 1970s, several studies began highlighting the discomfort caused by environmental noise [
3,
8], especially traffic noise [
1,
13,
14,
15]. The most cited effects on human health refer to emotional changes, namely agitation, distraction, disappointment, stress, hypertension [
7,
16,
17,
18] and the association of low-frequency noise with cognitive impairments [
19], the development of cardiovascular diseases [
20,
21], disturbances in sleep and heart rate [
22,
23,
24] and hypertension [
25,
26].
In the field of occupational medicine, several studies claim that low-frequency noise is an agent that interferes with the performance of work tasks [
25,
27,
28,
29] and that low-frequency noise can affect mental and physical health.
Exposure to noise has harmful effects and constitutes a risk factor for human health. Some authors have treated these effects under the name as vibroacoustic disease [
10], vibroacoustic pathology or vibronoise pathology [
30],
i.e., systemic pathology encompassing the entire body, characterized by abnormal proliferation of extracellular matrices caused by excessive and prolonged exposure to low-frequency noise (LFN) [
10,
31].
In Portugal, the first study of low-frequency noise dates back to 1979. The study focused on Portuguese Air Force health workers in the General Aeronautical Material Workshops (GAMW) (
Table 1) [
9,
10]. The study led to a definition of three clinical stages of vibroacoustic disease: Stage I—Mild (1–4 years), characterized by slight mood swings, indigestion and heartburn, oropharyngeal infections and bronchitis; Stage II—Moderate (4–10 years), characterized by chest pain, mood swings, back pain, fatigue, skin infections, inflammation of the gastric surface, pain and blood during urination, conjunctivitis and allergic processes; and Stage III—Severe (>10 years) characterized by psychiatric disorders, hemorrhages of nasal, digestive and conjunctive mucosa, varicose veins and hemorrhoids, duodenal ulcers, spastic colitis, decreased visual acuity, headaches, severe joint pain, intense muscular pain and neurological disturbances [
9].
Table 1.
Low-frequency noise and its effects on human health from different sources.
Table 1.
Low-frequency noise and its effects on human health from different sources.
| Authors | Object | Year | Main Results | Sample |
|---|
| Donald Laird (Psychological Laboratory, Colgate University) | Physiological effects of noise on typists | 1928 | Increase in energy expenditure when subjected to noisy environments, when the noise is smoothed on site the average increase in calorie spending is lower. | 4 experienced typists. |
| E. Dart (Ford Occupational Physician—Detroit, USA) | Description of symptoms observed in aircraft technicians. | 1946 | Report of pain in the hands, swelling, tenosynovitis and increased vascular tone. | 112 aircraft technicians. |
| G. I. Rumancev | Description of the symptoms of a group of workers in a concrete factory in the Soviet Union exposed to noise. | 1961 | Report of pain in the hands, swelling, tenosynovitis and increased vascular tone. | * |
| Alexander Cohen (National Institute for Occupational Safety and Health, USA) | Description of clinical complaints of boiler plant workers before and after the implementation of a hearing protection programme. | 1976 | Report of pain in the hands, swelling, tenosynovitis and increased vascular tone. | 400 boiler plant workers. |
| Yiming Zhao et al. (Research Center of Clinical Epidemiology; Research Center of Occupational Medicine, Beijing—China) | Description of the effects of industrial noise on the prevalence of hypertension in a group of 1101 female workers in a textile mill in Beijing, in 1985. | 1991 | Report that noise is a significant determinant of the prevalence of hypertension. | 1101 female workers. |
| N. V. Grechkovskaia and I. A. Parpalei | Mention the vibronoise pathology in workers of the aircraft industry in Kiev, Ukraine. | 1997 | Report of disturbances such as psychovegetative syndrome, vegetative-vascular-trophic syndrome, cerebral anguidystonic syndrome as initial disturbances of vibronoise pathology. | 103 assemblers-fitters |
V. D. Balunov,
A. F. Barsukov,
V. G. Artamonova | Research involving the evaluation of the health condition of building industry workers engaged into ferro-concrete production in Saint Petersburg, Russia, submitted to infrasound, noise and general vibration. | 1998 | The health status was considered under the combined action of infrasound, noise and vibration generally presented greater morbidity for this group. | 62 molders |
| Nuno A. A. Castelo Branco (Center of Human Performance, Alverca, Portugal) | Research report initiated in 1979 about the systemic changes caused by the continuous exposure to noise in the General Aeronautical Material Workshops in Portugal. | 1999 | Prolonged exposure to low-frequency sounds, below 500 Hz, presented clinical concern, especially with the high incidence of cases of sudden epilepsy and fury. 20 years of research have led to the definition of a new disease: vibroacoustic disease. | Data collected for 20 years |
| Kerstin Persson Waye (Department of Environmental Medicine, Göteborg University, Sweden) | Description the effect of ventilation noise was further examined along with traffic noise, in two laboratory studies. | 2003 | This study showed that the exposure to low-frequency noise, especially at night, may affect the cortisol response, i.e., lower cortisol levels after awakening were associated with subjective reports of mood and sleep quality. | Ventilation noise and comparison with traffic noise: 12 male subjects with an average age of 24.5 years Ventilation noise: 26 male subjects with an average age of 26 years. |
| Malgorzata Pawlaczyk-Luszczynska et al. (Department of Physical Hazards, Nofer Institute of Occupational Medicine—Lodz, Poland) | Research to investigate the annoyance of LFN at workplaces in control rooms and office-like areas. | 2010 | There were no differences in the annoyance assessments between the groups (young and old volunteers—females and males). Both groups similarly assessed annoyance from low-frequency noise. | 55 young volunteers 70 older volunteers |
| Ta-Yuan Chang et al.
(China Medical University—Taiwan, China) | A joint study about occupational noise exposure and incident Hypertension in Men. | 2013 | High incidence of hypertension in prolonged exposure to noise levels ≥85 dBA. | 578 male workers in Taiwan (1998–2008), all subjects were divided into exposure groups (high, intermediate and low). |
Exposure to low-frequency noise (LFN) has significant impacts on human health. This impact is absorbed by auditory sensation, which is a function of the perception that encompasses aspects of physiological, pathological and sociological order. There are caveats in relating certain harmful effects to a single source of noise, but human exposure to multiple sources of noise must be used as a criterion [
3,
6].
The publications on low-frequency noise shown in
Table 1 are case-control studies, using large samples and developed by interdisciplinary researchers. In general, they focus on occupational exposure. These studies concluded that the clinical picture is similar in what concerns noise exposure: swelling tenosynovitis, hand pain and hypertension.
Despite all the research on the effects of low-frequency noise and its impact on human health conducted for more than a century, there are still no references to LFN from the electromagnetic field of power poles and power lines.
Electric, magnetic and electromagnetic fields are physical agents associated with the use of electricity for the transmission and transport of energy (low frequency, 60 Hz). These fields interact with living beings in general and the human body in particular, causing harmful effects by inducing electric currents that exceed the skin shield, damaging sensitive cells and organs [
3,
32]. For this research, we used the criterion for low-frequency noise levels below 200 Hz.
Some studies show that low-frequency noise differs from other environmental noises at comparable levels. Much of the urban noise pollution we are exposed to in our daily environment contains significant energy within this range. Low-frequency noise is very common as background noise in urban environments. The effects of LFN are of particular concern because of their pervasiveness due to numerous sources, efficient propagation and the reduced efficacy of many structures (e.g., walls, houses and hearing protection). For instance, low-frequency noise is a common cause of sleep disturbances, psychological distress, cognitive impairment, increased social conflict, anxiety, emotional instability and nervousness.
3. Experimental Section
In this section, we briefly describe environmental noise measurements and procedures, as well as meteorological data collection.
3.1. Study Area
Guimarães is located in the Ave sub-region of the Braga district in northwestern Portugal. According to the 2011 Census of the National Institute of Statistics, the municipality’s population totaled 158,124 inhabitants. Guimarães has a population of 54,097 inhabitants distributed among 20 villages and the population density is 2224 inhabitants/km
2 [
33].
The Guimarães municipality is crossed by four lines of 400 kV and nine lines of 150 kV. The village of Serzedelo, located southwest of Guimarães city, has a population of 3680 inhabitants, covers an area of 5.14 km
2 and has a high density of power poles and power lines in its territory. In addition to these facts, there is an electrical substation in Serzedelo with a transformer capacity of 2 × 360 MVA—Riba de Ave Substation [
33] (
Figure 1).
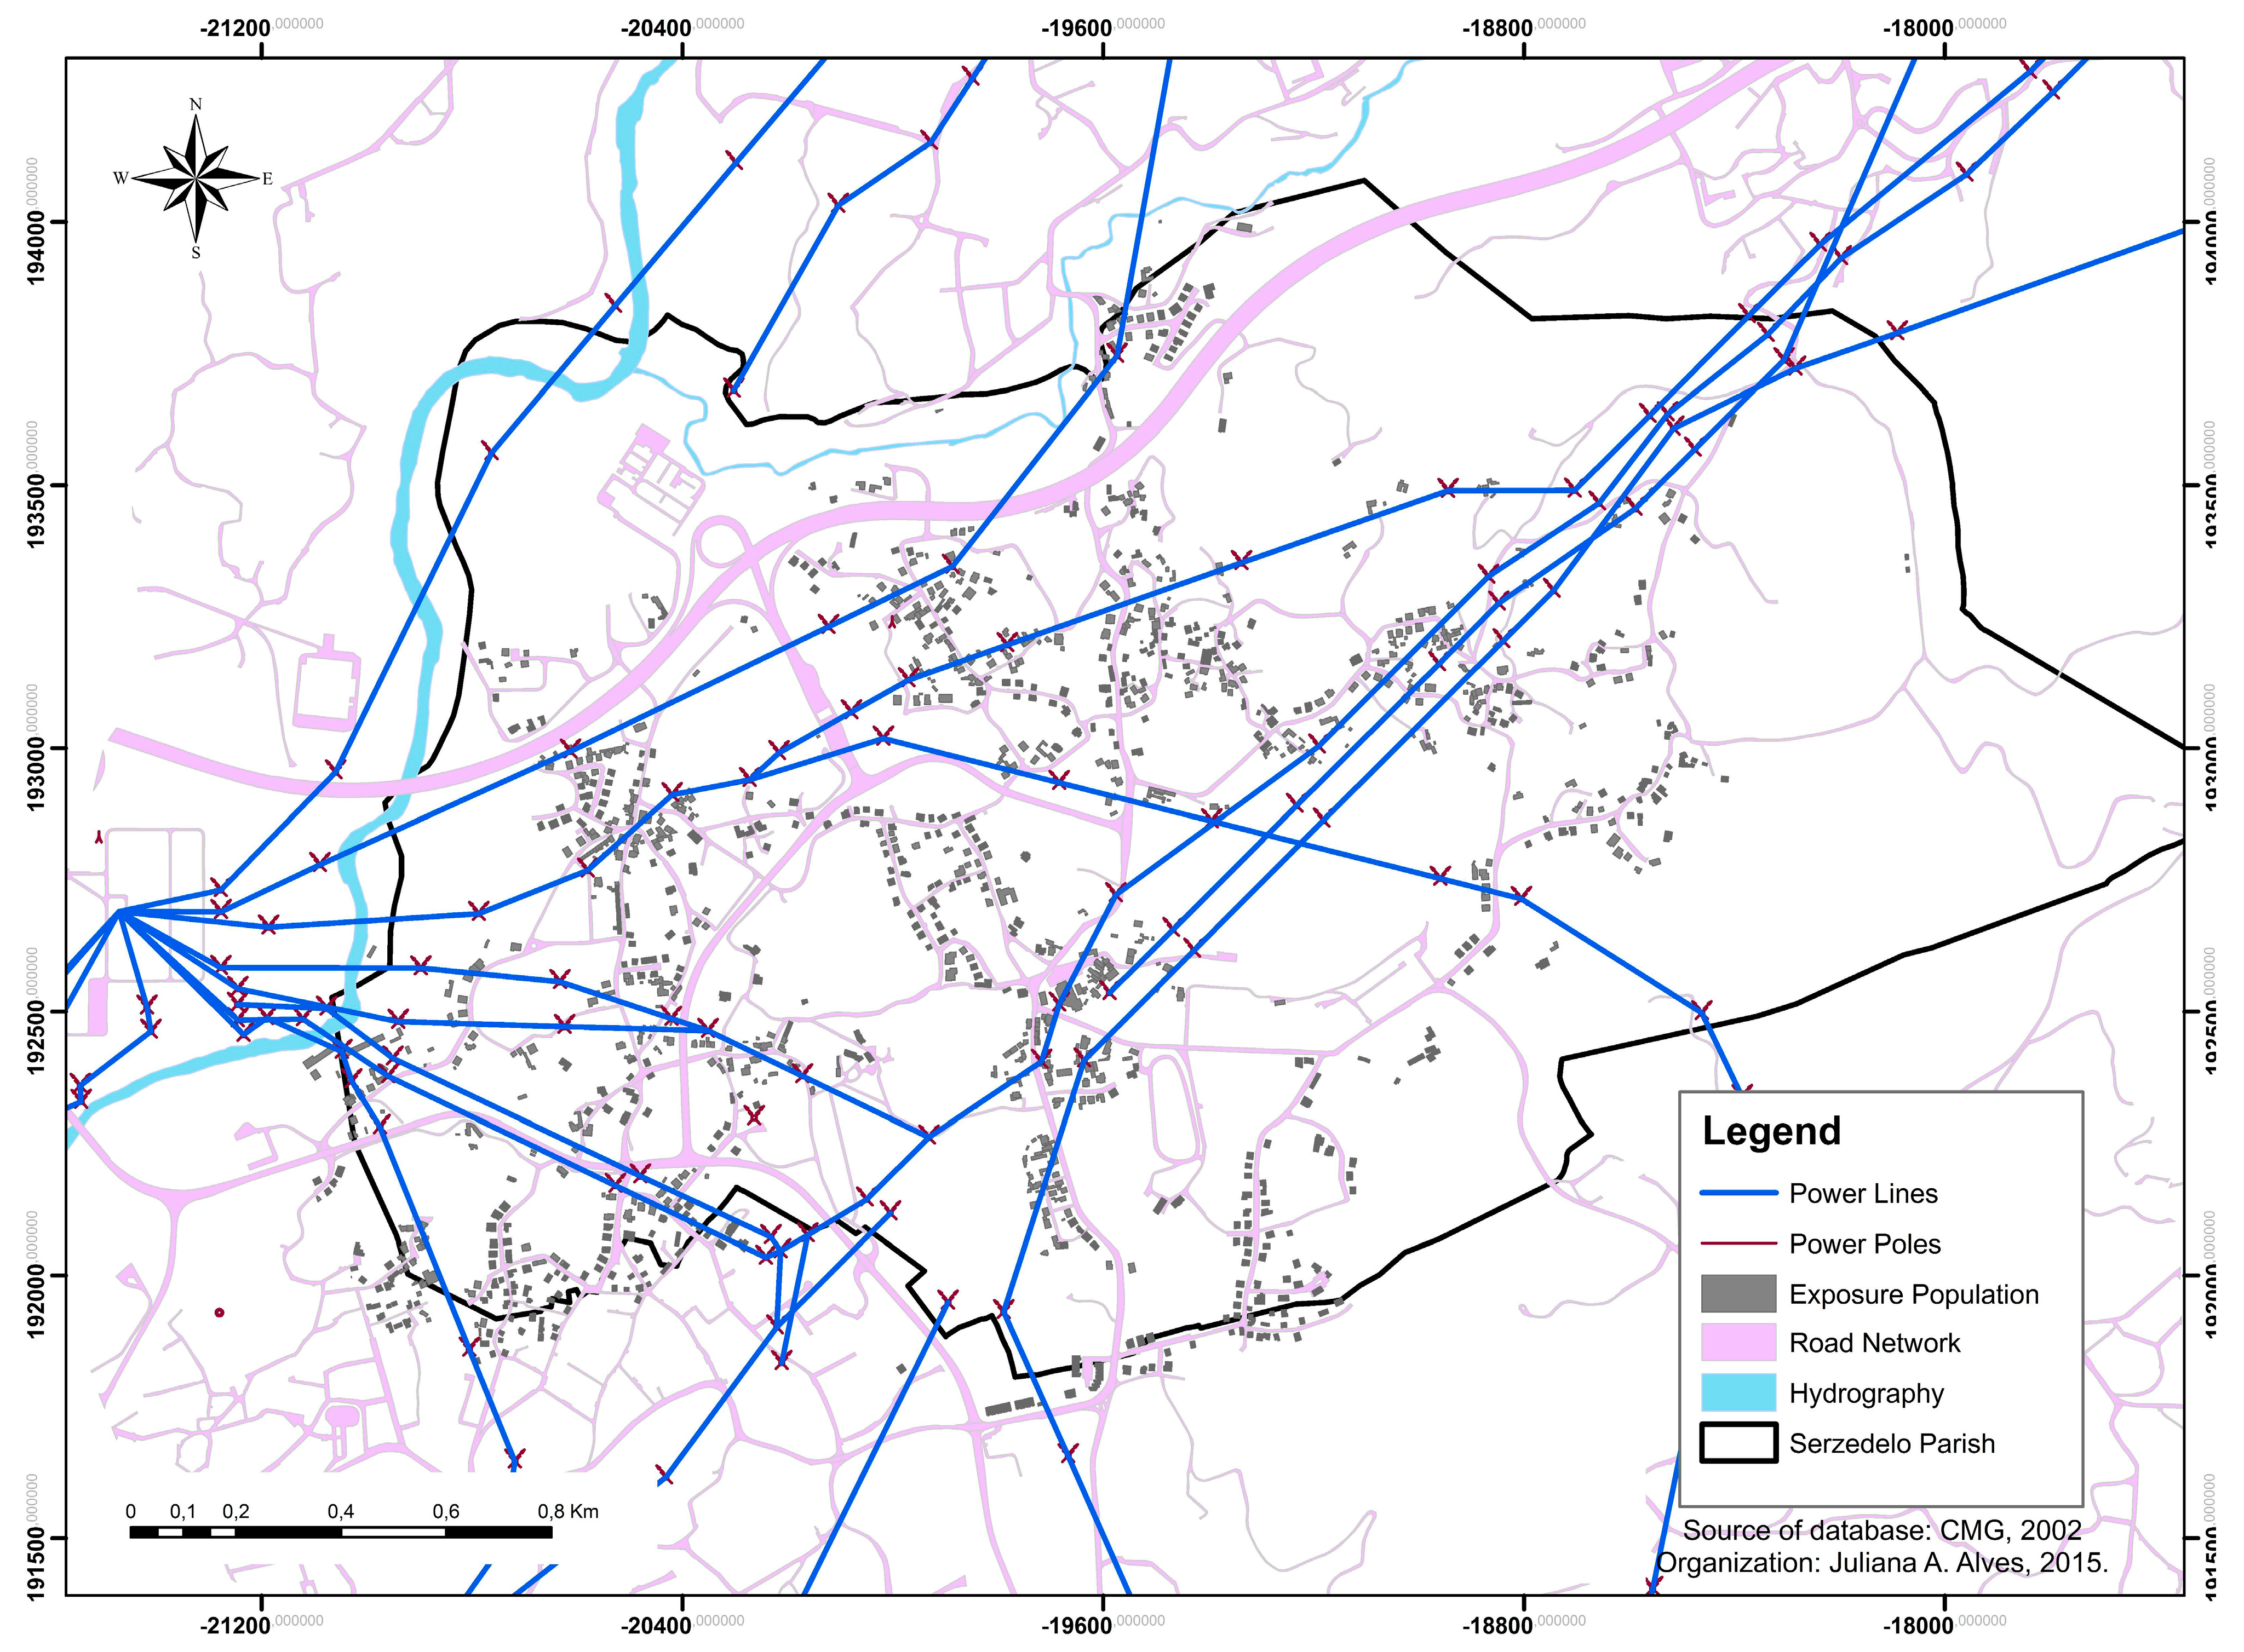
Figure 1.
Study area—village of Serzedelo.
Figure 1.
Study area—village of Serzedelo.
The village of Serzedelo has power poles less than five meters away from houses, which does not meet the recommendations of related legislation in force in Portugal (
Figure 2). Ninety power poles and 12 power lines cover an area of little more than five km
2, which means 80% of the village is exposed to high and very high voltage.
Figure 2.
Power poles and power lines in the village of Serzedelo.
Figure 2.
Power poles and power lines in the village of Serzedelo.
3.2. Assessment Framework
The methodology used was based on a procedure developed by the Department of Environment, Food and Rural Affairs (DEFRA), Acoustics Research Center, University of Salford—Procedure for the assessment of low-frequency noise complaints [
12].
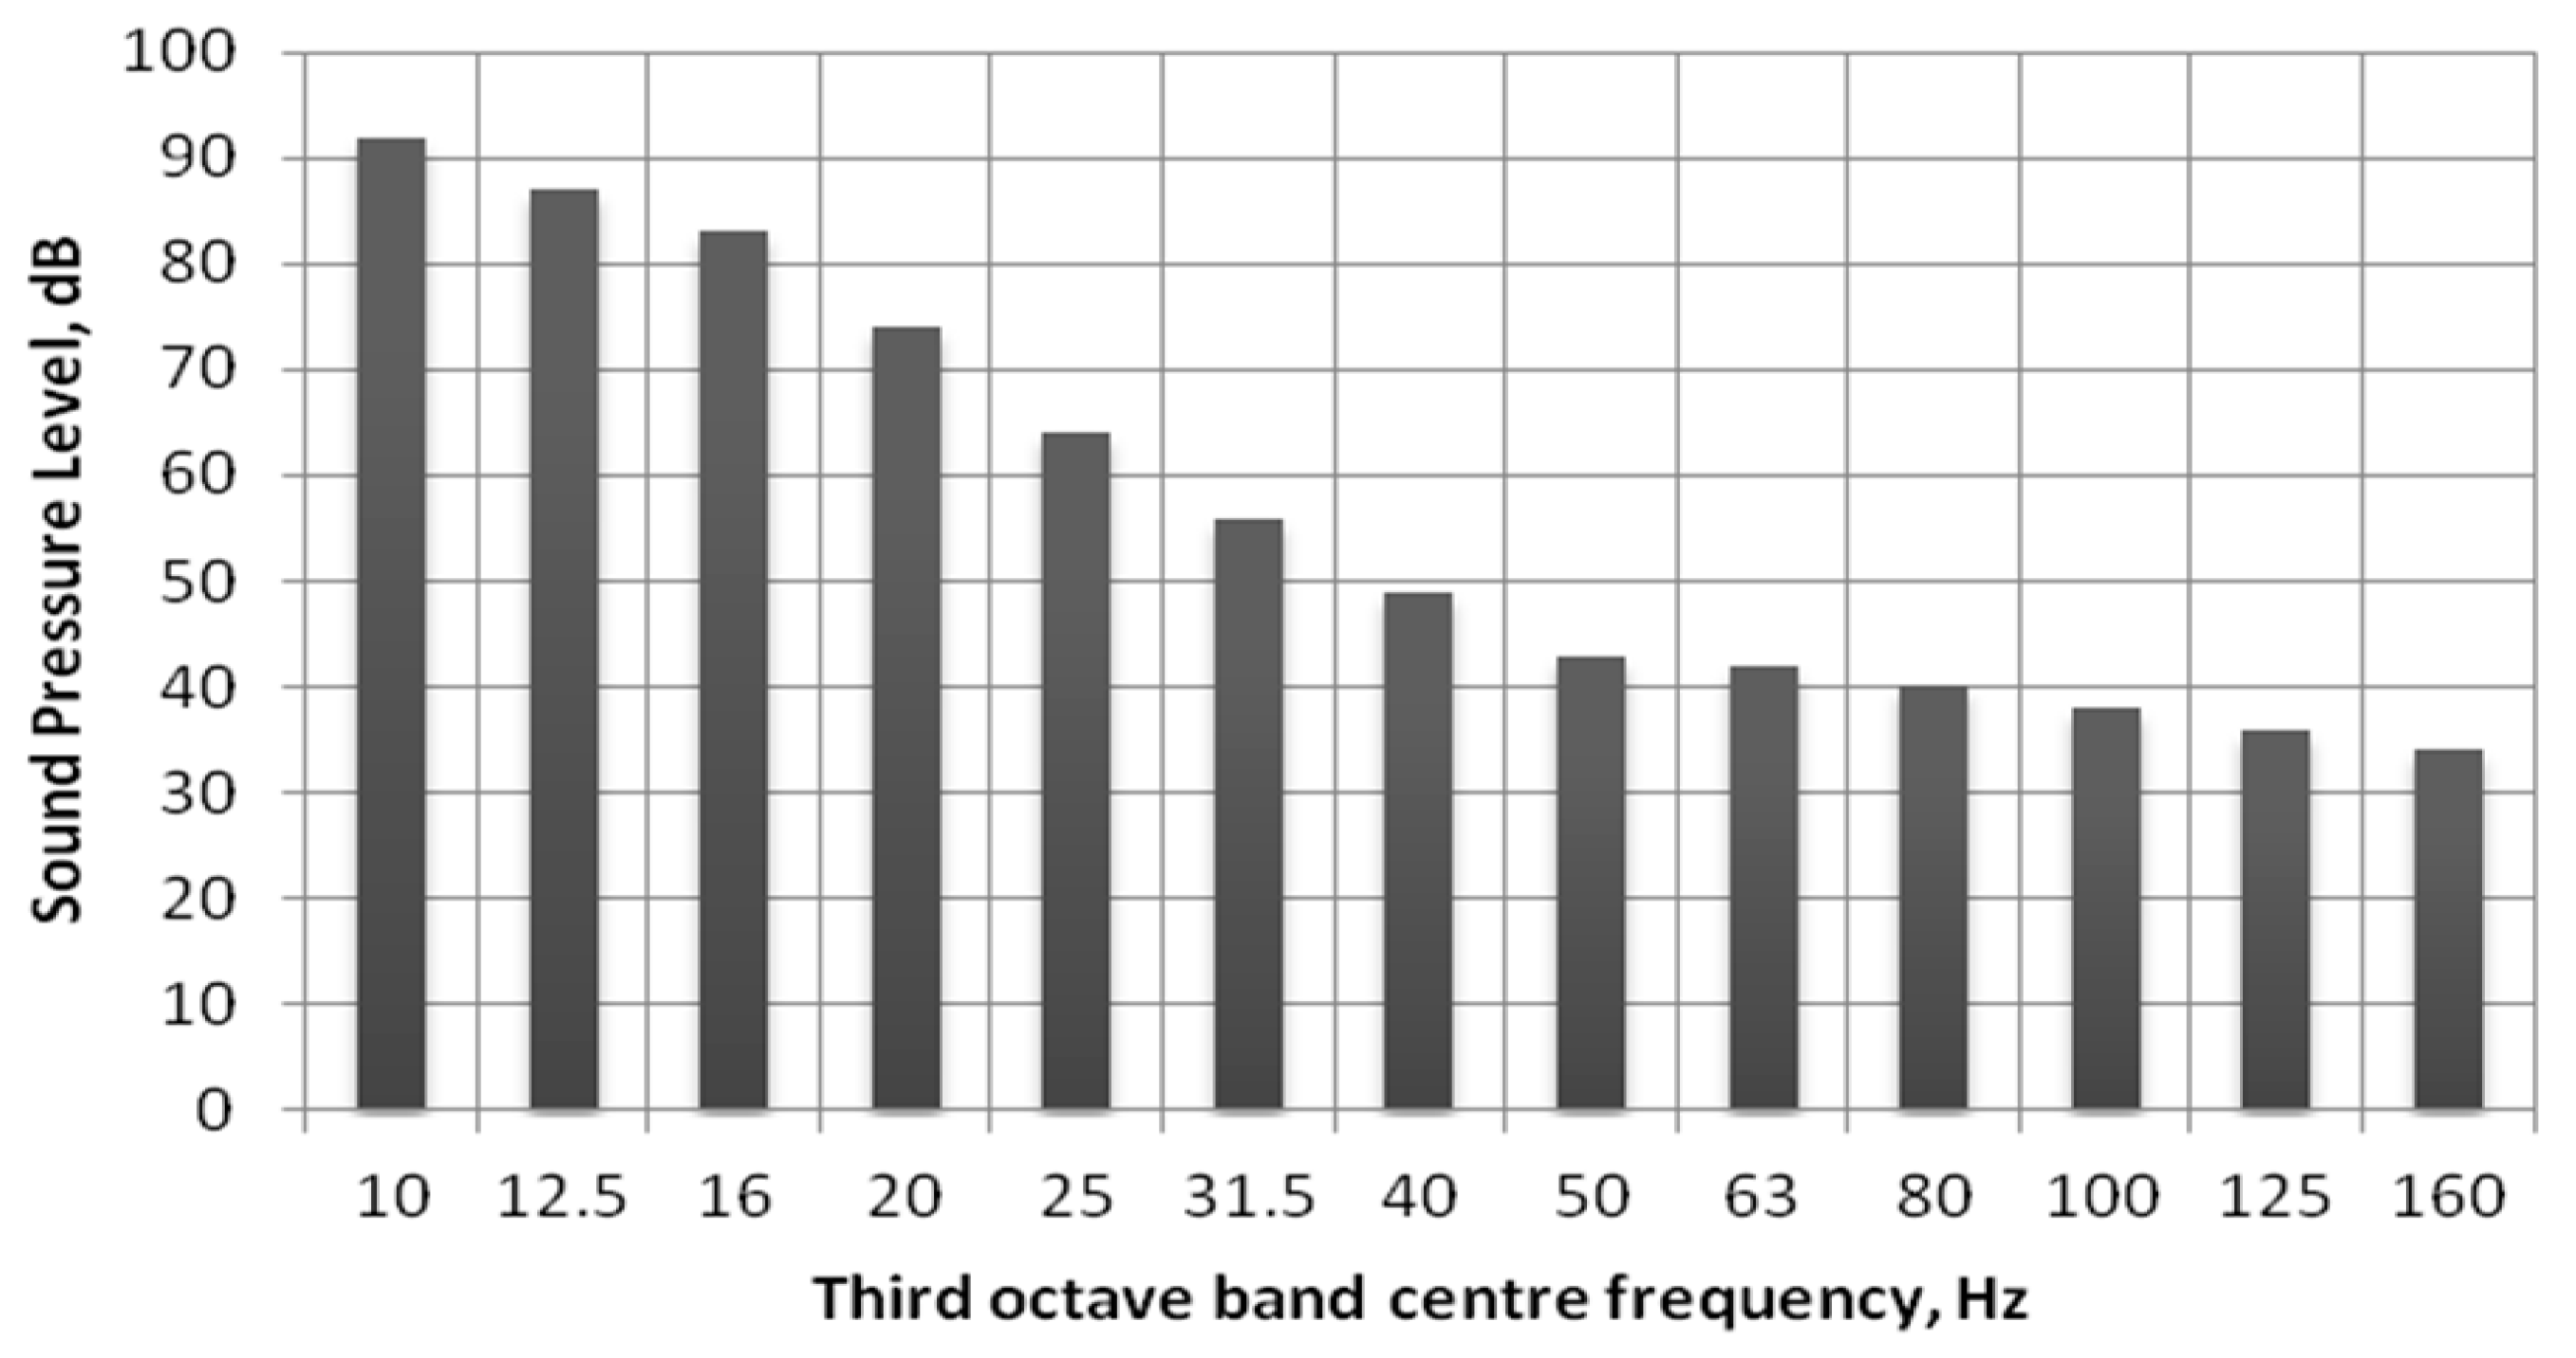
The noise assessments were made using a class 1 sound level meter with a 1/3-octave filter, the noise indicator recorded was Leq in a range of 10–160 Hz and for an average time of five minutes. The noise levels of the field measurements were compared with the criteria curve (
Figure 3). The L10 and L90 were recorded in the same bands to achieve fluctuating characteristics. In the first approach, the noise measurements were taken for 20 min periods, and in the second approach the measurement time was 72 h periods. To evaluate whether an environmental sound could be responsible for the disturbance, the level of recorded sounds was compared with the criterion curve (
Figure 3).
Figure 3.
Criterion curve to assess low-frequency noise (Adapted from [
12]).
Figure 3.
Criterion curve to assess low-frequency noise (Adapted from [
12]).
Regarding fluctuations, according to the DEFRA methodology, when the L10–L90 difference exceeds 4 dB, the sound fluctuates and a penalty should be imposed. The DEFRA suggests that 5 dB relaxation may be applied for steady sounds, rather than introducing a penalty for fluctuating sounds. Furthermore, it states that a fluctuating sound with an average level of 5 dB below the threshold would be audible, whereas a steady sound would not. Since the curve values at low frequency are set 5 dB below the threshold, this is again consistent with allowing relaxation for steady sounds.
Using the DEFRA methodology [
12], outdoor and indoor measurements were carried out in houses and nearby places. Two approaches were adopted for this research. The first was held in 2014, and the second in 2015. Both assessments were made using a class 1 sound level meter with a 1/3-octave filter. The first approach was completed between June and July 2014 and entailed evaluating nine points, which were divided into two groups, considering their location due to the source under study.
The measuring points were selected based on the methodology used by [
11] concerning the exposure to electromagnetic fields in Serzedelo. This included houses near the source (e.g., within 50 m), and houses away from the source (e.g., at a distance equal to or greater than 250 m).
Temperature and relative humidity were measured at an automatic meteorological station located in Merelim, Braga, the nearest meteorological station with available data (about 7 km away). In accordance with DEFRA, we used a sound level meter class 1, with third octave filters from 10 Hz to 160 Hz, a tripod and a field calibrator. The height of the measurements was 1.2 m and was carried out at a distance more than 4 m away from the nearest facade. The following factors were considered to select the measurement points:
- (a)
Distance to 400 kV power poles of less than 250 m from the “near the source” group.
- (b)
Distance to 400 kV power poles of more than 250 m from the “away from the source” group.
- (c)
Avoidance of the influence of other noise sources such as road traffic;
- (d)
Preference for routes with low road traffic, away from highways and with an absence of noise barriers.
The noise measurements taken in the “near the source” group consisted of six points, outside houses located less than 50 m from the source (
Figure 4 and
Table 2). Measurements were taken over three days: 26 June, 3 July and 8 July 2014.
Table 2.
Characteristics of measurement points in the “near the source” group.
Table 2.
Characteristics of measurement points in the “near the source” group.
| Point | Proximity to the Source | Environmental Area |
|---|
| A | 10 m away from a 400 kV voltage power pole | Located near houses and extensive cultivation areas (urban garden). |
| B | 5 m away from a 400 kV voltage power pole | Located on higher ground over houses. During the measurement, the passage of a garbage truck on cobbled ground near the measurement location was recorded. Noise perceived: continuous noise from the power pole. Less intense noise: birds, auto horn and cicada (insect). |
| C | 5 m away from the source | Located near the houses and urban gardens with a high density of 150 kV and 220 kV voltage power poles and power lines. Sounds emitted during the measurement came from a lawnmower, birds, hammering, dogs barking, roosters and sawmill works. |
| D | 3 m away from a high-voltage 400 kV power pole | Located near the houses and comprises an area of the 400 kV power poles corridor. The measurement was carried out near the inter-municipal highway. At this point, there were reports of discomfort from noise on wet, rainy days. In this aspect, residents reported using sleeping pills and experiencing headaches and fatigue. |
| E | 10 m away from the source | Located near the houses and extensive urban gardens. The area had a concentrated, high density of high-voltage power poles and a mobile phone antenna. |
| F | 15 m away from the electrical substation | Located near of the Riba de Ave Substation. The area is located near houses and factories. The closest road, of granite cube, did not record traffic during the measurement period. A microphone shield was used in the sound level meter due to high wind speed. |
The “away from the source” group consisted of three measurement points. This group comprised locations between 200 and 300 m away from the influence of power poles and power lines (
Figure 4 and
Table 3). Measurements were performed over three days: 26 June, 3 July and 8 July 2014.
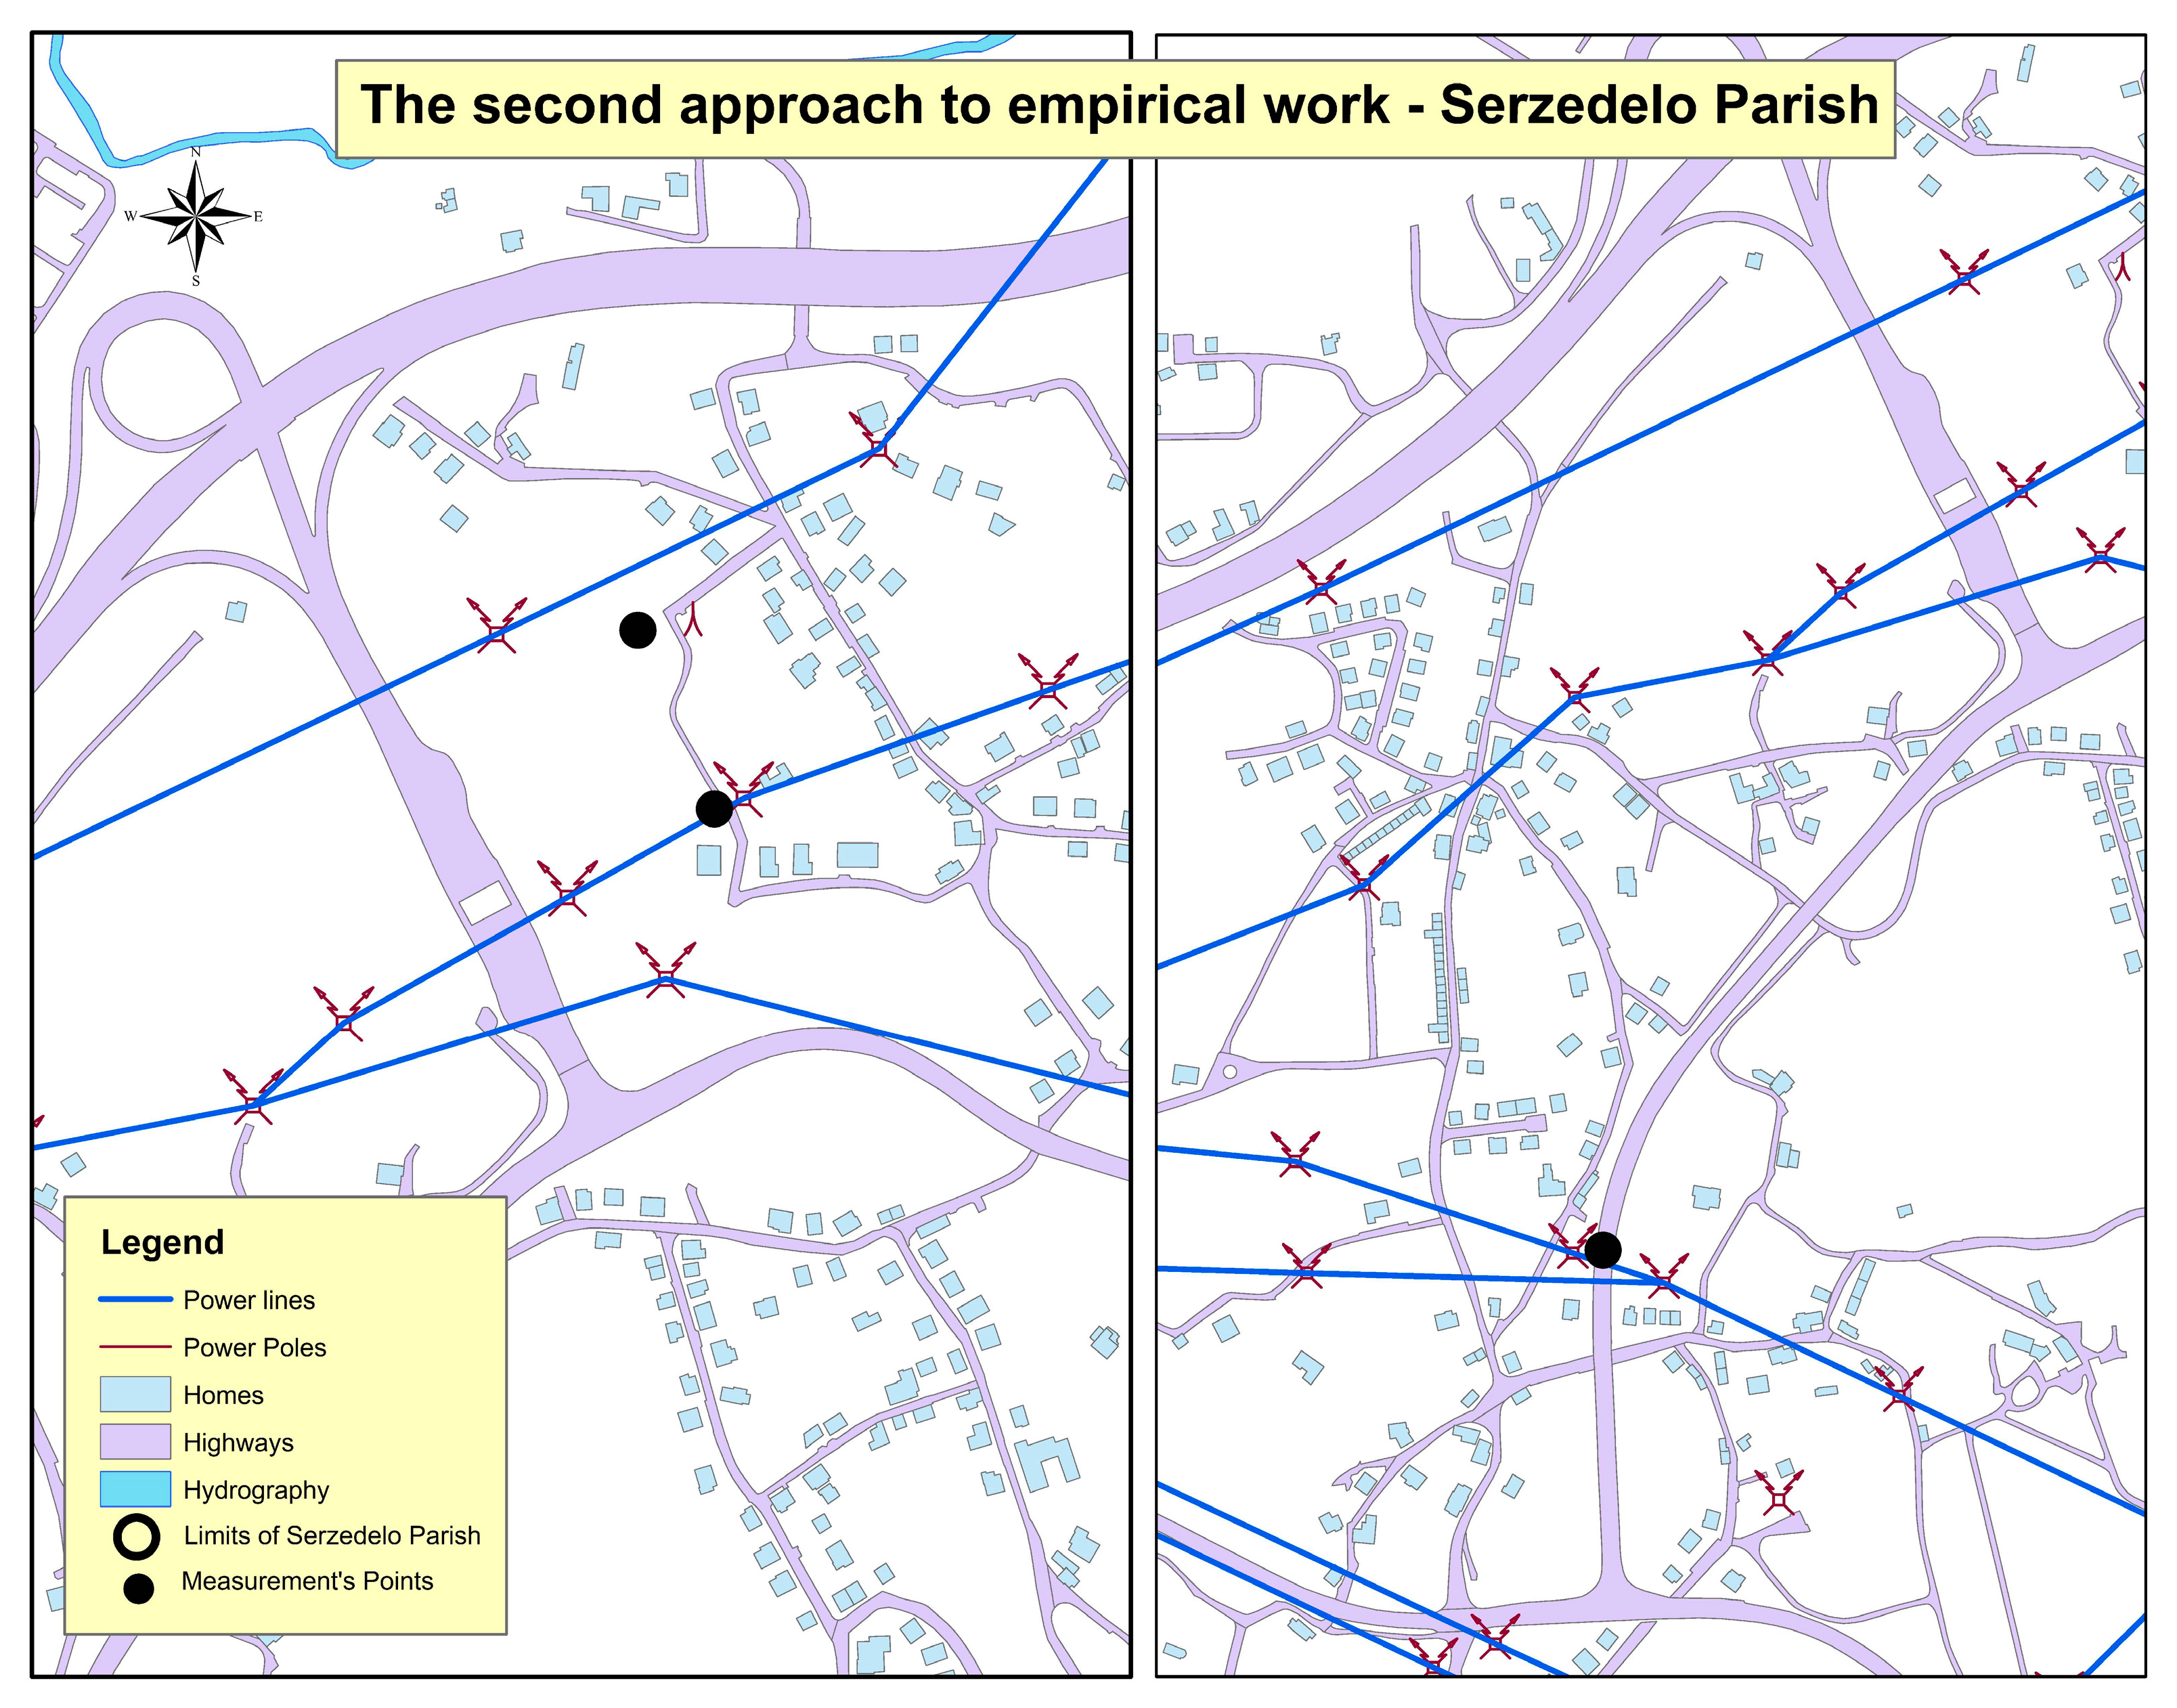
The second approach comprised three measurement points inside three houses located near the source and in a room where annoyance was detected by the house owner. In point L, the appliances were switched off for 20 min. In points J and M, there were no appliances. The three measurements were divided into three blocks, considering the monitoring dates (February and March 2015) (
Figure 5 and
Table 4). Point J was measured between 9–12 February, Point L between 11–14 March and Point M between 14–17 March.
Figure 4.
First approach—village of Serzedelo.
Figure 4.
First approach—village of Serzedelo.
Table 3.
Characteristics of measurement points in the “away from the source” group.
Table 3.
Characteristics of measurement points in the “away from the source” group.
| Point | Proximity to the Source | Environmental Area |
|---|
| G | 250 m away from the influence of power poles and power lines | During the measurement, a group of people was talking near the sound level meter and there were also two light vehicles belonging to local inhabitants |
| H | 250 m away from the source | During the measurement, recording sounds came from light vehicles, a child crying and a group of people talking next to the sound level meter. |
| I | About 400 m away from the source | The measurement was carried out at the side of a granite cube road near some houses. Something to note was the presence of an unidentified background noise. |
For the second approach, three analyses were taken and compared with the criterion curve: (1) complete measurement, i.e., comprising the measurement for 72 h (three days); (2) measurement per day, i.e., the values per day, where differentiated, for each frequency band in the criterion curve; and finally (3) measurement between 02:00–04:00, which characterizes night time, according to the DEFRA Guidance.
To complement this approach, an interview was conducted with the person of contact, who also agreed that the measurements could be taken inside the houses. This interview was standardized and had 30 questions following DEFRA guidelines. The questionnaire was structured in three sections. The first one dealt with personal data (seven questions). The second section focused on health and the quality of sleep (eleven questions) and, finally, the third section was concerned with the characteristics of perceived noise (twelve questions).
Figure 5.
Location of the three measurement points in the second approach.
Figure 5.
Location of the three measurement points in the second approach.
Table 4.
Characteristics of measurement points in the second approach.
Table 4.
Characteristics of measurement points in the second approach.
| Point | Proximity to the Source | Environmental Area | Presence of Obstacles | Reports |
|---|
| J | 5 m away from a 400 kV power pole | Located inside a house, in a garage attached to the residence, where noise from the source was detected. | House faced | Noise discomfort from the power pole and some health problems: depression, headaches and insomnia. |
| L | 15 m away from a 400 kV power pole | Located inside the house in a room closest to the source, where the interviewee felt the presence of low-frequency noise the most. There was a mobile phone antenna nearby. The area was located close to a residential area near the A7 highway. | House faced | Noise discomfort from the power pole, especially on humid and rainy days. Health problems included fatigue, headaches and insomnia. |
| M | 10 m away from a 400 kV power pole | Located in an annex close to the source, where the interviewee most felt the presence of low-frequency noise. | House faced | Noise discomfort and stress. In the village, there were cases of cardiovascular disease and stomach cancer. |
4. Results and Analysis
4.1. The First Approach
The noise measurements taken in the “near the source” group consisted of six points (points A to F). The “away from the source” group consisted of three measurement points (points G to I). Measurements were performed over three days: 26 June, 3 July and 8 July 2014.
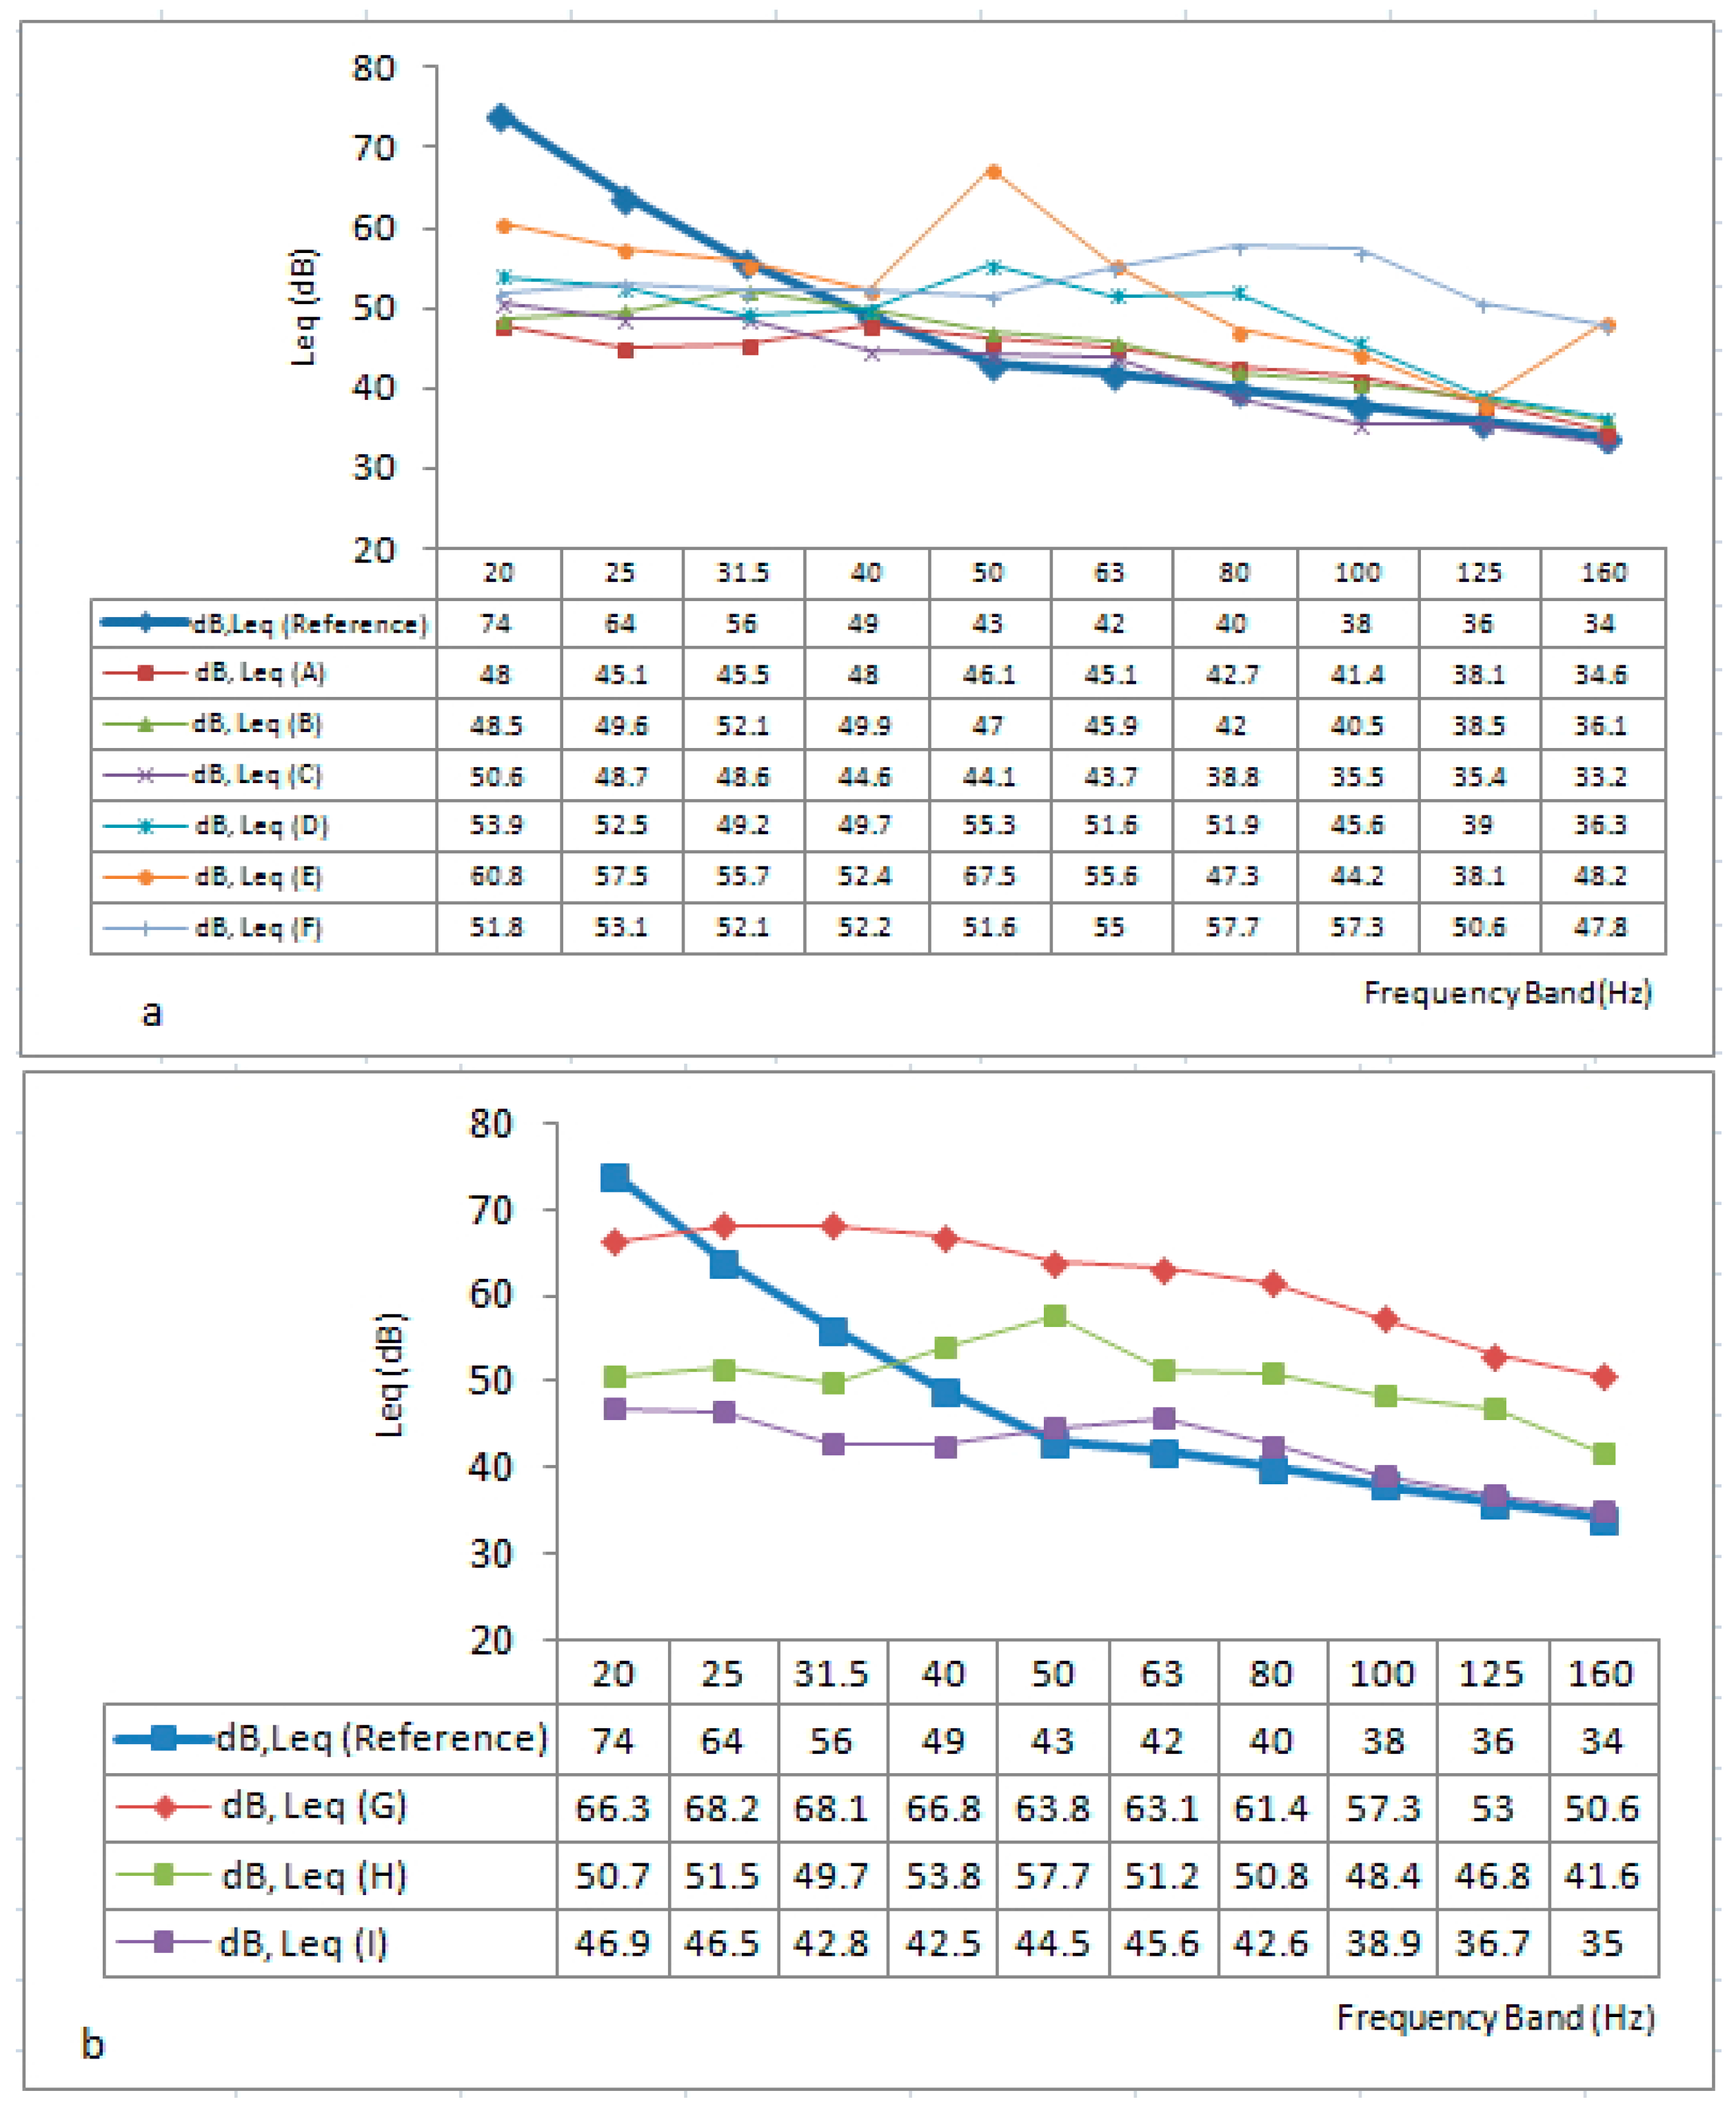
The criterion reference curve was exceeded in all measurement points (dB Leq—Reference), especially between the 50 Hz and 160 Hz frequency bands. According to DEFRA Guidance, the measured levels at these frequencies would be considered audible to most people who are exposed to them. The D, E and F measurement points showed a higher deviation relative to the criterion reference curve (
Figure 6a). Particularly in measurement point F, a higher deviation from the reference value was recorded, which can be explained by its location near the Riba de Ave Substation. No association was found between weather conditions and the noise levels measured (
Table 5).
Figure 6.
First approach—(a) Measurement point A to F (“near the source” group); (b) Measurement point G to I (“away from the source” group).
Figure 6.
First approach—(a) Measurement point A to F (“near the source” group); (b) Measurement point G to I (“away from the source” group).
The criterion reference curve was exceeded in all measurement points (dB Leq—Reference), especially in the G and H measurement points, which presented a higher deviation from the reference value beginning at 25 Hz (for the first) and 40 Hz (for the second). In the I measurement point, the deviation was very low—between 50 Hz and 160 Hz (
Figure 6b). We could not establish a relationship between weather conditions and the measured noise levels (
Table 5).
Both groups exceeded the values in the criterion curve (dB Leq—Reference). There are two possible explanations for these results: (1) The low-frequency noise detected in the “away from the source” group could result from other sources; (2) The need to redefine the limits of the “near the source” and “away from the source” groups, i.e., what is being regarded as “away from the source” could be classified as “near the source”. Given the specific characteristics of low-frequency noise, especially its high capacity for propagation and low absorption by materials and the environment, redefining the limits of the groups could be accounted for.
Table 5.
Weather Conditions, Average [
34].
Table 5.
Weather Conditions, Average [34].
| | Air Temperature (°C) | Rainfall (mm) | Wind Speeds (km/h) | Relative Humidity (%) | Measurement Points |
|---|
| 26 June 2014 | Mean Values | 17 | 0.0 | 1.5 | 77.5 | Point A and F |
| 3 July 2014 | 22.9 | 0.0 | 3.5 | 52.5 | Point B, C and H |
| 8 July 2014 | 28 | 0.0 | 13 | 37 | Point D, E, F and G |
4.2. The Second Approach
The second approach comprised three measurement points inside three houses (points J–M). For the second approach, three analyses were taken and compared with the criterion curve: (1) complete measurement for 72 h (three days); (2) measurement per day; and finally (3) measurement between 02:00–04:00, which characterizes night time, according to the DEFRA Guidance.
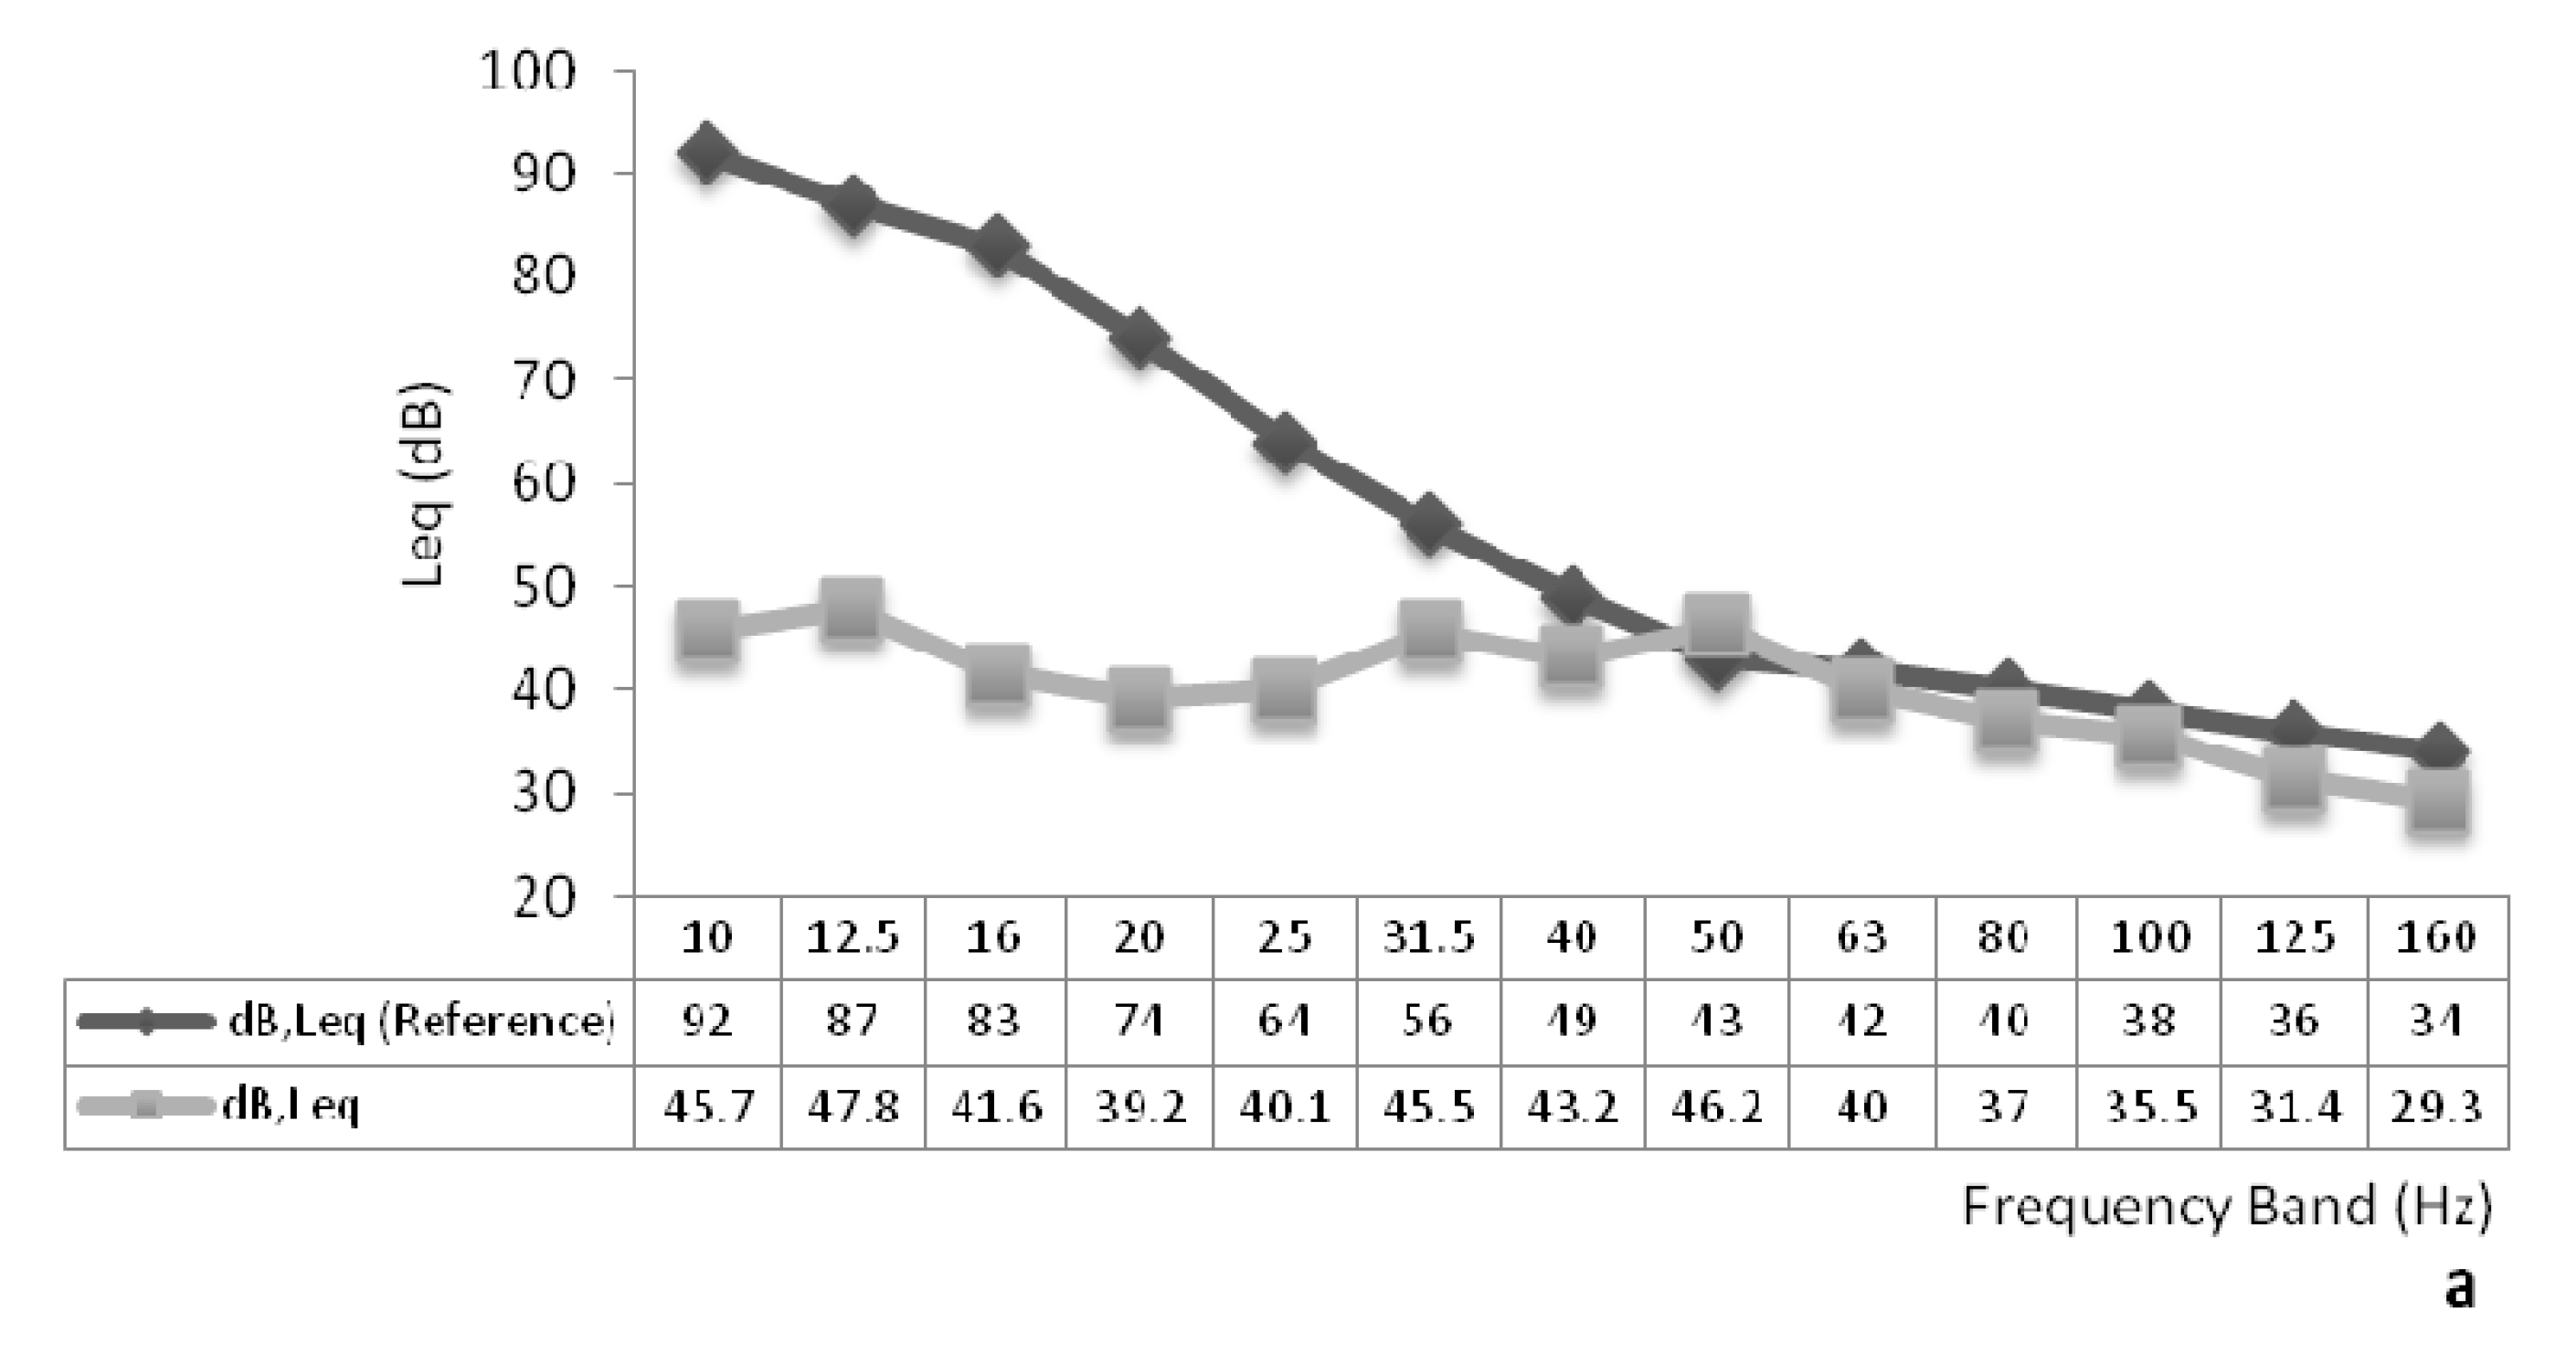
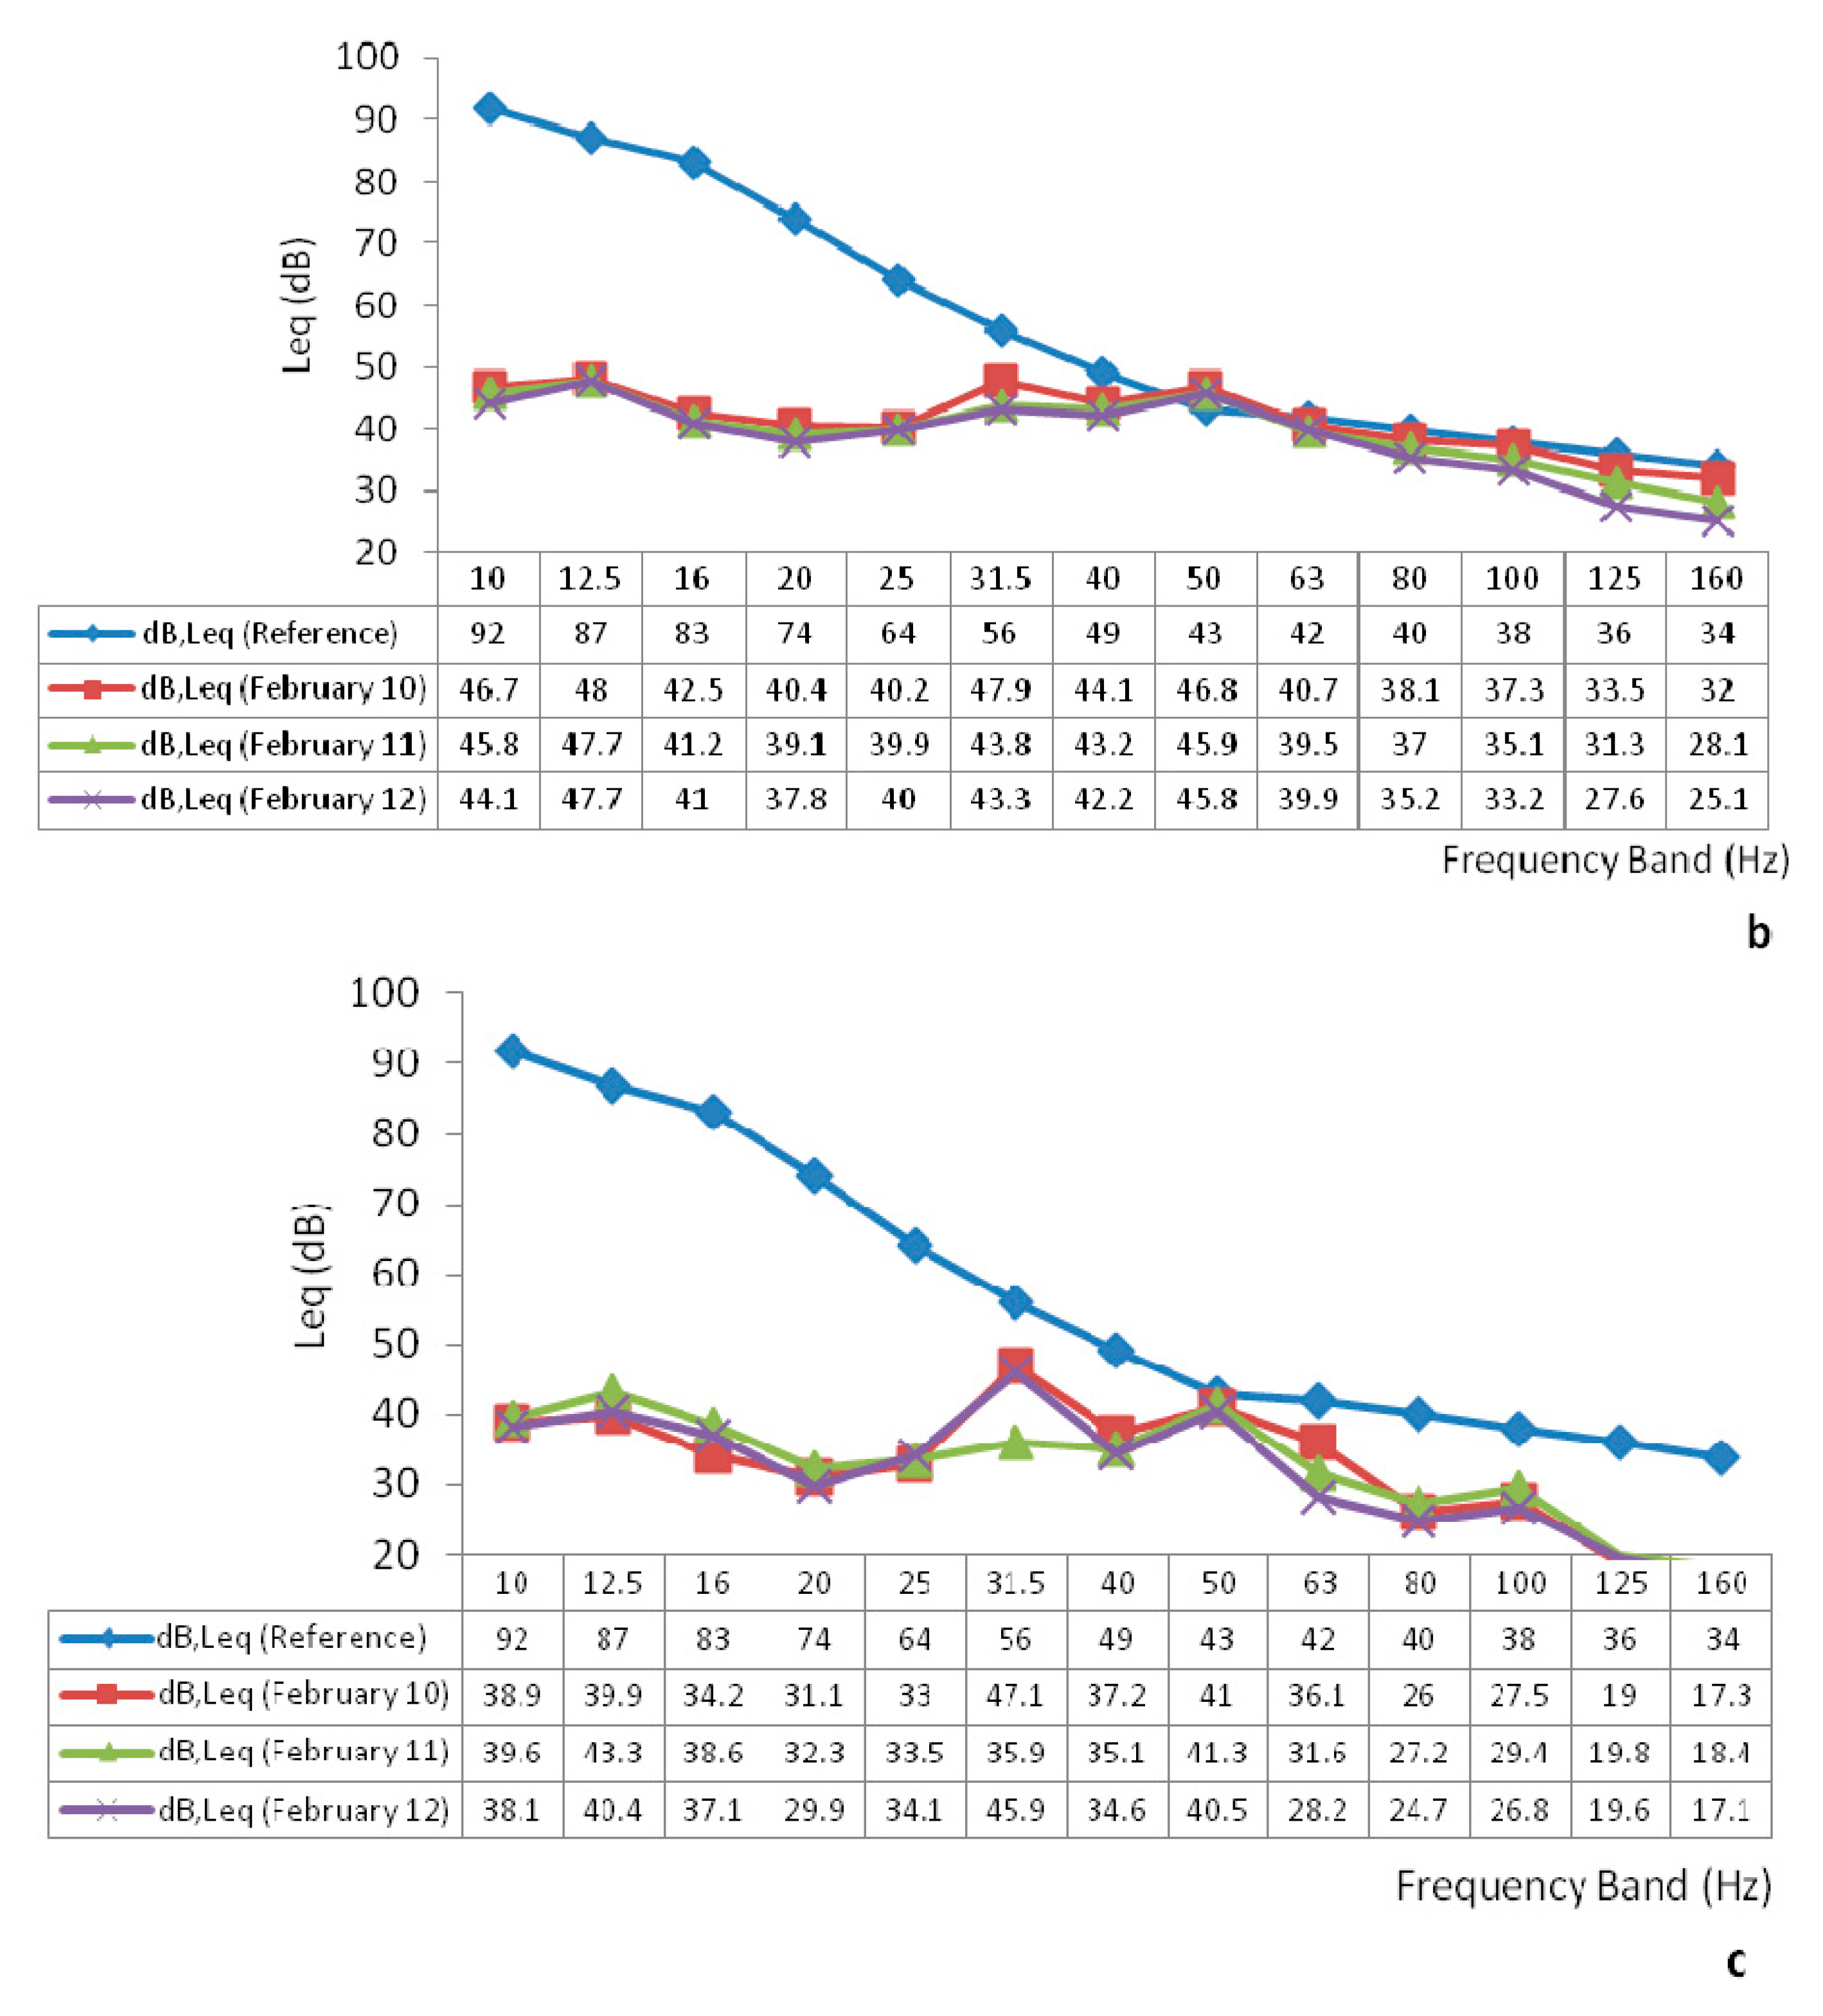
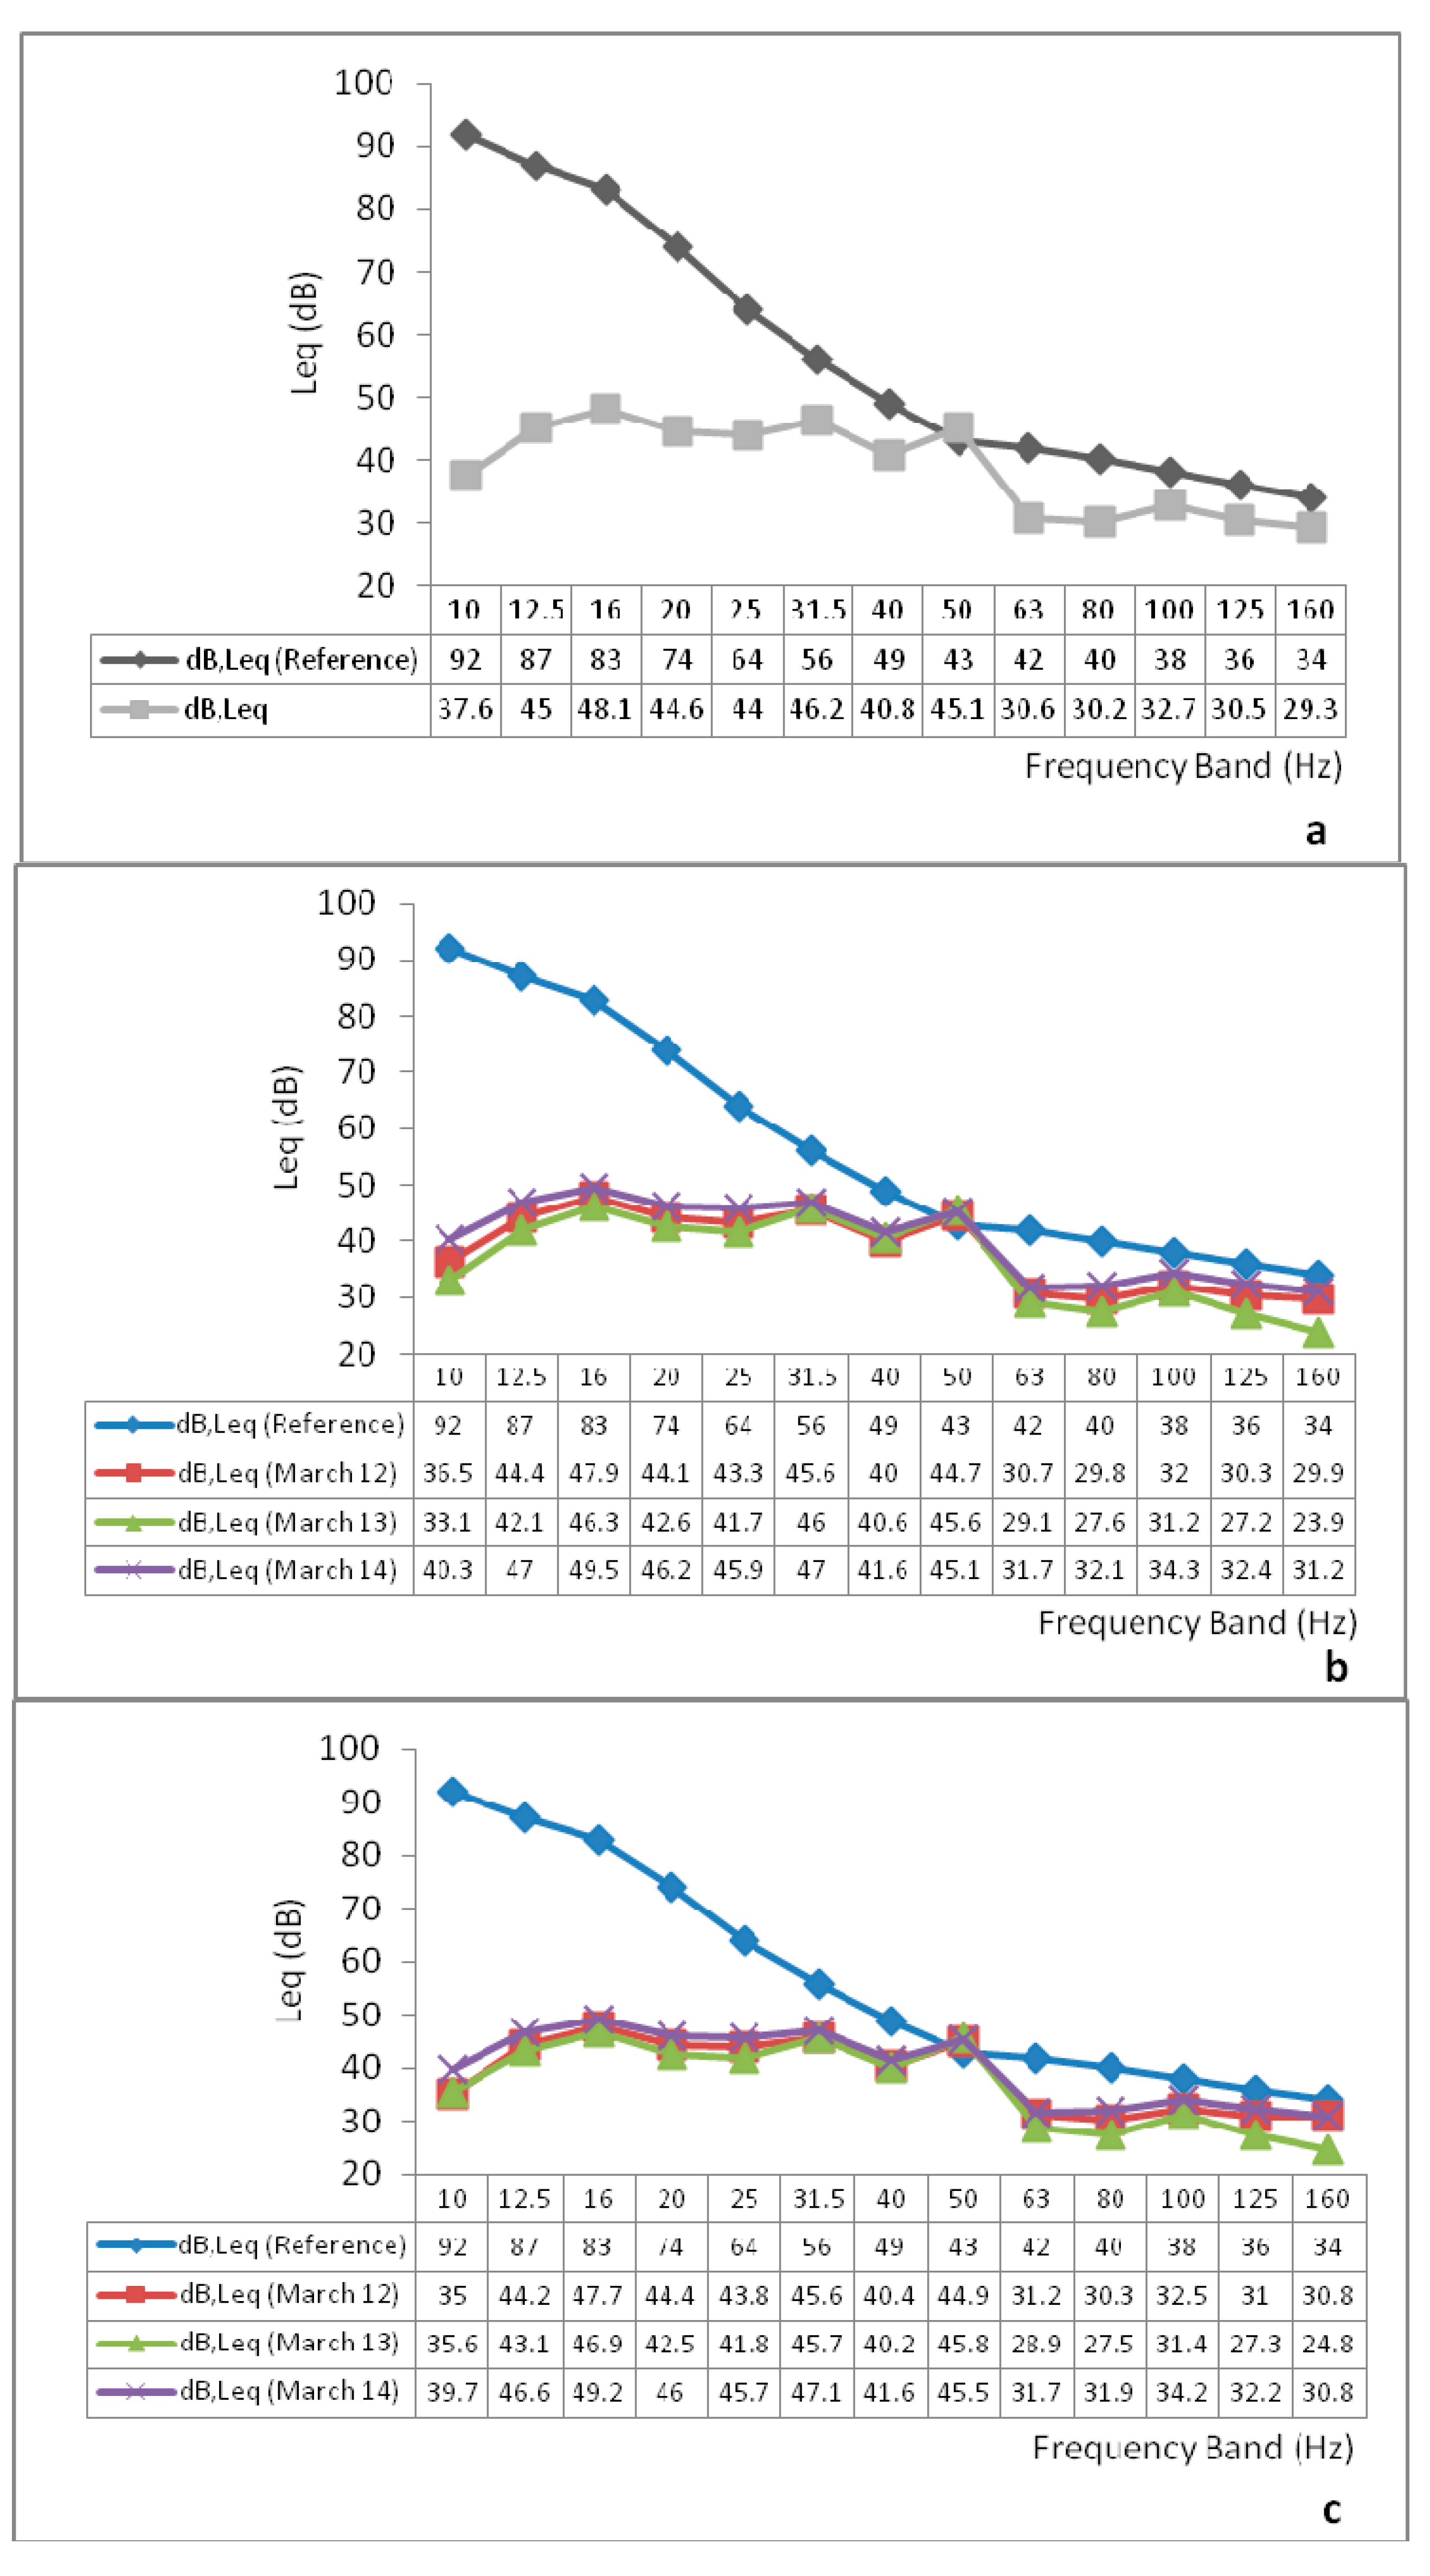
In both analyses of point J, “complete measurement” and “measurement per day”, the reference values of the criterion curve were exceeded at the 50 Hz frequency band (
Figure 7a,b). Given the lack of home appliances nearby, the high values on the 50 Hz frequency band recorded in the daytime analysis are due to other sources. In the night-time measurement analysis, the values in the criterion curve were not exceeded (
Figure 7c).
Figure 7.
Point J (a) Complete Measurement (b) Measurement per day and (c) Measurement at night.
Figure 7.
Point J (a) Complete Measurement (b) Measurement per day and (c) Measurement at night.
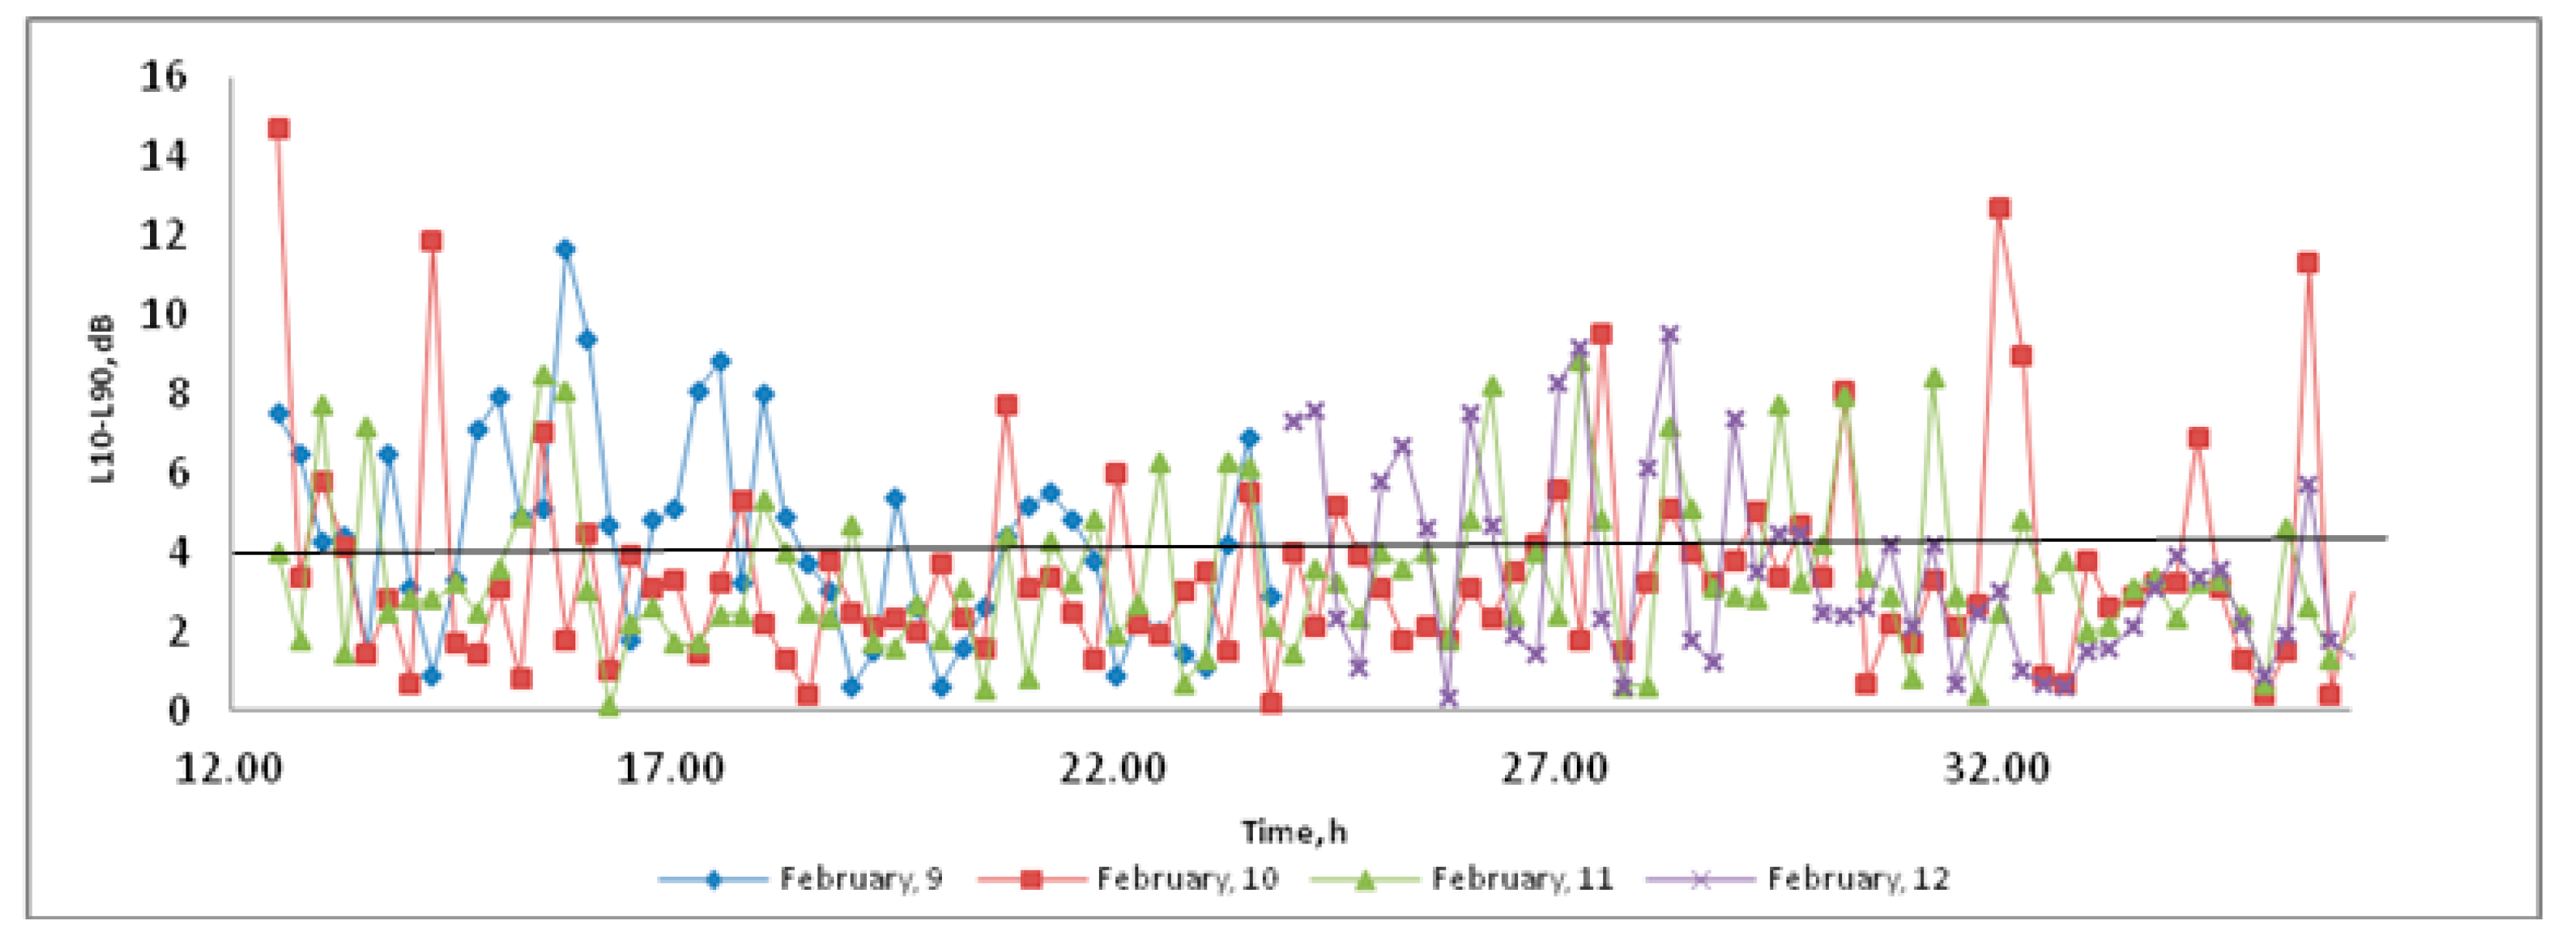
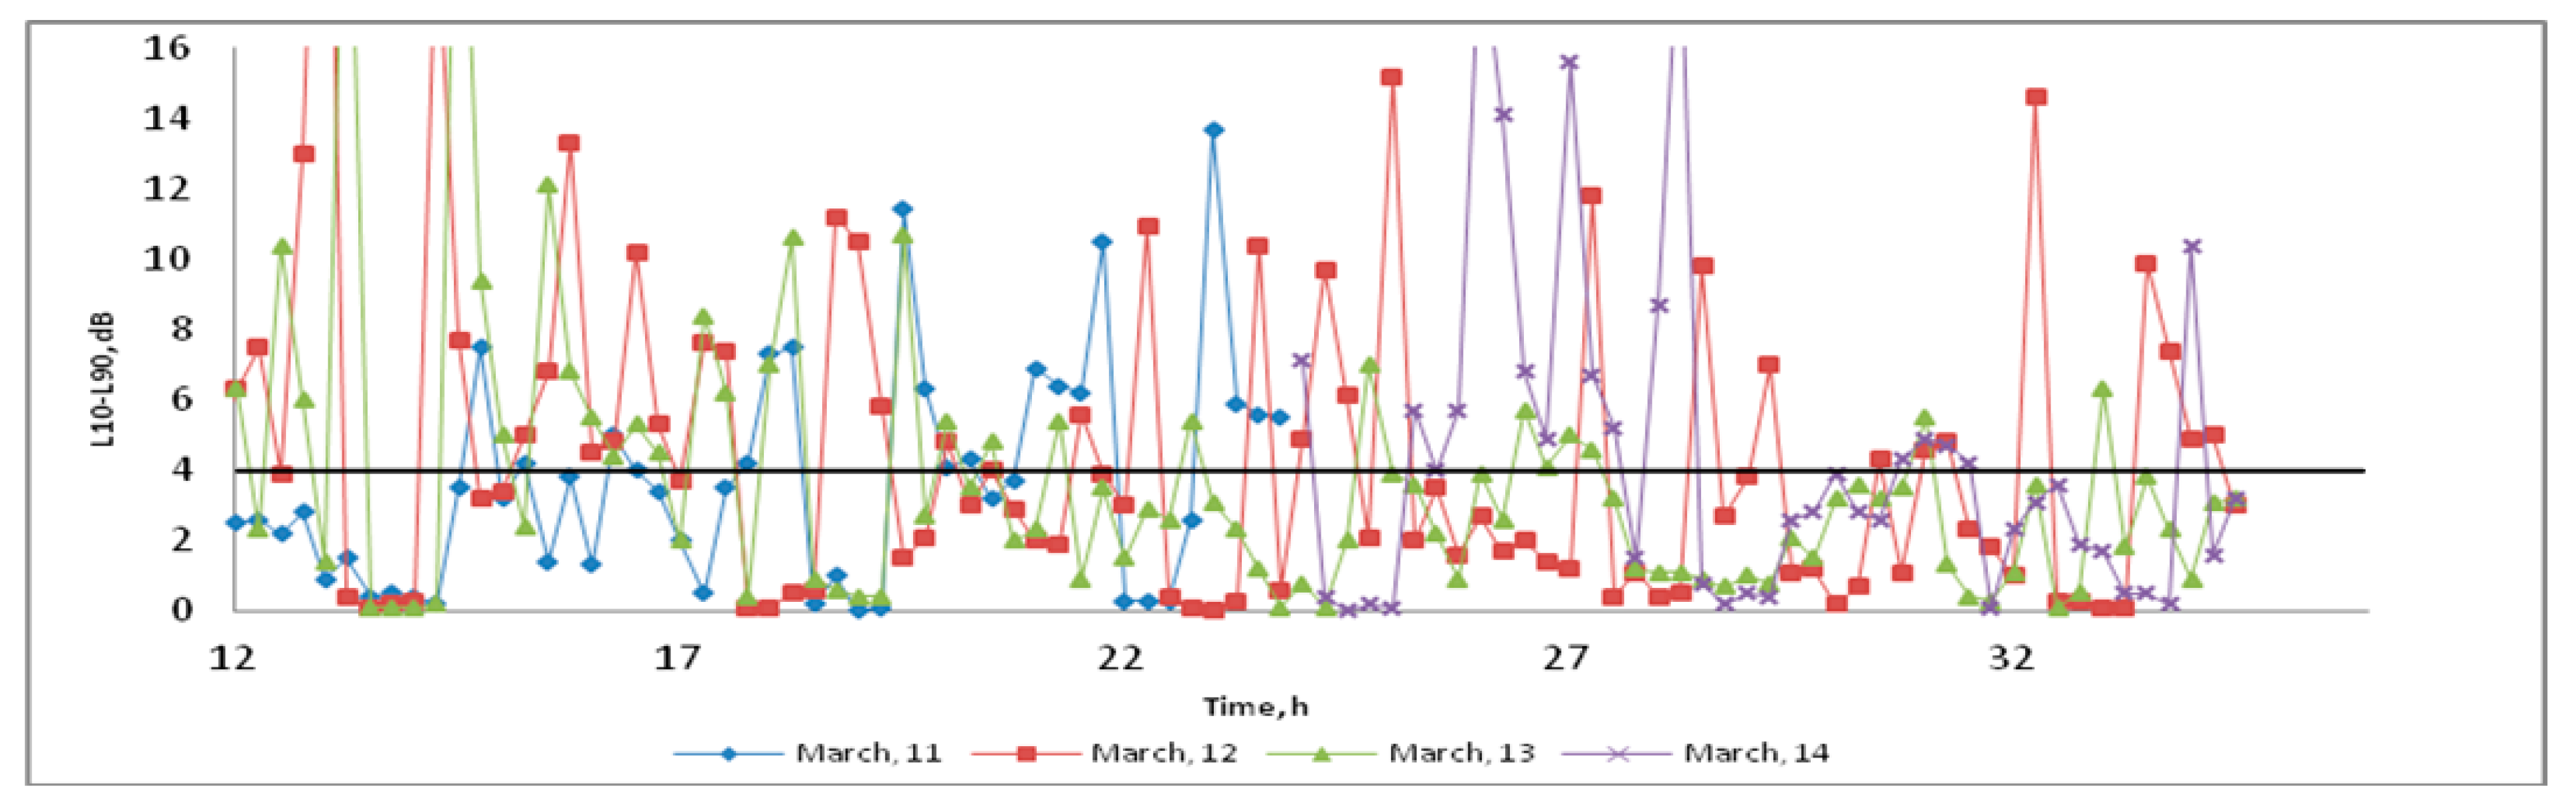
The noise measured over three days showed fluctuating characteristics (
Table 6). The evaluation of the fluctuating characteristics of noise was carried out by determining L10–L90 for periods of 15 min, for 72 h and for the 50 Hz frequency band (exceeded bandwidth). The L10–L90 values are greater than 4 dB over 33.90% of the time (
Figure 8 and
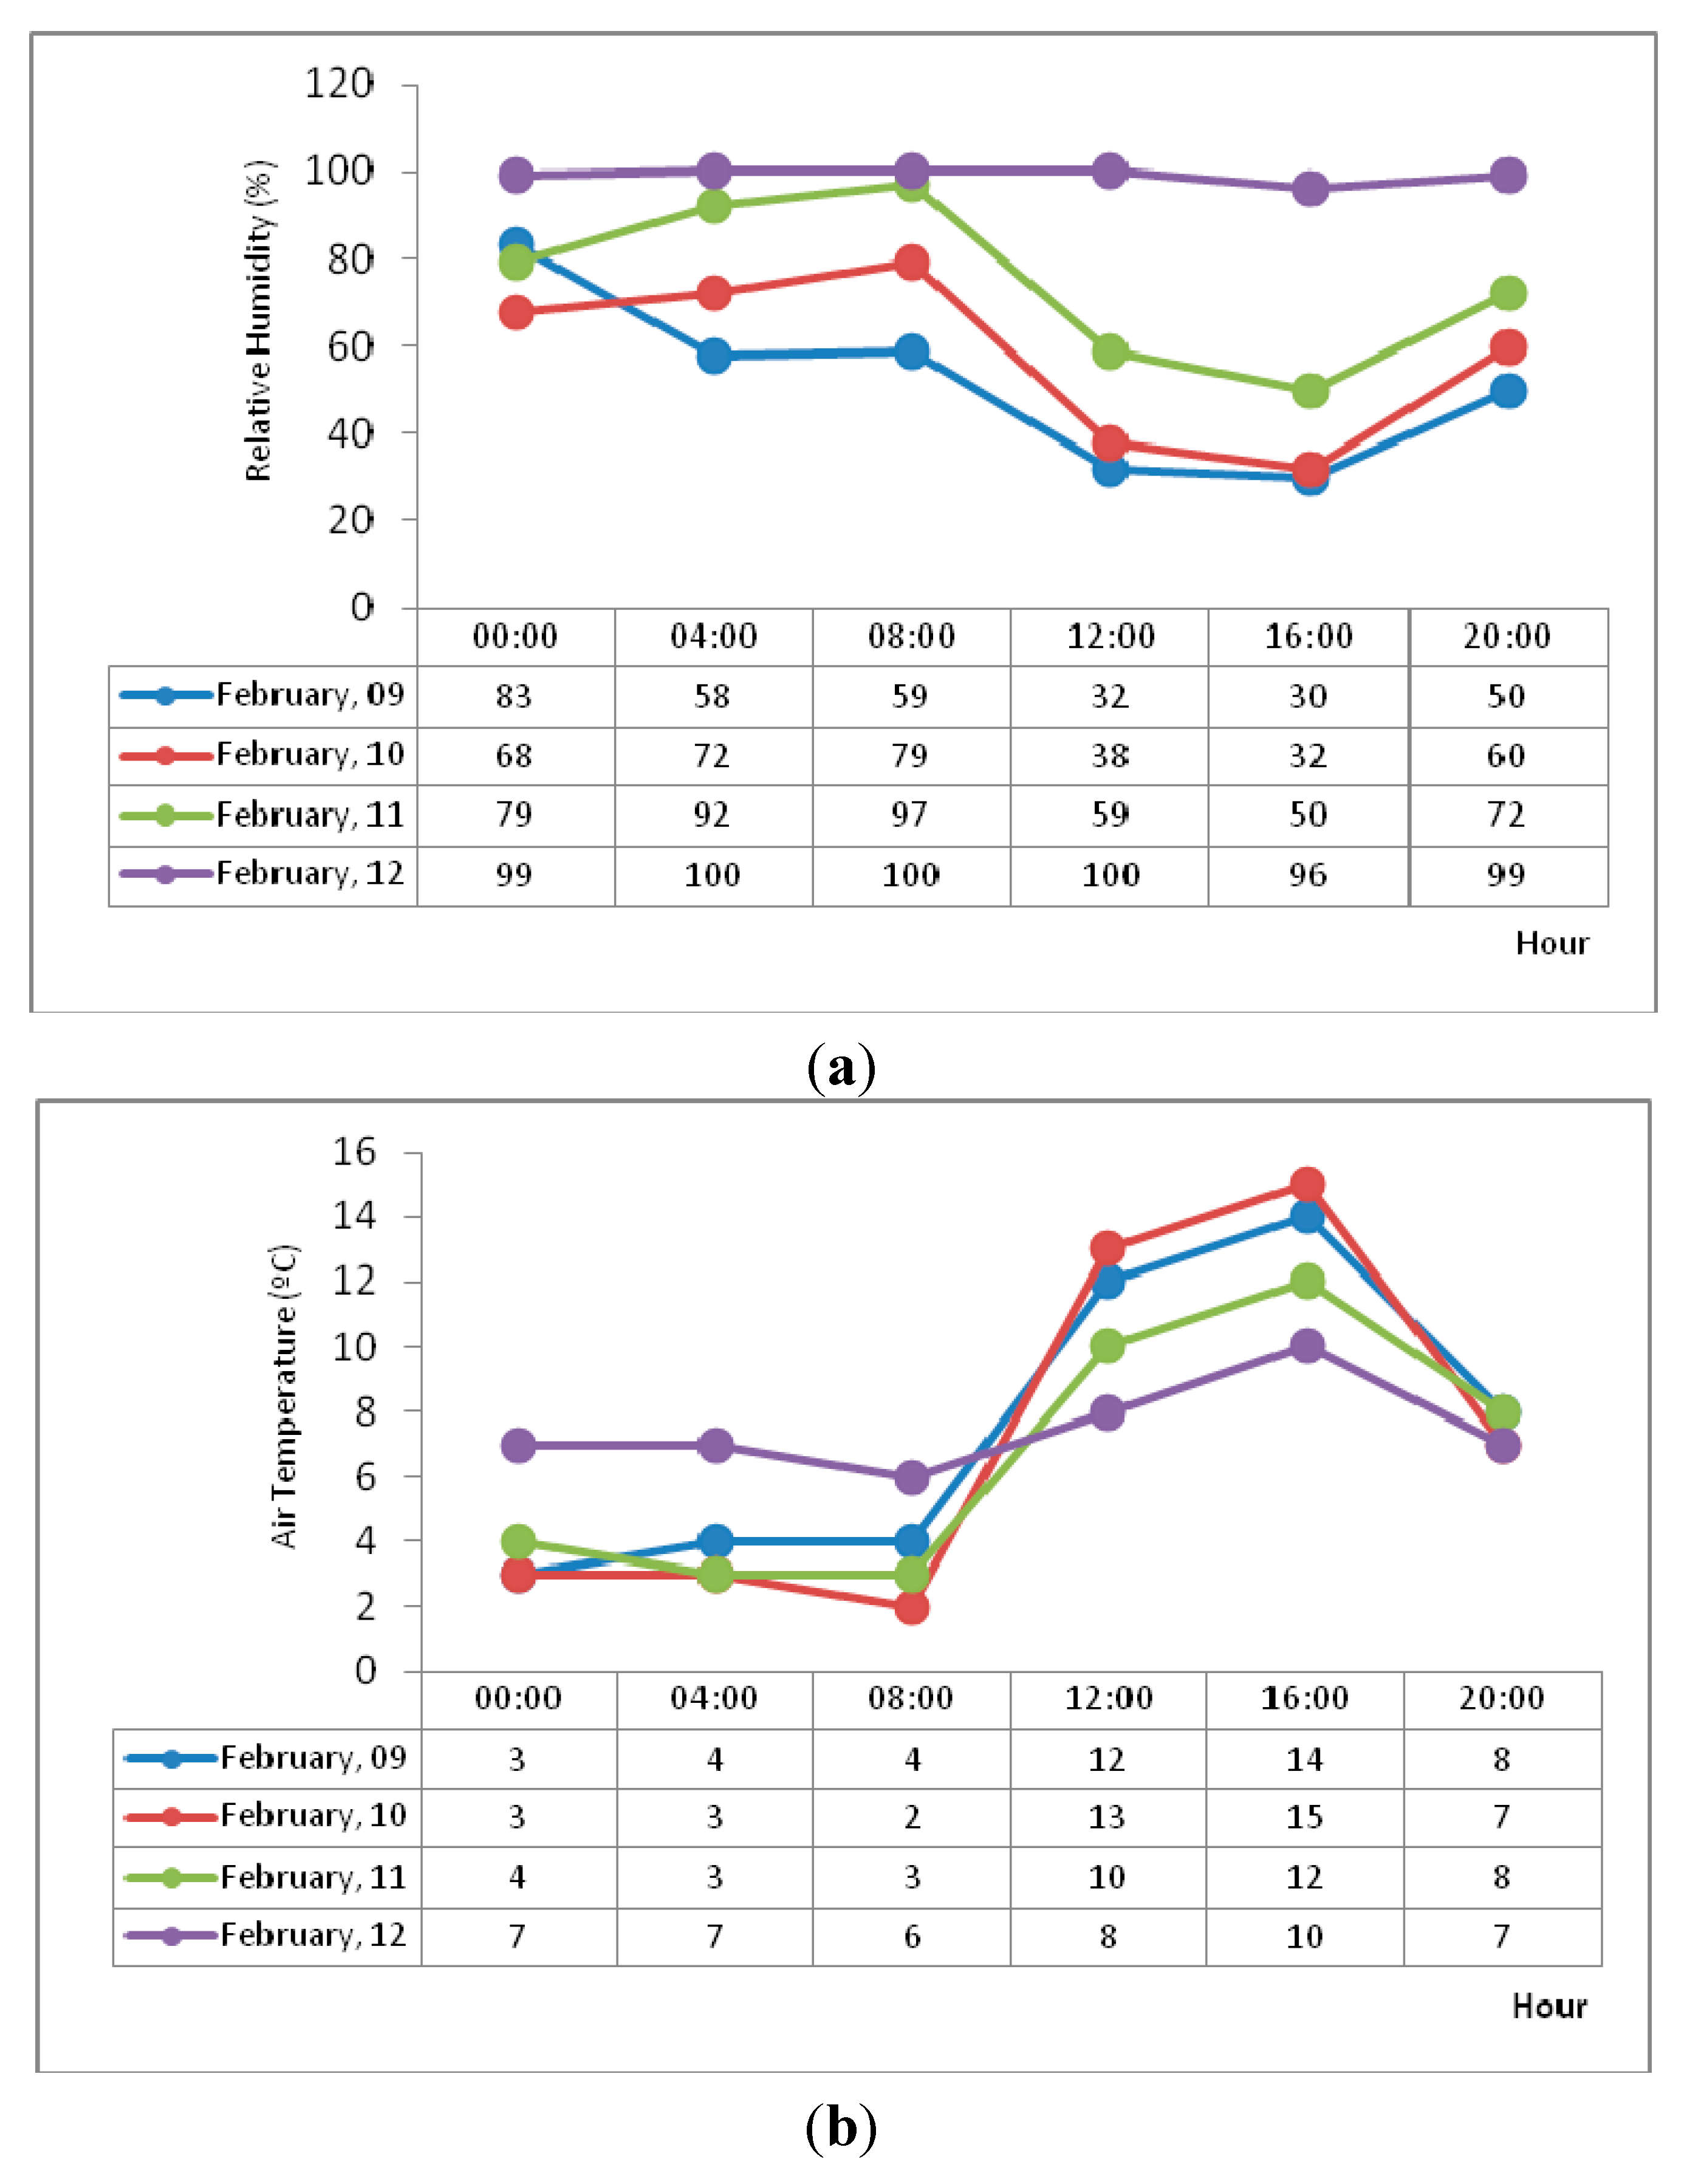
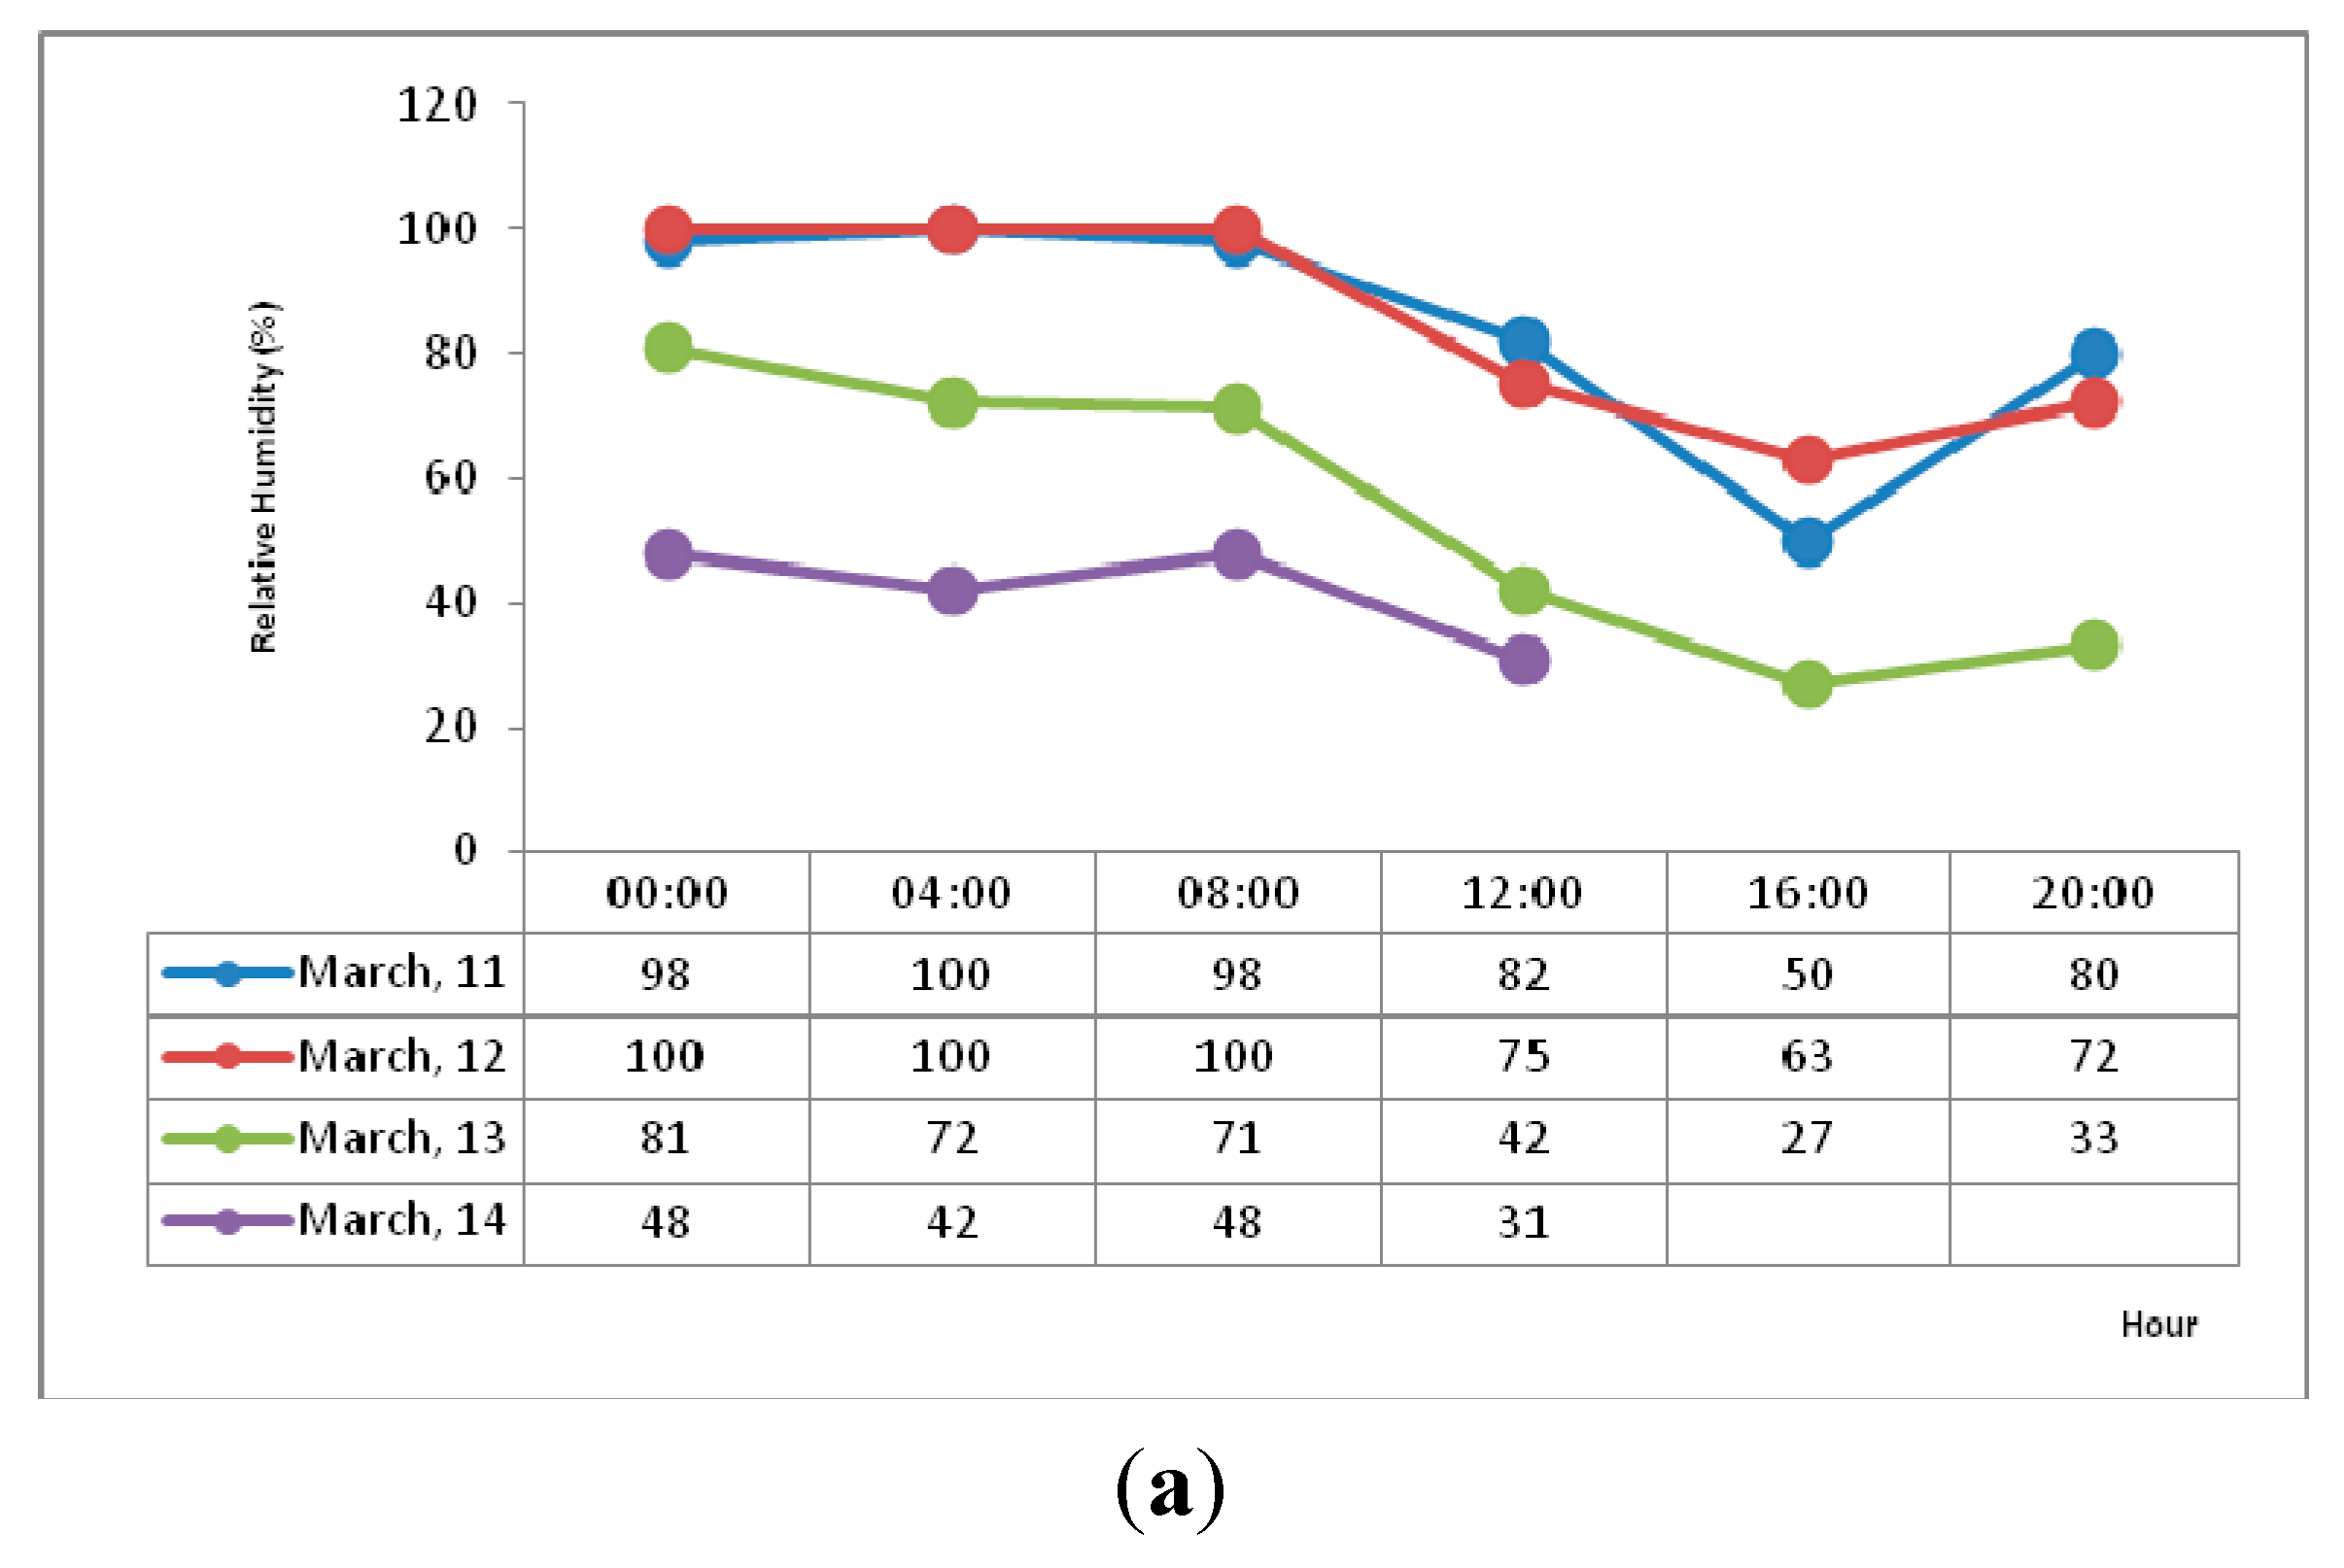
Table 6). During the night period (2:00 to 4:00), for the three days, this value was exceeded for most of this period. In another hand, it was not possible to establish a correlation between weather conditions and the measured noise levels (
Figure 9).
Table 6.
Point J—Fluctuating Characteristics, percentage of time that L10–L90 ≥ 4 dB.
Table 6.
Point J—Fluctuating Characteristics, percentage of time that L10–L90 ≥ 4 dB.
| Frequency (Hz) | 10 | 12.5 | 16 | 20 | 25 | 31.5 | 40 | 50 | 63 | 80 | 100 | 125 | 160 |
|---|
| L10–L90 ≥ 4 | 14 | 41.5 | 21.1 | 27.7 | 27 | 42.9 | 38.1 | 33.9 | 31.5 | 32.9 | 29.8 | 38.4 | 34.9 |
Figure 8.
Point J—L10–L90—1/3 Oct 50 Hz.
Figure 8.
Point J—L10–L90—1/3 Oct 50 Hz.
Figure 9.
Point J—Weather Conditions [
34] (
a) Relative Humidity and (
b) Air Temperature.
Figure 9.
Point J—Weather Conditions [
34] (
a) Relative Humidity and (
b) Air Temperature.
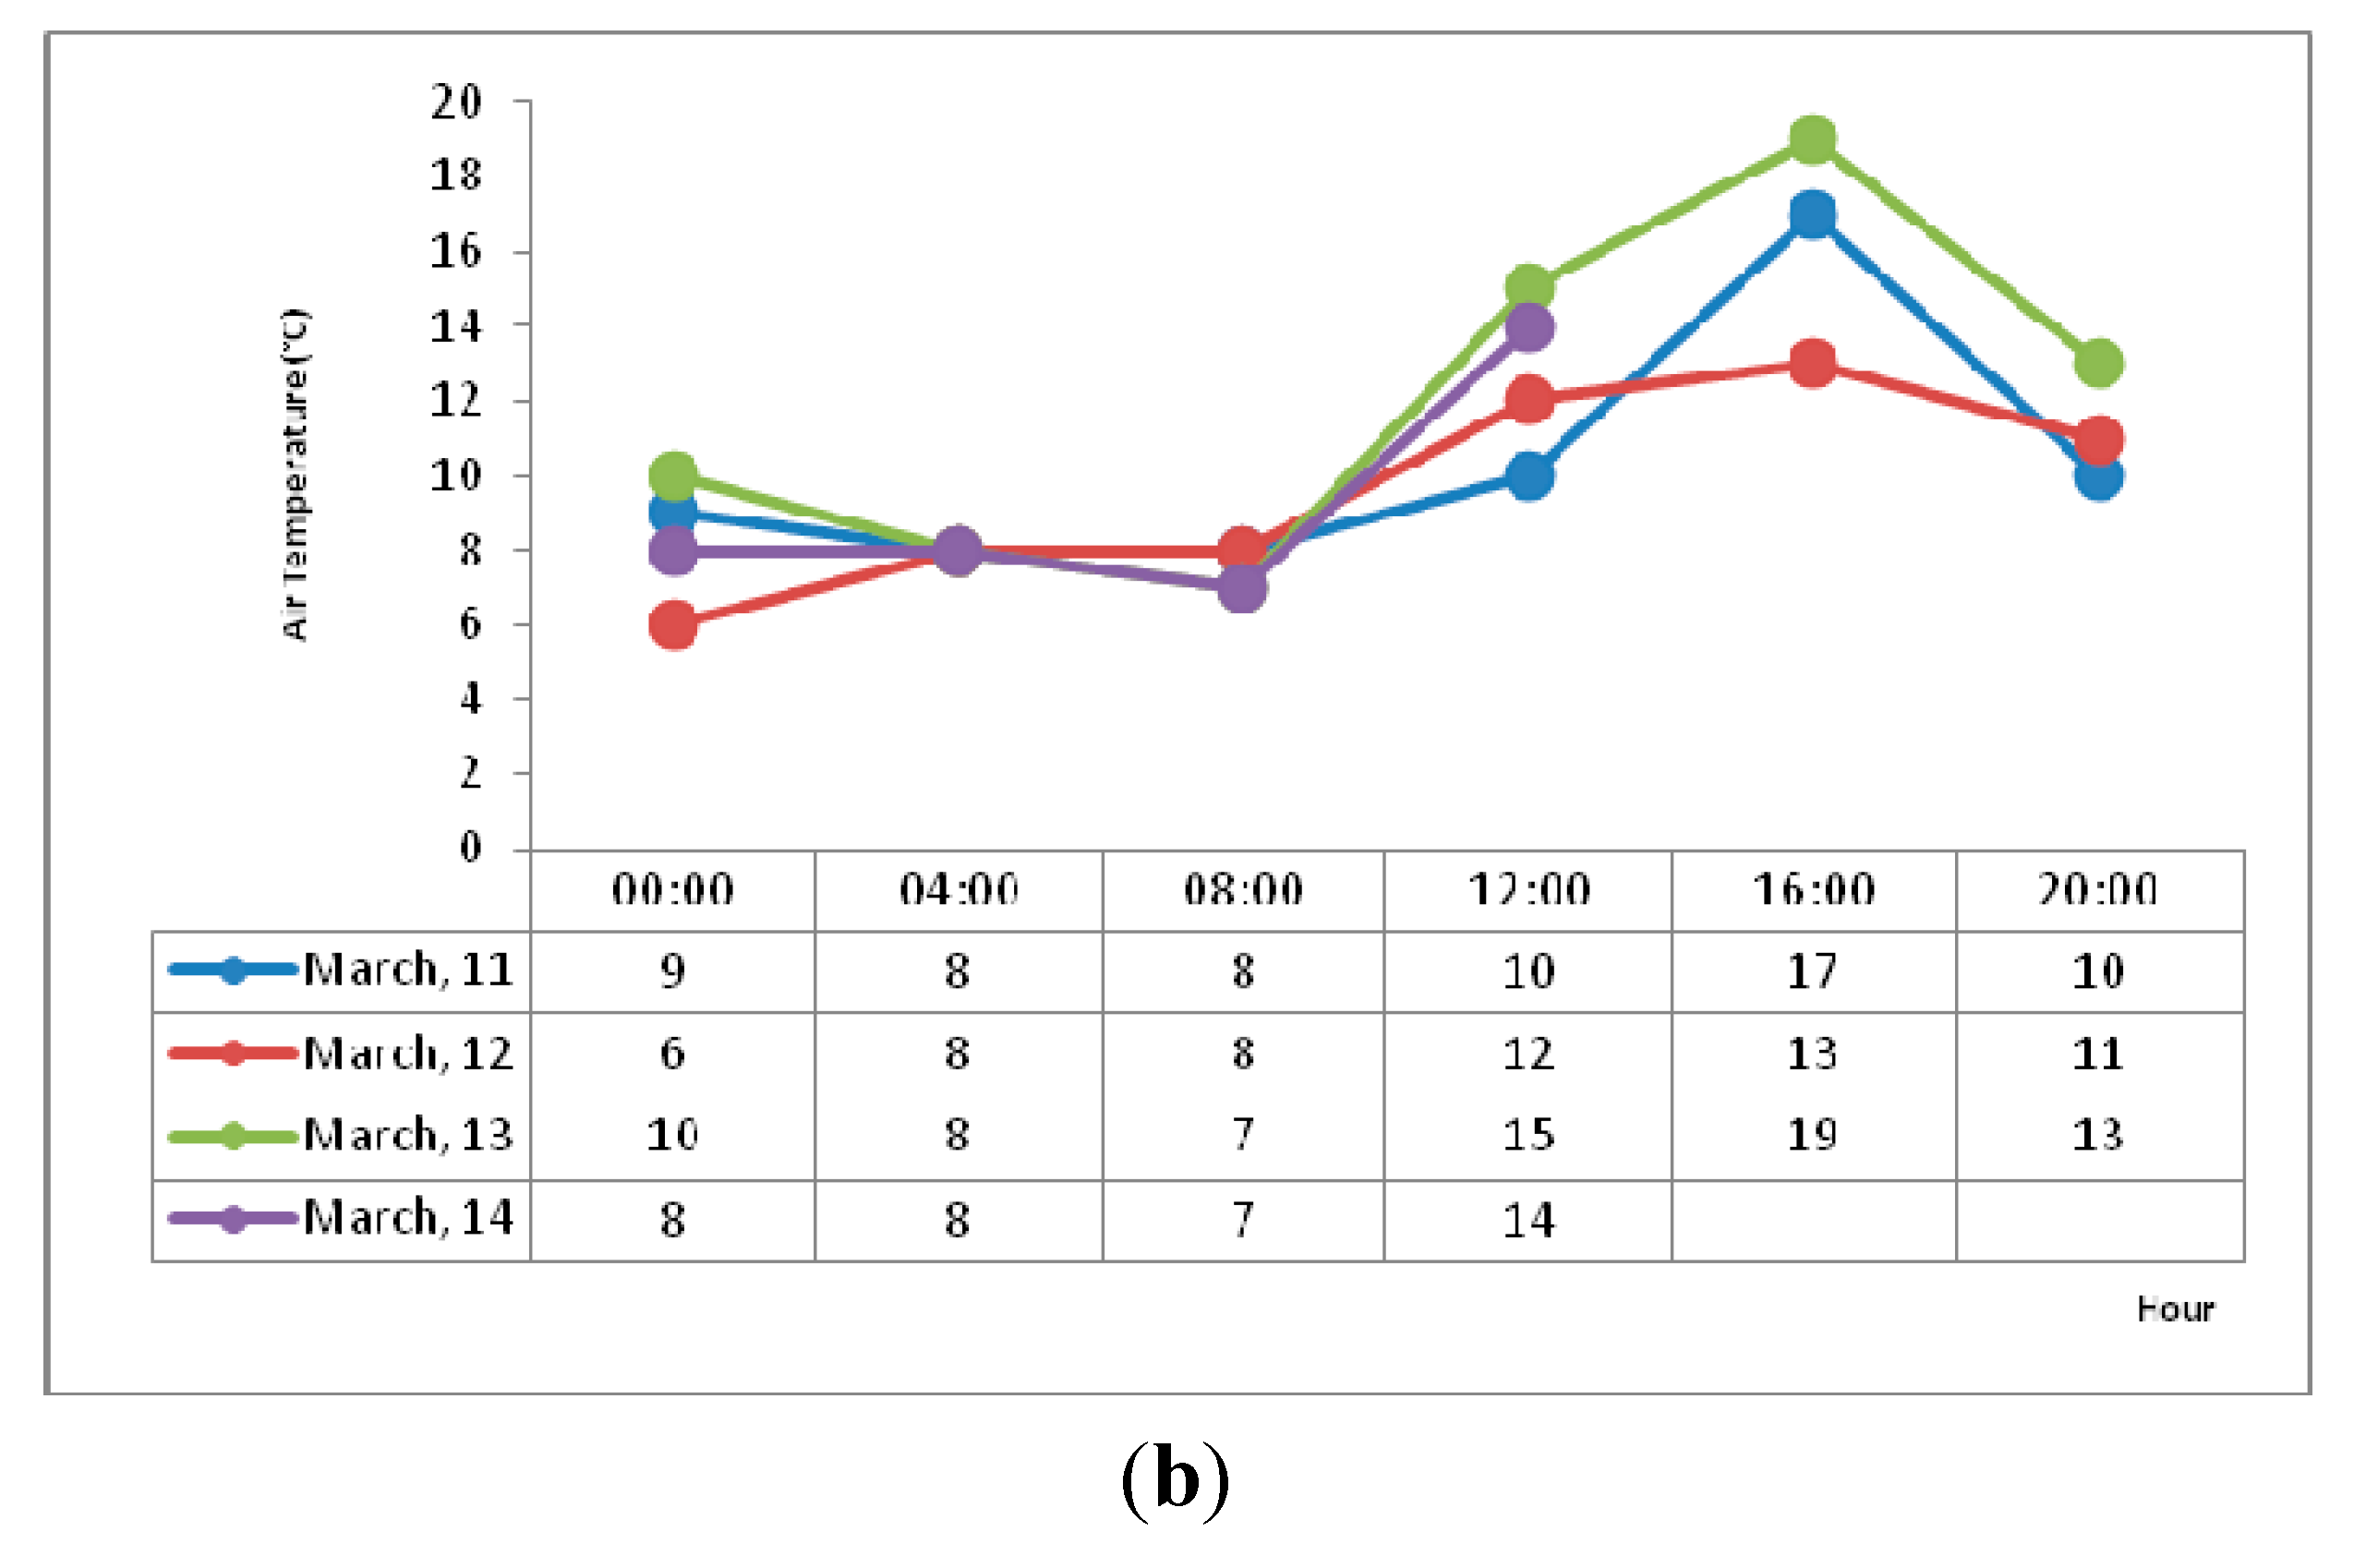
At point L, the equipment was installed inside the kitchen of the residence, where the interviewee claimed she could hear the noise. Due to the influence of the equipment, an analysis was made for 20 min using shutdown equipment.
Figure 10.
Point L (a) Complete Measurement (b) Measurement per day and (c) Measurement at night.
Figure 10.
Point L (a) Complete Measurement (b) Measurement per day and (c) Measurement at night.
According to [
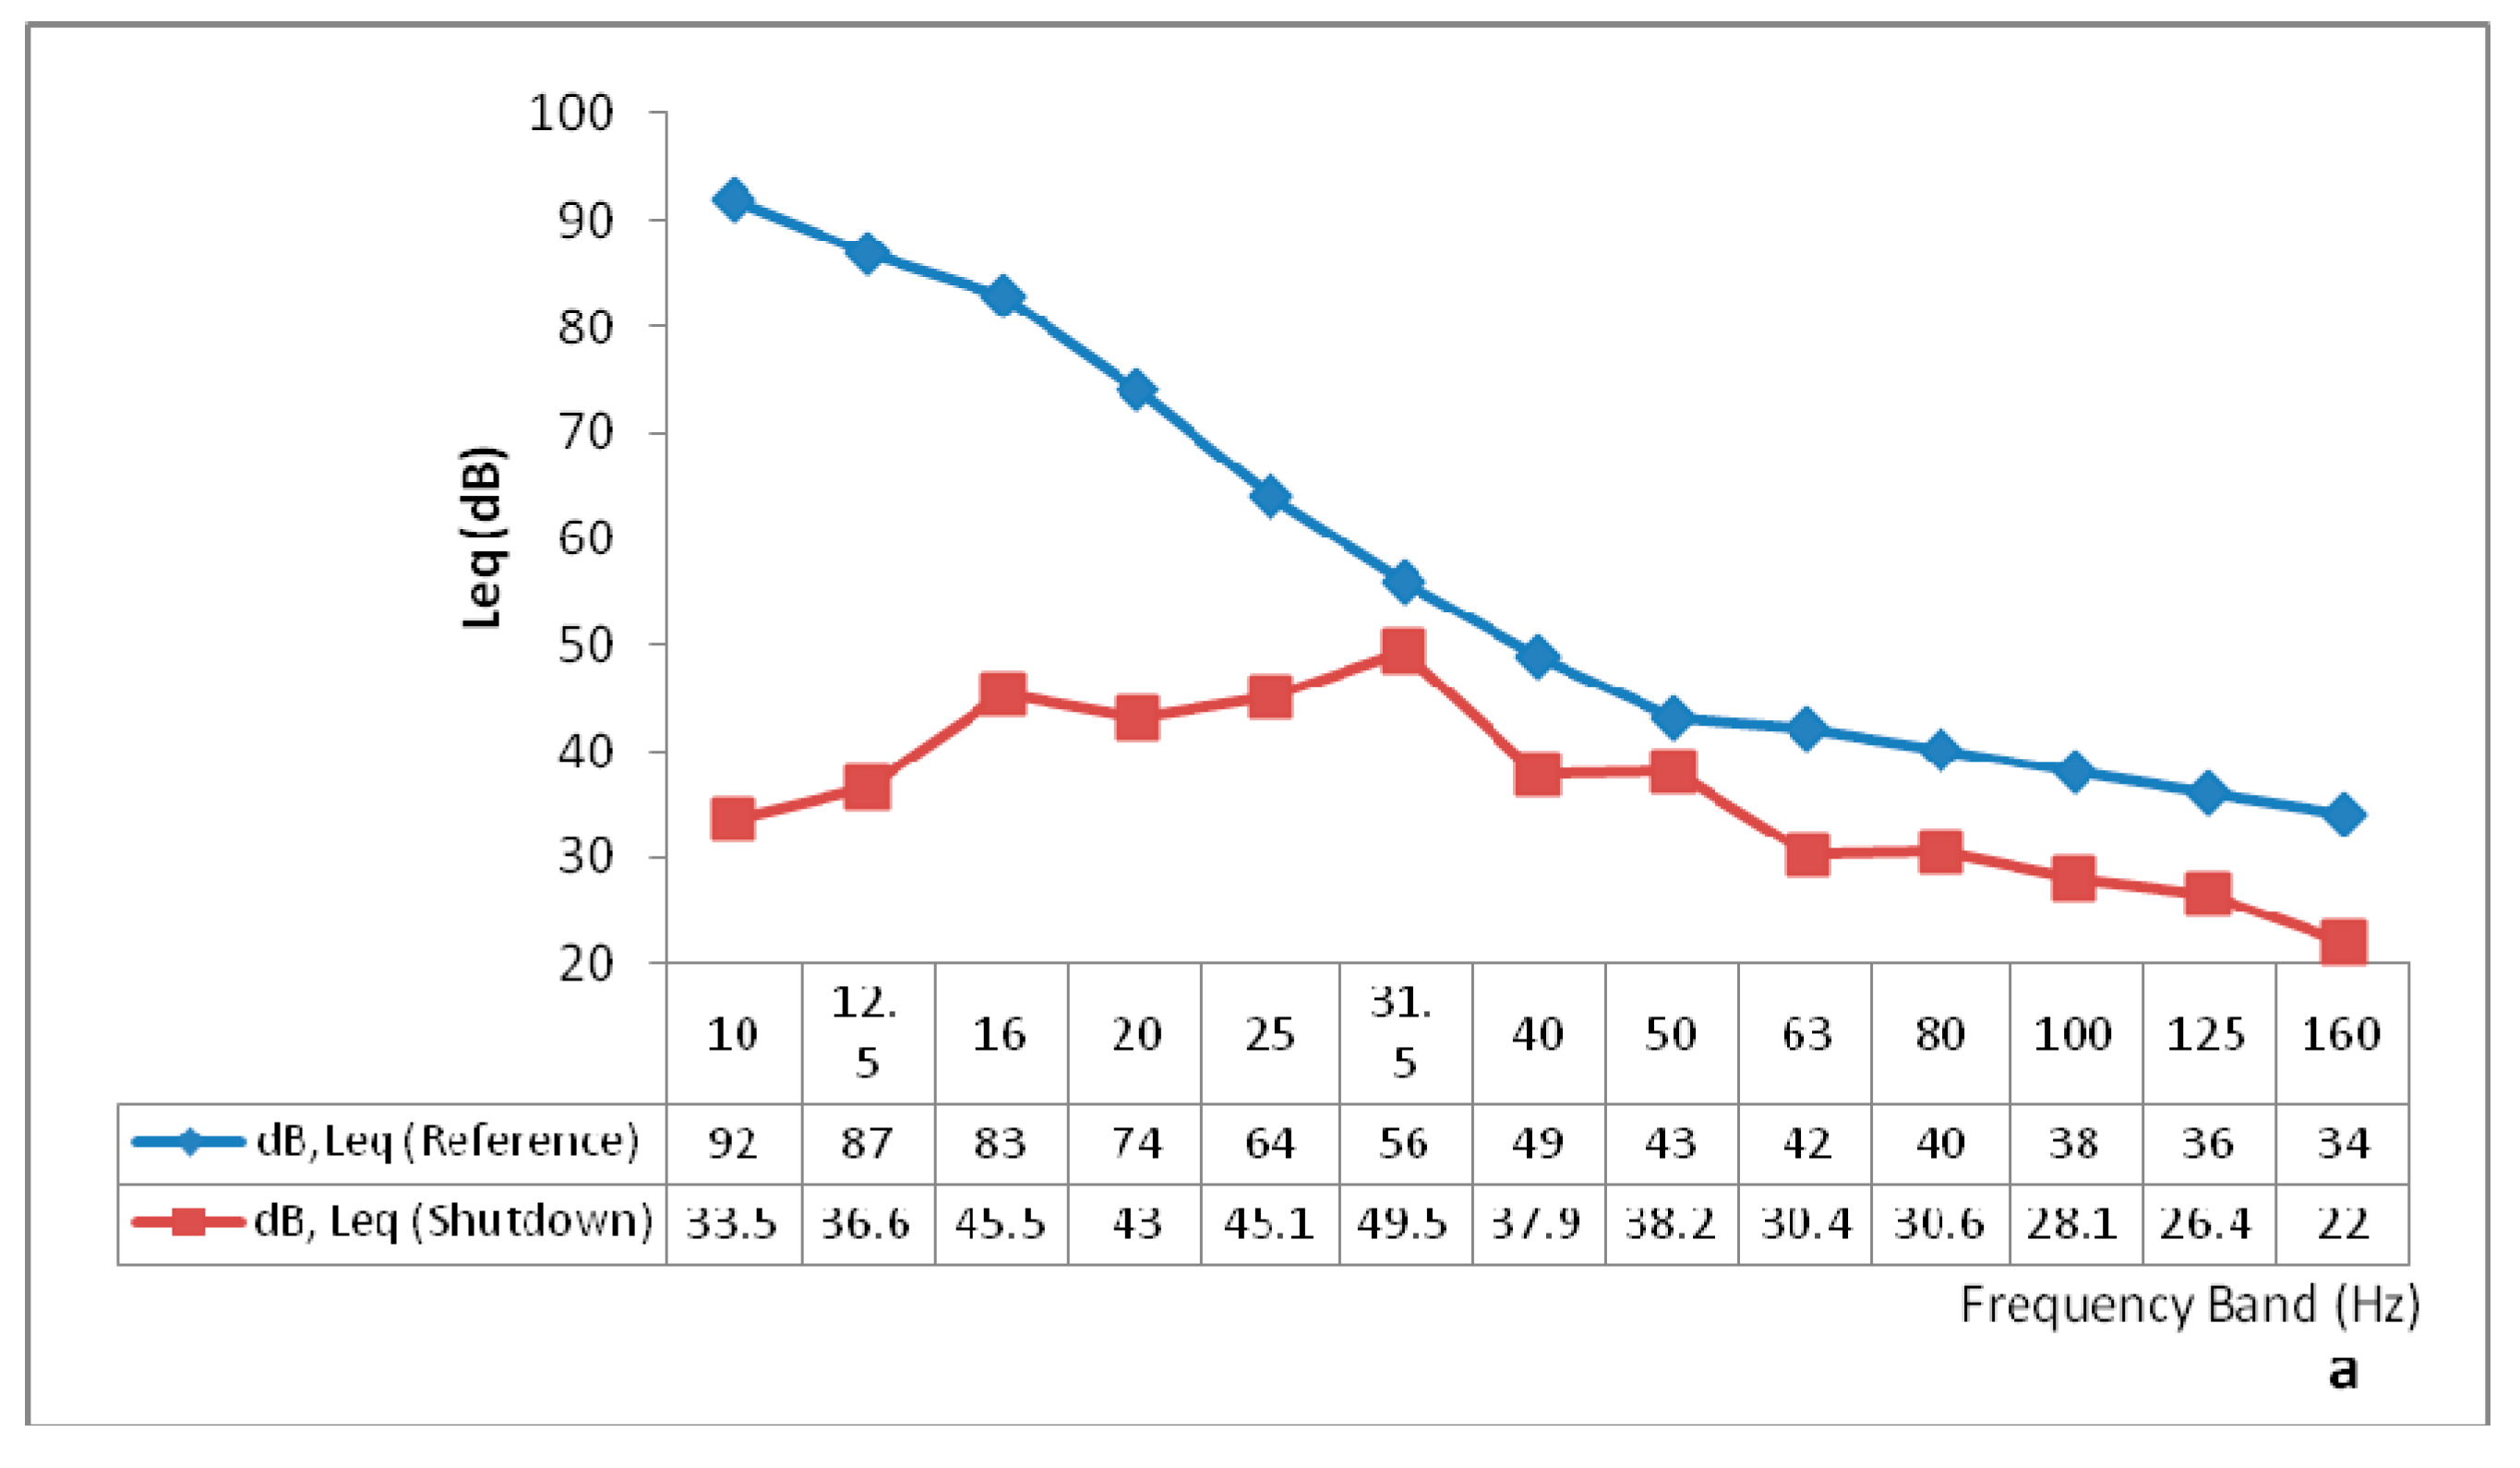
11], this is the frequency band in which refrigerators operate, which could account for the reference values being exceeded in the 50 Hz frequency band (
Figure 11). This deduction can be confirmed with the results obtained after shutdown equipment (
Figure 12), where the criterion curve was exceeded in this band (50 Hz). It was not possible to establish a correlation between the air temperature, relative humidity and the measured noise levels (
Figure 13).
The fluctuating L10–L90 noise characteristics were determined for periods of 15 min for three days of measurement. The noise during the complete measurement showed fluctuating characteristics during 39.1% of the time for band 50 Hz (
Table 7). However, during the night-time measurement (2:00 a.m. to 4:00 a.m.), this value was exceeded for most of this period over the three days (
Figure 11).
Figure 11.
Point L—L10–L90—1/3 Oct 50 Hz.
Figure 11.
Point L—L10–L90—1/3 Oct 50 Hz.
Figure 12.
Point L—Shutdown (20 min).
Figure 12.
Point L—Shutdown (20 min).
Figure 13.
Point L—Weather Conditions [
34] (
a) Relative Humidity and (
b) Air Temperature.
Figure 13.
Point L—Weather Conditions [
34] (
a) Relative Humidity and (
b) Air Temperature.
Table 7.
Point L—Fluctuating Characteristics, percentage of time that L10–L90 ≥ 4 dB.
Table 7.
Point L—Fluctuating Characteristics, percentage of time that L10–L90 ≥ 4 dB.
| Frequency (Hz) | 10 | 12.5 | 16 | 20 | 25 | 31.5 | 40 | 50 | 63 | 80 | 100 | 125 | 160 |
|---|
| Complete Measurement L10–L90 ≥ 4 | 22.8 | 28.0 | 33.6 | 25.6 | 23.4 | 33.2 | 33.6 | 39.1 | 32.9 | 42.6 | 31.8 | 28.0 | 22.5 |
| Shutdown (20 min) L10–L90 ≥ 4 | 25.0 | 50.0 | 25.0 | 0.0 | 25.0 | 0.0 | 0.0 | 25.0 | 25.0 | 50.0 | 50.0 | 25.0 | 25.0 |
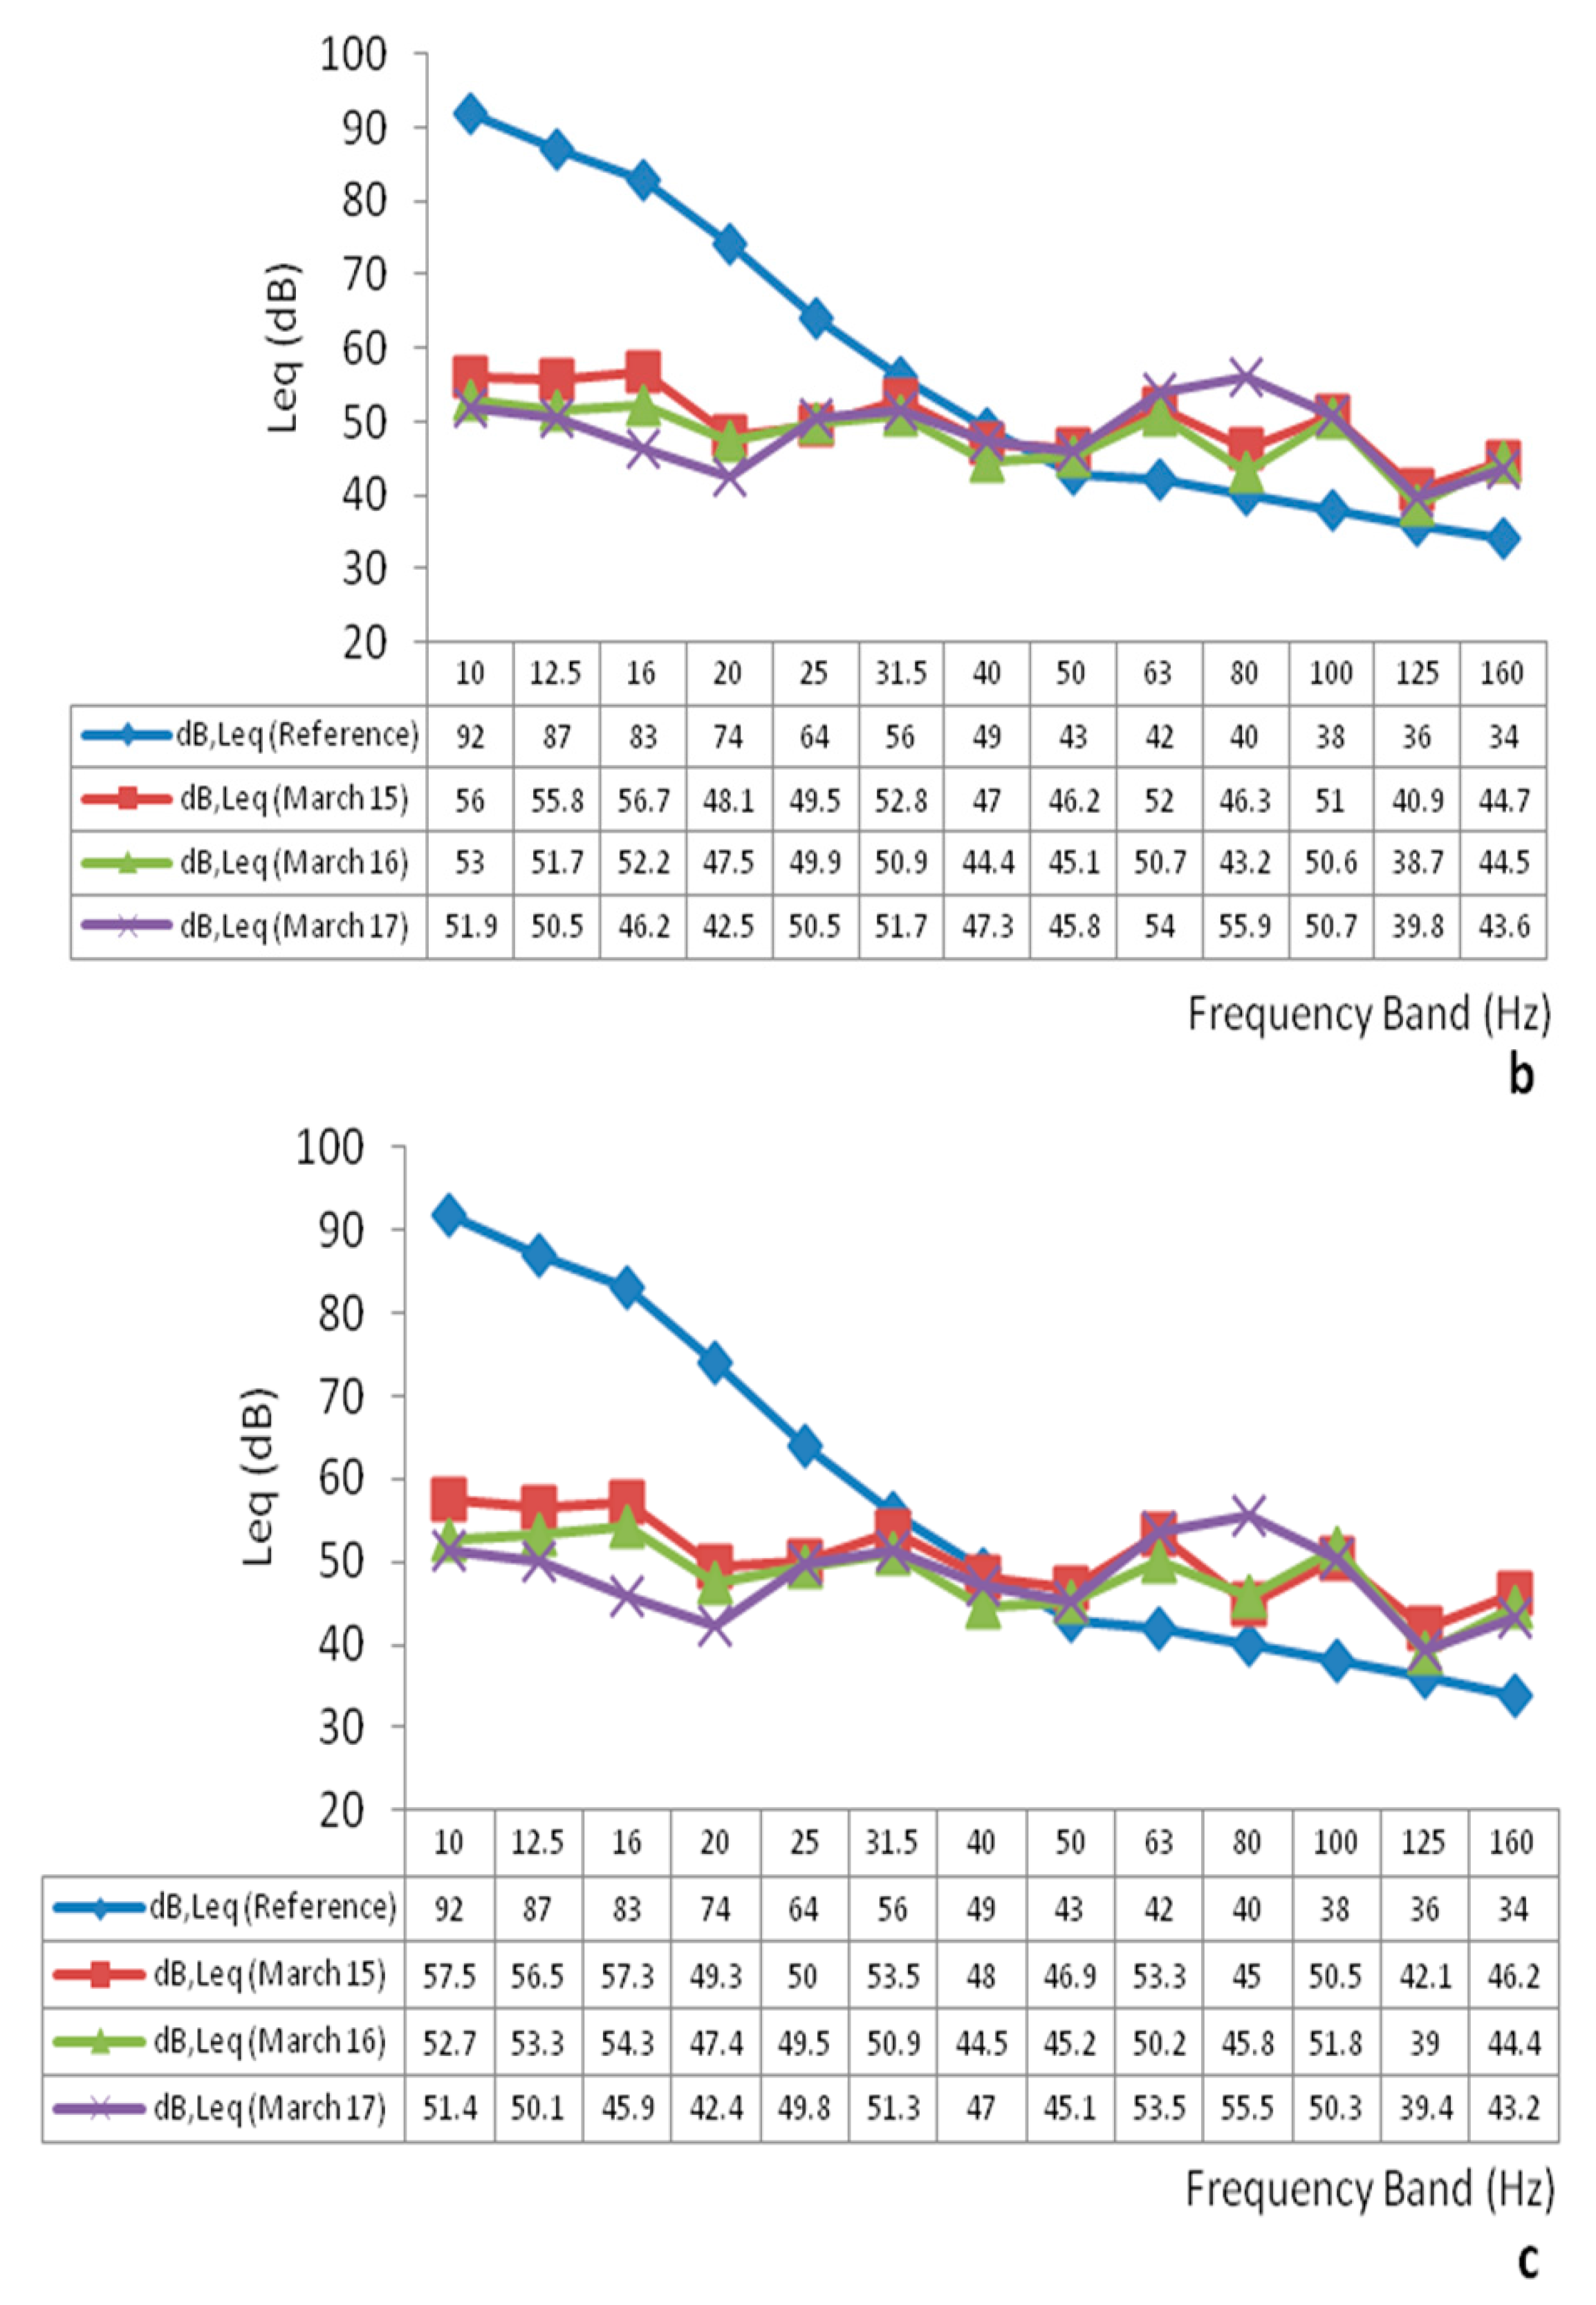
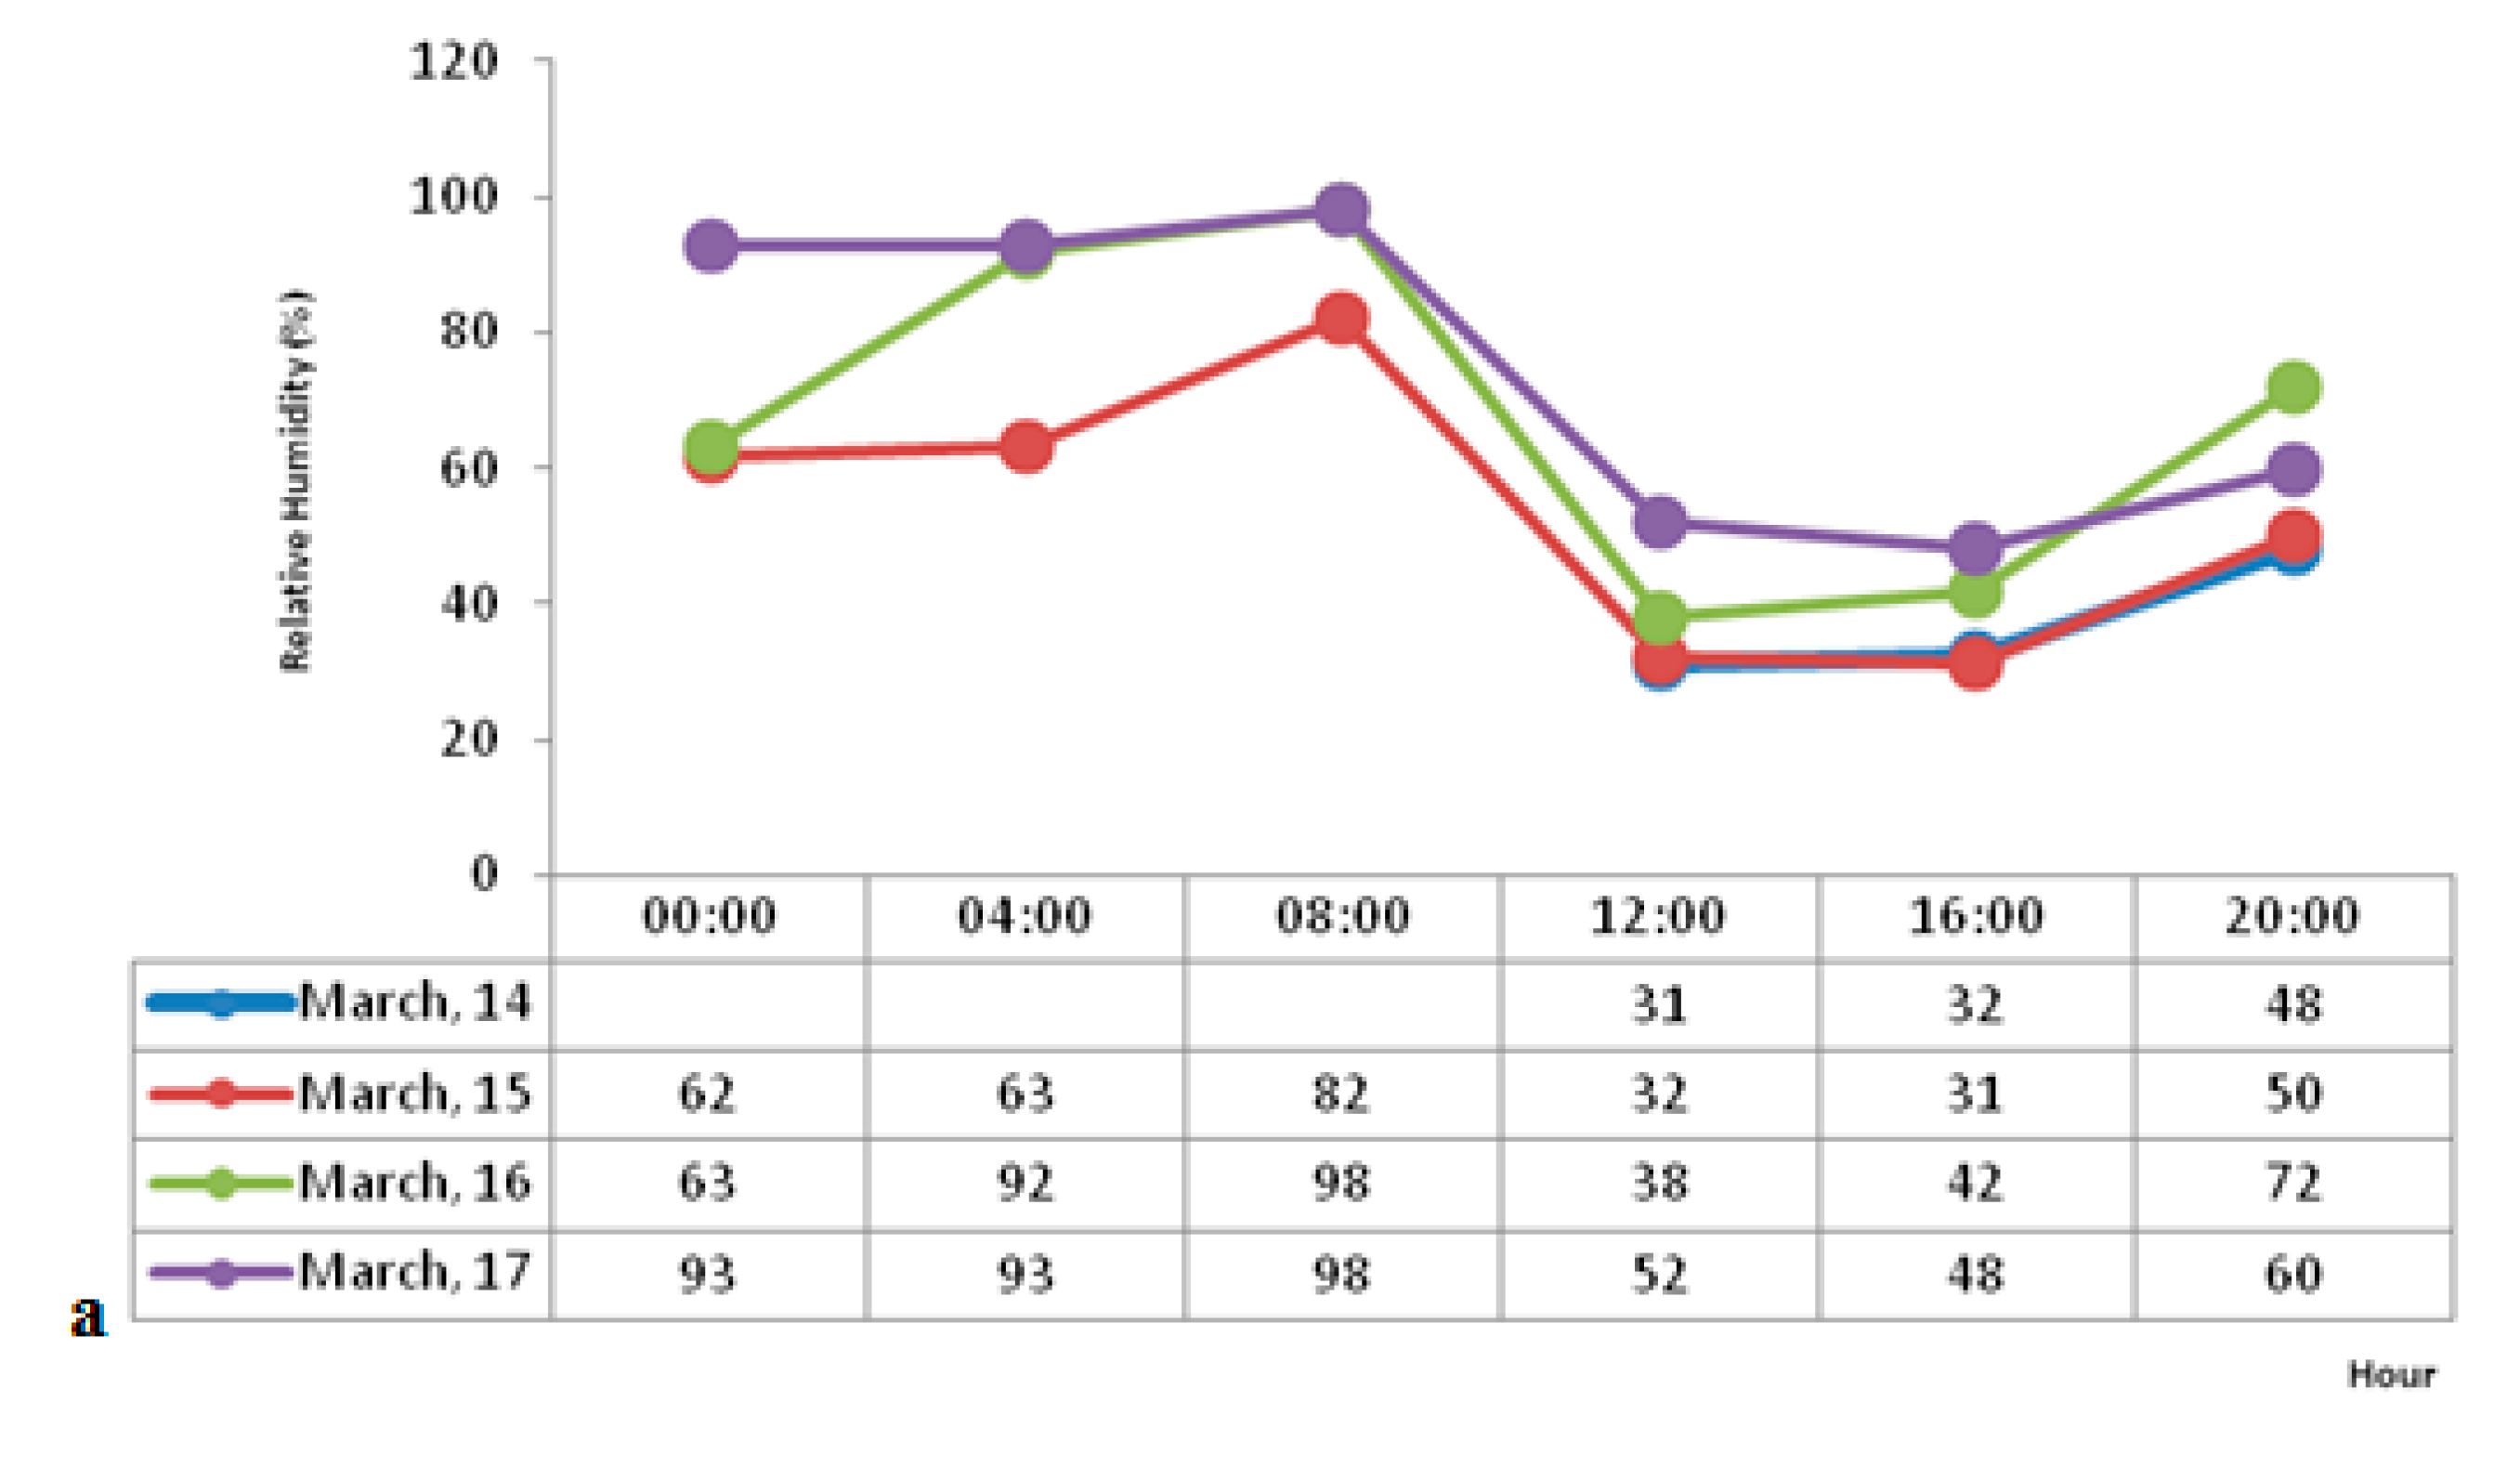
At point M, the sound level meter was installed in the outer area of the residence, inside an annex away from electrical appliance interference. In all time scales, the criterion curve was exceeded between the 50 Hz and 160 Hz frequency bands. The measurement shows the highest exceeding values in the second approach, particularly in the 80 Hz frequency band (
Figure 14).
We highlight the high noise levels, which exceeded 40 Hz, and records of almost 50% of the time for 50 Hz, 63 Hz and 80 Hz bands (
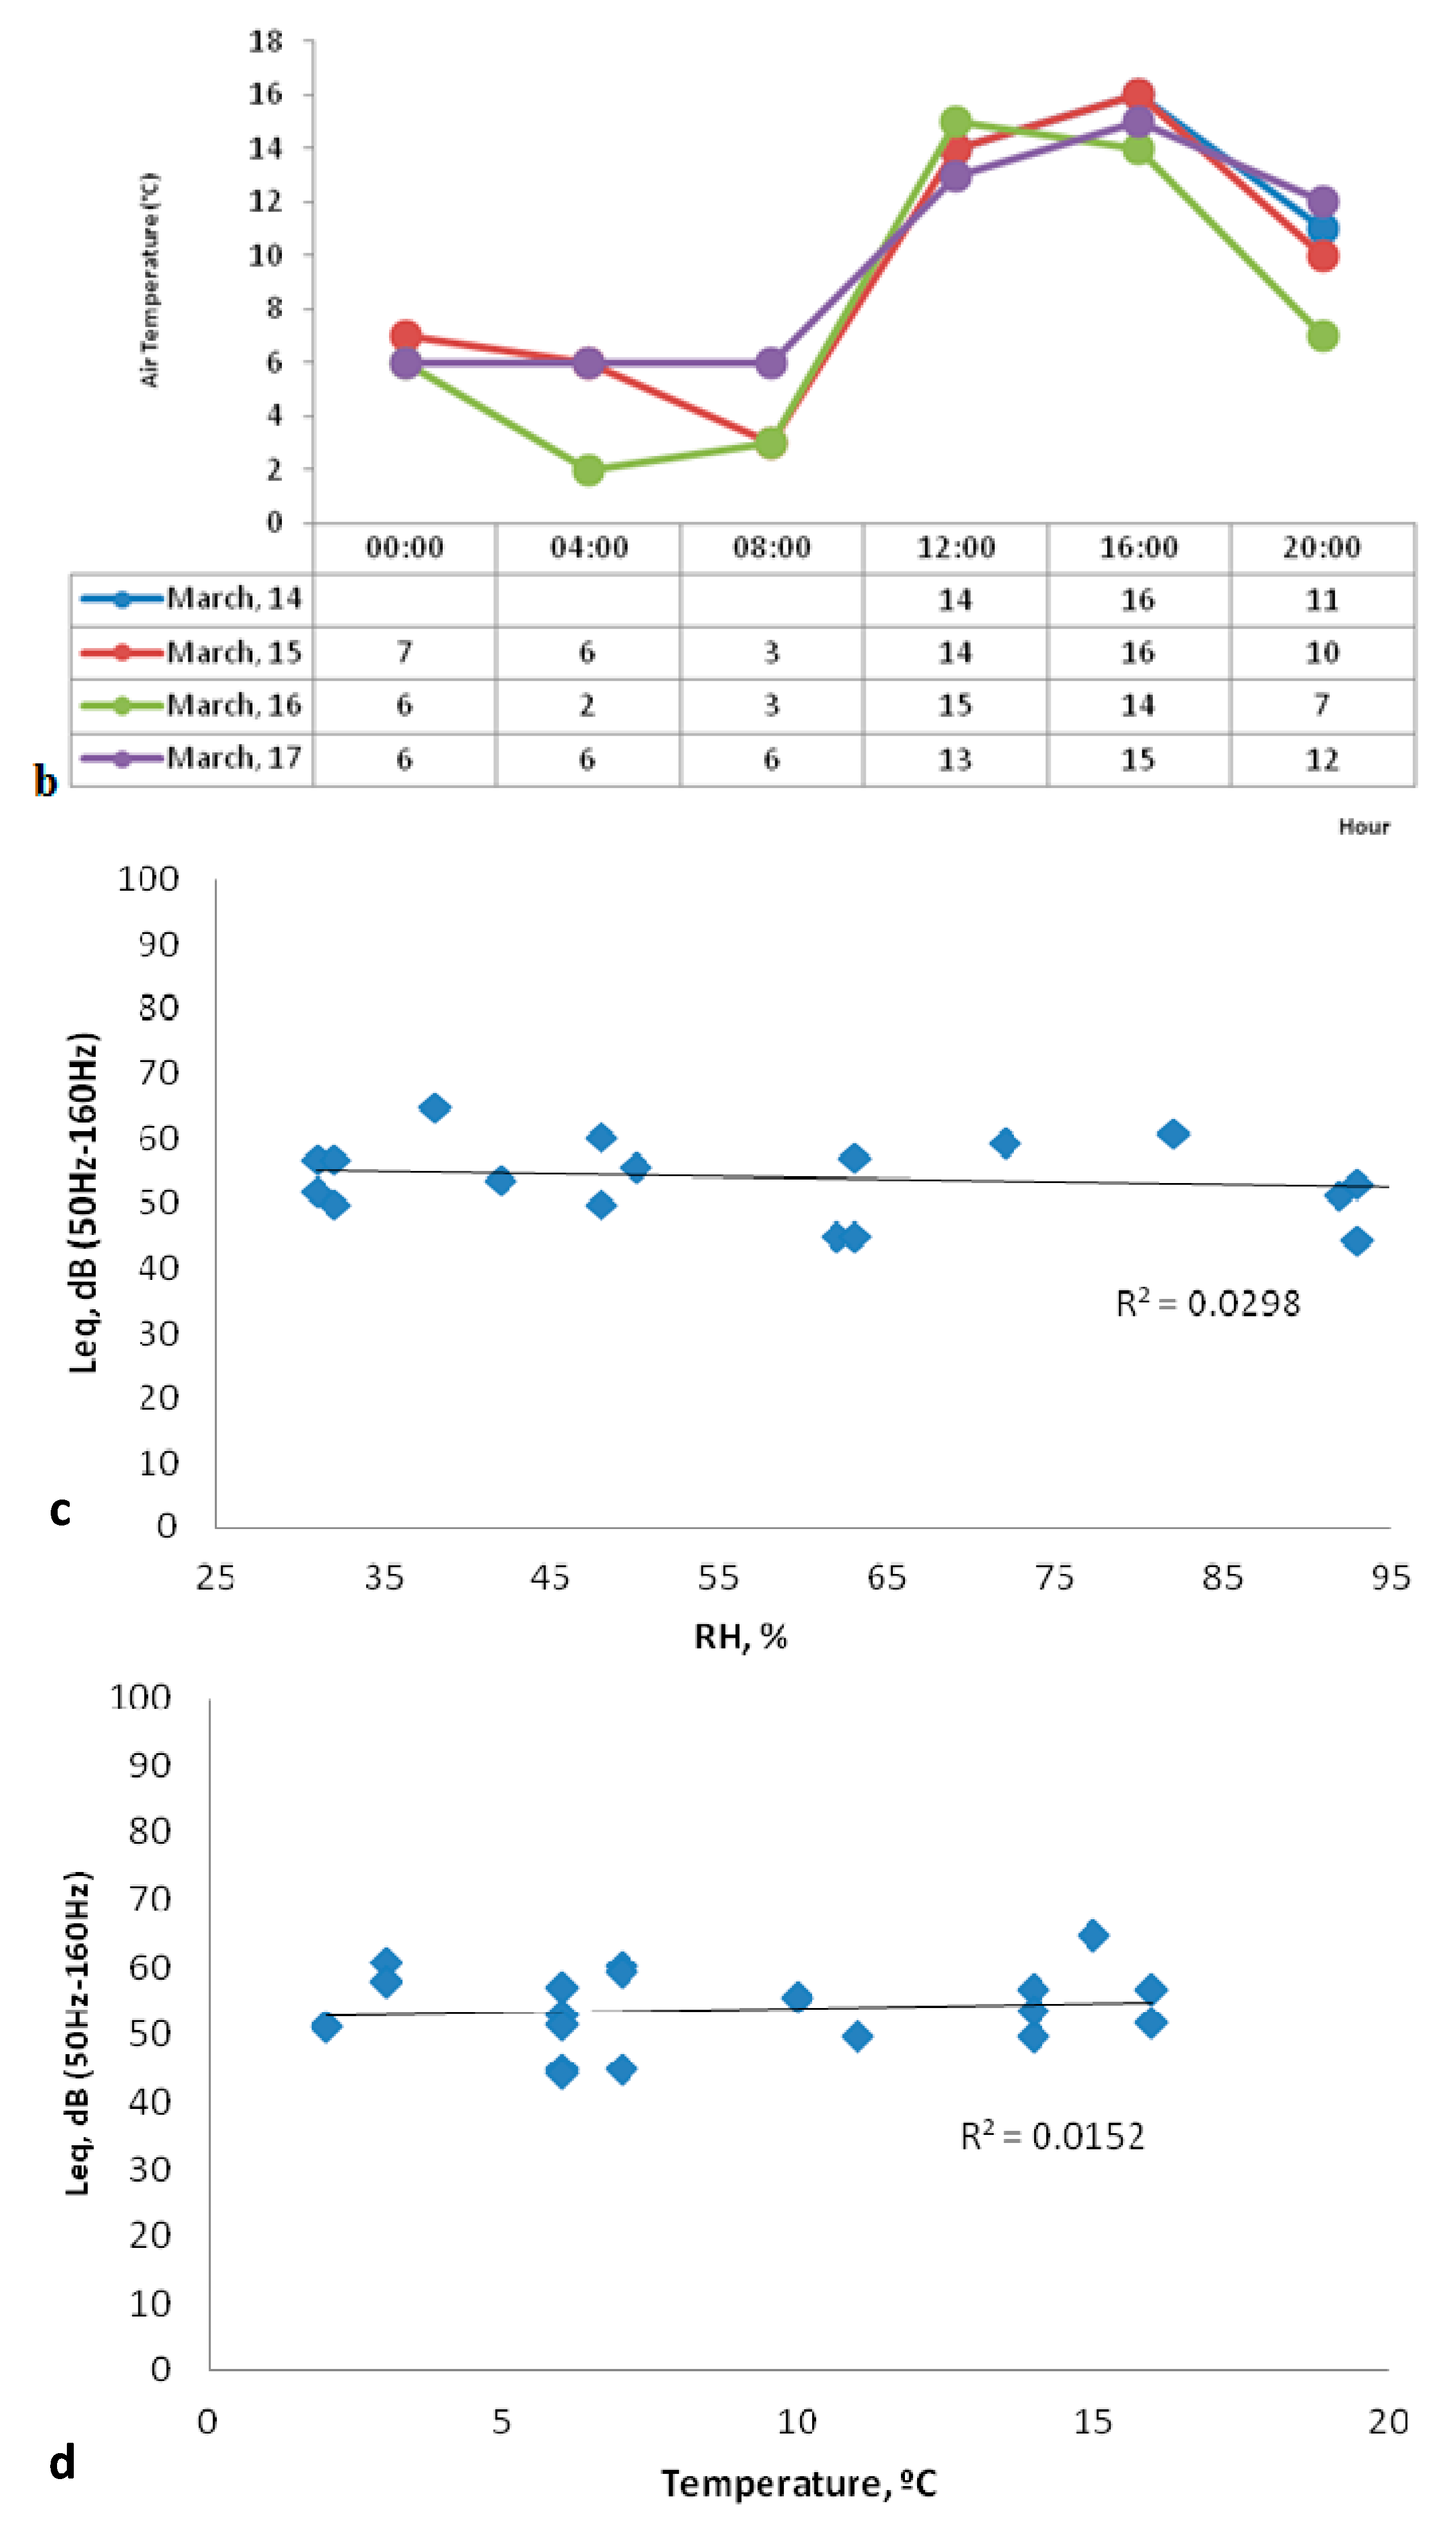
Table 8). Due to the high overdrive bands, an attempt was made to correlate the noise levels measured with the weather conditions. However, this was not possible (
Figure 15).
Figure 14.
Point M (a) Complete Measurement (b) Measurement per day and (c) Measurement at night.
Figure 14.
Point M (a) Complete Measurement (b) Measurement per day and (c) Measurement at night.
Figure 15.
Point M (
a,
b) Weather conditions [
34]; (
c) Relative humidity
vs. Leq (50–160 Hz) and (
d) Air temperature
vs. Leq (50–160 Hz).
Figure 15.
Point M (
a,
b) Weather conditions [
34]; (
c) Relative humidity
vs. Leq (50–160 Hz) and (
d) Air temperature
vs. Leq (50–160 Hz).
Table 8.
Point M—Fluctuating characteristics, percentage of time that L10–L90 ≥ 4 dB.
Table 8.
Point M—Fluctuating characteristics, percentage of time that L10–L90 ≥ 4 dB.
| Frequency (Hz) | 10 | 12.5 | 16 | 20 | 25 | 31.5 | 40 | 50 | 63 | 80 | 100 | 125 | 160 |
|---|
| L10–L90 ≥ 4 | 15.3 | 27.1 | 41.7 | 41.3 | 43.4 | 48.6 | 55.6 | 40.3 | 43.8 | 45.8 | 33.7 | 37.2 | 38.5 |
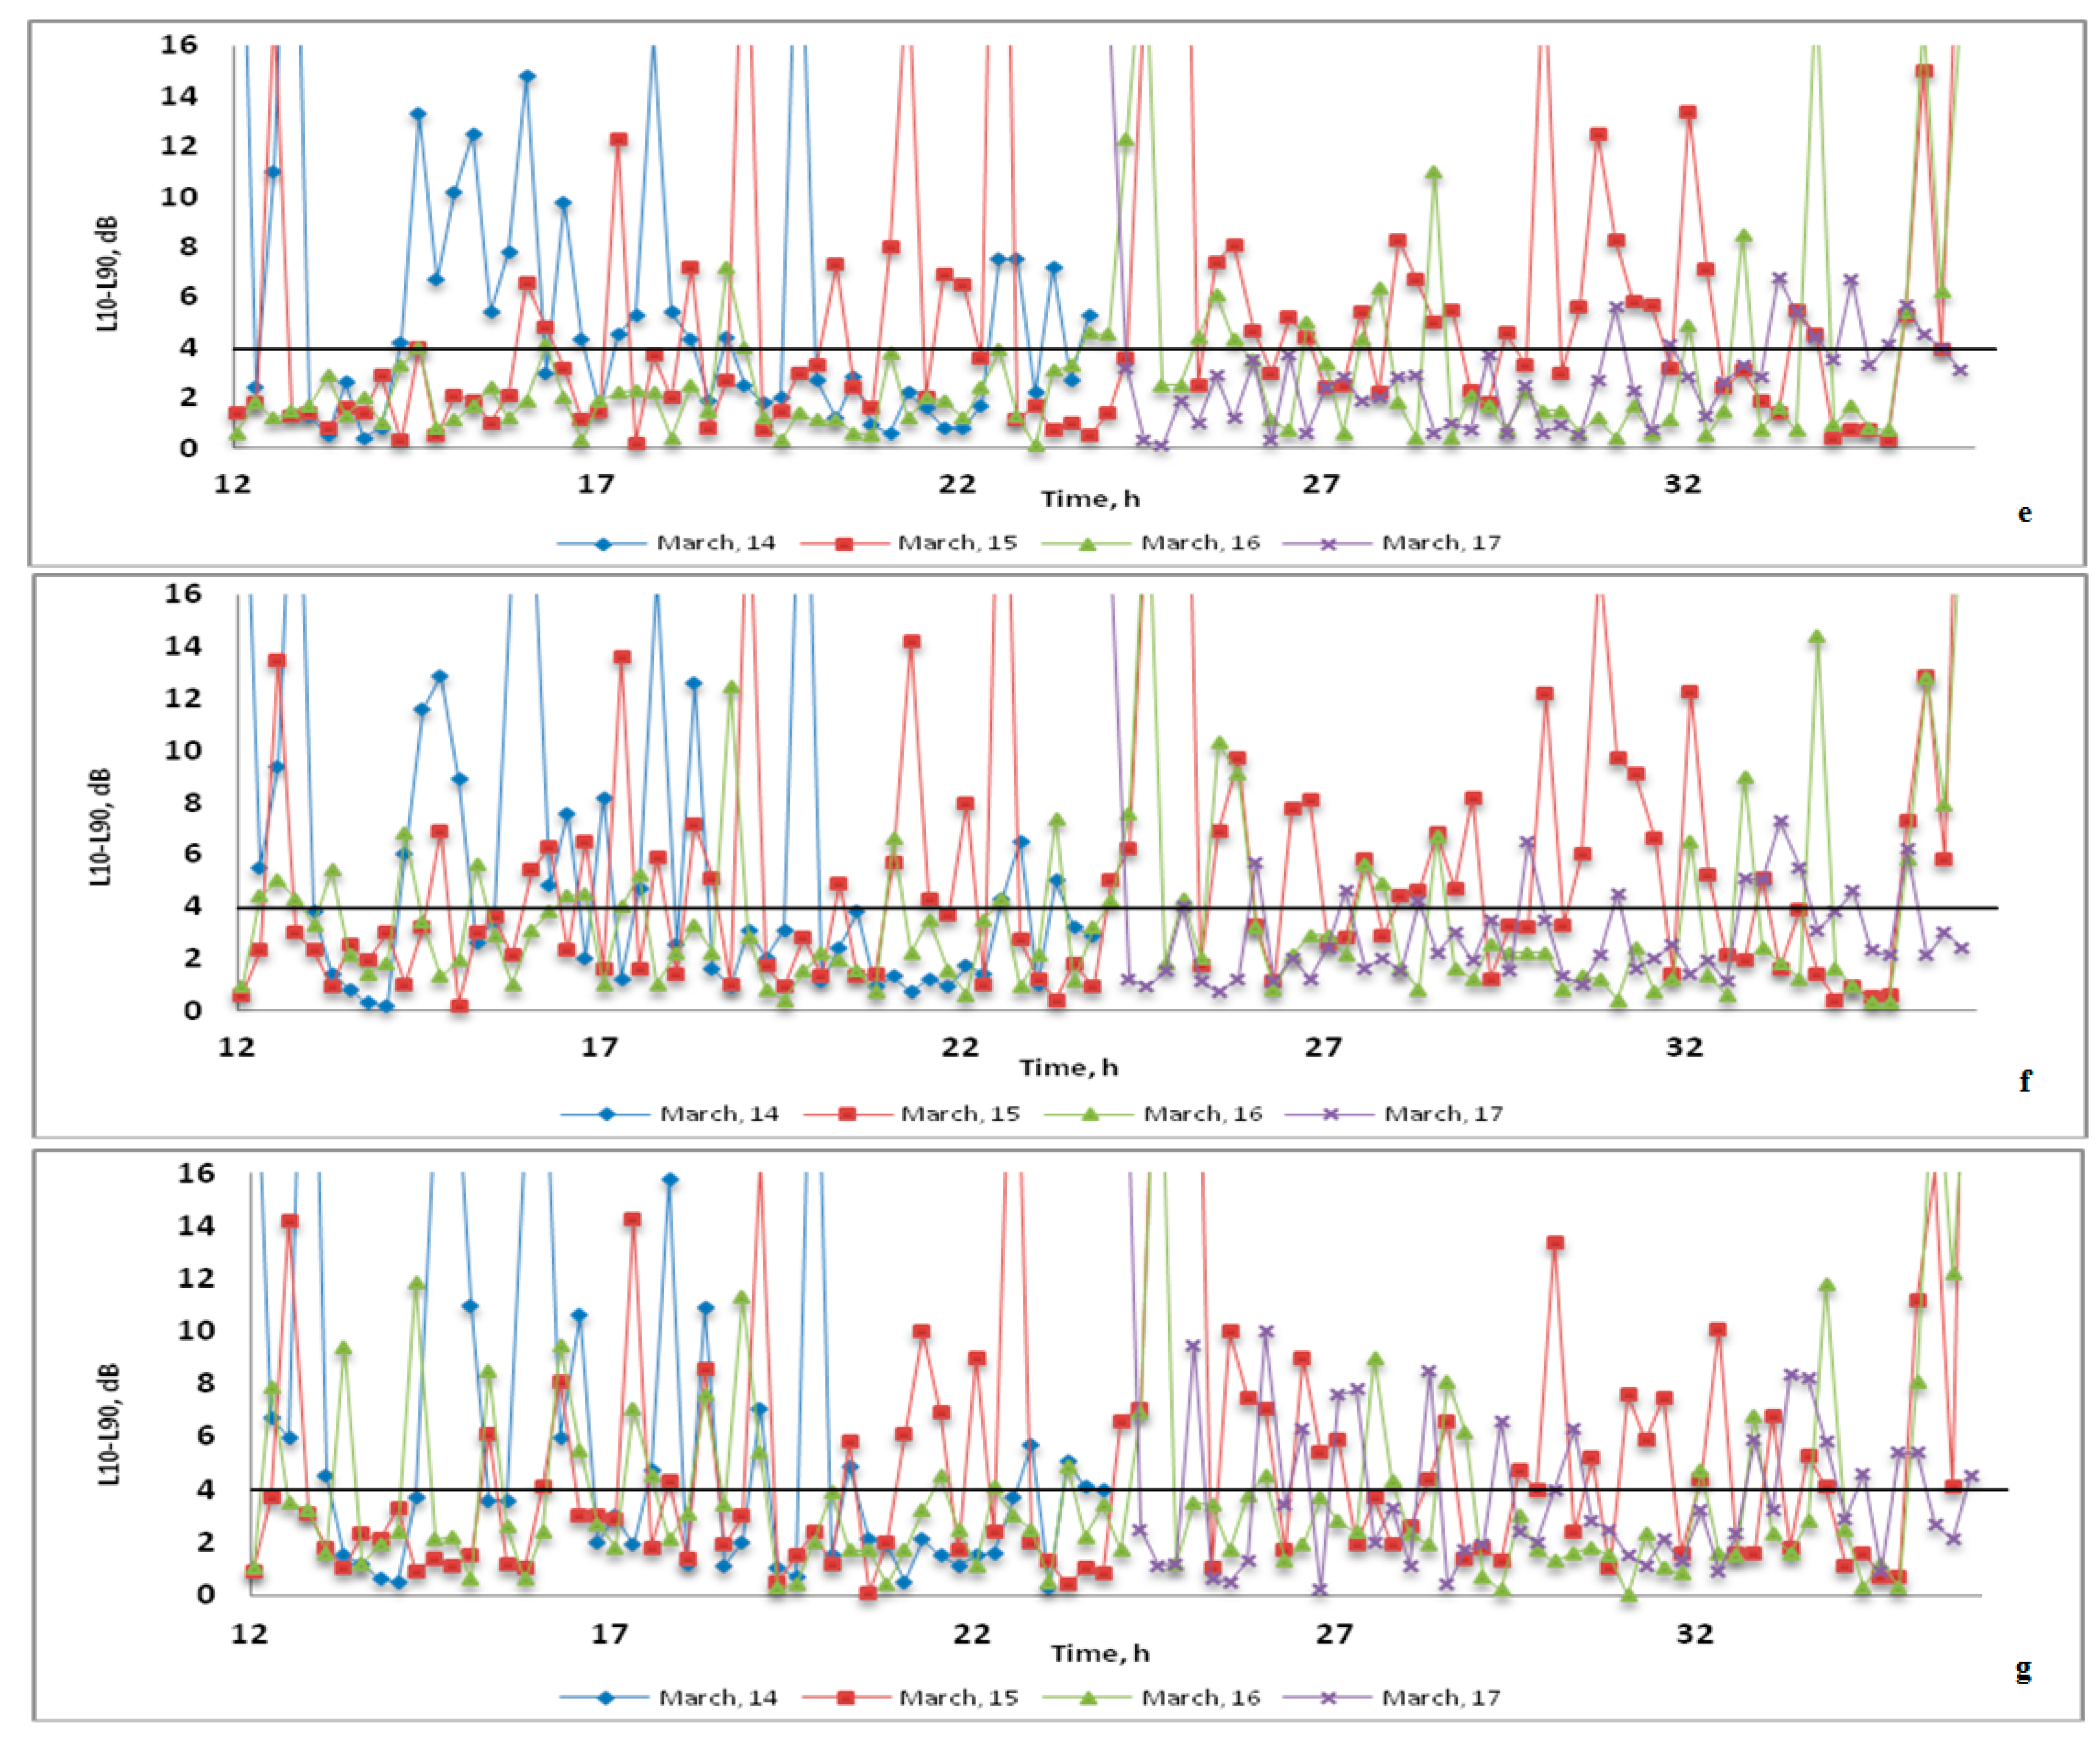
For the evaluation of the fluctuating characteristics of the noise, the L10–L90 difference was determined for periods of 15 min for the three days of measurement (
Table 8) and exceeded the frequency bands,
i.e., the 50–160 Hz range (
Figure 16). The exceeded frequency bands presented fluctuating characteristics for 55.6%, 40.3%, 43.8%, 45.8%, 33.7%, 37.2% and 38.5% of the measurement time, respectively, for the frequency bands of 40 Hz, 50 Hz, 63 Hz, 80 Hz, 100 Hz, 125 Hz and 160 Hz.
Figure 16.
(a) Point M—L10–L90—1/3 Oct 40 Hz; (b) 1/3 Oct 50 Hz; (c) 1/3 Oct 63 Hz; (d) 1/3 Oct 80 Hz; (e) 1/3 Oct 100 Hz; (f) 1/3 Oct 125 Hz and (g) 1/3 Oct 160 Hz.
Figure 16.
(a) Point M—L10–L90—1/3 Oct 40 Hz; (b) 1/3 Oct 50 Hz; (c) 1/3 Oct 63 Hz; (d) 1/3 Oct 80 Hz; (e) 1/3 Oct 100 Hz; (f) 1/3 Oct 125 Hz and (g) 1/3 Oct 160 Hz.
5. Evaluation of the Perception of Noise Discomfort
5.1. The First Approach
The residents of Serzedelo village have expressed their dissatisfaction with power lines in the area through their own initiative, the National Civic Movement Against High-Voltage Power Lines. In 2007, the village’s inhabitants filed a petition against the National Energy Company to bury the aerial power lines crossing the village, but to date, nothing has been done. Subsequently, in 2010, a team from the University of Minho (Portugal), supported by the local population and the leader of this movement, conducted an exploratory study in Serzedelo.
The study used two groups: a “near the source” group (118 individuals were interviewed) and an “away from the source” group (55 individuals were interviewed). The most frequent diseases identified were cardiovascular diseases (35.6% in the “near the source” and 42.6% in the other group), and depression (22.9% in the “near group” and 20.4% in the other group). However, there were no significant differences between the two groups [
11]. Additionally, self-awareness of general health was not perceived differently by the two groups. Perhaps these kinds of diseases could be related more to the influence of noise than to exposure to electromagnetic fields (power poles and power lines), which was the main focus of the study. Even if at that time the study did not focus on the influence of low-frequency noise pollution, it was concluded that only the “near source” group spontaneously mentioned that the noise was always present in their daily lives (in fact 9.3%), while there was no mention of the noise by residents of the group “away from the source”.
5.2. The Second Approach
According to the DEFRA Guidance [
12], persons living near the measurement points that mentioned discomfort due to noise should be interviewed to provide other background information to complement the analysis. For this reason, we interviewed three people that were engaged with the three points of measurement of the second approach. Two men and a woman were interviewed, aged between 40 to 70 years old, who had lived in Serzedelo village between 4 and 40 years. Two had a university degree, while the older person had been a postman for 25 years.
For all of them, the noise is continuous in periods of rain, with fog and wet weather. The following narratives express this perception.
In the evening, I hear a sound and during the day something that seems like sparks (Point L, female, 55 years old).
I hear a continuous hissing sound (Point J, male, 69 years old).
For all the respondents, noise has been heard continuously and coincides with the time of experience of living in Serzedelo, expressed in the following two narratives.
I have heard the noise since 1985, when this 400 kV power pole was installed (Point J, male, 69 years old).
I have heard the noise for several years or more since living in this house (Point M, male, 45 years old).
All the respondents reported that other people who lived with them or nearby hear noise, as did their wives, children, visitors and neighbors. The power poles are seen as the source of the noise by all the respondents.
The noise comes from electric poles placed to the north and south of the house (Point L, female, 55 years old).
The noise can be heard by respondents inside the house, in the living room, the bedroom and the kitchen. They mentioned that they have adopted strategies to alleviate the noise, such as “sleeping in a different room from the usual”, “sleeping in a different position or changing the bed position”, “using earplugs” or “going on vacation”. The discomfort caused by noise varies between the perceptions from “very uncomfortable” to a “little bother”.
6. Discussion
Although there is a study focused on the risk of death in Guimarães [
35], using 1997 and 2005 data, which was a response from the regional and local health authorities to the demands of the population of Serzedelo village and to the National Civic Movement Against High-Voltage Power Line demands this was not, in fact, a good solution to the problem. The study did not show significant differences in the risk of death and major causes of death in the population living in Serzedelo village, when compared to the north of the country and with Portugal as a whole. This happened because of the type of approach adopted. Mortality indicators are not sufficient to express the relationship between the low frequency noise, the electromagnetic fields and the different types of cancer as the diseases related to this type of exposure are currently those that involve a lower risk of death. Taking this into account, an approach is needed to address the mortality data which can be obtained by the general official statistics. This inference contradicts the solution that was given by the health authorities, as well as the need to conduct more comprehensive studies.
Compared with the reference values of the DEFRA Guidance [
12], noise from power poles exceeds the criterion curve. However, more measurements should be carried out in order to consider other factors that may influence the measured values. A survey investigating noise discomfort experienced by an exposed population, as well as knowledge of the population’s health status, and access to morbidity data could complement this analysis.
The concern with the characterization of the surrounding environment is one of the missing aspects in DEFRA methodology. The low-frequency noise levels can vary considerably within a room depending on the measurement location and this can occur when the room dimensions are similar to the wavelength of the sound at these frequencies. The weather seems to be another important aspect that could influence the noise propagation, therefore future research should include measurements both in dry and wet periods. A methodology by season may reveal other noise levels and different perceptions by the population about their discomfort.
7. Conclusions
At the moment we cannot fully answer the fourth question: “Can power poles and power lines affect human health?” This is a complex issue and requires further study. In particular, the issue needs to be developed closely by conducting population surveys. In Portugal, as there are no morbidity data on a village scale for the spectrum of diseases related to this type of problem, the only option is to interview the population. This will follow the same “near the source” and “away from the source” methodology and be based on other variables such as type and duration of exposure to the source, age, self-reported health status and presence of diseases that may influence, among others, depressive disorders and insomnia.
It can be concluded that there is a need to redefine the location range of “away from the source” and “near the source” groups. It makes more sense to opt for people who live far from the source than those who live closer, as they are likely to be less subjected to influences from other sources (e.g., homes with no crossing of highways, people with a fairly healthy diet and a no-stress lifestyle) and residences in rural areas.
No association was found between weather conditions and the noise levels measured. However, we believe that the relationship between low frequency noise levels and weather conditions such as relative humidity, rainfall and wind direction exists, and should be studied to complement this analysis. All environmental characteristics should be taken into account (type of terrain, proximity to other sources of noise, existence of obstacles and factors that facilitate the propagation of noise), especially due to the peculiar characteristics of high propagation of low-frequency noise and its low absorption by materials and the environment.
The limitations of research of this nature focus mainly on assigning disturbing effects on human health to a single factor. Health status is a complex factor that involves multiple aspects, such as lifestyle, as well as genetic and environmental factors. A single indicator may not put into perspective the magnitude of the health problems. Future research along these lines should consider these issues.
Additionally, case-control type studies seem to be the most appropriate for continuing this type of research. It is essential to keep track of the daily lives of the interviewees and monitor their lifestyles (e.g., diet and sleep quality), aspects related to labor dynamics (e.g., the history of activities performed, type of activity currently carried out), genetic predisposition (e.g., history of disease cases in the closest family circle), characterization of the house structure (e.g., position of the bedroom in the residence and amount of electronic equipment). This last item should be thoroughly analyzed. In addition to their bedrooms, where the interviewees spend much of the night, the rooms where they spend most of their time during the day and evening should also be studied in-depth.
This research is part of a more structured investigation that was started in 2009 at the University of Minho, which focused on the influence of low-frequency noise and electromagnetic fields on human health.


