1. Introduction
Thermal conditions in street canyons are important topics of urban microclimate, which influence the building’s energy demand and have a large impact on thermal comfort and on the health of people [
1]. The reduction of energy consumption in buildings is a priority in the objectives “20-20-20” in the field of energy efficiency and Directive 2010/31/EU falls into this desire by offering guidelines for the Member States relating to the provision efficiency of buildings [
2,
3]. Surface temperature distribution and air circulation play an important role in heat exchange between the building and canyon air, which in turn influences pedestrian comfort and the energy demand of buildings. The landscape of dense urban areas can be described by units of street delimited by two continuous rows of buildings to form a “canyon”. Several studies have been performed on different street canyons, through numerical simulations [
4,
5], wind tunnel experiments [
6], measurement campaigns [
7,
8] and pollution transport studies [
9,
10,
11,
12,
13,
14], the impact of surface heating on the flow field and on the exchange has been analyzed. The design of an urban canyon, defined as a stretch of road, relatively narrow and bounded on both sides in the longitudinal direction by continuous buildings, has a key role for the outdoor thermal comfort. It is a function of geometrical parameters, such as the average height H of the buildings facing on the roadway, the width W and the length L of the canyon. These parameters can affect the exchange of air mass and they can increase the concentration of pollutants generated by different human activities such as vehicular traffic and the heating of buildings. Also, the ratio of height to width and the canyon orientation affect the timing and magnitude of the energy regime of urban surfaces, which in particular influence the air temperature within the canyon. The study [
15] focused on radiation fluxes, shows the importance of the shading towards the reduction of the radiant heat gained from human body when compared to a person standing in a fully exposed location. Other studies [
5,
6,
8,
16,
17,
18] highlight the importance of canyon geometry in outdoor thermal comfort, which depends on the short and long-wave radiation fluxes from the entire surroundings of human beings. The goal of this study is to analyze how the flow field structure is affected by the H/W ratio and the effects of the heating of the façades on several planes of interest within the canyon, the evaluation of tridimensional effects on the flow field has been carried out. The analysis of the flow field within the canyon has been conducted with computational fluid dynamics (CFD) simulations performed during summer days, because, during this period, weather conditions affect human activity much more than during the winter season. The thermal field is induced by setting up the solar radiation module, the ambient conditions and thermo physical properties values of the buildings and the ground.
2. CFD Numerical Model
In this section the CFD numerical model that we have used to perform the simulations, is outlined. Further details on numerical model and on boundary conditions, not discussed in this paper, are listed in other papers [
19] in which are used the same settings of CFD numerical model. Using the commercial CFD code ANSYS Fluent 14.0 [
20], 3D double precision, pressure based version, the steady Reynolds-averaged Navier-Stokes (RANS) equations have been solved in combination with the standard k-ε model; the governing equations can be expressed as follows:
where
is the average speed of air flow;
is the Reynolds stress;
is the air density;
is the molecular viscosity;
is the thermal-induced buoyant force;
is the potential temperature;
is the heat diffusivity. The standard k-ε model has been used to solve the turbulence problem. The standard k-ε model produces, as a result, an excessive turbulent kinetic energy in fluxes with considerable strong recirculating motions. However, in [
21], various turbulence model are tested and it’s shown that more advanced models when compared with the standard k-ε model do not lead to relevant improvement, when the flow field has a significant longitudinal component. The turbulence kinetic energy,
, and its rate of dissipation,
, are obtained from the following transport equations:
where
is the generation of turbulence kinetic energy due to the mean velocity gradients;
is the generation of turbulence kinetic energy due to buoyancy;
,
constants and the
and
expressions are reported in the standard k-ε model of ANSYS Fluent 14.0.0 [
20];
and
are the turbulent Prandtl numbers for
and
, respectively.
The degree to which ε is affected by the buoyancy is determined by the constant C
3ε. In ANSYS Fluent [
20], C
3ε is not specified, but is instead calculated according to the following relation:
where
ν is the component of the flow velocity parallel to the gravitational vector and
u is the component of the flow velocity perpendicular to the gravitational vector [
5]. To evaluate the impact of thermal effects, the natural convection module has been activated by setting incompressible ideal gas model for air density. Based on the best practice guidelines by Franke
et al. [
22] and Tominaga
et al. [
23], the computational domain has been extended beyond the built area by 5H in the North, West and South direction, of 15H in the East direction. The upper boundary condition is located at distance of 5H above the building roofs. These dimensions have been chosen to take into account of the blockage ratio and to ensure the flow re-development behind the building region. The temperature surfaces has been obtained as result of the heat transfer calculations, setting up: the solar load module, the temperature of undisturbed air (303 K), and the internal temperature of buildings (299 K). To simulate the ground influence, the computational domain has been extended 5 m below the ground level. The ground has been simulated setting the following parameters: density = 1000 kg/m
3; specific heat = 1000 J/kg
∙K; thermal conductivity = 2 W/m∙K; temperature at −5 m = 288 K; emissivity = 0.9; solar radiation absorptivity (direct visible and infrared) = 0.8. The radiation exchanges has been evaluated setting up the S2S radiation model, in which the energy exchange parameters are accounted by a geometric function,
i.e., view factor, and activating the solar ray tracing in the solar load model, provided in ANSYS Fluent version 14.0.0. Transient heat conduction in ground and walls has been analyzed in [
19]. This study finds that these effects are important to calculate heat fluxes, but not for surface temperatures which influence the natural convection flow fields. Furthermore, the materials characteristics have been reported in [
22,
23]:
i.e., the building walls have: density = 1000 kg/m
3; specific heat = 1000 J/kg∙K; thermal conductivity = 0.15 W/m∙K; thickness = 0.30 m; internal air temperature = 299 K; emissivity = 0.9; solar radiation absorptivity (direct visible and near infrared) = 0.8. To ensure a high quality of the computational grid, it is fully structured and the shape of the cells has been chosen hexahedral. The velocity profile has been set giving a uniform velocity magnitude at the velocity inlet boundary, the turbulence intensity at 10% and the roughness length
. As the flow approaches the built area the velocity inlet profile is fully-developed before reaching the buildings [
19] and it can be represented by Equation (7), where
is the friction velocity,
is the Von Karman constant (0.4) and z is the height coordinate. This equation represents the wind velocity profile of the inlet flow, when the wind approaches the buildings. In another study [
19], it is shown that the profile reaches the asymptotic velocity when it reaches about 4 m in height.
The aerodynamic roughness value
z0 has been set in relation to the roughness parameters in the ground surface boundary conditions (Ramponi and Blocken [
24]): the sand-grain roughness height Ks and the roughness constant Cs. According to the best practices guideline for the CFD simulations by Franke
et al. [
22] and Tominaga
et al. [
23], setting
Ks = 1 m and
Cs = 0.5, we obtain
z0 = 0.05 m (Blocken
et al. [
25], ANSYS Fluent User’s Guide [
20]), that has been considered an appropriate value to represent the roughness of the outer region (Blocken
et al. [
25], Norris and Richards [
26]).
The friction velocity value has been obtained by the correlation with the calculated value of the turbulent kinetic energy (
) at the first node above the ground, as shown in Equation (8) [
22].
where
.
3. Results
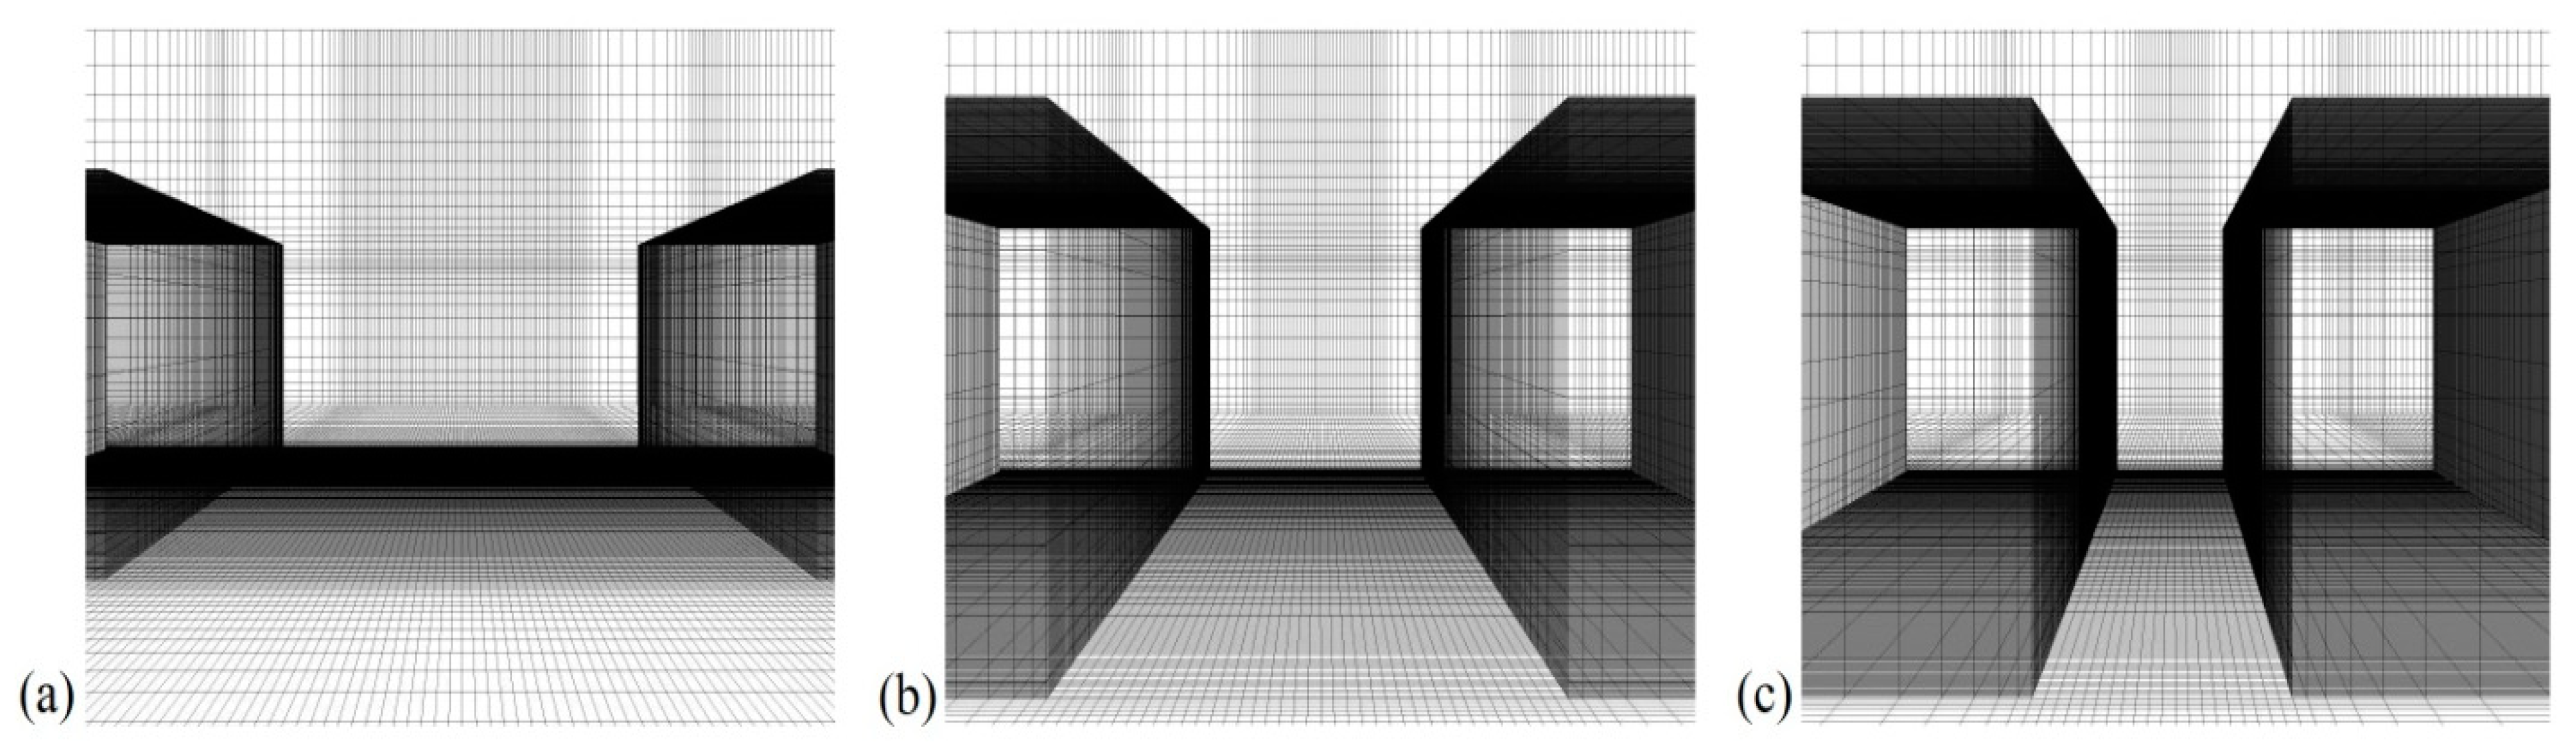
The impact of H/W ratio and thermal effects on thermo fluid dynamics parameters has been studied performing six simulations on three street canyon models characterized by H/W = 0.5, 1, 2 respectively (
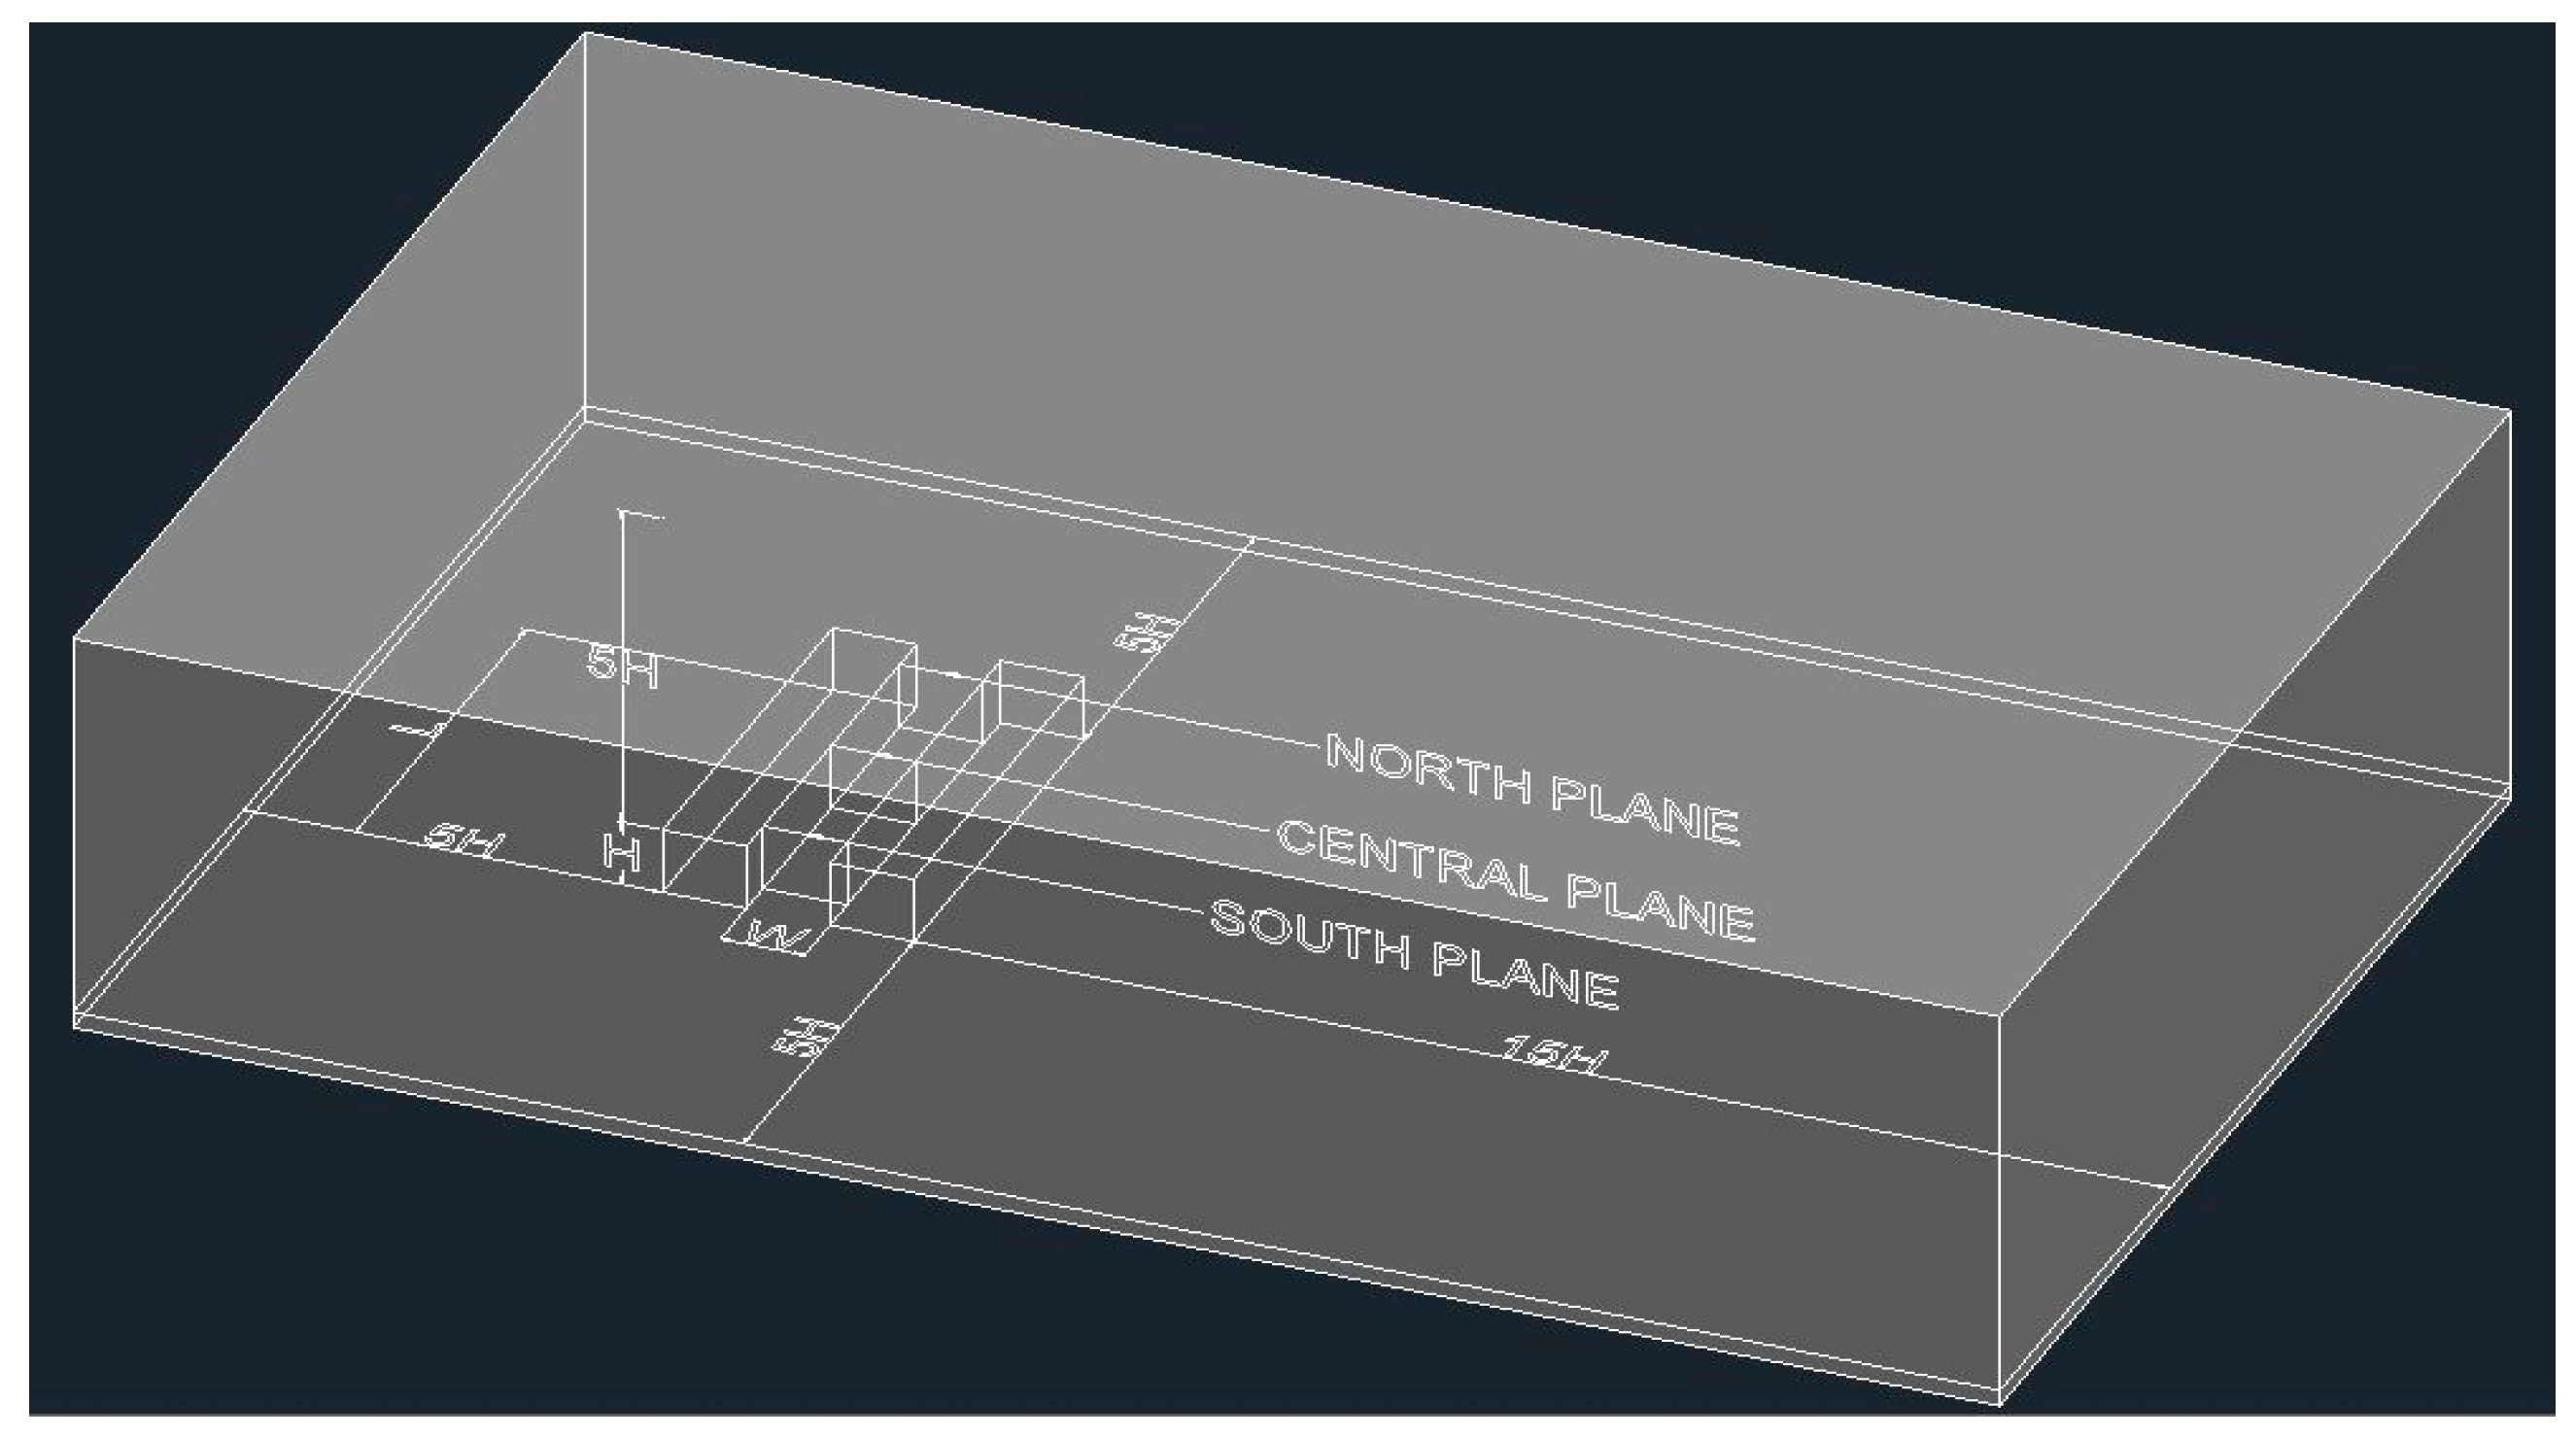
Figure 1). The canyons are placed in Milan (longitude: 9.18, latitude: 45.47, UTC: +1) and their orientation is North/South. They are flanked by identical buildings having the following dimensions: height (H) = 20 m, length (L) = 100 m and three different widths (Wb) = 40m; 20 m and 10 m, in
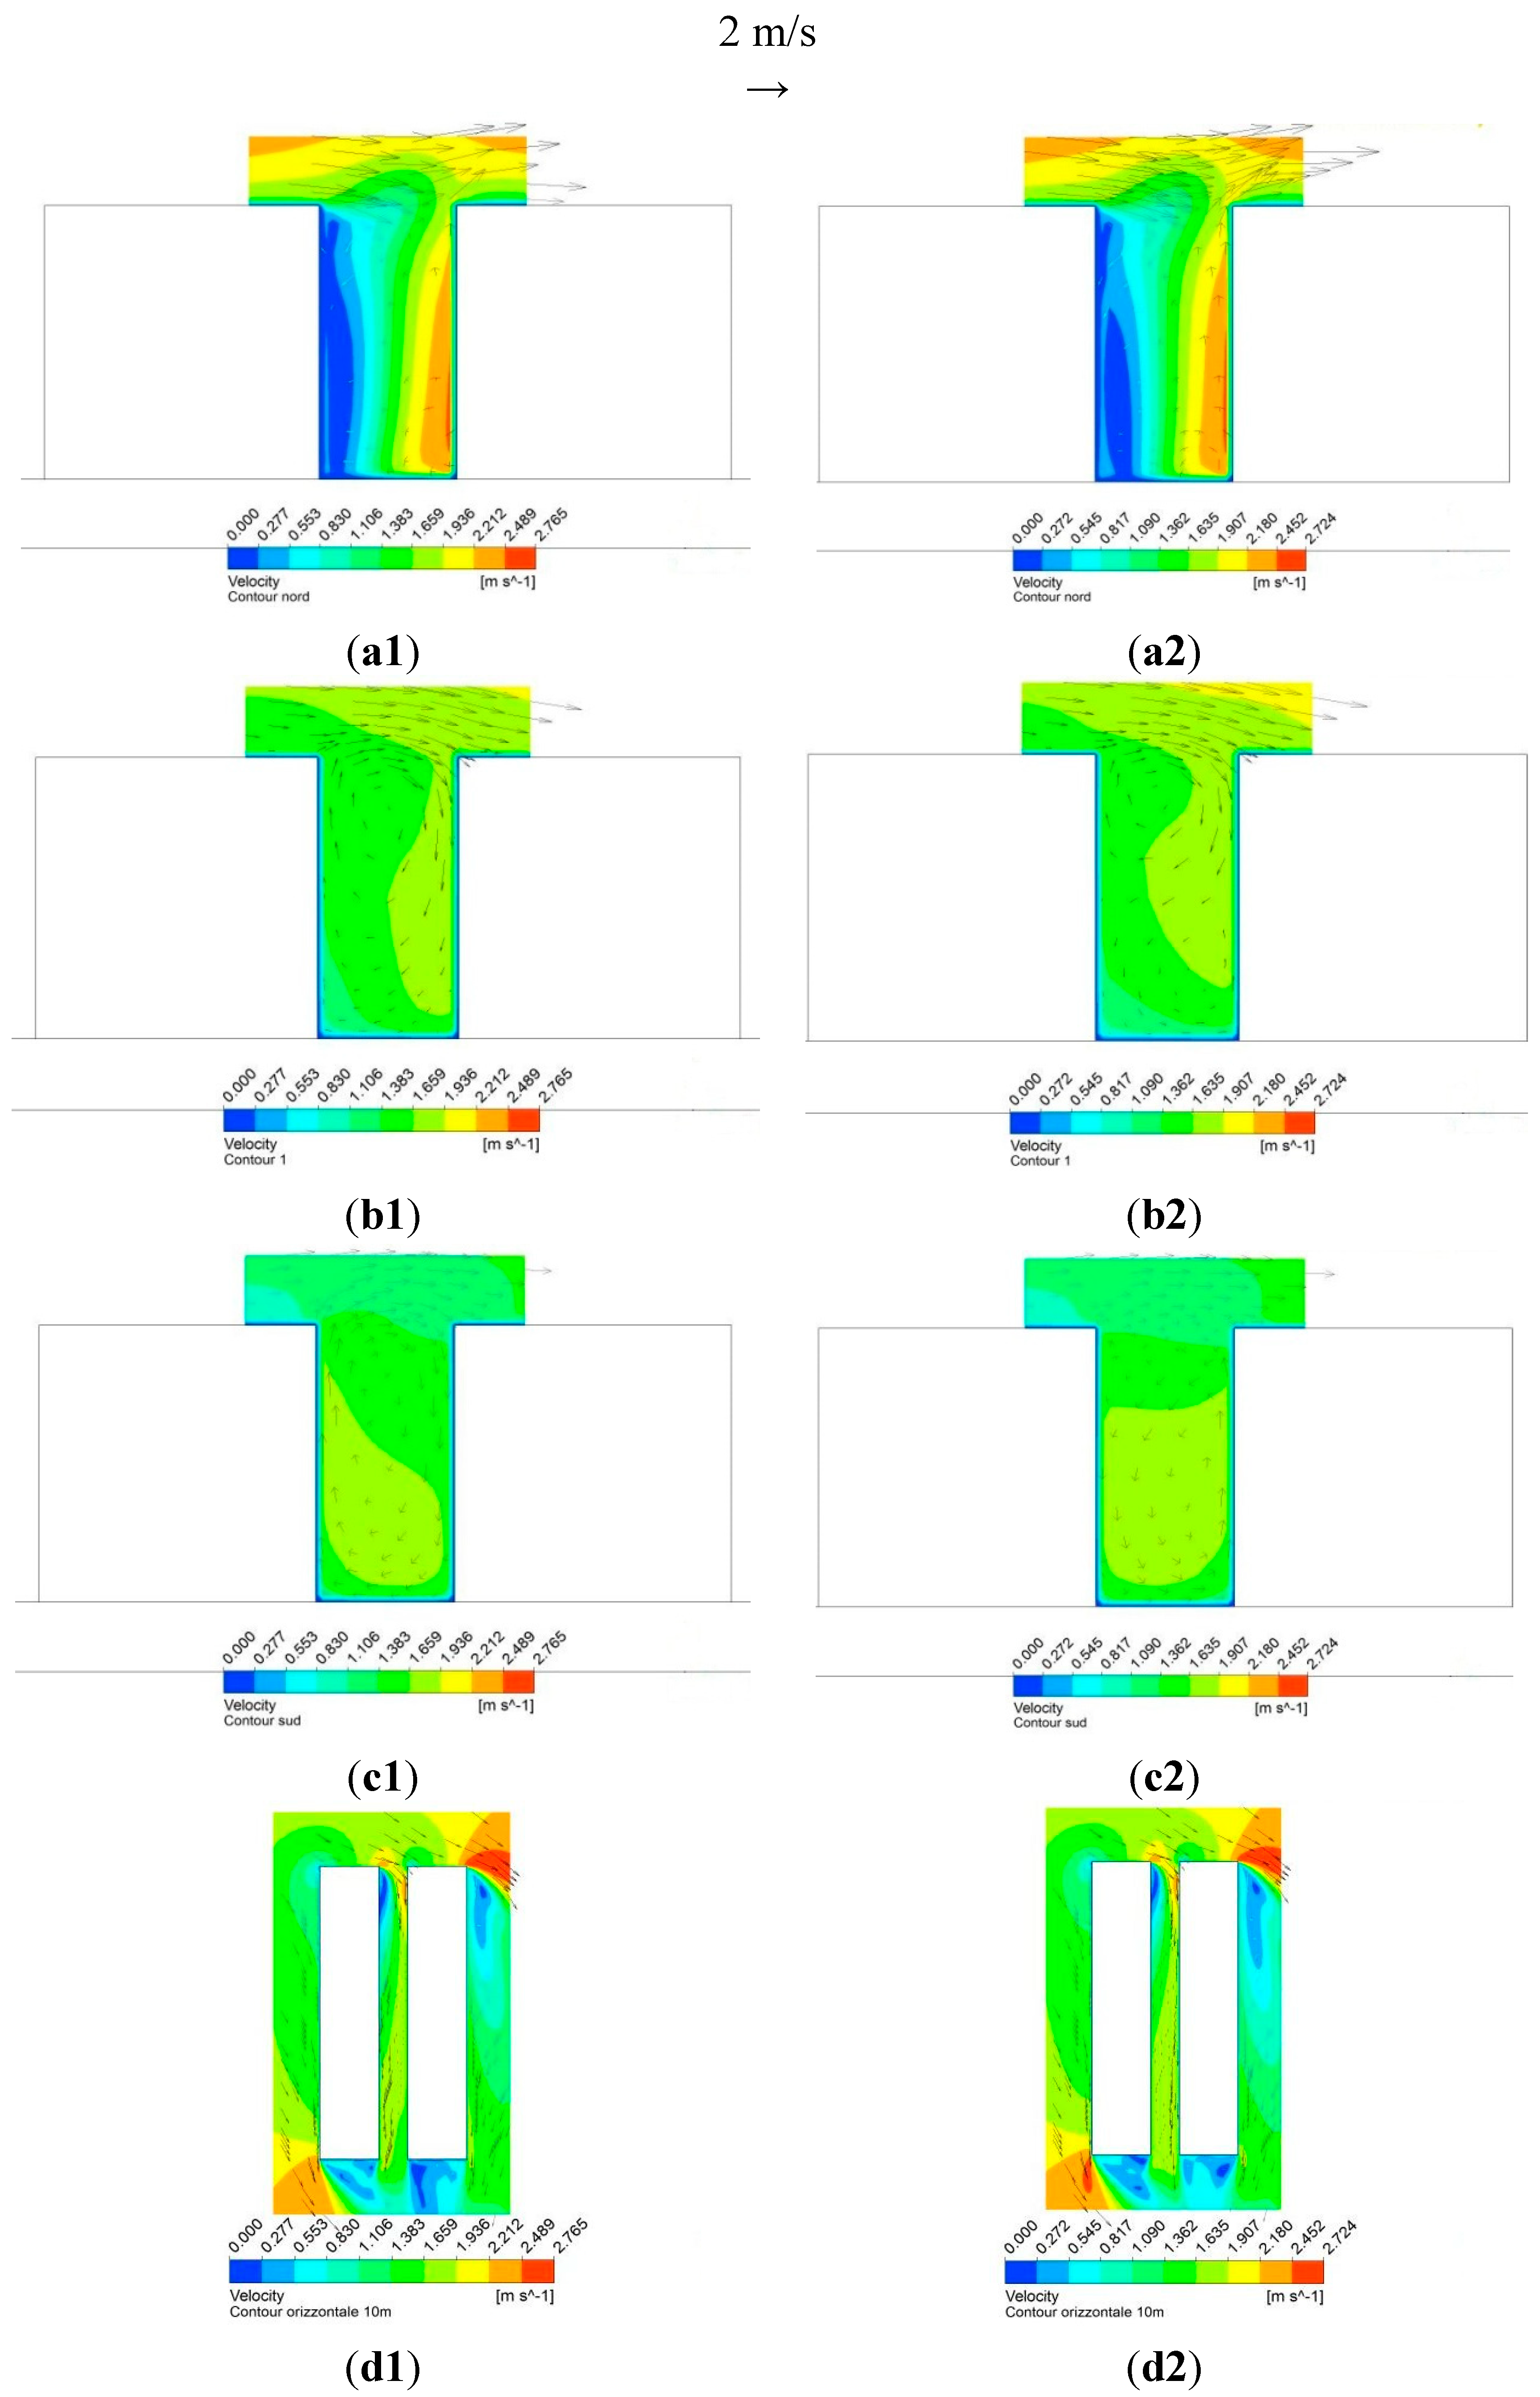
Figure 2 we can observe the computational domain. The flow regime impacting on the built area is described by a velocity inlet magnitude of 2 m/s and a wind direction of −45° N. The simulations have been performed in steady case at two different hours of the day: 11:00 and 14:00 of 21 July, as given by the software meteorological file, so that at 11:00 the windward façade is in shadow, instead at 14:00 it is exposed to sun radiation. For an isolated 3D street canyon, the three dimensional effect of the flow is evident in the formation of a spiral flow, produced by the combination of the downward vertical vortex and the longitudinal component of the wind velocity, as reported in other 3D simulations [
21,
27,
28]; they found that the wind field in urban areas is quite complex and the simulated wind speed intensities can be totally different from the measured data. To evaluate the impact of H/W ratio on the thermal and flow field within the canyon, three vertical planes of interest between the buildings have been considered: North, Central and South plane, placed respectively at 10 m from the north opening, in the middle of the canyon and at 10 m from south opening. The analysis has been conducted graphically, evaluating velocity vectors on the planes of interest. In
Figure 3,
Figure 4 and
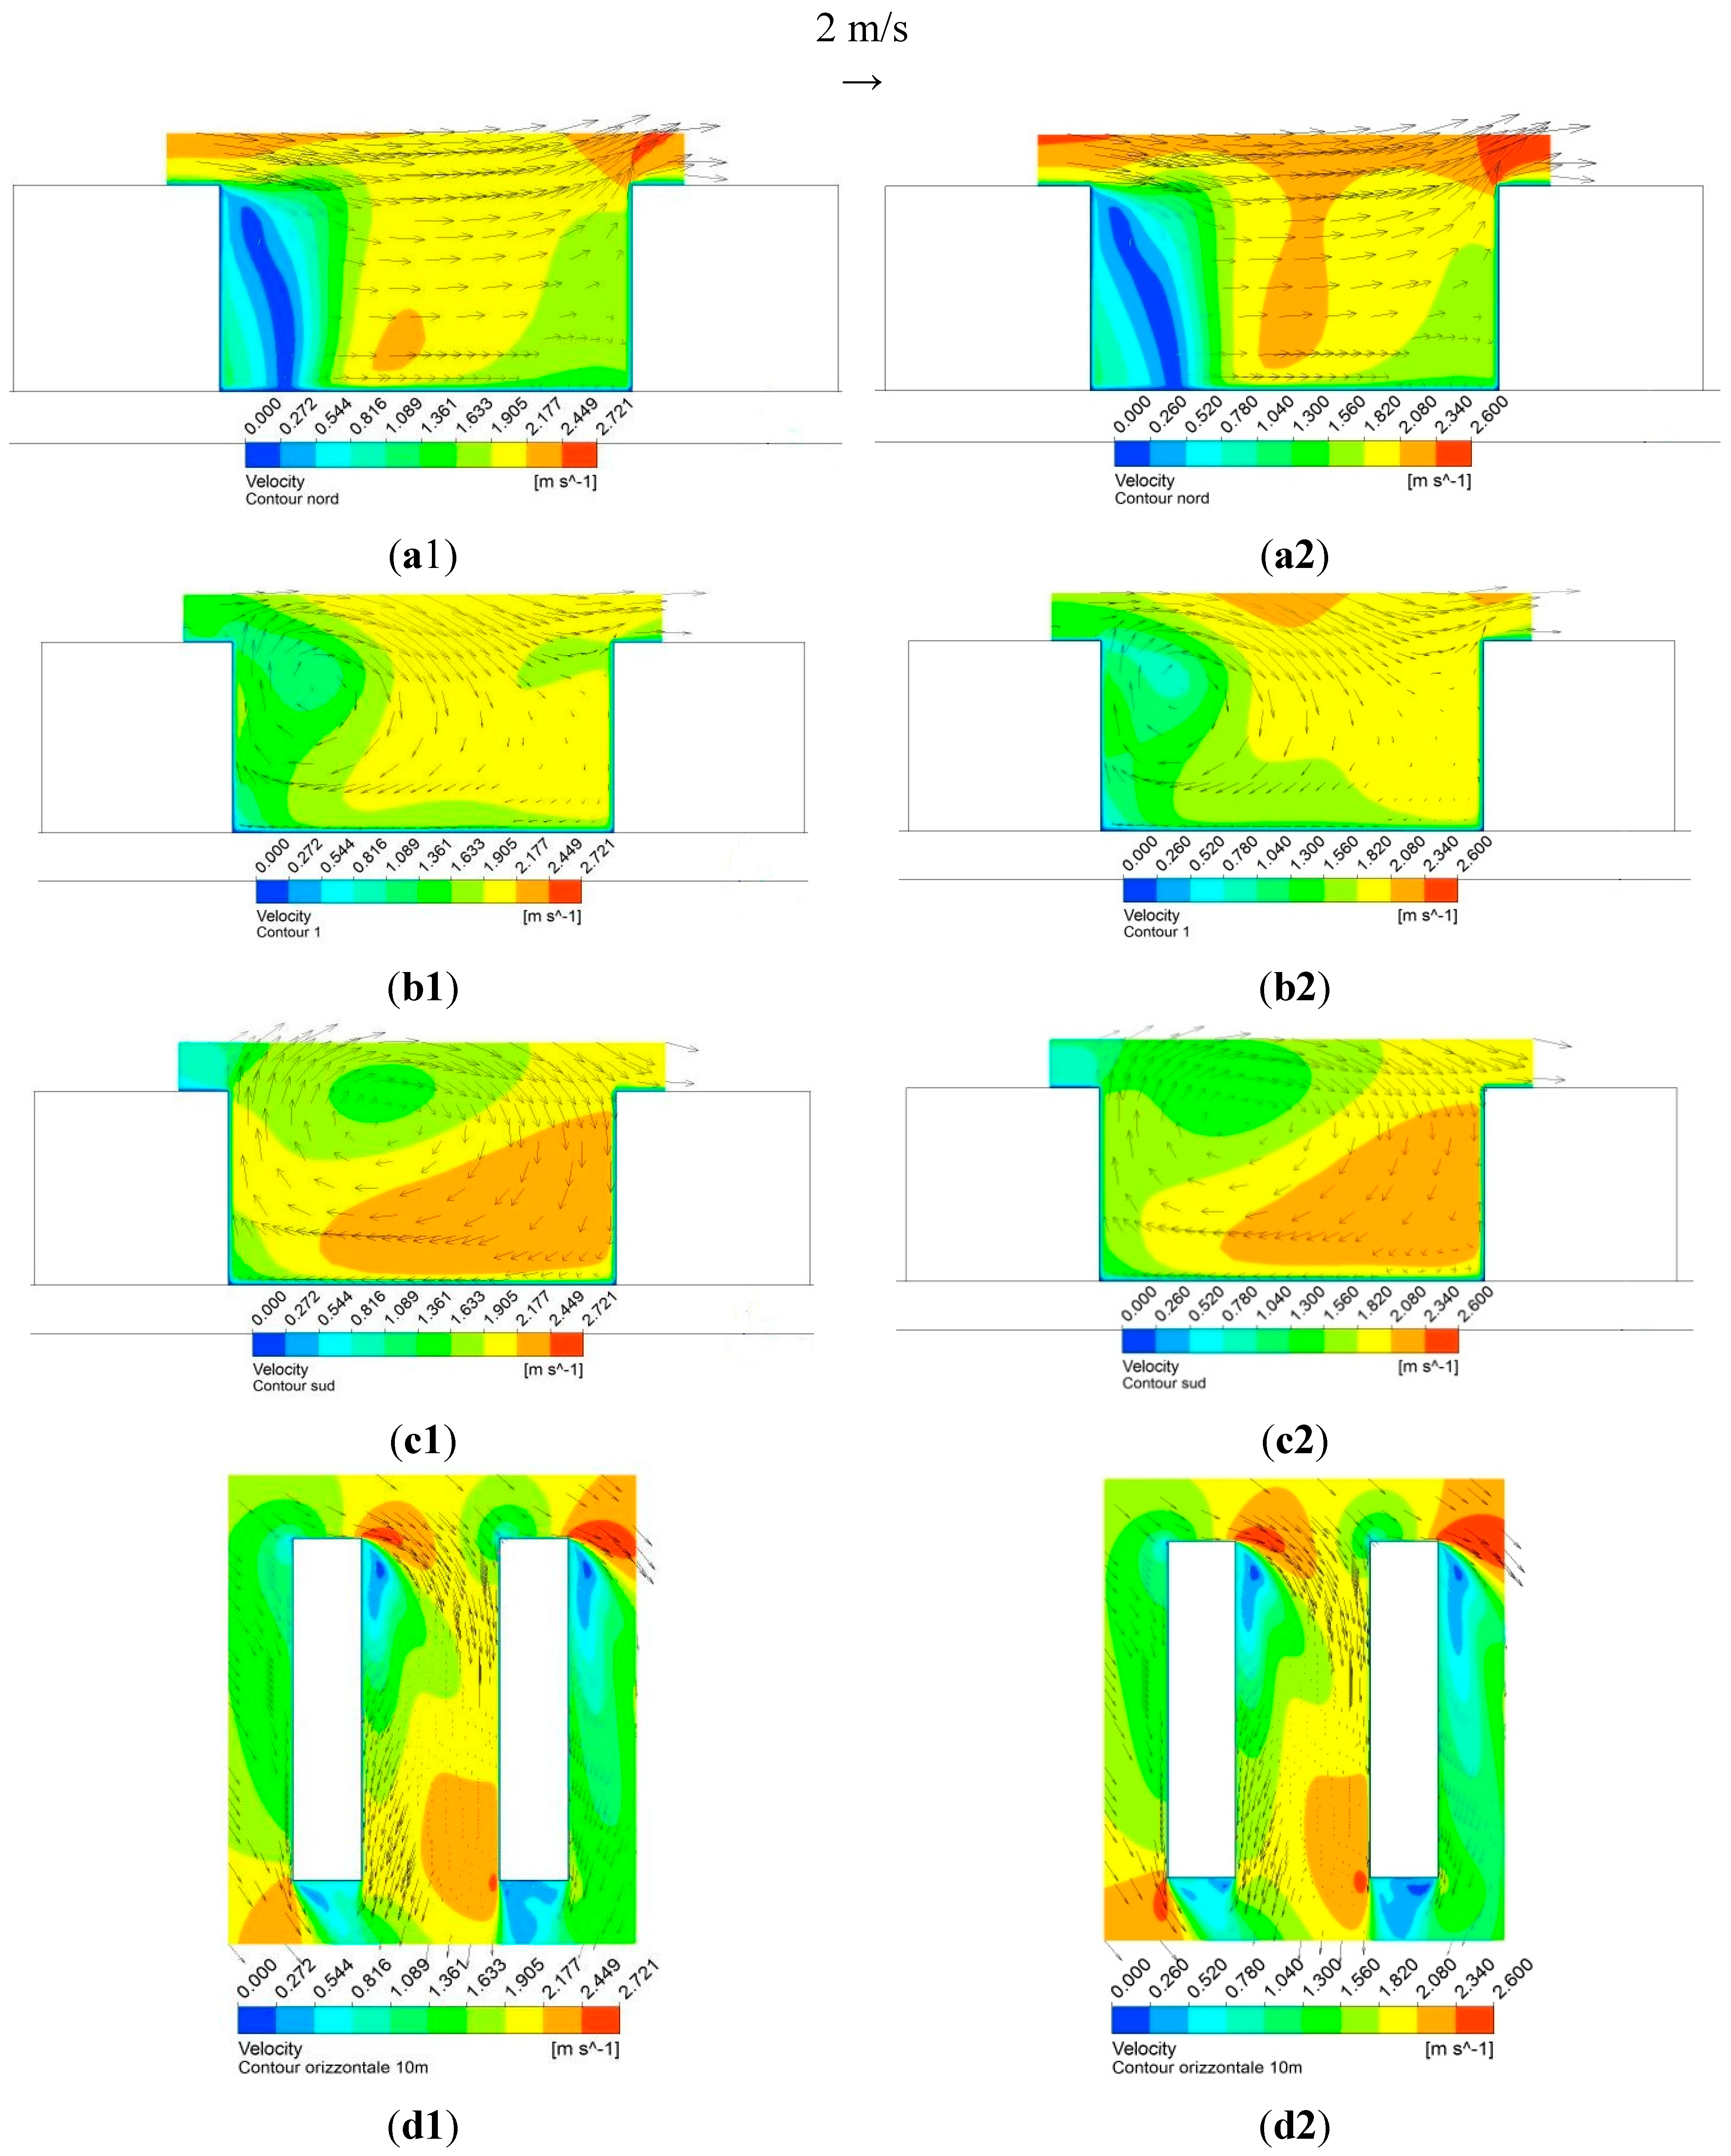
Figure 5 are reported the XZ velocity vectors on the three planes of interest at 11:00 and 14:00, for H/W = 0.5, 1, 2 respectively. The leeward façade (westerly building) is on the left side of the figures, instead the windward façade (easterly building) is on the right side. For simulations performed at 11:00, the flow pattern changes significantly from the north opening to the Central plane, instead, from the Central plane to the South one, the flow pattern remains basically constant (
Figure 3a1,b1,c1,
Figure 4a1,b1,c1 and
Figure 5a1,b1,c1). At the North plane the flow field structure is the same for the two hours considered, for each H/W street canyons. In particular, the flow field is characterized by an aerodynamic vortex in the upper corner of the plane, near the leeward façade (
Figure 3a1,a2,
Figure 4a1,a2 and
Figure 5a1,a2). This vortex is generated by geometrical discontinuities (the roof and the vertical corner of the left building) and its axis is parallel to the canyon direction. From Central plane to the South plane, the aerodynamic vortex coming from the roof is fully-formed and it occupies all the space between buildings.
Figure 1.
Views of the computational grids of the street canyons: H/W = 0.5 (a); 1 (b); 2 (c).
Figure 1.
Views of the computational grids of the street canyons: H/W = 0.5 (a); 1 (b); 2 (c).
Figure 2.
View of the computational domain.
Figure 2.
View of the computational domain.
Figure 3.
XZ velocity vectors on North plane (a); Central plane (b); South plane (c); horizontal plane (d) at 11:00 (subscript 1) and 14:00 (subscript 2), for street canyon H/W = 0.5.
Figure 3.
XZ velocity vectors on North plane (a); Central plane (b); South plane (c); horizontal plane (d) at 11:00 (subscript 1) and 14:00 (subscript 2), for street canyon H/W = 0.5.
Figure 4.
XZ velocity vectors on North plane (a); Central plane (b); South plane (c); horizontal plane (d) at 11:00 (subscript 1) and 14:00 (subscript 2), for street canyon H/W = 1.
Figure 4.
XZ velocity vectors on North plane (a); Central plane (b); South plane (c); horizontal plane (d) at 11:00 (subscript 1) and 14:00 (subscript 2), for street canyon H/W = 1.
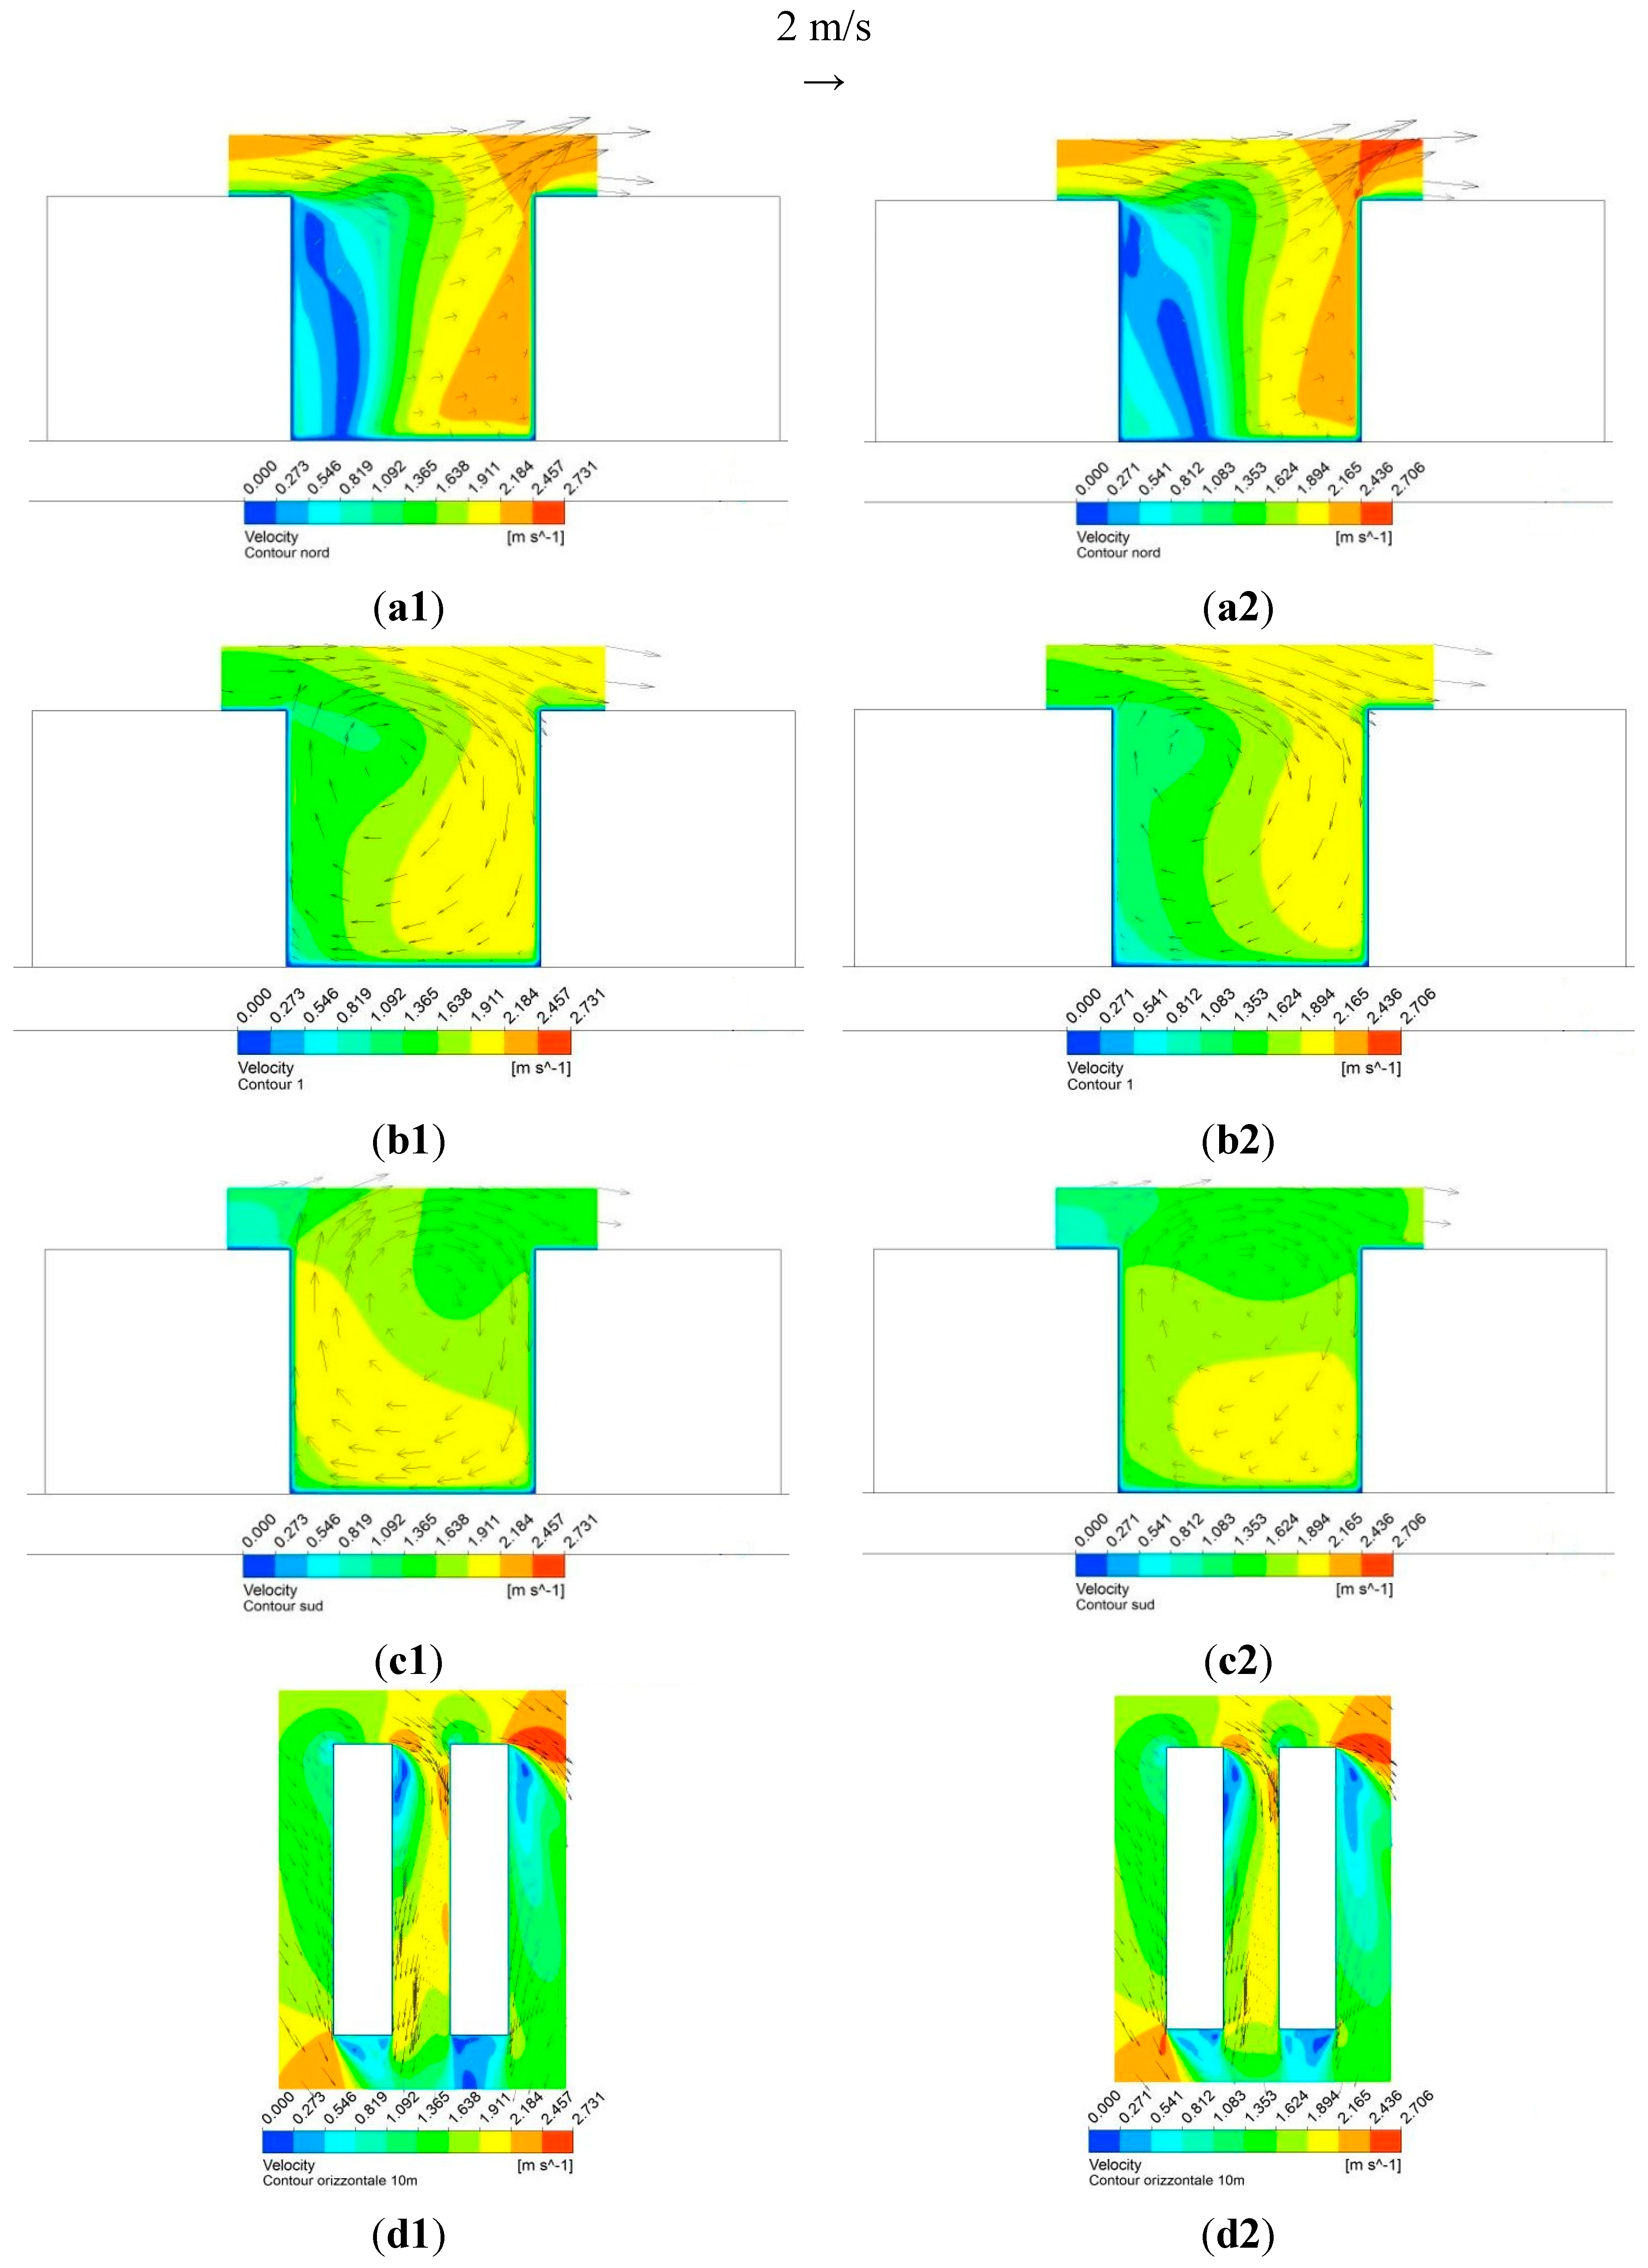
Figure 5.
XZ velocity vectors on North plane (a); Central plane (b); South plane (c); horizontal plane (d) at 11:00 (subscript 1) and 14:00 (subscript 2), for street canyon H/W = 2.
Figure 5.
XZ velocity vectors on North plane (a); Central plane (b); South plane (c); horizontal plane (d) at 11:00 (subscript 1) and 14:00 (subscript 2), for street canyon H/W = 2.
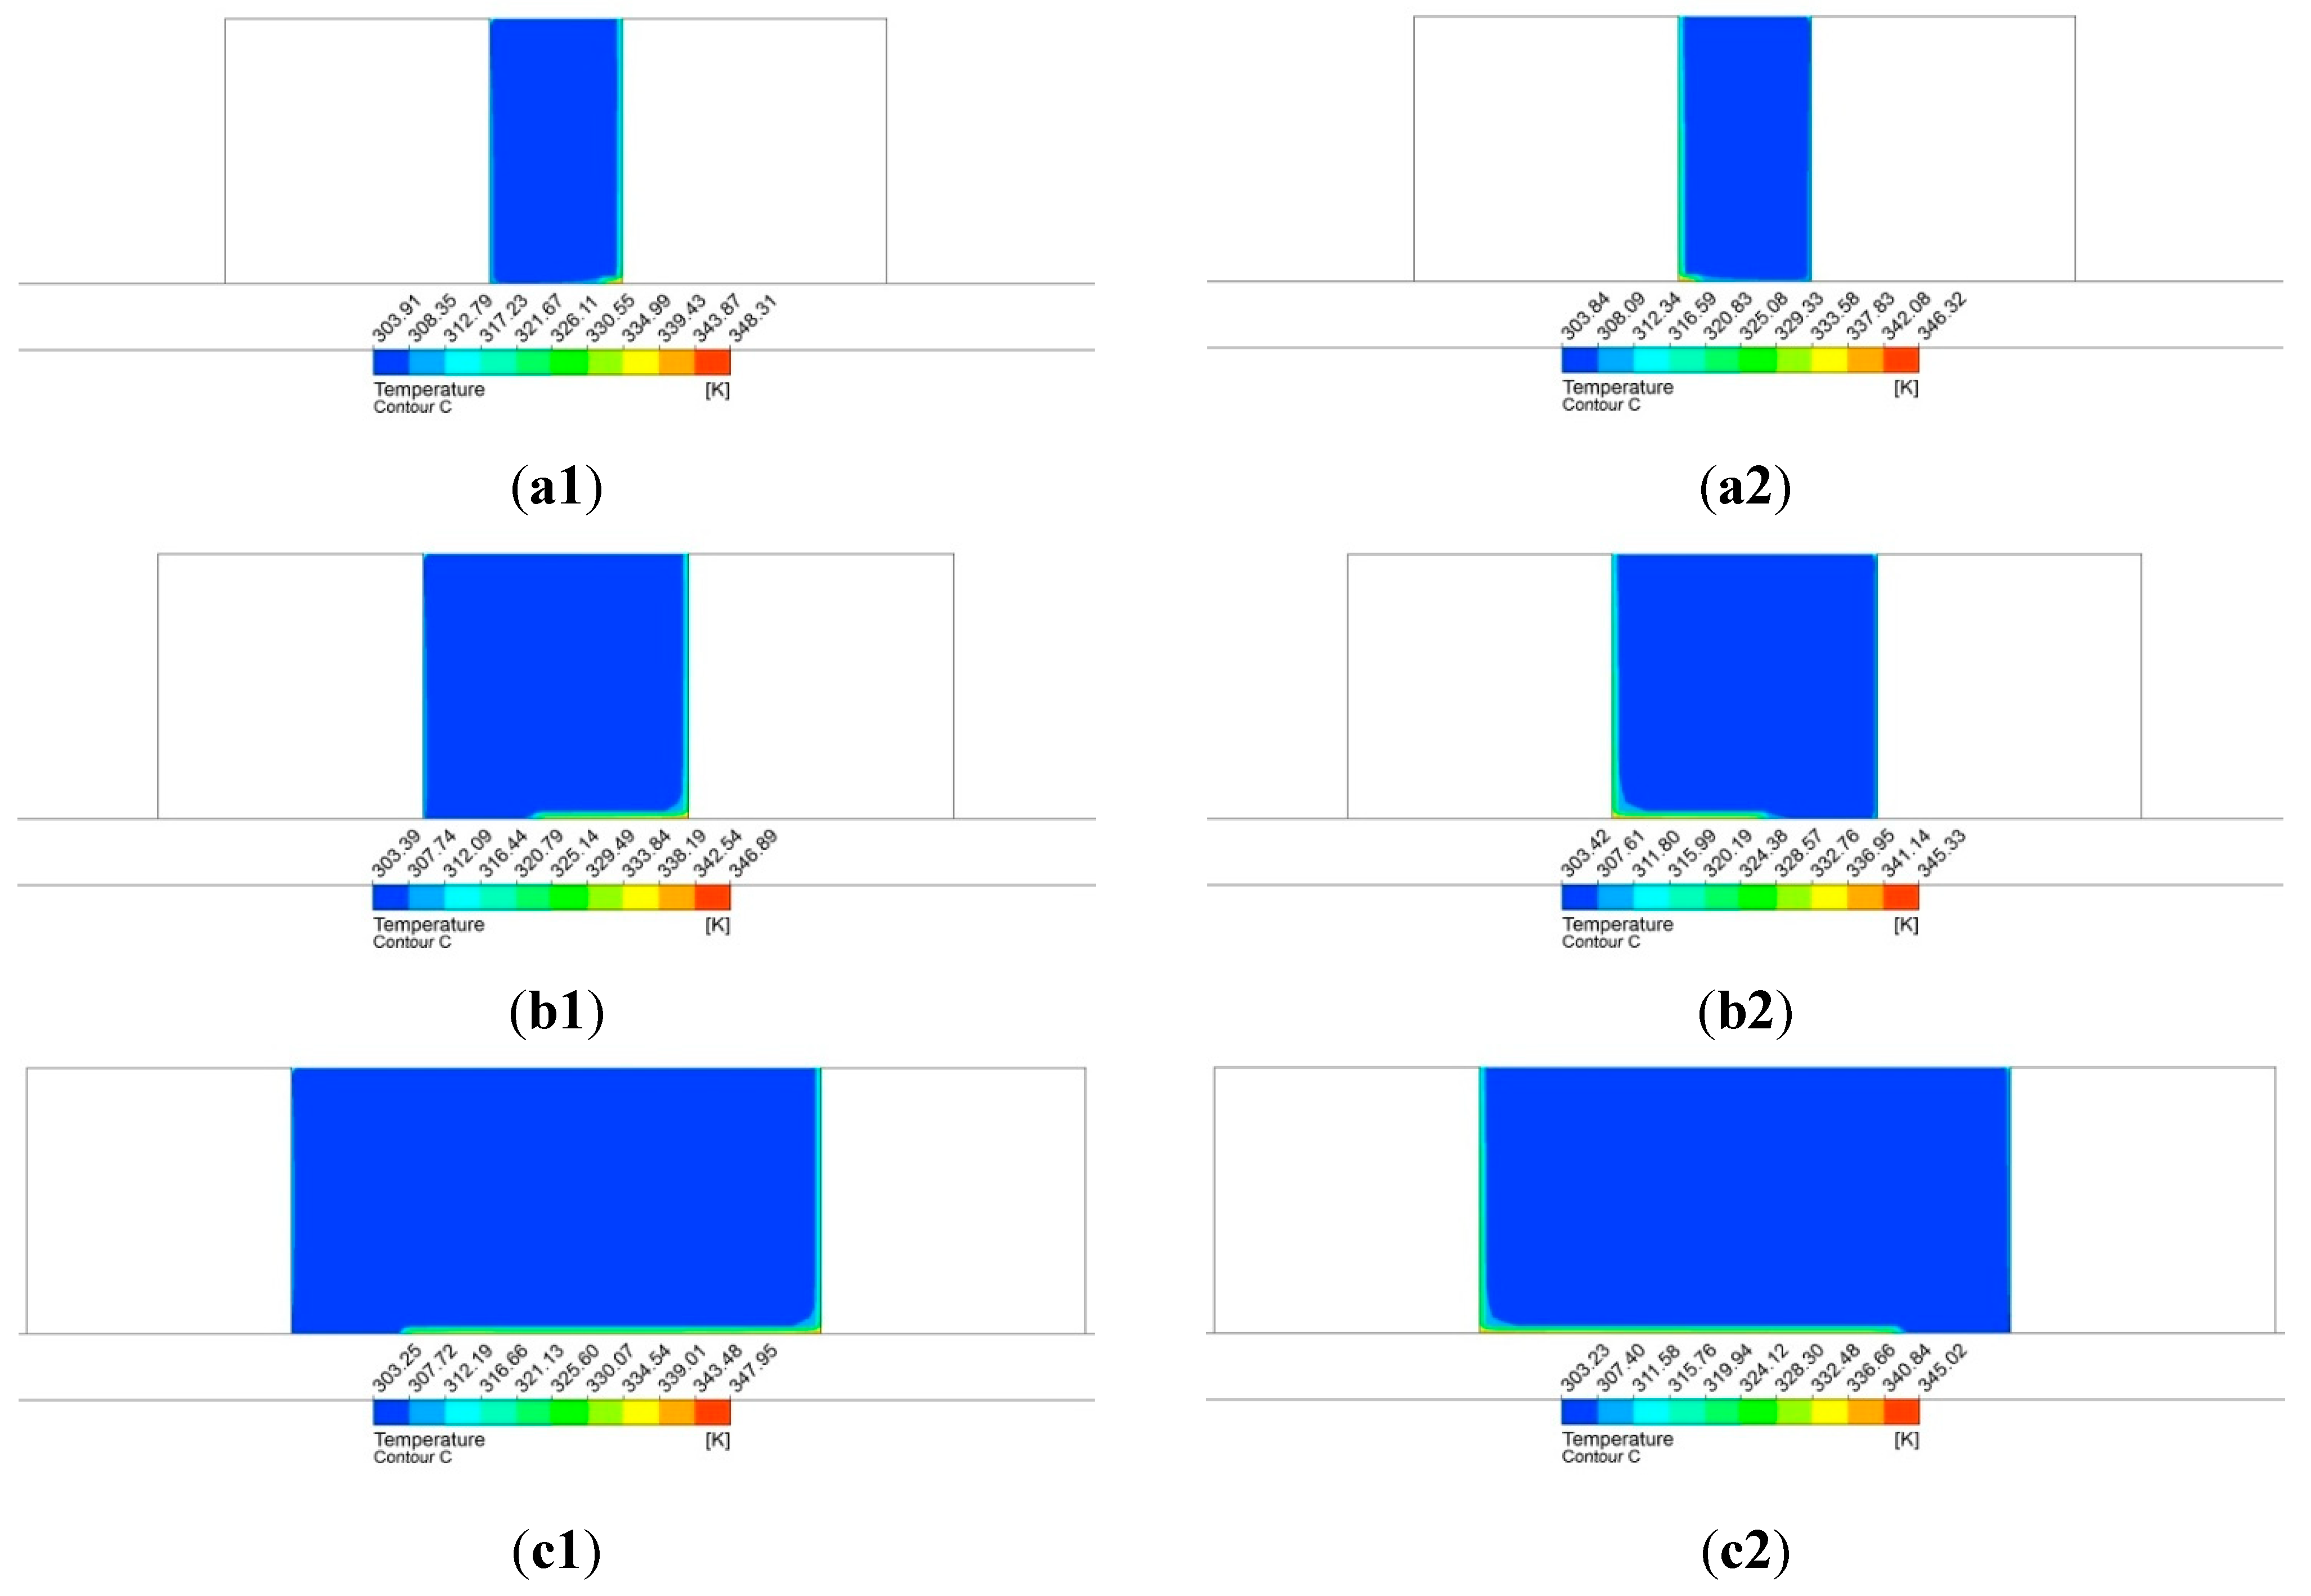
Figure 6.
XZ air temperature on Central plane for street canyon H/W = 2 (a); H/W = 1 (b); H/W = 0.5 (c), at 11:00 (subscript 1) and 14:00 (subscript 2).
Figure 6.
XZ air temperature on Central plane for street canyon H/W = 2 (a); H/W = 1 (b); H/W = 0.5 (c), at 11:00 (subscript 1) and 14:00 (subscript 2).
As the leeward facade is exposed to sun radiation, the natural convection gives a positive contribution to this spiral vortex coming from the roof. For the simulations performed at 14:00, in the Central and South plane the flow pattern is divided in two counter-rotating vortex: the upper one due to the geometrical discontinuity and the second one, due to the buoyancy effect, in the low corner near the hot wall. The convective vortex appears less developed than the simulations carried out by Li
et al. [
4] and Xie
et al. [
5], probably because of the 3D nature of our simulations. The impact of the natural convection vortex on the flow field structure, grows with the H/W ratio. As it can be seen in
Figure 3(c2), when H/W = 0.5, even if the windward façade is sun-heated, the flow field structure between the buildings is strongly characterized by the large aerodynamic vortex and the buoyancy conducted vortex occupies the area near the hot wall which extends up to half height of the building. The same result is obtained for the simulations relative to H/W = 1; at 11:00 the aerodynamic vortex occupies all the space between the buildings (
Figure 4c1), instead, at 14:00, the flow field is double-vortex in structure (
Figure 4c2). When the height of the buildings doubles the width of the canyon (H/W = 2) and when the windward façade is sun-heated, the flow structure is strongly affected by the natural convection vortex. As it can be seen from a comparison between
Figure 5b1,b2 and c1,c2, in the Central and South Plane, the natural convection vortex occupies a large part of area between the buildings. In particular, in the South Plane, while at 11:00 (
Figure 5c1) the aerodynamic vortex occupies all the area, at 14:00 it is almost absent and the motion due to buoyancy forces clearly prevails.
The phenomena of flow fields shown, as expected, dependent on the air temperature inside the canyon, as can be seen from
Figure 6. In particular, the effect of temperature on the flow field within the canyon is most evident in
Figure 5b2, where the formation of two vortices is a direct result of the air temperature rise near the leeward façade.
4. Conclusions
In this study a numerical simulation method has been used to investigate the physical phenomena that characterize the flow field structure within a street canyon, N-S oriented, during a summer day. A fully 3D model has been simulated, considering the effects of solar radiation and radiative exchange on canyon air and surfaces temperature, at two different hours of the day: 11:00 and 14:00. The importance of considering a 3D domain has been shown, because the flow field within the canyon changes significantly as the air passes through the canyon itself. When the windward façade is sun-heated, even if the flow field is characterized by a strong velocity component parallel to the canyon direction (direction: −45° N and intensity: 2 m/s), it has been noticed that the buoyancy force determines a thermal induced vortex near the hottest façade. Considering the natural convection effects, the flow field is complex, and it is strongly different for the two hours of the day considered. The impact of buoyancy forces on the flow field structure for three different H/W ratios, has been evaluated. In particular it has been shown that the impact of natural convection vortex, when the windward façade is sun-heated, increases with the H/W ratio. When the leeward façade is heated, instead, it has been shown that the flow pattern is characterized only by the aerodynamic vortex coming from the roof and, in these cases, the upward motion due to the buoyancy forces gives a positive contribution to the above mentioned vortex. Further analysis must be performed to quantify the effects of buoyancy forces on thermo fluid dynamic parameters, such as the convective heat transfer coefficient, turbulent kinetic energy, local values of velocity magnitude and surfaces temperatures.


