Article

Recycled Urban Wastewater for Irrigation of Jatropha curcas L. in Abandoned Agricultural Arid Land

by
María Dorta-Santos
1,*,
Marisa Tejedor
1,
Concepción Jiménez
1,
Jose M. Hernández-Moreno
1,
M. Pino Palacios-Díaz
2 and
Francisco J. Díaz
1
1
Department of Animal Biology, Soil Science and Geology, Faculty of Biology, University of La Laguna, La Laguna 38206, Tenerife, Canary Islands, Spain
2
Department of Animal Pathology, Animal Production, Bromatology and Food Technology, Agronomy, Faculty of Veterinary, University of Las Palmas de Gran Canaria, Arucas 35413, Las Palmas, Canary Islands, Spain
*
Author to whom correspondence should be addressed.
Sustainability 2014, 6(10), 6902-6924; https://doi.org/10.3390/su6106902
Submission received: 5 August 2014 / Revised: 15 September 2014 / Accepted: 23 September 2014 / Published: 1 October 2014
(This article belongs to the Section Environmental Sustainability and Applications)

Abstract

:
In a global context in which obtaining new energy sources is of paramount importance, the production of biodiesel from plant crops is a potentially viable alternative to the use of fossil fuels. Among the species used to produce the raw material for biodiesel, Jatropha curcas L. (JCL) has enjoyed increased popularity in recent years, due partly to its ability to grow in degraded zones and under arid and semi-arid conditions. The present study evaluates the potential for JCL production under irrigation with non-conventional water resources in abandoned agricultural soils of the island of Fuerteventura (Canary Islands, Spain), which is one of the most arid parts of the European Union. JCL growth and productivity are compared during the first 39 months of cultivation in two soil types (clay-loam and sandy-loam) and with two irrigation water qualities: recycled urban wastewater (RWW) and desalinated brackish water (DBW). The results indicate that JCL growth (in terms of plant height and stem diameter) was significantly influenced both by soil type and water quality, with better development observed in the sandy-loam soil under RWW irrigation. Productivity, measured as cumulative seed production, was not affected by soil type but was affected by water quality. Production under RWW irrigation was approximately seven times greater than with DBW (mean ~2142 vs. 322 kg·ha−1). The higher nutrient content, especially P, K and Mg, and lower B content of the RWW were found to be key factors in the greater productivity observed under irrigation with this type of water.

1. Introduction

Increasing energy demand and dependence worldwide has made it necessary to explore alternatives to fossil fuels [1]. The interest in procuring renewable energy sources also forms part of the battle to prevent climate change, the main goal of which is to reduce greenhouse gas emissions [2]. For these reasons, biofuels are being promoted as a sustainable alternative to fossil fuels in order to meet the demand for energy and also to address the problems of climate change [3]. Obtaining bioenergy from vegetable oils (global production ~2.4 million t·year−1) is one possible option to achieve the aforementioned objectives [4].
Among the crops used to produce biodiesel from the oil extracted from their seeds, Jatropha curcas L. (JCL) has emerged as one of the candidates with greatest potential and its use for energy is being promoted at world level [5]. JCL crops occupied around 900,000 ha across the world in 2008, a figure which rose to 4.7 million ha in 2010 [6] and is expected to reach 12.8 million in 2015 [7]. Despite this impressive expansion, very little scientific evidence exists to support many of the views published concerning the validity of the species as an energy crop [8] and there are important knowledge gaps about the environmental impacts and yield potential of JCL plantations [7].
The high ecological adaptability of JCL allows it to thrive in a wide range of environmental conditions [4]. It adapts well to arid and semi-arid regions [4], with the optimum temperatures for growth ranging from 20–28 °C [6]. It can grow without irrigation in areas with average rainfall of 250–300 mm·year−1. However, the minimum annual average rainfall at which JCL is known to yield a harvestable amount of seeds is 500–600 mm·year−1 [9], while the ideal rainfall for optimum production levels is 1000–1500 mm·year−1 [10]. Accordingly, additional watering is indispensable for cultivation as an energy crop in arid and semi-arid regions [11]. The belief that it can be productive with limited water availability has led to the failure of many projects in arid zones [7]. However, large-scale projects geared to biodiesel production have achieved high yields with irrigation, although the use of conventional water resources which could otherwise be used for food crops has proven an obstacle to the acceptance and expansion of the crop [7].
An alternative midway between these two situations is to irrigate with non-conventional resources such as recycled urban wastewater (RWW). From an agronomic point of view, high salt and Na concentrations are the most problematic constituents in RWW [12]. For most crops, the relative salinity tolerance and yield response functions to salinity are known well enough for general salt tolerance guidelines [13], however JCL’s salinity threshold has not been assessed yet. While Dagar et al. [14] reported that JCL could successfully be irrigated with levels of salinity of up to 12 dS·m−1, FAO classifies JCL as a sensitive crop (<4 dS·m−1) [15]. Previous studies on the cultivation of JCL in arid regions using RWW for irrigation are scarce and provide very limited information. In Southern Morocco, Rajaona et al. [16], determined the water and nutrient requirements of a JCL plantation irrigated with RWW. They found that the N content of RWW at the considered irrigation requirement was not sufficient to produce a moderate seed yield, while the P and K demand could be easily satisfied. They concluded that the irrigation with RWW needs to consider both the water requirements of the crop and irrigation doses needed for controlling salinity build-up in the top soil in arid climates. In Carrión de los Céspedes, Spain, De Miguel et al. [17] found no significant differences in biomass production and the nutrient content of JCL leaves based on irrigation water quality (groundwater vs. reclaimed water). Although without offering production data, they conclude that using RWW for JCL irrigation could ease the pressure on water resources and represent an alternative source of clean energy.
Concerning the appropriate soil characteristics for growing JCL, the data published by different authors can often prove contradictory and no definitive studies on the issue exist. Heller [18] notes the capacity of the species to grow in soils with poor agricultural potential. Kumar & Sharma [19], state that it can grow in marginal soils not used for food crops. A number of authors suggest as optimum conditions well aerated and well drained sandy-loam soils with depths of at least 45 cm [20], whereas clay soils are considered less suitable due to potential ponding problems and root development limitations [4,5,6,7,8,9,10]. However, Valdés-Rodríguez et al. [21] indicate that clay-loam soils may be more appropriate than sandy soils given their higher nutrient content. Although JCL can grow in nutrient-poor soils [22], acceptable yields are dependent on the presence of high N and P content in the soils [9]. Other authors note that excessive fertilization and water application can result in too high a biomass production but at the expense of seed production [6].
The island of Fuerteventura (Canary Islands, Spain) is among the areas of the European Union that suffer the most severe desertification. A series of factors could make it ideal for JCL cultivation, including: (i) the availability of extensive areas of neglected farmland (approximately 8700 ha, 92% of the island’s farmland, has been abandoned in the last decades for socio-economic reasons); (ii) the availability of large volumes of treated wastewater from the tourist industry (around 15 Hm3 of urban wastewater are treated every year).
The present study evaluates—using data obtained from the first 39 months of the experiment—the potential for growing JCL under irrigation with urban RWW in two types of soil (clay-loam and sandy-loam) on Fuerteventura Island. The specific objectives were: (i) to evaluate the influence of RWW irrigation on crop yield, comparing it to irrigation with desalinated well-water used for conventional crops and (ii) to determine which types of soil improve crop behavior. The influence of irrigation water type and soil type on JCL growth and yield was evaluated by studying plant morphometrical characteristics (height and stem diameter), leaf mineral composition, stable carbon isotope composition, and seed production.
The results of the study will deepen our knowledge of the cultivation possibilities of the species in extremely arid territories using marginal soil and water resources to ensure that JCL does not pose competition for food crop production. The information from the study will be directly applicable in strategies to tackle desertification in the Canary Islands and elsewhere. The study will also provide useful information for the farming and water treatment sectors on the possible benefits and limitations of the use of RWW to irrigate energy crops.

2. Material and Methods

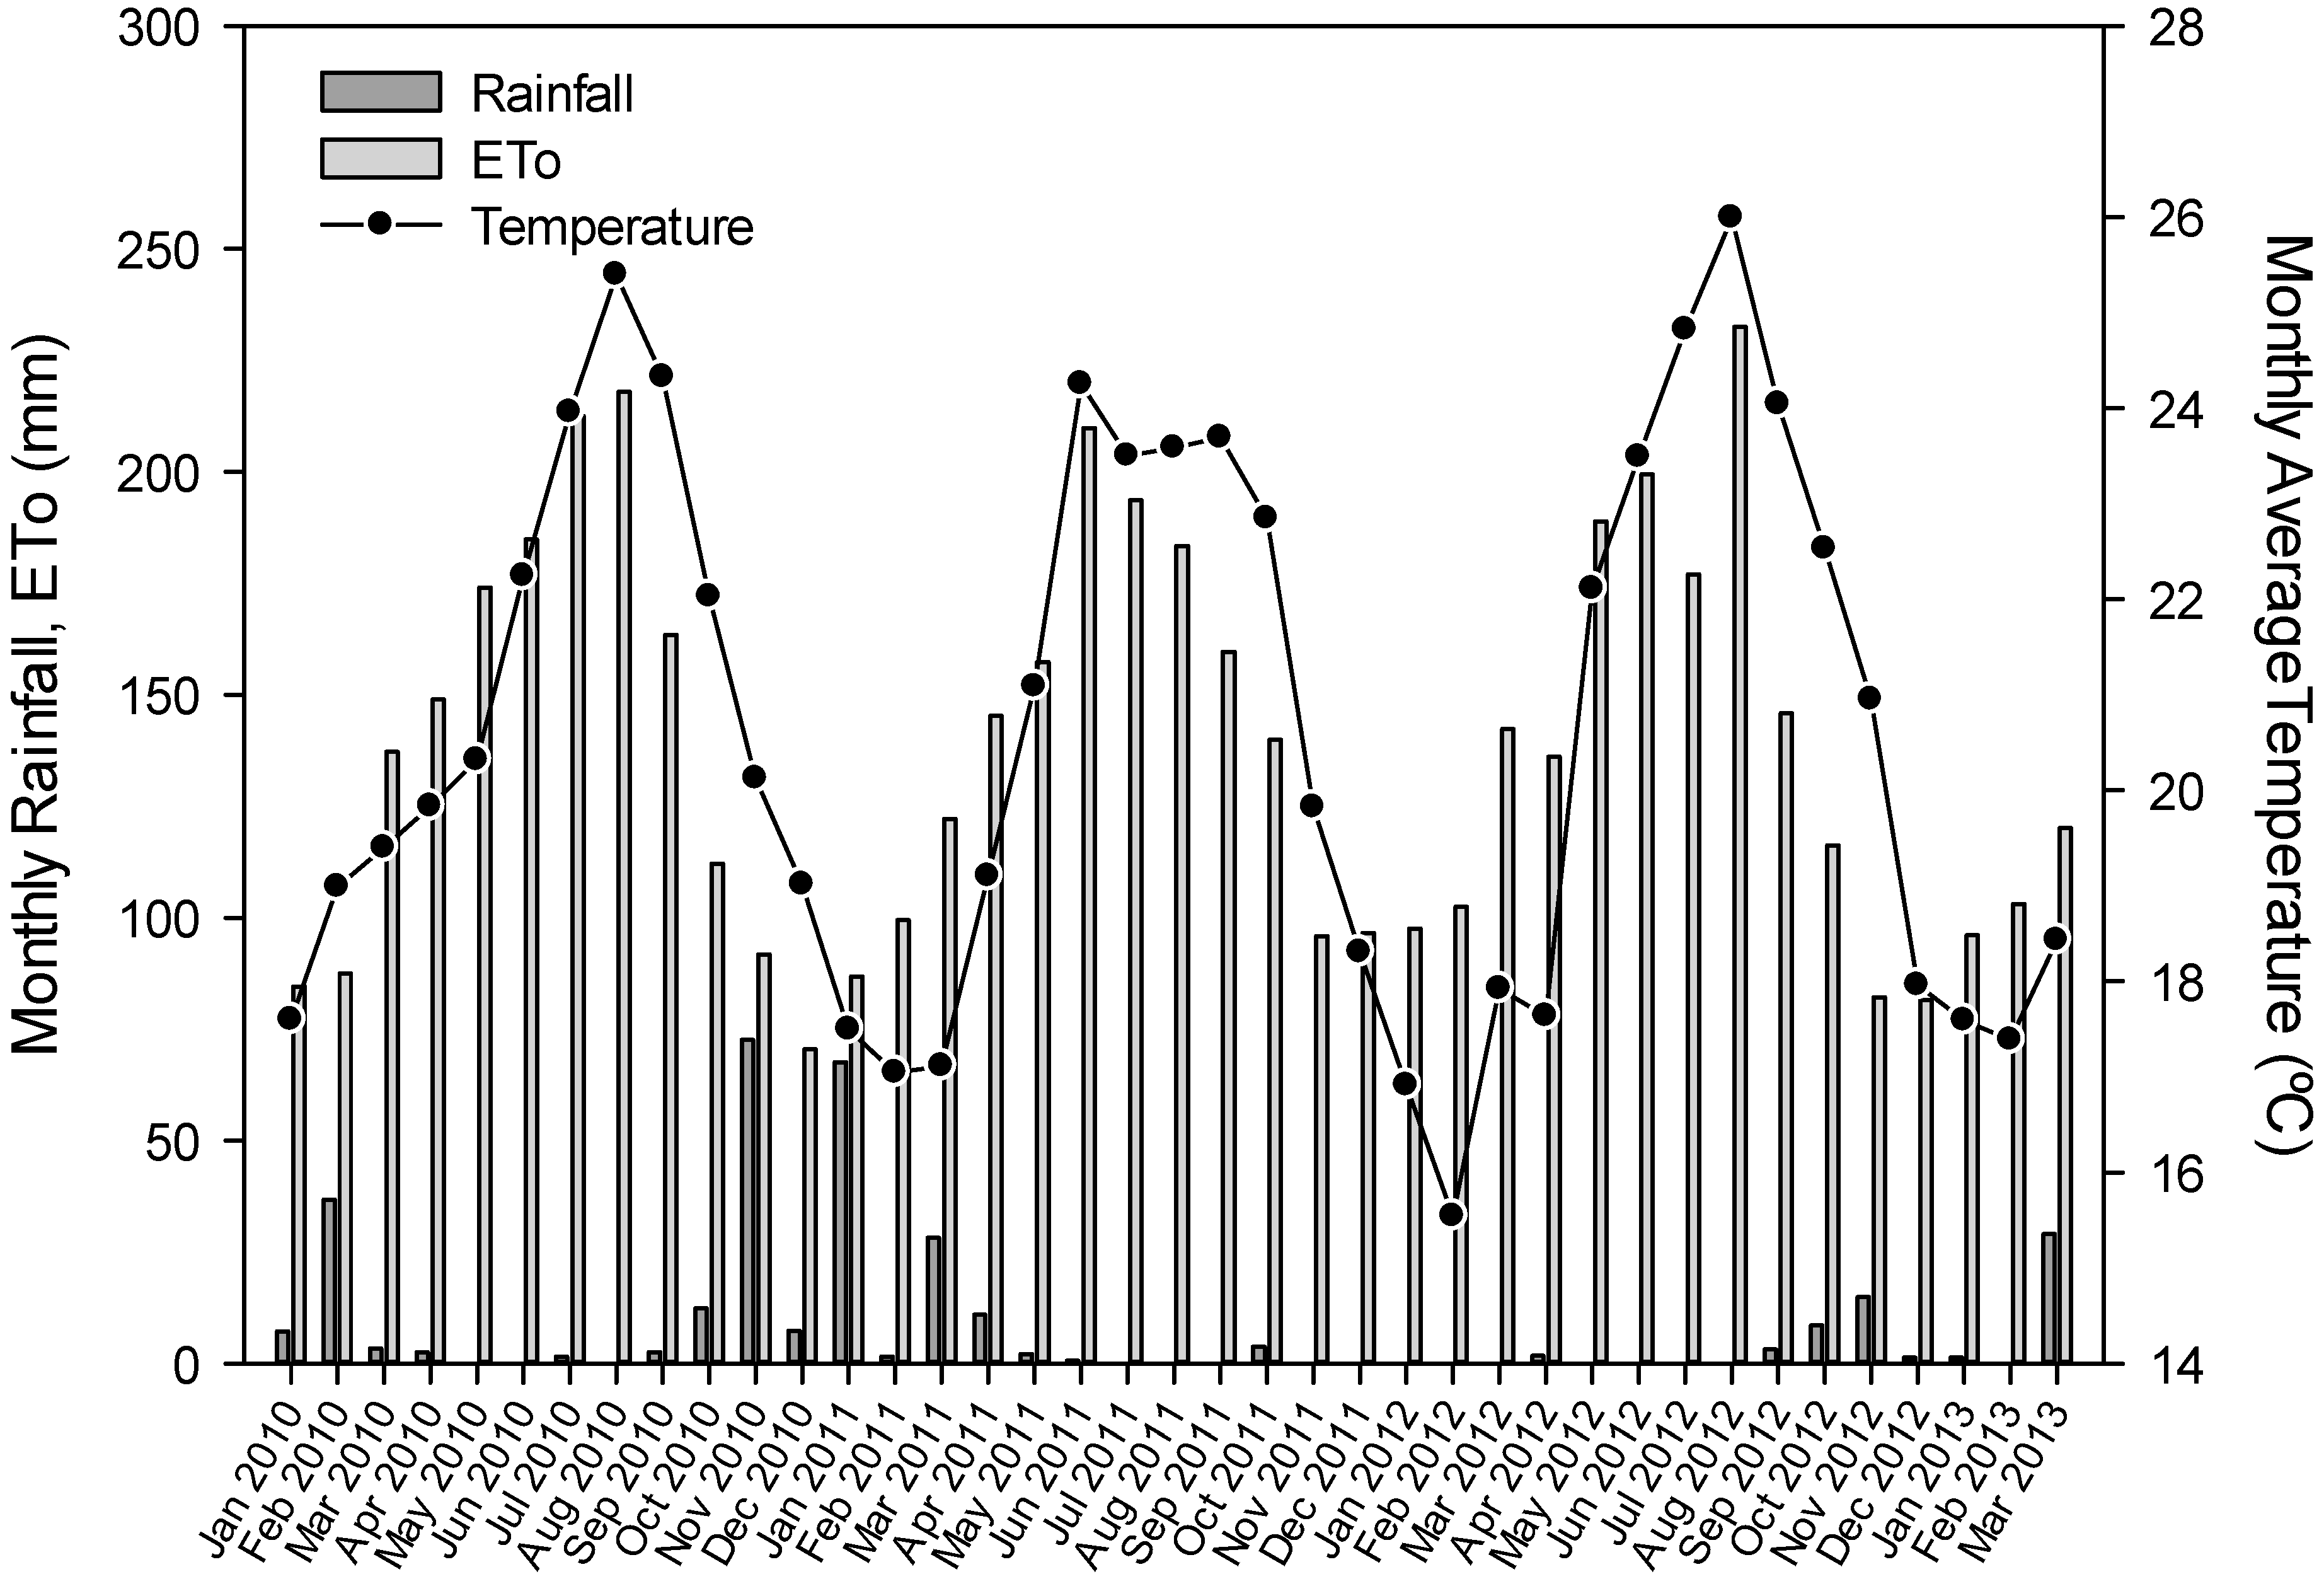
2.1. Description of Study Site

The study was conducted on the island of Fuerteventura (Canary Islands, Spain), which is situated in the Atlantic Ocean between 28°45′ and 28°02′ north latitude and 13°49′ and 14°20′ west longitude, a mere 115 km off the west coast of Africa. The study site—a local government-owned experimental farm situated in the south-east of the island—has average rainfall of 98 mm, with high inter-annual variability (32–117 mm), an average annual temperature of 20 °C, 64% relative humidity, average wind speed of 3.4 m·s−1, average radiation of 18.9 M J m−2·day−1, and an average of 10.6 h sunshine·day−1. The combination of the near constant winds, high radiation and high temperatures produces a reference evapotranspiration (ETo) of 1707 mm·year−1, calculated using the FAO/Penman-Monteith method [23]. Figure 1 shows climate data, obtained from a meteorological station situated in the study site, during the period 2010–2013.
Figure 1. Monthly values of meteorological variables recorded between January 2010 and March 2013 at the study site.
Sustainability 06 06902 g001

2.2. Experimental Design

Two experimental fields, each one with a different soil, designated TT and TH here, were chosen to cultivate JCL. Soil TT is a Typic Torrifluvents [24] with an average soil depth of 60–80 cm and a sandy-loam texture at both 0–20 cm (clay 15.3%, silt 19.5%, sand 65.2%) and 20–40 cm (clay 17.4%, silt 21.7%, sand 60.9%). Soil TH is a Typic Haplocambids [24], with a mean depth of 90–100 cm and clay-loam texture at both 0–20 cm (clay 29.6%, silt 50.2%, sand 20.2%) and 20–40 cm (clay 29.6%, silt 48.3%, sand 22.1%).
In each of the two selected fields, six experimental plots separated by 2 m aisle (10 m2 in size with 10 plants each one) were created in a random block design with three replicates for each treatment. Treatments consisted of irrigation with two types of water: (i) recycled urban wastewater (RWW) and (ii) desalinated brackish groundwater (DBW), which is used in the island to irrigate conventional crops and was used in this case as a control treatment. A localized automatic irrigation system was installed on each experimental field. Water was applied by means of superficial drip irrigation. The irrigation lines were spaced 1 m and the pressure-compensating emitters with delivery rates of 2.3 L·h−1 were spaced 0.5 m. The water dose applied was changed monthly during the entire experimental period in order to meet the 100% ETo, ranging from 2.7 mm·day1 (December 2010) to 9.1 mm·day1 (July 2012).
The JCL seeds were imported from Brazil and germinated in a nursery after 48 h immersion in water in 6000 cm3 polythene bags. A mixture of the two soils, fine lapilli and peat was used as substrate. The plants were transplanted to the experimental fields in December 2009 after 53 days of nursery growth (plant height ≈ 30–40 cm). 250 g of granular fertiliser (NPK 15:15:15) was added to the base of each plant during the first year.

2.3. Irrigation Water Sampling and Analysis

Samples of DBW and RWW were taken monthly at the stop-valves of the experimental fields during the period September 2010–March 2013. The water was collected in plastic bottles and send to the laboratory for analysis. The DBW was generated from saline groundwater drawn from a depth of 45 m and treated at a desalination plant in the same location as the study site. The RWW was from a nearby treatment plant which receives urban wastewater originating from desalinated sea water. The treatment process consists of pre-treatment (removal of solids using filters), primary treatment (decantation) and secondary treatment (biological digestion). The following variables were analyzed in the water samples: electrical conductivity (EC), pH, total suspended solids (TSS) by standard glass-fiber filter, cations (Ca2+, Mg2+, Na+, K+, NH4+) and anions (Cl, SO42−, NO3) by ion chromatography, Total-phosphorus (TP) was determined by colorimetric method using phosphomolybdenum blue after digestion with perchloric acid, Total-nitrogen (TN) according to Korolef’s method by treatment with an oxidizing agent in a thermoreactor, boron (B) using azomethine-H, chemical oxygen demand (COD) by dichromate oxidation and closed reflux colorimetric method, and biological oxygen demand (BOD) was determinate from the difference between dissolved oxygen initially and after 5 d incubation using pressure transducer sensors (VELP Scientifica).All the analyses were performed in accordance with Standard Methods for the Examination of Water and Wastewater [25].

2.4. Soil Sampling and Analysis

Initial samples were taken from soils TT and TH for characterization before planting and the installation of irrigation. In each site nine samples were taken randomly (each replicate being a combination of three subsamples) at two different soil depths: (0–20 cm; 20–40 cm) (total samples = 36). In order to evaluate the effects of JCL cultivation and irrigation with DBW and RWW on the chemical characteristics of the soils, samples were taken again in June 2012 (30 months after planting). Three soil samples were taken at random from the same depths as the initial sample (0–20 cm; 20–40 cm) in each of the experimental plots (total samples = 72). All the soil samples were air-dried and passed through a 2 mm sieve prior to analysis. The following variables were analyzed in the soil samples: particle size (sand, silt and clay) by hydrometer; pH and electrical conductivity in saturated paste extract (pHs and ECs); soluble cations (Ca2+, Mg2+, Na+, K+) in saturated paste extract by inductively coupled plasma atomic emission spectrometry (ICP-AES) and emission spectrometry; sodium adsorption ratio (SAR) from Ca2+, Mg2+ and Na+ concentrations in the saturated paste extract; exchangeable cations by equilibrium extraction using 1 M ammonium acetate (pH 7.0) for Na+ and K+, and 1 M sodium acetate (pH 8.2) for Ca2+ and Mg2+, and subsequent determination by atomic absorption/emission spectrometry; calcium carbonate equivalent (CaCO3) using gravimetric determination by reaction with hydrochloric acid; organic carbon (OC) by potassium dichromate oxidation and subsequent spectrophotometric measurement; available phosphorus (P-Olsen) by the Olsen method; total nitrogen (TN) by micro-Kjeldahl; and boron in saturated paste extract (Bs) and hot water-soluble boron (HWSB) using azomethine-H. All the soil analyses followed Standard Methods [26].

2.5. Plant Sampling and Analysis

2.5.1. Leaf Mineral Composition

In each plot, young (~1 month) and mature (~6 months) leaves were collected from all the JCL plants. Young leaves were combined in one sample per plot, doing the same with mature leaves, for tissue analysis. The samples were taken in July 2011, before the plants began to bear fruit but when differences between the treatments in terms of production were already becoming apparent. Immediately after collection, the leaf samples were dried in an oven at 60 °C for subsequent grinding. Samples were acid-digested in a microwave according to USEPA [27] for analysis of macro and microelements: sulfur (S), P, potassium (K), calcium (Ca), magnesium (Mg), sodium (Na), boron (B), copper (Cu), iron (Fe), manganese (Mn) and zinc (Zn). The resulting solutions were examined using Inductively Coupled Plasma Atomic Emission Spectrometry (ICIP-AES). Nitrogen determination was by dry combustion. All leaves samples were analyzed at the Agrofood and Phytopathology Laboratory of Gran Canaria Island Council.

2.5.2. Stable Carbon Isotope Discrimination

The stable carbon isotope compositions of young leaf tissues were measured in July 2011 and in July 2012 by mass spectrometry (ANCA-SL Stable Isotope Analysis System, Europa Scientific, Crewe, UK) with a sample precision of ±0.03 × 10⁻³. The 13C/12C isotope ratios (δ13 C) were calculated relative to the Pee Dee Belemnite international standard. Carbon isotope discrimination (Δ) was calculated as: Δ = (δa − δp)/(1 + δp), where δa and δp are the isotopic compositions of air and plant material, respectively [28]. The isotopic composition of air was assumed to be −8.0 × 10⁻³.

2.5.3. Plant Morphometrical Characteristics

The total plant height and stem diameter, measured at 5 cm from the base, were recorded in July 2011 (19 months after planting) and again in November 2012 (35 months after planting). The measurements were taken for every plant in each experimental plot. Formative pruning was performed each year in all the plots during the dormant season at the end of the harvest (~April). Branches were pruned by removing around two-thirds of their length.

2.5.4. Seed Production

All the fruits produced in each of the experimental plots were periodically collected manually, during the 39 months of cultivation in order to estimate seed production. In all cases the fruits were deemed to be ripe when they changed in color from green to yellow-brown (~90 days after flowering). The seeds were separated from the rest of the fruit, again by hand, and their weight measured. Seed production was expressed as the cumulative production per plot during the study period.

2.6. Statistical Analysis

The variable differences between DBW and RWW were determined using a paired-sample t-test. A Wilcoxon Signed Rank Test was used for variables not presenting a normal distribution (Kolmogorov–Smirnov test) and homogeneity of variance (Levene test). For each soil type (TT and TH), the differences between the effects of DBW and RWW irrigation on the soil variables were evaluated using ANOVA and post-hoc Tukey’s test. A Kruskal–Wallis test and a non-parametric Tukey-type multiple comparisons test were used where the variables did not fit a normal distribution and homogeneity of variance. The effects of the type of soil and type of irrigation water on plant morphometrical characteristics, leaf mineral composition, stable carbon isotope composition and cumulative seed production were evaluated using a two-way ANOVA or a non-parametric two-factor analysis of variance where the variables did not present a normal distribution and homogeneity of variance. The ordination and distribution of the samples with respect to the soil variables and leaf composition were examined using Principal Components Analysis (PCA). Components I and II of the PCAs were correlated with seed production by calculating the Pearson correlation coefficients. Statistical methods were implemented using SPSS (version 19.0) and CANOCO (version 4.5). The significance level was set at p ≤ 0.05.

3. Results

3.1. Irrigation Water Quality

The mean values of the physico-chemical variables analyzed in the DBW and RWW are given in Table 1. Average TSS values were 1 mg·L−1 and 24 mg·L−1 for DBW and RWW, respectively, and reached maximum values of 90 mg·L−1 in the RWW. The pH values were also generally higher in the RWW (range = 6.9–9.9) than in the DBW (range = 6.4–7.3). Average EC values were 300 μS·cm−1 (DBW) and 1800 μS·cm−1 (RWW). SAR values varied from 3.1–22.6 in the DBW and from 9.6–17.2 in the RWW. Chloride content reached maximum values of 127 and 651 mg·L−1, respectively, in the DBW and RWW. Boron levels in the RWW and DBW varied from 0.7–1.4 mg·L−1 and 1.4–2.4 mg·L−1, respectively, with statistically significant differences found between the two types of water. Ammonium, nitrate and potassium levels were approximately 12, 1.5 and 31 times greater, respectively, in RWW than in DBW. These levels in RWW may be a potentially significant source of nutrients in low fertility soils. COD and BOD values in RWW ranged from 25–110 mg·L−1 and from 0.4–33 mg·L−1, respectively.
Table 1. General characterization of desalinated brackish water (DBW) and recycled wastewater (RWW) used for irrigation; n = 29.
VariableDBWRWW
TSS mg·L−11.0 ± 1.524.0 ± 25.3 *
pH6.8 ± 0.38.0 ± 1.0 *
EC dS·m−10.3 ± 0.11.8 ± 0.2 *
SAR (meq·L−1)0.510.9 ± 3.511.4 ± 1.7
Ca2+ mg·L−10.8 ± 0.421.0 ± 3.2 *
Mg2+ mg·L−11.3 ± 2.113.1 ± 2.6 *
K+ mg·L−11.1 ± 1.134.4 ± 4.0 *
Na+ mg·L−157.1 ± 27.1270.0 ± 40.7 *
Cl−1 mg·L−167.9 ± 19.5425.0 ± 72.0 *
B mg·L−11.9 ± 0.30.9 ± 0.2 *
N-NH4+ mg·L−10.14 ± 0.011.7 ± 3.0
N-NO3 mg·L−15.0 ± 1.97.4 ± 7.1
TN mg·L−1n.d16.3 ± 11.3
S-SO42− mg·L−17.7 ± 2.555.3 ± 11.8 *
TP mg·L−1<15.9 ± 2.8
COD mg·L−1n.d49.9 ± 22.1
BOD mg·L−1n.d10.4 ± 8.9
n.d non determined; * denote significant differences (p < 0.05).

3.2. Initial Soil Chemical Properties

Table 2 gives the main chemical characteristics of the soils TH and TT at two depths (0–20 cm and 20–40 cm) before commencement of the treatments and after 30 months of irrigation. The reaction of both soils was alkaline (pH 8.5–8.9) prior to the treatment application. Initial EC levels were significantly higher in soil TH, with the mean values exceeding 2 dS·m−1 in the surface layer and 7 dS·m−1 at 20–40 cm. In soil TT the EC values were below 2 dS·m−1 throughout the profile. In both soil types, the soil solution was dominated by Cl and Na+ (data not shown) indicating that salinization is natural and originates from sea spray. SAR values were also significantly higher in soil TH, with mean values reaching 42 (meq·L−1)0.5 at 20–40 cm, compared to 17 (meq·L−1)0.5 at the same depth in soil TT. In both soil types and at all depths the order of exchangeable cations was Ca2+ > Na+ > Mg2+ > K+. Both soils contained CaCO3, with higher values found in soil TH. Boron levels in soil TH were generally above 2 mg·L−1 and 2 mg·kg−1 of Bs and HWSB, respectively. In soil TT, however, the values were below 1.5 mg·L−1 and 1.3 mg·kg−1, respectively. Organic C and TN were generally larger (p > 0.05) in soil TH than in TT, in all cases with very low levels (<10 g·kg−1 C and <1 g·kg−1 TN) typical of soils in arid zones. Mean P-Olsen content at 0–40 cm was similar in both types of soil (22 and 17 mg·kg−1 in soil TH and TT, respectively), above sufficiency for most crops.
Table 2. Chemical characteristics of the top layers (0–20 cm; 20–40 cm) of the soils before treatment application (Initial soil) and after irrigation with desalinated brackish water (DBW) and recycled wastewater (RWW); mean ± standard deviation; n = 3–9; different letters (a–b) in the same row denote significant differences (p < 0.05) between treatments within each soil and depth.
VariableSoil THSoil TT
Initial SoilDBWRWWInitial SoilDBWRWW
0–20 cm0–20 cm
pHs8.9 ± 0.1 a8.9 ± 0.2 a8.6 ± 0.0 b8.5 ± 0.3 a8.4 ± 0.1 a8.2 ± 0.2 a
ECs (dS·m−1)2.5 ± 0.4 a13.2 ± 10.3 a6.1 ± 1.8 a1.2 ± 0.2 a6.3 ± 5.3 ab24.1 ± 6.1 b
Exch. Na (cmolc·kg−1)15.0 ± 4.2 a14.3 ± 7.5 ab5.5 ± 0.9 b5.6 ± 1.3 a2.4 ± 0.4 b5.5 ± 2.2 a
Exch. K (cmolc·kg−1)2.7 ± 0.9 a1.8 ± 0.1 a2.8 ± 0.2 a2.6 ± 0.2 a1.2 ± 0.4 b2.5 ± 0.6 a
Exch. Ca (cmolc·kg−1)17.2 ± 1.4 a14.6 ± 6.7 a19.6 ± 1.3 a15.4 ± 2.6 a16.7 ± 3.7 a15.0 ± 0.4 a
Exch. Mg (cmolc·kg−1)7.3 ± 0.9 a5.5 ± 2.4 a7.0 ± 0.9 a4.1 ± 1.2 a3.1 ± 1.4 a3.9 ± 0.6 a
SAR (meq·L−1)0.524.3 ± 3.7 a40.9 ± 26.0 a15.2 ± 5.3 a14.8 ± 4.4 a11.3 ± 4.0 a29.9 ± 8.9 b
CaCO3 (g·kg−1)103.9 ± 6.4 a95.3 ± 25.7 a102 ± 2.4 a75.4 ± 11.0 a43.8 ± 25.8 a72.3 ± 30.3 a
Organic C (g·kg−1)4.8 ± 0.9 a3.7 ± 0.4 a5.0 ± 0.7 a4.4 ± 1.0 a3.2 ± 1.6 a3.8 ± 2.2 a
TN (g·kg−1)0.5 ± 0.1 a0.5 ± 0.0 a0.5 ± 0.3 a0.4 ± 0.1 a0.5 ± 0.2 a0.5 ± 0.1 a
Olsen-P (mg·kg−1)23.6 ± 9.4 ab15.2 ± 10.6 a43.5 ± 17.9 b20.8 ± 12.5 a16.1 ± 11.6 a28.6 ± 8.6 a
Bs (mg·L−1)2.1 ± 0.3 a3.4 ± 1.5 a1.9 ± 1.6 a0.9 ± 0.2 a3.4 ± 0.8 b3.9 ± 1.4 b
HWSB (mg·kg−1)2.3 ± 1.8 a6.6 ± 1.7 b4.5 ± 1.5 ab1.1 ± 0.9 a4.4 ± 0.2 b5.9 ± 2.3 b
20–40 cm20–40 cm
pHs8.5 ± 0.3 a9.2 ± 0.2 b8.5 ± 0.4 a8.5 ± 0.2 a9.0 ± 0.4 a8.7 ± 0.4 a
ECs (dS·m−1)7.4 ± 4.7 a3.3 ± 1.3 a3.2 ± 0.8 a1.5 ± 0.9 a1.5 ± 0.5 a5.5 ± 2.0 b
Exch. Na (cmolc·kg−1)13.6 ± 5.8 a12.0 ± 1.4 a4.6 ± 0.9 a6.8 ± 2.2 a1.7 ± 0.5 b3.7 ± 0.4 a
Exch. K (cmolc·kg−1)2.1 ± 0.7 a1.3 ± 0.5 a2.0 ± 0.3 a2.0 ± 0.4 a1.2 ± 0.3 b1.8 ± 0.1 ab
Exch. Ca (cmolc·kg−1)18.9 ± 2.1 a13.6 ± 1.6 b19.9 ± 1.4 a14.3 ± 2.2 a17.9 ± 3.0 a17.0 ± 2.2 a
Exch. Mg (cmolc·kg−1)7.9 ± 0.8 a6.1 ± 1.2 b8.5 ± 0.7 a3.4 ± 1.0 a3.7 ± 0.5 a4.6 ± 0.5 a
SAR (meq·L−1)0.541.5 ± 11.7 a26.3 ± 7.2 ab13.5 ± 2.5 b16.5 ± 6.4 a7.2 ± 0.2 a17.2 ± 5.1 a
CaCO3 (g·kg−1)102.2 ± 6.0 a100.2 ± 10.2 a106.1 ± 11.6 a74.3 ± 12.9 a43.6 ± 47.3 a69.5 ± 14.3 a
Organic C (g·kg−1)4.8 ± 1.0 a3.2 ± 0.7 ab2.3 ± 1.2 b2.5 ± 1.8 a0.9 ± 0.8 a1.7 ± 1.3 a
TN (g·kg−1)0.5 ± 0.1 a0.4 ± 0.0 a0.4 ± 0.0 a0.3 ± 0.1 a0.2 ± 0.0 a0.3 ± 0.0 a
Olsen-P (mg·kg−1)19.6 ± 9.6 a12.3 ± 6.3 a17.8 ± 6.2 a13.7 ± 9.7 a9.6 ± 4.6 a12.2 ± 3.2 a
Bs (mg·L−1)2.5 ± 0.4 a1.8 ± 1.5 a0.5 ± 0.3 a1.5 ± 0.7 a1.6 ± 0.4 a1.2 ± 0.3 a
HWSB (mg·kg−1)2.4 ± 1.9 a5.7 ± 3.5 a2.0 ± 1.0 a1.3 ± 1.2 a2.6 ± 1.2 a1.9 ± 0.8 a

3.3. Effects of Irrigation on Soil Properties

Following 30 months of irrigation, the pH values fell significantly in soil TH due to RWW use (Table 2) but always remained above 8.2. No significant changes were observed in soil TT. RWW irrigation led to a significant increase in the ECs of soil TT at both depths studied (Table 2). Although in the other cases the effects of irrigation on ECs were not statistically significant, soluble salts tended to accumulate in the upper zone of the profiles (0–20 cm) with both types of water. The great variability of EC data was remarkable in soil TH. Mean SAR values were generally not affected by irrigation, except in soil TH (20–40 cm) and soil TT (0–20 cm) where RWW irrigation resulted in a significant fall (Table 2). In relation to initial soil, irrigation with DBW and RWW caused a significant increase in B levels (Bs and HWSB) for soil TT (0–20 cm), whereas in soil TH a significant increase in HWSB only was observed at 0–20 cm following DBW irrigation (Table 2). Compared to the initial content, organic C fell significantly in soil TH (20–40 cm) following RWW irrigation (Table 2). No significant changes were observed in the other cases. Available P tended to increase in soil irrigated with RWW but the increase was only significant for soil TH (Table 2). Total N levels were not affected by irrigation with either type of water in any of the soils (Table 2).

3.4. Leaf Mineral Composition

The mineral composition of the young (~1 month) and mature (~6 months) leaves of the JCL plants is given in Table 3. The statistical results show that, in the former, the concentrations of N, P, Ca, S, Cu, Mn and Zn were significantly affected by the soil type but not by the type of irrigation water. With the exception of Ca, the plant concentrations of the studied elements were higher in the clay-loam soil (TH) (Table 3). Boron content, however, was significantly influenced by both factors (soil type and water type). For the same soil type, leaf B levels were always significantly higher with DBW irrigation, while for the same water quality leaf B levels were significantly higher in soil TT (Table 3).
Table 3. Mineral composition of young (~1 month) and mature leaves (~6 months) of Jatropha curcas L. irrigated with DBW and RWW in different types of soil; mean ± standard deviation; n = 3 for treatment.
Leaf TypeNutrientSoil THSoil TT
DBWRWWDBWRWW
Leaf ~ 1 monthN (g·kg−1)46.3 ± 3.056.3 ± 3.231.1 ± 4.225.9 ± 2.5 *
P (g·kg−1)6.3 ± 1.47.6 ± 0.35.4 ± 0.94.6 ± 0.8 *
K (g·kg−1)34.0 ± 3.738.5 ± 2.048.0 ± 5.639.8 ± 12.5
Ca (g·kg−1)7.5 ± 1.36.7 ± 0.310.1 ± 1.610.1 ± 1.6 *
Mg (g·kg−1)7.8 ± 1.06.4 ± 0.211.1 ± 1.210.5 ± 1.9
Na (g·kg−1)7.6 ± 2.84.1 ± 0.55.3 ± 0.77.7 ± 0.6
S (g·kg−1)2.6 ± 0.33.1 ± 0.12.4 ± 0.02.0 ± 0.0 *
B (mg·kg−1)109.5 ± 20.868.3 ± 9.3246.1 ± 16.5196.5 ± 14.6 * β α
Cu (mg·kg−1)12.6 ± 2.115.0 ± 1.39.3 ± 2.97.8 ± 2.1 *
Fe (mg·kg−1)362.3 ± 73.7357.0 ± 22.3310.6 ± 8.0454.8 ± 149.7
Mn (mg·kg−1)36.4 ± 12.648.6 ± 0.629.3 ± 4.129.3 ± 4.0 *
Zn (mg·kg−1)34.0 ± 8.346.0 ± 1.126.4 ± 6.019.5 ± 5.4 *
Leaf ~ 6 monthsN (g·kg−1)17.0 ± 2.620.1 ± 2.517.0 ± 1.414.2 ± 0.4 *
P (g·kg−1)4.4 ± 0.65.5 ± 1.24.0 ± 0.82.5 ± 0.2 *
K (g·kg−1)16.0 ± 2.315.4 ± 1.243.1 ± 5.934.0 ± 5.2 *
Ca (g·kg−1)19.6 ± 4.726.2 ± 3.627.7 ± 3.624.6 ± 2.0
Mg (g·kg−1)11.0 ± 1.914.6 ± 1.317.4 ± 2.614.4 ± 1.3 *
Na (g·kg−1)25.2 ± 7.019.4 ± 2.88.5 ± 2.88.5 ± 0.8 *
S (g·kg−1)1.4 ± 0.21.5 ± 0.11.6 ± 0.21.3 ± 0.2
B (mg·kg−1)459.0 ± 101.0279.3 ± 31.3583.8 ± 165369.6 ± 70.8 β
Cu (mg·kg−1)8.8 ± 0.510.2 ± 1.36.9 ± 1.96.3 ± 1.3 *
Fe (mg·kg−1)914.0 ± 129.3921.0 ± 212.0654.0 ± 265.3737.7 ± 29.7
Mn (mg·kg−1)56.8 ± 12.770.2 ± 2.948.2 ± 5.443.9 ± 2.8 *
Zn (mg·kg−1)14.4 ± 2.814.1 ± 0.721.8 ± 6.718.5 ± 3.7
* at the end of a row indicates significant effect of soil type; β at the end of a row indicates significant effect of water type; α at the end of a row indicates significant effect of soil type—water type interaction.
In comparison with the young leaves, the mature leaves contained less N (significant in all cases) and P (significant in both soils only for RWW). The following elements also showed larger concentrations in young than in old leaves: K (significant only in soil TH with both water treatments), S (significant in all cases), Zn and Cu (significant only in soil TH for both water treatments). The following elements presented larger concentrations in old leaves: Na (significant only in soil TH for both water treatments), Ca (significant in all the cases), Mg and Mn (significant in all cases but in soil TH with DBW), B (significant in all the cases), and Fe (all cases but soil TT with DBW).
As with the young leaves, old leaf B levels were always significantly higher with DBW irrigation within the same soil. The soil-water combination producing the largest accumulation of B in leaves was TT-DBW (584 mg·kg−1), followed by TH-DBW (459 mg·kg−1), >TT-RWW (370 mg·kg−1) > TH-RWW (279 mg·kg−1) (Table 3).

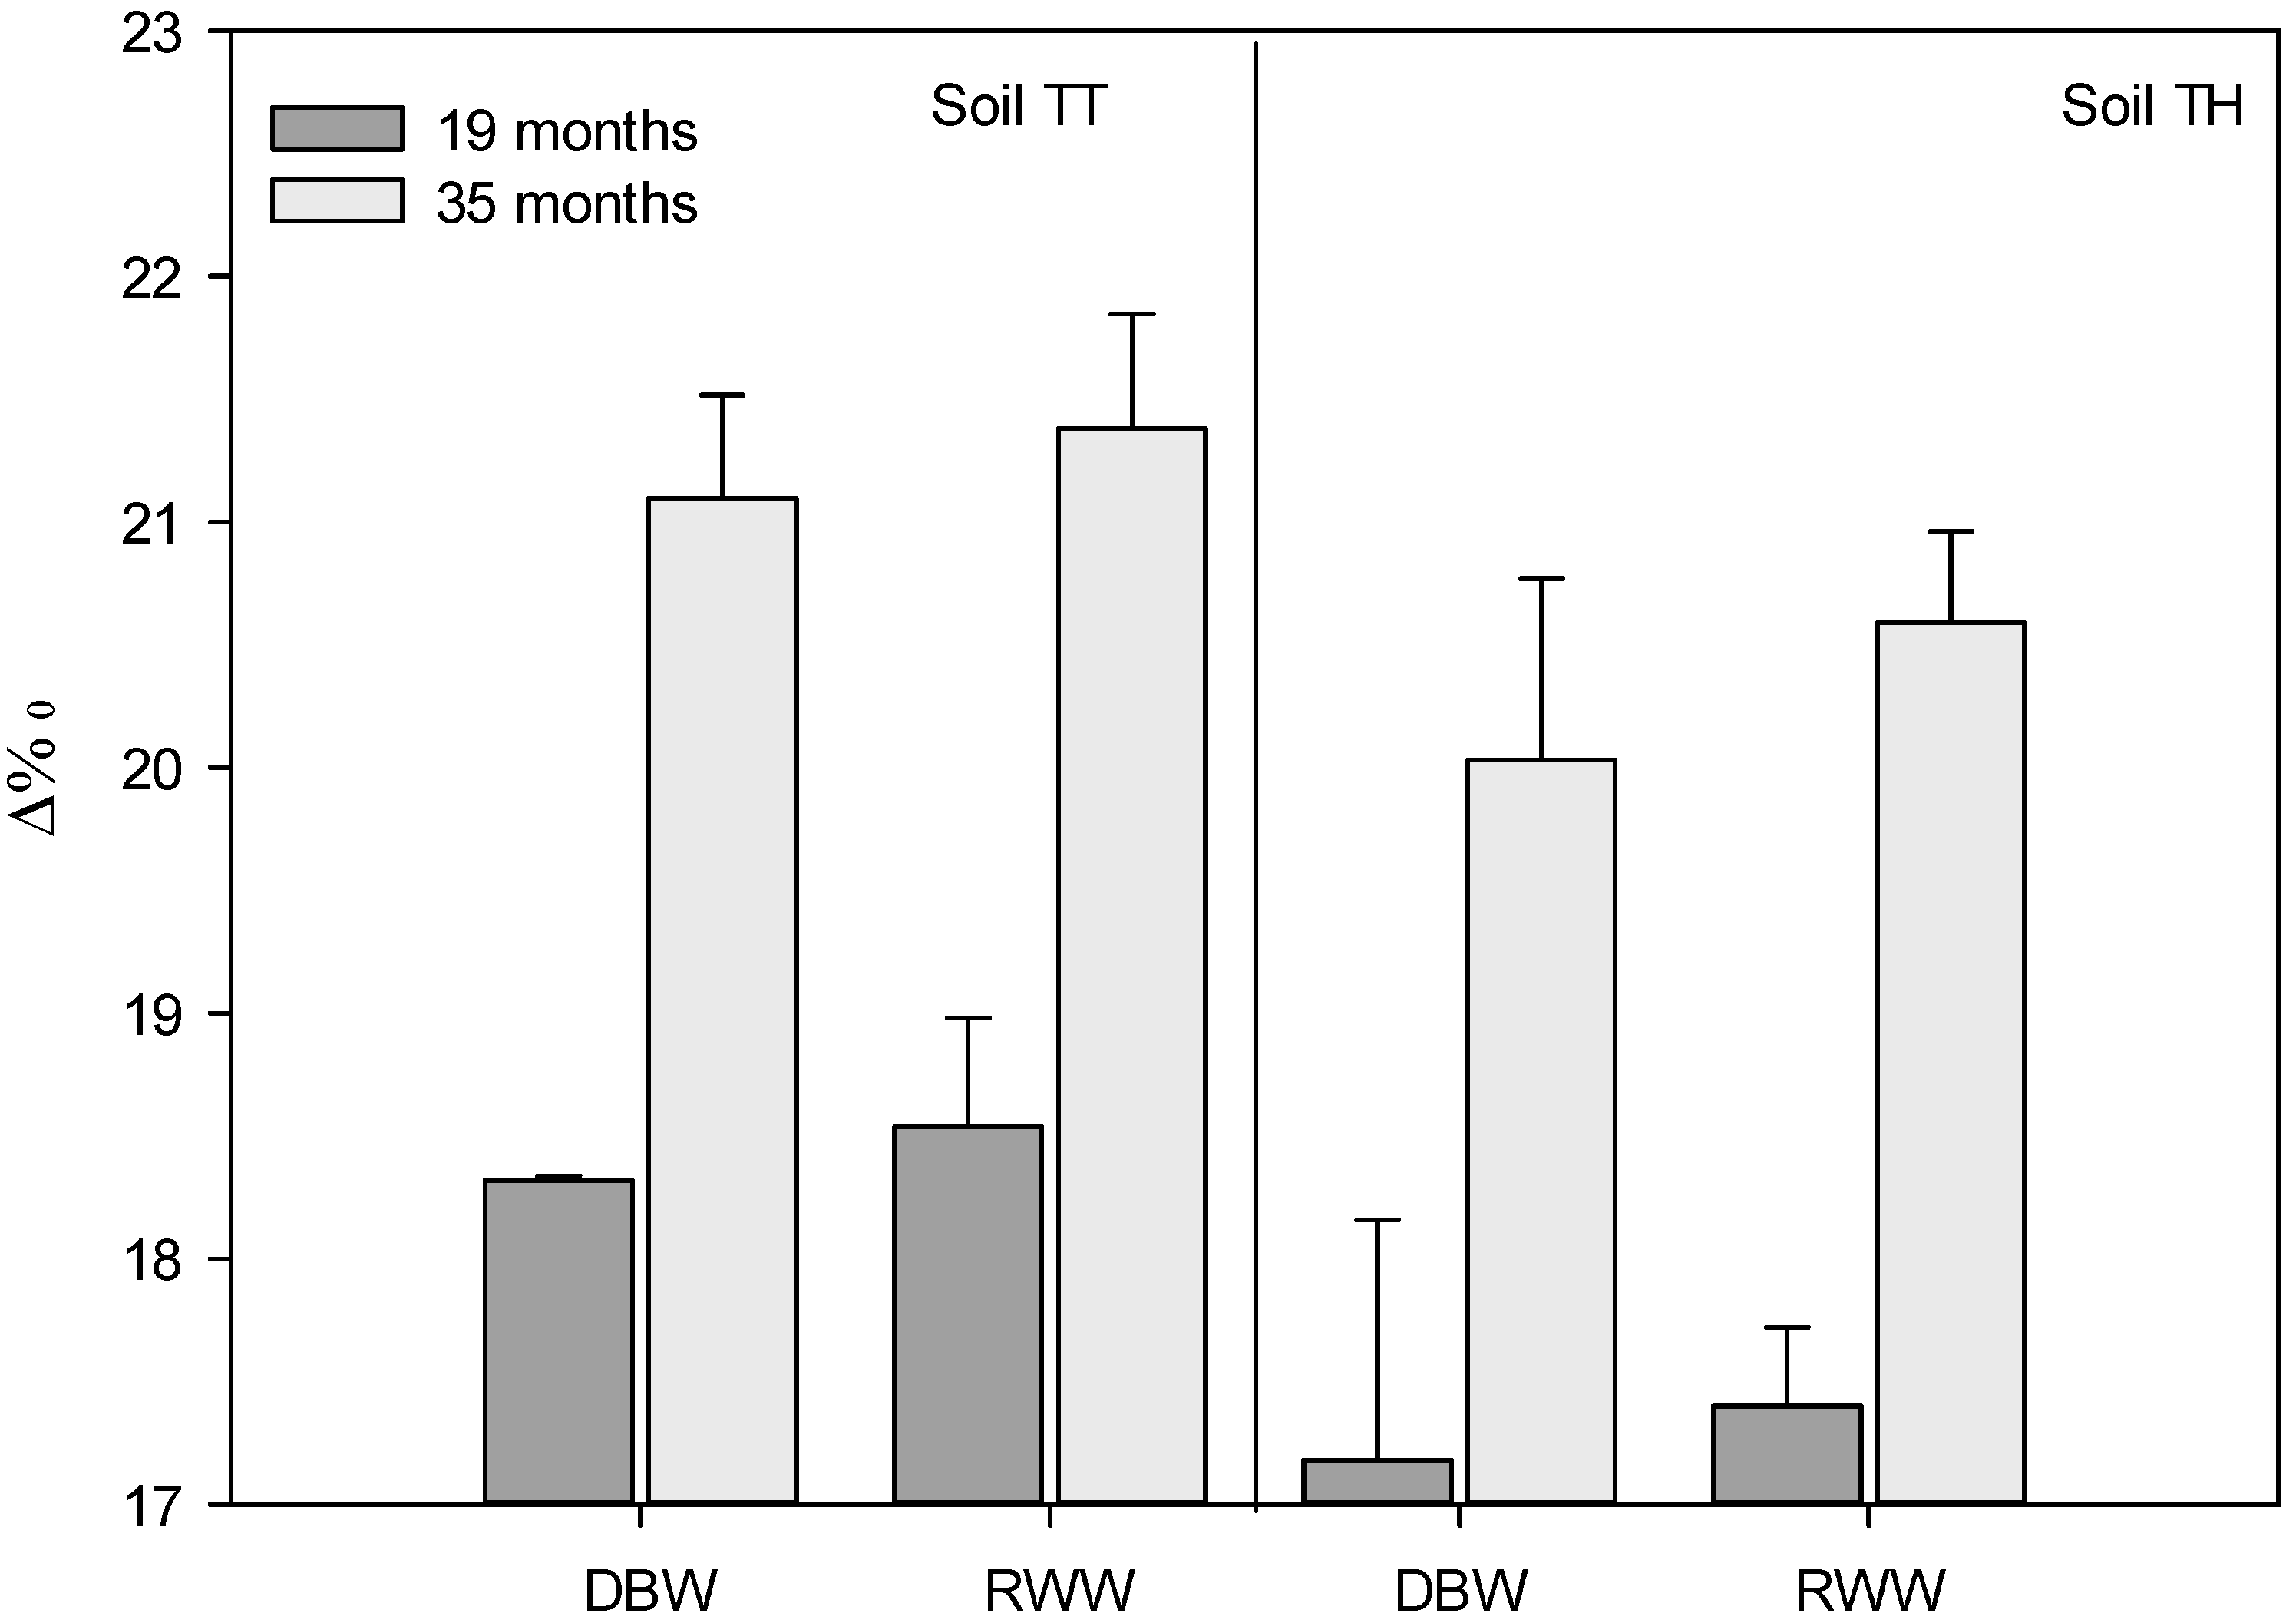
3.5. Stable Carbon Isotope Discrimination

Figure 2 shows the values of ∆ under the different treatments at two stages of the experiment. Results showed that ∆ was significantly influenced (p < 0.05) by the soil factor, but no water quality effects were statistically significant. For the same type of water, the levels of ∆ were higher in soil TT than in soil TH, while for the same type of soil average ∆ increased under irrigation with RWW. ∆ also increased with time regardless of treatment.
Figure 2. Stable carbon isotope discrimination values (∆%0) at different stages of the experiment and under the different treatments; means ± standard deviation; n = 3.
Sustainability 06 06902 g002

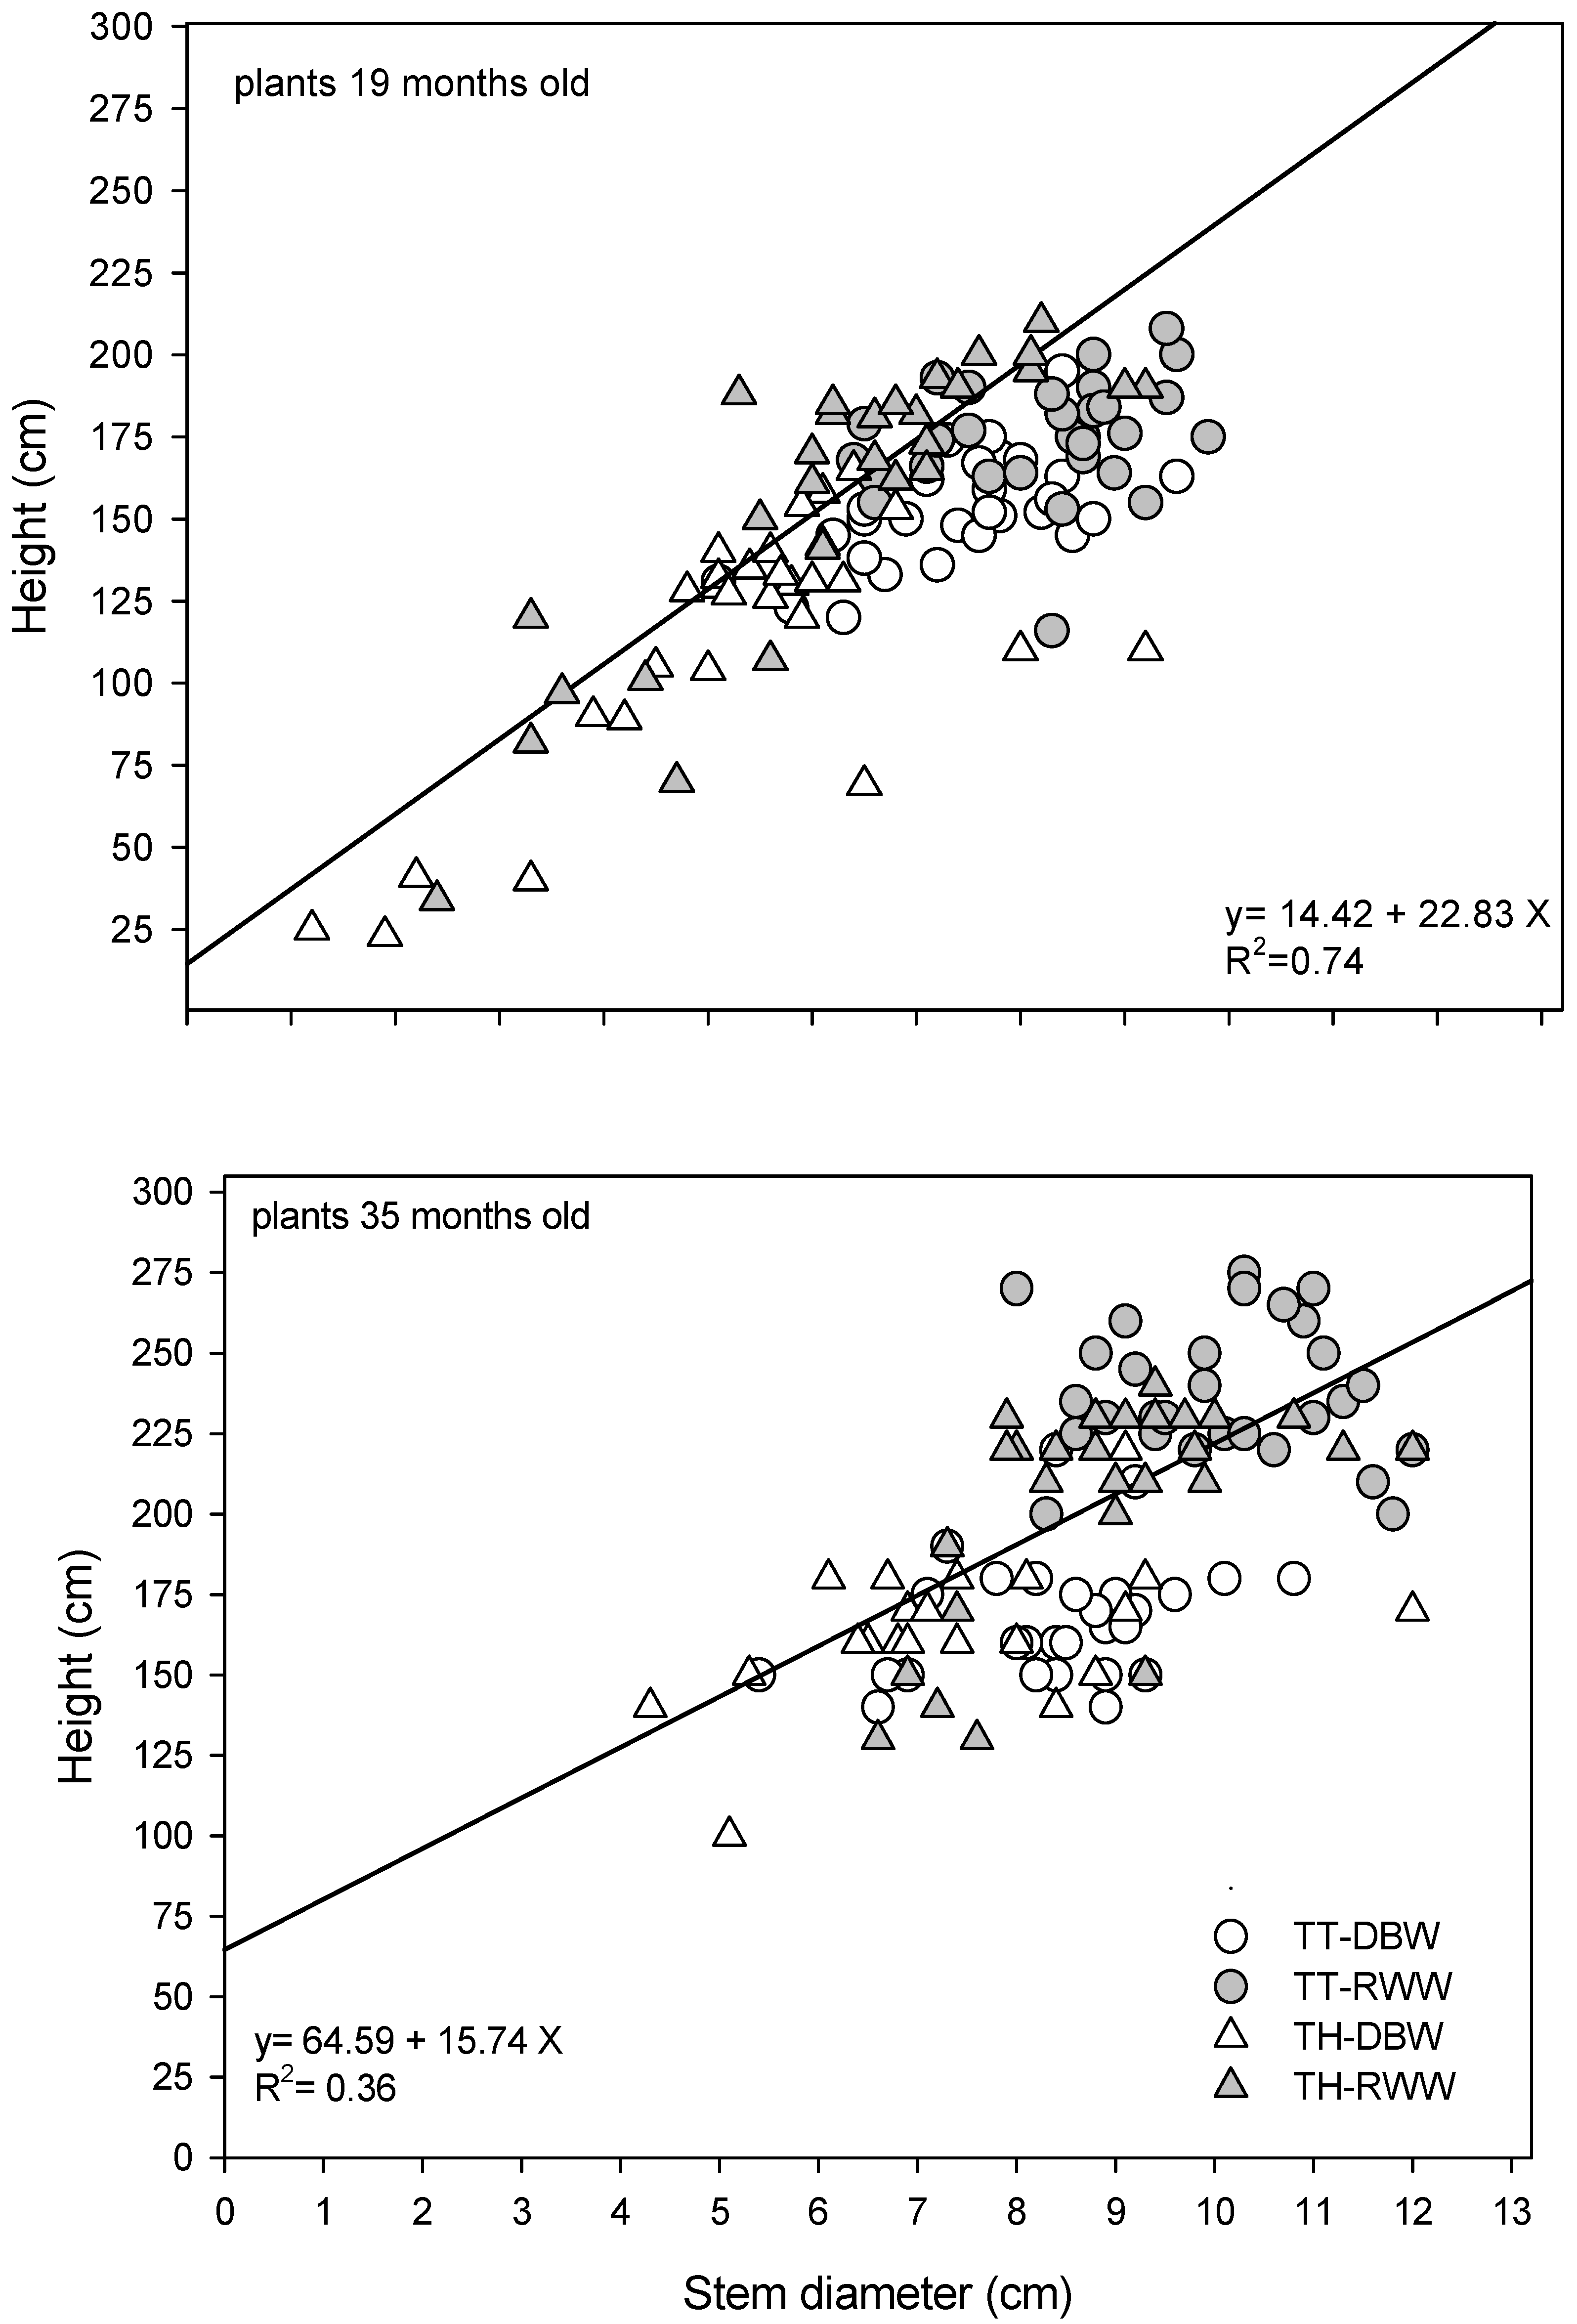
3.6. Plant Morphometrical Characteristics

Figure 3 shows the relationship between the base diameter and height of the plants 19 and 35 months after planting. The two-way ANOVA results indicate that both morphometrical variables were significantly affected (p < 0.05) by the soil and water factor, but not by the interaction between them. The soil-water combination resulting in plants with the greatest base diameter and height was TT-RWW followed by TH-RWW > TT-DBW > TH-DBW. The mean base diameter of the combinations was 10.1, 8.9, 8.4 and 7.4 cm, respectively, for the 35-month plants, while the mean height was 238, 204, 167 and 164 cm, respectively. Thus, for the same soil type, irrigation using RWW proved better for plant growth than DBW irrigation, while for the same type of water the sandy-loam soil (TT) proved more favorable than the clay-loam soil (TH).

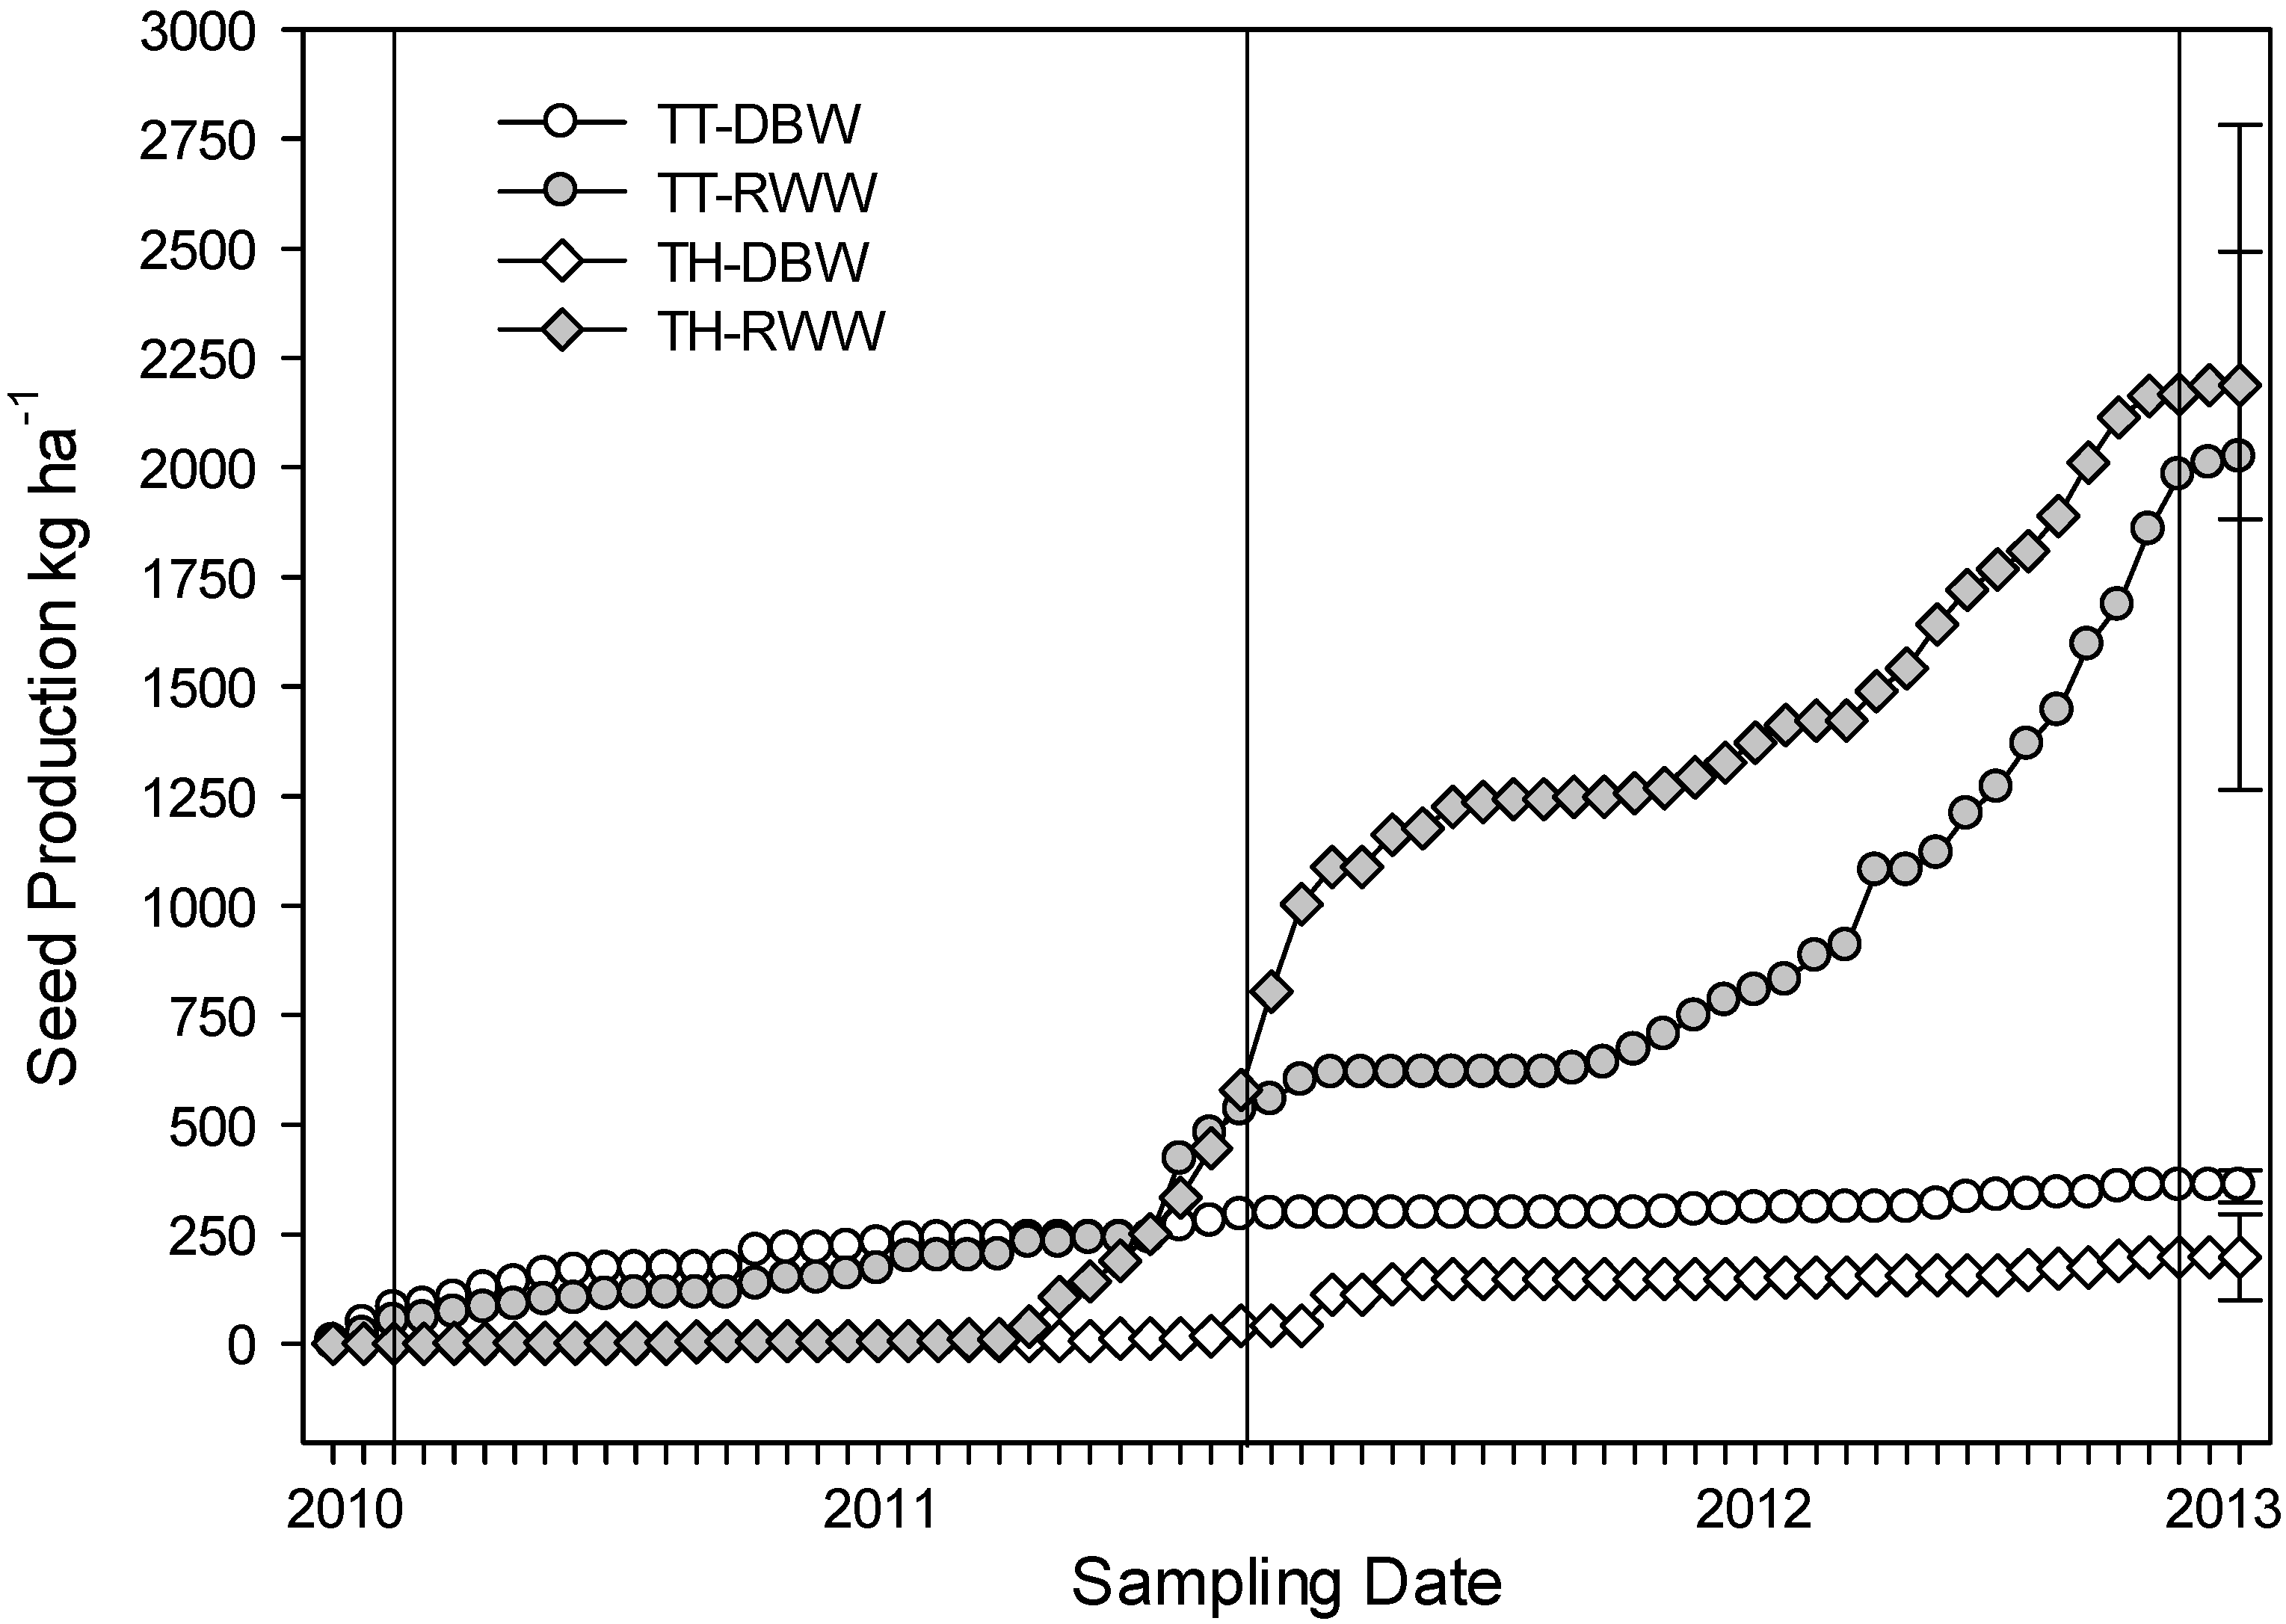
3.7. Seed Production

The cumulative seed production during the 39 months of cultivation for the different treatments is shown in Figure 4. The first collection of fruit was carried out in December 2010, approximately one year after planting. A further 63 collections were performed, mainly during the period August to March. The two-way ANOVA results show that seed production was significantly affected by the type of irrigation water (p = 0.02) but not by soil type (p = 0.984) or by the interaction between the two factors (p = 0.566). Production under RWW irrigation increased by a factor of 12 with respect to that obtained using DBW (mean ~2258 vs. 197 kg·ha−1). Yields followed the order TH-RWW > TT-RWW > TT-DWB > TH-DBW, with mean values of 0.45, 0.41, 0.09 and 0.04 kg·plant−1 respectively.
Figure 3. Stem diameter and height of Jatropha curcas L. at two different stages of cultivation and under the different treatments; n = 24–30.
Sustainability 06 06902 g003
Figure 4. Cumulative seed production during the study period (Jan 2010–March 2013) under the different treatments; means ± standard deviation; n = 3 for treatment.
Sustainability 06 06902 g004

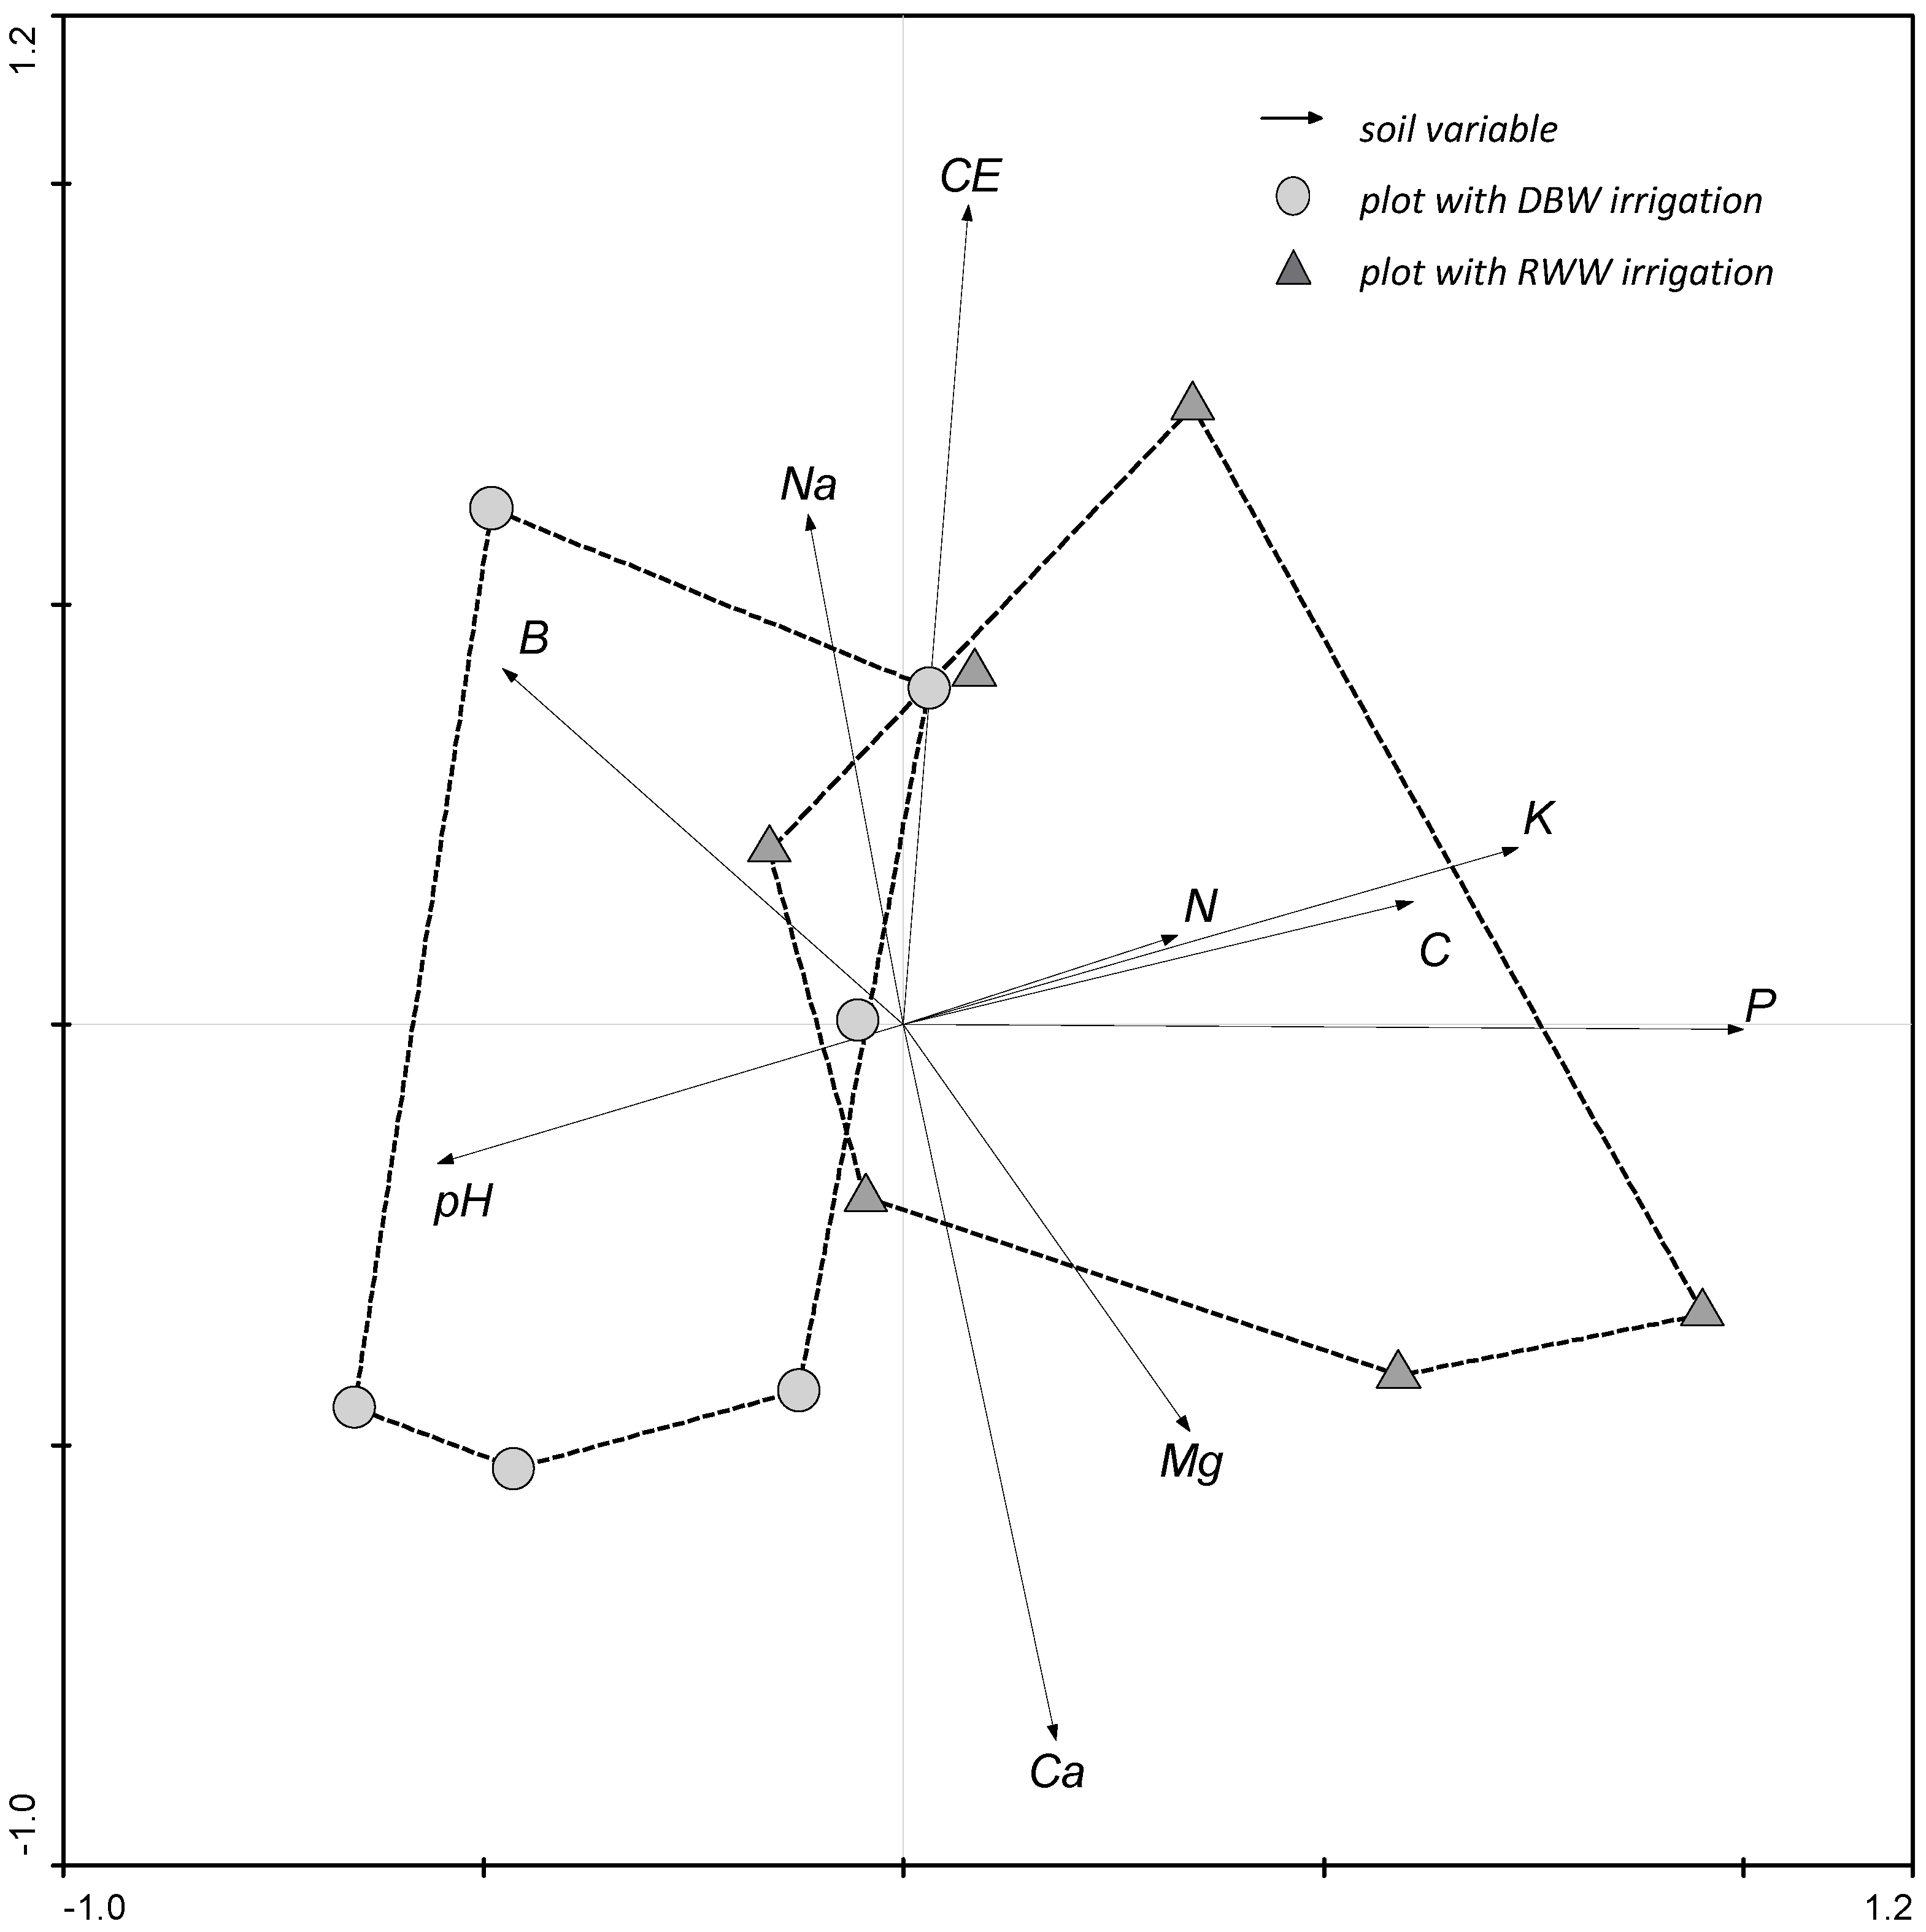
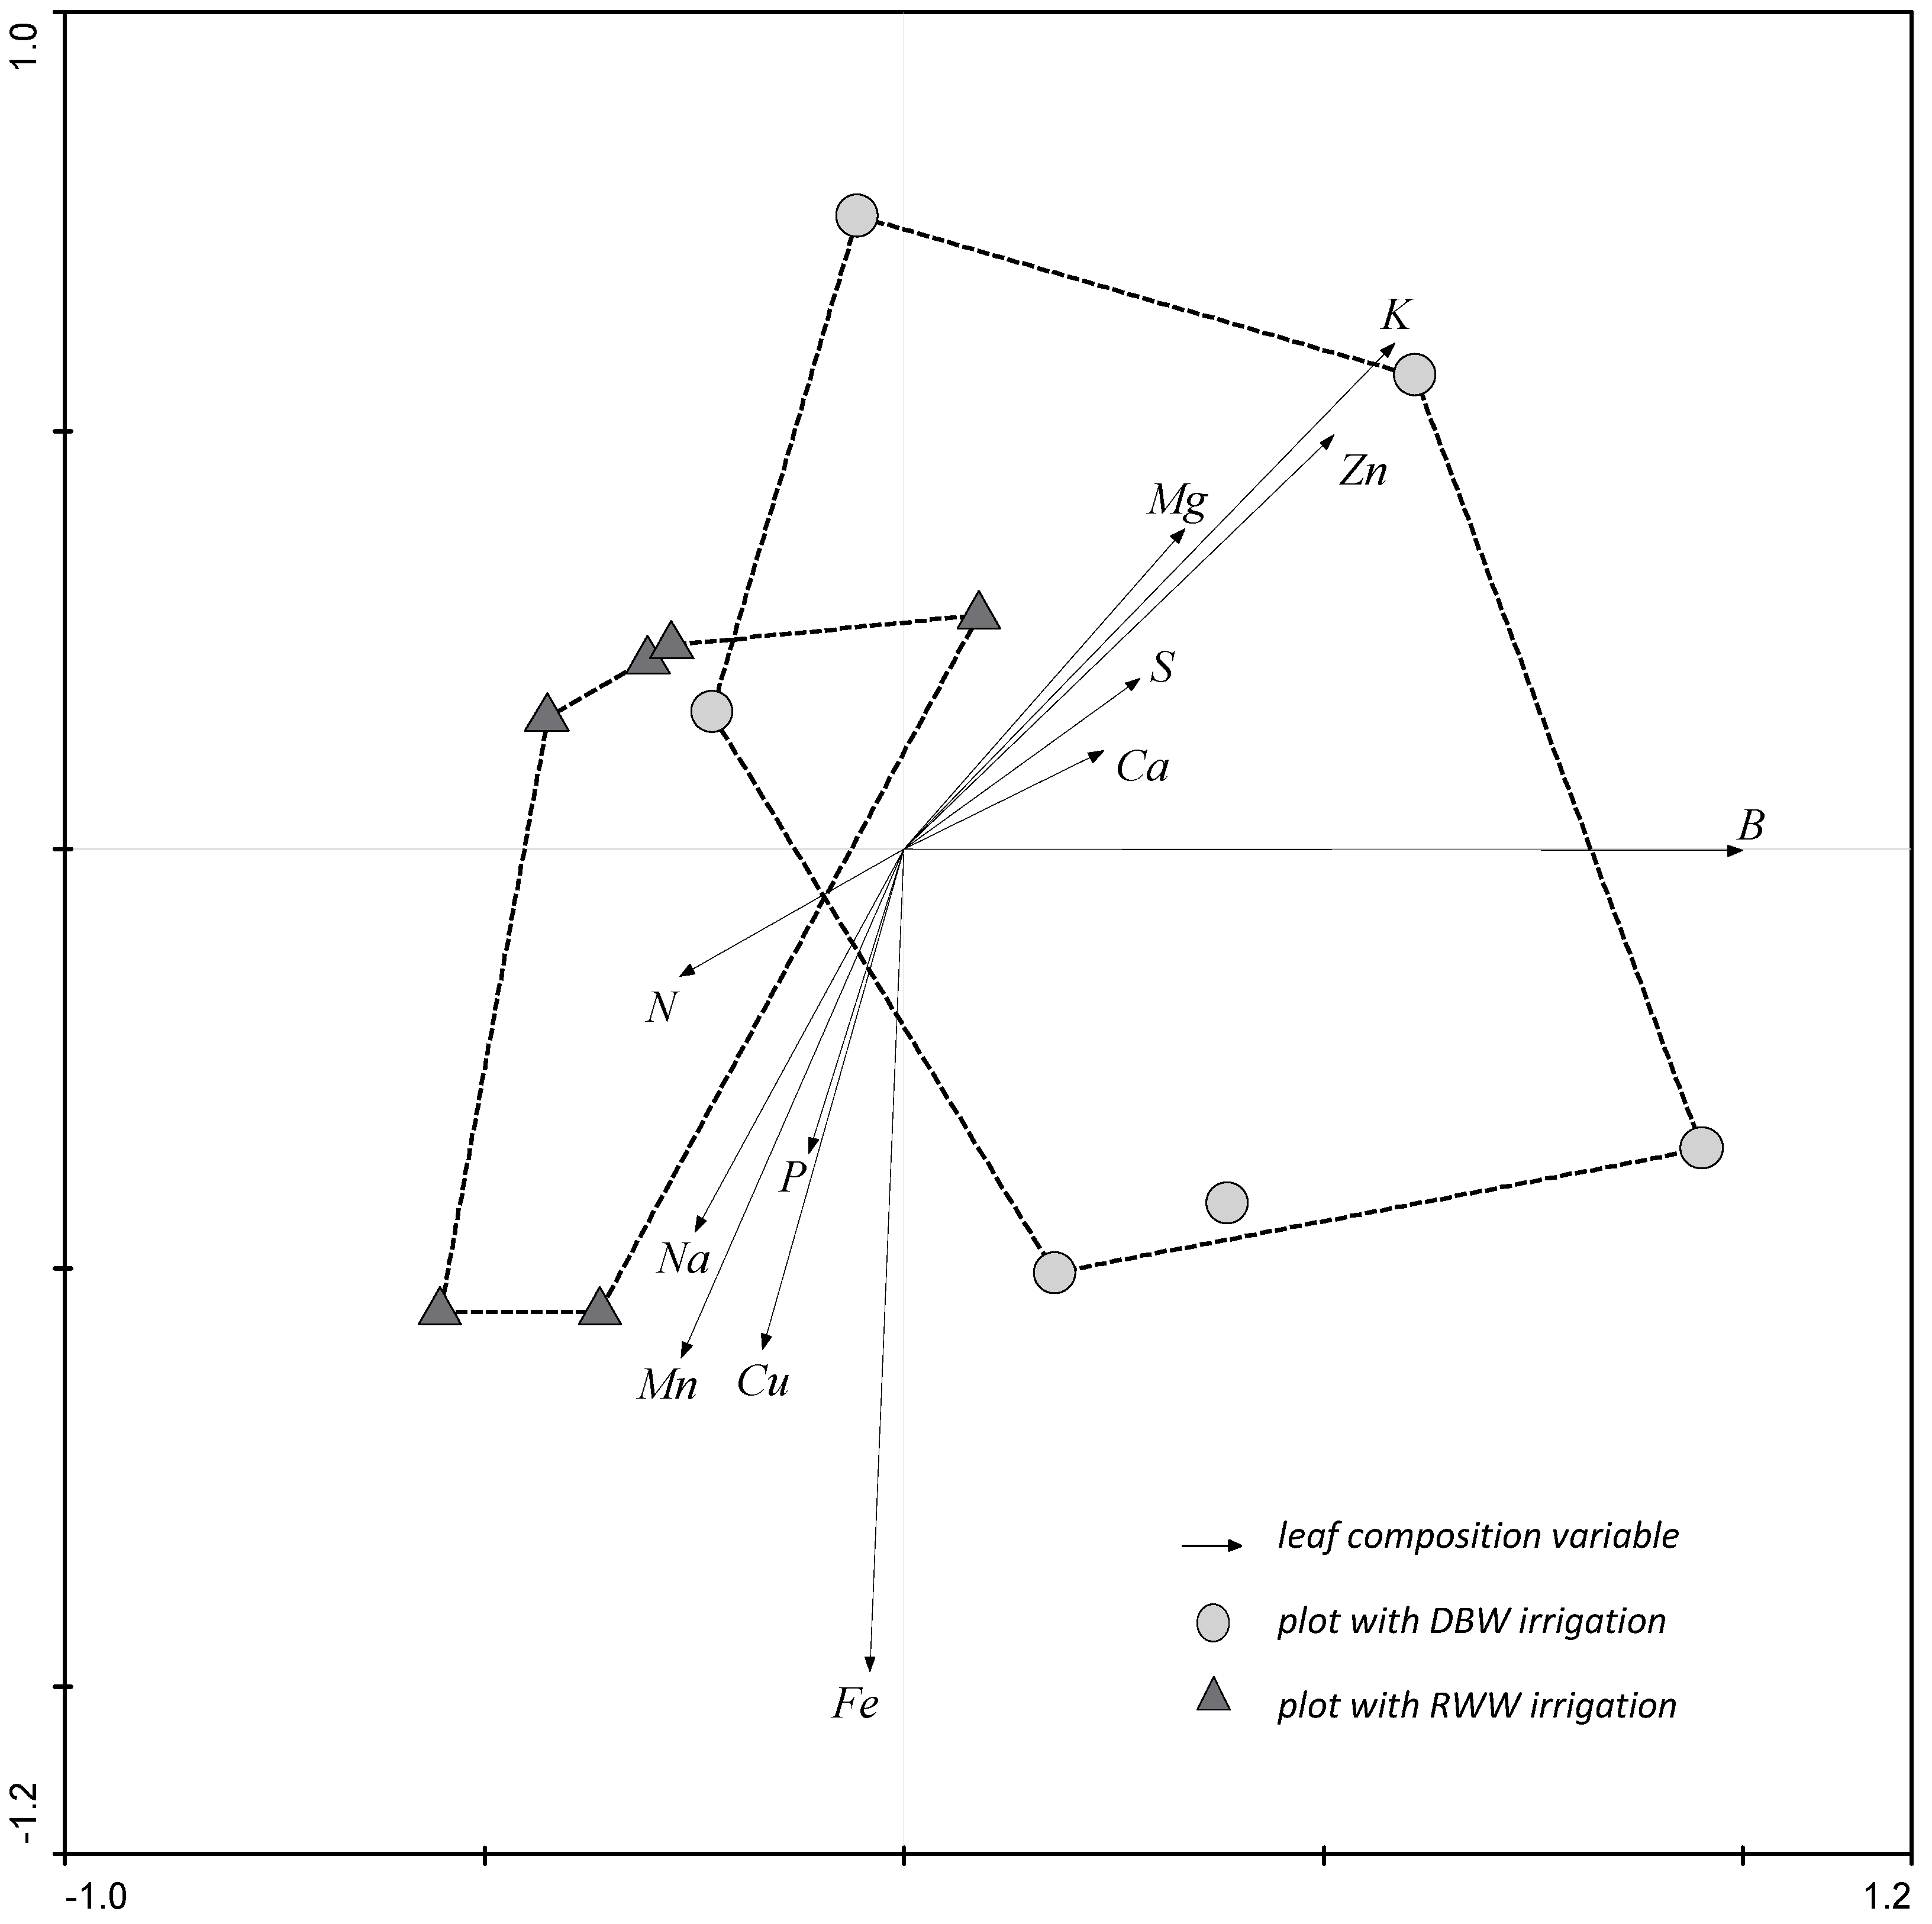
3.8. Relationship between Productivity, Soil Properties and Mineral Plant Composition

Exploratory multivariate analyses (PCA) were performed to assess the main tendencies between soil properties and plant composition with productivity.
Figure 5. Soil sample ordination from top 0–20 cm layer in plots irrigated with DBW and RWW, using PCA; n = 12; eigenvalue of axis I and II, 0.647 and 0.271, respectively.
Sustainability 06 06902 g005
Ca (exchangeable calcium); Mg (exchangeable magnesium); K (exchangeable potassium); Na (exchangeable sodium); EC (electrical conductivity); P (available phosphorous); C (organic carbon); N (total nitrogen); B (boron in saturated extract). Graph interpretation: each arrow points in the direction of steepest increase of value for the corresponding parameter. Angles between arrows indicate correlations between parameters. The distance between sample symbols approximates the dissimilarity of their parameter composition. Perpendicular projections of sample symbols onto the line overlaying the arrow of a particular parameter approximates the abundance of that parameter in individual samples. The sample points are in the order of predicted increase of abundance of a particular parameter. The predicted increase occurs in the direction indicated by the arrow.
Figure 5 shows the PCA ordination and distribution of the study plots according to the soil properties for surface layers (0–20 cm). In this analysis the percentage of variance explained by the first two components (axes I and II) was 91.8%, indicating that the conclusions derived from the 2-dimensional figure are representative of the true ordination of the samples. Only component I significantly correlated with productivity (r = 0.647; p = 0.044). The variables with the greatest positive weight in this component were P-Olsen and exchangeable K (score = 0.9998 and 0.7305, respectively), whereas those with the greatest negative weight were pH and B (score = −0.5550 and −0.4770, respectively). Equally, for 20–40 cm (PCA ordination not shown), productivity correlated significantly only with component I (r = 0.593; p = 0.042). The variables with the greatest positive weight in this component were P Olsen and exchangeable Mg (score = 0.9885 and 0.6551, respectively), while once again those with the greatest negative weight were Bs and pH (score = −0.6245 and −0.4803, respectively). There was no correlation between productivity and component II, where the variables with greatest weight were ECs (score = 0.9753) for the 0–20 cm depth and exchangeable Na (score = 0.9792) for 20–40 cm (not shown).
Figure 6. Tissue sample ordination from leaves 6 months old in plots irrigated with DBW and RWW, using PCA; n = 12; eigenvalue of axis I and II, 0.976 and 0.020, respectively.
Sustainability 06 06902 g006
Ca (calcium); Mg (magnesium); K (potassium); Na (sodium); P (phosphorous); N (nitrogen); B (boron); Fe (iron); Mn (manganese); Cu (copper); Zn (zinc); S (sulfur).
Figure 6 shows the PCA ordination and distribution of the study plots based on the mineral composition of JCL mature leaves. As occurred with the soils, the percentage of variance explained by the first two components was very high (99.6%). In this ordination, component I correlated negatively with seed production (r = −0.625; p = 0.030). In this component, the variable with the greatest positive weight was Bs (score = 1.0000), while the one with the greatest negative weight, albeit to a much lesser degree, was N (score = −0.2680). In PCA ordination, using young leaves (not shown), neither of the two resulting components correlated significantly with production.

4. Discussion

4.1. Effects of Irrigation on Soil Properties

With regard to EC, the accumulation of soluble salts in the upper zone of the profiles (0–20 cm) with both types of water might be a potentially limiting factor for production in numerous crops [29]. High SAR values, such as those found in these soils, can lead to a deterioration of soil physical properties and, consequently, to a reduction in plant yield [30,31]. Bearing in mind the interaction between ESP and the electrolyte concentration in the soil solution, continuous irrigation with RWW is unlikely to cause structural degradation given that the relatively high RWW salinity counteracts the high SAR and resulting ESP [31]. However, soil structure problems are much more likely to occur in soils irrigated with DBW given the latter’s low salinity (~0.3 dS·m−1).
In relation to Bs, the mean values exceeded, in the majority of cases, the threshold established for boron-sensitive plants (0.7–1.0 mg·L−1) [29]. Significant Bs increases in soil as a result of irrigation with RWW and DBW have been reported by other authors [32,33]. The high B content in the RWW and DBW in the present study, above the recommended limit for irrigation water (~0.75 mg·L−1) [34] is a consequence of its high content in the seawater (~4.5 mg·L−1) and saline groundwater (~2.70 mg·L−1) respectively, which is not effectively reduced by reverse osmosis during desalination.
No changes or decrease in organic C contents in soils irrigated with RWW seem to be at odds with those reported in other studies, where an increase in organic C was observed due to the application of RWW [35,36]. However, the incorporation of easily degradable organic substances as a result of RWW use can increase both the microbial population and microbial activity and, consequently, can increase organic-matter mineralization [37]. Although in our study the increase was only significant for soil TH, the tendency to increase available P in soil irrigated with RWW is reported also by some authors [35,36]. The differences might be accounted for by the greater P removal by JCL compared to the crops used in the aforementioned studies. Relative to TN levels, Leal et al. [38] did not observe any variation in TN content in soils irrigated for 16 months with RWW, a finding in accordance with our results.

4.2. Leaf Mineral Composition

The lesser content of N and P in mature leaves in comparison with the young leaves, agrees with the behavior of these elements, which are largely withdrawn from senescent leaves before leaf abscission [39].
For the same soil type, the high leaf B levels, both in young and old leaves, with DBW irrigation, reflects the important differences in B concentrations between both water types. This reflects the trend of B accumulation in leaves in function of B in solution and time [40].
The Na and B values observed were higher in comparison with the values found in the literature (3.1–3.6 g·kg−1 for Na [17] and 29.2–52.3 mg·kg1 for B [17,18,19,20,21,22,23,24,25,26,27,28,29,30,31,32,33,34,35,36,37,38,39,40,41]), while the rest of the nutrient levels are within the ranges reported by other authors for JCL [17,41,42]. These results reflect the effect of both water qualities.
The larger levels of most minerals in the plant leaves of the clay-loam soil (TH) could be associated with this soil’s greater nutrient retention capacity. Thus, Valdés-Rodríguez et al. [21] note that clay-loam soils, generally with higher concentrations of nutrients than sandy soils, may well be more suitable for JCL cultivation. A high soil buffer capacity can reduce element uptake as in the case of B. In accordance, B plant concentrations in young leaves for soil TH was a factor of two less than in soil TT, for each water type.

4.3. Stable Carbon Isotope Discrimination

Determination of stable carbon isotopic composition (δ13C) in plants can provide a valuable quantitative index of the cumulative stress experience of the plant [43]. Environmental stress-causing factors such as water, light, salinity and air pollution, affects the fractionation of carbon isotope composition in the plant tissue due to its effect on CO2 fixation and transpiration [28,44,45]. Stressful conditions to the plant reduce stomatal conductance and affect CO2 ratios inside/outside the leaf leading to a decrease in Δ with respect to optimal conditions [28]. The higher ∆ values founded in JCL plants growing in TT soil indicate that those plants were under less stress, which is in agreement with the better plant development in that soil. Similarly, although in this case differences are not statistically significant, higher mean ∆ values in plants irrigated with RWW suggest that those plants experienced less stress than those irrigated with DBW. The trend of a higher stress with DBW irrigation could be associated to a large portion of B and a minor content of nutrients present in that water. On the other hand, the B uptake by plants irrigated with RWW may be reduced because of the associations of B with dissolved organic matter [46]. The increase of ∆ with time indicates that the overall stress experience was greater when the plants were younger.

4.4. Plant Morphometrical Characteristics

Valdés-Rodríguez et al. [21] found better plant development of JCL in sandy-loam soils than in clay-loam soils, results coinciding with our study. Other authors have also noted the preference of JCL for sandy soils, which are more favorable to root development than clay soils [10,11,12,13,14]. Other studies, however, have found no influence of soil texture on JCL growth variables [47].
The results reported in the literature concerning the influence of irrigation water quality on JCL growth are also contradictory. Whereas Nery et al. [48] and Cavalcante-Sousa et al. [49] found significant reductions in growth variables when irrigation water EC exceeds 3.0 dS·m−1 and 1.6 dS·m−1 respectively, Veras et al. [50] did not observe any significant changes in plant height and stem diameter when the EC was increased (EC = 0.6; 1.8; 3.0; 4.2 and 5.4 dS·m−1). Likewise, De Miguel et al. [17] found no growth differences in a comparison of two irrigation water qualities (groundwater EC = 2.1 vs. recycled water EC = 1.1 dS·m−1).
In the present study, the higher nutrient content and lower B content of the RWW may well be key factors in the improved development of the plants irrigated with this water. In this regard, Simón et al. [51] report a 30% reduction in JCL growth when the leaf B concentration reaches 1200 mg·kg−1 and suggest that a B concentration of 2.0 mg·L−1 or above in irrigation water (in our study the DBW figure is 1.9 mg·L−1) could be considered toxic for JCL plants.

4.5. Seed Production and Relationship with Soil Properties and Mineral Plant Composition

The level of production achievable with JCL cultivation is a controversial issue and the figures reported in the literature for annual seed production per hectare vary tremendously [4]. Generally speaking, a production range of between 0.4–12 t·ha−1·year−1 can be established [52]. Moreover, given that much of the data offered lacks information on the factors that influence production, such as the environmental conditions (precipitation, soil type), management practices (plant density, fertilization, and irrigation) and plant age [20,53,54,55], comparisons prove highly difficult.
Considering that JCL has a productive life of some 50 years [54] and that it attains maximum productivity after 4–5 years [8], our preliminary data can only be compared to production data covering the first three years of cultivation and under irrigation conditions. Prajapati & Prajapati [56] and Tewari [22] obtained figures of 250, 1000 and 2470 kg·ha−1 for Years 1, 2 and 3, respectively. Other authors have established 1250, 1500 and 5000 kg·ha−1 as the normal production figures for these three years [57]. Lower figures have been obtained for Year 3 in other studies, with maximum reported values of 750 kg·ha−1 [58] and 387 kg·ha−1 [59]. The production data obtained in the present study—maximum values of 170, 1200 and 1500 kg·ha−1 for Years 1, 2 and 3, respectively—are close to those reported by other authors.
The results obtained in PCA, according to the soil properties, suggest that the plots with the highest levels of P Olsen, exchangeable K and Mg and lowest pHs and Bs were more productive. Irrigation with RWW was generally more effective than with DBW in producing these conditions in the soil (Figure 5). Antagonistic relationships between P and B in JCL plants have been reported recently by Simón et al. [51]. Other authors have noted this antagonism in maize [60], tomatoes [61] and kiwi-fruit [62]. Thus, higher soil concentrations of K and Mg could restrict B uptake by JCL. With regard to soil pH, various authors consider that increased alkalinity limits JCL development and productivity [22,23,24,25,26,27,28,29,30,31,32,33,34,35,36,37,38,39,40,41,42,43,44,45,46,47,48,49,50,51,52,53,54,55,56,57,58,59,60,61,62,63]. The lack of correlation obtained between productivity and component II (dominated by EC) suggests that JCL is relatively tolerant to salinity. This tolerance has already been reported in other studies [14,15,16,17,18,19,20,21,22,23,24,25,26,27,28,29,30,31,32,33,34,35,36,37,38,39,40,41,42,43,44,45,46,47,48,49,50,51,52,53,54,55,56,57,58,59,60,61,62,63,64]. Furthermore, the interactions between salinity (for example SO42− and Cl) and B can reduce the accumulation of the latter in the plants, limiting its toxicity [65].
With reference to the PCA ordination and distribution of the study plots based on the mineral composition of JCL mature leaves, the results obtained suggest that B in the mature leaves was the key factor responsible for separating the DBW and RWW irrigated plots in the ordination and potentially constitutes a limiting factor for JCL production. The absence of correlation between the two components and the production in PCA ordination, using young leaves, indicate that the mineral composition of the 1-month leaves is not a good predictor of seed production.
The relationships between productivity and plant and soil variables suggest that B excess could be responsible for the very low productivity of the crops irrigated with DBW since no other nutrient limitations (surplus or deficiency) was apparent. Boron toxicity in JCL has been described by Simon et al. [50] who found, in a nutrient solution experiment, that when plants were treated with 2–4.5 mg·L−1 B, total dry weight was reduced by 19% and a leaf concentration about 270 mg·kg−1 caused a notable decline in photosynthetic activity. This range of B concentration was similar to our Bs concentration range. In our study, however, it is remarkable that the plants irrigated with RWW had considerably lower leaf B concentrations than those irrigated with DBW at similar soil B levels (Bs, HWSB); apart from the antagonistic, soil-mediated effects already mentioned, the associations of B with dissolved organic matter can have a role in reducing B uptake by plants, as suggested by Communar & Keren [46] in soils irrigated with treated sewage effluent.

5. Conclusions

In conclusion, the present study shows that JCL growth was significantly better in sandy-loam soils than in clay-loam soils, and under RWW irrigation compared to DBW. In terms of seed production, JCL productivity was significantly greater under RWW irrigation irrespective of the type of soil. The higher readily available nutrient content such as P and K provided by RWW, together with its lower B content appear to be the key factors behind the greater productivity observed with this water. Our study also confirms the moderate sensitivity of JCL to B. The mitigation effect of COD on B plant uptake in RWW irrigated soils deserves further research.
Under the experimental conditions of this study and bearing in mind that results correspond to the first three years of plantation the sustainability of this farming system seems to be threatened by soil degradation (particularly salinity and B). Therefore mid-long-term sustainability requires substantial improvements in RWW quality overall with respect to salinity and B levels. Also required are appropriate management practices, particularly the application of adequate leaching fractions and calcium amendments to prevent progressive increases in soil salinity and sodicity.

Acknowledgments

This work was funded by the DISA Company. The authors are grateful to the Pozo Negro Experimental Farm staff in the Fuerteventura Island, where the study was undertaken.

Author Contributions

The individual contributions and responsibilities of the authors were as follows: María Dorta-Santos conducted the field work, the data collection, the statistical analysis and prepared the draft of the manuscript. Francisco J. Díaz led the write up of the paper, analysed data, reviewed the document and participated in the field trials. The study was conceived by Marisa Tejedor, Concepción Jiménez and Jose M. Hernández-Moreno who coordinated the field trial and contributed to development of the final report. M. Pino Palacios-Díaz carried out the experimental design. All authors review and approved the final published manuscript.

Conflicts of Interest

The authors declare no conflict of interest.

References

  1. May, Y.K.; Tinia, I.M.G. A review of biodiesel production from Jatropha curcas L. oil. Renew. Sustain. Energy Rev. 2011, 15, 2240–2251. [Google Scholar] [CrossRef]
  2. Verrastro, F.; Ladislaw, S. Providing energy security in an interdependent world. Wash. Q. 2007, 30, 95–104. [Google Scholar] [CrossRef]
  3. Jingura, R.M. Technical options for optimization of production of Jatropha as a biofuel feedstock in arid and semi-arid areas of Zimbabwe. Biomass Bioenergy 2011, 35, 2127–2132. [Google Scholar] [CrossRef]
  4. Achten, W.M.J.; Verchot, L.; Franken, Y.J.; Mathijs, E.; Singh, V.P.; Aerts, R.; Muys, B. Jatropha bio-diesel production and use. Biomass Bioenergy 2008, 32, 1063–1084. [Google Scholar] [CrossRef] [Green Version]
  5. Kheira, A.A.A.; Atta, N.M.M. Response of Jatropha curcas L. to water deficits: Yield, water use efficiency and oilseed characteristics. Biomass Bioenergy 2009, 33, 1343–1350. [Google Scholar] [CrossRef]
  6. FAO. Food and Agriculture Organization of the United Nations Jatropha a Smallholder Bioenergy Crop. The Potential for Pro-Poor Development; FAO, Integrated Crop Management: Rome, Italy, 2010; Volume 8, pp. 1–114. [Google Scholar]
  7. Contran, N.; Chessa, L.; Lubino, M.; Bellavite, D.; Roggero, P.P.; Enne, G. State of the art of the Jatropha curcas productive chain, from sowing to biodiesel and by-products. Ind. Crops Prod. 2013, 42, 202–215. [Google Scholar] [CrossRef]
  8. Everson, C.S.; Mengistu, M.G.; Gush, M.B. A Field Assessment of the Agronomic Performance and Water Use of Jatropha curcas in South Africa. Biomass and Bioenergy. 2012. Available online: http://dx.doi.org/10.1016/j.biombioe.2012.03.013 (accessed on 30 April 2012).
  9. Behera, S.K.; Srivastava, P.; Tripathi, R.; Singh, J.P.; Singh, N. Evaluation of plant performance of Jatropha curcas L. under different agro-practices for optimizing biomass—A case study. Biomass Bioenergy 2010, 32, 30–41. [Google Scholar] [CrossRef]
  10. FACT. Position Paper on Jatropha curcas L. State of the Art, Small and Large Scale Project Development. Fuels from Agriculture in Communal Technology. 2007. Available online: http://www.fact-foundation.com/ (accessed on 10 September 2013).
  11. Maes, W.H.; Trabucco, A.; Achten, W.M.J.; Muys, B. Climatic growing conditions of Jatropha curcas L. Biomass Bioenergy 2009, 33, 1481–1485. [Google Scholar] [CrossRef]
  12. Da Fonseca, A.F.; Herpin, U.; de Paula, A.M.; Victóri, R.L.; Melfi, A.J. Agricultural use of treated sewage effluents, agronomic and environmental implications and perspectives for Brazil. Sci. Agric. 2007, 64, 194–209. [Google Scholar] [CrossRef]
  13. Ayers, R.S.; Westcot, D.W. Water Quality for Agriculture; FAO Irrigation and Drainage Paper 29 (Rev 1.); Food and Agriculture Organization of the United Nations: Rome, Italy, 1985. [Google Scholar]
  14. Dagar, J.C.; Tomar, O.S.; Kumar, Y.; Bhagwan, H.; Yadav, R.K.; Tyagi, K. Performance of some under-explored crops under saline irrigation in a semiarid climate in northwest India. Land Degrad. Dev. 2006, 17, 285–299. [Google Scholar] [CrossRef]
  15. FAO Ecocrop. Ecocrop Jatropha. 2010. Available online: http://ecocrop.fao.org/ecocrop/srv/en/dataSheet?id=1297 (accessed on 13 May 2013).
  16. Rajaona, A.M.; Sutterer, N.; Asch, F. Potential of Waste Water Use for Jatropha Cultivation in Arid Environments. Agriculture 2012, 2, 376–392. [Google Scholar] [CrossRef]
  17. De Miguel, A.; Martínez-Hernández, V.; Leal, M.; González-Naranjo, V.; Bustamante, I.; Lillo, J.; Martín, I.; Salas, J.J.; Palacios-Díaz, M.P. Short-term effects of reclaimed water of irrigation, Jatropha curcas L. cultivation. Ecol. Eng. 2012, 50, 44–51. [Google Scholar] [CrossRef]
  18. Heller, J. Physic Nut. Jatropha curcas L. Promoting the Conservation and Use of Underutilized and Neglected Crops. 1. [Internet Monograph]. Rome: International Plant Genetic Resources Institute. 1996. Available online: http://www.bioversityinternational.org/nc/publications/issue/physic_nut_emjatropha_curcasem_l.html (accessed on 15 August 2013).
  19. Kumar, A.; Sharma, S. An evaluation of multipurpose oil seed crop for industrial uses (Jatropha curcas L.): A review. Ind. Crops Prod. 2008, 28, 1–10. [Google Scholar] [CrossRef]
  20. Gour, V.K. Production practices including post-harvest management of Jatropha curcas. In Proceedings of the Biodiesel Conference toward Energy Independence—Focus of Jatropha, Hyderabad, India, 9–10 June 2006; Singh, B., Swaminathan, R., Ponraj, V., Eds.; Rashtrapati Bhawan: New Delhi, India, 2006; pp. 223–251. [Google Scholar]
  21. Valdés-Rodríguez, O.A.; Sánchez-Sánchez, O.; Pérez-Vázquez, A.; Ruiz-Bello, R. Soil texture effects on the development of Jatropha seedlings—Mexican variety “piñón manso”. Biomass Bioenergy 2011, 35, 3529–3536. [Google Scholar] [CrossRef]
  22. Tewari, D.N. Jatropha and Biodiesel, 1st ed.; Ocean Books Limited: New Delhi, India, 2007. [Google Scholar]
  23. FAO. Food and Agriculture Organization of the United Nations. In Crop Evapotranspiration—Guidelines for Computing Crop Water Requirements—FAO Irrigation and Drainage; Paper 56; FAO: Rome, Italy, 1998. [Google Scholar]
  24. Soil Survey Staff. Keys to Soil Taxonomy, 11th ed.; USDA, Natural Resources Conservation Service: Washington, DC, USA, 2010; p. 338. [Google Scholar]
  25. APHA. Standard Methods for the Examination of Water and Wastewater, 20th ed.; APHA Publication Office: Washington, DC, USA, 1998. [Google Scholar]
  26. Soil Survey Staff. Soil Survey Laboratory Methods Manual; Soil Survey Investigations Report 42; USDA-NRCS, National Soil Survey Center: Lincoln, NE, USA, 1996. [Google Scholar]
  27. USEPA. Method 3015-microwave assisted acid digestion of aqueous samples. In Test Methods for Evaluating Solid Waste, 3rd ed.; United States Environmental Protection Agency (USEPA): Washington, DC, USA, 1994; p. 26. [Google Scholar]
  28. Farquhar, G.D.; Ehleringer, J.R.; Hubick, K.T. Carbon isotope discrimination and photosynthesis. Annu. Rev. Plant Physiol. Plant Mol. Biol. 1989, 40, 503–537. [Google Scholar] [CrossRef]
  29. Grieve, C.M.; Grattan, S.R.; Maas, E.V. Plant salt tolerance. In ASCE Manual and Reports on Engineering Practice No. 71 Agricultural Salinity Assessment and Management, 2nd ed.; Wallender, W.W., Tanji, K.K., Eds.; ASCE: Reston, VA, USA, 2012. [Google Scholar]
  30. Qadir, M.; Schubert, S. Degradation processes and nutrient constraints in sodic soils. Land Degrad. Dev. 2002, 13, 275–294. [Google Scholar] [CrossRef]
  31. Muyen, Z.; Moore, G.A.; Wrigley, R.J. Soil salinity and sodicity effects of wastewater irrigation in South East Australia. Agric. Water Manag. 2011, 99, 33–41. [Google Scholar] [CrossRef]
  32. Tejedor, M.; Jiménez, C.; Hernández-Moreno, J.M.; Díaz, F. Tephra-mulched soils irrigated with reclaimed urban wastewater in former dry-farming systems of Lanzarote (Spain). Catena 2011, 84, 108–113. [Google Scholar] [CrossRef]
  33. Díaz, F.J.; Tejedor, M.; Jiménez, C.; Grattan, S.R.; Dorta, M.; Hernández, J.M. The imprint of desalinated seawater on recycled wastewater: Consequences for irrigation in Lanzarote Island, Spain. Agric. Water Manag. 2013, 116, 62–72. [Google Scholar] [CrossRef]
  34. Pereira, B.F.F.; He, Z.L.; Silva, M.S.; Herpin, U.; Nogueira, S.F.; Montes, C.R.; Melfi, A.J. Reclaimed wastewater: Impact on soil–plant system under tropical conditions. J. Hazard. Mater. 2011, 192, 54–61. [Google Scholar] [PubMed]
  35. Mohammad, M.J.; Mazahreh, N. Changes in soil fertility parameters in response to irrigation of forage crops with secondary treated wastewater. Commun. Soil Sci. Plant Anal. 2003, 34, 1281–1294. [Google Scholar] [CrossRef]
  36. Rusan, M.J.M.; Hinnawi, S.; Rousan, L. Long term effect of wastewater irrigation of forage crops on soil and plant quality parameters. Desalination 2007, 215, 143–152. [Google Scholar] [CrossRef]
  37. Chen, Y.; Dosoretz, C.G.; Katz, I.; Jüeschke, E.; Marschner, B.; Tarchitzky, J. Organic matter in wastewater and treated wastewater-irrigated soils, properties and effects. In Treated Wastewater in Agriculture, Use and Impacts on the Soil Environment and Crops; Levy, G., Fines, P., Bar-Tal, A., Eds.; Wiley-Blackwell Publishing Ltd.: Oxford, UK, 2011; pp. 400–414. [Google Scholar]
  38. Leal, R.M.P.; Firme, L.P.; Herpin, U.; da Fonseca, A.F.; Montes, C.R.; dos Santos Dias, C.T.; Melfi, A.J. Carbon and nitrogen cycling in a tropical Brazilian soil cropped with sugarcane and irrigated with wastewater. Agric. Water Manag. 2010, 97, 271–276. [Google Scholar] [CrossRef]
  39. Van Heerwaarden, L.M.; Toet, S.; Aerts, R. Nitrogen and phosphorus resorption efficiency and proficiency in six sub-arctic bog species after 4 years of nitrogen fertilization. J. Ecol. 2003, 91, 1060–1070. [Google Scholar] [CrossRef]
  40. Yermiyahu, U.; Ben-Gal, A. Boron Toxicity in Grapevine. HortScience 2006, 41, 1698–1703. [Google Scholar]
  41. Laviola, B.G.; Dias, L.A.D. Nutrient concentration in Jatropha curcas L., leaves and fruit and estimated extraction at harvest. Rev. Bras. Cienc. Solo 2008, 32, 1969–1975. [Google Scholar] [CrossRef]
  42. Chaudhary, D.R.; Ghosh, A.; Chikara, J.; Patolia, J.S. Soil characteristics and mineral nutrient in wild Jatropha population of India. Commun. Soil Sci. Plant Anal. 2008, 39, 1476–1485. [Google Scholar] [CrossRef]
  43. Poss, J.A.; Grattan, S.R.; Suarez, D.L.; Grieve, C.M. Stable carbon isotope discrimination, an indicator of cumulative salinity and boron stress in Eucalyptus camaldulensis. Tree Physiol. 2000, 20, 1121–1127. [Google Scholar] [CrossRef] [PubMed]
  44. O’Leary, M.H. Carbon isotope fractionation in plants. Phytochemistry 1981, 20, 553–567. [Google Scholar] [CrossRef]
  45. Ehleringer, J.R.; Hall, A.E.; Farquhar, G.D. Stable Isotopes and Plant Carbon–Water Relations; Academic Press: London, UK, 1993; p. 555. [Google Scholar]
  46. Communar, G.; Keren, R. Boron adsorption by soils as affected by dissolved organic matter from treated sewage effluent. Soil Sci. Soc. Am. J. 2008, 72, 492–499. [Google Scholar] [CrossRef]
  47. Li, K.; Yang, W.Y.; Li, Z.C.H.; Cui, Y.Z.; Sun, Y.Y. Distribution and development strategy for Jatropha curcas L. in Yunnan Province, southwest China. For. Stud. China 2007, 9, 120–126. [Google Scholar] [CrossRef]
  48. Nery, A.R.; Rodrigues, L.N.; Silva, M.B.R.; Fernandes, P.D.; Chaves, L.H.G.; Dantas Neto, J.; Gheyi, H.R. Crescimento do pinhão-manso irrigado com águas salinas em ambiente protegido. Rev. Bras. Eng. Agríc. Ambient. 2009, 13, 551–558. [Google Scholar] [CrossRef]
  49. Cavalcante-Sousa, A.E.; Gheyi, H.R.; Guedes Correia, K.; Loureiro Soares, F.A.; Gomes-Nobre, R. Growth and water consumption of physic nut under salt stress and phosphorus levels. Rev. Ciênc. Agron. 2011, 42, 310–318. [Google Scholar] [CrossRef]
  50. Veras, R.P.; Laime, E.M.O.; Fernandes, P.D.; Soares, F.A.L.; Freire, E.A. Altura de planta, diâmetro caulinar e produção do pinhão-manso irrigado sob diferentes níveis de salinidade. Rev. Bras. Eng. Agríc. Ambient. 2011, 15, 582–587. [Google Scholar] [CrossRef]
  51. Simón, I.; Díaz-López, L.; Gimeno, V.; Nieves, M.; Walter, E.; Pereira, W.E.; Martínez, V.; Lidon, V.; García-Sánchez, F. Effects of boron excess in nutrient solution on growth, mineral nutrition, and physiological parameters of Jatropha curcas seedlings. J. Plant Nutr. Soil Sci. 2013, 176, 165–174. [Google Scholar] [CrossRef]
  52. Openshaw, K. A review of Jatropha curcas, an oil plant of unfulfilled promise. Biomass Bioenergy 2000, 19, 1–15. [Google Scholar] [CrossRef]
  53. Sharma, G.D.; Gupta, S.N.; Khabiruddin, M. Cultivation of Jatropha curcas as future source of hydrocarbon and other industrial products. In Biofuels and industrial products from Jatropha curcas, Proceedings from the symposium “Jatropha 1997”, Managua, Nicaragua, 23–27 February 1997; Gubitz, G.M., Mittelbach, M., Trabi, M., Eds.; Dbv-Verlag: Graz, Austria, 1997; pp. 19–21. [Google Scholar]
  54. Francis, G.; Edinger, R.; Becker, K. A concept for simultaneous wasteland reclamation, fuel production, and socio-economic development in degraded areas in India: Need, potential and perspectives of Jatropha plantations. Nat. Resour. Forum 2005, 29, 12–24. [Google Scholar] [CrossRef]
  55. Singh, L.; Bargali, S.S.; Swamy, S.L. Production practices and post-harvest management. In Proceedings of the Biodiesel Conference toward Energy Independence-Focus of Jatropha, Hyderabad, India, 9–10 June 2006; Singh, B., Swaminathan, R., Ponraj, V., Eds.; Rashtrapati Bhawan: New Delhi, India, 2006; pp. 252–267. [Google Scholar]
  56. Prajapati, N.D.; Prajapati, T. A Handbook of Jatropha curcas Linn. (Physic Nut); Asian Medical Plants & Health Care Trust: Jodhpur, India, 2005. [Google Scholar]
  57. Jatropha World. 2013. Available online: http://www.jatrophabiodiesel.org/jatrophaPlantation.php (accessed on 15 September 2013).
  58. Ariza-Montobbio, P.; Lele, S. Jatropha plantations for biodiesel in Tamil Nadu, India: Viability, livelihood trade-offs, and latent conflict. Ecol. Econ. 2010, 70, 189–195. [Google Scholar] [CrossRef]
  59. Tikko, A.; Yadav, S.S.; Kaushik, N. Effect of irrigation, nitrogen and potassium on seed yield and oil content of Jatropha curcas in coarse textured soils of northwest India. Soil Tillage Res. 2013, 134, 142–146. [Google Scholar] [CrossRef]
  60. Günes, A.; Alpaslan, M. Boron uptake and toxicity in maize genotypes in relation to boron and phosphorus supply. J. Plant Nutr. 2000, 23, 541–550. [Google Scholar] [CrossRef]
  61. Kaya, C.; Tuna, A.; Dikilitas, M.; Ashraf, M.; Koskeroglu, S.; Guneri, M. Supplemental phosphorus can alleviate boron toxicity in tomato. Sci. Hortic. 2009, 121, 284–288. [Google Scholar] [CrossRef]
  62. Sotiropoulos, T.E.; Therios, I.N.; Dimassi, K.N. Calcium application as a means to improve tolerance of kiwifruit (Actinidiadeliciosa L.) to boron toxicity. Sci. Hortic. 1999, 81, 443–449. [Google Scholar] [CrossRef]
  63. Kumar, A.A.; Sharma, S.; Mishra, S. Effect of alkalinity on growth performance of Jatropha curcas inoculated with PGPR and AM fungi. J. Phytol. 2009, 1, 177–184. [Google Scholar]
  64. Díaz-López, L.; Gimeno, V.; Simón, I.; Martínez, V.; Rodríguez-Ortega, W.M.; García-Sánchez, F. Jatropha curcas seedlings show a water conservation strategy under drought conditions based on decreasing leaf growth and stomatal conductance. Agric. Water Manag. 2012, 105, 48–56. [Google Scholar] [CrossRef]
  65. Díaz, J.F.; Grattan, S.R. Performance of tall wheatgrass (Thinopyrumponticum, cv. “Jose”) irrigated with saline-high boron drainage water: Implications on ruminant mineral nutrition. Agric. Ecosyst. Environ. 2009, 131, 128–136. [Google Scholar] [CrossRef]

