Article

Cellulose-Based Waste in a Close Loop as an Adsorbent for Removing Dyes from Textile Industry Wastewater

1
Faculty of Technology and Metallurgy, University of Belgrade, Karnegijeva 4, 11000 Belgrade, Serbia
2
Innovation Center of Faculty of Technology and Metallurgy, Karnegijeva 4, 11000 Belgrade, Serbia
3
Textile School for Design, Technology and Management, Academy of Technical and Art Applied Studies Belgrade, Starine Novaka 24, 11000 Belgrade, Serbia
4
Department of Materials, “VINČA” Institute of Nuclear Sciences—National Institute of the Republic of Serbia, University of Belgrade, Mike Petrovica Alasa 12–14, 11000 Belgrade, Serbia
*
Author to whom correspondence should be addressed.
Sustainability 2024, 16(9), 3660; https://doi.org/10.3390/su16093660
Submission received: 1 April 2024 / Revised: 24 April 2024 / Accepted: 25 April 2024 / Published: 26 April 2024
(This article belongs to the Special Issue Advances in Adsorption Processes for Sustainable Water Treatment)

Abstract

:
In an attempt to reuse fibrous textile waste and, at the same time, to address dye pollution in textile wastewater, waste cotton-based yarn was utilized as a cheap and sustainable adsorbent, as well as a row material for carbon adsorbent production. Unmodified yarn and cotton-based carbon adsorbents were used as adsorbents for dye removal from water. Cotton and cotton/polyester yarn samples underwent thermal modification through carbonization followed by chemical activation with KOH. Various techniques, including scanning electron microscopy, Fourier transform infrared spectroscopy, nitrogen adsorption–desorption isotherms, and surface charge determination, were employed to analyze the morphological and surface characteristics of the cotton-based adsorbents. Adsorption properties were evaluated by testing the removal of selected cationic and anionic dyes from water. The impact of temperature, initial pH and concentration of the dye solution, and contact time on adsorption were investigated, and experimentally obtained data were analyzed using theoretical models. While carbonization alone did not significantly enhance adsorption properties, activated samples exhibited high efficacy in removing both cationic and anionic dyes from water. Despite the negative influence of the polyester component in the carbon precursor on the efficiency of activated samples in removing methyl orange, the results indicated that activated cotton and cotton/polyester yarn could be used to prepare highly efficient adsorbents for the rapid removal of methylene blue from real wastewater samples.

1. Introduction

The textile industry is known to be one of the major polluters in the world. Nowadays, the frequent changes in fashion trends and excessive consumption of textiles have brought an increase in textile production, significantly influencing the environment through the high amounts of generated waste. Mostly, solid textile wastes (natural or synthetic yarns, fibers, pieces of clothing, etc.) are discarded in landfills or incinerating plants, causing serious soil, water, and air pollution. Additionally, various chemical agents used during textile production can also harm the quality of the environment. Although textile wastes of natural origin (wool, cotton, hemp, flax, etc.) are biodegradable, there is a particular concern about non-degradable synthetic fibers that are usually mixed with natural fibers during textile production. These synthetic fibers can be the source of plastic microfibers, representing a significant and unique group of microplastics that have a dramatic environmental impact [1,2]. The way to decrease the negative impact of textile waste on the environment is to transition textile production from a linear to a circular economy [3] by implementing different mechanisms, such as reuse, redesign, and recycling [4,5,6,7]. Recycling and converting textile-related waste to produce advanced materials for ecological applications can be a sustainable way to give such waste a new life in the value chain.
In that manner, solid textile waste can be used as adsorbents for the purification of wastewater discharged from textile production and loaded with various chemicals used for finishing, dying, increasing fineness, or improving the properties of fibers. The waste materials obtained during textile production are considered to be economically and ecologically suitable materials that can substitute commercial adsorbents in wastewater treatment. Utilization of solid waste as adsorbents for the purification of wastewater from textile production will close the loop, making textile production more sustainable and leading to an overall positive environmental effect.
Considering that due to the increase in the production and consumption of cotton materials, huge amounts of waste are generated, special attention is paid to the use of waste cotton fibers and yarn as adsorbents. Cotton fibers are natural, biodegradable, and cheap and can be used as biosorbents in their natural form or modified (chemically and/or thermally) [8,9,10]. Along with cotton as a natural fiber, polyester fibers are the most commonly used synthetic fibers for the production of textile materials, both individually and in a mixture with cotton. Considering their mass production and subsequent application, large amounts of polyester-based waste are generated. Therefore, several studies examined the possibility of using mostly modified polyester fibers as adsorbents for water treatment [11,12].
Different modification methods can be used to improve the adsorption properties of textile waste materials. Besides physical and chemical modification methods, processes of carbonization and activation can be applied as special ways of thermal modification to convert cellulose-based waste from textile production into efficient carbon adsorbents. Depending on the type of precursor and parameters of carbonization and activation, waste textile materials could be converted into carbon materials with a highly developed specific surface area [13,14].
This work explored the potential of reusing textile waste in the form of yarn as adsorbents, as well as a row material for carbon adsorbent production, for the purification of wastewater from the textile industry polluted with dyes to define the optimal adsorption parameters and the most efficient adsorbents for the removal of methylene blue from real wastewater samples.

2. Materials and Methods

2.1. Material Preparation

Waste cotton and 50/50% cotton/polyester blended yarn obtained from the factory of decorative fabrics SIMPO Dekor (Vranje, Serbia) were used as adsorbents and row material for the production of carbon adsorbents. Starting from cotton and cotton/polyester yarns (samples Cott and Cott/PES, respectively), carbon adsorbents were obtained by carbonization and subsequent chemical activation of carbonized materials. Carbonization of cotton and cotton/polyester yarns was performed in an inert atmosphere of nitrogen in the electrical furnace with a heating rate of 5 °C/min up to 900 °C. In this way, two carbonized samples, Cottc and Cott/PESc, were obtained. To obtain activated samples (Cottac and Cott/PESac), carbonized cotton and cotton/polyester yarns were subjected to chemical activation using KOH as an activating agent. Carbonized material was mixed with KOH flakes and homogenized in an avan with a pestle without adding water since KOH is hygroscopic. The mass ratio of carbonized material to KOH was 1:2, and activation was performed in an electrical furnace and inert nitrogen atmosphere, with a heating rate of 5 °C/min up to 900 °C. After activation, the obtained material was washed with distilled water to a neutral pH value and dried at 105 °C overnight.

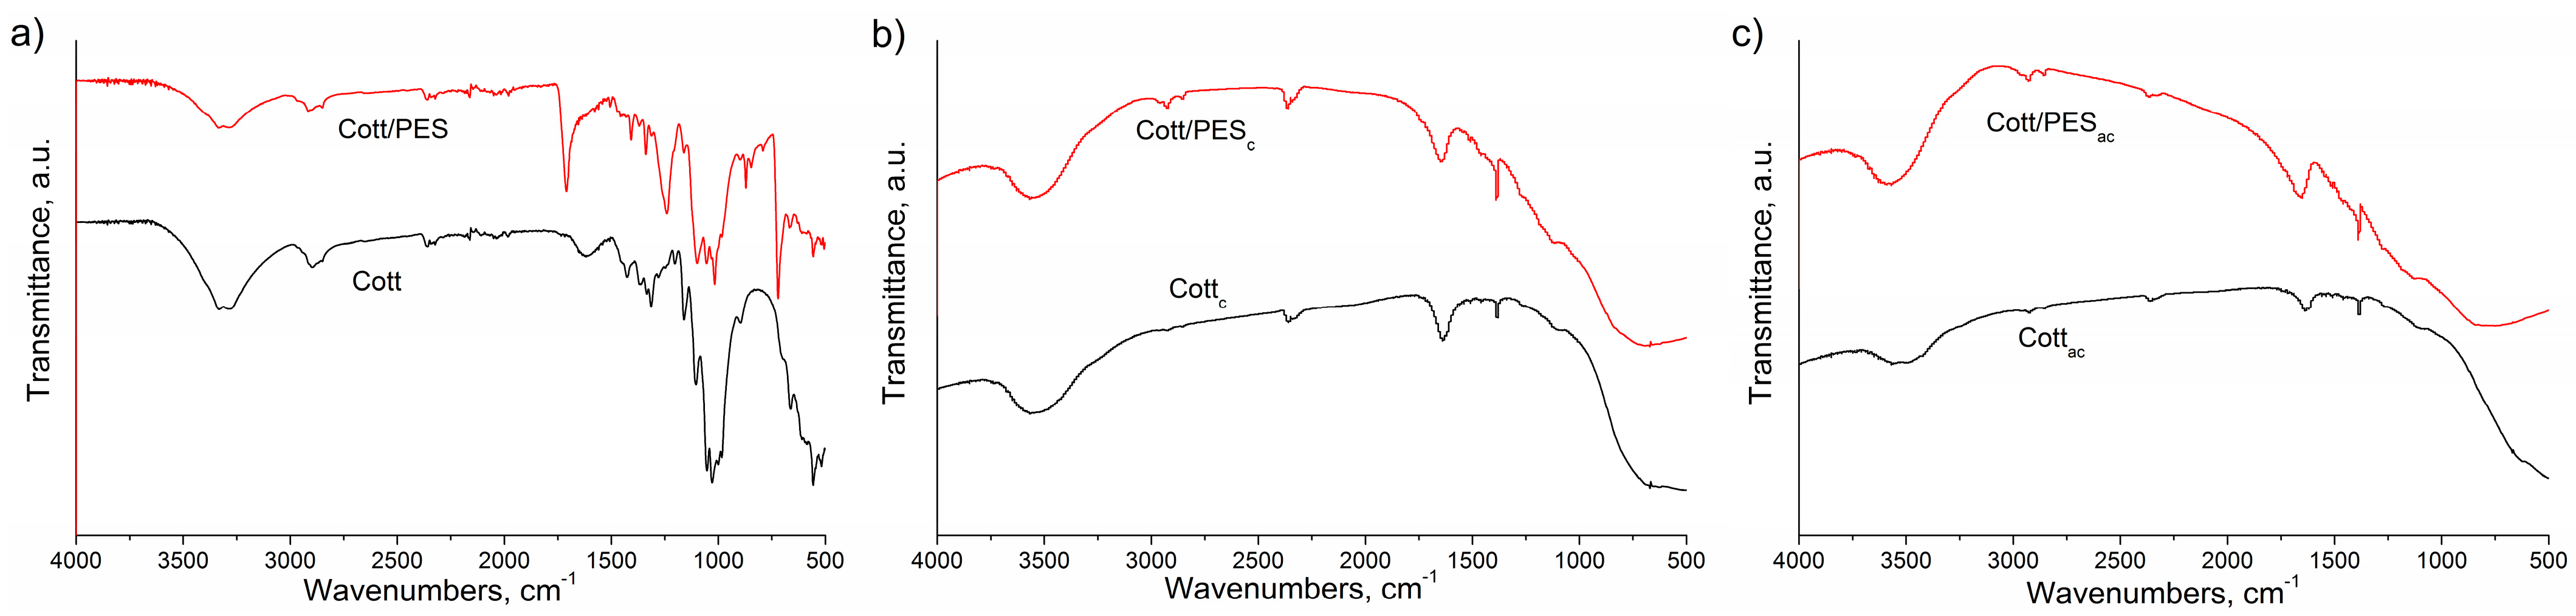
2.2. Material Characterization

The surface structure and morphology of examined samples were analyzed using field emission scanning electron microscopy (FESEM, Mira3 Tescan, Brno, Czech Republic).
Specific surface area and porous properties were determined using Micromeritics ASAP 2020 Surface and Porosity Analyzer (Micromeritics Instrument Corporation, Norcross, GA, USA). From the data obtained from N2 adsorption and desorption isotherms, using manufacturer software, specific surface area (SBET), external (Sext) and microporous (Smicro) surface area, mean pore diameter (Dm), as well as micropore (Vmic) and total (Vtotal) pore volume, were obtained.
The type of functional groups present on the surface of all cotton and cotton/polyester-based adsorbents was analyzed using ATR-FTIR spectra recorded by Nicolet™ iS™ 10 FT-IR Spectrometer (Thermo Fisher Scientific, Waltham, MA, USA).
Surface charges of the Cott and Cott/PES samples were determined through the values of isoelectric point (IEP), obtained by streaming potential method (SurPASS electrokinetic analyzer, Anton Paar GmbH, Graz, Austria) [9], while for carbon samples, the point of zero charge (PZC) was determined by mass titration method. Various amounts (0.05, 0.1, 0.5, 1, and 10% by weight) of carbon material were placed in beakers containing 10 cm3 of 0.1 M KCl solution. The beakers were then shaken in an N2 atmosphere for 24 h to ensure equilibrium. Afterward, the limiting pH value was measured and taken as the PZC.

2.3. Adsorption Experiments

The adsorption properties of cotton-based adsorbents were tested through the efficiency of materials to adsorb selected organic dyes from water. Methylene blue (MB) and methyl orange (MO) were selected as cationic and anionic model dyes, respectively, since these dyes are most commonly discussed in the relevant literature. Also, methylene blue and methyl orange, which are used for dying cellulosic materials and fabric printing, respectively, due to their instability during the washing process, may end up in wastewater. The adsorption of selected dyes (MO and MB) onto examined adsorbents (0.02 g) was conducted with constant shaking (180 rpm) in a batch system, using 25 cm3 of dye solution. All adsorption experiments were performed in triplicate. Both MB and MO were obtained from MERCK (Rahway, NJ, USA). The concentrations of the MO and MB solutions were measured at 464 nm and 675 nm, respectively, using a UV/Vis spectrophotometer. The adsorption capacity (q, mg/g) and adsorption efficiency (%) were calculated by Equations (1) and (2):
q = c 0 c · V m
A d s o r p t i o n   e f f i c i e n c y = c 0 c c 0 · 100 ,   %
where c0 and c (mg/dm3) are the initial and the final dye concentration, respectively; V is the solution volume (dm3), and m is the weight of the adsorbent (g).
To optimize the adsorption process, the influence of initial pH, contact time, and concentration of dye solution, as well as surrounding temperature, on adsorption efficiency and capacity were examined. The influence of the initial pH of MB and MO solution on adsorption was examined by adjusting the initial pH value of the adsorbate solution to 2, 4, 6, and 8. The pH values optimal for MB and MO adsorption were selected based on the obtained adsorption efficiencies and used in the following adsorption experiments. The influence of initial adsorbate concentration on adsorption was examined using dye solutions of different concentrations: for non-carbonized and carbonized samples, initial concentrations of MO and MB were 2.5, 5, 10, 15, and 20 mg/dm3, while for activated samples, solution concentrations were 10, 30, 40, 50, and 70 mg/dm3. For examination of the contact time influence, adsorption experiments were performed on 0.05 g of adsorbent from 100 cm3 of MO and MB solution. Initial concentration was 10 mg/dm3 for adsorption on non-carbonized and carbonized samples and 50 mg/dm3 for activated samples. Theoretical models were used to process the collected experimental data: Langmuir (Equation (3)) [15] and Freundlich (Equation (4)) [16] isotherm models were used for the interpretation of equilibrium data, while adsorption kinetic was analyzed using pseudo-first (Equation (5)) [17] and pseudo-second (Equation (6)) [18] order kinetic models, as well as Elovich (Equation (7)) [19] and intraparticle diffusion (Equation (8)) [20] models:
q e = Q 0 · b · c e 1 + c e
q e = K f · c e 1 / n
q t = q e · 1 e k 1 t
q t = q e 1 q e + k 2 · t 1
q t = 1 β l n α · β + 1 β ln t
q t = k i d · t 1 2 + C
In Equations (3)–(8), qe and qt (mg/g) are the amounts of dyes adsorbed at equilibrium and at time t (min), respectively; ce is the equilibrium dye concentration (mg/dm3); Q0 is the amount of solute adsorbed per unit mass of adsorbent required for monolayer coverage of the surface (mg/g); b is a constant related to the heat of adsorption (dm3/mg); Kf (mg g−1(mg dm−3)−1/n) is Freundlich constant, related to the adsorption capacity; 1/n is the heterogeneity factor; k1 (1/min) and k2 (g/(mg min)) are the pseudo-first order and pseudo-second order rate constants; kid (mg/(g min1/2)) is the intra-particle diffusion rate constant that can be evaluated using the slope of the linear plot of qt versus t1/2; constant C is the intercept; Elovich constant α (g/(mg min)) is related to the initial adsorption rate, and β (g/mg) is a constant related to the extent of surface coverage and activation energy for chemisorption.
To evaluate the effect of ambient temperature on MB and MO adsorption, adsorption experiments were performed under controlled temperatures at 20, 35, and 45 °C. Obtained adsorption data were used to calculate thermodynamic parameters by applying Equations (9)–(11):
K e = q e c e
ln K e = Δ S 0 R Δ H 0 R T
Δ G 0 = Δ H 0 T Δ S 0
Additionally, optimized conditions of the adsorption process were applied to the treatment of real wastewater samples (W1, W2, and W3). Wastewater samples were collected in the period September–October 2023, and the sampling site descriptions are given in Table S1 in Supplementary Materials. Different wastewater samples were spiked with methylene blue (initial concentration of 50 mg/dm3), and the most efficient waste cotton-based adsorbent was used for the purification of spiked water samples. Based on the adsorption efficiencies obtained for spiked distilled (SDw), and wastewater samples, the influence that wastewater matrix has on adsorption was examined.

3. Results and Discussion

3.1. Material Characterization

The morphological characteristics of examined samples were analyzed by scanning electron microscopy (Figure 1). The main morphological characteristic of cotton fibers within the structure of Cott and Cott/PES (Figure 1a and Figure 1d, respectively) samples is the appearance of a spirally twisted ribbon. Along the rough surface of cotton fibers, the longitudinal cracks are visible [21,22]. The straight and smooth fiber visible in the structure of the Cott/PES sample (Figure 1d) represents a PES component. After carbonization, cotton and cotton/polyester yarns retain a fibrous structure, which is visible in SEM photographs (Figure 1b,e). Carbonized cotton fibers retain a spirally twisted structure with more visible microfibrils that contribute to an increase in surface roughness. The surface of carbonized cotton fibers within the structure of the Cott/PESc sample (Figure 1e) is additionally decorated by evenly distributed particles. During the pyrolysis, depolymerization of the PES component occurs, leading to the tearing of the PES filament and the creation of shorter linear segments of fibers with a significantly lower degree of polymerization. Also, the pyrolysis products obtained as a consequence of PES decomposition are evenly deposited on the surface of the cotton component, remaining as condensed particles after carbonization.
Unlike the carbonized samples that retain the fibrous form of the precursor, the samples obtained after activation become breakable and lose their fibrous form, acquiring the form of needle powder (which is visible from the optical photographs in Figure 1c,f). However, the SEM photographs (Figure 1c,f) show that at the micro level, these samples retain the precursor structure. Additionally, on the SEM photograph of sample Cott/PESac (Figure 1f), only the presence of the activated cotton component is noticeable, while the presence of the activated PES component is not visible. It may be assumed that two subsequent pyrolysis processes were too aggressive for the PES component, leading to its decomposition and disappearance.
Textural characteristics of carbonized and activated samples are given in Table 1. Although non-carbonized samples contain rough surfaces with longitudinal cracks, their specific surface area is not developed and cannot be measured. The carbonization of cotton and cotton/PES yarn does not bring a considerable increase in specific surface area and porosity. The Cottc sample showed very low values of specific surface area and pore volumes, while the specific surface area and porosity of sample Cott/PESc were below the measurement limit. This immeasurable surface area may be the consequence of the presence of condensed material visible in Figure 1e, which blocks the pores on the surface of the carbonized cotton component. As can be seen from Table 1, high values of specific surface area and pore volume are obtained for activated samples. It is evident that starting from cotton and cotton/polyester yarn as carbon precursors, microporous materials with a highly developed specific surface area can be obtained by carbonization and activation in the presence of KOH. This double pyrolysis procedure of cotton/polyester yarn leads to some higher SBET and Smicro values in the case of Cott/PESac due to the decomposition of the synthetic component (the disappearance of the PES component is confirmed by SEM photographs in Figure 1f), with the opening of the pores upon activation in the presence of KOH.
The surface charge of non-carbonized samples is determined through the values of the isoelectric point: for Cott pHIEP = 2.25 and Cott/PES pHIEP = 1.34. The isoelectric point indicates that the surface of the examined material is positively charged below and negatively charged above the pHIEP value. For the carbonized samples, the point of zero charge is in the basic pH region, indicating that the surface of carbonized samples is negatively charged in the surrounding solution, having a pH value above 8.71 for Cottc and 8.19 for Cott/PESc. On the other hand, activated samples have a more acidic surface with the pHPZC 5.11 for Cottac and 6.43 for Cott/PESac.
FTIR analysis (Figure 2) was used to examine the type of surface functional groups of unmodified and thermally modified yarn samples. FTIR spectra of untreated samples (Cott and Cott/PES) show a broad band between 3350 and 3250 cm−1 that originates from cellulose in the structure of cotton component: peaks at 3340 and 3279 cm−1 correspond to the intramolecular O(3)H…O(5) and intermolecular O(6)H…O(3) hydrogen bonds, respectively [23], while shoulder at 3410 cm−1 can be assigned to the O(2)H…O(6) intramolecular hydrogen bonds [23]. Symmetrical and asymmetrical vibrations of the C-H bond in methyl and methylene groups of cellulose give two peaks at wavenumbers of 2850 cm−1 and 2920 cm−1 [24]. The broad peak, around 1630 cm−1, can be assigned to the OH bending of adsorbed water [23], aromatic skeletal vibration, or C=O stretching vibrations in carbonyl groups of hemicelluloses [24].
The band at 1365 cm−1, observed in Figure 2a, may be attributed to C-H bending vibrations in cellulose and hemicellulose, while the bands centered at 1313–1317 cm−1 and 1336 cm−1 are assigned to CH2 wagging characteristic of crystalline cellulose and the C-O-H in-plane bending from amorphous cellulose, respectively [25]. The C-O stretching around 1162 cm−1 represents asymmetric bridge stretching of C-O-C groups in cellulose, while the band at 1110 cm−1 corresponds to asymmetric glucose ring stretching. The low-intensity peak at 894 cm−1 indicates the presence of β-glycosidic linkages between monosaccharides [26], and the peak at 668 cm−1 can be assigned to C-OH out-of-plane bending [23]. Compared to cotton, the FTIR spectrum of cotton/polyester yarns showed some additional peaks originating from polyester. The presence of ester groups in a polyester component is confirmed by the intense peaks at 1710 cm−1 and 1240 cm−1. Also, the peak at 1505 cm−1 is assigned to the skeletal vibrations of the aromatic systems in polyester chains [27], while out-of-plane bending vibrations of the benzene ring in the polyester appear at 870 cm−1 (C-C) and 720 cm−1 (C-H and C=O) [27]. The FTIR spectra of the carbonized and activated samples also show a broad band in the region of 3450–3650 cm−1, which originates from stretching vibrations of the O-H bond in carboxyl or hydroxyl groups. Bands at 2925 cm−1 and 2855 cm−1 originate from the asymmetrical and symmetrical vibrations of the C-H bond in methyl and methylene groups [28], while the doublet present at 2360 and 2340 cm−1 originate from the carbon dioxide. Also, a band appearing at 1640 cm−1 corresponds to the bending vibrations of the O-H bond or the stretching vibrations of the aliphatic C=C bond, while the peak at 1384 cm−1 belongs to the deformational vibration of the C-O bond in the carboxyl group [29].

3.2. Adsorption Experiments

The pH value of the dye solution influences the adsorption efficiency by dictating the form of the dye molecule in the solution, as well as the charge of the adsorbent surface, depending on pHPZC. In the adsorbate solution with a pH below 4, the molecular form of MB and the zwitterion form of MO are predominating. On the other hand, with a pH increase above 4, the cationic form of MB and anionic form of MO become dominant. The influence of the initial pH value of the MB and MO solutions on the adsorption efficiency of examined samples is shown in Figure 3.
The adsorption efficiency of non-carbonized samples increases with pH since the surfaces of these samples (pHPZC around 2) are negatively charged in the examined pH range and attract MB cations. On the other hand, these samples repel the anionic MO dye, showing low adsorption efficiency. Both carbonized samples show the lowest adsorption efficiency for MB adsorption, which slightly increases with the initial pH value. According to the pHPZC values, the surface of carbonized samples is positively charged in the examined pH range, repelling the MB cations from the surface. As the pH value of the solution approaches the pHPZC value, the adsorption efficiency slightly increases. Carbonized samples show similar behavior for MO adsorption as non-carbonized samples, having the highest adsorption efficiency in the pH range of 4–6. Activated samples showed the highest adsorption efficiencies for all examined pH values of solution for both adsorption of MO and MB, which is the consequence of developed specific surface area. The high adsorption efficiency of activated samples does not depend on the initial pH, and the sample Cottac completely removes both dyes from the water solution. Based on the obtained results, all following adsorption experiments were performed with the initial pH value adjusted to 8 for MB, and for MO solution, this value was without adjustment (pH 5.5).
The dynamics of MB and MO adsorption onto the surface of examined samples is given in Figure 4 as the influence of contact time on adsorption capacities. The pseudo-first and pseudo-second-order kinetics, Elovich, and intraparticle diffusion models were selected to test the adsorption dynamics and determine the kinetic parameters (Tables S2 and S3).
For most examined samples, the adsorption of both dyes can be described by the pseudo-second-order kinetic model, while the experimental data obtained for MB adsorption onto the activated cotton sample fit better with pseudo-first-order kinetic (Figure 4 and Table S2). The pseudo-second and pseudo-first-order models are the most commonly used models, which can fit kinetic data originating from systems limited by the surface reaction and diffusion, thus not being associated with only one adsorption mechanism [30]. However, according to Mita et al., 2017 [31], a good correlation of experimental data with the pseudo-second-order model suggests that chemisorption is most likely the rate-limiting step in the process of adsorption. On the other hand, a good correlation with the pseudo-first-order model assumes that the rate of occupation of sorption sites is proportional to the number of unoccupied sites [32].
High values of correlation coefficients obtained for the Elovich model (Table S3) indicate that this model can describe dye adsorption on all examined samples except on sample Cottac. Applied thermal treatment of cotton and cotton/polyester yarns led to differences in surface coverage (β) and an increase in the initial rate of adsorption (α). Adsorption of MB and MO is a relatively fast process, reaching the equilibrium after 60 min for all samples, except for sample Cottac, which shows the fastest adsorption, with the equilibrium at 10 min for MB and 30 min for MO (Figure 4). These findings are in agreement with the value of Elovich constant α, which shows that the initial rate of adsorption is the highest for activated samples, especially for Cottac. The values of RE approaching the equilibrium parameter based on the Elovich equation [33] given in Table S2 also show that dependence qt-t is mild-rising (0.3 > RE > 0.1) for almost all samples and rapid-rising (0.1 > RE > 0.02) for adsorption of MB on carbonized and activated samples. For MB adsorption, adsorption capacities decrease in the following order: activated; unmodified yarn; and carbonized samples, while for MO adsorption, the unmodified and carbonized samples show similar, extremely low adsorption capacities, and the highest adsorption capacity (up to 100 mg/g) was obtained for Cottac.
The intraparticle diffusion model was used to evaluate the influence of diffusion on the adsorption process (Figure 5). By applying Equation (8) to the experimental data, the values of intraparticle diffusion rate constant, kid, and constant C were obtained and given in Table S3.
Intraparticle diffusion plots of unmodified and activated cotton and cotton/polyester samples are generally given as multi-linear plots of qt vs. t1/2, consisting of three or two (Figure 5) consecutive steps of the process of dye adsorption. For all carbonized samples and MB adsorption on the Cott/PESac sample, the intraparticle diffusion plot was fitted with one straight line that does not pass through the origin. Therefore, MB and MO adsorption onto these samples is not controlled by the intraparticle diffusion step of the adsorption process. Carbonized samples do not have a developed specific surface area and porosity, and the overall adsorption process, which occurs on the external surface of the material, is not controlled by intraparticle diffusion. Additionally, experimental data obtained for Cott/PESac (sample with a developed specific surface area and microporosity) fitted by intraparticle diffusion model gave one straight line, confirming that the process of dye adsorption occurs only on the external surface without diffusion of dye molecules into micropores of material. Similarly, the adsorption of MB and MO onto other activated samples occurs through two steps: fast adsorption onto the external surface with the highest kid value and equilibrium adsorption with the lowest values of kid (Table S3). For MB adsorption onto Cott and MO adsorption onto Cott and Cott/PES samples between the initial external adsorption and final equilibrium process, the intraparticle diffusion step is observed as a second step in the overall process of adsorption. This step is moderately fast and controlled by intraparticle diffusion of dye molecules through the macropores, cracks, and cavities of the cotton component in the yarn structure, while adsorption onto the smooth surface of the polyester component is less influenced by the intraparticle diffusion.
According to the values obtained for interparticle diffusion rate constants, kid, the initial steps of adsorption are the fastest, especially for activated samples, which is in agreement with the values of Elovich constant α. As the adsorption process proceeds, kid values decrease while the values of constant C increase, and the highest values are at equilibrium.
To analyze the adsorption process at the equilibrium as well as the influence of the initial dye concentration on adsorption, experimental data were fitted with Langmuir and Freundlich isotherm models (Figure 6). Although adsorption capacity increases with the initial concentration, there is no characteristic plot on the qe-ce dependence for adsorption on activated samples, which indicates the lack of surface saturation in an examined concentration range, especially in the case of Cottac.
Isotherm parameters obtained by fitting adsorption equilibrium data with isotherm models are given in Table 2. Correlation coefficient values (R2) indicate that equilibrium data obtained for MB and MO adsorption fit better with the Langmuir isotherm model.
The highest values of Q0 and Kf (Table 2) follow the experimentally obtained highest capacities of activated samples, which are the consequence of the developed specific surface area. However, the heterogeneity factor (1/n) values were less than a unit, implying that the surfaces of examined materials are relatively homogeneous and that the adsorption of selected dyes is a chemical process occurring on the surface functional groups as active sites [34].
To examine the influence of surrounding temperature on the adsorption capacities, adsorption experiments were performed at 20, 35, and 45 °C (Figure 7).
It can be observed that adsorption capacities decrease with the temperature increase, except for MO adsorption on samples Cott/PESc and Cott/PESac. This decrease in adsorption capacities as temperature increases may be the consequence of the increase in dye solubility and weakening of the physical bonds between the adsorbate and adsorbent, followed by the partial removal of dye molecules from the adsorbent surface [35,36]. Thermodynamic parameters obtained from experimental results are shown in Table 3. Obtained negative values for ΔH0 and ΔS0 for all samples, except for adsorption of MO on Cott/PESc and Cott/PESac, indicate that adsorption of selected dyes is an exothermic process with decreased randomness at the solid/solute adsorption systems. According to the values of ΔG0, adsorption of MB and MO is a feasible and spontaneous process only on samples Cott, Cottac, and Cott/PESac.
Optimal parameters of adsorption (initial pH adjusted at 8, contact time 3 h, and initial MB concentration 50 mg/dm3) obtained in previous experiments of this work were applied to the adsorption of methylene blue from real wastewater samples using Cottac and Cott/PESac as the most efficient adsorbents (Figure 8). Along with the adsorption efficiency obtained for wastewater samples, Figure 8 shows the adsorption efficiency obtained for spiked distilled water to demonstrate the effect of the matrix on adsorption. The wastewater matrix affects the adsorption of MB onto Cott/PESac and decreases adsorption efficiency by approximately 20%. On the other hand, the adsorption efficiency of Cottac is not influenced by the wastewater matrix since this adsorbent completely removes MB from wastewater.

4. Conclusions

The present work highlights the use of textile waste in the form of cotton and cotton/polyester yarn as adsorbents and row material for carbon adsorbents production. Newly obtained adsorbents generally showed higher adsorption efficiency for the removal of cationic than anionic dyes. Adsorbents obtained by carbonization and subsequent activation were demonstrated to be the most efficient for the removal of both cationic and anionic dyes from water, having the highest values of Langmuir maximal adsorption capacities: 90.6 and 140 mg/g for methyl orange and 82.6 and 79.4 mg/g for methylene blue adsorption. On the other hand, thermal modification using only the carbonization process does not bring a significant improvement in adsorption properties. It was found that the chemical composition of the starting material, i.e., the presence of a polyester component in the structure of the yarn, affects the surface properties, morphology, and, consequently, adsorption properties of the resulting cotton-based carbon adsorbents. In the case of activated samples, the presence of the polyester component induced a higher specific surface area, less acidic surface, and lower efficiency for methyl orange adsorption. Nevertheless, the obtained results have shown that waste cotton yarn can be utilized for the preparation of highly efficient carbon adsorbent for the fast removal of methylene blue from real wastewater samples with adsorption efficiency above 99%. These kinds of re-employment of textile waste fits into the concept of circular economy and increase the sustainability of textile production processes.

Supplementary Materials

The following supporting information can be downloaded at https://www.mdpi.com/article/10.3390/su16093660/s1, Table S1: The raw wastewater sampling site description, pH, and conductivity of wastewater samples; Table S2: Pseudo-first and pseudo-second-order adsorption rate constants calculated using appropriate model and experimental qe values for adsorption of selected dyes on cotton-based adsorbents; Table S3: Kinetic parameters for MO and MB adsorption on cotton-based adsorbents obtained by Elovich and intraparticle diffusion model.

Author Contributions

Conceptualization, M.V. and M.M.; methodology, M.V.; investigation, M.M.; resources, A.K.; data curation, M.M.; writing—original draft preparation, M.V. and B.P.; writing—review and editing, M.K. and K.T.; visualization, M.V. and M.M.; supervision, A.P.G.; funding acquisition, A.P.G. All authors have read and agreed to the published version of the manuscript.

Funding

This research was funded by the Science Fund of the Republic of Serbia, Program Ideas, GRANT No 7743343, Serbian Industrial Waste towards Sustainable Environment: Resource of Strategic Elements and Removal Agent for Pollutants—SIW4SE, and by the Ministry of Science, Technological Development and Innovation of the Republic of Serbia (Contract No. 451-03-66/2024-03/200017).

Institutional Review Board Statement

Not applicable.

Informed Consent Statement

Not applicable.

Data Availability Statement

The data presented in this study are available on request from the corresponding author.

Conflicts of Interest

Author Marina Maletić was employed by Innovation Center of Faculty of Technology and Metallurgy. The remaining authors declare that the research was conducted in the absence of any commercial or financial relationships that could be construed as a potential conflict of interest.

References

  1. Gaylarde, C.; Baptista-Neto, J.A.; Monteiro da Fonseca, E. Plastic microfibre pollution: How important is clothes’ laundering? Heliyon 2021, 7, e07105. [Google Scholar] [CrossRef] [PubMed]
  2. Suaria, G.; Achtypi, A.; Perold, V.; Lee, J.R.; Pierucci, A.; Bornman, T.G.; Aliani, S.; Ryan, P.G. Microfibers in oceanic surface waters: A global characterization. Sci. Adv. 2020, 6, eaay8493. [Google Scholar] [CrossRef] [PubMed]
  3. Schmutz, M.; Som, C. Identifying the potential for circularity of industrial textile waste generated within Swiss companies. Resour. Conser. Recycl. 2022, 182, 106132. [Google Scholar] [CrossRef]
  4. Tummino, M.L.; Varesano, A.; Copani, G.; Vineis, C. A Glance at Novel Materials, from the Textile World to Environmental Remediation. J. Polym. Environ. 2023, 31, 2826–2854. [Google Scholar] [CrossRef]
  5. Briga-Sá, A.; Nascimento, D.; Teixeira, N.; Pinto, J.; Caldeira, F.; Varum, H.; Paiva, A. Textile waste as an alternative thermal insulation building material solution. Constr. Build. Mater. 2013, 38, 155–160. [Google Scholar] [CrossRef]
  6. Mishra, R.; Behera, B.; Militky, J. Recycling of textile waste into green composites: Performance characterization. Polym. Compos. 2014, 35, 1960–1967. [Google Scholar] [CrossRef]
  7. Rahman, S.S.; Siddiqua, S.; Cherian, C. Sustainable applications of textile waste fiber in the construction and geotechnical industries: A retrospect. Clean. Eng. Technol. 2022, 6, 100420. [Google Scholar] [CrossRef]
  8. Tian, D.; Zhang, X.; Lu, C.; Yuan, G.; Zhang, W.; Zhou, Z. Solvent-free synthesis of carboxylate-functionalized cellulose from waste cotton fabrics for the removal of cationic dyes from aqueous solutions. Cellulose 2014, 21, 473–484. [Google Scholar] [CrossRef]
  9. Niu, Y.; Hu, W.; Guo, M.; Wang, Y.; Jia, J.; Hu, Z. Preparation of cotton-based fibrous adsorbents for the removal of heavy metal ions. Carbohydr. Polym. 2019, 225, 115218. [Google Scholar] [CrossRef]
  10. Xu, Z.; Gu, S.; Sun, Z.; Zhang, D.; Zhou, Y.; Gao, Y.; Qi, R.; Chen, W. Synthesis of char-based adsorbents from cotton textile waste assisted by iron salts at low pyrolysis temperature for Cr(VI) removal. Environ. Sci. Pollut. Res. 2020, 27, 11012–11025. [Google Scholar] [CrossRef]
  11. Coşkun, R.; Birgül, H.; Delibaş, A. Synthesis of functionalized PET fibers by grafting and modification and their application for Cr(VI) ion removal. J. Polym. Res. 2018, 25, 29. [Google Scholar] [CrossRef]
  12. Carraro, P.S.; Spessato, L.; Crespo, L.H.S.; Yokoyama, J.T.C.; Fonseca, J.M.; Bedin, K.C.; Ronix, A.; Cazetta, A.L.; Silva, T.L.; Almeida, V.C. Activated carbon fibers prepared from cellulose and polyester–derived residues and their application on removal of Pb2+ ions from aqueous solution. J. Mol. Liq. 2019, 289, 111150. [Google Scholar] [CrossRef]
  13. Chen, W.; He, F.; Zhang, S.; Xv, H.; Xv, Z. Development of porosity and surface chemistry of textile waste jute-based activated carbon by physical activation. Environ. Sci. Pollut. Res. 2018, 25, 9840–9848. [Google Scholar] [CrossRef] [PubMed]
  14. Sayed Jamaludin, S.I.; Ahmad Zaini, M.A.; Sadikin, A.N.; Abdol Jani, W.N.F. Textile waste valorization as potential activated carbon precursor for the removal of water contaminants: Commentary. Mater. Today Proc. 2024, 96, 110–115. [Google Scholar] [CrossRef]
  15. Langmuir, I. The adsorption of gases on plane surfaces of glass, mica and platinum. J. Am. Chem. Soc. 1918, 40, 1361–1403. [Google Scholar] [CrossRef]
  16. Freundlich, H. Adsorption in solutions. J. Phys. Chem. 1906, 57, 384–410. [Google Scholar]
  17. Lagergren, S. Zur the orieder sogennanten adsorption geloester stoffe, Kungliga Svenska Vetenskapsakademiens. Handlingar 1898, 24, 1–39. [Google Scholar]
  18. Ho, Y.S.; Mckay, G. Pseudo-second order model for sorption processes. Process Biochem. 1999, 34, 451–465. [Google Scholar] [CrossRef]
  19. Weber, W.J.; Morris, J.C. Kinetics of adsorption on carbon from solutions. J. Sanit. Eng. Div. Am. Soc. Civil. Eng. 1963, 89, 31–59. [Google Scholar] [CrossRef]
  20. Aharoni, C.; Ungarish, M. Kinetics of activated chemisorption. Part 1.—The non-elovichian part of the isotherm. J. Chem. Soc. Faraday Trans. 1 1976, 72, 265–268. [Google Scholar] [CrossRef]
  21. Wang, Y.; Xu, W.; Tao, Y.; Ma, P.; Zhu, G. Effect of Urea/NaOH Aqueous System on Morphology and Properties of Cotton Fabric. Fiber. Polym. 2012, 13, 729–734. [Google Scholar] [CrossRef]
  22. Vukčević, M.; Maletić, M.; Karić, N.; Pejić, B.; Trivunac, K.; Perić Grujić, A. Cellulose-based waste structure and chemical composition impact on the adsorption of pharmaceuticals. Tekst. Ind. 2023, 71, 4–12. [Google Scholar] [CrossRef]
  23. Oh, S.Y.; Yoo, D.I.; Shin, Y.; Seo, G. FTIR analysis of cellulose treated with sodium hydroxide and carbon dioxide. Carbohydr. Res. 2005, 340, 417–428. [Google Scholar] [CrossRef] [PubMed]
  24. Zhang, H.; Ming, R.; Yang, G.; Li, Y.; Li, Q.; Shao, H. Influence of alkali treatment on flax fiber for use as reinforcements in polylactide stereo complex composites. Polym. Eng. Sci. 2015, 55, 2553–2558. [Google Scholar] [CrossRef]
  25. Abbass, A.; Paiva, M.C.; Oliveira, D.V.; Lourenço, P.B.; Fangueiro, R. Insight into the Effects of Solvent Treatment of Natural Fibers Prior to Structural Composite Casting: Chemical, Physical and Mechanical Evaluation. Fibers 2021, 9, 54. [Google Scholar] [CrossRef]
  26. Portella, E.H.; Romanzini, D.; Coussirat Angrizani, C.; Campos Amico, S.; José Zattera, A. Influence of Stacking Sequence on the Mechanical and Dynamic Mechanical Properties of Cotton/Glass Fiber Reinforced Polyester Composites. Mater. Res. 2016, 19, 542–547. [Google Scholar] [CrossRef]
  27. Younis, A.A. Evaluation of the flammability and thermal properties of a new flame retardant coating applied on polyester fabric. Egypt. J. Petrol. 2016, 25, 161–169. [Google Scholar] [CrossRef]
  28. Mihoubi, W.; Sahli, E.; Gargouri, A.; Amiel, C. FTIR spectroscopy of whole cells for the monitoring of yeast apoptosis mediated by p53 over-expression and its suppression by Nigella sativa extracts. PLoS ONE 2017, 12, e0180680. [Google Scholar] [CrossRef]
  29. Zhou, J.H.; Sui, Z.J.; Zhu, J.; Li, P.; Chen, D.; Dai, Y.C.; Yuan, W.K. Characterization of surface oxygen complexes on carbon nanofibers by TPD, XPS and FT-IR. Carbon 2007, 45, 785–796. [Google Scholar] [CrossRef]
  30. Vareda, J.P. On validity, physical meaning, mechanism insights and regression of adsorption kinetic models. J. Mol. Liq. 2023, 376, 121416. [Google Scholar] [CrossRef]
  31. Mita, L.; Forte, M.; Rossi, A.; Adamo, C.; Rossi, S.; Mita, D.G.; Guida, M.; Portaccio, M.; Godievargova, T.; Yavour, I.; et al. Removal of 17-α Ethinylestradiol from water systems by adsorption on polyacrylonitrile beads: Isotherm and kinetics studies. Peertechz J. Environ. Sci. Toxicol. 2017, 2, 48–58. [Google Scholar] [CrossRef]
  32. Salam, M.A. Removal of heavy metal ions from aqueous solutions with multi-walled carbon nanotubes: Kinetic and thermodynamic studies. Int. J. Environ. Sci. Technol. 2013, 10, 677–688. [Google Scholar] [CrossRef]
  33. Wu, F.C.; Tseng, R.L.; Juang, R.S. Characteristics of Elovich equation used for the analysis of adsorption kinetics in dye-chitosan systems. Chem. Eng. J. 2009, 150, 366–373. [Google Scholar] [CrossRef]
  34. Madaeni, S.S.; Salehi, E. Adsorption of cations on nanofiltration membrane: Separation mechanism, isotherm confirmation and thermodynamic analysis. Chem. Eng. J. 2009, 150, 114–121. [Google Scholar] [CrossRef]
  35. El-Bery, H.M.; Saleh, M.; El-Gendy, R.A.; Saleh, M.R.; Thabet, S.M. High adsorption capacity of phenol and methylene blue using activated carbon derived from lignocellulosic agriculture wastes. Sci. Rep. 2022, 12, 5499. [Google Scholar] [CrossRef]
  36. Salah Omer, A.; El Naeem, G.A.; Abd-Elhamid, A.I.; Farahat, O.O.M.; El-Bardan, A.A.; Soliman, H.M.A.; Nayl, A.A. Adsorption of crystal violet and methylene blue dyes using a cellulose-based adsorbent from sugercane bagasse: Characterization, kinetic and isotherm studies. J. Mater. Res. Technol. 2022, 19, 3241. [Google Scholar] [CrossRef]
Figure 1. Optical and SEM photographs of samples: (a) Cott; (b) Cottc; (c) Cottac; (d) Cott/PES; (e) Cott/PESc; and (f) Cott/PESac.
Sustainability 16 03660 g001
Figure 2. FTIR spectra of (a) cotton and cotton/polyester yarns, (b) carbonized and (c) activated yarns.
Sustainability 16 03660 g002
Figure 3. The influence of initial pH value on adsorption efficiency of examined samples in removing (a) MB and (b) MO from water.
Sustainability 16 03660 g003
Figure 4. The influence of contact time on adsorptions of (a) MB and (b) MO onto unmodified and thermally modified samples.
Sustainability 16 03660 g004
Figure 5. Intraparticle diffusion plots of the MB and MO adsorption onto cotton- ((a) and (c), respectively) and cotton/polyester- ((b) and (d), respectively) based samples.
Sustainability 16 03660 g005
Figure 6. The influence of initial adsorbate concentration on adsorption of (a) MB and (b) MO onto unmodified and thermally modified samples.
Sustainability 16 03660 g006
Figure 7. Influence of temperature on adsorption capacity of examined samples for (a) MB and (b) MO adsorption.
Sustainability 16 03660 g007
Figure 8. The adsorption efficiency of activated samples for removal of MB from wastewater and spiked distilled water.
Sustainability 16 03660 g008
Table 1. Surface properties of carbonized and activated samples.
SampleSBET, m2/gSext, m2/gSmicro, m2g−1Vtotal, cm3 g−1Vmicro, cm3 g−1Dm, nmpHPZC
Cottc0.110000.0020.001-8.71
Cott/PESc00000-8.19
Cottac8862236630.5180.3594.575.11
Cott/PESac9131577560.5110.4044.076.43
Table 2. Langmuir and Freundlich isotherm parameters for adsorption of MB and MO on examined samples.
DyeSampleCottCottcCottacCott/PESCott/PEScCott/PESac
Langmuir isotherm
MOQ0, mg g−10.6230.39890.61.880.824140
MB13.92.6482.67.552.8179.4
MOb0.0040.1420.2170.0090.0040.048
MB0.0801.3327.90.0760.0710.157
MOR20.98530.99840.94450.99370.95600.9936
MB0.99610.25790.93760.99400.99950.9280
Freundlich isotherm
MOKf,
mg1−1/nL1/ng−1
0.0420.12624.50.2530.0787.19
MB2.861.8073.31.780.47014.4
MO1/n0.9300.3820.4960.7140.8260.400
MB0.7380.1460.1780.5690.5910.401
MOR20.92700.91330.89730.89340.91380.9960
MB0.86640.37180.75510.84110.93880.9195
Table 3. Thermodynamic parameters for MB and MO adsorption on unmodified and thermally modified cotton and cotton/polyester yarns.
Thermodynamic ParametersDyeT, KCottCottcCottacCott/PESCott/PEScCott/PESac
ΔH0, kJ/molMO −37.92−25.85−132.85−10.9717.7515.87
MB −33.75−11.87−153.97−17.07−10.43−125.32
ΔS0, kJ/molKMO −0.15−0.10−0.38−0.0640.0280.058
MB −0.11−0.052−0.44−0.057−0.053−0.35
ΔG0, kJ/molMO293.15−80.84.45−21.27.999.40−1.13
308.15−82.85.89−15.98.909.01−1.94
318.15−84.36.92−12.19.548.72−2.51
MB293.15−2.053.34−23.6−0.415.16−21.6
308.15−0.544.06−17.40.385.90−16.7
318.150.534.58−13.00.956.43−13.2
Disclaimer/Publisher’s Note: The statements, opinions and data contained in all publications are solely those of the individual author(s) and contributor(s) and not of MDPI and/or the editor(s). MDPI and/or the editor(s) disclaim responsibility for any injury to people or property resulting from any ideas, methods, instructions or products referred to in the content.

