Article

Quantitative Assessment of the Impact of the Three-North Shelter Forest Program on Vegetation Net Primary Productivity over the Past Two Decades and Its Environmental Benefits in China

College of Landscape Architecture, Northeast Forestry University, No. 26, Hexing Road, Xiangfang District, Harbin 150040, China
*
Author to whom correspondence should be addressed.
Sustainability 2024, 16(9), 3656; https://doi.org/10.3390/su16093656
Submission received: 27 February 2024 / Revised: 22 April 2024 / Accepted: 24 April 2024 / Published: 26 April 2024

Abstract

:
Vegetation net primary productivity (NPP) is a crucial indicator for assessing the carbon balance in terrestrial ecosystems. Qualitative and comparative research on the NPP influenced by human activities, climate change, and their interactions remains insufficient. The Three-North Shelter Forest Program (TNSFP), initiated in 1978, provides a valuable reference for such investigations. This study employs an improved residual trend method to analyze the spatiotemporal patterns, trends, and driving factors of vegetation NPP during the second phase of the Three-North Shelter Forest Program (2001–2020), as well as TNSFP’s contribution to vegetation NPP. The results indicate that (1) from 2001 to 2020, overall vegetation NPP exhibited a significant fluctuating upward trend at a rate of 3.69 g C/m−2 annually; and (2) precipitation, accounting for 1.527 g C/m−2, had a more significant impact on vegetation net productivity compared to temperature (0.002 g C/m−2). Climate factors (76%) significantly influenced vegetation NPP in the Three-North Shelter Forest region more than human activities (24%). In the last decade (2011–2020), the climate contribution rate decreased to 67%, while the human activity contribution rate increased by seven percentage points compared to the previous decade (2001–2010); (3) during 2001–2020, TNSFP contributed 10.9% to the total human activity contribution to vegetation net primary productivity, approximately 2.6% of the overall contribution; (4) After the second phase of TNSFP was enacted, PM2.5 levels decreased by an average of −0.57 μg/m−3/a−1. Concurrently, soil conservation improved from 6.57 t/km2 in 2001 to 14.37 t/km2 in 2020.

1. Introduction

Global carbon emissions from agricultural, livestock, and industrial sectors are causing widespread environmental challenges. Consequently, vegetation plays a crucial role in mitigating these effects by absorbing carbon dioxide [1,2]. Vegetation NPP denotes the aggregate organic matter generated by green plants via photosynthesis and carbon dioxide absorption per unit area and time, subtracting the organic matter retained post-autotrophic respiration [3,4]. It is a pivotal element in terrestrial ecosystems for gauging carbon sequestration potential and evaluating ecosystem integrity [5,6,7,8]. Simultaneously, it serves as one of the indicators reflecting ecosystem provisioning capacity. It has been established as a core issue by the Global Change and Terrestrial Ecosystems (GCTE) and the Kyoto Protocol [9,10].
At different regional scales, vegetation types exhibit spatiotemporal heterogeneity in their sensitivity and response to driving factors. Due to the threats posed by global warming, research on the impact of climate change on local vegetation has become one of the most prominent areas of study [11,12,13,14]. Most scholars primarily consider factors such as temperature [15], precipitation [16], sunshine duration [17], and solar radiation [18] about the impact on vegetation NPP. They conduct correlation analyses between these climate factors and NPP, examining the extent and mechanisms of the spatiotemporal influence of individual or multiple climate elements on vegetation NPP. Xu et al. (2024) investigated the spatiotemporal variation of vegetation dynamics in East Africa from 2000 to 2020 and its correlation with various factors. They found that precipitation had the most outstanding positive contribution among all climate factors, while temperature had a significant negative contribution. The average contributions of precipitation, temperature, and solar radiation to the interannual variation of East African NPP were 2.02, −1.09, and 0.31 g C/m−2/a−1, respectively [19]. Das et al. (2023) discovered that in India, due to climate warming, an increase in temperature beyond the critical threshold led to a decline in photosynthesis, while respiration remained relatively stable. From 2001 to 2019, Indian forests experienced a 6.19% decline in NPP despite a 6.75% rise in LAI, underscoring the influence of temperature on NPP [20]. Fu et al. (2023) pointed out that aerosols affect vegetation NPP by boosting diffuse radiation and modifying temperature and humidity [21].
Chinese scholars have also researched the connection between vegetation net productivity and climate change. Zhou Aiping et al. (2014) employed a multi-layered linear model to examine the characteristics of vegetation NPP changes in Guangxi spanning ten years, from 2001 to 2010. Their findings suggested that temperature and precipitation significantly affected vegetation NPP, surpassing the influence of sunshine hours [22]. Mu et al., (2013) assessed the NPP of various vegetation types in Inner Mongolia, spanning a period from 2001 to 2010. They investigated how different climatic factors influenced the NPP of these vegetation types. Their findings indicated that temperature predominantly constrained the NPP of forest vegetation, whereas precipitation played a primary role in regulating the NPP of farmland, grassland, and desert vegetation [23]. Overall, these studies strongly emphasize the importance of climate in vegetation NPP. However, the specific impact mechanisms and the relative influence of different climate factors require case-specific analysis [24].
Additionally, some scholars have researched human activities that contribute to alterations in NPP [19,25]. When discussing the impact of anthropogenic factors on vegetation NPP, most studies primarily focus on aspects such as land use [26], population density [27], nighttime lights, and GDP [28]. Hao et al. (2023) employed a geodetector approach to study the multifaceted effects and interactions among various variables influencing NPP in Henan Province. They found that the impact of population density and GDP on vegetation NPP was more significant than that of climatic factors such as precipitation [29]. In recent years, societal policies such as ecological engineering have played an increasingly significant role in influencing terrestrial vegetation [30]. Cai et al. (2023) employed the RF method to identify the primary drivers of changes in NPP in China, attributing them mainly to human activities, particularly afforestation and other ecological engineering endeavors [31]. Wenwen Li et al. (2023) discovered that implementing ecological projects such as the Grain for Green Program had a significant role in the recent increase in NPP [32]. The construction of the TNSFP, initiated in 1978 and currently in its second phase (2001–2020), has played a pivotal role over the past 40 years. The project has achieved afforestation on an area of 26.47 million hectares, and the forest coverage in the region has reached 10.18%. Ji Ping et al. (2022) estimated that during the second phase of the TNSFP (2001–2020), the average NPP increased by 34.96%, from 235.49 g C/m−2/a−1 at the beginning to 317.82 g C/m−2/a−1 at the end of the second phase [33].
It is now widely acknowledged that climate changes, such as temperature and precipitation, and human activities, such as ecological engineering and policy changes, collectively influence vegetation dynamics. However, when these factors act on vegetation NPP, they exhibit coupling effects. Therefore, quantifying the magnitude of the influence of a specific factor is a critical focus in vegetation NPP research [34,35,36,37,38]. Currently, there are various methods for quantitatively analyzing the magnitude of the impact of different influencing factors, with residual trend analysis being a more mainstream approach [39,40]. This approach establishes a correlation between vegetation and climatic factors to differentiate the impacts of climate change and human interventions on vegetation [41].
However, this method still has some limitations. It considers all residuals as the influence of human activities, neglecting the effects of other climatic factors on vegetation, which greatly overestimates the impact of human activities on vegetation. Moreover, the TNSFP is located in the northern inland regions of China, mainly including provinces such as Xinjiang, Inner Mongolia, and Qinghai, where the population density is relatively low and climate fluctuations are significant. The frequency and intensity of extreme weather events (such as droughts, high temperatures, cold waves, etc.) are higher, leading to many climatic influencing factors in this region, making vegetation susceptible to climate change. Therefore, it is crucial to reasonably separate the effects of climate change and human activities in the TNSFP area.
The construction of the TNSFP involves various human activities, such as tree planting, land protection, and farmland conversion, resulting in changes in LULC, such as the transition from bare land or cultivated land to forests or grasslands. In this study, we improved the residual analysis method using multi-temporal LULC datasets. We distinguished areas in the TNSFP region from 2001 to 2020 that were only affected by climate change ( L c ) from those simultaneously affected by both human activities and climatic factors ( L c + h ). This approach to distinguishing ( L c ) and ( L c + h ) areas has reduced the uncertainty of human activities’ impacts on vegetation dynamics. It enables more accurate quantification of the contributions of different human activities to vegetation NPP, including the Three-North Shelterbelt ecological project, land use expansion for construction, cultivation, and other human activities.
The objectives of this study are as follows: (1) Analyze the spatiotemporal patterns and trends of vegetation NPP in the second phase of the TNSFP (2001–2020) and summarize its driving factors using data such as MOD17A3HGF, meteorological data, and LULC. (2) Utilize an improved residual trend analysis method to distinguish the impacts of climate change and human activities on vegetation NPP, assess changes in impacts over the first decade (2001–2010) and the subsequent decade (2011–2020), and calculate the contribution rates of temperature and precipitation to vegetation NPP in the TNSFP area. (3) Divide the Three–North Shelterbelt into regions and vegetation types, analyze the differentiation of its impacts on four different functional zones (Northeast China–North China Plain Region, Sandy Region, Northwest Desert Region, Loess Plateau Region) and four different vegetation zones (Forest Vegetation Zone, Grassland Vegetation Zone, Desert Vegetation Zone, Plateau Vegetation Zone), and quantify the regional differences in the implementation of the Three–North Shelterbelt ecological project and its impact on different vegetation NPP levels. (4) Analyze the differential impacts of the TNSFP on environmental quality over the first decade (2001–2010) and the subsequent decade (2011–2020) using data such as PM2.5 and soil conservation and quantify its environmental benefits. This study provides a solid scientific basis for assessing and protecting ecosystem environmental quality and the rational development and utilization of resources.

2. Materials and Methods

2.1. Research Area

The Three-North Shelter Forest Program region is situated between 73°26′ to 127°50′ E and 33°30′ to 50°12′ N, covering 13 provinces (autonomous regions, direct-administered municipalities) in Northeast, Northwest, and North China, with a total area of 4.36 million square kilometers [42]. The study region is defined by China’s eight significant deserts, four extensive sandy regions, and vast stretches of barren land, constituting roughly 85% of the country’s wind- and sand-affected land area. According to the Opinion on Further Promoting the Construction of the Three–North Shelterbelt System issued by the General Office of the State Council, the TNSFP is divided into four construction regions based on different functional orientations. Firstly, there is the Sandy Region, which mainly refers to the semi-arid areas dominated by the four significant sandlands in northern North China. Secondly, there is the Northwest Desert Region, mainly referring to the arid desert areas west of the 200 mm annual precipitation line. Thirdly, there is the Loess Plateau Region, which mainly refers to the natural distribution area of loess in Shaanxi, Gansu, Ningxia, Shanxi, Inner Mongolia, and Qinghai. Fourth, there is the Northeast China–North China Plain Region, including transitional mountainous areas and foothills between the Sandy Region and the plains (Figure 1). Most of the study area encounters a temperate continental climate and a temperate monsoon climate. Annual precipitation exhibits a spatial distribution, decreasing from east to west and south to north. Surface runoff and groundwater reserves are inadequate. The ecological environment in the research area is highly fragile. The northwest desert region has high solar radiation and evaporation, with generally poor and dry soil, low organic matter content, and severe desertification. Low temperatures, strong winds, and abundant sand contribute to severe desertification in the sandy region. In the Loess Plateau region, precipitation distribution is uneven, leading to significant soil erosion [43,44,45].
To enhance the ecological environment, curb soil erosion, and combat the hazards of sand and dust in the Three-North region, China initiated the TNSFP in 1978. The afforestation plan for the entire project aims for a total area of 535 million hectares, spanning a planned duration of 78 years and divided into three distinct phases. The first phase covered the period from 1978 to 2000, the second covered 2001 to 2020, and the third was slated for 2021 to 2050. Currently, the second phase of the project has been completed. With the conclusion of the second phase, there has been a significant increase in vegetation cover in the TNSFP region. It not only helps mitigate land desertification and desertification processes but also enhances the efficiency of surface photosynthesis. Consequently, it increases plant biomass and net primary productivity, maintains carbon balance, alleviates climate change impacts, and protects the ecological environment [46,47]. The vegetation in the TNSFP area is categorized into forested, grassland, desert, and plateau vegetation zones based on regional variations in vegetation distribution and topographic characteristics (Figure 2).

2.2. Data Sources

2.2.1. Net Primary Productivity (NPP) Data

MOD17A3HGF V6 from NASA’s Terra MODIS NPP dataset was selected for this study (https://ladsweb.modaps.eosdis.nasa.gov/) (accessed on 3 January 2024). The MODIS NPP product, boasting a spatial resolution of 500 m and a temporal resolution of 1 year, stands among the most extensively utilized NPP datasets. It calculates vegetation NPP by merging the BIOME-BGC model with the light use efficiency model and has found application and validation in global and regional research endeavors. Through the utilization of NASA’s official MODIS Reprojection Tool (v4.1) software and the Python programming language, various preprocessing steps were conducted on the NPP data of the TNSFP Region, including stitching, clipping, reprojection, and removal of outliers (where valid values of the dataset range from −3000 to 32,700), resulting in annual vegetation NPP data for the TNSFP Region expressed in g C/m2. Due to differences in resolution between temperature and precipitation grid images and NPP, the annual NPP images were resampled to a uniform resolution of 1 km × 1 km.

2.2.2. Meteorological Data

The annual average temperature and precipitation data were obtained from the National Earth Science Data Center (http://www.geodata.cn/) (accessed on 3 January 2024), spanning the period from 2000 to 2020, with a spatial resolution of approximately 1 km and a temporal resolution of annually. This dataset was downscaled in China using the Delta spatial downscaling method based on global 0.5 °C climate data released by the CRU and high-resolution global climate data released by WorldClim [48].

2.2.3. Land Use and Land Cover (LULC) Data

The LULC data for 2000, 2010, and 2020 were acquired from the Resource and Environment Science and Data Center of the Chinese Academy of Sciences (https://www.resdc.cn/DOI/doi.aspx?DOIid=54) (accessed on 3 January 2024). Following the GB/T21010-2017 [49] classification standard, land types were categorized into cultivated land, woodland, grassland, water, construction land, and bare ground (Figure 3a,b). Utilizing multi-temporal LULC datasets, improvements in residual analysis methods allow for a more precise assessment of the effects of climate change and human activities on vegetation alterations by distinguishing between L c (Climate Change) and L c + h (Climate Change + Human Activities). L c includes regions where a consistent land-use type has maintained vegetation (grassland and woodland) from 2001 to 2020 without mutual conversion (Figure 3c). L c + h encompasses both cultivated and non-vegetated areas (comprising water, constructed land, and bare ground), along with zones where vegetation types (such as grassland and woodland) have changed since 2001, illustrating the combined impact of climate change and human activities (Figure 3d). The delineation method for L c and L c + h regions for the periods 2001–2010 and 2011–2020 remains consistent with that of 2001–2020.

2.2.4. Data Environmental Quality Data

The PM2.5 data were acquired from the China PM2.5 dataset available at the National Tibetan Plateau Data Center (https://data.tpdc.ac.cn) (accessed on 4 January 2024). This dataset employs artificial intelligence techniques to fill spatial gaps in the satellite MODIS MAIAC AOD product. Combining ground-based observations, atmospheric reanalysis, emission inventories, and other significant data sources generated seamless ground-level PM2.5 data for the entire country from 2000 to the present. The dataset is in NC format, featuring a spatial resolution of 1 km and a temporal resolution of one year. It underwent conversion from NC format to Geo-Tiff format using the “make NetCDF raster layer” tool in ArcGIS. Subsequently, the extract by mask tool was utilized to clip the data to the desired study area, resulting in annual PM2.5 raster data for the Three-North region [50].
The spatial distribution data of soil conservation in the Three–North region’s ecosystems are sourced from the Science Data Bank (https://www.scidb.cn/detail?dataSetId=c561bab524b04a0ba93678abde74aa5a&version=V2) (accessed on 4 January 2024). This dataset utilizes a variety of remote sensing, meteorological, geographical, and soil data within the Three–North Engineering area. Combining GIS technology and the RUSLE model, it estimates soil conservation to evaluate the soil conservation capacity in the study area. Data quality control measures were implemented from both the source and model calculation perspectives to ensure the objectivity and accuracy of the data. This approach provides an intuitive assessment of the ecosystem’s soil conservation capacity in the Three–North Engineering area from 2000 to 2020.
The water conservation data is derived from the National Earth System Science Data Sharing Infrastructure, National Science and Technology Infrastructure of China (http://www.geodata.cn) (accessed on 4 January 2024), covering the period from 1990 to 2010 nationwide, with a resolution of 1000 m grid data. The water conservation dataset is calculated based on interpolated precipitation data from 2419 national ground meteorological observation stations in China, NOAA/AVHRR 1 km 16-day maximum composite NDVI data products, and MODIS 1 km 16-day maximum composite NDVI data products to calculate vegetation coverage data. The data validation results are reliable and widely applied [51].

2.3. Research Methods

2.3.1. Data Correlation Analysis

Correlation analysis was employed to investigate the response of vegetation net primary productivity (NPP) to various meteorological factors such as temperature and precipitation changes. The correlation between climatic factors and vegetation net primary productivity was characterized using mathematical formulas.
R x y = i = 1 n   x i x y i y i 1 n   x i x 2 i = 1 n   y i y 2
In the formula, R x y represents the correlation coefficient between two variables, x i denotes the NPP for the i -th year, x is the average NPP, y i represents the influencing factor for the i -th year, and y is the average of the influencing factor.

2.3.2. Trend Analysis

The present study employs the linear regression method to analyze the spatial and temporal trend characteristics of vegetation NPP data in the Three–North region. The formula is as follows [52,53]:
θ slope   = n × i = 1 n   i × N P P i i = 1 n   i i = 1 n   N P P i n × i = 1 n   i 2 i = 1 n   i 2
In the equation, θ slope   represents the trend of NPP for each pixel from 2001 to 2020, where i denotes the year ( i = 1, 2, 3…, n ), and N P P i denotes the average NPP for the i -th year. θ slope   > 0 indicates an increasing trend of NPP during that period, while θ slope   < 0 indicates a decreasing trend in NPP.

2.3.3. Mann–Kendall Significance Test

This paper employs the Mann-Kendall significance test (M–K test) to assess the significance of the vegetation NPP trend. It uses the statistical parameter Z to represent the test results of the M–K test. The M–K test is applied to analyze the mutation of the time series of vegetation NPP. This method is not constrained by the need for data distribution to adhere to a particular form or pattern, and outliers within the samples do not impact the analysis outcomes. Z is the standardized test statistic. When the absolute value of Z is more significant than 1.65, 1.96, and 2.58, it indicates that the trend has passed significance tests with confidence levels of 90%, 95%, and 99%, respectively [54,55].

2.3.4. Residual Trend Analysis

Utilizing the residual trend analysis method to separate and quantify the influences of climate change and human activities on vegetation NPP, the formula is as follows:
θ slope   C ( T ) + C ( P ) + C O N P P T × T n + N P P P × P n + C O
In the equation: θ slope   represents the overall trend of NPP; the study years are denoted by the letter n ; C ( T ) denotes the influence of temperature, while C ( P ) signifies the impact of precipitation on vegetation NPP; N P P T and N P P P are the partial correlation coefficients between vegetation NPP and T , P ; T n and P n represent the interannual variation rates of T and P [32]. Other climate factors such as solar radiation, wind, and natural disasters also impact vegetation net primary productivity, denoted as L c ’s, while human activities’ influence on vegetation net primary productivity is denoted as L c + h ’s, including projects like the TNSFP, urban land expansion (artificial greening), and cultivation. The formula for calculating the second-order partial correlation coefficient is as follows:
R x y , z λ = R x y , z R x λ , z × R y λ , z 1 R x λ , z 2 × 1 R y λ , z 2
where R x y , z λ represents the second-order partial correlation coefficient between variables x and y , after eliminating the influence of factors z and λ ; R x λ , z , R y λ , z , z, and R x y , z are defined similarly. The significance of the correlation between two variables is determined using the t test. The positive or negative contribution indicates the positive or negative effect of the influencing factor on NPP, where a positive effect suggests that the influencing factor promotes NPP increase, while a negative effect indicates that the influencing factor inhibits NPP increase.

3. Results

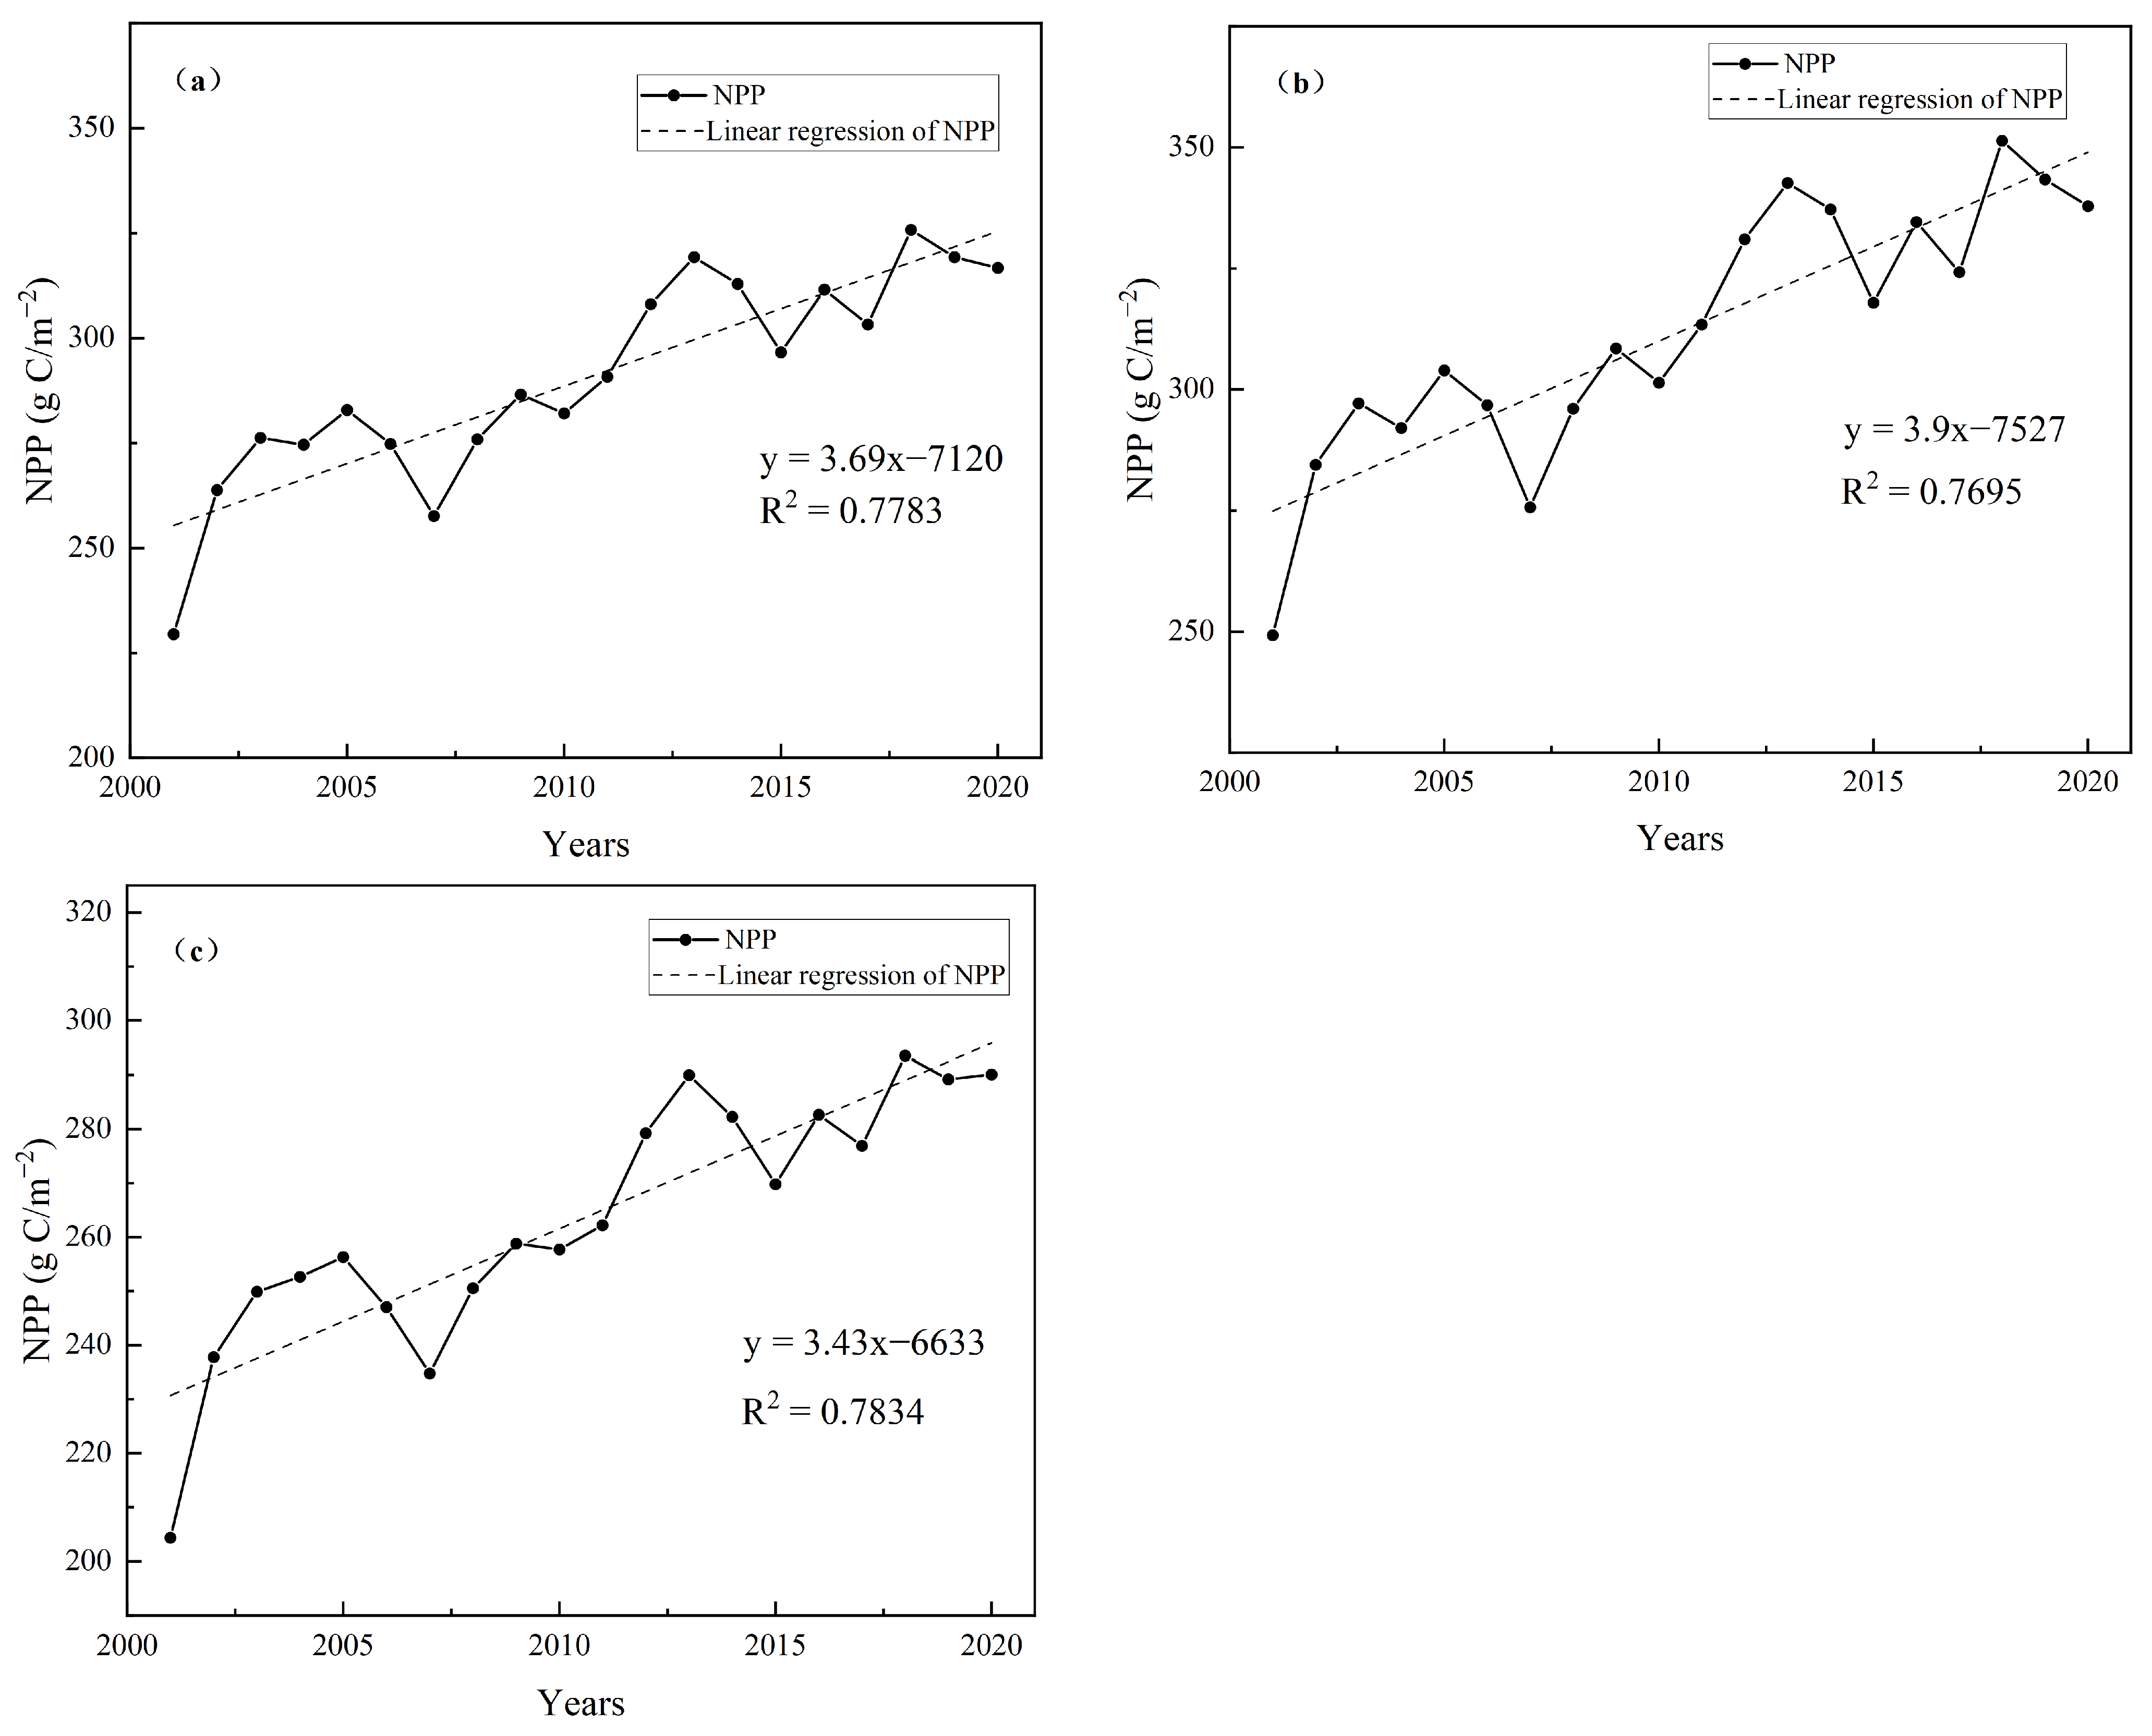
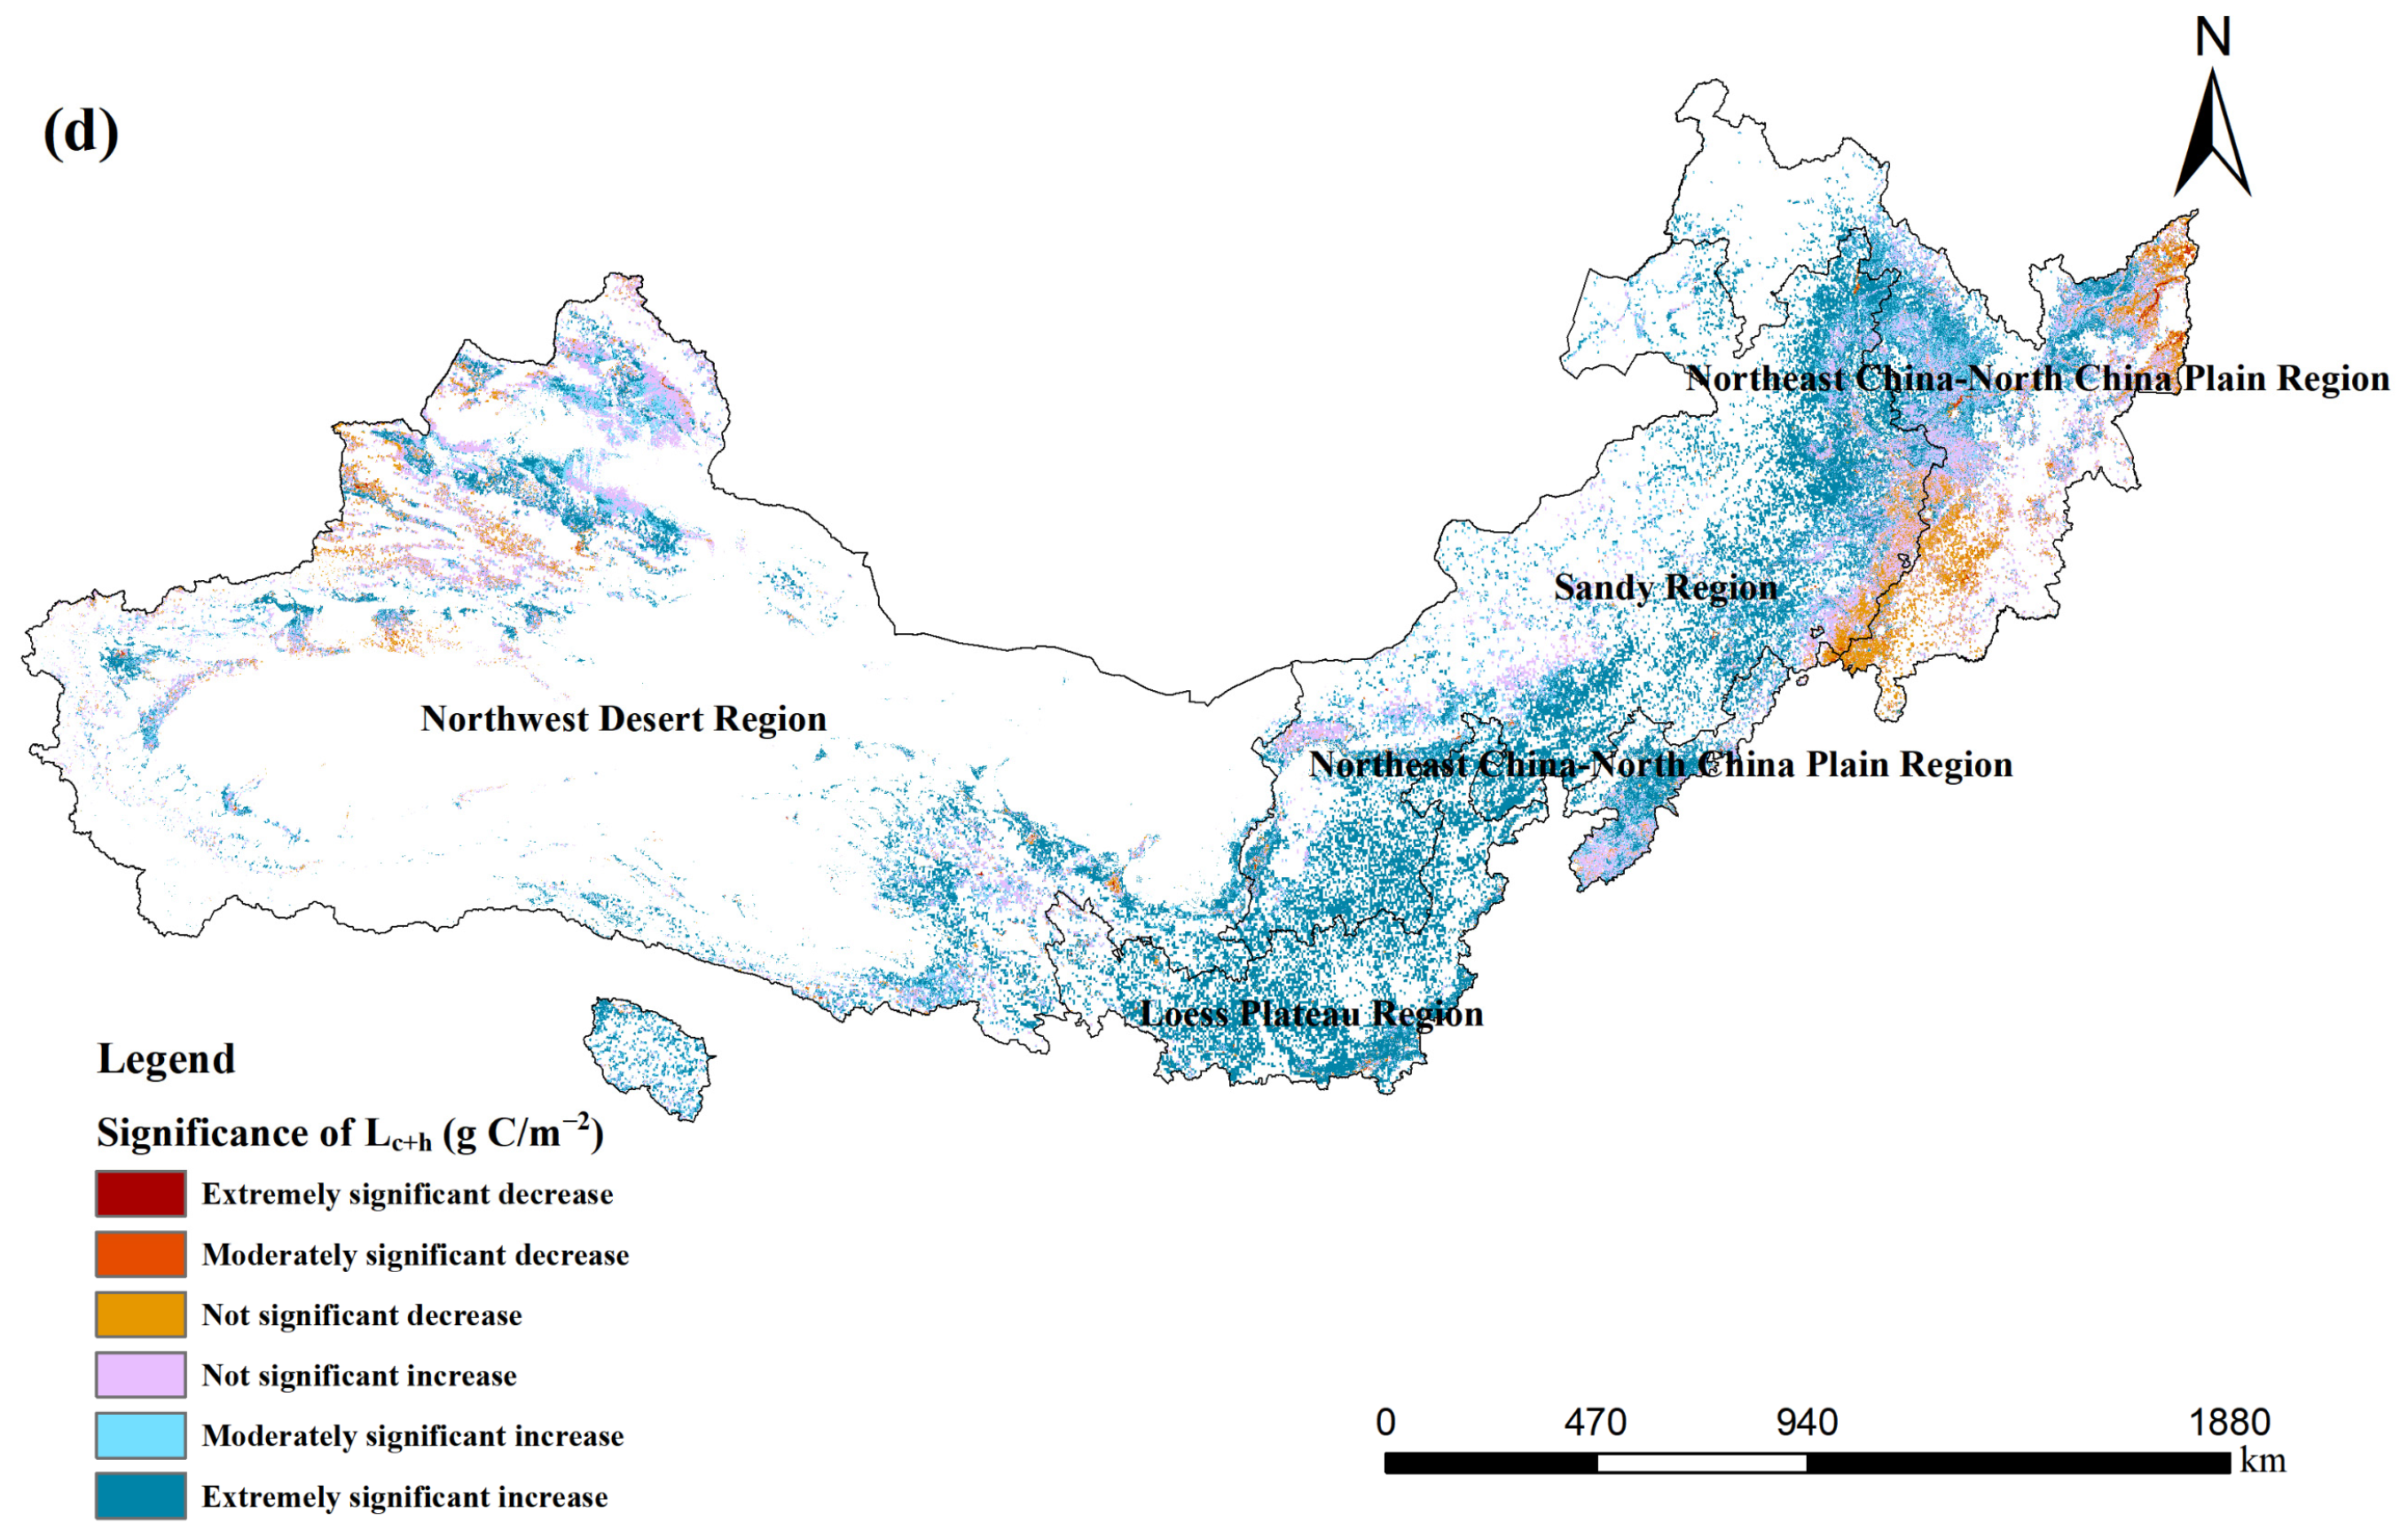
3.1. Temporal and Spatial Variations in NPP within the TNSFP Area from 2001 to 2020

Figure 4a illustrates the interannual variation traits of vegetation NPP in the TNSFP region from 2001 to 2020. The annual average NPP values in the Three–North region range from 229.53 to 325.77 g C/m2, showing a significant fluctuating upward trend at a rate of 3.69 g C/m2 (p < 0.05). The highest NPP value occurred in 2018, while the lowest was observed in 2001. Both L c and L c + h experienced a significant increase in NPP, reaching 249.26–351.34 g C/m2 and 204.35–293.52 g C/m2, with growth rates of 3.9 and 3.43 g C/m2, respectively (Figure 4b,c). The annual average NPP growth rate from 2001 to 2010 was 3.46 g C/m2, higher than the rate of 1.2 g C/m2 from 2011 to 2020. Specifically, from 2001 to 2010, L c ’s annual average NPP growth rate was 3.49 g C/m2, surpassing the rate of 1.99 g C/m2 from 2011 to 2020. Similarly, L c + h exhibited an annual average NPP growth rate of 3.44 g C/m2 from 2001 to 2010, exceeding the rate of 2.03 g C/m2 from 2011 to 2020.
From northeast to northwest, the average vegetation NPP of L c and L c + h shows a gradual decrease trend from 2001 to 2020 (Figure 5a,b). The proportion of average vegetation NPP in L c + h during 2001–2020, ranging from 200–400 g C/m2, was highest at 53.6%, primarily distributed in the grassland and forest vegetation zones of the Northeast China–North China Plain region within L c + h . The average vegetation NPP of L C from 2001 to 2020, with a proportion between 200–400 g C/m−2, is 36%, and between 400–600 g C/m−2, it is 28.7%, mainly distributed in the forested vegetation zones and grassland vegetation zones in the Northeast China–North China Plain and Loess Plateau Region of L C . The NPP values in the Northeast China–North China Plain Region of L c + h are significantly smaller than L c , where the average annual vegetation NPP for L C in the Northeast China–North China Plain Region is mainly concentrated between 400–800 g C/m−2, while for L C + h , it is mainly concentrated between 200–600 g C/m−2.
Analyzing the vegetation NPP trends in the TNSFP region over the past two decades, this study categorizes the trends into six types based on trend analysis and significance testing results: extremely significant decrease, moderately significant decrease, not significantly decreased, not significantly increased, moderately significant increase, and highly significant increase. Figure 6a,b show that from 2001 to 2020, the overall vegetation NPP in the Three–North region shows an increasing trend, with an NPP slope ranging from −28.2 to 31 g C/m−2. The long-term fitted NPP slopes for L c and L c + h are −28.2 to 31 g C/m−2 and −27.6 to 29.7 g C/m−2, respectively. L c and L c + h show increasing trends in 98% and 96% of the regions, primarily distributed in the Northeast China–North China Plain Region, Loess Plateau Region, and Sandy Region. The decreasing trend areas account for 2% and 4% for L C and L c + h , mainly distributed in the Junggar Basin, southern Xinjiang Basin, and the fixed sand control areas along the Hexi Corridor. Among the various vegetation zones, the grassland vegetation zone has the highest proportion of increased trend area, accounting for 98.8%. In contrast, the forest and desert vegetation zones have more relatively minor proportions, at 88.6% and 90.5%, respectively. In each functional zone, the Loess Plateau, Sandy, and Northwest Desert regions have a relatively higher proportion of increasing trend areas, accounting for 98.8%, 98%, and 91.4%, respectively. In contrast, the Northeast China–North China Plain region has a smaller proportion of increasing trend areas, accounting for 87.2%. The extremely significant and significantly increasing regions for L c account for 48.1% and 19.3%, respectively, while for L c + h , these regions account for 47.8% and 16.2% (Figure 6c,d).

3.2. Impact of Climate Change on NPP within the TNSFP Area from 2001 to 2020

Previous studies have demonstrated that vegetation NPP growth is impacted by temperature, precipitation, and other climatic factors. The average contributions of these climate variables to changes in vegetation NPP in the study area from 2001 to 2020 were 1.529 g C/m−2. Specifically, temperature and precipitation contributed mean values of 0.002 g C/m−2 and 1.527 g C/m−2, respectively (Figure 7a–c). During the initial decade (2001–2010), the average climate-driven changes in vegetation NPP amounted to 0.798 g C/m−2. The mean contributions of temperature and precipitation to vegetation NPP were 0.006 g C/m−2 and 0.792 g C/m−2, respectively (Figure S1a–c). In the subsequent decade (2011–2020), the average climate-induced changes in vegetation NPP were 0.646 g C/m−2 (Figure S1d–f).
The mean contributions of temperature and precipitation to vegetation NPP were 0.017 and 0.629 g C/m−2, respectively. In the TNSFP Region, precipitation contributes positively to NPP with a rate of 81.9%, primarily distributed in the Northeast China–North China Plain Region, Sandy Region, and Loess Plateau Region. Regions with negative contributions to NPP were in the Northwest Desert Region (18.1%), including the Tianshan and Altai Mountains. Temperature contributed positively to NPP at a rate of 63.9%, mainly in the northern part of the Loess Plateau and the northeastern part of the Qilian Mountains. Regions with negative contributions to NPP were in the northeastern Da Hinggan Mountains (36.1%). Climate change had the most significant positive contribution rate to vegetation NPP in grassland vegetation zones, at 95.3%, while desert vegetation zones had the lowest positive contribution rate, at 61%. The favorable contribution rates were 81.7% for plateau vegetation zones and 79.2% for forested vegetation zones. In each functional zone, the positive contribution rates of climate change to vegetation NPP in the Sandy region, Loess Plateau region, Northeast China–North China Plain region, and Northwest Desert region are 99.2%, 87.3%, 78.3%, and 60.1%, respectively. Residuals between climate factors and NPP represent the contributions of other climatic factors, such as solar radiation, wind, and natural disasters. From 2001 to 2020, other climatic factors accounted for 35% of the contribution, with climate overall contributing 76%; from 2001 to 2010, other climatic factors accounted for 51%, with climate overall contributing 74%; and from 2011 to 2020, other climatic factors accounted for 35%, with climate overall contributing 67% (Figure 7d–f).

3.3. Influence of Human Activities on NPP within the TNSFP Area from 2001 to 2020

From 2001 to 2020, human activities contributed 24% to the NPP of the vegetation in the TNSFP region. Among these, 75.8% of the study areas positively contributed to the NPP, primarily in regions such as the Loess Plateau Region and Sandy Region (Figure 8c). The plateau vegetation zones showed the highest positive contribution to vegetation NPP from human activities, at 92.3%, while the forested vegetation zones exhibited the lowest positive contribution, at 73.1%. The favorable contribution rates were 93.1% for grassland vegetation zones and 82% for desert vegetation zones. In each functional zone, human activities significantly positively contribute to vegetation NPP in the Loess Plateau and Northwest Desert regions, accounting for 97.5% and 89.1%, respectively. The positive contribution rate in the Sandy region is 77.2%. However, the positive contribution rate in the Northeast China–North China Plain region is relatively small, at 51.4%. In the first decade (2001–2010), human activities contributed 26% to the NPP of vegetation in the TNSFP Region, while in the subsequent decade (2011–2020), the contribution of human activities to the NPP of vegetation in the TNSFP Region increased to 33% (Figure 8a,b). Different human activities, including cultivation, land expansion for construction, the TNSFP, and other activities, had varying contributions to the NPP. From 2001 to 2020, large-scale cultivation (cropland) directly and significantly impacted vegetation NPP, contributing 63.8%. Other human activities also influenced vegetation growth, accounting for approximately 19.9% of the overall vegetation growth in the study area. During the same period, TNSFP and land expansion for construction (artificial greening) contributed approximately 10.9% and 5.4%, respectively.

3.4. Environmental Benefits of the TNSFP Area

In the TNSFP Region, PM2.5 levels ranging from 30 to 50 μg/m−3 accounted for 66.9% of the total area from 2001 to 2020, while PM2.5 levels exceeding 50 μg/m−3 covered 20% of the total area, primarily distributed in the Northwest Desert Region. (Figure S2a). The area exhibiting a decreasing trend in PM2.5 levels accounts for 95.6% of the entire study area, primarily distributed in the Northeast China–North China Plain Region, Sandy Region, and Loess Plateau Region. (Figure S2b). The maximum and minimum values of PM2.5 from 2001 to 2020 were 48.65 μg/m−3 and 32.91 μg/m−3, respectively (Figure S2c). PM2.5 fluctuated, increasing from 46.79 μg/m−3 in 2001 to 47.88 μg/m−3 in 2014 and then decreasing, reaching 34.6 μg/m−3 in 2020. Following the commencement of the second phase of the TNSFP in 2001, PM2.5 exhibited minor fluctuations in the initial decade, with negligible alteration (the PM2.5 growth rate from 2001 to 2010 was 0.14 μg/m−3/a−1). In the subsequent decade, PM2.5 started to decline (the decrease rate of PM2.5 from 2011 to 2020 was −1.93 μg/m−3/a−1). The overall growth rate of PM2.5 from 2001 to 2020 decreased, with a rate of −0.57 μg/m−3/a−1, indicating an improvement in air quality.
Figure S3 illustrates the spatial distribution and temporal trends of soil conservation in the TNSFP area from 2001 to 2020, representing the soil conservation capacity of the ecosystem in the TNSFP Region. In the TNSFP Region, soil conservation ranging from 0 to 20 t/km2 covers 84.9% of the total area, while soil conservation exceeding 20 t/km2 occupies 15.1% of the total area, primarily distributed in the Loess Plateau Region. (Figure S3a). The area exhibiting an increasing trend in soil conservation accounts for 89.2% of the entire study area. (Figure S3b). Soil conservation increasing by 0–10 t/km2 per unit area covers 88.9% of the total area, primarily distributed in the Northeast China–North China Plain Region and sandy region. The maximum and minimum values of soil conservation quantity from 2001 to 2020 are 19.1 t/km2 and 6.57 t/km2, respectively (Figure S3c). Since the initiation of the second phase of the TNSFP in 2001, the soil conservation quantity in the TNSFP area has increased, rising from 6.57 t/km2 in 2001 to 14.37 t/km2 in 2020. The growth rate of soil conservation in the first decade (2001–2010) was 0.36 t/km2/a−1, while in the second decade (2011–2020), it slightly slowed to 0.24 t/km2/a−1, indicating a stable overall upward trend in soil conservation.
The ecosystem service function of water conservation in the TNSFP region has been enhanced, showing an upward trend. The spatial distribution and variation trend of the mean water conservation from 2001 to 2010 are shown in Figure S4. Areas with an annual average water conservation of over four m3.km−2 accounted for 31.47% of the total area, mainly distributed in the Northeast China–North China Plain Region and Loess Plateau regions. The area with an increasing trend in water conservation accounted for 64.13% of the entire study area. This is consistent with the findings of Shao et al. [56].

4. Discussion

4.1. The Influence of Climate Change on Vegetation NPP

In the TNSFP area, the spatial pattern of annual average vegetation NPP from 2001 to 2020 exhibits a gradual decrease from southeast to northwest. After implementing the second phase of the TNSFP, 93.4% of the region exhibits an increasing trend, mainly covering forested and grassland vegetation zones. These areas have relatively humid climate conditions with sufficient precipitation and suitable temperatures. Forested vegetation zones efficiently convert solar energy into plant biomass through photosynthesis, while grassland vegetation zones demonstrate rapid growth and regeneration capabilities. Therefore, these regions exhibit rich and well-developed vegetation cover. The area where vegetation NPP has decreased by 6.6% is mainly located in the northwest desert region, primarily comprising deserts and barren lands. These areas experience dry and low rainfall climates with relatively scarce water resources. Typically dominated by drought-resistant and cold-resistant herbaceous plants, the growth rate of these plants is relatively slow, with lower efficiency in utilizing light and moisture. This leads to reduced biodiversity, characterized by a predominance of singular biological species, which is not conducive to increased net primary productivity of vegetation. This observation aligns with the findings of Xiaoqi Zhou and Chi Zhang’s studies [57,58,59].
Climate change (76%) and human activities (24%) have both played a role in the variation of vegetation NPP in the TNSFP region from 2001 to 2020. With the global increase in temperature, the Earth’s surface receives more heat, leading to changes in surface heat fields and temperatures. According to the Intergovernmental Panel on Climate Change (IPCC) Sixth Assessment Report, during the period from 2011 to 2020, the global surface temperature increased by 1.09 °C compared to pre-industrial levels (1850–1900), and it is projected to exceed 1.5 °C shortly (2021–2040) [60,61]. Under the combined influence of interannual precipitation variability and global warming, vegetation types, distribution, and growth have changed to adapt to the new environment. This study focuses on the impact of temperature, precipitation, and other climate factors on vegetation NPP in the TNSFP region. The findings reveal that precipitation (1.527 g C/m−2) has a higher average contribution to vegetation net primary productivity than temperature (0.002 g C/m−2). This may be because the TNSFP region generally falls within arid and semi-arid areas, where water availability is a primary limiting factor for vegetation growth. Changes in precipitation directly affect soil moisture availability, significantly influencing vegetation growth. This aligns with the results of studies conducted by Guillermo Murray-Tortarolo et al., Hyun-Cheul An et al., and Liu et al. [62,63,64].
In contrast, temperature variations may have a particular impact on biological growth, but under conditions of insufficient water, the influence of temperature on vegetation is relatively tiny. Over the long term, these climate factors have positively affected vegetation NPP, but their impact exhibits spatial heterogeneity. In the eastern region, precipitation significantly enhances vegetation growth, whereas in the western region, it hampers vegetation development. The main reasons for this are that the eastern region has lower elevation, gentle slopes, higher temperatures, greater evaporation, and predominantly consists of cultivated land (paddy fields). Crops in this region, such as rice and rapeseed, have high water requirements, and precipitation primarily constrains vegetation growth.
In contrast, the western region, with higher elevation and dominated by alpine meadows, experiences limitations in vegetation growth due to excessive precipitation, leading to soil erosion in complex terrains. In the first decade of the second phase of the TNSFP, precipitation contributed 0.792 g C/m−2 to vegetation NPP, higher than the contribution of 0.646 g C/m−2 in the subsequent decade (2011–2020). With the development of ecological engineering, there is a gradual impact on vegetation’s utilization of water resources [65,66,67].

4.2. The Influence of Human Activities on Vegetation NPP

Compared to climatic factors, human activities are an external direct factor influencing vegetation growth. Previous studies often did not adopt methods that differentiate between the impacts of human activities and climate change, leading to a persistent overestimation of the influence of human activities on vegetation changes. Utilizing multi-temporal land-use data to separate the effects of climate change and human activities, the results reveal spatiotemporal variations in human activity areas within the TNSFP region. In terms of time, from 2001 to 2020, human activities contributed 24% to the NPP of vegetation in the TNSFP Region. In the first decade (2001–2010), human activities contributed 26% to the NPP of vegetation in the TNSFP area. In the subsequent decade (2011–2020), this contribution increased to 33%, representing a 7% rise. This indicates the growing significance of the TNSFP in influencing vegetation dynamics.
Spatially, 24.2% of areas exhibit a negative impact from human activities on the NPP of vegetation, predominantly situated in the economically developed and densely populated Northeast China–North China Plain Region compared to the arid Northwest Desert Region. In these areas, extensive land conversion from cultivation to construction land has occurred to meet the needs of urban development, leading to ecological degradation. Human activities exhibit a negative impact on vegetation NPP [68]. Different human activities exert varying effects on vegetation NPP, with large-scale cultivation (cropland) having a direct and significant impact, accounting for 63.8% of human activity contributions. When agricultural management practices prioritize ecological conservation and sustainable land management, the direct impact on vegetation can be reduced. Protective agricultural measures such as afforestation, crop rotation, and soil conservation help decrease soil erosion, maintain soil structure, and alleviate the negative impact on vegetation. The contribution of construction land expansion (artificial greening) for construction purposes is 5.4%. Since the inception of the second phase of the TNSFP in 2001, there has been a gradual vegetation recovery and a notable enhancement in the ecological environment, exemplified by the decline in PM2.5 levels and the augmentation of soil conservation efforts [69,70,71].

4.3. Impact of Ecological Engineering on Vegetation NPP

The TNSFP area encompasses eight central deserts, four sandy regions, and vast expanses of Gobi, accounting for approximately 85% of the national wind and sand erosion land area. This region faces severe desertification, soil erosion, degradation of natural vegetation, low NPP, and unfavorable conditions for the carbon cycle within the ecosystem. Implementing the second phase of TNSFP has increased vegetation density in the region, increasing NPP. Between 2001 and 2020, the TNSFP contributed about 10.9% to human activities, constituting 2.6% of the overall impact and contributing to the enhancement of the ecological environment. The proportion of regions showing sustained improvement in ecosystem restoration is 21.95%. In each functional zone, the Loess Plateau region, Sandy region, and Northwest Desert region have the highest proportion of areas with increasing vegetation NPP trends, and the impact of the second phase of the TNSFP on NPP in these areas is most significant. These regions face severe soil erosion and desertification issues, necessitating greater resource investment. Among them, the Northwest Desert region and Sandy region are the focus and central parts of the TNSFP, including eight key project areas such as the Horqin Sandy Land, Maowusu Sandy Land, Hulunbuir Sandy Land, Ulan Buh Desert, Hexi Corridor, Xinjiang Oasis and its surrounding areas, valleys on the northern slopes of the Tianshan Mountains, and the Qaidam Basin. These two regions have low precipitation and high evaporation, making it difficult for afforestation to survive without irrigation in the Northwest Desert region. Moreover, the Sandy region has low temperatures, strong winds, abundant sand, severe land desertification, and harsh ecological environments, resulting in lower vegetation NPP. Therefore, in the construction of the shelterbelt system, the Sandy region focuses on sand prevention and control, establishing windbreak and sand-fixing forest belts with reasonable combinations of trees, shrubs, and grasses at the forefront of the desert, constructing large-scale shelterbelt belts in towns, roads, and oases on the outskirts to prevent sand hazards, and building a complete farmland shelterbelt system within the oasis. These measures can effectively slow down the expansion of the desert, reduce erosion and damage to surrounding areas caused by the desert, mitigate sand erosion, protect soil, improve soil fertility and structure, provide a more suitable growth environment for vegetation, promote root growth and nutrient absorption of vegetation, and thus increase vegetation NPP. In the Northwest Desert region, the focus is on protecting natural desert vegetation, adopting comprehensive measures mainly based on sealing and protection, establishing natural reserves composed of typical desert ecosystems, protecting natural ecology, and constructing a desert oasis shelterbelt system composed of desert shrubs. This approach can protect plant species diversity and contribute to maintaining and promoting the stability and health of the local ecosystem. In afforestation, the two regions mainly choose tree species such as North China larch, pine, Chinese pine, fir, sea buckthorn, and oleaster. These tree species have advantages such as high biomass production, developed root systems, salt and alkali resistance, tolerance to barren conditions, strong adaptability to harsh climates such as wind and sand, and rapid growth. They can form dense crowns quickly, provide more leaf area for photosynthesis, and facilitate ecological restoration in the region [72].
The Loess Plateau region boasts abundant solar and thermal resources but receives minimal and unevenly distributed rainfall, with heavy rainfalls concentrated mainly from June to September. Additionally, factors such as steep slopes, deep valleys, and human activities like cultivation and reclamation have exacerbated soil erosion and soil infertility issues. With the growth in population and human activities, indiscriminate land reclamation, excessive logging, overgrazing, and excessive excavation of grasslands have become more prevalent. Consequently, forest resources have suffered severe damage, leading to sparse forest vegetation, single vegetation types, and the disruption of vegetation structure and function, all hindering the improvement of vegetation NPP. Moreover, historical practices of excessive logging without proper management of water-conserving forests have resulted in soil moisture loss and aggravated soil erosion, leading to soil infertility and loss of fertility, thus affecting the growth conditions of vegetation and subsequently impeding the increase in NPP.
Furthermore, this has caused the annual discharge of a large amount of sediment into the Yellow River from the Loess Plateau region, severely limiting the effectiveness of water conservancy projects. Therefore, in the construction of protective forests in the Loess Plateau region, efforts are focused on establishing soil conservation forests on the edges of terraces, hills, loess plateaus, and along riverbanks to effectively reduce soil erosion, protect soil quality, and improve the ecological environment. Simultaneously, activities such as sealing and transforming inefficient forests, afforestation of barren hills, and transformation of secondary forests have been carried out to enhance forest stands’ quality and water storage function, expand forest vegetation coverage, and promote ecosystem recovery and stability. In afforestation, tree species such as Chinese pine, Pinus tabulaeformis, Populus davidiana, Populus euphratica, Populus tomentosa, and Populus cathayana are mainly selected, as they have demonstrated positive effects on soil conservation, water conservation, and sand fixation. Their trunks and leaves effectively reduce soil erosion, prevent soil erosion, protect land resources, provide a favorable ecological environment for vegetation growth, and contribute to improving NPP.
The impact of the TNSFP Phase II on the Northeast China–North China Plain region is relatively small. One reason is that the natural environment in the Northeast China–North China Plain region is relatively stable. The Northeast Plain area in particular has the most fertile soil among the TNSFP construction areas, with deep soil layers, high organic matter content, developed agriculture and animal husbandry, and a traditional forestry production base. Therefore, ecological engineering has a relatively small impact on this area. Another reason is that construction in the Northeast China–North China Plain region focuses on farmland shelterbelt forests. In the process of construction, in order to quickly establish the shelterbelt forest system and maximize the protective benefits, fast-growing and adaptable poplar trees were chosen as the afforestation species. For instance, the farmland shelterbelt forests in the Northeast region are almost entirely composed of poplar trees, accounting for as high as 98%. Due to the concentrated construction time of the farmland shelterbelt forests on a large scale, there has not been the formation of a ladder structure of young, middle-aged, near-mature, mature, and over-mature forests. The single tree species have poor resistance, serious diseases, and pests, resulting in poor growth of trees and even death. Limited by the lifespan of poplar trees, the period for renewal logging is relatively short. There is a significant backlog in renewal, which has a considerable impact on the quality and protective benefits of farmland shelterbelt forests.
Additionally, farmers have low enthusiasm for farmland shelterbelt forest construction. Furthermore, the TNSFP has not yet considered special funds for renewing and transforming farmland shelterbelt forests, exacerbating the severity of the problems with farmland shelterbelt forests. In the future, the government should start by reforming the existing land system, planning collective land specifically for farmland shelterbelt forest construction, and establishing corresponding ecological compensation mechanisms. At the same time, it should strengthen the construction of a comprehensive technological support system and dynamic monitoring information management system for major ecological engineering projects, enhance project management and technical personnel training, improve the rate of achievement transformation and contribution, and promote the development of project construction towards high quality and high standards [44,73].
Overall, the second phase of the TNSFP has achieved remarkable results by employing various methods such as afforestation, natural forest conservation, and aerial seeding based on the ecological environment of different regions to promote the construction of protective forests. The carbon sequestration per unit area in the TNSFP area increased from 383.85 g C/m−2/a−1 in 2001 to 518.04 g C/m−2/a−1 in 2020, with a change rate of 34.96%. The substantial improvement in vegetation has significantly suppressed regional soil erosion and improved air quality. Between 2001 and 2020, the soil conservation per unit area in the TNSFP area rose from 6.57 t/km2 to 14.37 t/km2. The overall growth rate of PM2.5 from 2001 to 2020 showed a decreasing trend, with a rate of −0.57 μg/m−3/a−1, indicating an improvement in air quality. The water conservation per unit area increased from 27,200 m3.km−2a−1 in 2001 to 39,700 m3.km−2a−1 in 2020, with a net increase of 12,500 m3.km−2a−1, representing a 45.96% enhancement in service capacity. The change rate of water conservation per unit area for the first decade was 29.78%, while for the latter decade, it was 12.46%. Meanwhile, the windbreak and sand fixation per unit area exhibited a trend of initially decreasing and then increasing, declining from 39.31 t.hm−2a−1 in 2001 to 29.52 t.hm−2a−1 in 2010 before rising to 49.12 t.hm−2a−1 in 2020. The change rate of windbreak and sand fixation per unit area for the first decade was −24.9%, while for the latter decade, it was 66.4% [56]. This indicates that the TNSFP has improved environmental quality and promoted sustainable land development.
China’s natural regional variations are pronounced, and there are significant differences in the goals of different ecological engineering projects. The contribution of ecological effectiveness driving factors varies spatially, both among different ecological engineering areas and within the same engineering area across different regions. China has implemented several ecological engineering projects alongside the TNSFP, including the Beijing-Tianjin Sand Source Control Project (BTP) and the Grain for Green Project (GFGP). Research indicates that in the BTP region, there is an overall fluctuating upward trend in NPP, with an average growth rate of 2.21 g C/m−2/a−1. The rise in vegetation cover varies between 0.19% and 21.06%, with an average yearly increase ranging from 0.1% to 4.08%. The variation in soil conservation ranges from −26.91% to 95.65%, with an annual average change rate of −4.18%/a to −7.05%/a. Beijing in particular experienced an 85.18% increase, indicating that the BTP project has increased regional vegetation cover, enhanced carbon sequestration capacity, and improved ecosystem stability. In the GFGP region, vegetation cover increased by 3.675% to 31.01%, with an annual average increase of 0.37%/a to 1.63%/a. The Fraction of Vegetation Cover (FVC) in the project area increased by 4.8% to 6.5% from 2000 to 2015 [74,75,76]. Ecological engineering has positively enhanced NPP by providing favorable ecological conditions for ecosystems. Through methods such as planting and introducing plant species, ecological engineering has effectively promoted the recovery and expansion of vegetation cover. This habitat reconstruction provides abundant living space for vegetation, creating favorable conditions for improving its NPP. The formation of root structures and vegetation cover has effectively prevented soil erosion, reduced the risk of natural disasters, and further ensured the sustainability of NPP.

5. Conclusions

This study employed an improved Residual Trend (RESTREND) analysis to investigate the spatiotemporal patterns and changing trends of vegetation NPP in the TNSFP region after its second phase implementation (2001–2020) as well as the impacts of human activities and climate change on vegetation NPP. By separating the effects of climate change and human activities, it was found that during the second phase of TNSFP, climate factors contributed 76% to the variability of TNSFP, while human activities contributed 24%. Climate change played a significant role in influencing vegetation NPP in the TNSFP region. In previous studies, the impact of human activities on vegetation NPP has been overestimated, but the contribution of human activities in the TNSFP region is increasing. Compared to the first decade (2001–2010), the total contribution of human activities increased by seven percentage points in the second decade (2011–2020). The TNSFP is playing an increasingly important role.
However, TNSFP still faces many challenges. For example, the project has not fully considered the carrying capacity of water resources, resulting in a relatively low afforestation rate and a relatively low survival rate of planted trees. The tree species in farmland shelterbelts are single, and pest and disease problems are severe, leading to an overall decline in farmland shelterbelts. Issues such as over-reclamation, over-logging, and overgrazing have emerged within the region, resulting in limited effectiveness in desertification control. In future construction, efforts should be made to coordinate living, agricultural production, and ecological water use, considering the carrying capacity of water resources and aiming to improve water resource utilization efficiency. The objectives include promoting the reasonable distribution of water resources, vigorously developing water-saving and rain-fed forestry, emphasizing biodiversity and species diversity, adopting appropriate measures based on local conditions, integrating trees, shrubs, and grasses, and achieving organic unity between natural restoration and artificial repair. It is necessary to consolidate the terrestrial carbon sink capacity, establish a scientific management model for artificial forest renewal and nurturing, improve stand quality, increase unit area stocking volume, optimize stand age structure, conduct timely and rational thinning, and better realize the oxygen release and carbon sequestration capabilities of plants. Severe measures should be taken to prohibit indiscriminate felling, over-logging, and overgrazing, promote the sustained and efficient growth of forest vegetation carbon reserves, and achieve high carbon sink targets.

Supplementary Materials

The following supporting information can be downloaded at: https://www.mdpi.com/article/10.3390/su16093656/s1, Figure S1a: Contribution of Climate to NPP Trends from 2001 to 2010; Figure S1b: Contribution of Precipitation to NPP Trends from 2001 to 2010; Figure S1c: Contribution of Temperature to NPP Trends from 2001 to 2010; Figure S1d: Contribution of Climate to NPP Trends from 2010 to 2020; Figure S1e: Contribution of Precipitation to NPP Trends from 2010 to 2020; Figure S1f: Contribution of Temperature to NPP Trends from 2010 to 2020. Figure S2a: Spatial Distribution of Mean PM2.5 from 2001 to 2020; Figure S2b: Trend of PM2.5 Changes from 2001 to 2020; Figure S2c: Average PM2.5 Trend Curve from 2001 to 2020. Figure S3a: Spatial Distribution of Mean Soil Conservation (SC) from 2001 to 2020; Figure S3b: Trend of Soil Conservation (SC) Changes from 2001 to 2020; Figure S3c: Average Soil Conservation (SC) Trend Curve from 2001 to 2020. Figure S4a: Spatial Distribution of Mean Water Conservation (W) from 2001 to 2010; Figure S4b: Trend of Water Conservation (W) Changes from 2001 to 2010.

Author Contributions

Conceptualization, J.Z. and Y.Z.; methodology, J.Z. and Y.Z.; software, Y.Z.; validation, J.Z.; formal analysis, J.Z.; investigation, Y.Z.; resources, J.Z.; writing—original draft preparation, Y.Z.; writing—review and editing, Y.Z.; supervision, J.Z. All authors have read and agreed to the published version of the manuscript.

Funding

This research was funded by the Social Science Foundation of Heilongjiang Province (No. 22SHB173).

Institutional Review Board Statement

Not applicable.

Informed Consent Statement

Not applicable.

Data Availability Statement

Data are contained within the article and Supplementary Materials.

Acknowledgments

The authors would like to thank all reviewers and editors for their valuable comments.

Conflicts of Interest

The authors declare no conflict of interest.

References

  1. Elahi, E.; Li, G.; Han, X.; Zhu, W.; Liu, Y.; Cheng, A.; Yang, Y. Decoupling livestock and poultry pollution emissions from industrial development: A step towards reducing environmental emissions. J. Environ. Manag. 2024, 350, 119654. [Google Scholar] [CrossRef] [PubMed]
  2. Abbas, A.; Waseem, M.; Ahmad, R.; Khan, K.A.; Zhao, C.; Zhu, J. Sensitivity analysis of greenhouse gas emissions at farm level: Case study of grain and cash crops. Environ. Sci. Pollut. Res. 2022, 29, 82559–82573. [Google Scholar] [CrossRef] [PubMed]
  3. Chen, L.; Halike, A.; Yao, K.; Wei, Q. Spatiotemporal variation in vegetation net primary productivity and its relationship with meteorological factors in the Tarim River Basin of China from 2001 to 2020 based on the Google Earth Engine. J. Arid Land 2022, 14, 1377–1394. [Google Scholar] [CrossRef]
  4. Zhao, M.; Running, S.W. Drought-Induced Reduction in Global Terrestrial Net Primary Production from 2000 through 2009. Science 2010, 329, 940–943. [Google Scholar] [CrossRef] [PubMed]
  5. Chen, Z.; Chen, J.; Xu, G.; Sha, Z.; Yin, J.; Li, Z. Estimation and Climate Impact Analysis of Terrestrial Vegetation Net Primary Productivity in China from 2001 to 2020. Land 2023, 12, 1223. [Google Scholar] [CrossRef]
  6. Bejagam, V.; Sharma, A.; Wei, X. Projected decline in the strength of vegetation carbon sequestration under climate change in India. Sci. Total Environ. 2024, 916, 170166. [Google Scholar] [CrossRef]
  7. Melillo, J.M.; McGuire, A.D.; Kicklighter, D.W.; Moore, B.; Vorosmarty, C.J.; Schloss, A.L. Global climate change and terrestrial net primary production. Nature 1993, 363, 234–240. [Google Scholar] [CrossRef]
  8. Shao, Y.; Zhu, Q.; Feng, Z.; Sun, L.; Yang, X.; Li, X.; Wang, A.; Yang, F.; Ji, H. Temporal and Spatial Assessment of Carbon Flux Dynamics: Evaluating Emissions and Sequestration in the Three Northern Protection Forest Project Areas Supported by Google Earth Engine. Remote Sens. 2024, 16, 777. [Google Scholar] [CrossRef]
  9. Zhang, C.; Zhen, H.; Zhang, S.; Tang, C. Dynamic changes in net primary productivity of marsh wetland vegetation in China from 2005 to 2015. Ecol. Indic. 2023, 155, 110970. [Google Scholar] [CrossRef]
  10. Zhu, W.; Chen, Y.; Xu, D.; Li, J. Research Progress on Calculation Models of Terrestrial Vegetation Net Primary Productivity. J. Ecol. 2005, 24, 296–300. (In Chinese) [Google Scholar]
  11. Boisvenue, C.; Running, S.W. Impacts of climate change on natural forest productivity—Evidence since the middle of the 20th century. Glob. Chang. Biol. 2006, 12, 862–882. [Google Scholar] [CrossRef]
  12. Xu, Y.; Lu, Y.; Zou, B.; Xu, M.; Feng, Y. Unraveling the enigma of NPP variation in Chinese vegetation ecosystems: The interplay of climate change and land use change. Sci. Total Environ. 2024, 912, 169023. [Google Scholar] [CrossRef] [PubMed]
  13. Bennett, A.C.; Knauer, J.; Bennett, L.T.; Haverd, V.; Arndt, S.K. Variable influence of photosynthetic thermal acclimation on future carbon uptake in Australian wooded ecosystems under climate change. Glob. Chang. Biol. 2024, 30, e17021. [Google Scholar] [CrossRef] [PubMed]
  14. Yin, S.; Du, H.; Mao, F.; Li, X.; Zhou, G.; Xu, C.; Sun, J. Spatiotemporal patterns of net primary productivity of subtropical forests in China and its response to drought. Sci. Total Environ. 2024, 913, 169439. [Google Scholar] [CrossRef]
  15. Wang, Y.; Shen, X.; Jiang, M.; Tong, S.; Lu, X. Daytime and nighttime temperatures exert different effects on vegetation net primary productivity of marshes in the western Songnen Plain. Ecol. Indic. 2022, 137, 108789. [Google Scholar] [CrossRef]
  16. Wilcox, K.R.; Shi, Z.; Gherardi, L.A.; Lemoine, N.P.; Koerner, S.E.; Hoover, D.L.; Bork, E.; Byrne, K.M.; Cahill, J.; Collins, S.L.; et al. Asymmetric responses of primary productivity to precipitation extremes: A synthesis of grassland precipitation manipulation experiments. Glob. Chang. Biol. 2017, 23, 4376–4385. [Google Scholar] [CrossRef] [PubMed]
  17. Wen, Y.; Cai, H.; Han, D. Driving factors analysis of spatial–temporal evolution of vegetation ecosystem in rocky desertification restoration area of Guizhou Province, China. Environ. Sci. Pollut. Res. 2024, 31, 13122–13140. [Google Scholar] [CrossRef] [PubMed]
  18. Chen, X.; Zhang, Y. The impact of vegetation phenology changes on the relationship between climate and net primary productivity in Yunnan, China, under global warming. Front. Plant Sci. 2023, 14, 1248482. [Google Scholar] [CrossRef] [PubMed]
  19. Xu, M.; Zhang, Z.; Wang, Y.; Liu, B. Quantifying the contributions of climatic and human factors to vegetation net primary productivity dynamics in East Africa. Front. For. Glob. Chang. 2024, 6, 1332631. [Google Scholar] [CrossRef]
  20. Das, R.; Chaturvedi, R.K.; Roy, A.; Karmakar, S.; Ghosh, S. Warming inhibits increases in vegetation net primary productivity despite greening in India. Sci. Rep. 2023, 13, 21309. [Google Scholar] [CrossRef]
  21. Fu, Y.; Zhou, Z.; Li, J.; Zhang, S. Impact of Aerosols on NPP in Basins: Case Study of WRF–Solar in the Jinghe River Basin. Remote Sens. 2023, 15, 1908. [Google Scholar] [CrossRef]
  22. Zhou, A.; Xiang, W.; Yao, Y.; Huang, F.; Li, X. Spatial-temporal evolution and main influencing factors analysis of Net Primary Productivity (NPP) in Guangxi vegetation. Guangxi Plants 2014, 34, 622–628. (In Chinese) [Google Scholar]
  23. Mu, S.; Li, J.; Zhou, W.; Yang, H.; Zhang, C.; Ju, W. Spatial-temporal patterns of vegetation net primary productivity and its relationship with climate in Inner Mongolia from 2001 to 2010. Acta Ecol. Sin. 2013, 33, 3752–3764. (In Chinese) [Google Scholar]
  24. Xu, S.; Zhang, M.; Su, M. Spatial-temporal evolution characteristics of Net Primary Productivity (NPP) of grassland on the Qinghai-Tibet Plateau under future climate scenarios. Res. Soil Water Conserv. 2024, 31, 190–201. (In Chinese) [Google Scholar]
  25. Zhang, Y.; Zhang, C.; Wang, Z.; Chen, Y.; Gang, C.; An, R.; Li, J. Vegetation dynamics and its driving forces from climate change and human activities in the Three-River Source Region, China from 1982 to 2012. Sci. Total Environ. 2016, 563–564, 210–220. [Google Scholar] [CrossRef] [PubMed]
  26. Liu, Y.; Wang, X.; Xin, L.; Lu, Y. Impact of Farmland Change on Vegetation NPP in the One River and Two Streams Region of Tibet. Land 2022, 11, 2223. [Google Scholar] [CrossRef]
  27. Luck, G.W. The relationships between net primary productivity, human population density and species conservation. J. Biogeogr. 2007, 34, 201–212. [Google Scholar] [CrossRef]
  28. Xue, H.; Chen, Y.; Dong, G.; Li, J. Quantitative analysis of spatiotemporal changes and driving forces of vegetation net primary productivity (NPP) in the Qimeng region of Inner Mongolia. Ecol. Indic. 2023, 154, 110610. [Google Scholar] [CrossRef]
  29. Hao, X.; Wang, X.; Ma, J.; Chen, Y.; Luo, S. Spatiotemporal Characteristic Prediction and Driving Factor Analysis of Vegetation Net Primary Productivity in Central China Covering the Period of 2001–2019. Land 2023, 12, 2121. [Google Scholar] [CrossRef]
  30. Liang, W.; Quan, Q.; Wu, B.; Mo, S. Response of Vegetation Dynamics in the Three-North Region of China to Climate and Human Activities from 1982 to 2018. Sustainability 2023, 15, 3073. [Google Scholar] [CrossRef]
  31. Cai, Y.; Liu, X.; Liu, K.; Zeng, L.; Pei, F.; Zhuang, H.; Wen, Y.; Wu, C.; Li, B. Human activities significantly impact China’s net primary production variation from 2001 to 2020. Prog. Phys. Geogr. Earth Environ. 2023, 48, 251–274. [Google Scholar] [CrossRef]
  32. Li, W.; Zhou, J.; Xu, Z.; Liang, Y.; Shi, J.; Zhao, X. Climate impact greater on vegetation NPP but human enhance benefits after the Grain for Green Program in Loess Plateau. Ecol. Indic. 2023, 157, 111201. [Google Scholar] [CrossRef]
  33. Ji, P.; Shao, Q.; Wang, M.; Liu, H.; Wang, X.; Ling, C.; Hou, R. Comprehensive evaluation of ecological benefits of the second phase of the Three-North Shelter Forest Program in China. For. Sci. 2022, 58, 31–48. (In Chinese) [Google Scholar]
  34. Yu, H.; Ding, Q.; Meng, B.; Lv, Y.; Liu, C.; Zhang, X.; Sun, Y.; Li, M.; Yi, S. The Relative Contributions of Climate and Grazing on the Dynamics of Grassland NPP and PUE on the Qinghai-Tibet Plateau. Remote Sens. 2021, 13, 3424. [Google Scholar] [CrossRef]
  35. Liu, Y.; Zhang, Z.; Tong, L.; Khalifa, M.; Wang, Q.; Gang, C.; Wang, Z.; Li, J.; Sun, Z. Assessing the effects of climate variation and human activities on grassland degradation and restoration across the globe. Ecol. Indic. 2019, 106, 105504. [Google Scholar] [CrossRef]
  36. Zhang, Y.; Wang, Q.; Wang, Z.; Yang, Y.; Li, J. Impact of human activities and climate change on the grassland dynamics under different regime policies in the Mongolian Plateau. Sci. Total Environ. 2020, 698, 134304. [Google Scholar] [CrossRef] [PubMed]
  37. Gong, H.; Cao, L.; Duan, Y.; Jiao, F.; Xu, X.; Zhang, M.; Wang, K.; Liu, H. Multiple effects of climate changes and human activities on NPP increase in the Three-north Shelter Forest Program area. Forest Ecol. Manag. 2023, 529, 120732. [Google Scholar] [CrossRef]
  38. Chen, S.; Ma, M.; Wu, S.; Tang, Q.; Wen, Z. Topography intensifies variations in the effect of human activities on forest NPP across altitude and slope gradients. Environ. Dev. 2023, 45, 100826. [Google Scholar] [CrossRef]
  39. Zhao, C.; Yan, Y.; Ma, W.; Shang, X.; Chen, J.; Rong, Y.; Xie, T.; Quan, Y. RESTREND-based assessment of factors affecting vegetation dynamics on the Mongolian Plateau. Ecol. Model. 2021, 440, 109415. [Google Scholar] [CrossRef]
  40. Li, Q.; Zhang, C.; Shen, Y.; Jia, W.; Li, J. Quantitative assessment of the relative roles of climate change and human activities in desertification processes on the Qinghai-Tibet Plateau based on net primary productivity. Catena 2016, 147, 789–796. [Google Scholar] [CrossRef]
  41. He, C.; Tian, J.; Gao, B.; Zhao, Y. Differentiating climate- and human-induced drivers of grassland degradation in the Liao River Basin, China. Environ. Monit. Assess. 2015, 187, 4199. [Google Scholar] [CrossRef]
  42. Shao, Y.; Liu, Y.; Ma, T.; Sun, L.; Yang, X.; Li, X.; Wang, A.; Wang, Z. Conservation Effectiveness Assessment of the Three Northern Protection Forest Project Area. Forests 2023, 14, 2121. [Google Scholar] [CrossRef]
  43. Zhang, D.; Zuo, X.; Zang, C. Assessment of future potential carbon sequestration and water consumption in the construction area of the Three-North Shelterbelt Programme in China. Agric. For. Meteorol. 2021, 303, 108377. [Google Scholar] [CrossRef]
  44. Zheng, X.; Zhu, J.; Xing, Z. Assessment of the effects of shelterbelts on crop yields at the regional scale in Northeast China. Agric. Syst. 2016, 143, 49–60. [Google Scholar] [CrossRef]
  45. Mu, H.; Li, X.; Ma, H.; Du, X.; Huang, J.; Su, W.; Yu, Z.; Xu, C.; Liu, H.; Yin, D.; et al. Evaluation of the policy-driven ecological network in the Three-North Shelterbelt region of China. Landscape Urban Plan. 2022, 218, 104305. [Google Scholar] [CrossRef]
  46. Wu, Y.; Wang, W.; Wang, Q.; Zhong, Z.; Pei, Z.; Wang, H.; Yao, Y. Impact of poplar shelterbelt plantations on surface soil properties in northeastern China. Can. J. For. Res. 2018, 48, 559–567. [Google Scholar] [CrossRef]
  47. Wu, Y.; Wang, W.; Wang, Q.; Zhong, Z.; Wang, H.; Yang, Y. Farmland Shelterbelt Changes in Soil Properties: Soil Depth-Location Dependency and General Pattern in Songnen Plain, Northeastern China. Forests 2023, 14, 584. [Google Scholar] [CrossRef]
  48. Peng, S.; Ding, Y.; Liu, W.; Li, Z. 1 km monthly temperature and precipitation dataset for China from 1901 to 2017. Earth Syst. Sci. Data 2019, 11, 1931–1946. [Google Scholar] [CrossRef]
  49. GB/T 21010-2017; Classification of Land Use Status. China Standards Press: Beijing, China, 2017.
  50. Wei, J.; Li, Z.; Lyapustin, A.; Sun, L.; Peng, Y.; Xue, W.; Su, T.; Cribb, M. Reconstructing 1-km-resolution high-quality PM2.5 data records from 2000 to 2018 in China: Spatiotemporal variations and policy implications. Remote Sens. Environ. 2021, 252, 112136. [Google Scholar] [CrossRef]
  51. Wu, D.; Shao, Q.; Liu, J.; Cao, W. Spatial and Temporal Changes of Water Conservation Services in China’s Grassland Ecosystems. Water Soil Conserv. Res. 2016, 23, 256–260. (In Chinese) [Google Scholar] [CrossRef]
  52. Wang, Q.; Liang, L.; Wang, S.; Wang, S.; Zhang, L.; Qiu, S.; Shi, Y.; Shi, J.; Sun, C. Insights into Spatiotemporal Variations in the NPP of Terrestrial Vegetation in Africa from 1981 to 2018. Remote Sens. 2023, 15, 2748. [Google Scholar] [CrossRef]
  53. Yang, A.; Zhang, X.; Li, Z.; Li, Y.; Nan, F. Quantitative analysis of the impacts of climate change and human activities on vegetation NPP in the Qilian Mountain National Park. Acta Ecol. Sin. 2023, 43, 1784. [Google Scholar]
  54. Chi, D.; Wang, H.; Li, X.; Liu, H.; Li, X. Assessing the effects of grazing on variations of vegetation NPP in the Xilingol Grassland, China, using a grazing pressure index. Ecol. Indic. 2018, 88, 372–383. [Google Scholar] [CrossRef]
  55. Xuan, W.; Rao, L. Spatiotemporal dynamics of net primary productivity and its influencing factors in the middle reaches of the Yellow River from 2000 to 2020. Front. Plant Sci. 2023, 14, 1043807. [Google Scholar] [CrossRef]
  56. Shao, Q.; Fan, J.; Liu, J.; Yang, F.; Liu, H.; Yang, X.; Xu, M.; Hou, P.; Guo, X.; Huang, L.; et al. Study on Monitoring and Evaluation of Ecological Benefits of Major Ecological Projects. Adv. Earth Sci. 2017, 32, 1174–1182. (In Chinese) [Google Scholar]
  57. Sun, Y.; Feng, Y.; Wang, Y.; Zhao, X.; Yang, Y.; Tang, Z.; Wang, S.; Su, H.; Zhu, J.; Chang, J.; et al. Field-Based Estimation of Net Primary Productivity and Its Above- and Belowground Partitioning in Global Grasslands. J. Geophys. Res. Biogeosci. 2021, 126, e2021JG006472. [Google Scholar] [CrossRef]
  58. Zhang, C.; Ren, W. Complex climatic and CO2 controls on net primary productivity of temperate dryland ecosystems over central Asia during 1980–2014. J. Geophys. Res. Biogeosci. 2017, 122, 2356–2374. [Google Scholar] [CrossRef]
  59. Felton, A.J.; Shriver, R.K.; Bradford, J.B.; Suding, K.N.; Allred, B.W.; Adler, P.B. Biotic vs abiotic controls on temporal sensitivity of primary production to precipitation across North American drylands. New Phytol. 2021, 231, 2150–2161. [Google Scholar] [CrossRef] [PubMed]
  60. Wang, Y.; Hessen, D.O.; Samset, B.H.; Stordal, F. Evaluating global and regional land warming trends in the past decades with both MODIS and ERA5-Land land surface temperature data. Remote Sens. Environ. 2022, 280, 113181. [Google Scholar] [CrossRef]
  61. Konecky, B.L.; McKay, N.P.; Falster, G.M.; Stevenson, S.L.; Fischer, M.J.; Atwood, A.R.; Thompson, D.M.; Jones, M.D.; Tyler, J.J.; DeLong, K.L.; et al. Globally coherent water cycle response to temperature change during the past two millennia. Nat. Geosci. 2023, 16, 997–1004. [Google Scholar] [CrossRef]
  62. An, H.; Zhai, J.; Song, X.; Wang, G.; Zhong, Y.; Zhang, K.; Sun, W. Impacts of Extreme Precipitation and Diurnal Temperature Events on Grassland Productivity at Different Elevations on the Plateau. Remote Sens. 2024, 16, 317. [Google Scholar] [CrossRef]
  63. Murray Tortarolo, G.; Friedlingstein, P.; Sitch, S.; Seneviratne, S.I.; Fletcher, I.; Mueller, B.; Greve, P.; Anav, A.; Liu, Y.; Ahlström, A.; et al. The dry season intensity as a key driver of NPP trends. Geophys. Res. Lett. 2016, 43, 2632–2639. [Google Scholar] [CrossRef]
  64. Liu, Y.; Yang, Y.; Wang, Q.; Du, X.; Li, J.; Gang, C.; Zhou, W.; Wang, Z. Evaluating the responses of net primary productivity and carbon use efficiency of global grassland to climate variability along an aridity gradient. Sci. Total Environ. 2019, 652, 671–682. [Google Scholar] [CrossRef] [PubMed]
  65. Li, Q.; Zhang, X.; Liu, Q.; Liu, Y.; Ding, Y.; Zhang, Q. Impact of Land Use Intensity on Ecosystem Services: An Example from the Agro-Pastoral Ecotone of Central Inner Mongolia. Sustainability 2017, 9, 1030. [Google Scholar] [CrossRef]
  66. Zhang, X.; Nian, L.; Liu, X.; Samuel, A.; Yang, Y.; Li, X.; Liu, X.; Zhang, M.; Hui, C.; Wang, Q. The spatiotemporal response of photosynthetic accumulation per leaf area to climate change on alpine grassland. Glob. Ecol. Conserv. 2023, 43, e2467. [Google Scholar] [CrossRef]
  67. Jiang, Y.; Hou, W.; Gao, J.; Wu, S. Refined revealing the chain path of multiple ecosystem services under diverse environmental factor gradients. Sci. Total Environ. 2023, 865, 161187. [Google Scholar] [CrossRef]
  68. Hao, H.; Li, Z.; Chen, Y.; Xu, J.; Li, S.; Zhang, S. Recent variations in soil moisture use efficiency (SMUE) and its influence factors in Asian drylands. J. Clean. Prod. 2022, 373, 133860. [Google Scholar] [CrossRef]
  69. Huang, Q.; Zhang, F.; Zhang, Q.; Ou, H.; Jin, Y. Quantitative Assessment of the Impact of Human Activities on Terrestrial Net Primary Productivity in the Yangtze River Delta. Sustainability 2020, 12, 1697. [Google Scholar] [CrossRef]
  70. Deng, S.; Beale, C.M.; Platts, P.J.; Thomas, C.D. Human modification of land cover alters net primary productivity, species richness and their relationship. Glob. Ecol. Biogeogr. 2023, 33, 385–399. [Google Scholar] [CrossRef]
  71. Chi, Y.; Shi, H.; Zheng, W.; Sun, J.; Fu, Z. Spatiotemporal characteristics and ecological effects of the human interference index of the Yellow River Delta in the last 30 years. Ecol. Indic. 2018, 89, 880–892. [Google Scholar] [CrossRef]
  72. Huang, L.; Zhu, P.; Xiao, T.; Cao, W.; Gong, G. Windbreak and sand fixation effects of the Three-North Shelterbelt Project in the past 35 years. Sci. Geogr. Sin. 2018, 38, 600–609. (In Chinese) [Google Scholar]
  73. Zhu, J.; Zheng, X. Reflections and Prospects on the Construction of the Three-North Shelterbelt System: Based on a Comprehensive Assessment of 40 Years of Construction. J. Ecol. 2019, 38, 1600–1610. (In Chinese) [Google Scholar]
  74. Zhao, H.; Liu, X.; Liu, G.; Fu, H.; Zhang, Y.; Du, S.; Jiang, J.; Guo, W.; Yang, Z. Spatiotemporal variation of net primary productivity (NPP) in the Beijing-Tianjin Sand Source Area and its response to the implementation of control projects. Acta Ecol. Sin. 2024, 44, 2406–2419. (In Chinese) [Google Scholar] [CrossRef]
  75. Niu, L.; Shao, Q.; Ning, J.; Liu, S.; Zhang, X.; Zhang, T. The assessment of ecological restoration effects on Beijing-Tianjin Sandstorm Source Control Project area during 2000–2019. Ecol. Eng. 2023, 186, 106831. [Google Scholar] [CrossRef]
  76. Wang, L.; Cao, W.; Huang, L. Integrated analysis of ecological effects of major ecological projects in China over the past 40 years. Acta Ecol. Sin. 2024, 7, 1–15. (In Chinese) [Google Scholar] [CrossRef]
Figure 1. Location map of the study area.
Sustainability 16 03656 g001
Figure 2. Vegetation Zonation of the Study Area.
Sustainability 16 03656 g002
Figure 3. (a) LULC in 2000; (b) LULC in 2020; (c) L c , grassland and woodland unchanged from 2000 to 2020; (d) L c + h , residue land use of the research area from 2000 to 2020.
Sustainability 16 03656 g003aSustainability 16 03656 g003b
Figure 4. (a) Average NPP trend curve from 2001 to 2020; (b) NPP variation trend curve of L c (climate change) from 2001 to 2020; (c) NPP variation trend curve of L c + h (climate change + human activities) from 2001 to 2020.
Sustainability 16 03656 g004
Figure 5. (a) Annual average NPP of L c (climate change) from 2001 to 2020; (b) Annual average NPP of L c + h (climate change + human activities) from 2001 to 2020.
Sustainability 16 03656 g005aSustainability 16 03656 g005b
Figure 6. (a) NPP trend of L C (Climate Change) from 2001 to 2020; (b) NPP trend of L C + h (climate change + human activities) from 2001 to 2020; (c) Significance of NPP trend of L C (climate change) from 2001 to 2020; (d) Significance of NPP trend of L C + h (climate change + human activities) from 2001 to 2020.
Sustainability 16 03656 g006aSustainability 16 03656 g006b
Figure 7. (a) Contribution of climate to NPP trends from 2001 to 2020; (b) Contribution of precipitation to NPP trends from 2001 to 2020; (c) Contribution of temperature to NPP trends from 2001 to 2020; (d) Contribution of other climate factors to NPP trends from 2001 to 2010; (e) Contribution of other climate factors to NPP trends from 2011 to 2020; (f) Contribution of other climate factors to NPP trends from 2001 to 2020.
Sustainability 16 03656 g007aSustainability 16 03656 g007bSustainability 16 03656 g007c
Figure 8. (a) Contribution of human activities to NPP trends from 2001 to 2010; (b) Contribution of human activities to NPP trends from 2011 to 2020; (c) Contribution of human activities to NPP trends from 2001 to 2020.
Sustainability 16 03656 g008aSustainability 16 03656 g008b
Disclaimer/Publisher’s Note: The statements, opinions and data contained in all publications are solely those of the individual author(s) and contributor(s) and not of MDPI and/or the editor(s). MDPI and/or the editor(s) disclaim responsibility for any injury to people or property resulting from any ideas, methods, instructions or products referred to in the content.

