Article

Temporal–Spatial Characteristics and Trade-off–Synergy Relationships of Water-Related Ecosystem Services in the Yangtze River Basin from 2001 to 2021

by
Hongbo Du
1,2,
Jianping Wu
2,
Wenjie Li
1,*,
Yu Wan
1,2,
Ming Yang
1,2 and
Peng Feng
1,3
1
National Inland Waterway Regulation Engineering Technology Research Center, Chongqing Jiaotong University, Chongqing 400074, China
2
Key Laboratory of Hydraulic and Waterway Engineering of the Ministry of Education, Chongqing Jiaotong University, Chongqing 400074, China
3
School of Architecture and Civil Engineering, Chengdu University, Chengdu 610106, China
*
Author to whom correspondence should be addressed.
Sustainability 2024, 16(9), 3605; https://doi.org/10.3390/su16093605
Submission received: 10 February 2024 / Revised: 13 April 2024 / Accepted: 24 April 2024 / Published: 25 April 2024

Abstract

:
The Yangtze River Basin serves as an essential ecological shelter in China, yet it has encountered escalating aquatic ecological challenges. Exploring the spatial–temporal changes and the trade-off–synergy relationships of water-related ecosystem services (WESs) is necessary for formulating management and planning policies targeting the sustainable development of watersheds. In this study, the InVEST model is utilized to evaluate the spatial–temporal variations in water yield (WY), water purification (WP), and soil conservation (SC) in the Yangtze River Basin using remote-sensed data from 2001 to 2021. The spatial overlay method and a correlation analysis were adopted to reveal the trade-off–synergy relationship among the three WESs. Additionally, we performed a comparative analysis across the grid and sub-basin scales. The results showed that the multi-year average WY, WP, and SC were 536.10 mm, 1.32 kg/ha, and 250.08 t/ha, representing increasing rates of 4.74 mm/a, −0.001 kg/ha/a, and 1.88 t/ha/a, respectively. Moreover, the trade-off–synergy relationships of WESs exhibited spatial variability; specifically, the WY-WP, WP-SC, and WY-SC pairs demonstrated reduced synergy magnitude over time. The WES interactions were stable across the scales of interest, while synergy strength showed noticeable variability. The findings may contribute to the sustainable development of the Yangtze River Basin and enhance the comprehensive management of WESs.

1. Introduction

Ecosystem services refer to all the benefits humans acquire from nature [1]. Global ecological systems and basic services related to the structure, process, and functionality of natural ecosystems are termed water-related ecosystem services (WESs), which bolster the sustainable development of human welfare [2]. Recently, burgeoning urbanization and population density have degraded ecosystem services, involving WES degradation, water scarcity, water pollution, and weakened capacity for water–soil preservation [3]. Delving into WESs can promote their sustainable development and comprehensive management.
The spatial–temporal changes in WESs have been evaluated as a prerequisite for guiding ecological management. The evaluation techniques include traditional hydrological tools, such as the Soil and Water Assessment Tool (SWAT) model [4] and the Variable Infiltration Capacity (VIC) model [5], or ecosystem services tools, including the Artificial Intelligence for Ecosystem Services (ARIES) model [6], the Integrated Valuation of Ecosystem Services and Trade-offs (InVEST) model [7], and the Multiscale Integrated Model of Ecosystem Services (MIMES) model [8]. Traditional hydrological tools (i.e., the SWAT model) primarily focus on hydrological and physical processes, necessitating post-processing for ecosystem service assessments. In contrast, ecosystem service tools represented by the InVEST model provide direct spatial visualization results for various ecosystem services and their intermediate variables. Taking water yield (WY) as an example, the assessment accuracies using the SWAT and InVEST models vary across different temporal scales. The latter model is more suitable for annual scale assessments, while the former demonstrates advantages at seasonal and monthly scales [9]. The InVEST model possesses three distinct strengths compared to the others. Firstly, it offers greater flexibility, thanks to the employment of a hierarchical design that allows for adjusting data requirements according to different spatial scales. Secondly, fine-tuning the data settings enables researchers to assess changes in ecosystem service functionalities under future scenarios. Additionally, this model is user friendly and has favorable result visualization [10,11]. It is important to note that the InVEST model still needs improvement in terms of model parameter settings and the uncertainty assessment of evaluation results [11]. Despite these deficiencies, it is one of the most widely used models for WESs. Numerous evaluations of WESs have been conducted by researchers from myriads of administrative regions [12,13], watersheds [14,15], and ecological types, revealing the pronounced spatial–temporal heterogeneities in ecosystem services. Despite these contributions, most of the literature has only measured single or several discrete time points, neglecting the continuous time scale. On the one hand, conducting long-term and continuous time-series assessments can reveal trends and critical transitions in WESs, facilitating the decision making of priority issues for the sustainable management of watershed ecosystems [16]. On the other hand, the trade-offs and synergies of WESs obtained in a single time point may change, in decreasing, strengthening, or even reversing directions over time [17]. Thus, recognizing the continuous temporal changes within WESs can provide valuable insights into the dynamic nature of WESs, guiding ecosystem management [18].
The diversity and spatial heterogeneity of ecosystem services and human activities create intricate interactions mainly characterized by trade-off and synergy relationships. A variety of methodologies are employed to quantify these relationships between ecosystem services, as well as their spatial manifestations. These methodologies include correlation analysis [19], geographically weighted regression [20], spatial overlay analysis, and bivariate spatial autocorrelation analysis [21]. A correlation analysis is regarded as the most straightforward and effective method for quantitatively identifying trade-off and synergy relationships among different ecosystem services and their magnitudes. In contrast, a spatial overlay analysis provides a spatial expression for the relationships of interest. Identifying trade-off and synergy relationships among WESs has emerged as a research hotspot. Despite its popularity, a research gap remains on these interactions, especially across spatial scales [22]. Ecosystem services may exhibit contrasting trade-offs and synergies under different spatial scales [23,24]. For one thing, single spatial scale assessments are likely to capture, miss, or distort the interactions within WESs [18,25]. For another, comparing trade-offs and synergies of WESs across varying spatial scales can facilitate the optimal implementation scale for watershed sustainable management [26]. Moreover, current research primarily focuses on evaluations at various grid scales (500 m, 1 km, and 5 km) and administrative scales (province, city, and county), paying less attention to the sub-watershed scale, especially the differences between grid and sub-watershed scales. For these considerations, the spatial–temporal variations and cross-spatial features of WESs are imperative for watershed spatial planning [21] in the context of advances in the spatial–temporal and cross-spatial analysis of ecosystem services.
As a crucial ecological shelter for the city clusters in the middle and lower Yangtze River regions, the Yangtze River Basin fosters the sustainable development of biological habitats alongside human societies. Recently, the Basin has experienced growing water-related ecological issues, such as drought and flood disasters and water pollution, triggered by rapid economic advancement and climate change. Despite the urgency of addressing these issues, a knowledge gap exists regarding the dynamic changes in WESs, their trade-offs and synergies over long time series in the Yangte River Basin, and whether a conflict arises between these relationships at grid and sub-watershed scales. Based on the multi-source data pertaining to land and meteorological factors, the InVEST model was employed to assess the spatial–temporal variations and cross-spatial features of WESs from 2001 to 2021 in three metrics, i.e., WY, water purification (WP), and soil conservation (SC). Furthermore, this study analyzed the trade-off and synergy relationships among WESs. Subsequently, it revealed the cross-spatial discrepancy between grid and sub-watershed scales, promoting sustainable development of the Yangtze River Basin as well as comprehensive and cross-scale management of the hydrological ecosystem.

2. Overview and Explanation of Data

2.1. Overview of the Study Area

Originating from the northern foothills of the Tanggula Mountain Range, the Yangtze River extends over an impressive course of 6363 km, bypassing 11 provinces, cities, and autonomous regions, as shown in Figure 1. The geographic coordinates of the Yangtze River Basin fall between 24–36° N and 90–122° E. It transects the eastern, central, and western economic zones, covering an extensive area of 1.8 million km2. The Yangtze River Basin exhibits a diversified topography characterized by a gentle decrease in altitude from west to east and a wide distribution of plateaus, basins, mountains, and hills. This region is dominated by a subtropical monsoon climate, with an annual average temperature of 12–18 °C and an average precipitation of 1000–1400 mm, displaying spatial–temporal variations in abundant rainfall. The Yangtze River Basin is irreplaceable in pollution control, climate regulation, and biodiversity maintenance, forming a critical ecological security barrier in China.

2.2. Data Sources and Research Methodology

2.2.1. Data Sources and Processing

The land use data were derived from the Chinese Land Cover Dataset from 2001 to 2021 with a spatial resolution of 30 m, available at https://zenodo.org/record/5816591 (accessed on 8 January 2024). Meteorological data, including national monthly average precipitation, temperature, and potential evapotranspiration, were sourced from the National Center for Earth System Science (http://loess.geodata.cn, accessed on 8 January 2024), featuring a spatial resolution of 1 km. The Chinese Soil Dataset based on the World Soil Database (HWSD V1.1) provided the soil data, encompassing soil type, texture, and depth (1 km spatial resolution). The Digital Elevation Model data with a spatial resolution of 250 m can be accessed via the National Qinghai–Tibet Plateau Data Center (http://data.tpdc.ac.cn, accessed on 8 January 2024). The vector boundary data of sub-basins originated from the HydroSHEDS dataset (https://www.hydrosheds.org, accessed on 8 January 2024). The application of ArcGIS software (version 10.5) transformed these data into a unified projection coordinate system (WGS_1984_Albers) and resampled them with a spatial resolution of 500 m.

2.2.2. Quantification of WESs

Utilizing the InVEST model (version 3.13.0), this study quantified the WY, WP, and SC within WESs of the Yangtze River Basin on a grid scale. Subsequently, the Zonal Statistics tool in ArcGIS was employed to calculate the mean values of WY, WP, and SC at a sub-watershed scale according to the pixel results within the sub-basin boundaries. In addition, we introduced Sen’s Slope method to measure the long-term trend changes of the three WES types from 2001 to 2021 [27] and verified these trends based on the Mann–Kendall test [28]. The three WESs were quantified as follows.
Using the water balance principle in the Budyko Curve and the water production services assessment by the InVEST water production module, the annual WY (unit: mm) of pixel i (Yi) can be calculated as
Y i = ( 1 A E T i P i ) P i
where AETi is the annual evapotranspiration (mm) of pixel i, and Pi is the annual precipitation (mm) of pixel i; the Yangtze River Basin Water Resources Bulletin (http://www.cjw.gov.cn/zwzc/zjgb/, accessed on 8 January 2024) validated the results.
The nutrient delivery ratio module of the InVEST model quantified the nitrogen output per pixel as a metric for WP [18]. A higher nitrogen output indicates a lower capacity for water quality purification. The specific calculation formula used is as follows:
W P i = l o a d i N D R i
where WPi represents the nitrogen output (kg/ha) of pixel i, and loadi and NDRi denote the modified nutrient load [29] and nutrient delivery ratio of pixel i, respectively.
Based on the Universal Soil Loss Equation and considering the interception capacity of soil under varying climatic and topographic conditions, SC can be described based on the sediment delivery ratio module of the InVEST model:
S C = R K L S ( 1 C F )
where SC signifies the annual average soil conservation (t/ha), R stands for the rainfall erosivity factor (MJ·mm·ha−1·h−1), K denotes the soil erodibility factor (t-ha-MJ−1-mm−1), LS represents the slope length gradient factor, C indicates the vegetation cover and management factor, and F symbolizes the factor of soil and water conservation measures; the values of P and C are referred to the cases of the consistent kind of assessment [29].
Based on the results inferred from the InVEST model, WY, WP, and SC can be standardized and summed to assess the overall level of hydrological ecosystem services within the Yangtze River Basin. The calculation formula is expressed below:
T E S = i = 1 3 E S i , j E S i , min E S i , max E S i , min
where the total ecosystem service (TES) refers to the total amount of ecosystem services, ranging from 0 to 3, ESi,j represents the value of ecosystem service function i in image element j, and ESi,min and ESi,max are the minimum and maximum values of ecosystem service function i in this region, respectively.

2.2.3. Ecosystem Service Trade-Off and Synergy Analysis

In this study, the spatial overlay analysis method was utilized to identify the overall trade-off and synergy relationships of the WESs during different periods in the research area. Based on the ArcGIS software with the natural breakpoint method, pixelated WY, WP, and SC values were standardized, reclassified into high, medium, and low categories, and assigned values of 3, 2, and 1, respectively. Rules were applied to determine the overlay codes CODE for each pixel, as defined below:
C O D E = 100 D W Y + 10 D W P + 1 D S C
where DWY, DWP, and DSC denote the reclassification results of WY, WP, and SC, respectively. CODE refers to the three-digit overlay code varying from 111 to 333, corresponding to the supply capabilities of WY, WP, and SC per pixel. This study grouped the overall trade-off and synergy relationships of the WESs into four categories, namely strong trade-off, weak trade-off, high synergy, and low synergy, to predict the strength of the three WES supply capabilities, as listed in Table 1. Herein, all WES supply capabilities achieved their maximum values under conditions of high synergy. Notably, low synergy, implying low supply capabilities across all the WESs, was detrimental to the ecosystem.
In addition, a Pearson correlation analysis offered further insight into the trade-off and synergy relationships between WY, WP, and SC within the Yangtze River Basin at grid and sub-watershed scales, and the t-test facilitation provided a significant analysis of trade-off and synergy intensity. A positive Pearson correlation coefficient implies a synergy relationship between two WESs, while its negative counterpart represents a trade-off. The absolute value of the Pearson correlation coefficient denotes the degree of the trade-off–synergy relationship, passing the significance test when p < 0.05.

3. Results

3.1. Characteristics of Spatial and Temporal Changes in WESs

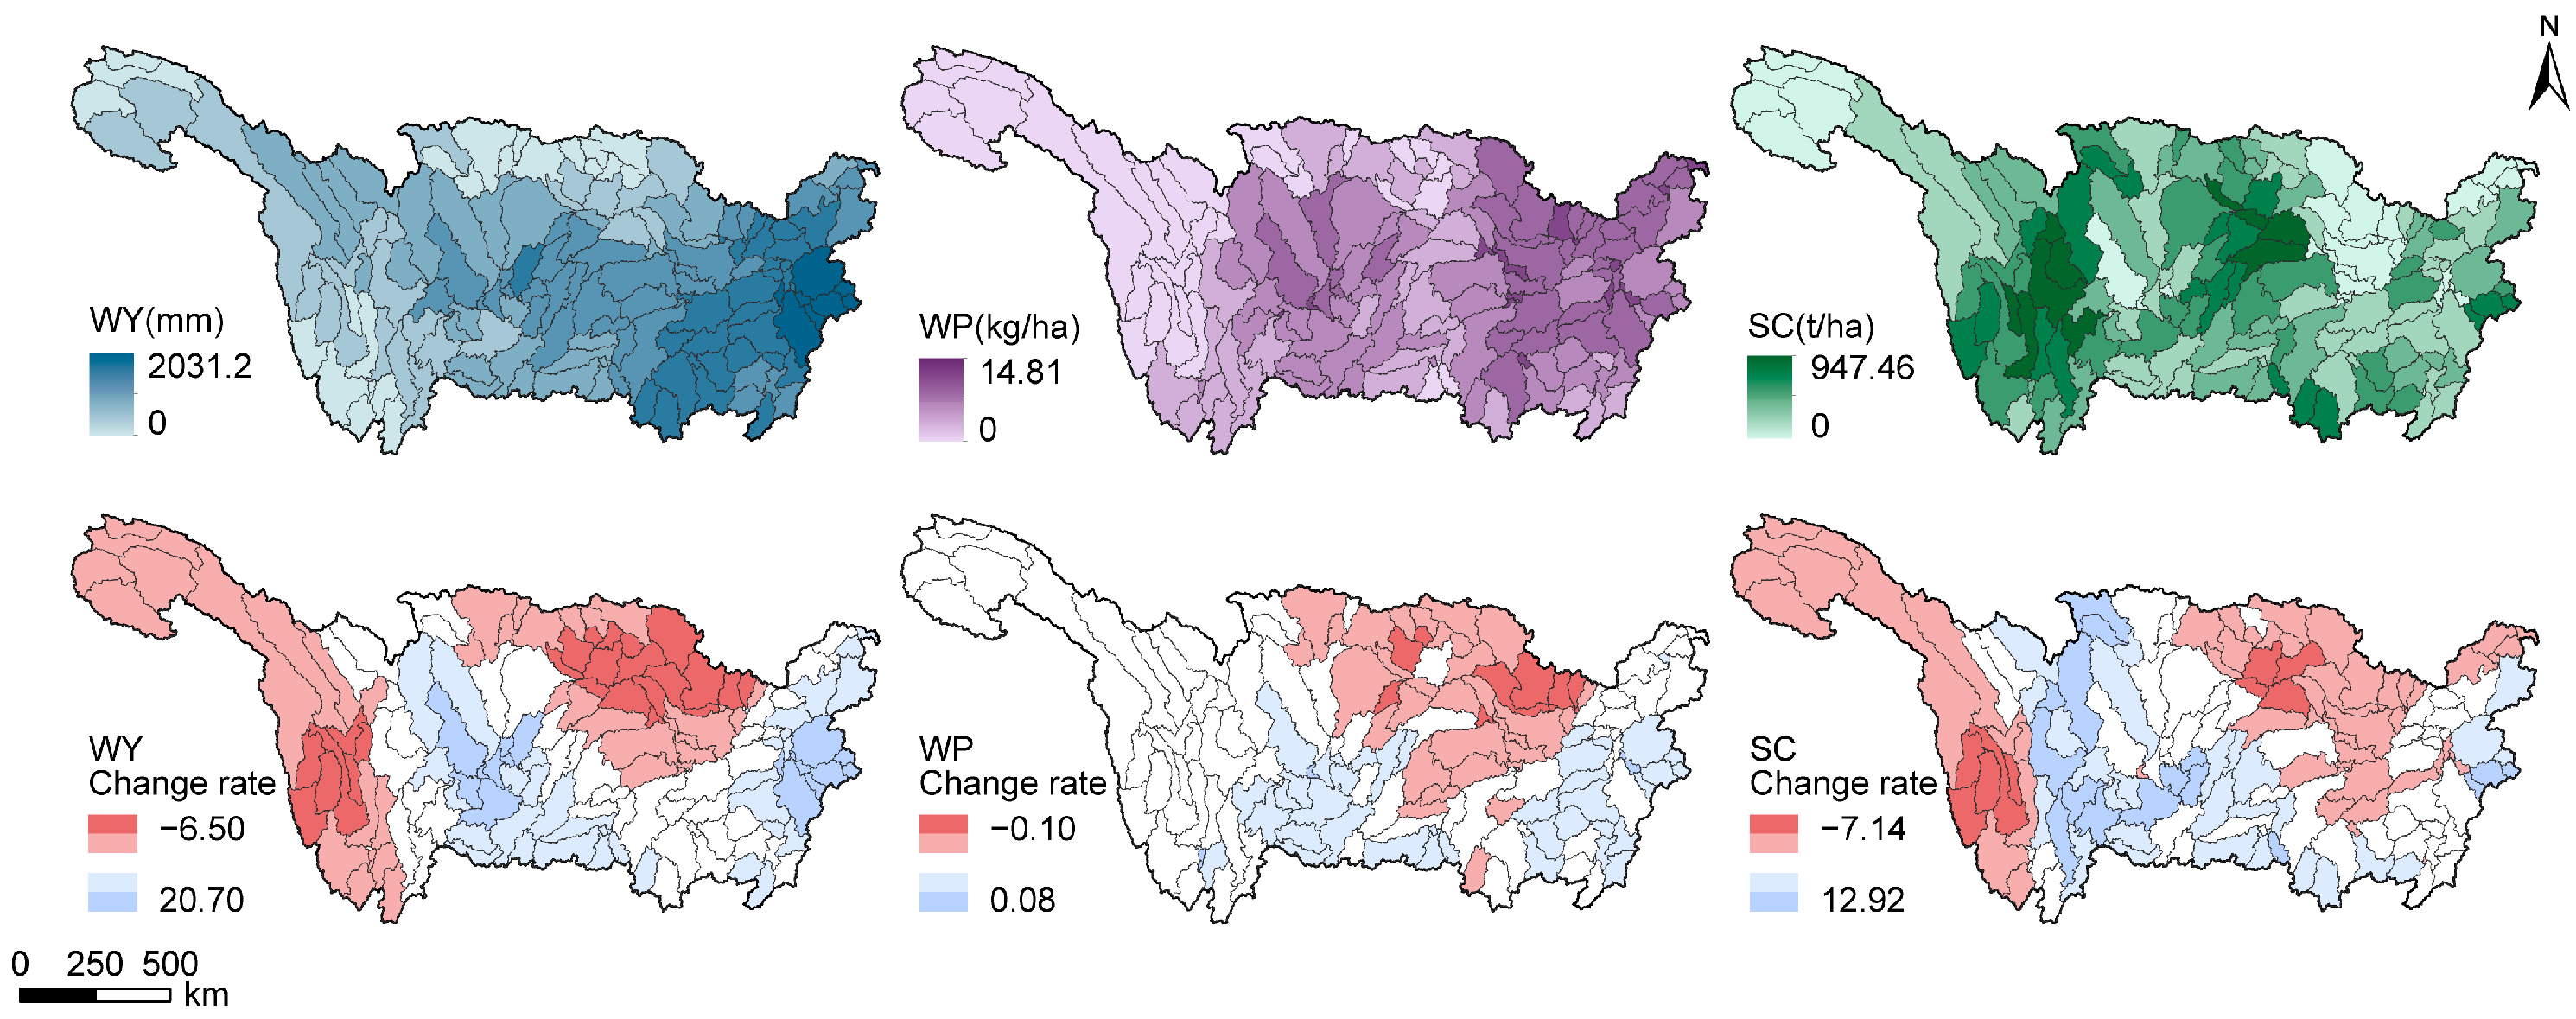
3.1.1. WES Spatial Pattern

Despite the spatial heterogeneity in the WES distribution, the relative spatial framework showed stability and consistent spatial distribution structures at grid and sub-watershed scales, as shown in Figure 2, Figure 3 and Figure 4. Over the last 21 years, the average WY, WP, SC, and TES in the Yangtze River Basin scored 536.10 mm, 1.32 kg/ha, 250.08 t/ha, and 1.18, respectively, with distinguishable variations across the spatial distributions of each WES. WY decreased from northwest to southeast, showing notable disparities between the upstream and downstream regions. High-value zones for WP resided in downstream regions associated with human activities, while the high SC values concentrated in the flat regions along the downstream regions. Pronounced value clusters were observed in the TES, with high values in the northwest mountains and the central mountainous and hilly areas and low values primarily in the Yangtze River source area and northern regions.

3.1.2. Temporal Change in WESs

The trends and spatial distributions of WES changes at the two scales are consistent. Despite the overall consistency, substantial differences are visible in the rate of variations in different WESs, as illustrated in Figure 2, Figure 3 and Figure 4. WY and SC display prominent upward trends, corresponding with the changing rates of 4.73 mm/a and 1.88 t/ha/a, respectively. The western and northeastern regions primarily undergo degradation due to ecological vulnerability. The eastern regions experience a remarkable increase in WY; in contrast, the primary growth in SC is observed in the steep mountainous transition between the first and second steps. WP and TES display relatively minor annual changes, while WP experiences slight decreases at 0.001 kg/ha/a, indicating an overall improvement in water quality. Subtle annual increases in the TES at a marginal rate of 0.003 are observed, while notable declines appear in the northwest and the midstream region of the Yangtze River Basin.

3.2. Trade-Off and Synergy Relationships of WESs

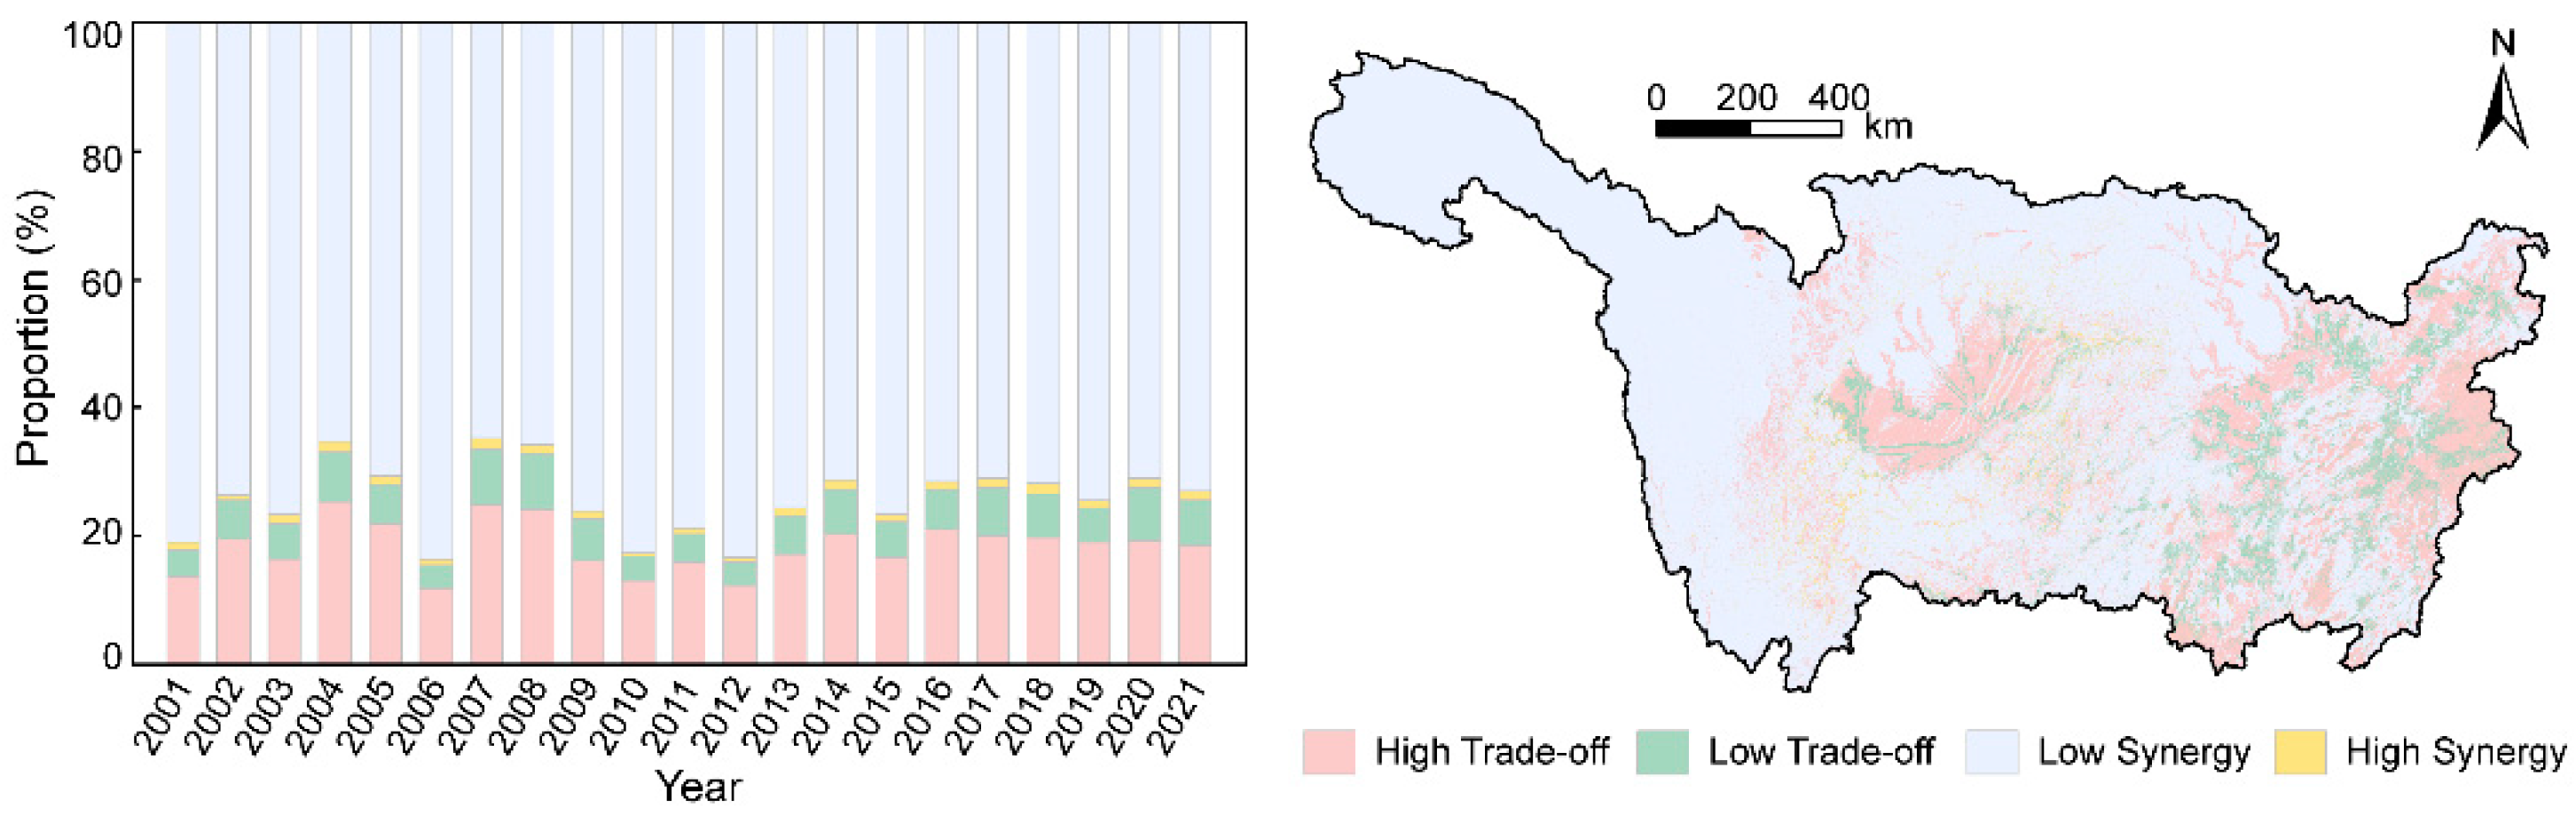
3.2.1. Overall Analysis of Trade-Off and Synergy Relationships

Figure 5 demonstrates that low-synergy relationships governed the ecosystem services in the Yangtze River Basin in 2001–2021, accounting for around 70% of the total pixels primarily distributed in the upstream and midstream regions. Here, the overall contributions of WY, WP, and SC remained consistent. Moreover, the proportions of inapparently strong trade-off, high synergy, and weak trade-off were 20.90%, 6.31%, and 1.57% of the total pixels, scattering across the eastern regions. An analysis of the historical pixel proportions of the trade-off and synergy relationships within the WESs revealed noticeable fluctuations in proportions between the four types of relationships before 2013. After 2013, the distribution area with low synergy decreased by 7.99%; strong and weak trade-offs along with high synergy underwent 4.73%, 2.91%, and 3.46% improvements, respectively. This phenomenon suggests an enhancement in the degree of synergy of the investigated WESs, indicating an improvement in ecological environmental conditions.

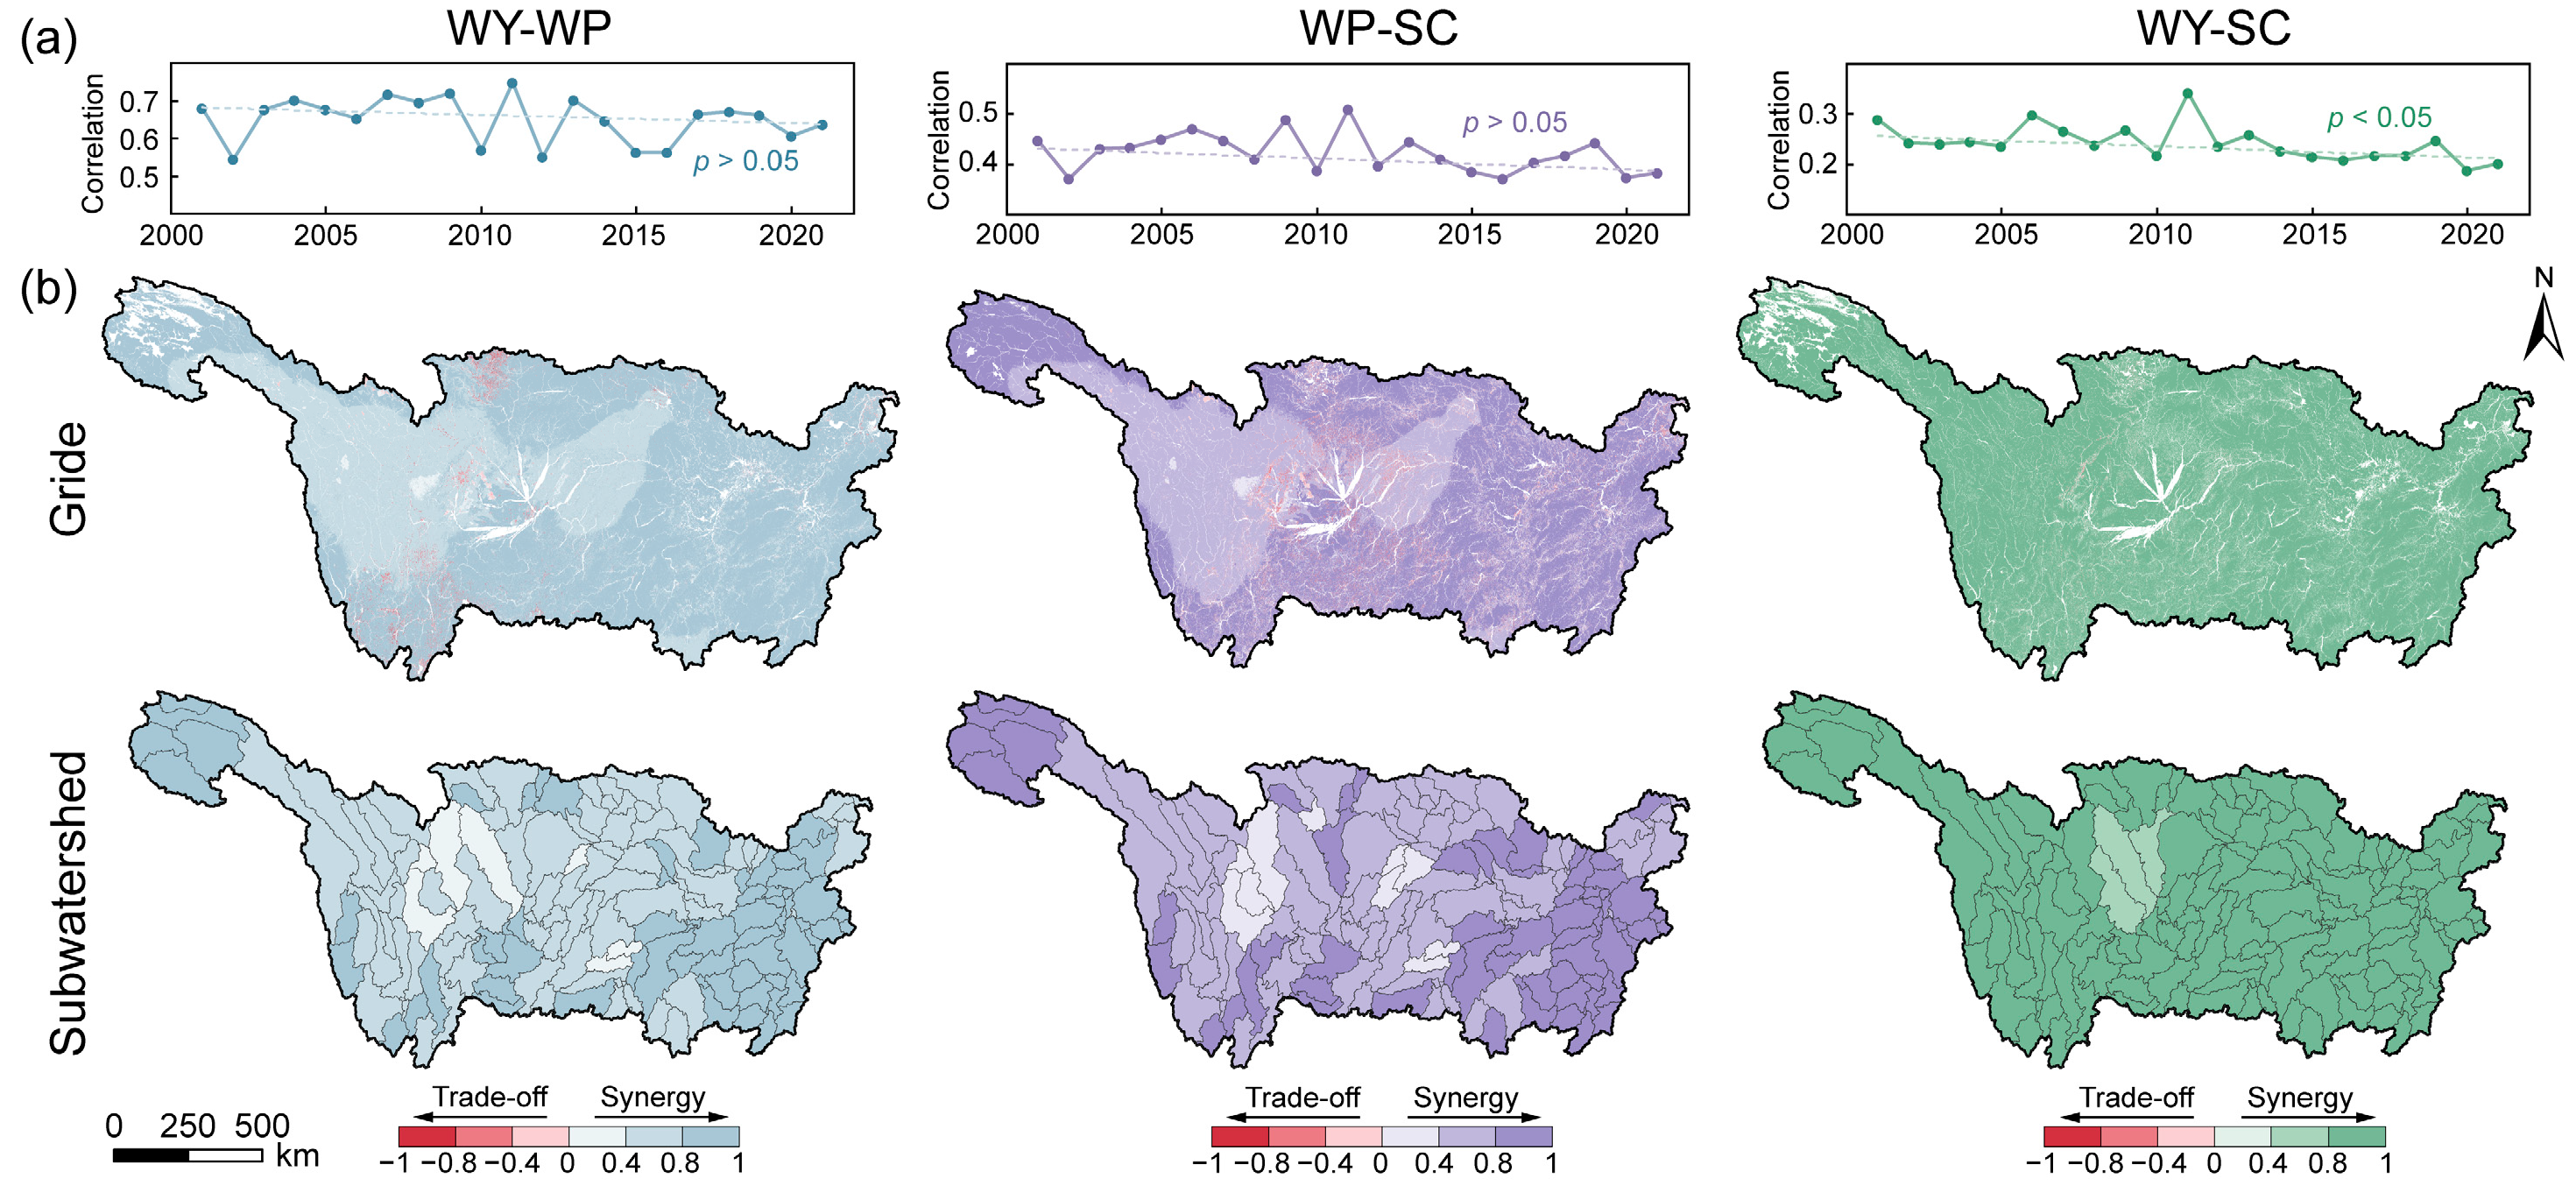
3.2.2. Spatial–Temporal Patterns of Trade-Off and Synergy Relationships within WESs

A notable synergy relationship (p < 0.01) exists among all WESs in the Yangtze River Basin, with the highest correlation coefficient of 0.65 for WY-WP, followed by 0.42 for WP-SC, and the lowest for WY-SC (0.24), as shown in Figure 6a. From 2001 to 2021, the synergy magnitude in all the WES pairs diminished, with a significant decline in WY-SC (p < 0.05); the WY-WP and WP-SC groups experienced no distinct declines. Figure 6b illustrates the spatial distribution of WY, WP, and SC during the study period, reflecting spatial heterogeneity in the trade-off and synergy interactions among the WES pairs on the grid and sub-watershed scales. At the grid scale, the proportions of the synergy relationships for WY-WP and WP-SC were 98.08% and 92.99%, respectively. In contrast, the corresponding trade-off relationships accounted for 1.92% and 7.01%, respectively. As the dominant service type, the synergy relationships showcased consistent spatial patterns with trade-off relationships. High levels of synergistic interactions primarily occurred in the middle and downstream areas of the basin, representing 62.14% and 55.84% of total pixels, which corresponded to more than 0.8 degrees of synergy. In contrast, the upstream area was predominantly characterized by lower synergy, ranging from 0 to 0.8. In the case of WY-SC, the proportion of trade-off and synergy interactions accounted for 0.71% and 99.29%; specifically, 89.18% of the pixels reflected more than 0.8 degrees of synergy, extensively distributing across the whole basin. On the sub-watershed scale, the primary service types of the WES pairs were consistent, and the WY-WP, WP-SC, and WY-SC groups were characterized by synergies. Notably, the pronounced transformation in the proportions of different degrees of synergy manifested.
The variations in the WY-WP and WP-SC pairs were primarily expressed as high-synergy to low-synergy transitions. Their proportions in highly synergistic areas (>0.8 degrees of synergy) reduced to 37.23% and 37.85%, respectively, primarily distributing on river sources and eastern hilly areas. In contrast, the proportion of the high-synergy area for the WY-SC pair further increased to 95.13%. Expanding from the grid scale to the sub-watershed scale, the synergy relationships among the WES pairs became increasingly pronounced, and the spatial heterogeneity was lessened.

4. Discussion

4.1. Analysis of the Impacts of Land Use Changes on the Spatial–Temporal Variations within WESs

From 2001 to 2021, cropland and grassland in the Yangtze River Basin decreased by 5.97 × 10⁸ ha and 5.20 × 10⁸ ha, respectively, while forest and impervious surface areas increased by 5.83 × 10⁸ ha and 4.73 × 10⁸ ha (Figure 7). These changes in land use have largely influenced the spatial–temporal characteristics of the WESs in the basin as a consequence of human activities. Based on the water balance, WY was governed by the combined interplay of precipitation and evapotranspiration. Precipitation was positively correlated with WY; specifically, its spatial distribution determined the increasing spatial pattern of WY from northwest to southeast. Conversely, evapotranspiration exhibited a negative correlation with WY and was influenced by changes in land use types. Impervious surfaces exhibited less evapotranspiration than vegetated lands, and their rapid growth proportionally contributed to the rise in WY. Moreover, considerable arable land underwent conversion into impervious surfaces for urban construction lands, lowering the fertilizers within the ecosystem and WP values and thus improving the water quality conditions. The increasing construction land and human population density intensified pollution [30] and deteriorated water quality, as indicated by the ascending WP in the lower reaches of the Yangtze River. The increased human emissions also decreased WP from surface runoff, weakening the synergistic relationship between WY and WP. During the research period (2001–2021), the construction of conservation forests and the comprehensive management of small watersheds contributed to forest area increases and soil erosion rate declines, leading to an upward trend in the overall SC. The increasing regional vegetation coverage further mitigated the effects of surface runoff on soil erosion, suppressing the WY and SC synergy.
Due to declines in grassland and wetland areas, a declining trend in SC was observed in ecologically vulnerable regions. Overall, the distribution of land use types led to spatial heterogeneity in the WESs and propelled their spatial–temporal evolution. Despite the achievements from ecological preservation measures implemented in the Yangtze River Basin over the past years, urban ecological environments continue to undergo substantial pressures. Attention should be given to bolstering urban ecological construction along with striking a balance between economic development and ecological preservation to achieve harmonious economic–ecological development. The spatial heterogeneity exhibited by WESs necessitates targeted management and zone-specific ecological conservation policies, considering the varying socio-natural conditions of specific regions and thereby facilitating ecological enhancement more effectively.

4.2. Analysis of WES Scale Effects

The multiscale evaluation of regional ecology forms the foundation for regulating ecosystem relationships, demonstrating the following merits: (1) combining the advantages of different analytical scales; (2) highlighting the details revealed by the smaller scale and considering the regional features reflected on the larger scale; (3) offsetting the result deviations introduced by sole-unit scales [31,32]. This research probed into the spatial–temporal characteristics and trade-off–synergy relationships of WY, WP, and SC as the main WESs across grid and sub-watershed scales. In the spatial–temporal configuration of the WESs, the spatial distribution and temporal alteration patterns of the WESs remained stable across varying scales, corroborating the conclusions derived by Xu et al. [23] and Xia et al. [18] that the dominant trade-off–synergy relationships among the WESs were consistent despite varying scales. The WY-WP, WP-SC, and WY-SC pairs predominantly demonstrated synergy relationships across the grid and sub-watershed scales, indicating a robust interaction between the WESs within the Yangtze River Basin [23]. The synergy intensity of the WESs showed spatial disparity at different scales, and the differences in scales resulted in varying strengths of trade-off and synergistic effects. In comparison to the grid scale, the overall synergy of the WESs at the sub-watershed scale was notably strengthened despite the reduced proportion of high-synergy areas. This phenomenon resembles the process of peak shaving and valley filling; specifically, high values are ‘trimmed’ and low values are ‘filled’ in the transition from small to large scales, compromising the synergy towards moderate to low degrees with increasing scale. The disparity in the strength of trade-offs and synergies of the WESs at different spatial scales may also be related to the overall impact of land use types. At smaller scales (grid), when a specific piece of land has a single type of land use and is not influenced by other land use types, this area exhibits direct and strong trade-off and synergy relationships among the WESs. Different local land use types may interact at the sub-watershed scale, thereby weakening and altering the WES trade-off and synergy relationships. This also explains the presence of trade-off relationships at the grid scale compared to the dominance of synergy relationships at the sub-watershed scale. The heterogeneity of the trade-off–synergy interaction intensity revealed the complexity of these interplays in ecosystem services at different dimensions. In this sense, successful ecosystem management necessitates comprehending the complex interactions among WESs, considering the scale effects within geographical environments, and thus adopting tailor-made sustainable ecosystem management under varying scales [33].

5. Conclusions

This study analyzed the spatial–temporal variation characteristics and the changes in the trade-off–synergy relationships of the WESs (WY, WP, and SC) in the Yangtze River Basin from 2001 to 2021. The scale effect on the grid and sub-watershed scales was revealed, offering insights for objectively evaluating the variations in the hydrological ecosystem service functions in the Yangtze River Basin and formulating ecological regulation policies. This work also contributes to the sustainable development of other large river basins experiencing rapid economic growth. The primary findings can be described as follows.
During the research period, the average WY was 536.10 mm in the Yangtze River Basin, with an increase rate of 4.74 mm per year. The average WP volume reached 1.32 kg/ha, revealing a slight annual decline rate of 0.001 kg/ha. Moreover, the SC yielded a 250.08 t/ha volume at an annual growth rate of 1.88 t/ha. The multi-year average TES remained stable at 1.18. Influenced by changes in land use types and natural factors such as precipitation and landform, the spatial–temporal characteristics in WY, WP, and SC exhibited pronounced spatial heterogeneity, demonstrating notable clustering outcomes in high- and low-value zones.
The overall trade-off–synergy relationships of ecosystem services in the Yangtze River Basin predominantly constituted low synergy in the upstream and midstream areas. In the investigated period, the low-synergy area decreased by 7.99%, while the counterparts of strong trade-off, weak trade-off, and high synergy increased, indicating an improvement in the overall ecological condition. The interactions amongst the WES pairs demonstrated that the WY-WP, WP-SC, and WY-SC relations were primarily synergistic, exhibiting a gradual decline in magnitude with increasing years. In addition, the spatial distributions of the synergy relationships in various WES pairs evinced pronounced disparities, with two pairs related to WP evincing similar spatial patterns to WP.
The cross-scale analysis of ecosystem service interactions indicated that WY, WP, and SC displayed consistent spatial–temporal characteristics under the grid and sub-watershed scales. The one interconnection of hydro–physical processes contributed to the stable WES trade-off–synergy relationships. All the investigated WES pairs were dominated by synergistic relationships, with varying strengths across scales. To conclude, basin ecological management and planning strategies should be tailored for different scales, especially for sub-basin regions.

Author Contributions

Conceptualization, writing—original draft preparation, H.D.; methodology, reviewing and editing, J.W.; data curation, visualization, Y.W.; data curation, visualization, M.Y.; reviewing and editing, P.F.; methodology, supervision, project administration, W.L. All authors have read and agreed to the published version of the manuscript.

Funding

This research was financially supported by the Science and Technology Research Program of Chongqing Municipal Education Commission (Grant No. KJZD-K202300703), the National Natural Science Foundation of China (52079013), the Natural Science Foundation of Chongqing (cstc2021jcyj-jqX0009), and the Open Research Subject of the Key Laboratory of Hydraulic and Waterway Engineering of the Ministry of Education, Chongqing Jiaotong University (SLK2023A02).

Institutional Review Board Statement

Not applicable.

Informed Consent Statement

Not applicable.

Data Availability Statement

The data presented in this study are available on request from the corresponding author.

Acknowledgments

We thank editors and anonymous reviewers for their constructive comments on the manuscript.

Conflicts of Interest

The authors declare no conflicts of interest.

References

  1. Robert, C.; Ralph, D.; Rudolf, D.G.; Stephen, F.; Monica, B.H.; Karin, L.; Shahid, N.; Robert, V.; Jose, P.; Robert, G.R.; et al. The value of the world’s ecosystem services and natural capital. Nature 1997, 387, 253–260. [Google Scholar]
  2. Aznar-Sanchez, J.A.; Velasco-Munoz, J.F.; Belmonte-Urena, L.J.; Manzano-Agugliaro, F. The worldwide research trends on water ecosystem services. Ecol. Indic. 2019, 99, 310–323. [Google Scholar] [CrossRef]
  3. Jia, K.; Huang, A.; Yin, X.; Yang, J.; Deng, L.; Lin, Z. Investigating the Impact of Urbanization on Water Ecosystem Services in the Dongjiang River Basin: A Spatial Analysis. Remote Sens. 2023, 15, 2265. [Google Scholar] [CrossRef]
  4. Arnold, J.G.; Fohrer, N. SWAT2000: Current capabilities and research opportunities in applied watershed modelling. Hydrol. Process. Int. J. 2005, 19, 563–572. [Google Scholar] [CrossRef]
  5. Nijssen, B.; Lettenmaier, D.P.; Liang, X.; Wetzel, S.W.; Wood, E.F. Streamflow simulation for continental-scale river basins. Water Resour. Res. 1997, 33, 711–724. [Google Scholar] [CrossRef]
  6. Villa, F.; Ceroni, M.; Bagstad, K.; Johnson, G.; Krivov, S. ARIES (Artificial Intelligence for Ecosystem Services): A new tool for ecosystem services assessment, planning, and valuation. In Proceedings of the 11th Annual BIOECON Conference on Economic Instruments to Enhance the Conservation and Sustainable Use of Biodiversity, Venice, Italy, 21–22 September 2009. [Google Scholar]
  7. Sun, X.; Jiang, Z.; Liu, F.; Zhang, D. Monitoring spatio-temporal dynamics of habitat quality in Nansihu Lake basin, eastern China, from 1980 to 2015. Ecol. Indic. 2019, 102, 716–723. [Google Scholar] [CrossRef]
  8. Boumans, R.; Roman, J.; Altman, I.; Kaufman, L. The Multiscale Integrated Model of Ecosystem Services (MIMES): Simulating the interactions of coupled human and natural systems. Ecosyst. Serv. 2015, 12, 30–41. [Google Scholar] [CrossRef]
  9. Guo, J.; Liu, X.; Zhang, W.; Yang, C.; Wang, R.; Luo, X.; Xin, L.; Wang, C.; Zhao, H. Characterization of Spatial and Temporal Variations in Water Yield on the Yunnan-Guizhou Plateau Based on The InVEST and PLUS Models. Geoscience 2024, 12, 1–16. (In Chinese) [Google Scholar]
  10. Vigerstol, K.L.; Aukema, J.E. A comparison of tools for modeling freshwater ecosystem services. J. Environ. Manag. 2011, 92, 2403–2409. [Google Scholar] [CrossRef]
  11. Huang, C.; Yang, J.; Zhang, W. Development of ecosystem services evaluation models: Research progress. Chin. J. Ecol. 2013, 32, 1–9. (In Chinese) [Google Scholar]
  12. Bai, Y.; Ochuodho, T.O.; Yang, J. Impact of land use and climate change on water-related ecosystem services in Kentucky, USA. Ecol. Indic. 2019, 102, 51–64. [Google Scholar] [CrossRef]
  13. Grizzetti, B.; Liquete, C.; Pistocchi, A.; Vigiak, O.; Zulian, G.; Bouraoui, F.; De Roo, A.; Cardoso, A.C. Relationship between ecological condition and ecosystem services in European rivers, lakes and coastal waters. Sci. Total Environ. 2019, 671, 452–465. [Google Scholar] [CrossRef]
  14. Liang, J.; Li, S.; Li, X.; Li, X.; Liu, Q.; Meng, Q.; Lin, A.; Li, J. Trade-off analyses and optimization of water-related ecosystem services (WRESs) based on land use change in a typical agricultural watershed, southern China. J. Clean. Prod. 2021, 279, 123851. [Google Scholar] [CrossRef]
  15. Li, J.; Zhou, K.; Xie, B. Impact of landscape pattern change on water-related ecosystem services: Comprehensive analysis based on heterogeneity perspective. Ecol. Indic. 2021, 133, 108372. [Google Scholar] [CrossRef]
  16. Wu, Y.; Xu, Y.; Zhang, X.; Li, C.; Hao, F. Multi-Remote Sensing Data Analysis for Identifying the Impact of Human Activities on Water-Related Ecosystem Services in the Yangtze River Economic Belt, China. Water 2023, 15, 915. [Google Scholar] [CrossRef]
  17. Zhu, C.; Dong, B.; Li, S.; Lin, Y.; Shahtahmassebi, A.; You, S.; Zhang, J.; Gan, M.; Yang, L.; Wang, K. Identifying the trade-offs and synergies among land use functions and their influencing factors from a geospatial perspective: A case study in Hangzhou, China. J. Clean. Prod. 2021, 314, 128026. [Google Scholar] [CrossRef]
  18. Xia, H.; Yuan, S.; Prishchepov, A.V. Spatial-temporal heterogeneity of ecosystem service interactions and their social-ecological drivers: Implications for spatial planning and management. Resour. Conserv. Recycl. 2023, 189, 106767. [Google Scholar] [CrossRef]
  19. Gou, M.; Li, L.; Ouyang, S.; Wang, N.; La, L.; Liu, C.; Xiao, W. Identifying and analyzing ecosystem service bundles and their socioecological drivers in the Three Gorges Reservoir Area. J. Clean. Prod. 2021, 307, 127208. [Google Scholar] [CrossRef]
  20. Zuo, L.; Gao, J. Investigating the compounding effects of environmental factors on ecosystem services relationships for Ecological Conservation Red Line areas. Land. Degrad. Dev. 2021, 32, 4609–4623. [Google Scholar] [CrossRef]
  21. Zheng, D.; Wang, Y.; Hao, S.; Xu, W.; Lv, L.; Yu, S. Spatial-temporal variation and tradeoffs/synergies analysis on multiple ecosystem services: A case study in the Three-River Headwaters region of China. Ecol. Indic. 2020, 116, 106494. [Google Scholar] [CrossRef]
  22. Zhang, Q.; Sun, X.; Ma, J.; Xu, S. Scale effects on the relationships of water-related ecosystem services in Guangdong Province, China. J. Hydrol. Reg. Stud. 2022, 44, 101278. [Google Scholar] [CrossRef]
  23. Xu, S.; Liu, Y.; Wang, X.; Zhang, G. Scale effect on spatial patterns of ecosystem services and associations among them in semi-arid area: A case study in Ningxia Hui Autonomous Region, China. Sci. Total Environ. 2017, 598, 297–306. [Google Scholar] [CrossRef] [PubMed]
  24. Zhang, B.; Zheng, L.; Wang, Y.; Li, N.; Li, J.; Yang, H.; Bi, Y. Multiscale ecosystem service synergies/trade-offs and their driving mechanisms in the Han River Basin, China: Implications for watershed management. Environ. Sci. Pollut. Res. 2023, 30, 43440–43454. [Google Scholar] [CrossRef] [PubMed]
  25. Raudsepp-Hearne, C.; Peterson, G.D. Scale and ecosystem services: How do observation, management, and analysis shift with scale—Lessons from Québec. Ecol. Soc. 2016, 21, 106097. [Google Scholar] [CrossRef]
  26. Sun, X.; Wu, J.; Tang, H.; Yang, P. An urban hierarchy-based approach integrating ecosystem services into multiscale sustainable land use planning: The case of China. Resour. Conserv. Recycl. 2022, 178, 106097. [Google Scholar] [CrossRef]
  27. Sen, P.K. Estimates of the regression coefficient based on Kendall’s tau. J. Am. Stat. Assoc. 1968, 63, 1379–1389. [Google Scholar] [CrossRef]
  28. Kisi, O.; Ay, M. Comparison of Mann–Kendall and innovative trend method for water quality parameters of the Kizilirmak River, Turkey. J. Hydrol. 2014, 513, 362–375. [Google Scholar] [CrossRef]
  29. Fang, L.; Wang, L.; Chen, W.; Sun, J.; Cao, Q.; Wang, S.; Wang, L. Identifying the impacts of natural and human factors on ecosystem service in the Yangtze and Yellow River Basins. J. Clean. Prod. 2021, 314, 127995. [Google Scholar] [CrossRef]
  30. Liu, R.M.; Shen, Z.Y.; Ding, X.W. Application of export coefficient model in simulating pollution load of non-point source in upper reach of Yangtze River Basin. J. Agro-Environ. Sci. 2008, 27, 677–682. [Google Scholar]
  31. Xu, J.; Chen, J.; Liu, Y.; Fan, F. Identification of the geographical factors influencing the relationships between ecosystem services in the Belt and Road region from 2010 to 2030. J. Clean. Prod. 2020, 275, 124153. [Google Scholar] [CrossRef]
  32. Cui, F.; Tang, H.; Zhang, Q.; Wang, B.; Dai, L. Integrating ecosystem services supply and demand into optimized management at different scales: A case study in Hulunbuir, China. Ecosyst. Serv. 2019, 39, 100984. [Google Scholar] [CrossRef]
  33. Rodríguez, J.P.; Beard, T.D.; Bennett, E.M.; Graeme, S.C.; Cork, S.J.; Agard, J.; Dobson, A.P.; Peterson, G.D. Trade-offs across space, time, and ecosystem services. Ecol. Soc. 2006, 11, 28. [Google Scholar] [CrossRef]
Figure 1. The map of the study region.
Sustainability 16 03605 g001
Figure 2. Patterns of spatial distribution of individual WESs at the grid scale.
Sustainability 16 03605 g002
Figure 3. Patterns of spatial distribution of individual WESs at the sub-watershed scale.
Sustainability 16 03605 g003
Figure 4. (a) Spatial and temporal characteristics of TES; (b) change trends of WESs.
Sustainability 16 03605 g004
Figure 5. WES trade-offs and synergies in the Yangtze River Basin.
Sustainability 16 03605 g005
Figure 6. (a) temporal distribution of correlations between WESs; (b) Spatial distribution of correlations between WESs.
Sustainability 16 03605 g006
Figure 7. WES changes under different land use types.
Sustainability 16 03605 g007
Table 1. Criteria for delineating trade-off–synergy relationships of ecosystem service.
Service RelationshipsSubclassesSupply Capacity CombinationsOverlay CodesInterpretation
Strong trade-off1 high, 2 low; 1 high, 1 medium, 1 low113, 123, 131, 311, 321Only one ecosystem service supply capacity high
Trade-off
Weak trade-off2 high and 1 low133, 313, 331Only the two ecosystem service supply capacities high
High synergy3 high, 2 high, and 1 medium; 1 high and 2 mediums222, 232, 322, 332, 333All three ecosystem service supply capacities high
Synergy
Low synergy3 low; 1 of 2 low; 1 of 2 low111, 112, 121, 212, 221All three ecosystem service supply capacities low
Disclaimer/Publisher’s Note: The statements, opinions and data contained in all publications are solely those of the individual author(s) and contributor(s) and not of MDPI and/or the editor(s). MDPI and/or the editor(s) disclaim responsibility for any injury to people or property resulting from any ideas, methods, instructions or products referred to in the content.

