Article

Experimental and Analytical Study on Recycled Aggregate RC Columns: Short and Slender Loaded Axially and Eccentrically

by
Bakhtyar Nassih Najar
*,
Mereen Hassan Fahmi Rasheed
and
Bahman Omar Taha
Department of Civil Engineering, Erbil Technical Engineering College, Erbil Polytechnic University, Erbil 44001, Iraq
*
Author to whom correspondence should be addressed.
Sustainability 2024, 16(8), 3489; https://doi.org/10.3390/su16083489
Submission received: 29 March 2024 / Revised: 16 April 2024 / Accepted: 18 April 2024 / Published: 22 April 2024
(This article belongs to the Section Environmental Sustainability and Applications)

Abstract

:
To protect the environment and preserve natural resources, it is crucial to use recycled aggregate (RA) in construction. The recycled coarse aggregate reinforced concrete columns with the addition of steel fiber evaluated under concentric and eccentric loadings for short and slender columns were examined experimentally and analytically in this research. Twenty-four column specimens were built for this study to examine the impact of steel fiber, recycled aggregate, slenderness, and eccentricity on the behavior of reinforced concrete columns. This research examined the failure mode, maximum load-carrying capacity, strain in the concrete, strain in the reinforcement, and ductility. Based on the results, it can be concluded that employing recycled concrete aggregate is a potential approach to meet design codes. The addition of 1% steel fiber effectively prevents concrete from crushing and spalling. Steel fiber, however, improved the columns’ ductility and strength. The results showed the maximum load-carrying capacity of the specimens and the results of using ACI-318 code equations agreed very well. Furthermore, a model is proposed for columns with both natural and recycled aggregate and which accounts for the eccentricity and slenderness to forecast the load-carrying capacity. The outcomes demonstrated that the design principles were met well. Plots of load–moment interaction diagrams for short and slender columns made with the ACI-318 method are compared to the findings of the experiments.

1. Introduction

Replacing natural aggregate (NA) with recycled concrete aggregate (RA) in the concrete mix design is an important step toward a green environment [1,2]. When utilizing recycled aggregate instead of natural aggregate, the computed net carbon balance is about 20% lower [3]. The environmental and economic implications of recycled aggregates manufactured from waste concrete blocks were demonstrated to have a reduction factor of 0.420 g of CO2/EUR cent, and this implies that using recycled aggregate will cut CO2 emissions per unit expense [4]. Different research was conducted in past years to determine the effect of steel fiber on the behavior of structural members made with RA, and some studies have shown an improvement in the compressive strength of concrete [5,6]. Research has also shown an improvement in the shear and bending behavior [7,8]. However, it was observed that current research mainly studied the performance of columns by taking RA into account, but not with a content of steel fiber [9]. In general, the steel fibers could improve the cover–core interface and improve the strength and ductility of reinforced concrete columns [10,11]. Five series of columns were tested to determine the differences in the behavior between columns made with recycled aggregate in comparison with samples made with natural aggregate. The results showed similar behavior during the loading up to failure, as well as a similar bearing capacity and the greater ductility of the samples with recycled aggregate recorded because of the slower nature of failure [12]. The axial load of recycled aggregate concrete (RAC) columns was found to be 18% lower than that of natural aggregate concrete (NAC) columns, while the axial load improved by 2.7% when the tie spacing decreased by 22.5 percent [13]. Seventeen columns (400 × 400 × 1000) were tested with various types and qualities of recycled aggregate, along with different replacement percentages of coarse aggregate (30%, 60%, and 100%), and samples with natural aggregate. Similar cracking patterns were observed. Columns with recycled aggregate experienced a 6–8% reduction in the load-carrying capacity compared to those with natural aggregate, and the authors therefore advocated for the use of the equivalent effective water method and pre-saturated method [14]. Experimental and theoretical results reported on the use of recycled aggregates in structural applications. It was observed that, if the parent concrete had a high-strength concrete, recycled aggregate could safely replace the natural aggregate by 100% [15]. In an experimental study, thirteen short axially loaded columns were investigated to assess the influence of steel fiber and recycled coarse aggregate. The results indicated that the mechanical properties of the recycled aggregate concrete improved. Although the ductility, energy dissipation, and deformation of the columns improved with the addition of 1% steel fiber, its effect on the axial load-carrying capacity was negligible [16]. In conclusion, the replacement of natural aggregate by recycled aggregate increased the compressive, tensile, and bending strength. A negligible change was noticed in the modulus of elasticity. Controlling the fracture process observed after adding steel fiber to the mixture with recycled aggregate consequently increased the mechanical properties of the produced concrete [17]. In the conduction of an experimental test on 12 short columns loaded concentrically and eccentrically, natural aggregate was replaced by recycled aggregate with different ratios of {0, 50, 70}%. The results showed a similarity in the mechanical properties and failure modes. Some of the columns with recycled aggregate recorded a higher bearing capacity. The equivalent effective water method was used with additional water [18]. In another study, the recycled coarse aggregate was produced by crushing waste concrete cubes after being tested in the labs for compressive strength, with a w/c of 0.47–0.70 used in the mixtures. The results showed a higher compressive strength of 3–16% compared to the samples made with natural aggregate. The reported higher strength could have been due to the high water absorption by the recycled aggregate. The use of recycled aggregate was suggested in different applications [19]. It was concluded that, with the higher strength of concrete, the differences between the parent concrete and produced recycled aggregate concrete become higher. In addition, the water absorption becomes higher with the higher strength of the parent concrete [20]. It was noted that the use of recycled aggregate in construction has a major role in the future of sustainable construction and a clean environment. In the experimental research, the results showed the mechanical performance of recycled aggregate concrete is similar to that of natural aggregate concrete in an 80% replacement ratio. However, the mechanical performance of recycled aggregate concrete was not affiliated with the parent concrete [21]. In an experimental study aimed at assessing the impact of parent concrete on the mechanical properties of recycled aggregate, both high-performance recycled aggregate concrete (HPRAC) and normal-strength recycled aggregate concrete (NSRAC) were investigated. It was found that HPRAC derived from parent concrete with strengths of 80–100 MPa demonstrated mechanical properties comparable to or slightly better than those of natural aggregate concrete [22]. The recycled aggregate was produced by crushing waste concrete from pre-cast concrete columns and laboratory test cubes. Samples with 0%, 50%, and 100% replacements of recycled aggregate underwent compression strength testing, and acceptable results confirmed the feasibility of using recycled aggregate in structural applications [23]. Examining the seismic effect on 53 rectangular recycled aggregate concrete columns from different reports in the literature, the results showed that the bearing capacity of the specimens decreased and the ductility performance increased with an increase in the replacement ratio of recycled aggregate and the slenderness ratio [24].
This study’s main objective is to investigate the behavior of slender, recycled coarse aggregate columns and short columns for comparison, which have not been combined in previous studies, as well as to examine the behavior of these columns at different levels of eccentricity under axial and eccentric loads. In addition, we assess if it is possible to replace all of the RA in the twenty-four reinforced concrete columns by analyzing the effects of steel fiber on the samples made of RA and NA. We also investigate the slenderness, eccentricity, ductility, strain in the concrete and steel, and axial and vertical displacement of the columns. Recently, there have been only a few studies looking into some aspects of column behavior, with one study considering slender or short columns built using recycled coarse aggregate. Therefore, many more investigation is required in the field of recycled aggregate.

2. Experimental Program
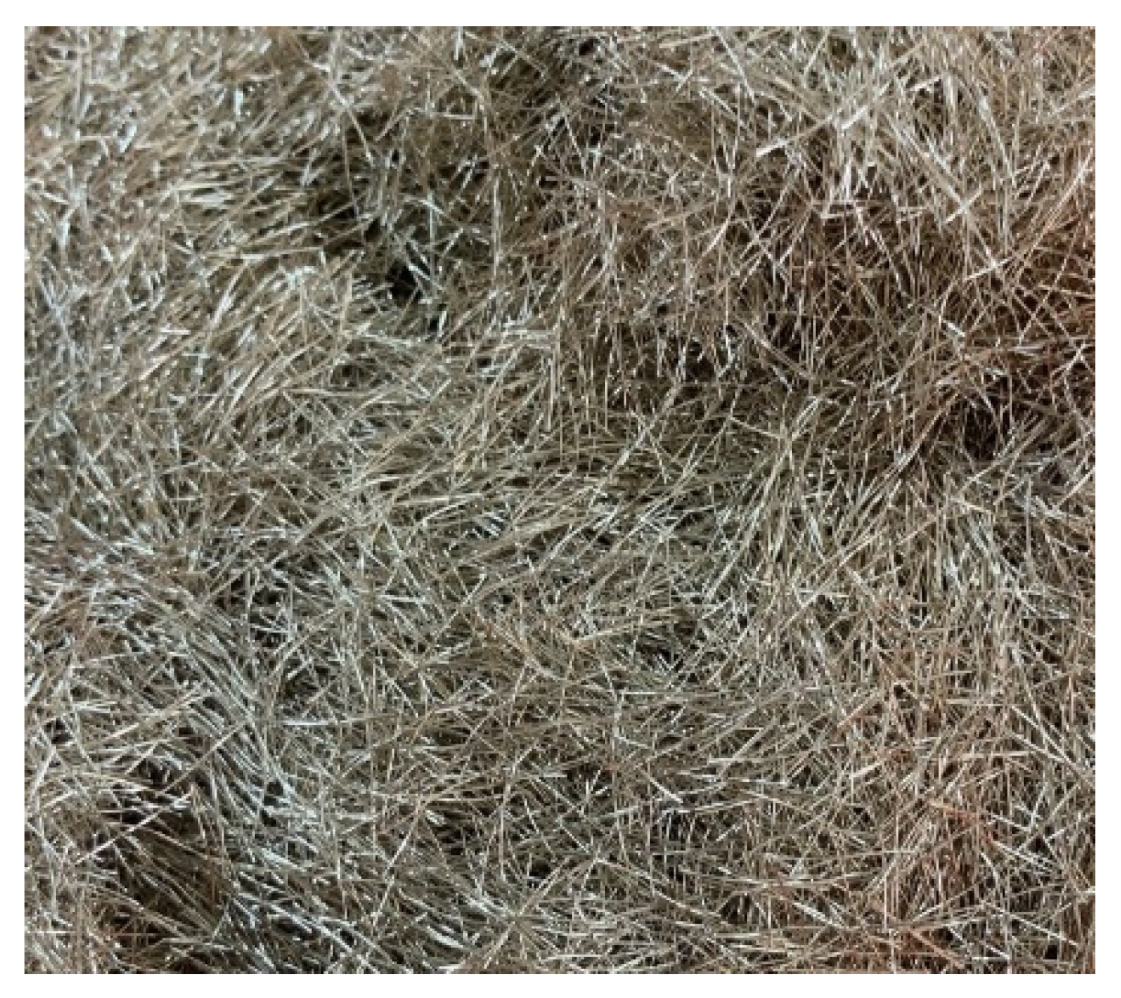
This experimental program consisted of twenty-four reinforced concrete columns. Twelve of these columns are short, with a slenderness ratio (kl/r) of 17.24, and the other twelve are slender columns with a kl/r of 34.5, where k is the effective length factor, l is the height of the column, and r is the radius of gyration. Every column made with natural coarse aggregate has an equivalent column made with recycled aggregate for comparison. Columns made with natural aggregate and recycled aggregate without steel fiber have an equivalent column made with a 1% content of steel fiber. Additionally, the columns are axially loaded in three different eccentricities, namely, e/h = 0 (concentrically loaded), e/h = 0.5 (e = 62.5 mm), and e/h = 1.0 (e = 125 mm). The specimens are identified based on how they are made. For the samples “S-RA0Vf0E0.0” and “L-RA100Vf0E0.0”, S = short; L = slender; RA0 = 100% natural aggregate; RA100 = 100% recycled aggregate; Vf0 = without steel fiber; Vf1 = with a content of 1% steel fiber; E0.0 = concentrically loaded; E0.5 and E1.0 = eccentrically loaded at e/h = 0.5 and e/h = 1.0, respectively. The details of the specimens are listed in Table 1.

2.1. Materials

Type 1 Ordinary Portland Cement was used to comply with ASTM C150 [25]. The chemical composition data for the cement provided by the manufacturer are shown in Table 2. River sand was used as a fine aggregate. Natural coarse aggregate with a maximum particle size of 12 mm was selected. The recycled aggregate is made from laboratory waste concrete blocks (tested cubes and cylinders), with a maximum particle size of 12 mm. Figure 1 shows the process of preparation of the recycled aggregate. The RA with mostly mortar attached to its surface was observed. The coarse aggregate, NA, and RA are shown in Figure 2 for comparison, and the results were satisfactory to ASTM-C33 [26]. Figure 3 shows the sieve analysis of the coarse aggregates. Table 3 shows the physical properties of the coarse aggregate, where it was observed that the RA had a much higher water absorption compared with the NA. The steel fiber used in this experiment was coated with copper, having a diameter of 0.25 mm and a length of 14 mm, with a nominal tensile strength of 2850 MPa, and the specified properties satisfied ASTM A820 [23]. A sample of steel fiber is shown in Figure 4.

2.2. Mix Properties

For this experimental test, a compressive strength of 35 MPa was chosen. The decision regarding the strength was determined by the capacity of the column testing machine. Table 4 presents the optimal proportions, determined through numerous trial mixes conducted in the laboratory by the authors and consistently utilized throughout the experimental testing. The direct volume replacement (DVR) method selected the same volume of aggregate used for the replacement. Following ASTM C127 [27], the RA and NA were washed and then immersed in roomtemperature water for 24 h before the use in the mixture. Then, the aggregate surface moisture is dried with towels. Figure 5 show the aggregates (a) immersed in water for 24 h and (b) the process of drying. At this time, both types of aggregate became saturated and dry on the surface, and this is the definition of the saturated surface dry (SSD) method. The water absorbed by both types of aggregate was not counted in the water–cement ratio. The water added to the mixture should be adequate for the cement hydration in the mixture of concrete.

2.3. Specimen Design

The available testing machine in the lab dictated the dimensions of the column concerning the size and slenderness ratio. In addition, the normal strength of the concrete was selected based on the strength capacity of the testing machine. The designed cross-section for all the columns in this study was 125 mm × 125 mm, with a clear cover of 12 mm, the effective length of the short columns equaled 625 mm, and the total length was 1025 mm, while the effective length of the slender columns was 1250 mm and its total length was 1650 mm. Six cylinders of 100 mm × 200 mm were prepared to measure the concrete compressive strength (f′c) and concrete splitting strength (fct), three prisms of 10 × 10 × 40 were cast to measure the flexural strength (fr), and three cylinders were used to measure the modulus of elasticity (Ec). All of them were accompanied by the columns in the same batch of pouring and curing conditions. The results are listed in Table 5.
Each column specimen was reinforced with four longitudinal 10 mm diameter steel bars placed at the corners of the cross-section, and the ratio was 2%. Ties with 8 mm diameter steel bars were used for transvers reinforcement. The properties of the steel reinforcement are shown in Table 6. The geometry, dimensions, and reinforcement are detailed in Figure 6.

2.4. Test Setup and Instrumentation

Specimens were loaded axially at a rate of 1.0 kN/sec up to failure with the load-controlled computerized compression testing machine with a capacity of 1200 kN in the laboratory of the Civil Engineering Department of Erbil Polytechnic University. The load cell model (HC-200 t C3) with a capacity of 2000 kN was installed on the machine and connected to the data logger, and the data were read from the computer screen. Two electrical strain gauges were installed on the longitudinal steel bars, four were installed on the concrete surface at mid-height and in a vertical position, one was installed on the front face, and another one was installed on the back face. Linear voltage displacement transducers (LVDTs) were used to measure the axial displacement installed at two-thirds of the height, while the second LVDT was installed at the mid-height of the column to measure the lateral displacement. A dial gauge was installed at the mid-height of the column on the opposite side of the LVDT for lateral displacement readings. All samples were aligned vertically in two perpendicular directions by two lasers. Figure 7a shows the enlarged ends of the columns confined with CFRP sheets to avoid premature failure at the ends. Figure 7b shows a 50 mm diameter steel rod that was placed between two 50 mm thick plates with three grooves at 13 mm, 62.5 mm, and 125 mm to obtain the required eccentricities. Column heads were inserted into a rectangular plate cap that was built with the 50 mm plate to ensure hinge behavior on the ends. Figure 7c shows the assembly and setup of the sample before the testing. In addition, six cylinders for compressive strength and splitting strength as well as three prisms were cast along with the samples to determine the mechanical properties of the concrete.

3. Results and Analysis
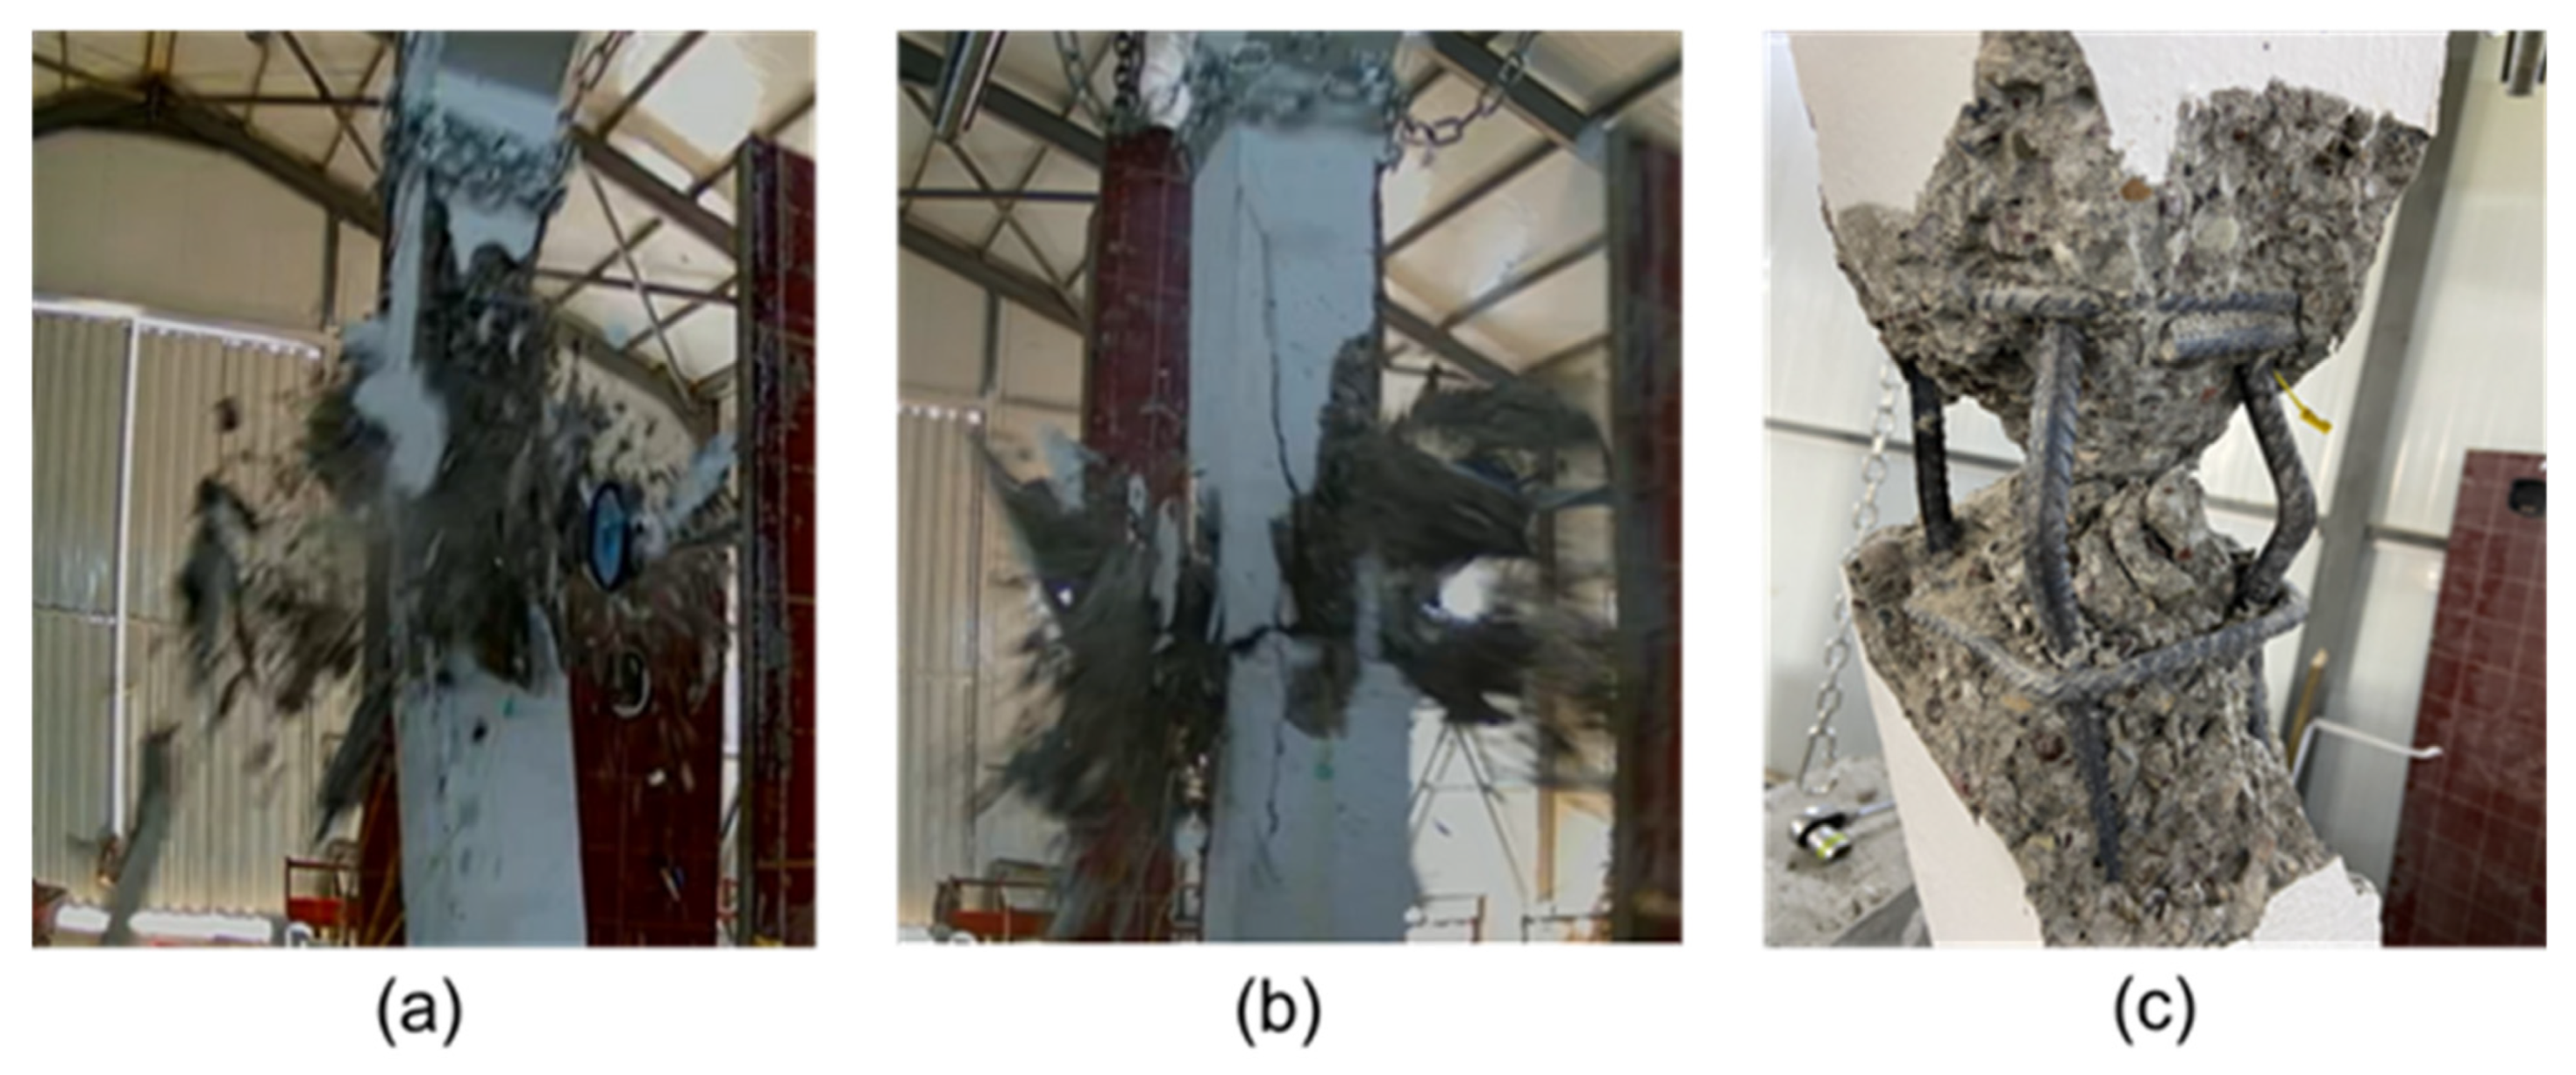
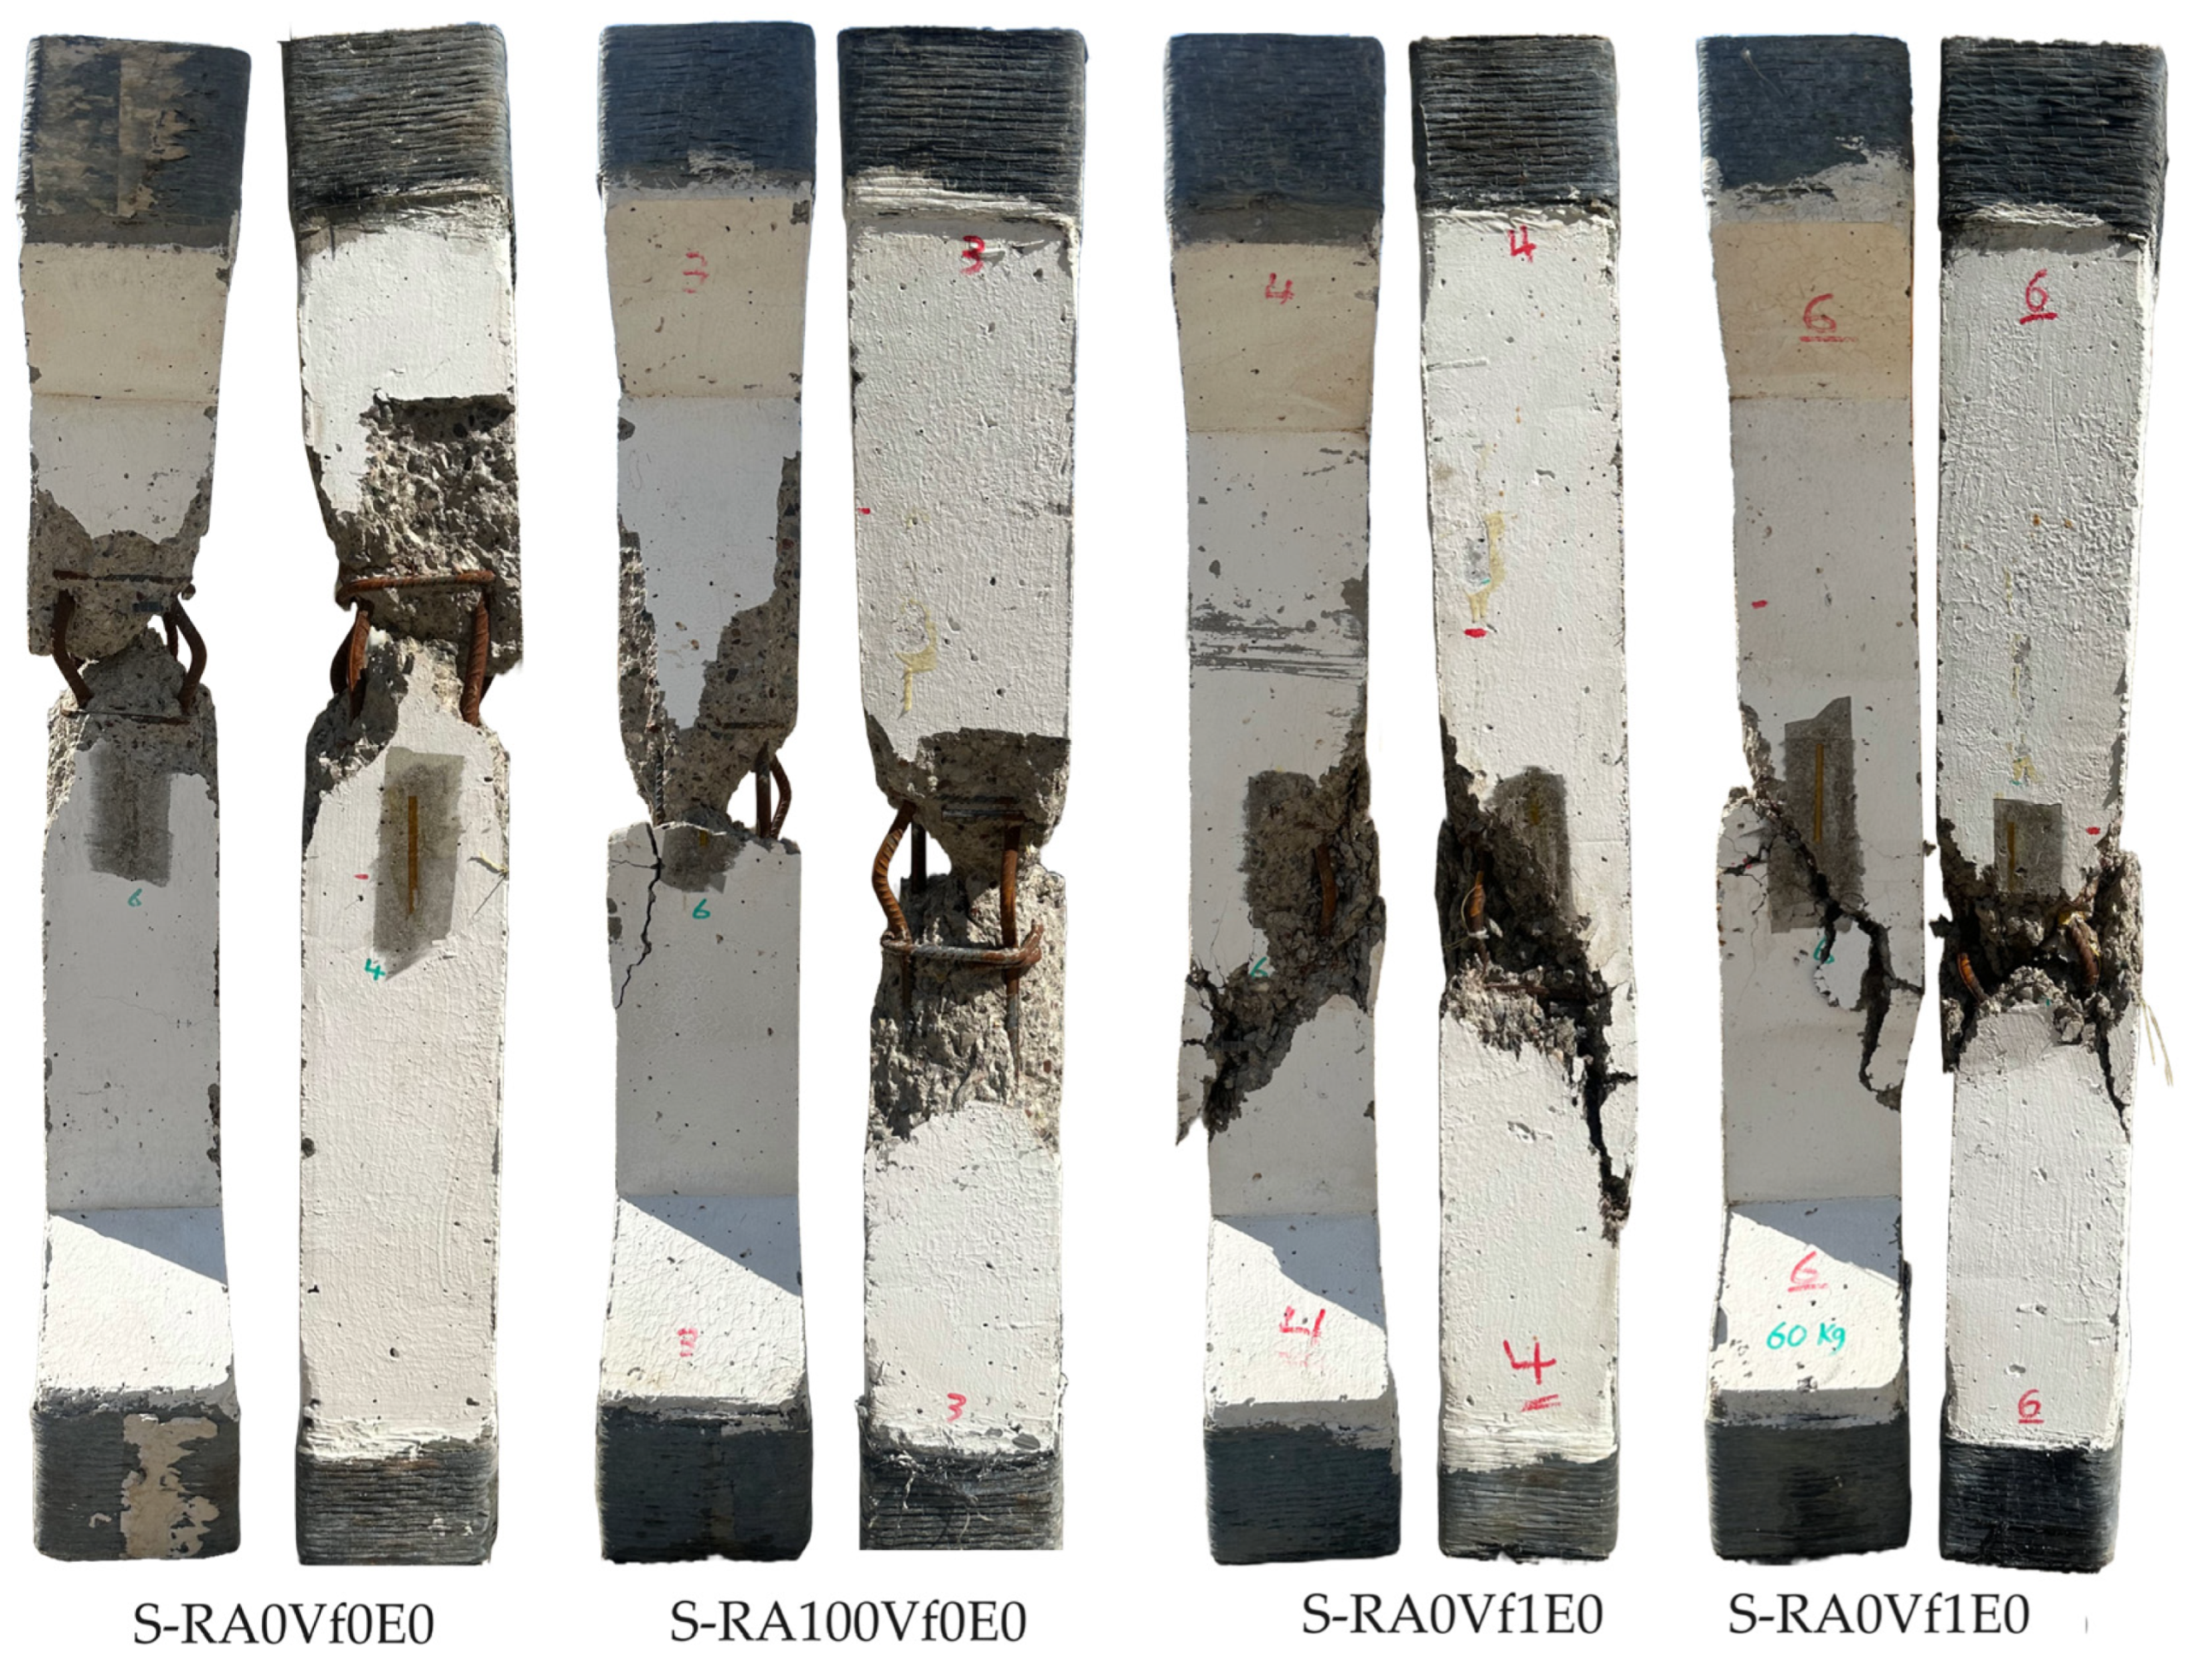
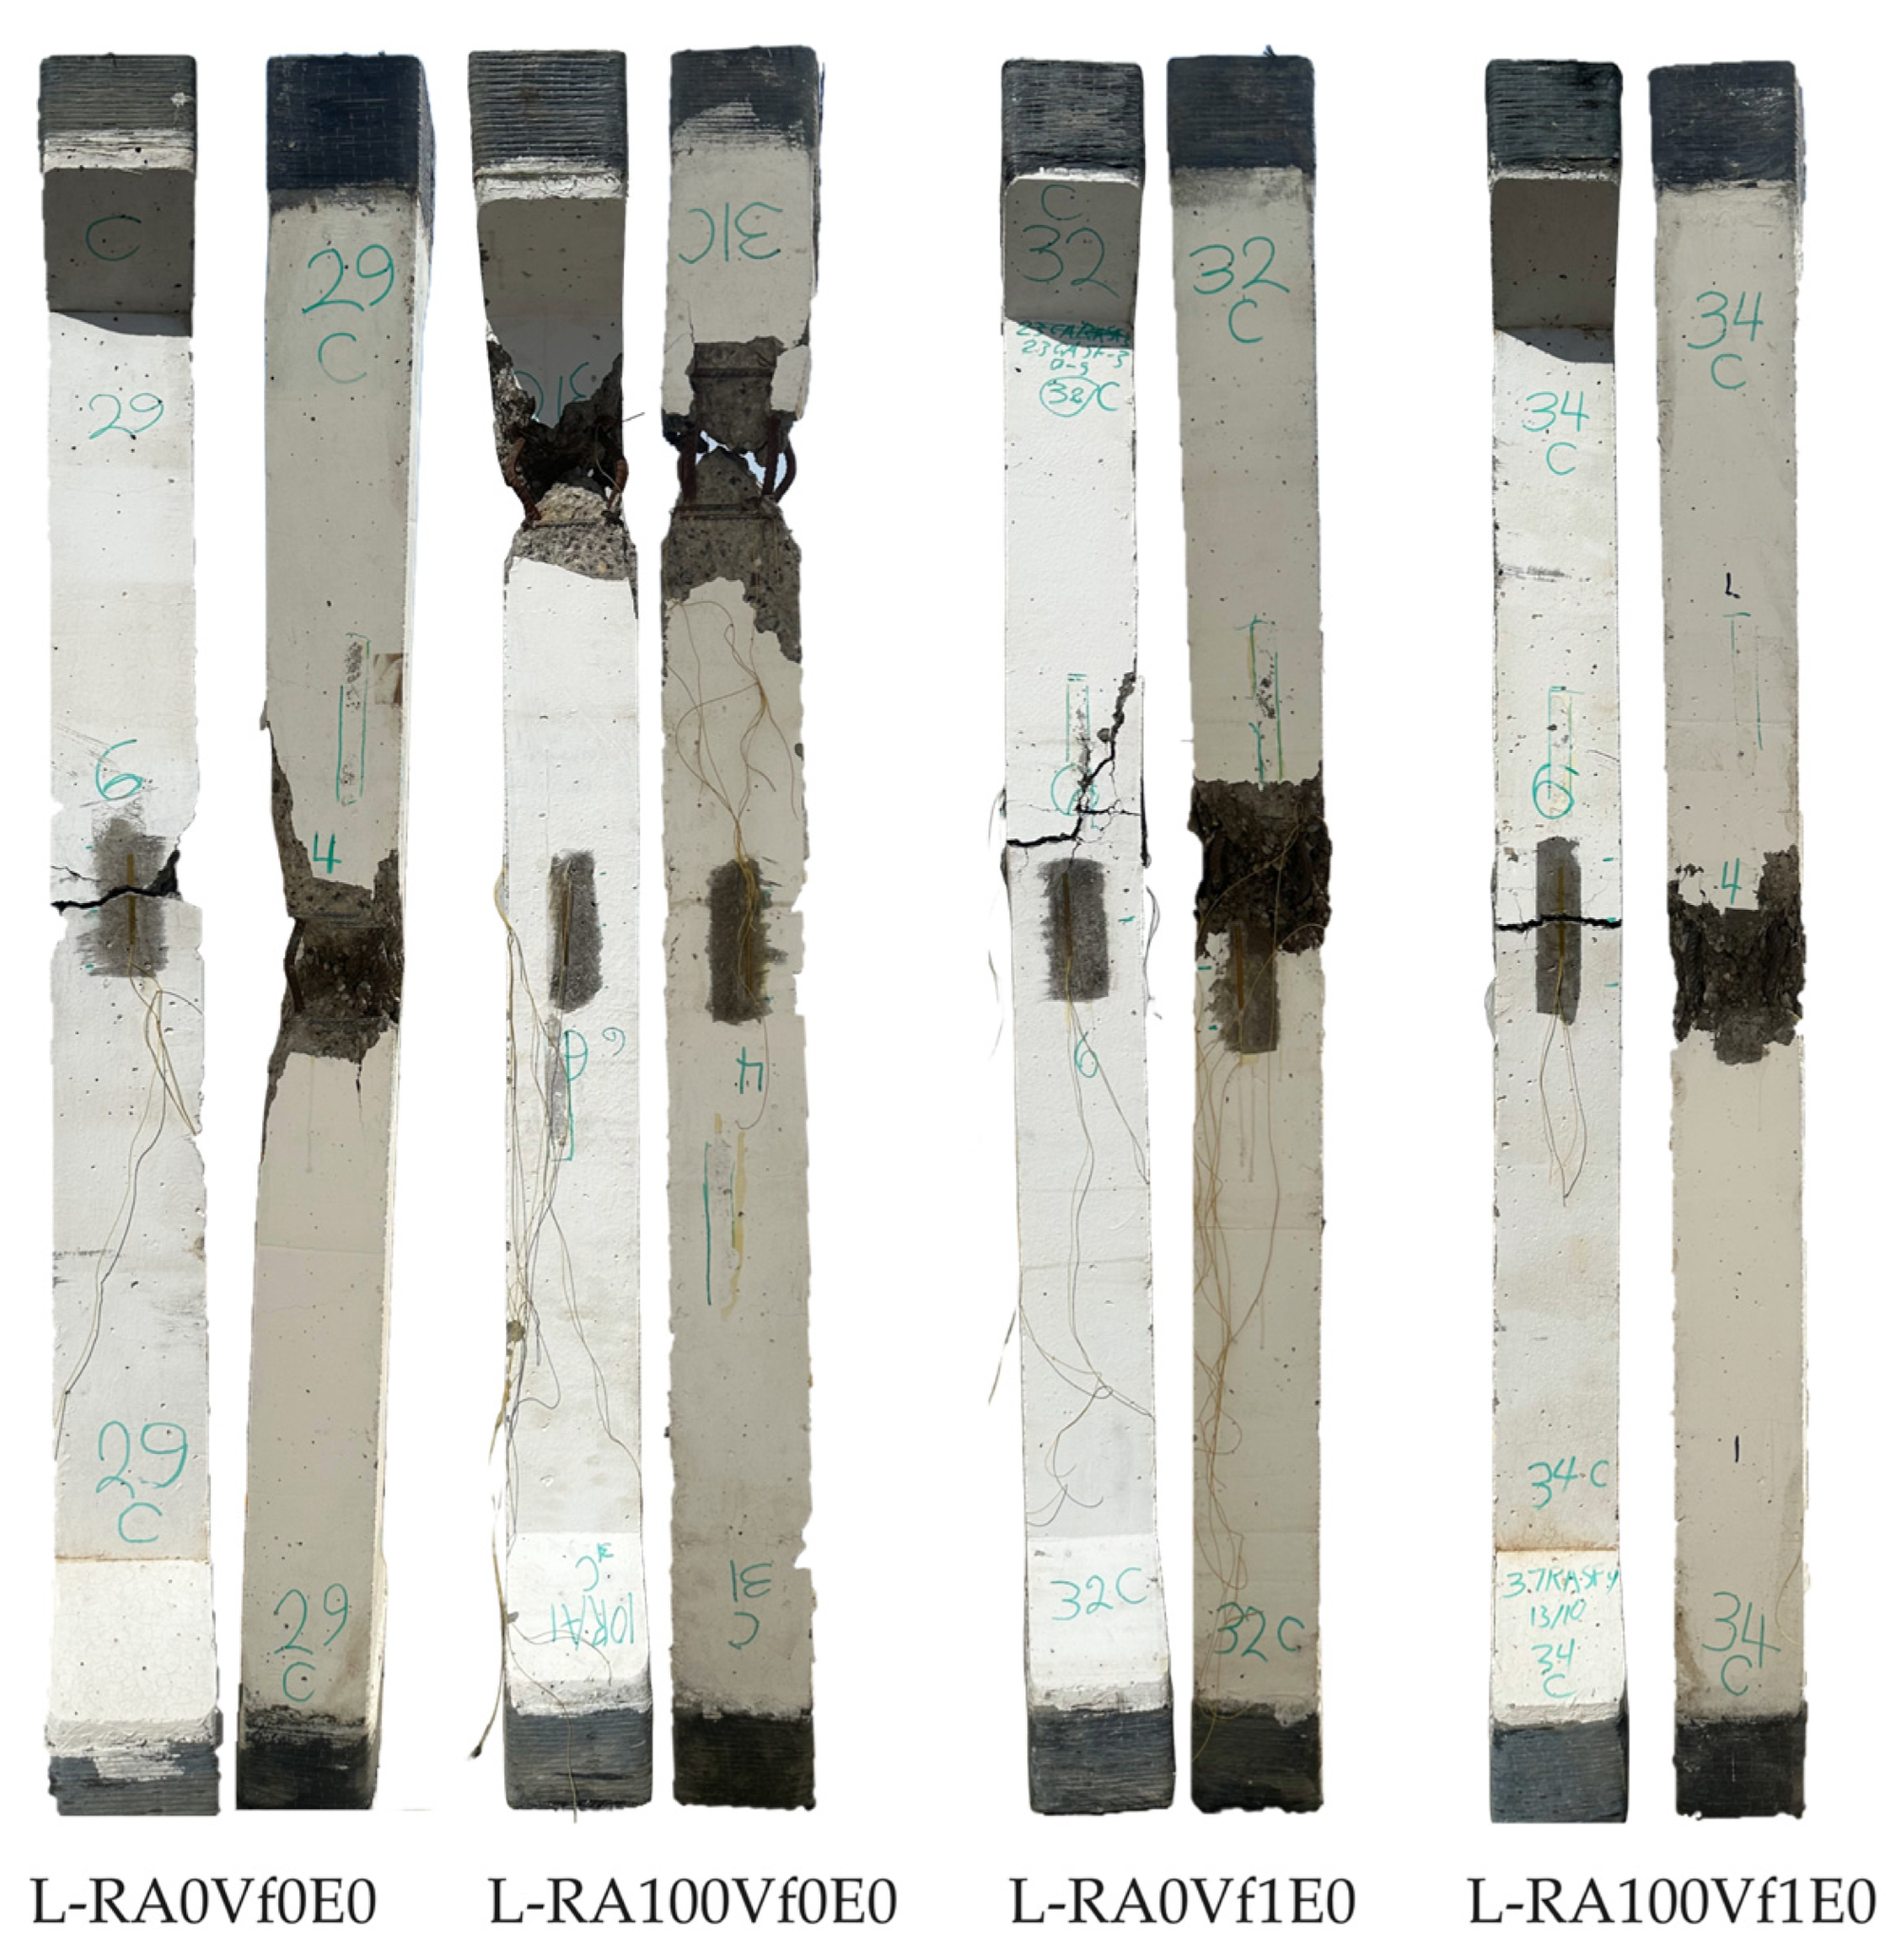
3.1. Failure Mode

3.1.1. Short and Slender Columns under Concentric Loading (e/h = 0)

The behavior of all columns at failure was brittle, sudden, and explosive. This type of failure is considered severe, as it occurs abruptly and without any prior warning. Both short and slender columns failed in compression when the steel yielded and buckled outward, and the concrete crushed. Long vertical hairline cracks appeared on the corner edge toward the middle of the columns in just about the maximum column carrying capacity; then, the cracks multiplied and widened, and the corners started spalling as the crush took place. Figure 8a column with natural aggregate and Figure 8b column with recycled aggregate, show the nature of the failure as it happened. Figure 8c shows how concrete pieces came off and steel buckled after the failure of a column. Columns crushed and failed near the mid-height of the columns, except for L-RA100Vf0E0, which crushed near the bottom end of the column, with a concrete strain comparable to other samples, as shown in Table 7. Slender columns (kl/r = 34.5) failed at slightly lower loads than the short columns (kl/r = 17.24). S-RA0Vf0E0 failed at 680 kN versus L-RA0Vf0E0, which failed at 642 kN. In the specimens without the content of steel fiber, the columns made with recycled aggregate, S-RA100Vf0E0 (735 kN) and L-RA100Vf0E0 (690 kN), recorded higher maximum carrying capacities than S-RA0Vf0E0 (680 kN) and L-RA0Vf0E0 (642 kN), which were made with natural aggregate. Table 7 shows the results of the strains at peak failure loads. Unequal concrete strains on the front side and back side of the concentrically loaded columns returned to the minor and unintentional eccentricity of the applied load; consequently, second-order effects developed and some moment on the column was created. The results show that short and slender columns made with recycled and natural aggregate with and without the content of steel fiber failed in compression under concentric loading. The columns made of recycled aggregate exhibited a similar failure process, but in a more fragile manner, compared to columns made of natural aggregate. More pieces came off S-RA100Vf0E0 and S-RA0Vf0E0 at the failure compared to the equivalent samples made with steel fiber. The addition of steel fiber in the samples showed more ductile behavior than the samples that did not have steel fiber in them, and this can be observed in the values of the ductility index in Table 7. An example is S-RA0Vf0E0, where the ductility index shown is 1.12, compared to S-RA0Vf1E0, with a ductility index of 1.37. The concrete strain curve for S-RA100Vf0E0 falls behind the curve for S-RA100Vf1E0, reading lower strains at the same load level. In S-RA0Vf1E0 and S-RA100Vf1E0, with steel fiber in both of them, most of the pieces of concrete cover held in place after the failure, and this might have contributed to the higher bearing capacity. This is correct for both types of specimens made with natural aggregate and recycled aggregate. Figure 9 and Figure 10 show the failure pattern of short and slender columns, respectively. It is observed that the short columns failed with a more fragile mode than the slender columns.

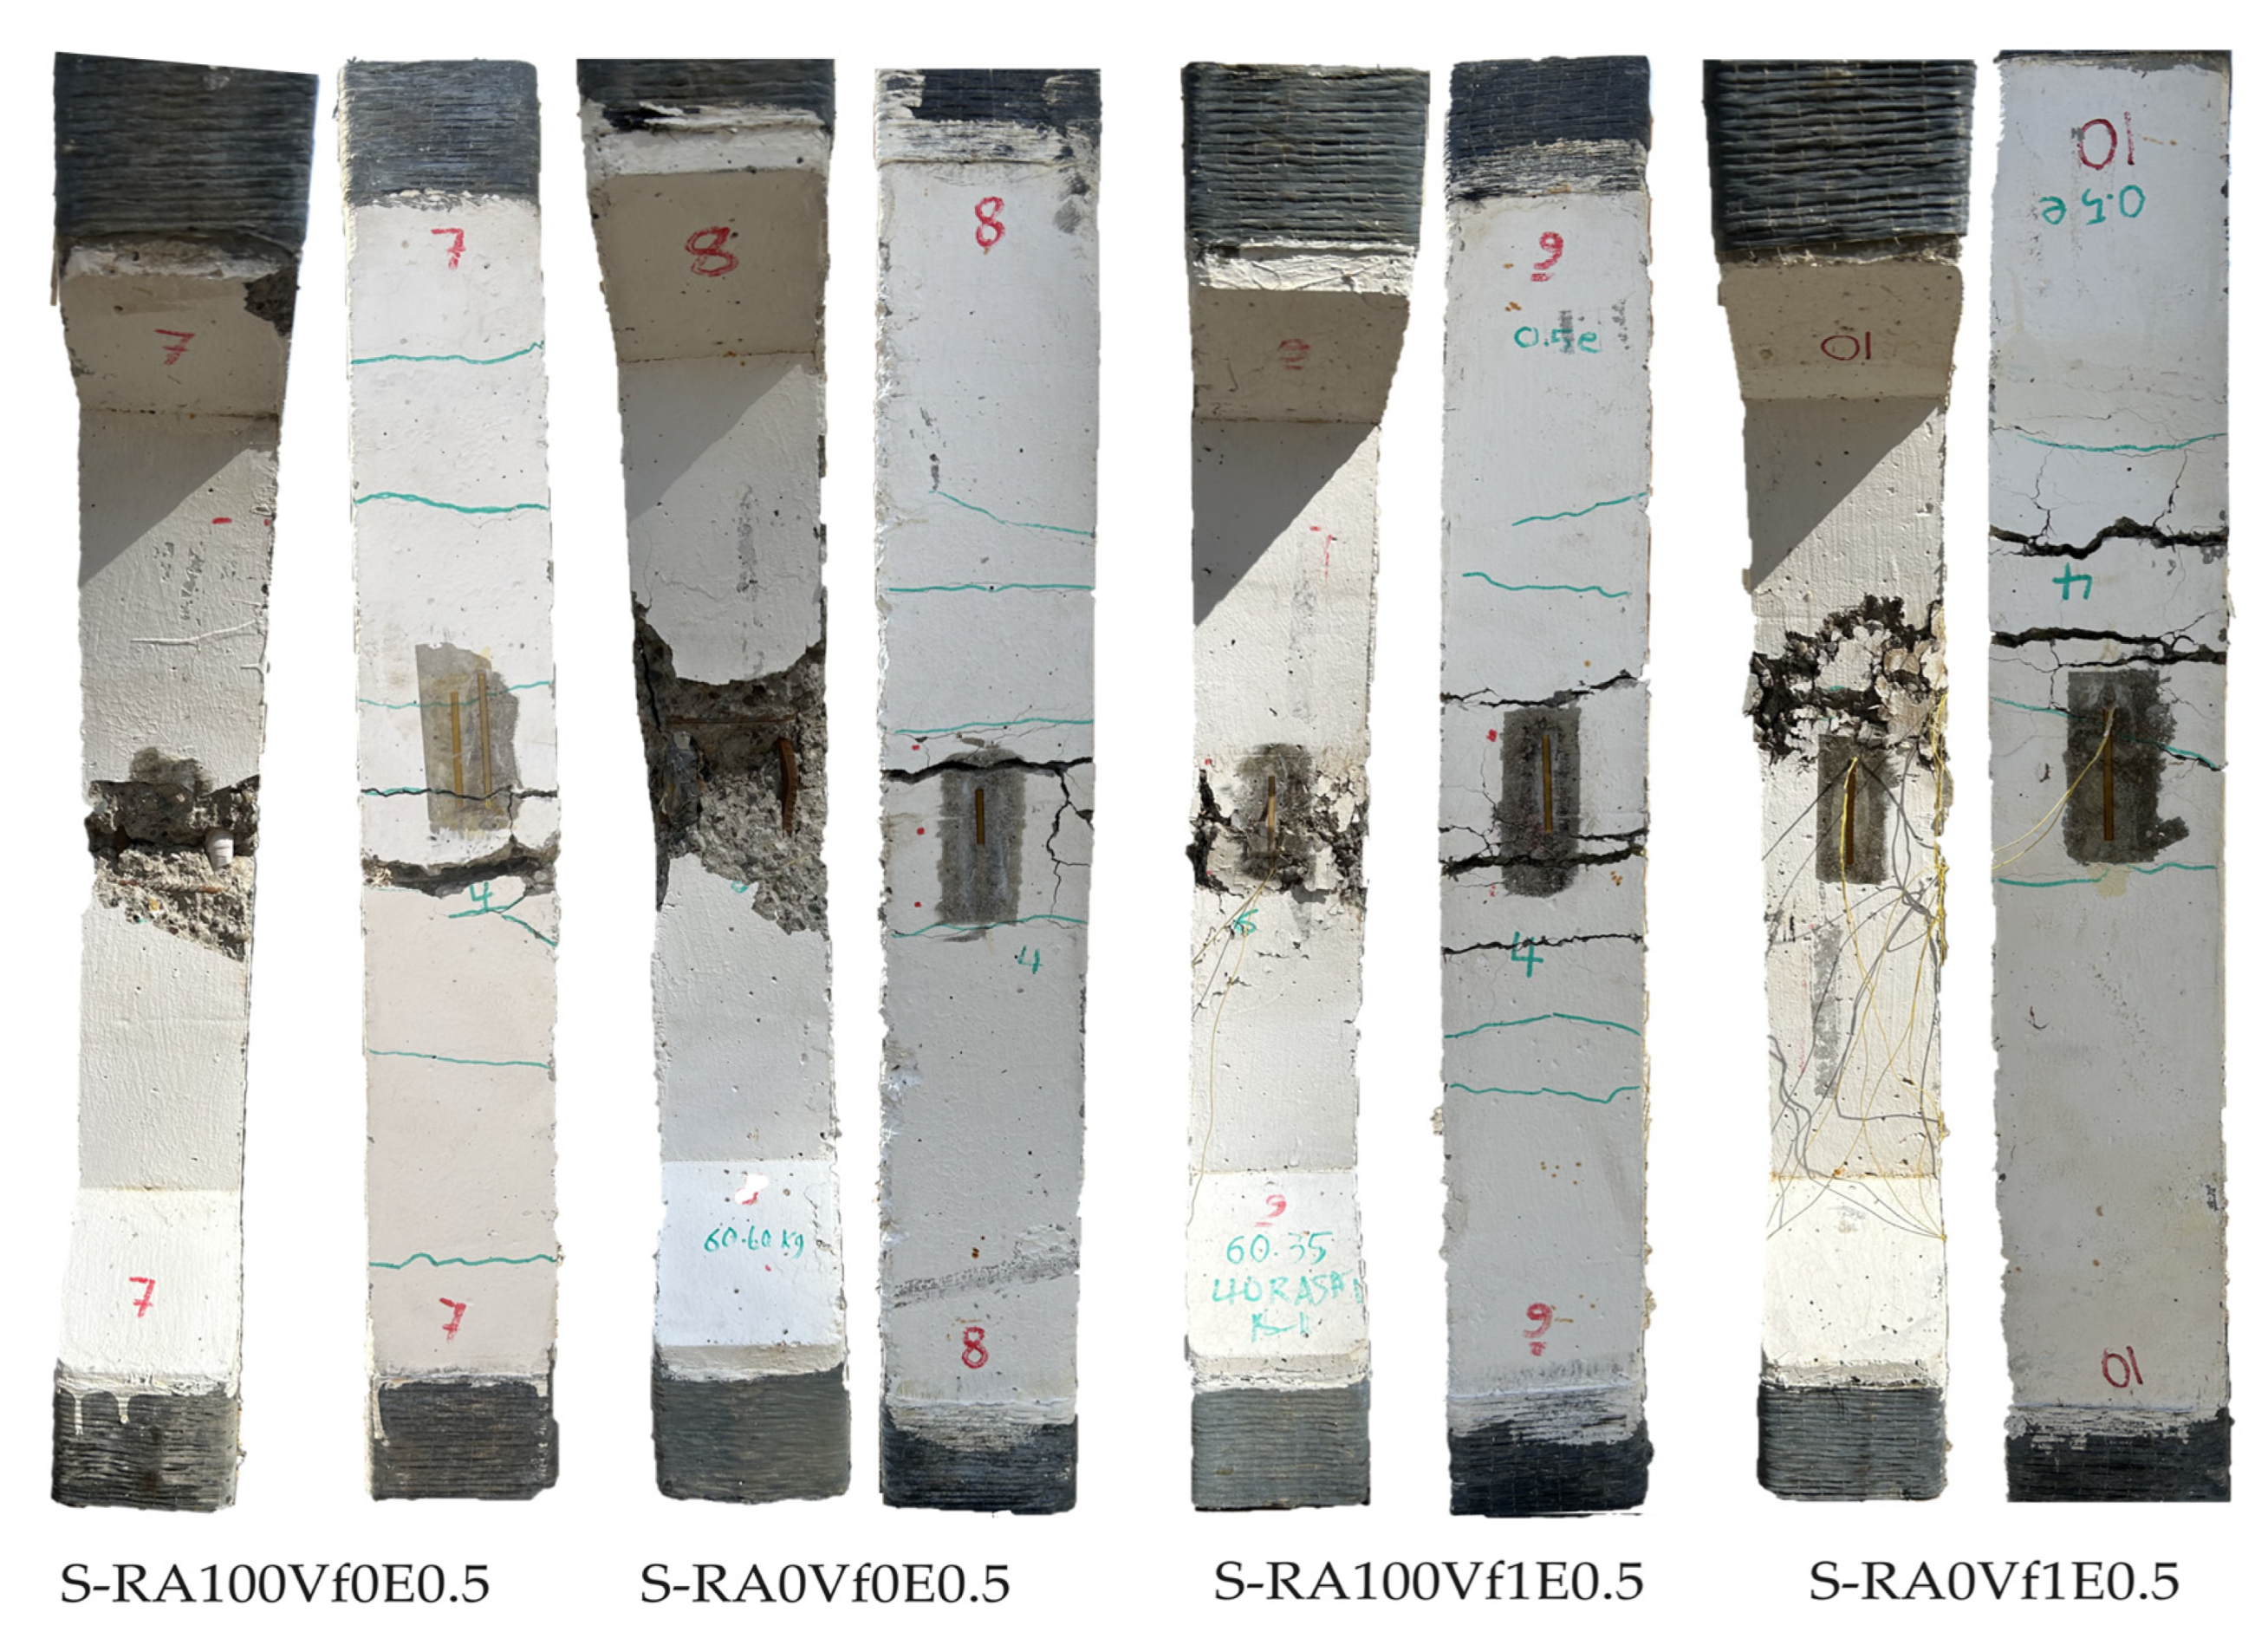
3.1.2. Columns under Loading with Moderate Eccentricity (e/h = 0.5)

Introducing eccentricity to the loading affected substantially the behavior of the columns, including the load-carrying capacity, the strain in both the concrete and the steel reinforcement, the crack pattern, and the failure modes. The cracking loads are shown in Table 7. Both short and slender columns failed after the steel yielded on the tension face and the concrete crushed on the compression face. Short columns S-RA100Vf0E0.5 and S-RA0Vf0E0.5 without contents of steel fiber cracked at 54% and 45% of the maximum load of 190 and 210 kN, respectively. Short columns C9 and C10 with contents of 1% steel fiber cracked at 53% and 58% of the maximum failure load of 223 and 218 kN one after another. Slender columns L-RA100Vf0E0.5 and L-RA0Vf0E0.5 without steel fiber cracked at 35% and 45% of the maximum load of 159 and 152 kN. L-RA100Vf1E0.5 and L-RA0Vf1E0.5 with 1% steel fiber cracked at 44% and 49% of the maximum failure load of 163 and 168 kN. Horizontal flexural cracks on the tension face (back side) of the column appeared at an early stage of loading around the mid-height of the columns; then, the number of cracks increased in a similar interval toward the top and bottom of the columns until cracks covered almost all over the tension face, and then extended toward the neutral axis of the column. Fewer numbers with smaller widths of cracks were observed in the short columns than in the slender columns. Figure 11 and Figure 12 show the failure and crack patterns. Approaching the maximum failure load, vertical cracks appeared on the compression side, followed by a drop in the load, and then the concrete was crushed in the compression face. During the process of loading, a curvature formed along the height of the columns. Furthermore, the columns with a content of steel fiber experienced higher strains at the maximum loads and lower strains at the same load level compared to the columns with no steel fiber content. In addition, in the columns with steel fiber, the cracks appeared more gradually than in the samples without steel fiber during the whole loading process. This shows the effect of steel fiber with respect to tension and its resistance to some tensional stresses versus no resistance in the case of columns with no steel fiber.

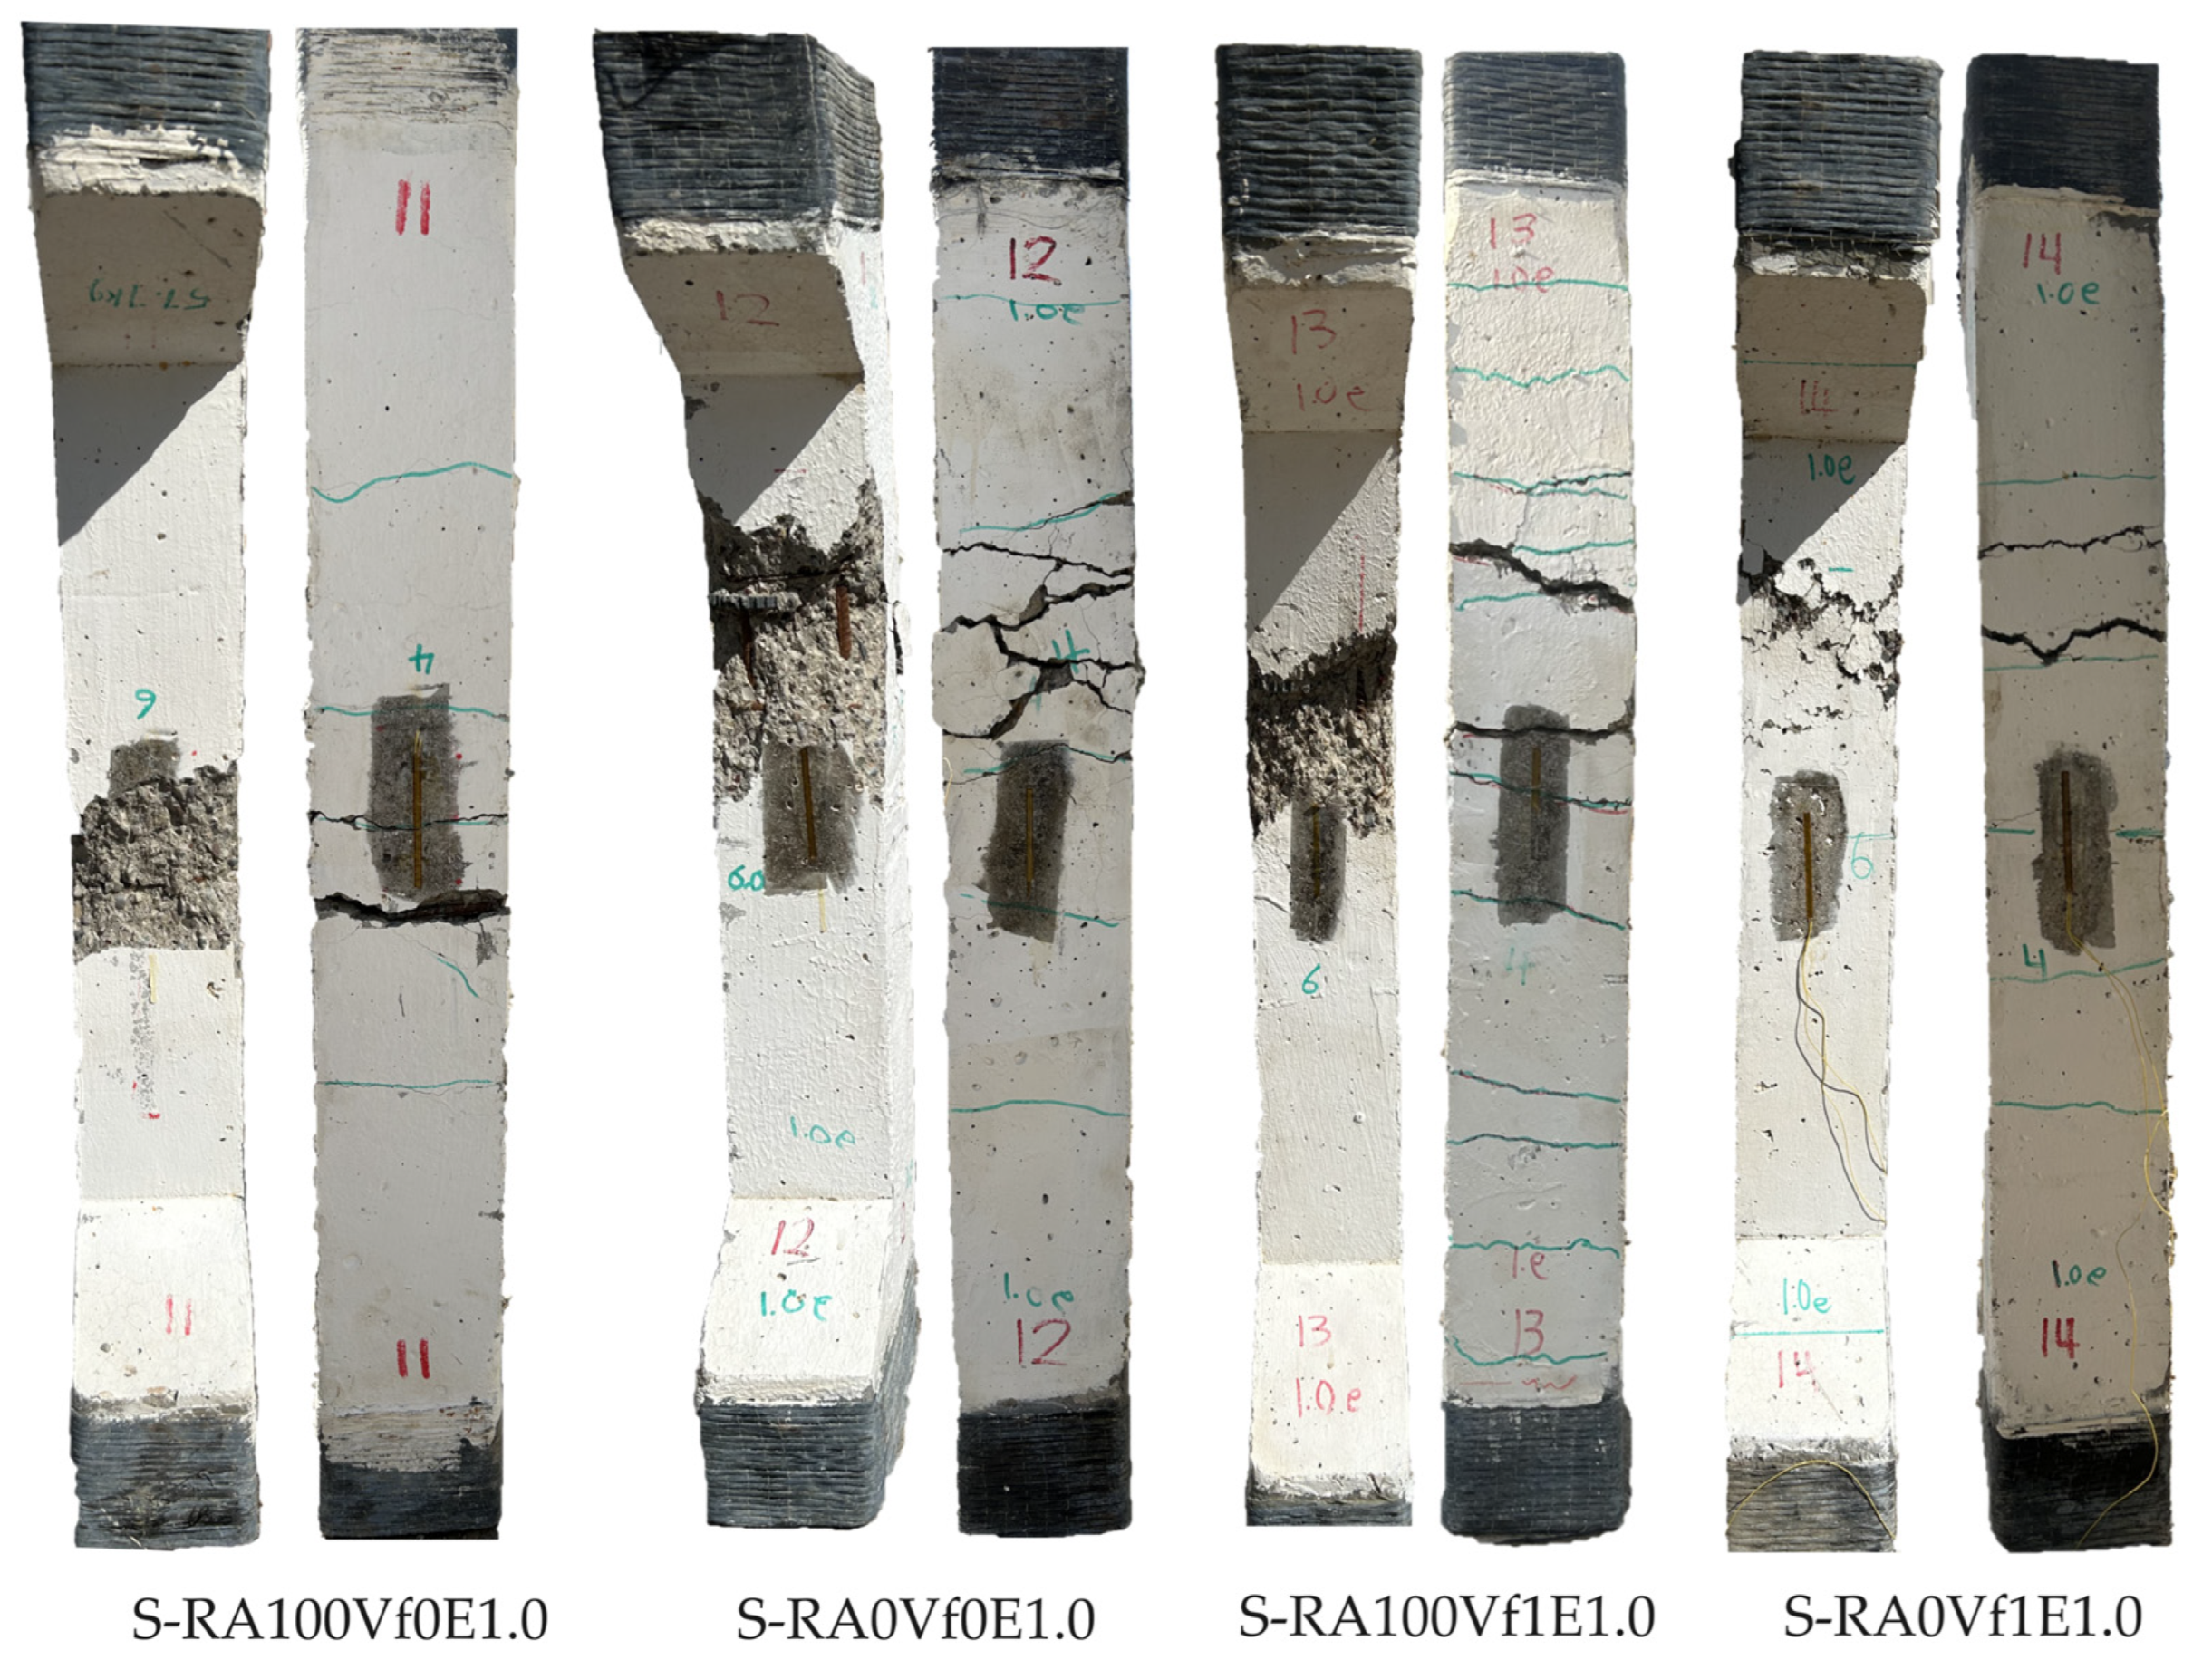
3.1.3. Columns under Loading with Large Eccentricities (e/h = 1.0)

The columns under a larger eccentricity of 100% (125 mm) failed at maximum load, with a larger lateral deformation and smaller axial load, compared with the columns loaded under a smaller eccentricity of 50% (62.5 mm) and the concentrically loaded columns, as shown in Table 7. The short columns S-A100Vf0E1.0 and S-RA0Vf0E1.0 without contents of steel fiber cracked at 42% and 36% of the maximum load of 100 and 105 kN, respectively. The columns with contents of 1% steel fiber, S-RA100Vf1E1.0 and S-RA0Vf1E1.0, cracked at 46% and 40% (4% higher) of the maximum loads of 107 and 112, respectively. The slender columns L-RA100Vf0E1.0 and L-RA0Vf0E1.0 had no steel fiber in them and cracked at 27% of the maximum load of 73 and 70 kN. The columns with 1% of steel fiber, L-RA100Vf1E1.0 and L-RA0Vf1E1.0, cracked at 41% and 34% (14% and 7% higher) of their maximum failure load of 80.5 and 76.5 kN. Steel reinforcement in all the columns yielded in the tension face with higher strain values. Furthermore, the steel did not yield in the compression face. The concrete in the compression face failed at lower strains than the columns with smaller eccentricities. From the earlier discussion, it is observed there was no significant effect of using recycled aggregate compared to the use of natural aggregate on the failure mode and bearing capacity of the column specimens, most likely because of the higher quality of the parent concrete of the recycled aggregate and the SSD method, mentioned earlier, in preparing the aggregate. However, the addition of steel fiber increased the ductility of the samples and exhibited higher strains and lateral displacements, in addition to a higher number of horizontal cracks with a smaller depth and width. Larger lateral displacements resulted due to the higher eccentricity observed. Cracks were first initiated during the initial stage of loading. Reaching the maximum failure load, transverse cracks covered the entire height of the columns on the tension face. Just before the decline of the load, vertical micro-cracks appeared on the compression face of the columns. At the peak failure load, the longitudinal steel bars buckled and the integrity of the columns was kept. The crack distribution of all the columns at failure is shown in Figure 13 and Figure 14. The slender and short columns were significantly under tensile stress, which can be observed in the strain values in Table 7. Additionally, we observed that the spacing and width of the flexural cracks were influenced by fiber bridging towards the compression face. As a result, we concluded that the compressive depth of the concrete decreases as the eccentricity increases.

3.2. Load-Carrying Capacity

Peak failure loads are listed in Table 7. Different factors affect the load-bearing capacity, such as the materials used and the loading conditions applied. This section discusses different variables and how they affect the load-carrying capacity.

3.2.1. Effect of Recycled Aggregate

The results presented in Table 7 demonstrate that a complete replacement of recycled aggregate does not consistently decrease the strength of the columns. It is observed that the differences are small, and could fail in higher loads or lower loads compared to the columns made with natural aggregate. This applies to the specimens made with and without the addition of steel fiber, short or slender columns, and eccentrically or concentrically loaded columns. Furthermore, the saturated surface dry, “SSD”, method is an effective factor in using recycled aggregate to use the same water–cement ratio in the mix of both types of aggregate, which was essential to obtain accurate results. The parent concrete or the type of concrete used for the recycled aggregate was another important factor for the strength response. In this study, waste concrete blocks with a compressive strength of 50 MPa were collected from laboratories and used to produce recycled aggregate. It is important to note that the change in the compressive strength due to the replacement of recycled aggregate is not large compared with the results of the investigation in this study and the existing research [28,29,30]. At 28 days old with a 50% replacement ratio, the strength reduction relative to the reference mix was 1.3%, which is a ratio that was deemed negligible. With a replacement ratio of 100%, the strength reduction compared to the reference mix was 5.1%, remaining within an acceptable range for the same strength class [31]. It is observed that, with the reduction in the w/c ratio, the compressive strength of the RAC increased [32]. The mechanical behavior was affected by the density and water absorption of the quality of the RCA [33].

3.2.2. Effect of Steel Fiber

The addition of 1% steel fiber to the mixes increased the strength of the columns, which was more obvious in the eccentrically loaded columns than in the concentrically loaded columns, and the differences can be explained by the resistance of the fiber in tension more than in compression. Table 8 shows the change in the strength of the columns. It is observed that the effect of steel fiber on both types of aggregate, namely, natural and recycled, is similar to a large extent. In addition, the steel fiber increased the ductility of the columns, which can be seen in Table 7, when the values of the ductility index are compared. Furthermore, steel fiber increased the splitting and flexural strength of the concrete, as shown by the differences in the strength in Table 5.
The tensile strength of the steel fiber σtu was used in the force equilibrium and strain compatibility diagram of the column cross-section. The steel fiber stress in tension is defined in [34]. The equation for the steel fiber stress is given below:
σtu = ηo × τu × Vf × Lf/Df
ηo = 0.333, 0.41, and 0.5 [35], where 0.5 is used in this study.
τu = the bond strength between the steel fiber and the concrete.
τu = ksf′c [36].
τu = 0.6 f′c(2/3) [37].
ks = 0.4 for plain fibers.
Vf, Lf, and Df: the volume fraction, length, and diameter of the steel fiber.

3.2.3. Effect of Slenderness Ratio

The slenderness ratio was affected by the eccentricity, where the higher the eccentricity, the larger the differences in the maximum failure load. For concentrically loaded columns, the slenderness effect was not as high as the eccentrically loaded columns. The maximum failure load of the short and slender columns was somewhat close. Test results are summarized in Table 9. In this study, the cross-section size is constant and the comparison is performed at the maximum peak load. This is not surprising, since a more slender column of the same cross-section stores more energy than a stockier column [38,39]. More ductile behavior was observed in the columns with a higher slenderness ratio, as well as higher crack numbers, gradual cover spalling, and also higher displacement at the mid-height of the columns. It is observed that the effect of the slenderness ratio on the columns using recycled aggregate matches its effect on the columns made with natural aggregate.

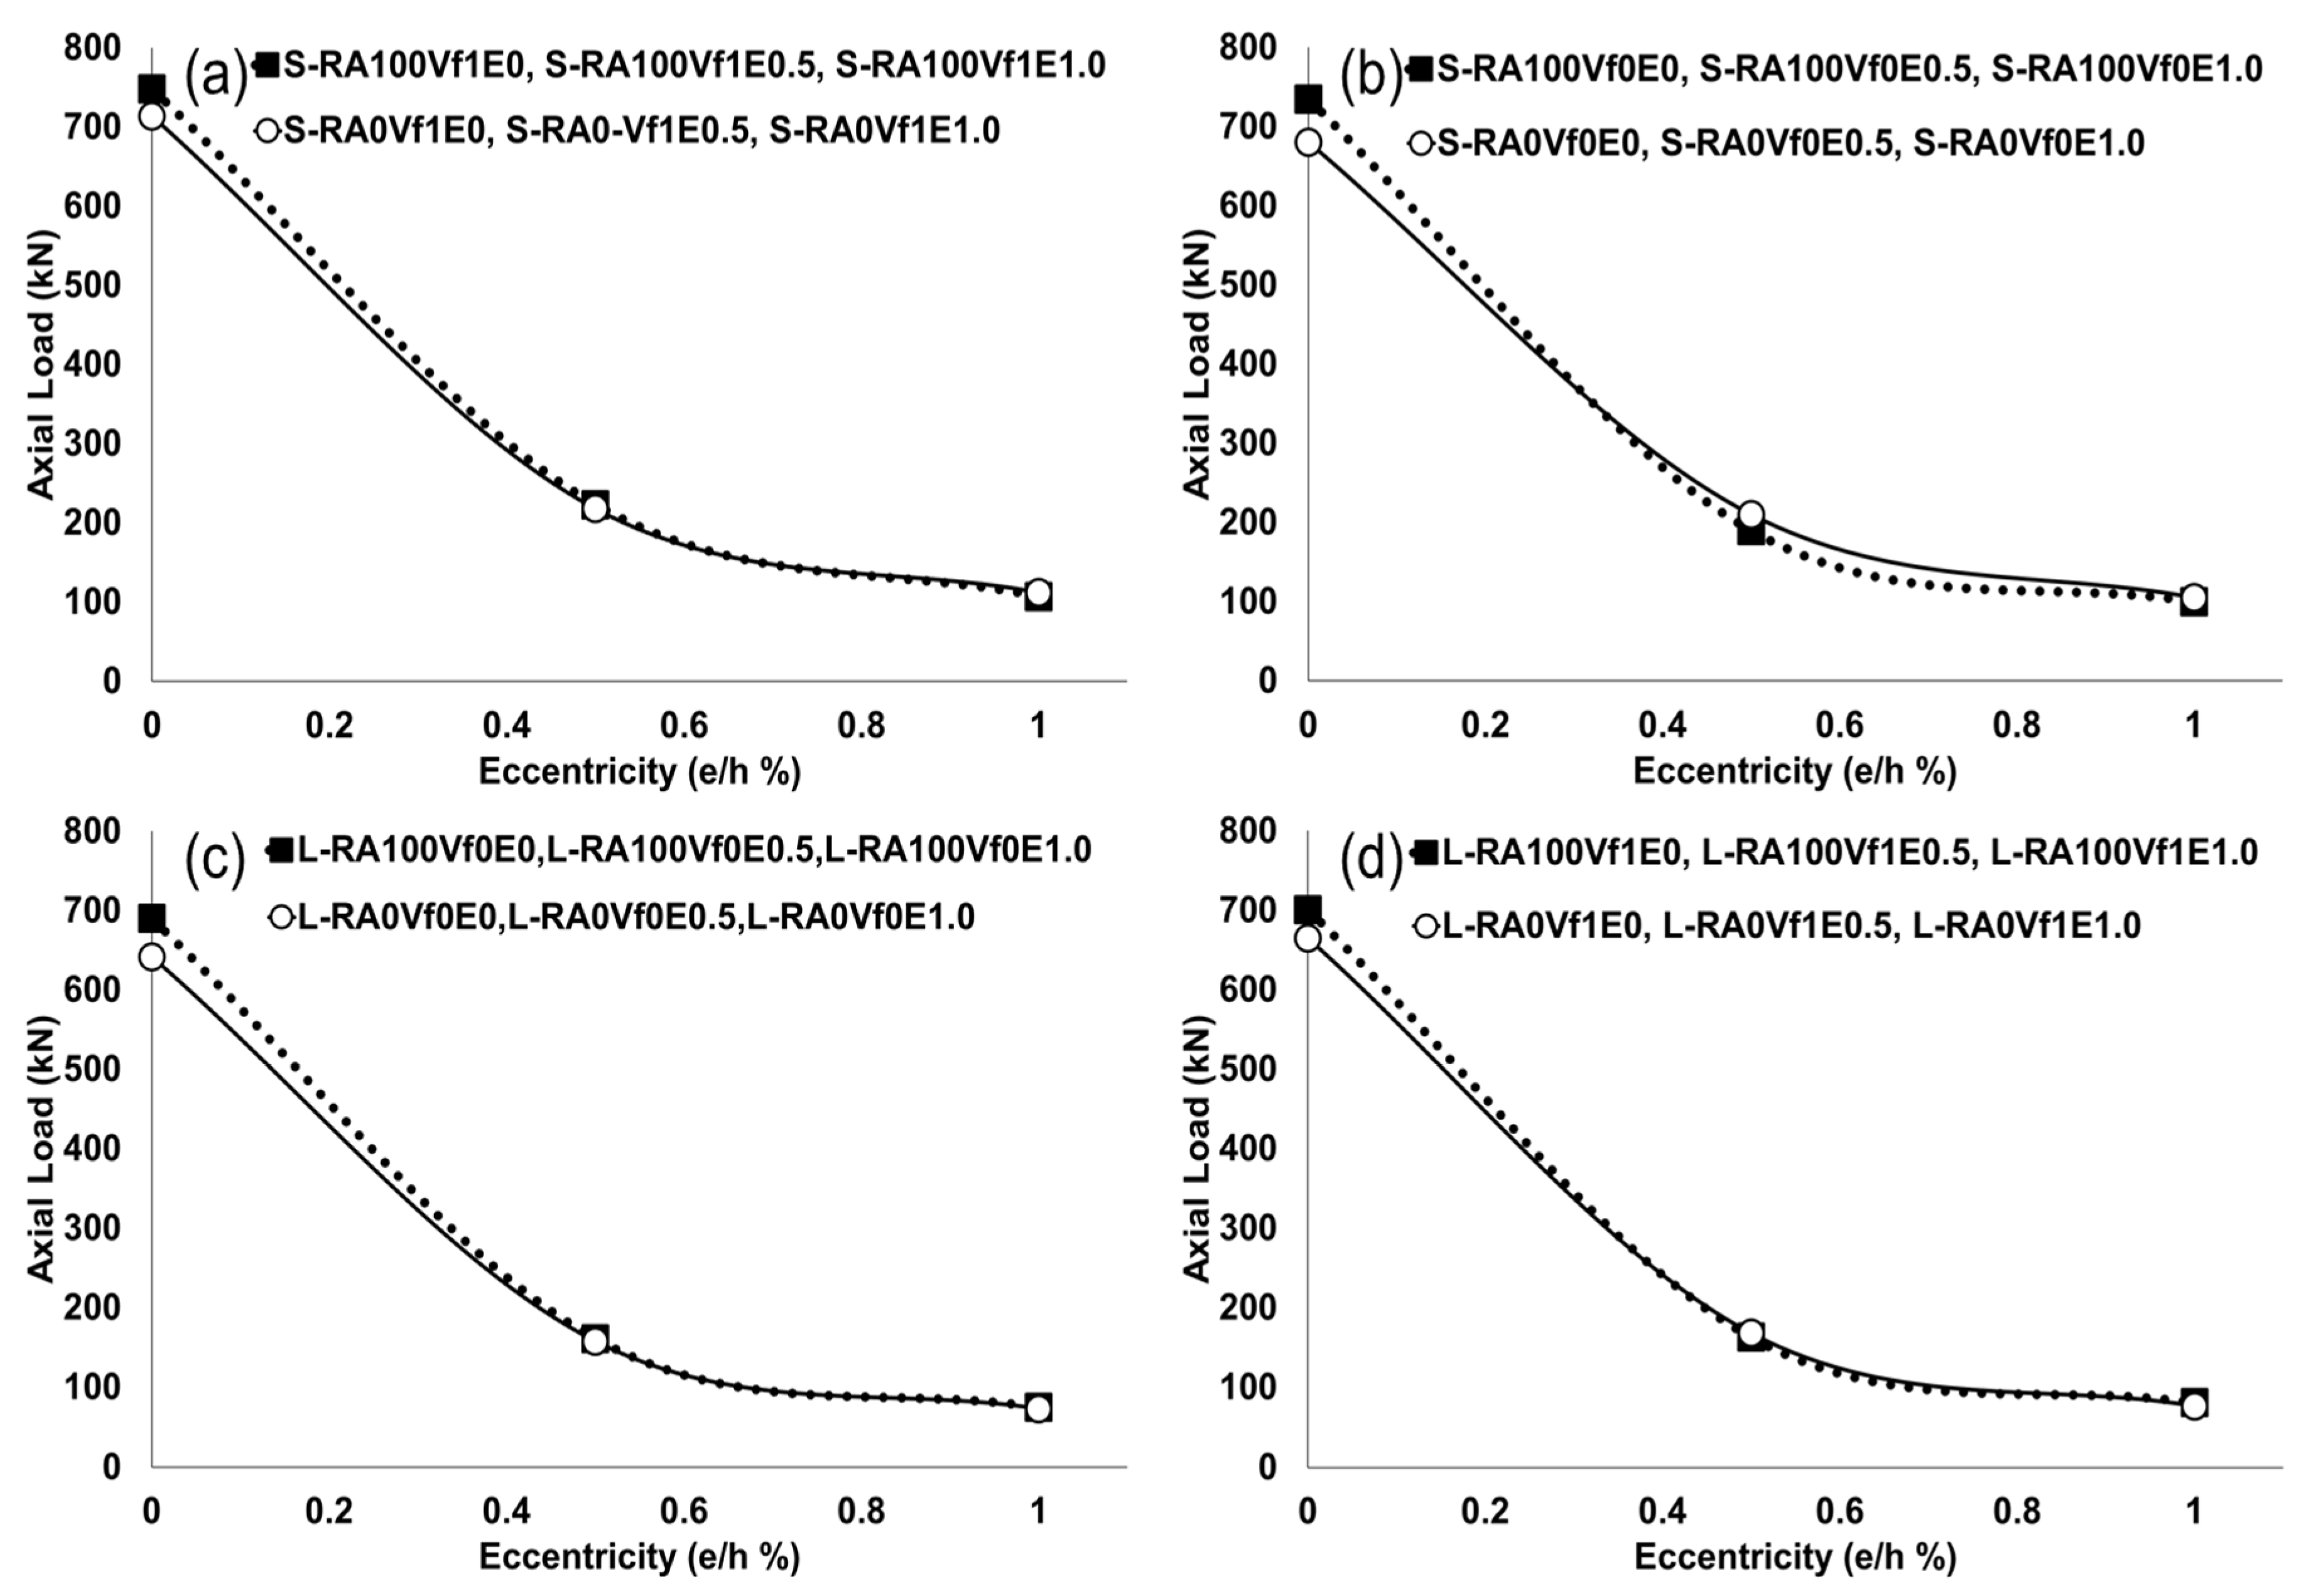
3.2.4. Effect of Eccentricity in Loading

In general, the column maximum strength decreased as the applied eccentricity increased. The influence of the applied eccentricity was more pronounced as the loading eccentricity increased, which resulted in a decrease in the load-carrying capacities of the columns. This observation was made for all the tested samples regardless of the type of aggregate or addition of steel fiber. Figure 15a,c show how the failure load drops with the increase in the eccentricity, and the slope of the curve drops significantly when it moves from e/h = 0 to e/h = 0.5, and then drops further when it moves to e/h = 1.0. Moving from e/h = 0 to e/h = 0.5 produces a higher loss in strength than moving from e/h = 0.5 to e/h = 1.0. Figure 15b,d provide the same comparison except with the addition of steel fiber to the samples. The difference is very small when natural aggregate is replaced by recycled aggregate. In concentrically loaded columns, the entire cross-section was in compression, while, in the eccentrically loaded column with e/h = 0.5, the depth of compression was reduced; in the columns with e/h = 1.0, the depth of compression reduced even further.
The reduction in the strength of the slender columns due to the application of eccentricity increased when the slenderness ratio increased, and this satisfied the mechanical behavior of the columns. When the columns had a 1% content of steel fiber, the reduction in the load capacity was slightly less than the samples made with no steel fiber; however, in the same load level, the effect of eccentricity was less on the columns made with steel fiber. With the larger eccentricity and more slender columns, the failure in compression was more ductile, and the propagation of cracks on the tension face was accompanied by a larger displacement and tended to buckle as the load approached the maximum load.

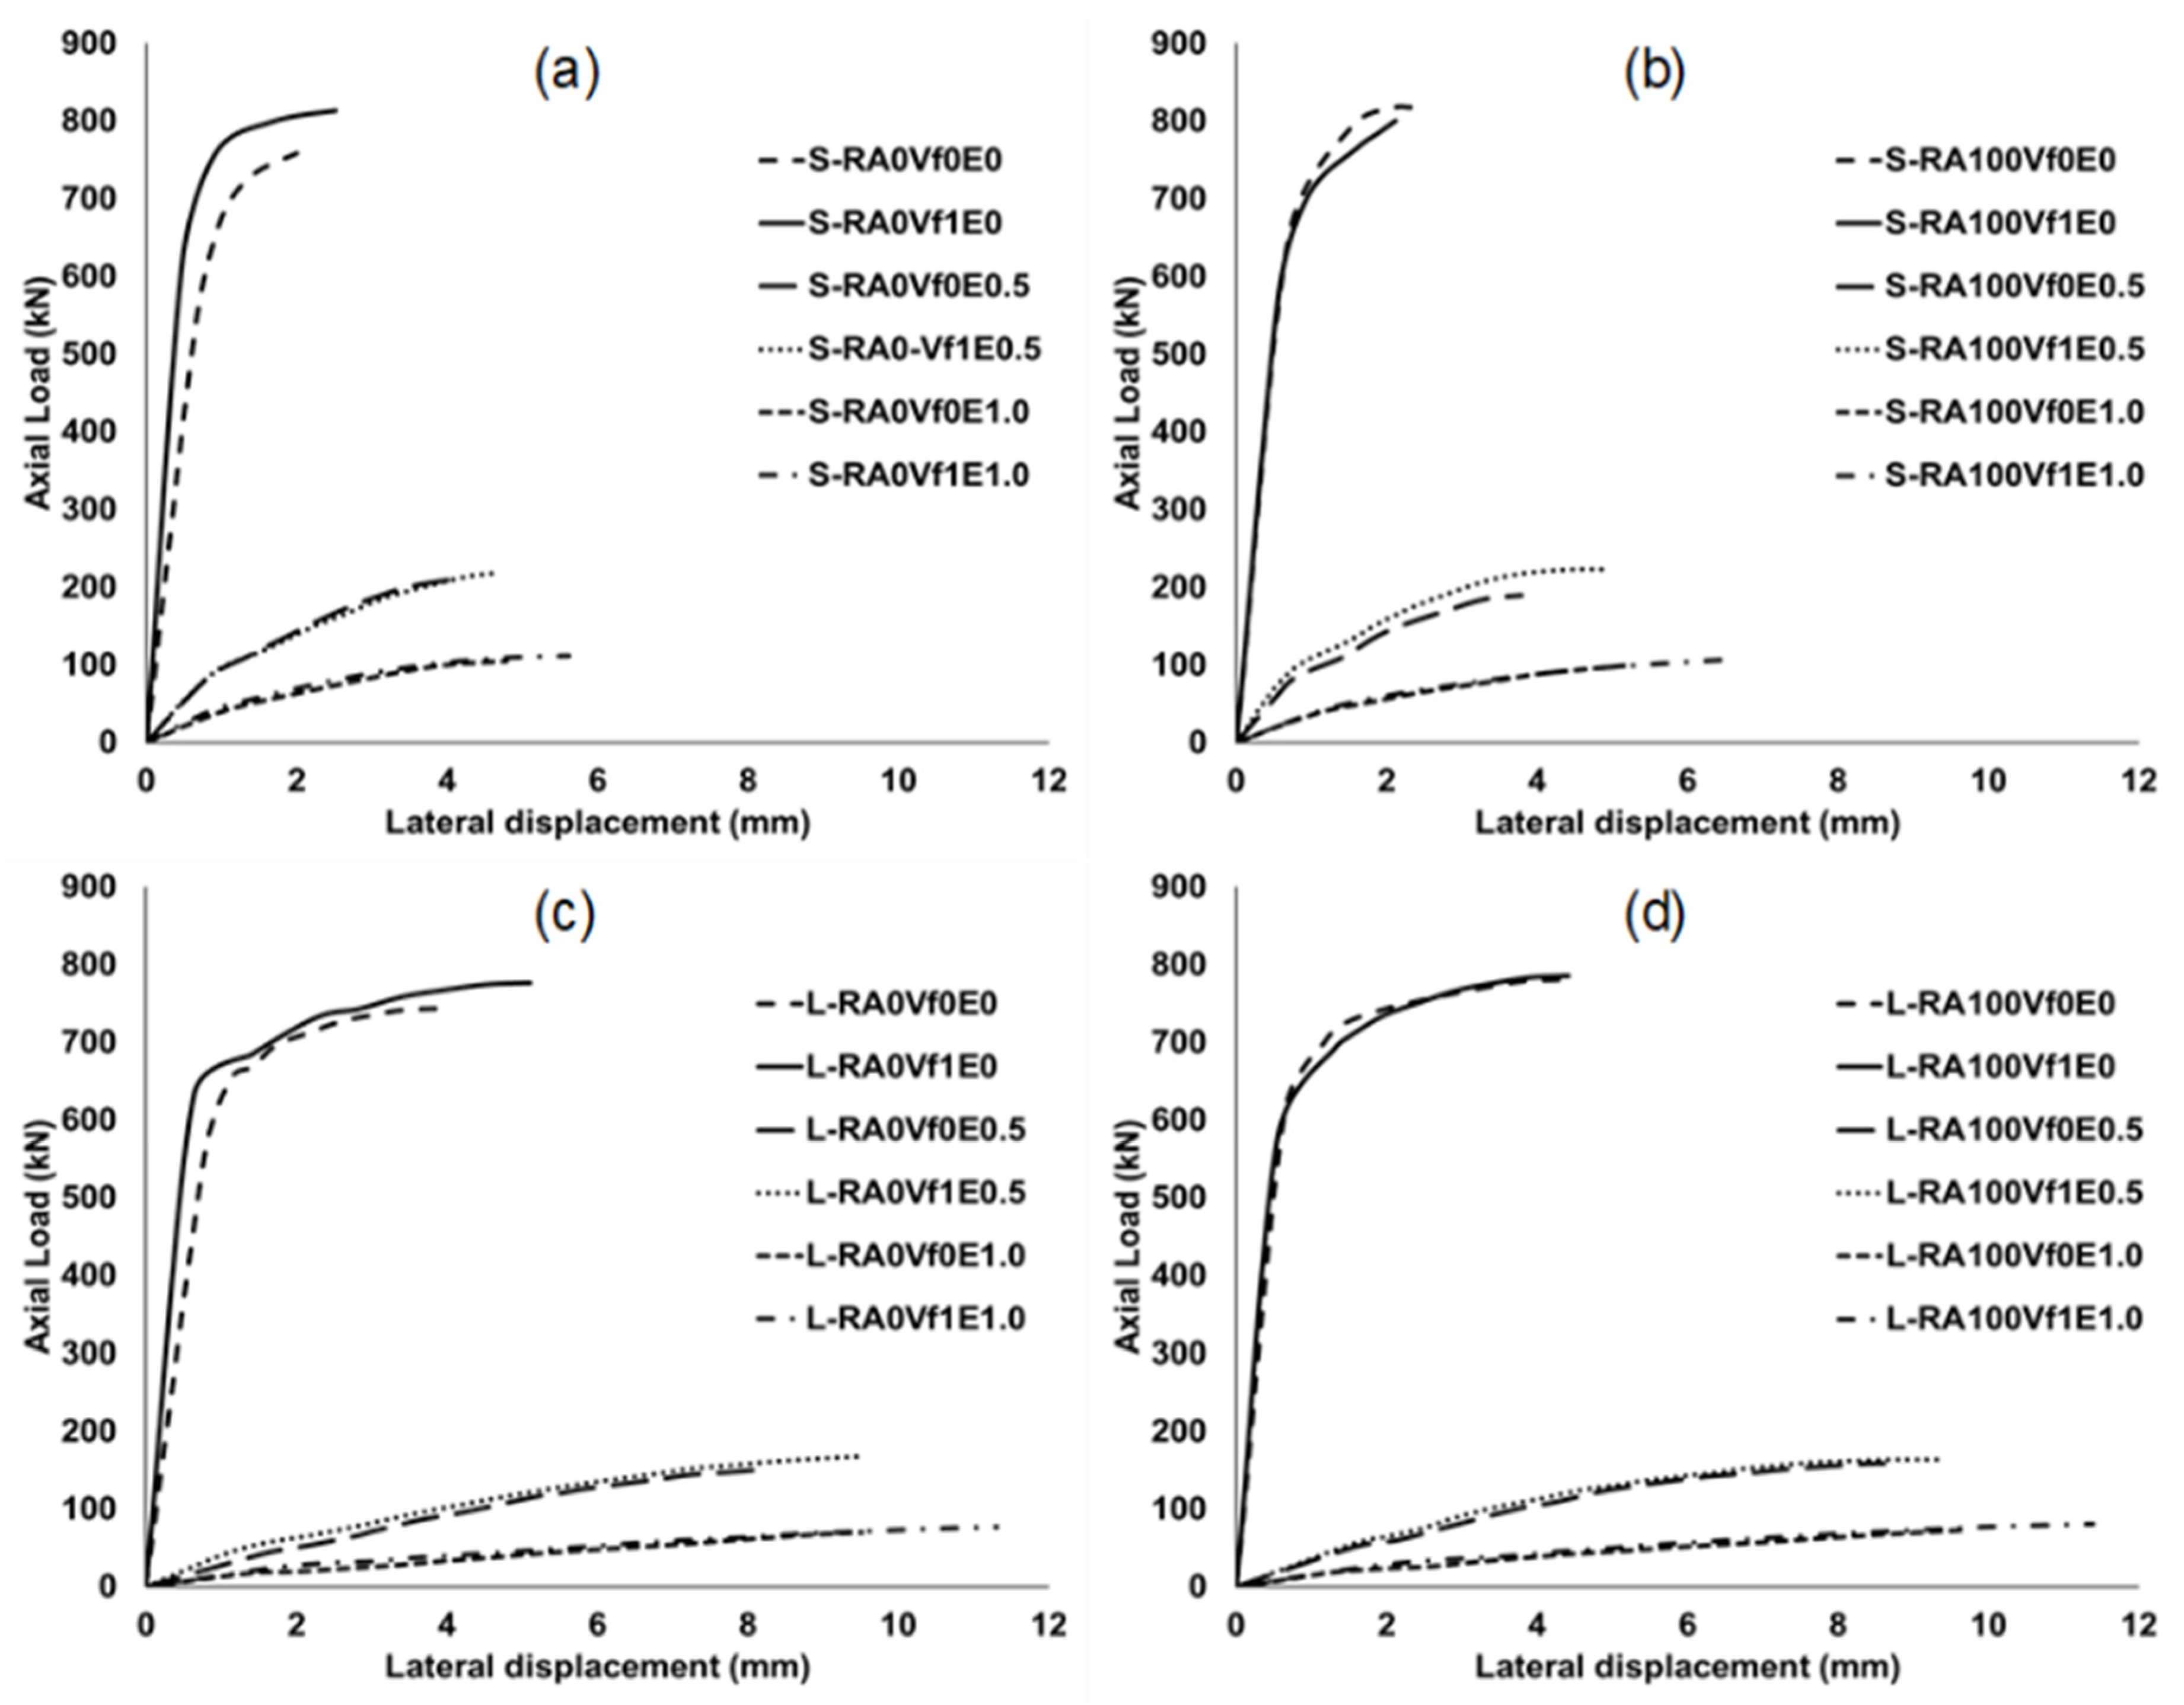
3.3. Mid-Height Lateral Displacement

The load-displacement relationships of the tested columns are shown in Figure 16. In general, the displacements initially increased at a very slow rate, creating an ascending linear branch that developed approximately 70–80% of the maximum load in the concentrically loaded columns and about 30–40% of the maximum loads in the eccentrically loaded columns, followed by a flattened nonlinear branch, in which the displacement increased with a small increase in the load. Eventually, this reached its peak load and failure. With the increase in the slenderness ratio from 17.24 to 34.5 and the addition of 1% of steel fiber, the displacement increased at the maximum load. Figure 16 shows that the linear part of the curves is much longer in the concentrically loaded columns, and it decreased after applying eccentricity and decreased even further when the eccentricity increased from 50% to 100%. Therefore, cracks started in the early stage of loadings in the eccentrically loaded columns.

3.4. Ductility

The ability of an element to behave elastically and absorb energy is measured by its ductility. There are various types of ductility, including displacement, rotation, and curvature ductility. The ductility index is the ratio of the maximum mid-span displacement at peak over the first yield displacement [40,41,42]. This definition is used in this research as follows. The authors of [43,44] defined the ultimate deflection as the deflection corresponding to 80% of the peak load along the descending branch of the load–deflection curve. In Table 7, the values of ductility are higher in the slender columns (example: L-RA100Vf1E1.0) than in the short columns (example: S-RA100Vf1E1.0). This statement is correct when the specimens with steel fiber are compared with the specimens without steel fiber. Furthermore, the specimens using recycled aggregate, such as S-RA0Vf0E0, and the specimens using natural aggregate, like S-RA100Vf0E0, exhibited ductility measurements of 1.12 and 1.15, respectively, which are considered comparable to a large degree.

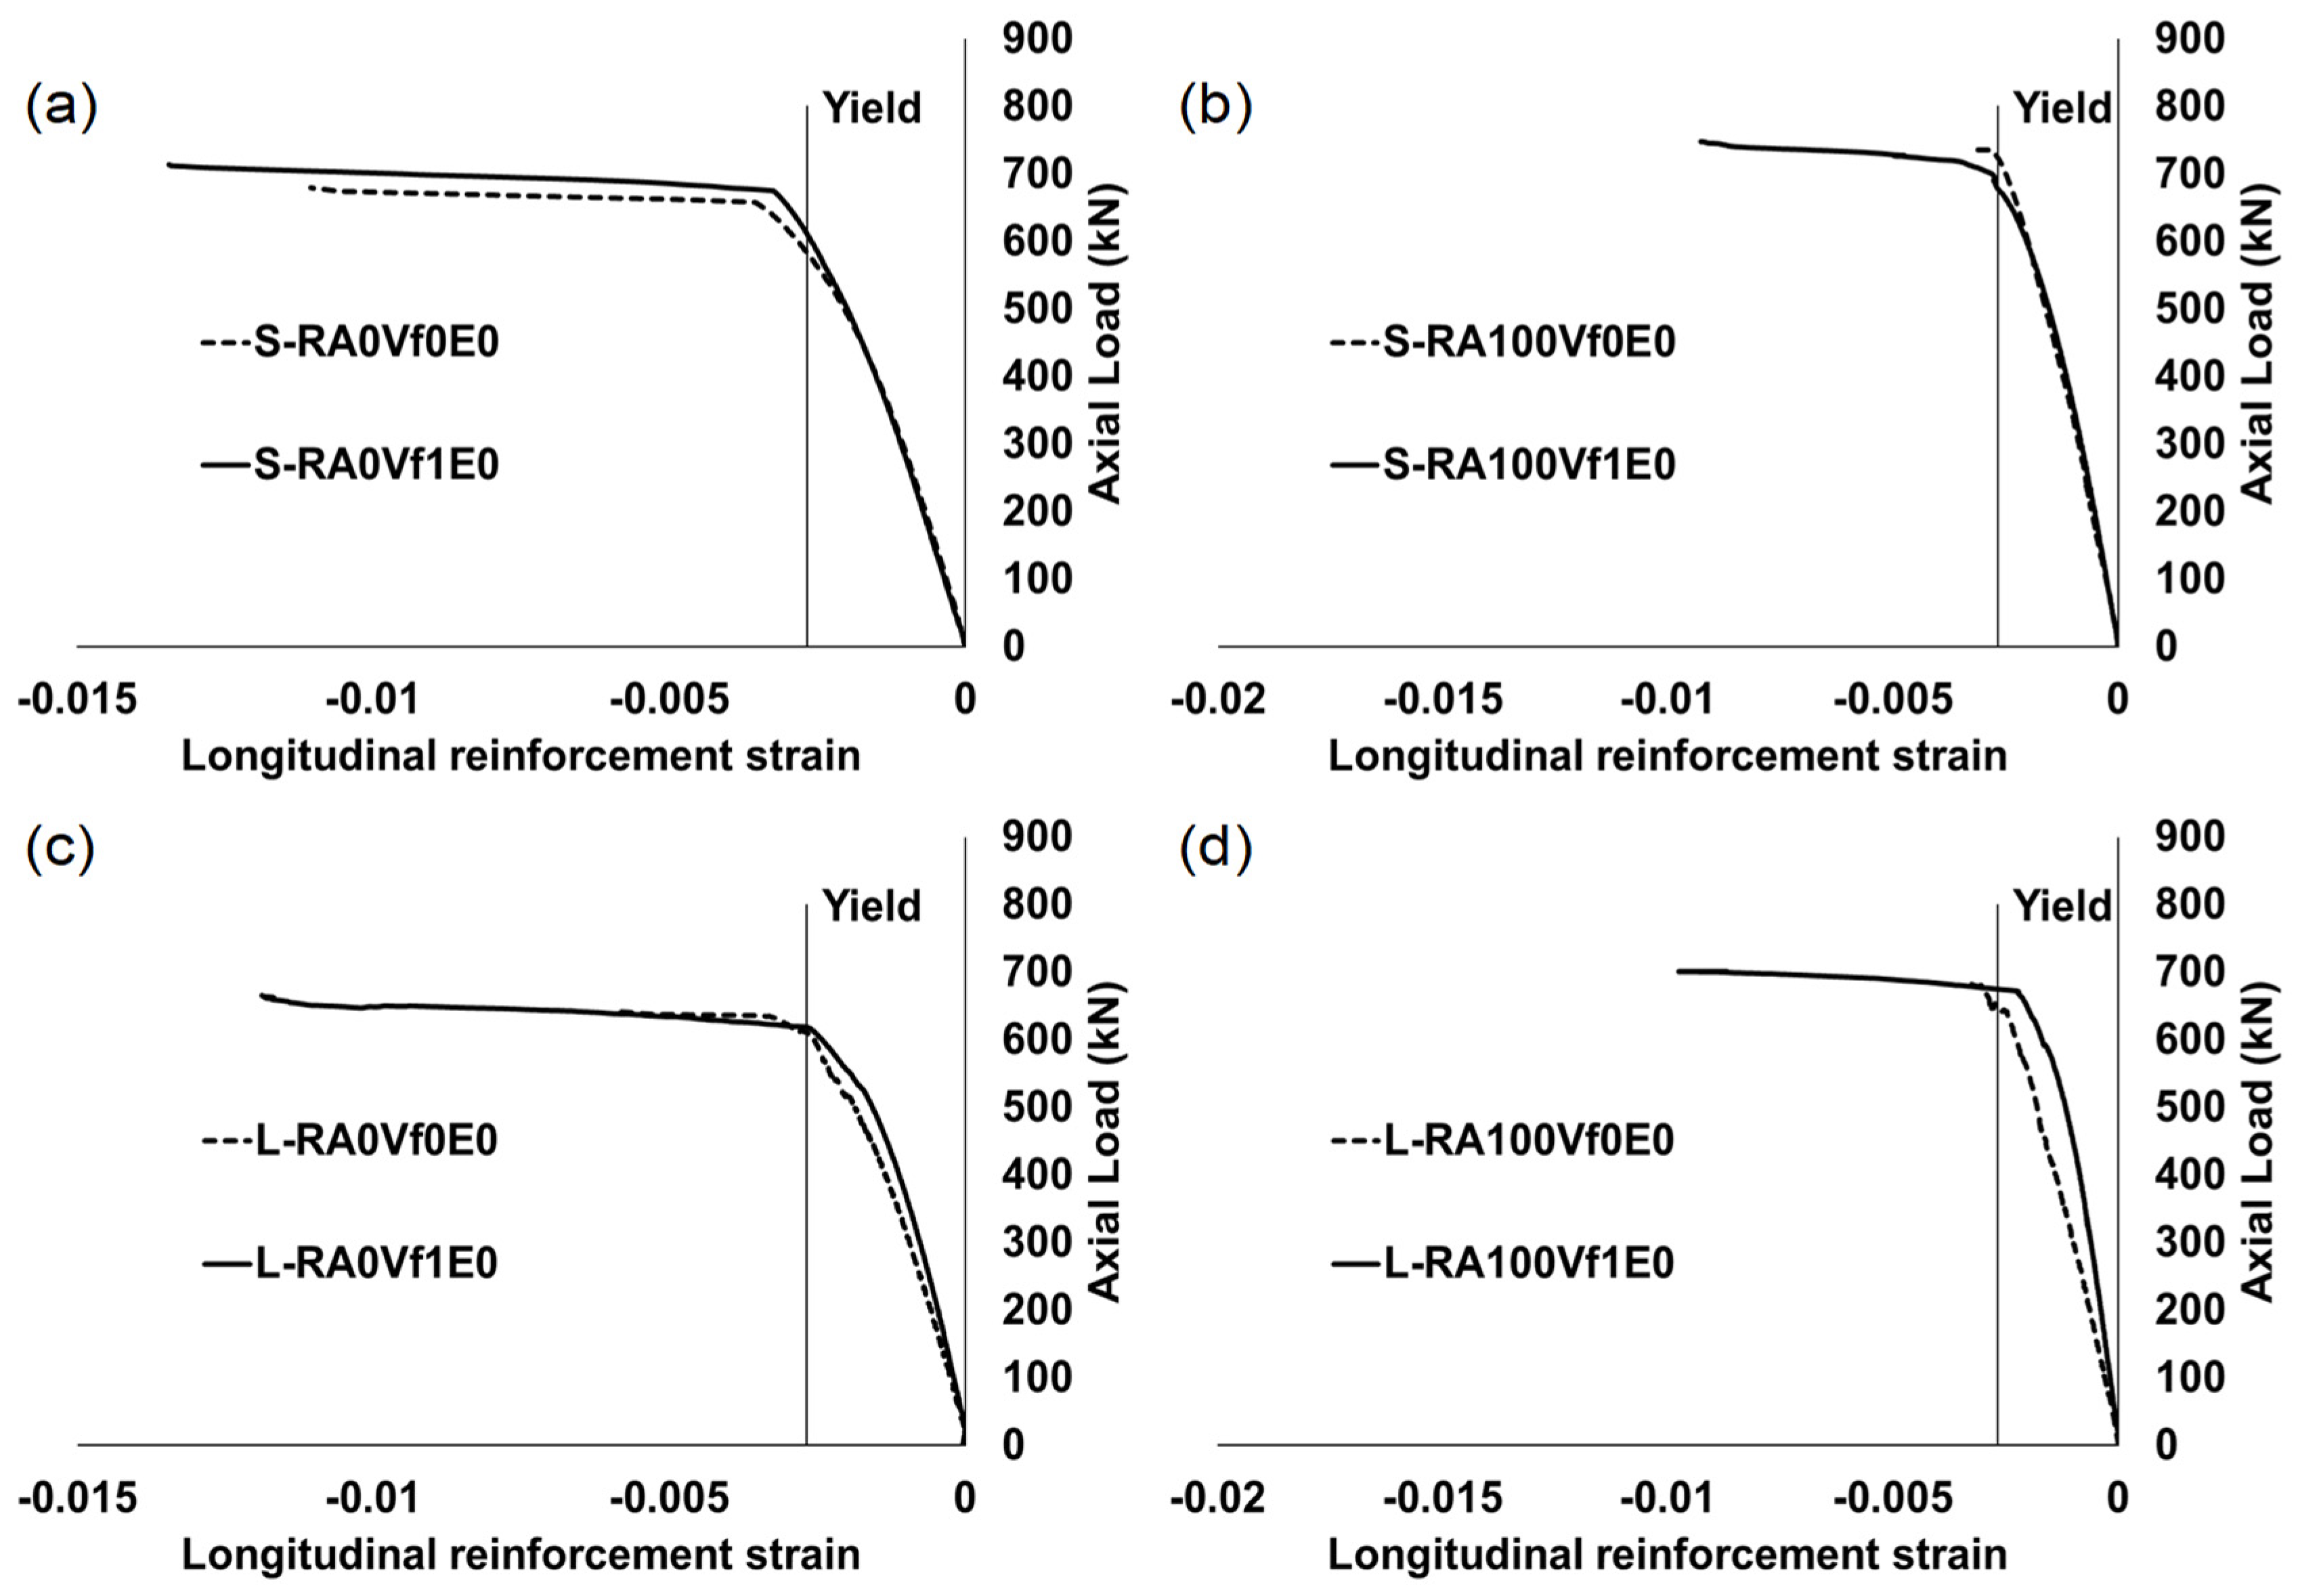
3.5. Concrete Strain and Reinforcement Strain

Figure 17 shows the axial load versus concrete strain in compression for concentrically loaded columns. In eccentrically loaded columns, readings were taken in compression (front face) and in tension (back side). Table 7 shows all the strain values. Unequal strains on the front side (compression face) and back side (tension face) of the concentrically loaded columns returned to minor and with the unintentional eccentricity of the applied load and second-order effect on the column behavior. The crush usually occurred on the side with the slightly higher strain. Since the curve slopes are greatly affected by the level of eccentricity, the slope of the curves decreases with the increase in the load eccentricity level. The observed differences in the strain values in the columns made with RA and NA return to the concrete strength of the columns more than the type of aggregate. It needs to be mentioned that the effect of the existence of steel reinforcement in the columns is a significant factor and controls the behavior of the concrete in the columns, and its effect is higher than the other variables in the test. Figure 18 and Figure 19 show graphs of the axial load versus the steel strain in tension and compression, where the former is for concentrically loaded columns and the latter is for eccentrically loaded columns. The response of the axial strain of the steel in compression and tension was distinguished starting with the linear part, and then the slope decreased and flattened as the load proceeded towards the maximum peak load. This statement is more obvious in the concentrically loaded columns than in the columns loaded with eccentricity; the eccentricity caused the column to crack earlier, and the curve slope changed and flattened earlier.
However, the slopes are extremely steeper for the concentrically loaded columns, becoming lower when introducing eccentricity and even lower when the eccentricity increases. The strains of the steel reinforcement in tension and compression at peak loads, along with the yield percentages, are presented in Table 7. In the columns with a high eccentricity (e/h = 1), the steel in the compression face did not yield, while, in the tension face, it yielded with higher strains and the columns acted more like flexural members. For the columns loaded with the eccentricity of e/h = 0.5, the steel yielded in tension and compression, but the strains were not as high as in the columns with a high eccentricity, and the behavior was more in compression than in flexure. The addition of steel fiber enhanced the deformability of the samples made with natural aggregate and recycled aggregate. Furthermore, the effect of the steel fiber produced higher strains at the maximum loads and lower strains at the same load level compared to the samples with no steel fiber.

3.6. Interaction Diagrams

To determine the column maximum load and moment capacity, an interaction diagram was plotted to obtain the failure envelop of the designed sections, while the provisions of ACI-318 were followed to construct the force–moment interaction diagrams. The experimental results of the axial force and moment from the applied eccentricity, as well as the second-order effects, are plotted on the diagram for comparison. The results concluded that they are valid and safe for the tested columns. The results of ACI-318 are more conservative. A common practice by the design codes is not to account for the tensile strength of concrete in the P-M curves. However, the experimental results included the tensile strength of the concrete. The interaction diagram was developed by the conventional method using section analysis based on the principles of the equilibrium of internal forces and strain compatibility, with 0.003 used for the concrete maximum strain. The cross-section, strain diagram, stress diagram, and forces are shown in Figure 20. This method is applied for short and slender columns, as well as the effect of the addition of steel fiber. The P-M diagrams are shown in Figure 21. The axial loads and moments are un-factored. The principals to plot the P-M diagrams for the slender columns were based on the method adopted by ACI 318, which was developed and improved by [45,46,47,48]. In this method, for each point (P, M), the moment for the short column is divided by the moment magnification factor to draw the new M-P diagram for the slender columns. This shows how the slenderness reduces the strength of the column. The P-Delta effect is obvious in the compression zone, while it is negligible in the tension zone. For each axial load, the moment value is smaller for the slender columns than the moment value for the short columns. Table 7 shows the experimental bending moment (M1st) for the specimens under different eccentricities at the mid-height of the columns, as well as the secondary moment (M2nd); (M2nd) was determined by multiplying the maximum axial load by the lateral displacement. The total moment was determined by the summation of the two moments, (M1st) and (M2nd).
The axial load and bending moment significantly improved with the inclusion of steel fiber. The effect of the steel fiber is pronounced more clearly in the tension zone.

4. Proposed Analytical Model for Column Load-Carrying Capacity

According to ACI 318–19, the axial capacity of reinforced concrete columns is as follows:
PACI = 0.85f′c Ac + fy As
where f′c is the concrete cylinder compressive strength, fy is the yield stress of the longitudinal steel reinforcement, and Ac and As are the cross-section area of the concrete and the longitudinal reinforcement. The contribution of transverse reinforcement is ignored, which is allowed by the code. This equation takes the column sections into account and does not consider the eccentricity and slenderness of the columns. A model proposed for verification to predict the column load-carrying capacity included the consideration of the slenderness and eccentricity of the columns. The ratio of the axial loads of the experimental toproposed axial loads (PExp/Pproposed) were calculated for 237 steel reinforced concrete columns, as well as the square, rectangular, and circular cross-sections from the existing literature, in addition to the column samples in this study, and the distribution is shown in Figure 22. The proposed model, the coefficient of variation, the mean, and the standard deviation were computed and are presented in Table 10.
A comparison was performed between the experimental peak axial loads and axial load capacity using ACI-318 equations, in addition to a comparison with the axial load capacity calculated using the proposed equation. Table 11 shows that both the ACI equations and the proposed equation are conservative compared to the results from the experiment.
Figure 21 shows the ratio of PExp/Pproposed versus the ratio of PExp/PACI for the proposed equation. The diagonal distribution of the data is in agreement between the experimental results and the proposed theoretical results. To study the effect of the parameters, the ratio of PExp/Pproposed versus the slenderness (kl/r), eccentricity to the (depth) height of the cross-section (e/h), and the compressive strength of the concrete (f′c) are plotted in Figure 23. These curves were plotted for data from 237 samples to evaluate the influence of these variables on the proposed model. The good distribution of the data is a good reason to use this proposed equation to determine the axial capacity of the columns. For better results, further research is needed, specifically for the slender columns, high levels of eccentricity, and high-strength concrete.

5. Conclusions

This research is a part of the current efforts to investigate recycled aggregate in the construction of short and slender columns. In this paper, 24 short and slender columns were cast and tested to investigate the effect of recycled aggregate, steel fiber, eccentricity in loading, and slenderness. The experimental results and analytical analysis led to the following conclusions:
  • The short and slender RA columns’ behavior during the loading from start to failure is comparable and similar to NA columns. A 100% replacement of recycled aggregate does not necessarily decrease the strength capacity and the high quality of the parent concrete is a big factor in obtaining better results. The results of this study are a great indication to use recycled aggregate in the compression members of structural engineering applications
  • The saturated surface dry (SSD) method in preparing the aggregate is another great factor to control the w/c ratio in the mixture; in addition, the SSD method creates a good ground for comparison between RA columns and NA columns.
  • Concentrically loaded columns failed in a sudden and explosive form, while the columns loaded with eccentricity failed with more ductility, and there was enough time to observe the cracks before the failure.
  • The experimental results showed that eccentricity had a major effect on the failure mode of the columns compared to the use of recycled aggregate, steel fiber, and slenderness. The load-carrying capacity decreased significantly when the eccentricity increased. The column behavior moved from compression control to flexural control as a result of the eccentricity. Slenderness did not cause the columns to lose the load-carrying capacity significantly in all columns. It remained minor in most of the samples.
  • Cracking patterns in eccentrically loaded columns were similar for the columns made with recycled aggregate with and without steel fiber, and they matched with the cracking patterns of the columns made with natural aggregate.
  • The displacement, concrete strain, reinforcement strain, and ductility at maximum load increased with the addition of steel fiber and were lower in the same load level before the maximum failure load.
  • Steel fiber improved the mechanical properties of the concrete in columns made with natural aggregate and recycled aggregate. The crack width decreased with the addition of steel fiber and the crack numbers increased at a more equally spaced distribution. Concrete and reinforcement strains decreased when using steel fiber at the same load level. The concrete cover spalling of the column was reduced to a good extent by using SF.
  • The proposed model predicts the load-carrying capacity of the columns; most importantly, it is modeled for short and slender columns.
  • More research in the field of recycling materials is required to help officials make decisions about using recycled materials in the design codes, such as using different types of recycled coarse aggregate, recycled fine aggregate, and recycled steel fiber.
  • Recycling concrete waste blocks (CBWs, as utilized in this study) and other recycled materials decrease the amount of waste sent to landfills, which is not environmentally friendly. This practice helps avoid the consumption of natural resources, thereby preventing their quick depletion and cutting down on the expenses and distractions linked to their extraction. Utilizing sustainable materials and creating a new pathway for using them again, such as incorporating recycled aggregates, can strengthen the circular economy, lower construction costs, and mitigate carbon emissions.

Author Contributions

Conceptualization, B.N.N., B.O.T. and M.H.F.R.; Writing—original draft preparation, B.N.N.; Writing—review & editing, B.O.T. and M.H.F.R. All authors have read and agreed to the published version of the manuscript.

Funding

This study received no external funding.

Institutional Review Board Statement

Not applicable.

Informed Consent Statement

Not applicable.

Data Availability Statement

Data are available upon request from the corresponding author.

Conflicts of Interest

The authors declare no conflicts of interest.

References

  1. Oikonomou, N.D. Recycled concrete aggregates. Cem. Concr. Compos. 2005, 27, 315–318. [Google Scholar] [CrossRef]
  2. Pacheco, J.; De Brito, J.; Chastre, C.; Evangelista, L. Experimental investigation on the variability of the main mechanical properties of concrete produced with coarse recycled concrete aggregates. Constr. Build. Mater. 2019, 201, 110–120. [Google Scholar] [CrossRef]
  3. Bampanis, I.; Vasilatos, C. Recycling Concrete to Aggregates. Implications on CO2 Footprint. Mater. Proc. 2023, 15, 28. [Google Scholar] [CrossRef]
  4. Fraile-García, E.; Ferreiro-Cabello, J. Environmental and Economic Viability of Using Concrete Block Wastes from a Concrete Production Plant as Recycled Coarse Aggregates. Materials 2024, 17, 1560. [Google Scholar] [CrossRef]
  5. Heeralal, M.; Kumar, R.P.; Rao, Y. Flexural fatigue characteristics of steel fiber reinforced recycled aggregate concrete (SFRRAC). Facta Univ.-Ser. Archit. Civ. Eng. 2009, 7, 19–33. [Google Scholar] [CrossRef]
  6. Sobhan, K.; Krizek, R.J. Fatigue behavior of fiber-reinforced recycled aggregate base course. J. Mater. Civ. Eng. 1999, 11, 124–130. [Google Scholar] [CrossRef]
  7. Gao, D.; Zhang, L. Flexural performance and evaluation method of steel fiber reinforced recycled coarse aggregate concrete. Constr. Build. Mater. 2018, 159, 126–136. [Google Scholar] [CrossRef]
  8. Gao, D.; Zhang, L.; Nokken, M. Mechanical behavior of recycled coarse aggregate concrete reinforced with steel fibers under direct shear. Cem. Concr. Compos. 2017, 79, 1–8. [Google Scholar] [CrossRef]
  9. Xiao, J.; Xiao, J. Recycled Aggregate Concrete; Springer: Berlin/Heidelberg, Germany, 2018; Available online: https://link.springer.com/book/10.1007/978-3-662-53987-3 (accessed on 10 April 2024).
  10. Ganesan, N.; Murthy, J.R. Strength and behavior of confined steel fiber reinforced concrete columns. Mater. J. 1990, 87, 221–227. [Google Scholar] [CrossRef]
  11. Foster, S.J.; Attard, M.M. Strength and ductility of fiber-reinforced high-strength concrete columns. J. Struct. Eng. 2001, 127, 28–34. [Google Scholar] [CrossRef]
  12. Ajdukiewicz, A.B.; Kliszczewicz, A.T. Comparative tests of beams and columns made of recycled aggregate concrete and natural aggregate concrete. J. Adv. Concr. Technol. 2007, 5, 259–273. [Google Scholar] [CrossRef]
  13. Pradhan, S.; Nayak, T.K.; Kumar, S.; Barai, S.V. Experimental and numerical study of recycled aggregate concrete column. Struct. Concr. 2023, 24, 3498–3519. [Google Scholar] [CrossRef]
  14. Choi, W.-C.; Yun, H.-D. Compressive behavior of reinforced concrete columns with recycled aggregate under uniaxial loading. Eng. Struct. 2012, 41, 285–293. [Google Scholar] [CrossRef]
  15. Breccolotti, M.; Materazzi, A.L. Structural reliability of eccentrically-loaded sections in RC columns made of recycled aggregate concrete. Eng. Struct. 2010, 32, 3704–3712. [Google Scholar] [CrossRef]
  16. Gao, D.; Li, W.; Pang, Y.; Huang, Y. Behavior analysis and strength prediction of steel fiber reinforced recycled aggregate concrete column under axial compression. Constr. Build. Mater. 2021, 290, 123278. [Google Scholar] [CrossRef]
  17. Carneiro, J.A.; Lima, P.R.L.; Leite, M.B.; Toledo Filho, R.D. Compressive stress–strain behavior of steel fiber reinforced-recycled aggregate concrete. Cem. Concr. Compos. 2014, 46, 65–72. [Google Scholar] [CrossRef]
  18. Hao, T.; Zhao, L.T.; Du, Z.H. Experimental study on compressive performance of RC columns with recycled aggregate. Key Eng. Mater. 2012, 517, 589–594. [Google Scholar] [CrossRef]
  19. Ridzuan, A.; Ibrahim, A.; Ismail, A.; Diah, A. Durablity performance of recycled aggregate concrete. In Proceedings of the Achieving Sustainability in Construction: Proceedings of the International Conference held at the University of Dundee, Scotland, UK, 5–6 July 2005; Thomas Telford Publishing: London, UK, 2005. [Google Scholar]
  20. Padmini, A.; Ramamurthy, K.; Mathews, M. Influence of parent concrete on the properties of recycled aggregate concrete. Constr. Build. Mater. 2009, 23, 829–836. [Google Scholar] [CrossRef]
  21. Pani, L.; Francesconi, L.; Rombi, J.; Mistretta, F.; Sassu, M.; Stochino, F. Effect of parent concrete on the performance of recycled aggregate concrete. Sustainability 2020, 12, 9399. [Google Scholar] [CrossRef]
  22. Kou, S.-C.; Poon, C.-S. Effect of the quality of parent concrete on the properties of high performance recycled aggregate concrete. Constr. Build. Mater. 2015, 77, 501–508. [Google Scholar] [CrossRef]
  23. Malešev, M.; Radonjanin, V.; Marinković, S. Recycled concrete as aggregate for structural concrete production. Sustainability 2010, 2, 1204–1225. [Google Scholar] [CrossRef]
  24. Ma, H.; Peng, S.; Xu, C.; Zhu, Y.; Sun, J.; Luo, S.; Deng, N.; He, L.; Han, Y.; Wu, C. Analysis of the Seismic Performance of Rectangular Recycled Aggregate Concrete Columns with Different Parameters. Buildings 2023, 13, 1761. [Google Scholar] [CrossRef]
  25. ASTM C150-07; Standard Specification for Portland Cement. ASTM International: West Conshohocken, PA, USA, 2012. [CrossRef]
  26. ASTM C33/C33M-18; Standard Specification for Concrete Aggregates. ASTM International: West Conshohocken, PA, USA, 2023. [CrossRef]
  27. ASTM C127; Standard Test Method for Density, Relative Density (Specific Gravity), and Absorption of Coarse Aggregate. ASTM International: West Conshohocken, PA, USA, 2015.
  28. Ismail, S.; Ramli, M. Mechanical strength and drying shrinkage properties of concrete containing treated coarse recycled concrete aggregates. Constr. Build. Mater. 2014, 68, 726–739. [Google Scholar] [CrossRef]
  29. Zhao, J.; Yu, T.; Teng, J. Stress-strain behavior of FRP-confined recycled aggregate concrete. J. Compos. Constr. 2015, 19, 04014054. [Google Scholar] [CrossRef]
  30. Xiao, J.; Li, J.; Zhang, C. Mechanical properties of recycled aggregate concrete under uniaxial loading. Cem. Concr. Res. 2005, 35, 1187–1194. [Google Scholar] [CrossRef]
  31. Eckert, M.; Oliveira, M. Mitigation of the negative effects of recycled aggregate water absorption in concrete technology. Constr. Build. Mater. 2017, 133, 416–424. [Google Scholar] [CrossRef]
  32. Adnan, S.H.; Loon, L.Y.; Rahman, I.A.; Saman, H.M.; Soejoso, M.W. Compressive strength of recycled aggregate concrete with various percentage of recycled aggregate. In Proceedings of the Conference National Seminar on Civil Engineering Research (SEPKA 2007), Skudai, Malaysia, 11–12 December 2007. [Google Scholar]
  33. Xu, J.-J.; Chen, Z.-P.; Ozbakkaloglu, T.; Zhao, X.-Y.; Demartino, C. A critical assessment of the compressive behavior of reinforced recycled aggregate concrete columns. Eng. Struct. 2018, 161, 161–175. [Google Scholar] [CrossRef]
  34. Bentur, A.; Mindess, S. Fibre Reinforced Cementitious Composites; CRC Press: Boca Raton, FL, USA, 2006. [Google Scholar]
  35. Hannant, P. Fibre Cements and Fibre Concretes; Mineralogical Society: Chantilly, VA, USA, 1978; Available online: https://onlinelibrary.wiley.com/doi/10.1002/pol.1979.130170714 (accessed on 10 April 2024).
  36. Ng, T.; Htut, T.; Foster, S. Fracture of Steel Fibre Reinforced Concrete—The Unified Variable Engagement Model. UNICIV Rep. No. R-460 May 2012. 2012. Available online: http://hdl.handle.net/20.500.11937/55306 (accessed on 10 April 2024).
  37. Marti, P.; Pfyl, T.; Sigrist, V.; Ulaga, T. Harmonized test procedures for steel fiber-reinforced concrete. Mater. J. 1999, 96, 676–685. [Google Scholar] [CrossRef]
  38. Bazant, Z.P.; Planas, J. Fracture and Size Effect in Concrete and Other Quasibrittle Materials; Routledge: London, UK, 2019. [Google Scholar] [CrossRef]
  39. Şener, S.; Barr, B.I.; Abusiaf, H.F. Size effect in axially loaded reinforced concrete columns. J. Struct. Eng. 2004, 130, 662–670. [Google Scholar] [CrossRef]
  40. Azizinamini, A.; Pavel, R.; Hatfield, E.; Ghosh, S.K. Behavior of lap-spliced reinforcing bars embedded in high-strength concrete. Struct. J. 1999, 96, 826–835. [Google Scholar]
  41. Ahmad, S.H.; Barker, R. Flexural behavior of reinforced high-strength lightweight concrete beams. Struct. J. 1991, 88, 69–77. [Google Scholar] [CrossRef]
  42. Yang, I.H.; Joh, C.; Kim, B.-S. Structural behavior of ultra high performance concrete beams subjected to bending. Eng. Struct. 2010, 32, 3478–3487. [Google Scholar] [CrossRef]
  43. Hadi, M.N.; Elbasha, N. Effects of tensile reinforcement ratio and compressive strength on the behaviour of over-reinforced helically confined HSC beams. Constr. Build. Mater. 2007, 21, 269–276. [Google Scholar] [CrossRef]
  44. Shin, S.-W.; Ghosh, S.K.; Moreno, J. Flexural ductility of ultra-high-strength concrete members. Struct. J. 1989, 86, 394–400. [Google Scholar] [CrossRef]
  45. MacGregor, J.G.; Breen, J.E. Design of slender concrete columns. J. Proc. 1970, 67, 6–28. [Google Scholar]
  46. MacGregor, J.G. Design of slender columns revisited. Struct. J. 1993, 90, 302–309. [Google Scholar] [CrossRef]
  47. Mockry, E.F.; Darwin, D. Slender Columns Interaction Diagrams. Concr. Int. 1982, 4, 44–50. [Google Scholar]
  48. Mirza, S. Flexural stiffness of rectangular reinforced concrete columns. ACI Struct. J. 1990, 87, 425–435. [Google Scholar]
Figure 1. Production of recycled coarse aggregate: (a) waste concrete; (b) crusher; (c) recycled aggregate.
Sustainability 16 03489 g001
Figure 2. Coarse aggregate: (a) NA; (b) RA.
Sustainability 16 03489 g002
Figure 3. Coarse aggregate particle size distribution.
Sustainability 16 03489 g003
Figure 4. Copper-coated steel fiber.
Sustainability 16 03489 g004
Figure 5. Coarse aggregate preparation: (a) moisturizing of the RA and NA; (b) drying of the RA and NA.
Sustainability 16 03489 g005
Figure 6. Reinforcement details (all dimensions are in mm): (a) slender columns; (b) short columns; (c) cross-section.
Sustainability 16 03489 g006
Figure 7. Test preparation: (a) CFRP wrapping; (b) pin support; (c) column setup.
Sustainability 16 03489 g007
Figure 8. Concentrically loaded columns: (a) S-RA0Vf0E0.0 at failure; (b) S-RA100Vf0E0.0 at failure; (c) L-RA100Vf0E0 after failure.
Sustainability 16 03489 g008
Figure 9. Failure patterns of the short columns (e/h = 0).
Sustainability 16 03489 g009
Figure 10. Failure patterns of the slender columns (e/h = 0).
Sustainability 16 03489 g010
Figure 11. Failure patterns of the short column (e/h = 0.5).
Sustainability 16 03489 g011
Figure 12. Failure patterns of the slender columns (e/h = 0.5).
Sustainability 16 03489 g012
Figure 13. Failure patterns of the short column (e/h = 1.0).
Sustainability 16 03489 g013
Figure 14. Failure patterns of the slender columns (e/h = 1.0).
Sustainability 16 03489 g014
Figure 15. Effect of the eccentricity on the RA and NA: (a) short column; (b) short columns with 1% Vf; (c) long columns; (d) long columns with 1% Vf.
Sustainability 16 03489 g015
Figure 16. Mid-height lateral displacement: (a) short columns with NA; (b) short columns with RA; (c) slender columns with NA; (d) slender columns with RA.
Sustainability 16 03489 g016
Figure 17. Concrete compressive strain: (a) short columns with RA; (b) short columns with NA; (c) slender columns with RA; (d) slender columns with NA.
Sustainability 16 03489 g017
Figure 18. Reinforcement strain in concentrically loaded columns in compression: (a) short columns with NA; (b) short columns with RA; (c) slender columns with NA; (d) slender columns with RA.
Sustainability 16 03489 g018
Figure 19. Reinforcement strain in tension and compression in eccentrically loaded columns: (a) short column with NA; (b) short columns with RA; (c) slender columns with NA; (d) slender columns with RA.
Sustainability 16 03489 g019
Figure 20. Column section analysis.
Sustainability 16 03489 g020
Figure 21. P-M diagrams of ACI-318 versus the experimental results: (a) short columns; (b) short columns with steel fiber; (c) slender columns; (d) slender columns with steel fiber.
Sustainability 16 03489 g021
Figure 22. Ratio comparison of the experimental axial load capacity to the theoretical values versus the experimental axial load values to the values calculated using the ACI-318 equations.
Sustainability 16 03489 g022
Figure 23. Effects on the proposed model of (a) effect of kL/r, (b) effect of e/h, and (c) effect of f′c.
Sustainability 16 03489 g023
Table 1. Details of the tested specimens.
Specimen IDkl/rVf % e/h %RA %
S-RA0Vf0E0.017.24000
S-RA100Vf0E0.017.2400100
L-RA0Vf0E0.034.5000
L-RA100Vf0E0.034.500100
S-RA0Vf1E0.017.24100
S-RA100Vf1E0.017.2410100
L-RA0Vf1E0.034.5100
L-RA100Vf1E0.034.510100
S-RA100Vf0E0.517.24050100
S-RA0Vf0E0.517.240500
L-RA100Vf0E0.534.5050100
L-RA0Vf0E0.534.50500
S-RA100Vf1E0.517.24150100
S-RA0-Vf1E0.517.241500
L-RA100Vf1E0.534.5150100
L-RA0Vf1E0.534.51500
S-RA100Vf0E1.017.240100100
S-RA0Vf0E1.017.2401000
L-RA100Vf0E1.034.50100100
L-RA0Vf0E1.034.501000
S-RA100Vf1E1.017.241100100
S-RA0Vf1E1.017.2411000
L-RA100Vf1E1.034.51100100
L-RA0Vf1E1.034.511000
Table 2. Cement chemical composition.
Chemical TestsResults
Loss on ignition (%)2.14
SiO2 (%)20
CaO (%)63.5
Al2O3 (%)4
Fe2O3 (%)4.5
MgO (%)2.15
S2O3 (%)2.1
Table 3. Physical properties of the coarse aggregate.
Aggregate TypeApparent Density (kg/m3)Bulk Density (kg/m3)Specific Gravity (SSD)Water Absorption (%)
NA159114632.67 (2.68)0.93
RA151914172.55 (2.62)2.61
Table 4. Mixture properties by weight.
CementSandGravel (RA or NA)w/cSteel Fiber
12.630.481% or 0%
Table 5. Mechanical properties of the concrete for each specimen.
Specimen IDf′c (MPa)fct (MPa)fr (MPa)Ec (MPa)
S-RA0Vf0E035.262.904.7131,632
S-RA100Vf0E038.613.155.0832,120
L-RA0Vf0E035.502.974.6230,770
L-RA100Vf0E037.403.054.8632,204
S-RA0Vf1E036.503.495.6433,763
S-RA100Vf1E038.103.605.8034,464
L-RA0Vf1E035.003.285.4831,273
L-RA100Vf1E036.483.475.5232,760
S-RA100Vf0E0.534.332.754.3131,621
S-RA0Vf0E0.537.453.024.8232,312
L-RA100Vf0E0.534.002.744.4029,778
L-RA0Vf0E0.533.652.704.3029,331
S-RA100Vf1E0.535.903.485.8632,130
S-RA0-Vf1E0.535.003.385.4231,756
L-RA100Vf1E0.534.493.355.5230,844
L-RA0Vf1E0.535.343.405.7830,935
S-RA100Vf0E1.036.202.944.2932,551
S-RA0Vf0E1.034.802.834.2331,032
L-RA100Vf0E1.034.872.864.3830,834
L-RA0Vf0E1.032.852.693.9029,039
S-RA100Vf1E1.036.713.515.7930,973
S-RA0Vf1E1.035.423.375.8836,199
L-RA100Vf1E1.033.633.205.2830,486
L-RA0Vf1E1.032.713.075.0928,918
Table 6. Mechanical properties of the steel reinforcement.
TypeDiameter (mm)Yield strength
fy (MPa)
Yield strain
εy (10−6)
Longitudinal105302650
Ties84872435
Table 7. Experimental test results.
Specimen IDPmax (kN)Pcrack (kN)Pcrack/Pmaxεcc (με)εct (με)εsc (με)Pyield SCεst (με)Pyield Stlat (mm)axial (mm)yield (mm)M1st (kN·m)M2nd (kN·m)M1s + M2ndμ
S-RA0Vf0E0680--------−3196−2622−11,04985%------1.031.400.910.000.700.701.12
S-RA100Vf0E0735--------−3325−2724−326899%------0.931.640.810.000.680.681.15
L-RA0Vf0E0642--------−3281−2811−595795%------3.502.812.770.002.252.251.26
L-RA100Vf0E0690--------−3528−2985−341394%------4.203.283.070.002.902.901.37
S-RA0Vf1E0714--------−3418−2882−13,45085%------1.111.360.890.000.790.791.25
S-RA100Vf1E0748--------−3701−3083−927990%------1.081.640.820.000.810.811.32
L-RA0Vf1E0665--------−3847−3125−11,88593%------3.732.962.810.002.482.481.33
L-RA100Vf1E0701--------−4624−3084−868396%------4.392.923.030.003.083.081.45
S-RA100Vf0E0.5190102.154%−3287917−2665100%2273---2.792.312.2811.880.5312.401.22
S-RA0Vf0E0.52109545%−3174284−268799%2343---3.032.472.3313.130.6413.761.30
L-RA100Vf0E0.51615635%−3327978−267898%282797%10.343.047.629.941.6611.601.36
L-RA0Vf0E0.51586945%−3215177−281299%292697%10.322.717.439.501.6311.131.39
S-RA100Vf1E0.5223117.553%−41911755−273199%2452---3.592.932.3813.940.8014.741.51
S-RA0-Vf1E0.5218126.158%−378657−288796%2395---3.452.592.0313.630.7514.381.70
L-RA100Vf1E0.516372.344%−37621405−2659100%282199%11.063.136.7810.191.8011.991.63
L-RA0Vf1E0.51688249%−38221505−254499%306998%11.583.126.4810.501.9512.451.79
S-RA100Vf0E1.01004242%−3707700−1647---458078%3.873.222.8212.500.3912.891.37
S-RA0Vf0E1.01053836%−3761292−2052---470583%3.523.302.7713.130.3713.491.27
L-RA100Vf0E1.074.52027%−2920181−1479---489194%13.133.698.919.130.9810.101.47
L-RA0Vf0E1.0731927%−2954222−1443---480084%13.033.449.368.750.959.701.39
S-RA100Vf1E1.01074946%−38441250−1750---462973%4.793.372.8713.380.5113.891.67
S-RA0Vf1E1.01124540%−38941226−1808---479589%4.133.362.2814.000.4614.461.81
L-RA100Vf1E1.080.53341%−33791321−1155---501499%14.104.237.0910.061.1411.201.99
L-RA0Vf1E1.076.52634%−31361241−1044---489187%13.494.027.139.561.0310.591.89
Notes: εcc and εct = strain in the concrete on front side (compression) and back side (tension), respectively; both sides, front and back are in compression. Positive strains are in tension, negative strains are in compression. ∆lat and ∆axial lateral and vertical displacements, respectively. M1st and M2nd = first-order moments due to initial applied eccentricity and moments due to the second-order effects. Pmax = column load carrying capacity at peak; Pcrack = column load at first horizontal crack (eccentric columns only); Pyield = column load at which steel yielded first. μ = ∆lat/∆yield = ductility index.
Table 8. Effect of the steel fiber on the load-carrying capacity.
Specimen IDPExp (kN)Specimen IDPExp (kN)Increase in Strength
S-RA0Vf0E0680S-RA0Vf1E07145.00%
S-RA100Vf0E0735S-RA100Vf1E07481.77%
L-RA0Vf0E0642L-RA0Vf1E06653.58%
L-RA100Vf0E0690L-RA100Vf1E07011.59%
S-RA100Vf0E0.5190S-RA100Vf1E0.522317.37%
S-RA0Vf0E0.5210S-RA0-Vf1E0.52183.81%
L-RA100Vf0E0.5161L-RA100Vf1E0.51631.24%
L-RA0Vf0E0.5158L-RA0Vf1E0.51686.33%
S-RA100Vf0E1.0100S-RA100Vf1E1.01077.00%
S-RA0Vf0E1.0105S-RA0Vf1E1.01126.67%
L-RA100Vf0E1.074.5L-RA100Vf1E1.080.58.05%
L-RA0Vf0E1.073L-RA0Vf1E1.076.54.79%
Table 9. Effect of the slenderness on the strength.
Specimens IDKl/rPExp (kN)% Decrease in Strength
S-RA0Vf0E017.24680
L-RA0Vf0E034.56425.6%
S-RA100Vf0E017.24735
L-RA100Vf0E034.56906.1%
S-RA0Vf1E017.24714
L-RA0Vf1E034.56656.9%
S-RA100Vf1E017.24748
L-RA100Vf1E034.57016.3%
S-RA100Vf0E0.517.24190
L-RA100Vf0E0.534.516115.3%
S-RA0Vf0E0.517.24210
L-RA0Vf0E0.534.515824.8%
S-RA100Vf1E0.517.24223
L-RA100Vf1E0.534.516326.9%
S-RA0-Vf1E0.517.24218
L-RA0Vf1E0.534.516822.9%
S-RA100Vf0E1.017.24100
L-RA100Vf0E1.034.574.525.5%
S-RA0Vf0E1.017.24105
L-RA0Vf0E1.034.57330.5%
S-RA100Vf1E1.017.24107
L-RA100Vf1E1.034.580.524.8%
S-RA0Vf1E1.017.24112
L-RA0Vf1E1.034.576.531.7%
Table 10. Proposed model.
Proposed EquationNrr2RavgSt. Dev.Var.
Pproposed= (1.67 × e−2.31 (e/h) (kl/r)−0.17) PACI2370.9790.9591.0250.2410.06
Table 11. Comparison of the experimental axial load with PACI and Pproposed.
Specimen IDPExp (kN)PACI (kN)Pproposed (kN)PExp/PACIPExp/Pproposed
S-RA0Vf0E06806256461.091.05
S-RA100Vf0E07356696921.101.06
L-RA0Vf0E06426295781.021.11
L-RA100Vf0E06906536011.061.15
S-RA0Vf1E07146426631.111.08
S-RA100Vf1E07486626851.131.09
L-RA0Vf1E06656225721.071.16
L-RA100Vf1E07016415901.091.19
S-RA100Vf0E0.51901782001.070.95
S-RA0Vf0E0.52101872131.120.98
L-RA100Vf0E0.51611401771.150.91
L-RA0Vf0E0.51581391751.140.90
S-RA100Vf1E0.52231882071.181.08
S-RA0-Vf1E0.52181862031.171.07
L-RA100Vf1E0.51631381791.180.91
L-RA0Vf1E0.51681391821.210.92
S-RA100Vf0E1.010084661.201.52
S-RA0Vf0E1.010583641.271.65
L-RA100Vf0E1.074.572571.031.31
L-RA0Vf0E1.07371541.031.34
S-RA100Vf1E1.010792661.171.61
S-RA0Vf1E1.011291651.231.73
L-RA100Vf1E1.080.577551.041.45
L-RA0Vf1E1.076.576541.011.41
Disclaimer/Publisher’s Note: The statements, opinions and data contained in all publications are solely those of the individual author(s) and contributor(s) and not of MDPI and/or the editor(s). MDPI and/or the editor(s) disclaim responsibility for any injury to people or property resulting from any ideas, methods, instructions or products referred to in the content.

