Article

Causes and Effects of Climate Change 2001 to 2021, Peru

by
Vicenta Irene Tafur Anzualdo
1,
Felipe Aguirre Chavez
1,
Miluska Vega-Guevara
1,
Doris Esenarro
2,3,* and
Jesica Vilchez Cairo
2,3
1
Institute of Research (ININ), Marcelino Champagnat University (UMCH), Lima 15039, Peru
2
Faculty of Architecture and Urbanism, Ricardo Palma University (URP), Santiago de Surco 15039, Peru
3
Research Laboratory for Formative Investigation and Architectural Innovation (LABIFIARQ), Ricardo Palma University (URP), Santiago de Surco 15039, Peru
*
Author to whom correspondence should be addressed.
Sustainability 2024, 16(7), 2863; https://doi.org/10.3390/su16072863
Submission received: 16 December 2023 / Revised: 29 February 2024 / Accepted: 14 March 2024 / Published: 29 March 2024

Abstract

:
Climate change is an imminent threat to humanity that brings significant environmental, social, and economic consequences worldwide, with population growth and deforestation among these effects. The research aims to analyze the causes and effects of climate change over the last 30 years. Various sources of information were analyzed to interpret the consequences; therefore, it is important to understand and analyze the causes and effects of climate change, generating information on temperature trends, precipitation, and glacier loss from 1990 to 2020. The evidence of the increase in the average temperature of the planet is becoming increasingly solid. The average annual temperature in the Coast region ranges from 21.1 to 22.6 °C, in the Sierra region from 12.6 to 14.4 °C, and in the Jungle region from 22.7 to 25.7 °C. Annual average precipitation in the Coast region varies from 22.3 to 174.1 mm, in the Highlands region from 570 to 834.3 mm, and in the Jungle region from 1156 to 2093 mm. The White Mountain Range has lost approximately 40.5% of its total glacier coverage on average, and between 1996 and 2019 the amount of tropical glaciers has decreased by 28.17%. It was concluded that the threats of climate change are increasingly evident, due not only to environmental pollution but also to the various human activities that generate changes in the environment.

1. Introduction

Global climate change (CC) is inducing significant biodiversity losses worldwide due to demographic explosions and human activities that have led to severe disruptions in natural resources of soil, air, and water. Human activities have been and will remain responsible for the decline in biodiversity, primarily through changes in land use, pollution, and the degradation of natural resources [1]. The impact of climate change increasingly threatens Peru, a country highly vulnerable to these changes. This issue extends beyond environmental pollution to encompass rapid population growth and intensive use of fossil fuels. The predominant use of fossil fuels as the primary energy source poses an extremely challenging obstacle in resolving the issue of climate change. The rapid deforestation caused by human activities has also contributed to releasing a substantial volume of greenhouse gases (GHGs) [2]. The undeniable human influence on the climate system is highlighted by recent anthropogenic emissions of GHGs, which have reached historic highs. These recent climate changes have had widespread impacts on both human and natural systems [3].
The environmental impacts associated with CC are becoming increasingly conspicuous due to their escalating intensity and frequency. Evidence of CC is manifested in the heightened frequency, intensity, and scale of recurring climate events each season [4]. Additionally, CC is exacerbating the frequency and intensity of natural disasters [5].
Human activities, essential to meet societal needs, have resulted in the irrational exploitation of natural resources and pollution, contributing to increased GHG emissions, and thereby intensifying CC. This phenomenon amplifies the alteration of climatic elements such as temperature, humidity, precipitation, and winds due to both anthropogenic and natural causes [6]. The effects of anthropogenic climate change are poised to persist for centuries to millennia [7].
Since the Industrial Revolution, human activity has emerged as the principal driver of this phenomenon [8]. The intensification of CC is evident in the diminishing ice cap, rising sea levels, more frequent extreme weather events (floods, droughts, heatwaves), ocean acidification, species migration to higher altitudes, and reduced crop productivity and yield [9,10].
Peru finds itself in a situation of high vulnerability to CC, stemming from its geography, the diversity of its ecosystems, and the wide range of climates within the country [9]. This phenomenon particularly impacts sectors such as energy, industry, transportation, and production, with a specific emphasis on fishing and agriculture [9]. These latter two sectors will face the most substantial impacts of CC, directly affecting food security and resulting in adverse consequences for vulnerable populations and families dependent on these activities [11]. Key impacts of climate change in the country encompass glacier retreat, the increased frequency and intensity of the El Niño phenomenon, and rising sea levels [12].
The analysis of CC proves pivotal in the light of climatological issues stemming from environmental pollution, deforestation, degradation of the Amazonian forests, high consumption of fossil fuels, and other human activities. In this context, the causes and effects of CC are scrutinized, encompassing deforestation, the surge in carbon dioxide and methane emissions, global warming, increased precipitation, and glacier reduction, all evident aspects.
Therefore, the present research aims to analyze the causes and effects of climate change during 2020–2021 in Peru.

2. Materials and Methods

A methodological approach was employed based on the systematic search for scientific information related to climate change. The units of analysis considered encompassed entities, both public and private, involved in the study of the environment and climate change. Data regarding temperatures, precipitation, and glacier coverage, and other relevant information for the study period, were obtained from environmental statistical yearbooks provided by the mentioned institutions.

2.1. Formatting of Mathematical Components

2.1.1. The Annual Growth Rates

The calculation of the annual growth rate of temperature, precipitation, and deforestation was derived from historical data enabling analysis within the 2005–2021 period, utilizing the following equation [13]:
D = D F D I D I 100 ,
D represents the growth rate, DF represents the temperature in the final year, and DI represents the temperature in the initial year.

2.1.2. Loss of Coverage

To analyze the loss of vegetative cover in the Amazonian forests of Peru and prevent forest degradation, it is crucial to determine the forest loss in the forthcoming years. To achieve this, we employed a simple linear regression equation [14]:
Y ^ = A + β   ( X ) ,
where Y ^ represents the dependent variable, A is the intercept, β is the slope of the line, and X represents the independent variable.

3. Results

3.1. Deforestation, Carbon Dioxide, and Methane

3.1.1. Deforestation in the Amazonian Forests

Forests in Peru constitute the largest ecosystem, spanning over 72 million hectares of forested areas. The country ranks second in Latin America in terms of forest extension, fourth for the largest tropical forest area, and ninth for global forest coverage [15].
Figure 1 shows that forests in Peru cover a total area of 73,280,424 hectares, representing 57.3% of the national territory [16]. These forests are generally classified into three main categories: the Amazonian humid forests, covering 53.7% of the country and constituting 94.1% of the forests; the coastal dry forests and Andean coastal forests, occupying 3.2% of the country and 5.6% of the forests; and the Andean relict humid forests, encompassing 0.2% of the national territory and representing 0.3% of the forests [16].
Despite the considerable benefits that forest ecosystems offer to society, their conservation is threatened by deforestation and degradation.
Figure 2A illustrates the direct causes such as agricultural expansion, illegal extractive activities, and infrastructure expansion for industries. Agricultural expansion, led by traditional small-scale farming and medium- to large-scale agriculture, stands as a determining force in Amazonian deforestation [17]. In Figure 2A’, a total of 1,490,498 ha were cultivated, comprising 341,003.03 ha for transitory crops and 1,182,647.72 ha for permanent crops. Crops significantly impacting deforestation or forest degradation include coffee, covering 378,622 ha (25.4%), and cultivated pastures with 375,976 ha (25.2%). Following these are cocoa (8.7%), plantain (8.2%), hard yellow maize (7.8%), rice (5.5%), and cassava (4.8%), encompassing 85.7% of the cultivated area [18].
Figure 2B portrays the underlying causes, such as illegal extractive activities; informal gold mining in Madre de Dios has encroached upon up to 33,552 ha, affecting protected areas and native communities [17]. Although cocoa crops were reduced from 49,800 to 42,900 ha between 2013 and 2014, challenges persist in specific areas [17]. Concerning infrastructure expansion and extractive activities like road construction and power grids, considerable concerns are raised. Road projects in the Amazon can induce ecological, social, and economic impacts within a range of up to 50 km on either side of the road [17]. Additionally, demographic factors, with population growth and migration to the Amazon, have doubled the regional population, representing 13.4% of the national total [17]. Regarding economic, political–institutional, and cultural aspects, the evidence shows a low profitability of forests compared to other uses, a lack of connectivity with markets, disjointed public policies, and limitations in rights over forest resources and lands. Furthermore, the migrants’ lack of knowledge in how to sustainably utilize forests often drives them towards activities like livestock or agriculture, moving away from forest sustainability [17].
Figure 3 illustrates the forest loss during the period 2001–2021, totaling 2,774,562 hectares, with an average annual loss of 132,122 ha [19]. However, between 2010 and 2021, deforestation exceeded this average, reaching 150,880 ha [20]. Over the last decade (2011–2021), there has been a consistent increase in forest loss, representing 67% of the total. This upward trend, particularly evident in 2020 during the COVID-19 pandemic, resulted in the deforestation of over 200,000 ha [19].
As shown in Table 1, the departments with the highest deforestation by 2021 were Loreto (508,027 ha), Ucayali (506,424 ha), San Martín (480,774 ha), Huánuco (366,812 Ha), and Madre de Dios (277,297 ha). These departments use approximately 77% of the deforested areas for expanding agricultural and livestock frontiers to produce staple crops such as rice, maize, cocoa, papaya, coffee, and other products to meet both domestic and international markets.
If the described practices persist, an increase in forest loss and degradation is anticipated, resulting in socio-environmental issues and declining biodiversity, and jeopardizing Peru’s commitments to greenhouse gas mitigation and climate change adaptation [18]. Statistical data from 2001 to 2021 have been utilized to forecast projected deforested areas for 2022–2025 using a simple linear regression equation, considering the dataset’s numerical nature and normal distribution, as follows:
Y ^ = A + β   ( X )
which denotes Area ( Y ^ ) = Constant (A) + Slope of the line (β) Independent variable (X).
The following projections were obtained:
Y = 80,502.6 + 4692.67 X
Y22 = 80,502.6 + 4692.67 (22) = 183,741.34
Y23 = 80,502.6 + 4692.67 (23) = 188,434.01
Y24 = 80,502.6 + 4692.67 (24) = 193,126.68
Y25 = 80,502.6 + 4692.67 (25) = 197,819.35
The results are concerning, attributed to the consistent rise in deforestation, supported by a high and positive correlation coefficient of 0.803, along with a determination coefficient of 0.645. These indicators signal a significant deterioration in the Amazonian forests, biodiversity, food security, and other related aspects.

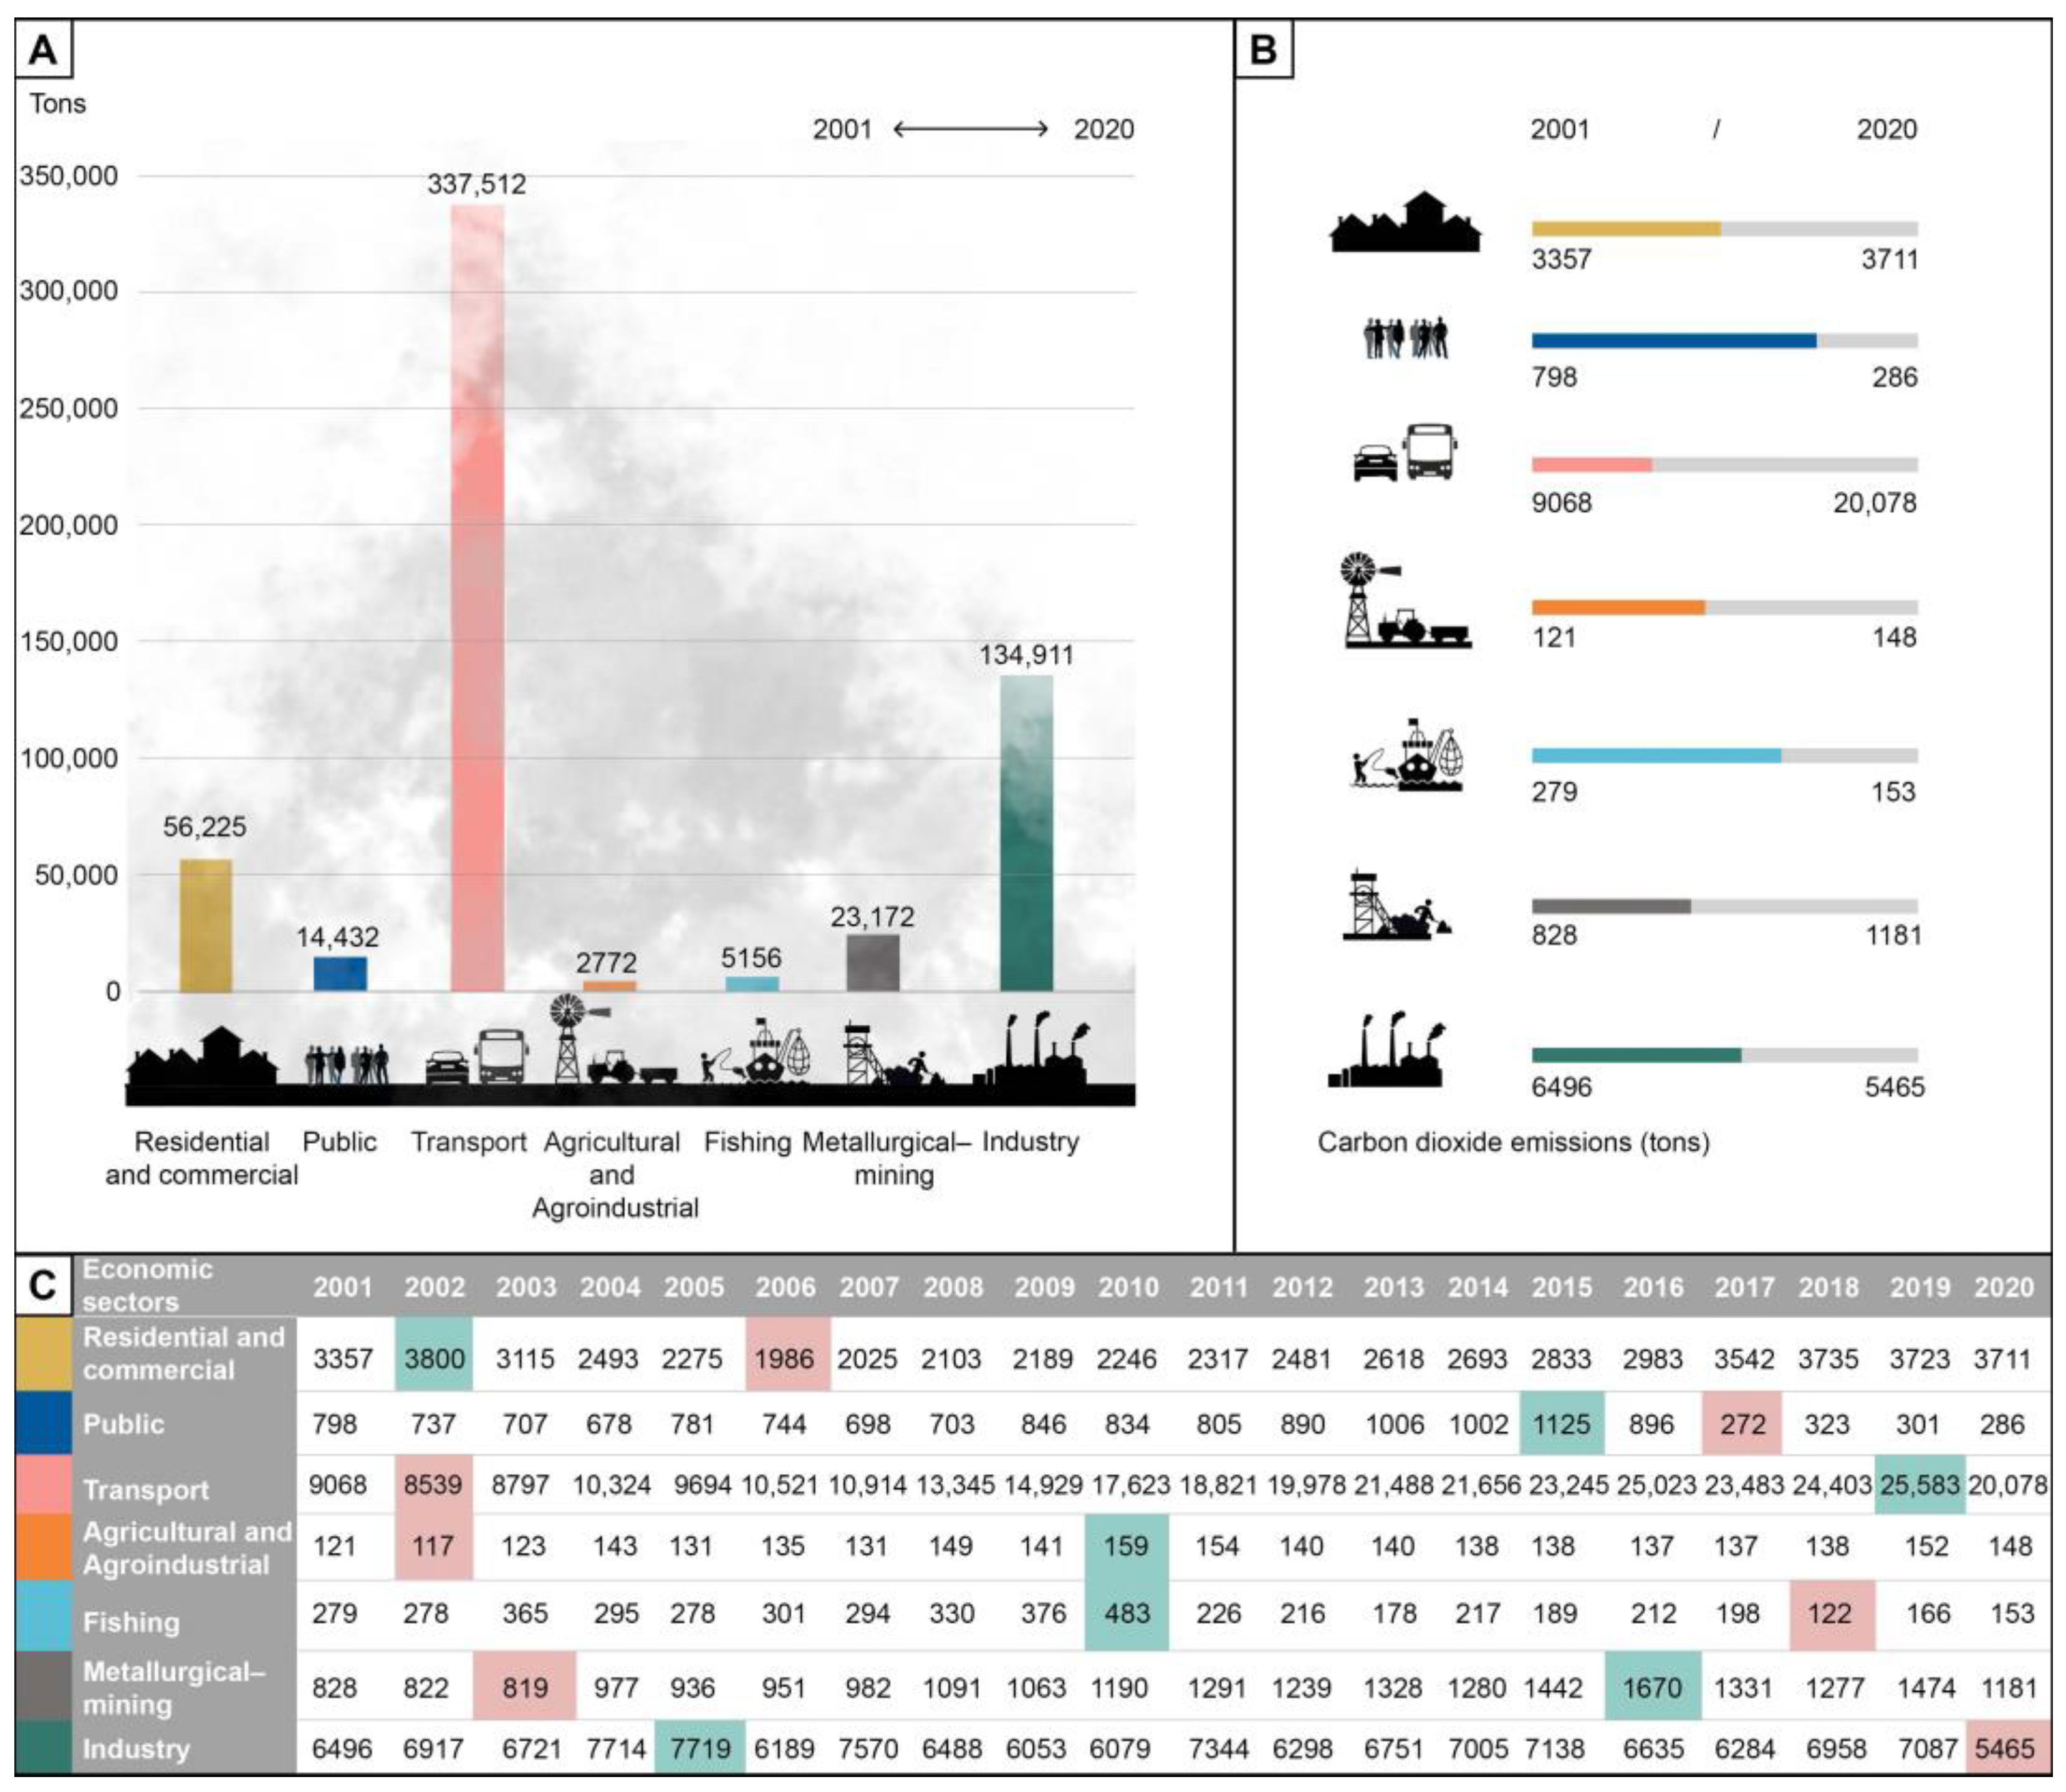
3.1.2. Carbon Dioxide (CO2)

GHGs are primarily generated by human activities, known as anthropogenic causes. These actions, linked to our lifestyles, are accountable for global warming. The heightened greenhouse effect, stemming from industrial, agricultural, transportation, and other processes, stands as the primary cause of the climate change experienced by planet Earth [23].
Figure 4 illustrates the warming potential and atmospheric persistence of greenhouse gases. CO2 is the most abundant and long-lasting gas, remaining at 20% of its atmospheric presence for approximately 30,000 years [24]. On the other hand, nitrous oxide (N2O) is 310 times more potent than CO2, while methane (CH4) is 23 times more potent [24]. In contrast, fluorinated gases have a shorter lifespan, ranging from months to years [24].
When it comes to CO2, it is the primary contributor to global warming, primarily stemming from the burning of fossil fuels, deforestation, and forest fires [23].
Figure 5 illustrates carbon dioxide emissions from 2001 to 2020, showing a 48.10% increase in emissions. In 2019, the highest volume of emissions at 38,486 tons was recorded, while the lowest was observed in 2006 with 20,827 tons [25].
Figure 6 illustrates carbon dioxide emissions according to the economic sector during the period 2001–2020. Figure 6A shows that the transportation sector has the highest carbon dioxide emissions, with an increase of 121.42%. Following this is the industrial sector, which experienced a reduction of −15.87% in its emissions, while the residential and commercial sectors have increased by 10.54%. For the mining–metallurgical sector, a 42.63% increase in emissions was recorded.
On the other hand, Figure 6B compares emissions between the years 2001 and 2020. In 2001, the public sector emitted 798 tons, a figure that decreased to 286 tons in 2020. The transportation sector showed the lowest emissions in 2001 with 9068 tons, contrasting with the 200,078 tons emitted in 2020.
In Figure 6C, the peaks and troughs of emissions per sector and year are detailed: for the residential and commercial sector, the peak was in 2002 and the trough in 2006; the public sector had its highest point in 2015 and the lowest in 2017; transportation reached its peak in 2019 and its minimum in 2002; agriculture and agribusiness had their peak in 2010 and their lowest point in 2002; the fishing sector had its maximum in 2010 and its minimum in 2018; the mining–metallurgical sector recorded its highest point in 2016 and its minimum in 2003; and finally, the industrial sector had its highest peak in 2005 and its lowest level in 2020.
The following projections were obtained:
Y = 18,051.28 + 1015.02 X
Y21 = 18,051.28 + 1015.02 (21) = 39,366.70
Y22 = 18,051.28 + 1015.02 (22) = 40,381.12
Y23 = 18,051.28 + 1015.02 (23) = 41,338.14
Y24 = 18,051.28 + 1015.02 (24) = 42,311.18
Y25 = 18,051.28 + 1015.02 (25) = 43,328.15
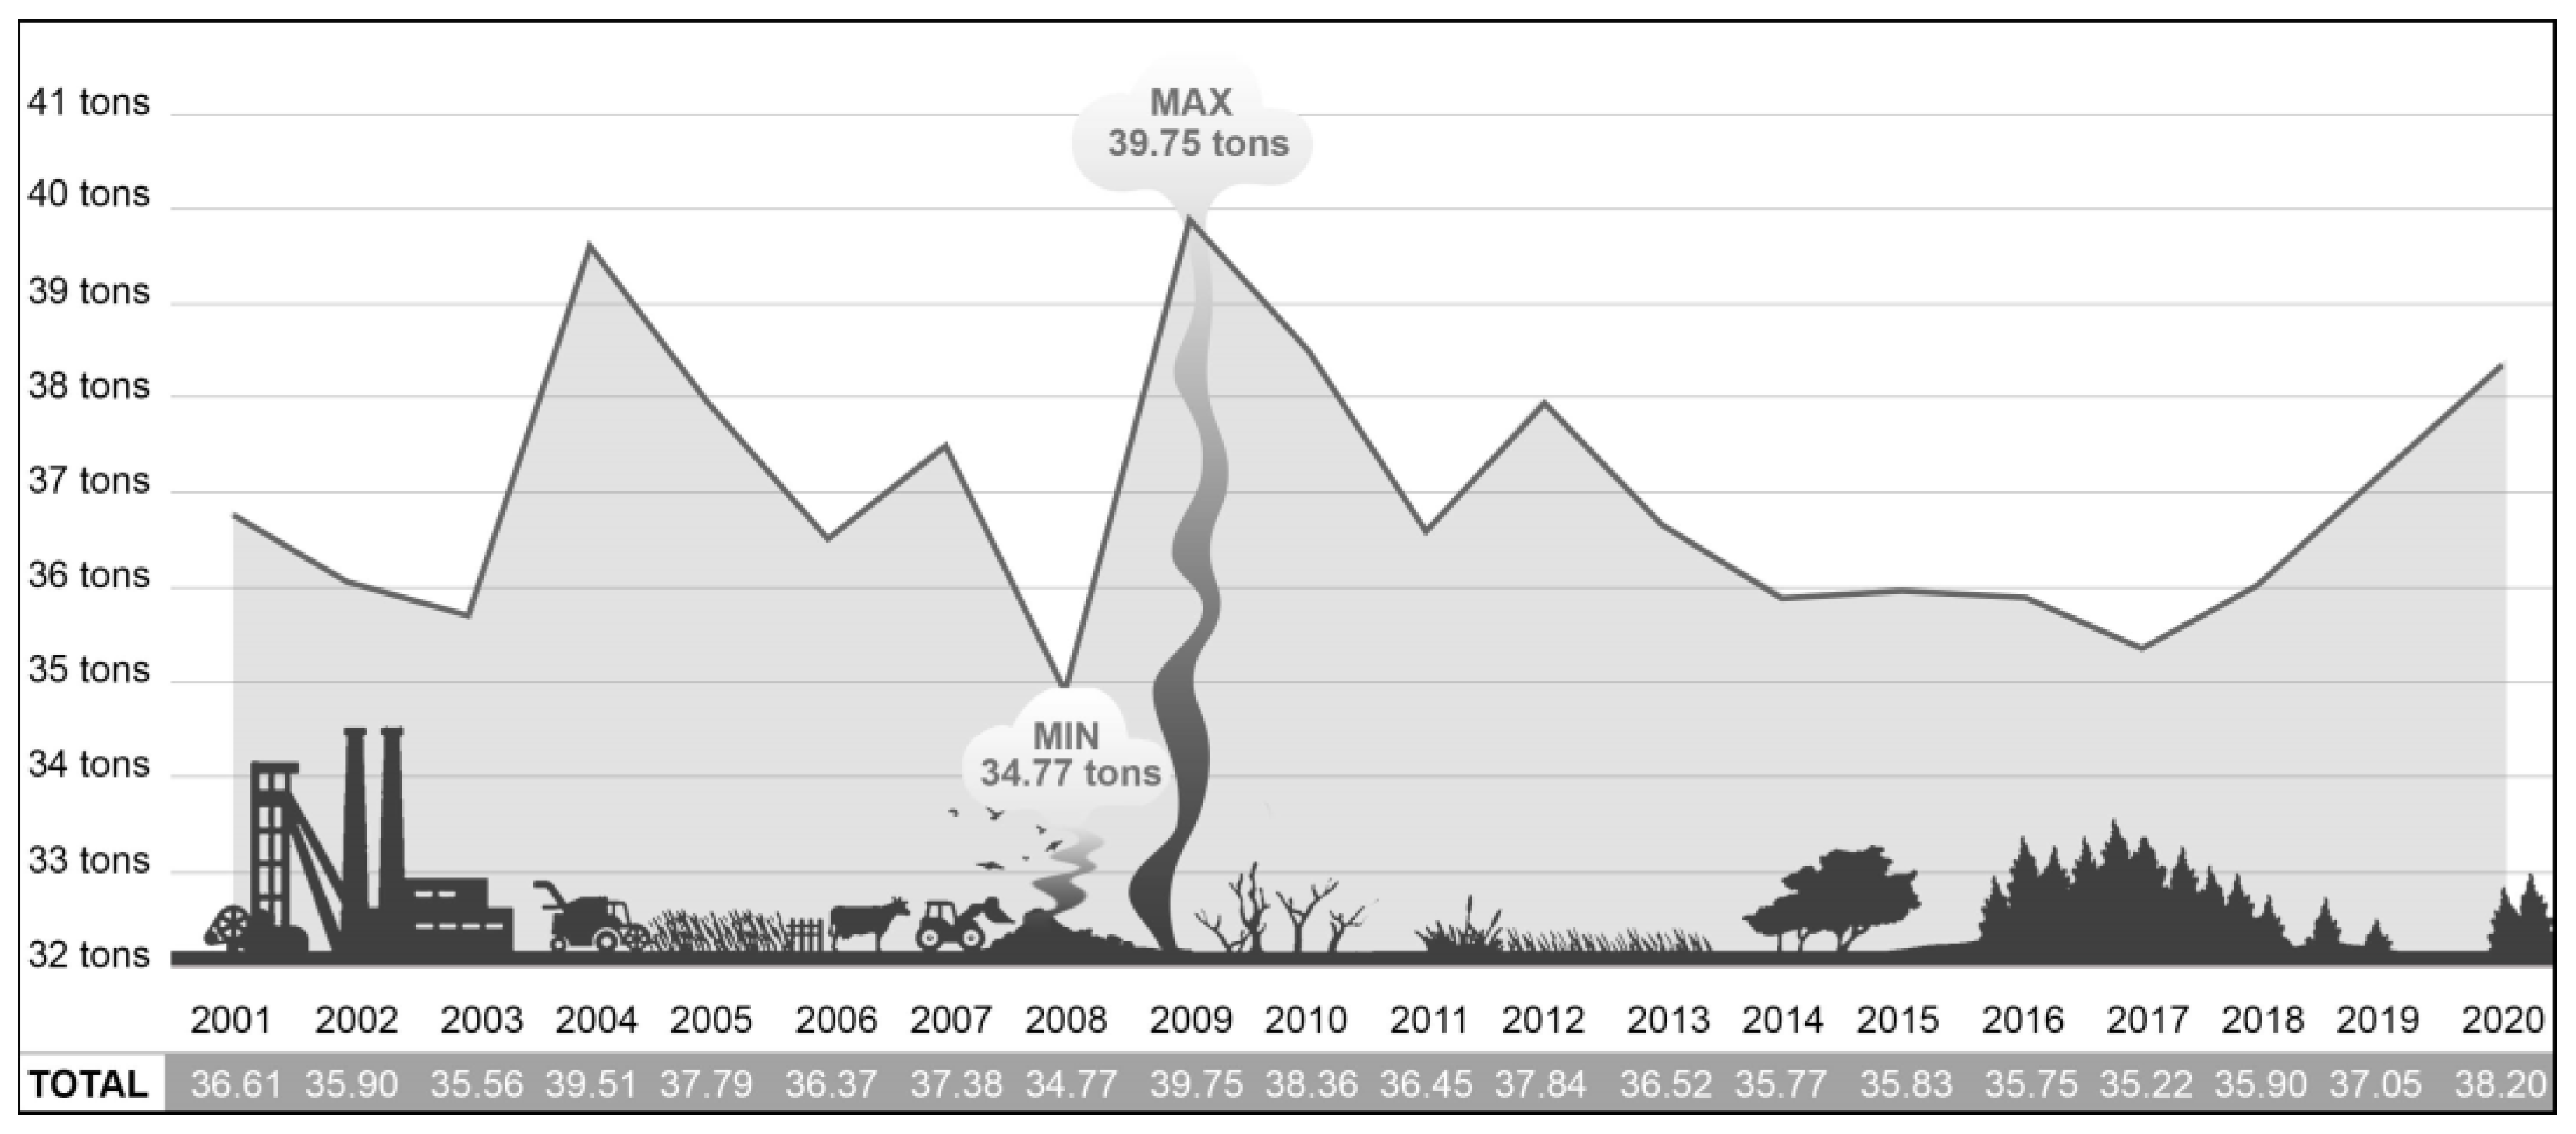
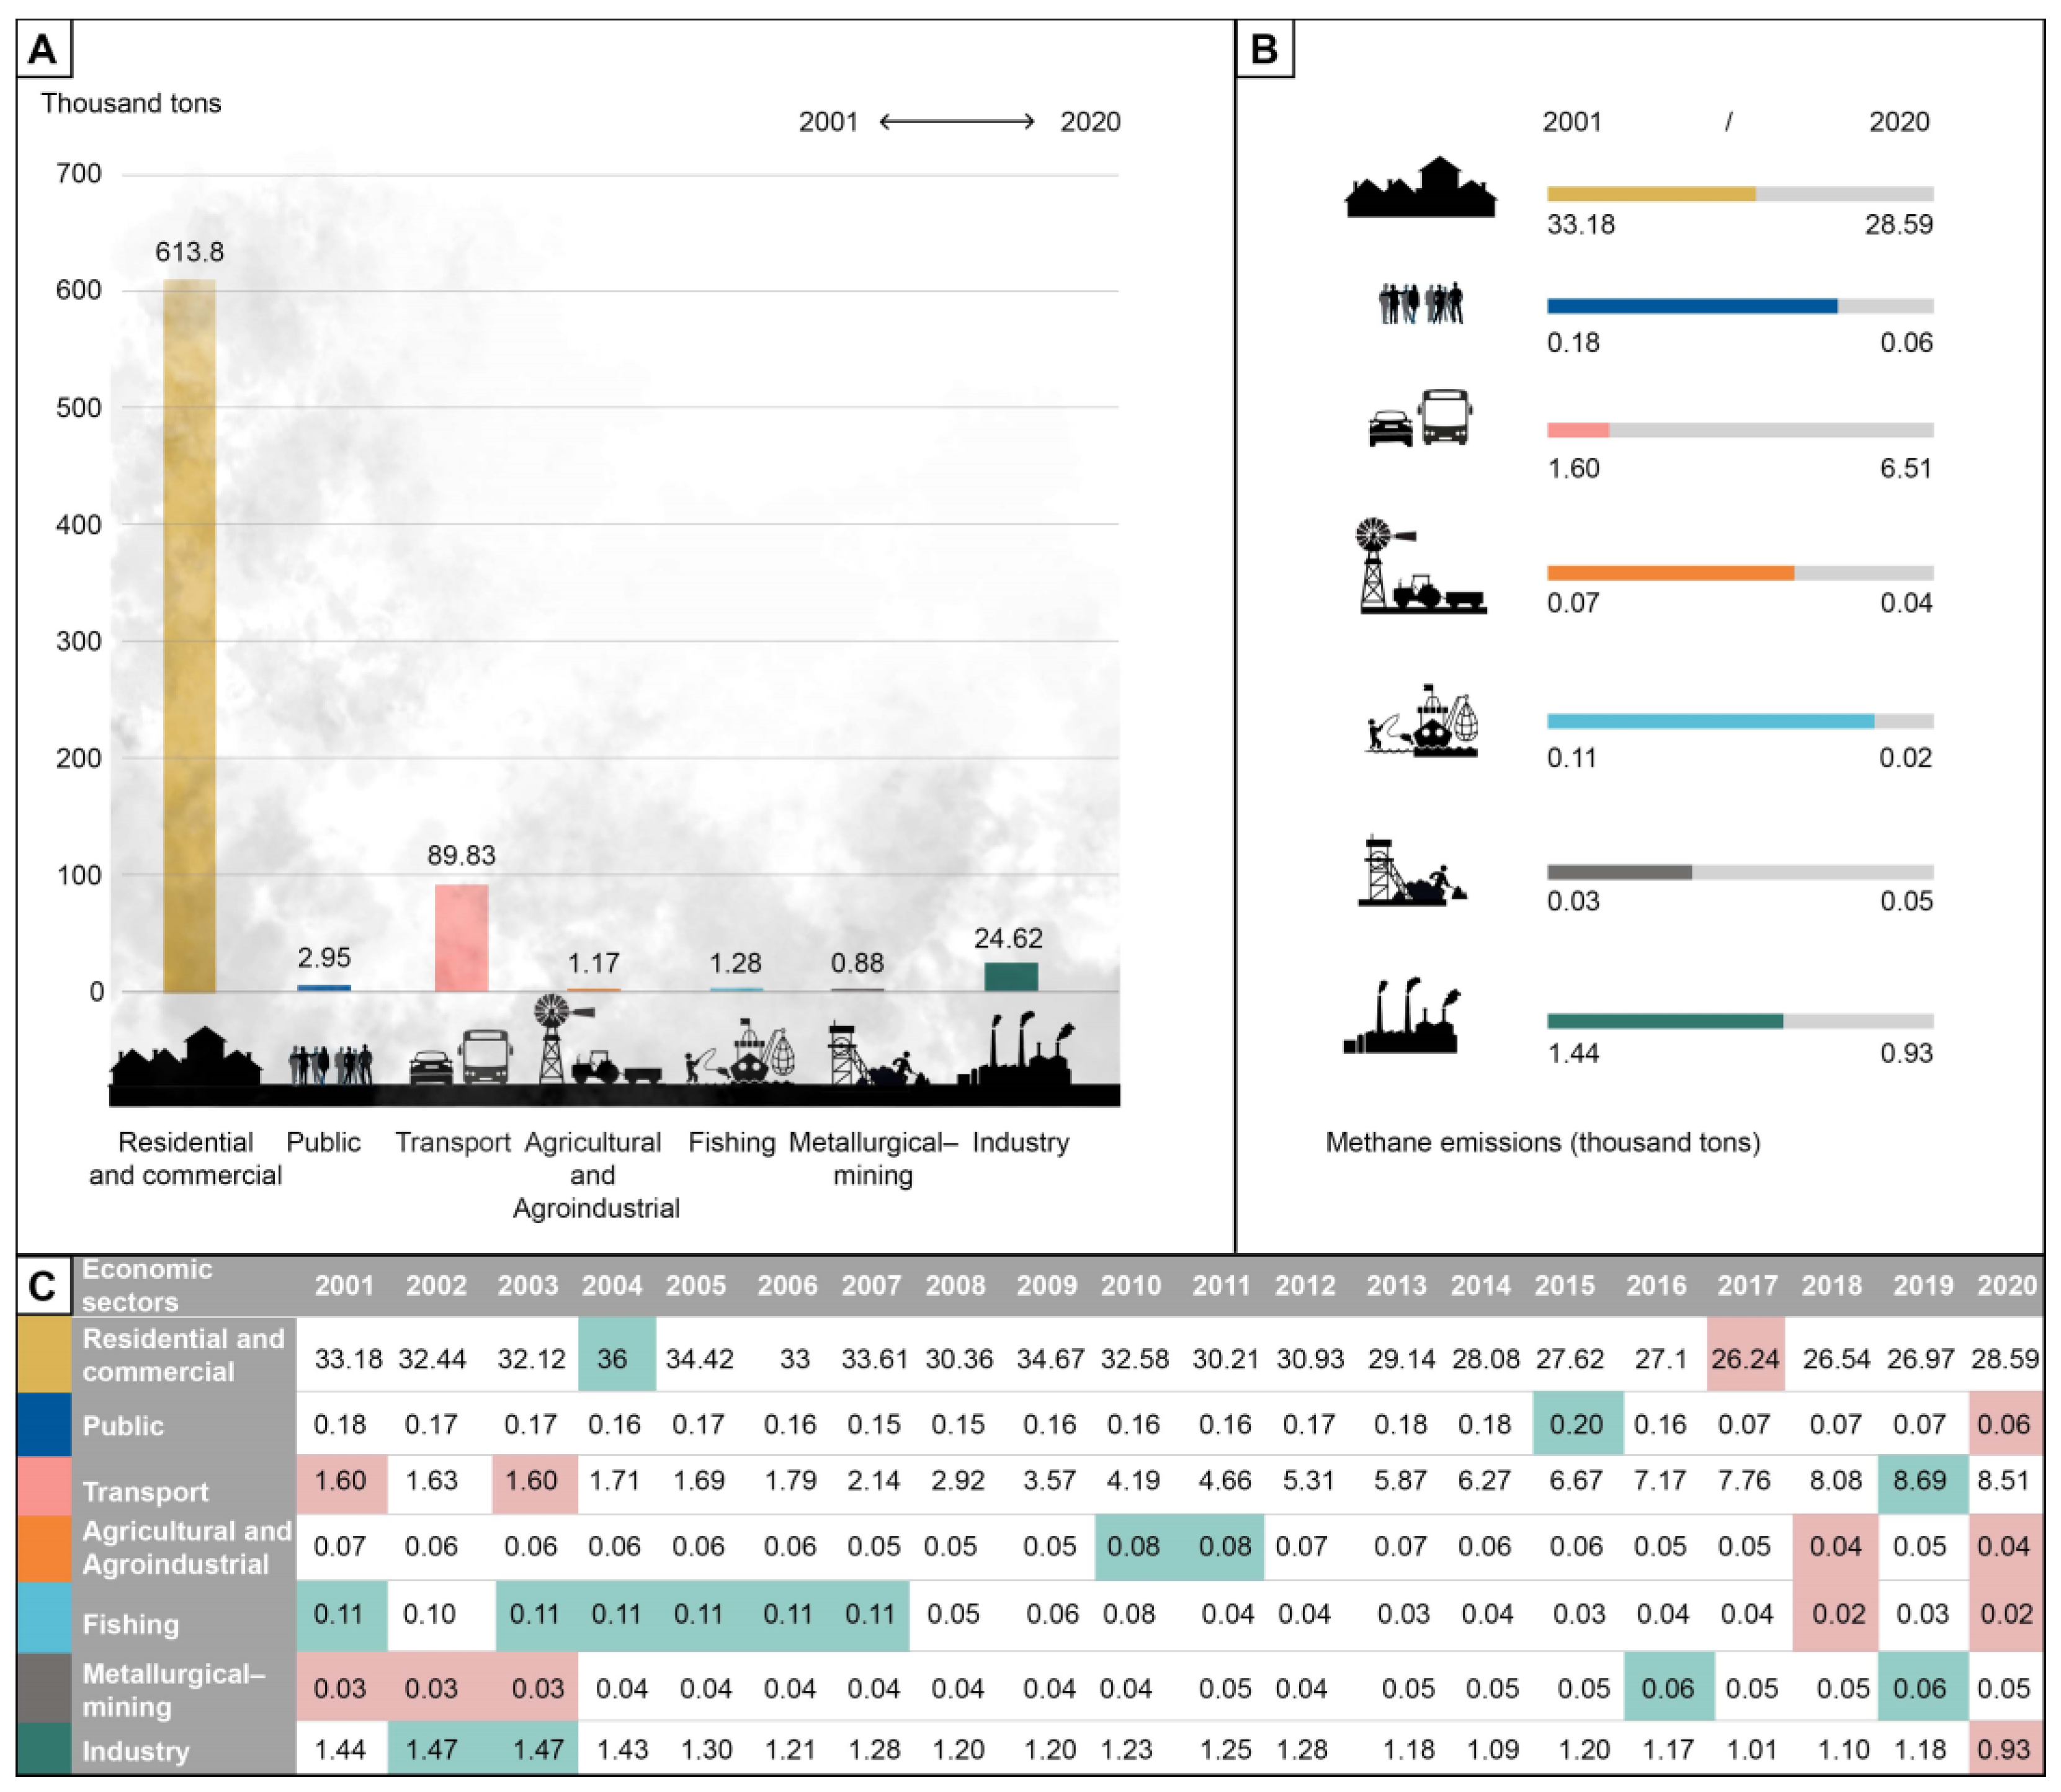
The projections for 2025 show a sustained increase.
The steady rise in carbon dioxide, primarily fueled by economic activities and our lifestyles, will continue to cause temperature and precipitation-related issues. These outcomes are concerning due to the ongoing sustained growth in carbon dioxide emissions. The correlation coefficient stands at a high, positive, and direct 0.925, with a determination coefficient of 0.854.

3.1.3. Methane

The release of CH4 is the result of burning fossil fuels, livestock farming, and the excessive use of agrochemicals in agriculture [23].
Figure 7 displays methane emission cycles between 2001 and 2020, highlighting its highest peak in 2009 at 39.75 tons and its lowest in 2008 at 34.77 tons. Despite this, its trend is downward (−0.01%) compared to carbon dioxide [25].
Figure 8 illustrates methane emissions by economic sector during the period 2001–2020. Figure 8A shows that the residential and commercial sector had the highest methane emissions, totaling 613.8 tons. It is followed by the transportation sector, with a total of 89.83 tons in emissions, while the industrial sector totals 24.62 tons, and the lowest is from the agricultural and agroindustrial sectors with 1.17 tons. On the other hand, Figure 8B compares emissions between the years 2001 and 2020. In 2001, the fishing sector emitted 0.11 tons, a figure that decreased to 0.02 tons in 2020. The transportation sector showed the lowest emission in 2001 with 1.60 tons, contrasting with the 6.51 tons emitted in 2020.
In Figure 8C, the peaks and troughs of emissions per sector and year are detailed: for the residential and commercial sector, the peak was in 2004 and the trough in 2017; the public sector had its highest point in 2015 and the lowest in 2020; transportation reached its peak in 2019 and its minimum in the years 2001 and 2003; agriculture and agroindustry peaked in two years, 2010 and 2011, and reached their lowest point in 2018 and 2020; the fishing sector had its maximum in 2001, 2003 to 2007 and its minimum in 2018 and 2020; the mining-metallurgical sector recorded its highest point in 2016 and 2019 and its minimum from 2001 to 2003; and finally, the industrial sector had its highest peak in 2002 and 2003 and its lowest level in 2020.
The following predictions were obtained:
Y = 37.13 − 0.03 X
Y21 = 37.13 − 0.03 (21) = 36.5
Y22 = 37.13 − 0.03 (22) = 36.47
Y23 = 37.13 − 0.03 (23) = 36.44
Y24 = 37.13 − 0.03 (24) = 36.41
Y25 = 37.13 − 0.03 (25) = 36.38
These projections indicate that the growth is steadily declining.
Greenhouse gases are natural gases present in the atmosphere, and their concentration is due to environmental pollution causing global warming, which greatly impacts on climate change. These results alert us to the issues caused by the continuous and sustained growth in transportation. The correlation coefficient is positive, low, and still direct at 0.124; similarly, the determination coefficient stands at 0.015.

3.2. Temperature, Precipitation, and Climate Change

3.2.1. Climatology

The geographical position of the Peruvian territory, situated between the equator and the Tropic of Capricorn, would theoretically suggest a tropical climate. However, various elements such as the presence of the Peruvian or Humboldt Current, the existence of the Andes mountain range, and the interaction of cyclones and anticyclones significantly contribute to the climatic diversity in the country [26], as detailed in Figure 9, which presents the 38 recognized climate types worldwide according to Thornthwaite’s classification [27]. Furthermore, the Peruvian territory is divided into three main regions: the Coast, Highlands, and Jungle. According to SENAMHI, the Coast has mostly arid and temperate climates and the Highlands have a semi-dry and cold climate, while the Jungle exhibits a warm and highly rainy climate [28].

3.2.2. Temperature

CC entails the alteration of climate patterns due to human activities. Temperature stands as a fundamental dimension for assessing climate.
Figure 10 displays the analysis of average annual temperatures by regions during the period 2005–2021, indicating average annual temperatures of 23.4 °C, 21.4 °C, and 13.1 °C in the Coast, Highlands, and Jungle regions, respectively [25]. On the Coast, there are observed trends of a slow and steady increase, fluctuating between a minimum temperature of 20.1 °C and a maximum of 22.6 °C [25]. In the Highlands, the upward trend is more pronounced, with a minimum of 12.4 °C and a maximum of 14.4 °C recorded. Conversely, in the Jungle, a rising trend is identified, with a minimum temperature of 22.7 °C and a maximum of 25.7 °C [25].
These analyses reveal increases of 3.98, 6.67, and 1.29 in the temperatures of the Coast, Highlands, and Jungle regions, respectively, indicating significant changes during the evaluated period [25].
The following projections were obtained for the average annual temperature in the Coast region for the period 2022–2025:
Y = 20.63 + 0.084 X
Y22 = 20.63 + 0.084(18) = 22.14
Y23 = 20.63 + 0.084(19) = 22.23
Y24 = 20.63 + 0.084(20) = 22.31
Y25 = 20.63 + 0.084(21) = 22.39
The following projections were obtained for the average annual temperature in the Highlands region for the period 2022–2025:
Y = 12.49 + 0.084 X
Y22 = 12.49 + 0.084(18) = 13.70
Y23 = 12.49 + 0.084(19) = 13.76
Y24 = 12.49 + 0.084(20) = 13.83
Y25 = 12.49 + 0.084(21) = 13.90
The following projections were obtained for the average annual temperature in the Jungle region for the period 2022–2025:
Y = 22.98 + 0.044 X
Y22 = 22.98 + 0.044 (18) = 23.77
Y23 = 22.98 + 0.044(19) = 23.82
Y24 = 22.98 + 0.044(20) = 23.86
Y25 = 22.98 + 0.044(21) = 23.90
The projections in all three regions show a sustained increase.
Figure 11 displays an analysis by department, revealing the average temperatures of each one [25]. Loreto stands out as the department with the highest average temperature, recording 27.40 °C, while Pasco presents the lowest average with 5.30 °C [25]. Additionally, the highest temperature peaks in Loreto were observed in the years 2005, 2010, and 2020, reaching 28.1 °C, 27.6 °C, and 27.6 °C, respectively [25]. In contrast, Pasco experienced its lowest temperatures in the years 2006, 2007, and 2012, recording 4.8 °C, 5 °C, and 5 °C, respectively [25].

3.2.3. Precipitation

During an El Niño episode, meteorological conditions in the national territory are affected, causing abnormalities in rainfall and air temperatures, especially on the western slope of the Peruvian Andes [29]. Precipitation increases in the northern areas of the Coast region and, depending on its intensity, can extend to the central and southern areas of the Coast region, from Tumbes to Lima and Ica. This triggers the formation of the Seasonally Dry Forest of the plain, with sparsely spaced trees like the “algarrobo”, influenced by El Niño [30]. Exceptional El Niño events also generate temporary lakes and lagoons in the Sechura Desert, benefiting the local population [31].
Since 1981, two major El Niño–Southern Oscillation episodes have been recorded, in 1982–1983 and 1997–1998, alongside a more recent event known as the Coastal El Niño in 2017. In the last two centuries, only the year 1925, followed by 1891 (the most intense of the last century), compete as Extraordinary El Niño phenomena [31]. However, the accumulated precipitation in 1925 did not reach even half of what was recorded in 1983. The floods in the northern Coast area of Peru were more severe during 1983 than in any year since 1891 [32].
Figure 12A illustrates that during the 1982–1983 El Niño phenomenon, significant rainfall occurred on the western slopes of the Andes and the coastal plain of southern Ecuador from November to December 1982 until June 1983 [33]. The rainfall in northern Peru began in January and persisted until June. On the northern coast, approximately 3000 mm of rainfall accumulated between September and May. Specifically, Piura experienced a peak of 170 mm/day in April 1983, with an annual total of 2340 mm and a flow rate of 3500 m3/s in the Piura River [31]. At the Rica Playa meteorological station in Tumbes, 5051 mm was recorded, representing an 1860% anomaly compared to the multi-year average of 257 mm for the same period [34]. On the northern coast, rainfall reached up to 3900 mm in Lancones (Piura) and 45 mm in Punta Atico (Arequipa) from June 1997 to May 1998 [34].
Figure 12B illustrates that during the 1997–1998 El Niño phenomenon, the main characteristic was the exceptional increase in rainfall on the Peruvian Coast, especially in the north, surpassing even the September–April phase of the 1982–1983 El Niño [35]. On the northern coast, rainfall reached up to 3900 mm in Lancones (Piura) and 45 mm in Punta Atico (Arequipa) between June 1997 and May 1998 [34].
In Tumbes, rainfall began in November 1997 and intensified in February 1998, with an accumulated total of 701 mm, representing a 1945% anomaly [35]. In Piura, rainfall peaked in January 1998, with notable accumulations in various areas, such as 458.7 mm in Talara, 773.8 mm in Miraflores, 692 mm in Mallares, and 1095.2 mm in Chulucanas [35]. The Piura River, with a flow rate of 4300 m3/s, caused significant damage, including the destruction of two bridges [31].
In Lambayeque, rainfall anomalies of up to 1500% were detected in its northern and central areas. Excesses of over 2500% were recorded in Reque, Chiclayo, and surrounding areas, and 3000% in Ferreñafe, Jayanca, Motupe, Olmos, and areas near Piura. Additionally, in the southeast (Nueva Arica, Oyotún, El Espinal, and nearby regions), rainfall exceeded 2000% of normal levels [35].
Figure 12C illustrates the 2017 coastal El Niño, displaying intense rainfall along the western slopes of the Andes, particularly in the northern and central sectors, notably concentrated in February and March. Cities like Piura, Chiclayo, Trujillo, and Huarmey witnessed exceptional rainfall, surpassing historical records of El Niño events. Throughout the 2017 summer, precipitation accumulated to between 500 and 1000 mm in Tumbes, over 1500 mm in coastal areas of Piura, around 700 mm in Lambayeque, and approximately 300 mm on the La Libertad coast [36]. Though the rainfall amounts were lower compared to the El Niño of 1982–1983 and 1997–1998, in some areas, they matched these events in just 10 weeks. The event highlighted drastic changes in conditions in the Eastern Pacific, marked by a significant rise in sea temperatures.
Figure 12D provides a comprehensive overview of the impacts generated by El Niño across different regions of the country. These impacts span a wide range of sectors, from hydroclimatic systems to fishing, agriculture, and forestry, and even effects on public health and transportation infrastructure [37]. Among the positive effects, reduced frost occurrences in certain areas of the Highlands due to warmer marine temperatures are observed, along with the appearance of pelagic species in fishing. However, negative impacts such as accelerated glacier retreat and the displacement of anchovy shoals are noted. In the agricultural sector, rains favor rice cultivation and livestock but decrease potato production and affect meat and milk production and infrastructure [37]. These phenomena also impact the forest resources, with beneficial regeneration but a high risk of forest fires. Concerning public health, there is an increase in diseases and damage to basic sanitation infrastructure. Transportation infrastructure is affected by road and bridge collapses. These data highlight the diversity of El Niño’s effects in the country [37].
In contrast to the El Niño phenomenon, characterized by the increase in sea temperature and the consequent presence of heatwaves, the La Niña Phenomenon manifests with lower temperatures, the intensity of which has various impacts on productive sectors such as agriculture and fisheries [38]. La Niña triggers an increase in the transport of moisture from the northern tropical Atlantic and the Caribbean Sea towards the western Amazon basin, along with a weakening of the South American Monsoon. These mechanisms result in an escalation of moisture transport convergence in the Peruvian Amazon basin, as evidenced during the period from November 2011 to April 2012, leading to the highest recorded flow in the Amazon River [39].
Figure 13A reveals that, during the period from February to April 2007, there were precipitation events with a notably high anomaly, ranging from 30 mm to 550 mm. Nationally, variations are observed in the departments of the Sierra, ranging from 60 mm to 120 mm, while in Madre de Dios and Cusco, similar variations are noted but with higher anomalies, ranging between 210 mm and 300 mm. In contrast, the northern Peruvian coast records lower values, with Tumbes and Piura being the lowest, with anomalies ranging from −550 mm to −300 mm. In comparison, the Peruvian jungle exhibits values from −30 mm to −300 mm [40].
In Figure 13B, a record of coastal La Niña events is presented from 1985 to 2022. It is highlighted that in the year 2013, the La Niña phenomenon reached its maximum magnitude in May, classified as strong. Events occurring between 1985 and 1996, as well as between 2007 and 2010, are considered to be of moderate magnitude, while the remaining events are categorized as weak [41].
Figure 13C illustrates the effects of the La Niña phenomenon. During its occurrence, there is a shortage of rainfall on the coast and an increase in precipitation and low temperatures in the Sierra and jungle. Furthermore, the decrease in air temperature, along with other climatic factors such as increased humidity and wind speed, intensifies the sensation of cold among the coastal population. Consequently, coastal agriculture is affected, especially for producers dedicated to the cultivation of corn, potatoes, barley, rice, bananas, wheat, and beans. In the fishing sector, schools of fish decrease in number and move away from the coast [42].
In 2013, former Conveagro director Reynaldo Trinidad explained that this phenomenon could lead to more intense droughts, causing negative impacts on crops in the coastal and Andean regions. Crops dependent on water, such as rice and sugarcane, are particularly affected, emphasizing the need to prioritize the planting of more resistant crops, such as hard yellow corn, wheat, and even quinoa. Regarding the fishing sector, it was emphasized that La Niña, on the contrary, could promote the recovery of anchovy biomass in Peruvian waters, given its preference for colder temperatures [38].
Precipitation is a dimension that allows the measurement of climate, which is why the average annual precipitation by regions was analyzed during the period 2005–2019.
Figure 14 shows the average annual precipitation reaching 61.8 mm, 720.6 mm, and 1644.4 mm in the Coast, Highlands, and Jungle regions, respectively. In the coastal area, the precipitation is more prominent during the summer season, varying from lows of 22.3 mm to a peak of 174.1 mm in the year 2017 [25]. On the other hand, in the Highlands, precipitation ranged between a minimum of 570 mm and a maximum of 834.3 mm, while in the Jungle, it ranged from 1156 mm to a maximum of 2093 mm [25]. During this period, an increase of 135.74 mm, 34.4 mm, and 53.42 mm was identified in the Coast, Highlands, and Jungle regions, respectively. Moreover, the total precipitation was calculated as 926.40 mm in the Coast region, 10,809.60 mm in the Highlands, and 24,666.10 mm in the Jungle [25].
The following projections were obtained for the average annual precipitation in the Coast region from 2020 to 2025:
Y = 23.96 + 4.488 X
Y20 = 23.96 + 4.488 (16) = 95.77
Y21 = 23.96 + 4.488 (17) = 100.26
Y22 = 23.96 + 4.488 (18) = 104.74
Y23 = 23.96 + 4.488 (19) = 209.23
Y24 = 23.96 + 4.488 (20) = 113.72
Y25 = 23.96 + 4.488 (21) = 118.208
Y25 = 20.63 + 0.084(21) = 22.39
The following projections were obtained for the average annual precipitation in the Highlands region from 2020 to 2025:
Y = 650.843 + 8.725 X
Y20 = 650.843 + 8.725 (16) = 790.44
Y21 = 650.843 + 8.725 (17) = 799.17
Y22 = 650.843 + 8.725 (18) = 807.89
Y23 = 650.843 + 8.725 (19) = 816.62
Y24 = 650.843 + 8.725 (20) = 825.34
Y25 = 650.843 + 8.725 (21) = 834.07
The following projections were obtained for the average annual precipitation in the Jungle region for the period 2022–2025:
Y = 1377.843 + 8.775 X
Y20 = 1377.843 + 8.775 (16) = 1911.04
Y21 = 1377.843 + 8.775 (17) = 1944.37
Y22 = 1377.843 + 8.775 (18) = 1977.70
Y23 = 1377.843 + 8.775 (19) = 2011.03
Y24 = 1377.843 + 8.775 (20) = 2044.36
Y25 = 1377.843 + 8.775 (21) = 2077.68
The projections across the three regions exhibit a sustained upward trend.
Figure 15 displays a detailed analysis by department, revealing the average precipitation for each department from 2005 to 2019. Loreto stands out as the department with the highest average from 2005 to 2019, recording 2696.31 mm, while Lima presents the lowest average with 10.68 mm [25]. Additionally, the highest precipitation peaks in Loreto were observed in 2009, 2013, and 2018, reaching 3312.0 mm, 3149.9 mm, and 2994.5 mm, respectively. In contrast, Lima experienced its lowest precipitation in 2005, 2006, and 2010, registering 3.4 mm, 2.9 mm, and 6.9 mm [25].
Peru houses 71% of South America’s tropical glaciers [43]. The significance of these glaciers in Peru lies in their freshwater reserves, though their sensitivity to climate change is crucial.
Figure 16, portraying the impact of climate change on Peruvian glaciers, illustrates how these phenomena manifest through alterations in precipitation and temperature patterns, resulting in a reduction in their extent [44]. Additionally, the formation of new lagoons significantly increased in size and volume due to glacier retreat, which has led to a diminished contribution of glacial water to the basin [44]. In recent years, these glaciers have undergone accelerated retreat, resulting in the creation of new lagoons, and face the imminent possibility of disappearing in the coming decades [43].
Figure 17A illustrates the glacier coverage from before 1930 (900 km2) to the current situation in 2019 (431 km2) in the mountain range, reflecting a loss of approximately 52.11% of the tropical glaciers, representing a reduction of 469 km2 in ice mass. Meanwhile, Figure 17B shows the results from the inventory of the periods 1962–1970, 2003–2010, and 2012–2019 [25]. During the span from 1962 to 1970 and from 2012 to 2019, there was a reduction of −53.13%, decreasing from 2043.4 km2 to 957.7 km2, with an ice mass loss of 1085.7 km2 [25]. Compared to the 2003–2010 period, a decrease of −45.7% was observed, amounting to 1171.2 km2, with an ice mass loss of 872.2 km2 [25]. The comparison between the 2003–2010 and 2012–2019 periods shows an additional decrease of −18.23%, dropping from 1171.2 km2 to 957.7 km2, with an ice mass loss of 213.5 km2 [25].
In Figure 18, glacial surface and loss are illustrated based on mountain range, of which 18 have persistent glaciers, while two mountain ranges, namely, El Barroso and Volcánica, no longer have glaciers [25]. The glaciers with the largest glacial surface in 2019 were, firstly, the Cordillera Blanca with 431.4 km2, followed by the Vilcanota with 239.3 km2, and finally Amapato with 46.2 km2 [25]. Previously, the glacial surface was larger, resulting in a percentage decrease in the glacial surface. The glacial area of the Cordillera Blanca was reduced from 724.4 km2 to 431.4 km2 in 2019, representing a 40.45% decrease since 1962. Meanwhile, the glacial area of Vilcanota was reduced from 418.4 km2 to 239.3 km2, equivalent to a reduction of 42.81%. Lastly, the Amapato mountain range saw a decrease in its glacial area by 68.51% from 1962 to 2019, decreasing from 146.7 km2 to 46.2 km2. On the other hand, La Raya had the smallest glacial coverage from 1962 to 1970 with an area of 11.3 km2. However, the current mountain range with the smallest glacial area is Chila, with 0.2 km2, whose area was previously 33.19 km2 [25]. Of all the mountain ranges, its glacial loss percentage is the highest of all, at 99.41%. In contrast, the Huayhuash mountain range has the smallest variation of 41.41%, decreasing from 85 km2 to 49.8 km2, with a loss of 35.2 km2 [25].

4. Discussion

It is noted that the increase in deforestation rates has resulted in alterations to natural systems, which are atmospheric and climatic patterns that exacerbated the devastating impacts of natural phenomena [45]. Additionally, the effect of deforestation on climate change in Ecuador between 1990 and 2020 was estimated using the Johansen cointegration test, a VAR model, a VEC model, and Granger causality to examine the short- and long-term relationships and the direction of causality of the variables. A causal relationship was determined from agriculture to deforestation, in conjunction with livestock farming and climate change [46].
According to an empirical reference, specifically the study by Panday et al. [47], there was an interest in relating these two variables: climate change and deforestation. Tree felling emits large amounts of CO2 and H2O, which are two of the greenhouse gases that contribute most to climate change, as these gases absorb solar infrared radiation, increasing and retaining heat in the atmosphere. We can perceive a direct relationship between the increase in temperature and the proportion of CO2 in the atmosphere. What happens with these gases is that they recreate a greenhouse effect on Earth and, in fact, bear the same name. There are questions about how the process works. When sunlight reaches us, much of it is reflected back into outer space, a phenomenon known as “albedo”.
Regarding the average net annual emissions from burned forests over a 30-year period, these were 1.52 MgCO2 ha −1 and −1, representing approximately 36% of the estimated annual sink of old secondary forests in tropical forests of America.

5. Conclusions

Deforestation, which implies the loss of forest areas due to the change in land use for different purposes such as agriculture, grasslands, human settlements, and other uses such as mining or infrastructure, represents 92% (79.8 MtCO2e) of the Land Use sector of Land, Land Use Change, and Forestry (USCUSS). In addition, changes in forest biomass due to the consumption of firewood, wood, and other elements constitute the remaining 8% (6.9 MtCO2e). Additionally, greenhouse gas emissions due to land use change averaged 88.8 MTCO2e per year.
Greenhouse gases, especially carbon dioxide and methane, contribute significantly to climate change, a phenomenon that is increasingly evident due to our lifestyles.
The evidence of the increase in the average temperature of the planet is increasingly solid. The world climate is changing and Peru is no stranger to this reality, being a country highly vulnerable to these changes. The average annual temperature in the Coast region ranges between 21.1 and 22.6 °C, in the Sierra region from 12.6 to 14.4 °C, and in the Jungle region from 22.7 to 25.7 °C.
The average annual precipitation on the Coast varies between 22.3 and 174.1 mm, in the Sierra region from 573.2 to 834.3 mm, and in the Jungle region from 1156 to 2093 mm.
The Cordillera Blanca has lost on average approximately 40.5% of its total glacier coverage and between 1996 and 2019 the number of tropical glaciers has been reduced by 28.17%.

Author Contributions

Investigation, V.I.T.A.; revision, F.A.C.; software, M.V.-G.; methodology, D.E.; formal analysis, J.V.C. All authors have read and agreed to the published version of the manuscript.

Funding

This research received no external funding.

Institutional Review Board Statement

Not applicable.

Informed Consent Statement

Not applicable.

Data Availability Statement

All data are in the manuscript.

Conflicts of Interest

The authors declare no conflicts of interest.

References

  1. Gitay, H.; Suárez, A.; Watson, R.; Dokken, D. Cambio Climático y Biodiversidad; IPCC: Geneva, Switzerland, 2002. Available online: https://archive.ipcc.ch/pdf/technical-papers/climate-changes-biodiversity-sp.pdf (accessed on 13 January 2023).
  2. Pinto-Bazurco, J. Los Retos del Cambio Climático: Un Estudio Sobre las Respuestas Legales del PERÚ; Fondo Editorial Universidad de Lima: Lima, Peru, 2019; p. 70. [Google Scholar]
  3. Pachauri, R.; Meyer, L.; Barros, V.R.; Broome, J.; Cramer, W.; Christ, R.; Church, J.A.; Clarke, L.; Dahe, Q.; Dasgupta, P.; et al. Cambio Climático 2014; IPCC: Geneva, Switzerland, 2014; p. 2. Available online: https://www.ipcc.ch/site/assets/uploads/2018/02/SYR_AR5_FINAL_full_es.pdf (accessed on 13 January 2023).
  4. Lábaque, M.; Reyna, T.; Valdés, J.; Reyna, S. Aproximación a los Efectos del Cambio Climático en las Precipitaciones en la Provincia de Córdoba; ISEA: Brighton, UK, 2019; Available online: https://eidipa.congresos.unc.edu.ar/wp-content/blogs.dir/45/files/sites/45/2021/04/Trabajo-8-Labaque-et-al.pdf (accessed on 16 January 2023).
  5. Guevara, A.; Lara, J. Desastres Naturales, Cambio Climático y Efectos Macroeconómicos: Una Revision de la Evidencia; Cemefi: Mexico City, Mexico, 2010; Available online: https://ri.ibero.mx/bitstream/handle/ibero/1504/GSA_Art_07.pdf?sequence=1 (accessed on 16 January 2023).
  6. Rojas, H. Conocimiento Sobre el Cambio Climático de los Estudiantes que Culminan la Educación Básica Regular en el Distrito de San Buenaventura; Espiral: Hollywood, FL, USA, 2021; p. 42. Available online: https://revistasinvestigacion.unmsm.edu.pe/index.php/espiral/article/view/18781/17210 (accessed on 18 January 2023).
  7. Calixto, R. Un Estudio Desde las Representaciones Sociales; Educare: Leamington Spa, UK, 2022; p. 4. Available online: https://dialnet.unirioja.es/servlet/articulo?codigo=8545112 (accessed on 20 January 2023).
  8. ¿Qué es el Cambio Climático? ONU. Available online: https://www.un.org/es/climatechange/what-is-climate-change (accessed on 22 January 2023).
  9. Rodríguez, R. Dr. Rodríguez: “Perú es uno de los Países más Vulnerables al Cambio Climático”; UDEP: Piura, Peru, 2021; Available online: https://www.udep.edu.pe/hoy/2021/11/dr-rodriguez-peru-es-uno-de-los-paises-mas-vulnerables-al-cambio-climatico/#:~:text=Los%20m%C3%A1s%20afectados%20son%20el%20energ%C3%A9tico%2C%20industrial%2C%20transporte,climas%20%2838%20seg%C3%BAn%20un%20%C3%BAltimo%20reporte%20de%20Senamhi%29 (accessed on 24 January 2023).
  10. Sequías, Tormentas e Inundaciones: El Agua y el Cambio Climático Dominan la Lista de Desastres; ONU: New York, NY, USA, 2021. Available online: https://news.un.org/es/story/2021/07/1494632 (accessed on 24 January 2023).
  11. Perú es Considerado uno de los Países Más Afectados por el Cambio Climático; Stakeholders: Chatswood, Australia, 2023; Available online: https://stakeholders.com.pe/noticias-sh/peru-es-considerado-uno-de-los-paises-mas-afectados-por-el-cambio-climatico/?utm_source=Stakeholders&utm_campaign=a00f828c88-EMAIL_CAMPAIGN_2023_01_12_12_20_COPY_01&utm_medium=email&utm_term=0_-c630d98c47-%5BLIST_EMAIL_ID%5D (accessed on 26 January 2023).
  12. Vargas, P. El Cambio Climático y sus Efectos en el Perú; SINIA: San Francisco, CA, USA, 2009; Available online: https://sinia.minam.gob.pe/documentos/cambio-climatico-sus-efectos-peru (accessed on 28 January 2023).
  13. Fernández Chavesta, J.; Romero Gonzales, E. Economía Básica Para la Gestión Empresarial, 3rd ed.; Manuel, F.C.J., Ed.; First Workplaces: Madrid, Spain, 2018; Available online: http://isbn.bnp.gob.pe/catalogo.php?mode=detalle&nt=97675 (accessed on 30 January 2023).
  14. Munier, N. Preparación Técnica, Evaluación Económica y Presentación de Proyectos; Astrea: Buenos Aires, Argentina, 1979. [Google Scholar]
  15. La Barreda, S. Deforestación en la Región Amazónica del Perú: Situación y Perspectivas. M+A. 2021; Volume 21, pp. 20–39. Available online: https://www.ucm.es/iuca/file/articulo_2_m-a_2021-1?ver (accessed on 30 January 2023).
  16. MINAM. La Conservación de Bosques en el Perú. 2016. Available online: https://cdn.www.gob.pe/uploads/document/file/12030/11-la-conservacion-de-bosques-en-el-peru.pdf?v=1530548434 (accessed on 2 February 2023).
  17. MINAM. Estrategia Nacional sobre Bosques y Cambio Climático. 2016. Available online: https://www.minam.gob.pe/wp-content/uploads/2016/07/ESTRATEGIA-NACIONAL-SOBRE-BOSQUES-Y-CAMBIO-CLIM%C3%81TICO-DECRETO-SUPREMO-007-2016-MINAM11.pdf (accessed on 4 February 2023).
  18. INEI. IV Censo Nacional Agropecuario. 2012. Available online: https://proyectos.inei.gob.pe/web/DocumentosPublicos/ResultadosFinalesIVCENAGRO.pdf (accessed on 6 February 2023).
  19. UNESCO. UNESCO Propicia Dialogo Multiactor Sobre la Importancia de los Bosques en la Mitigación del Cambio Climático en Perú. 2023. Available online: https://www.unesco.org/es/articles/unesco-propicia-dialogo-multiactor-sobre-la-importancia-de-los-bosques-en-la-mitigacion-del-cambio (accessed on 6 February 2023).
  20. MINAM. Contribuciones Determinadas a Nivel Nacional del Perú. 2021. Available online: https://cdn.www.gob.pe/uploads/document/file/1675213/Actualizaci%C3%B3n%20de%20las%20NDC%20del%20Per%C3%BA%20al%202030.pdf?v=1663622045 (accessed on 8 February 2023).
  21. SERFOR. Cobertura y Perdida de Bosque Húmedo Amazónico al 2020. 2020. Available online: https://geobosques.minam.gob.pe/geobosque/descargas_geobosque/perdida/documentos/Reporte_de_deforestacion_bosques_amazonicos_2020.pdf?Tue%20Feb%2021%202023%2019:14:55%20GMT-0500%20(hora%20est%C3%A1ndar%20de%20Per%C3%BA) (accessed on 10 February 2023).
  22. PNCBMCC. Cobertura y Perdida de Bosque Húmedo Amazónico al 2021. 2021. Available online: https://geobosques.minam.gob.pe/geobosque/descargas_geobosque/perdida/documentos/Reporte_Cobertura_y_Perdida_de_Bosque_Humedo_Amazonico_2021.pdf?Wed%20Oct%2011%202023%2004:47:36%20GMT-0500%20(hora%20est%C3%A1ndar%20de%20Per%C3%BA) (accessed on 10 February 2023).
  23. Ferreras, J.; Estada, P.; Herrero, T.; Velásquez, A.; Jiménez, G.; Santos, A.; Solís, E.; García, E. Educación Ambiental y Cambio climático. Consejería de Medio Ambiente Junta de Andalucía. 2011; p. 12. Available online: http://aeclim.org/wp-content/uploads/2016/01/guia-didactica-ed-ambiental-y-cambio-climatico.pdf (accessed on 12 February 2023).
  24. Clickmica. Gases de Efecto Invernadero y Calentamiento Global. Available online: https://clickmica.fundaciondescubre.es/recursos/infografias/gases-de-efecto-invernadero-y-calentamiento-global/ (accessed on 14 February 2023).
  25. INEI. Perú: Anuario de Estadísticas Ambientales 2022. 2022. Available online: https://www.inei.gob.pe/media/MenuRecursivo/publicaciones_digitales/Est/Lib1877/libro.pdf (accessed on 16 February 2023).
  26. MINAM. Informe Nacional del Estado del Ambiente 2012–2013. 2014. Available online: https://repositoriodigital.minam.gob.pe/handle/123456789/422 (accessed on 18 February 2023).
  27. SENAMHI. Mapa Climático del Perú. Available online: https://www.senamhi.gob.pe/?p=mapa-climatico-del-peru#:~:text=Entre%20los%20climas%20de%20mayor,y%20c%C3%A1lido%20en%20la%20selva (accessed on 20 February 2023).
  28. SENAMHI. Compendio de Clima y Salud: Resúmenes Ejecutivos. 2021. Available online: https://repositorio.senamhi.gob.pe/handle/20.500.12542/1350 (accessed on 22 February 2023).
  29. SENAMHI. El Fenómeno del Niño en el Perú. 2014. Available online: https://repositorio.senamhi.gob.pe/handle/20.500.12542/874 (accessed on 24 February 2023).
  30. MINAM. Mapa Nacional de Ecosistemas del Perú; SINIA: San Francisco, CA, USA, 2019; Available online: https://sinia.minam.gob.pe/mapas/mapa-nacional-ecosistemas-peru (accessed on 26 February 2023).
  31. Woodman, R. El Fenómeno el Niño y el Clima en el Perú; IGP: Mumbai, India, 1997; Available online: https://repositorio.igp.gob.pe/handle/20.500.12816/587#:~:text=El%20fen%C3%B3meno%20el%20Ni%C3%B1o%20y%20el%20clima%20en,de%20Conferencias%20de%20la%20Primera%20Legislatura%20Ordinaria%2C%201997%22 (accessed on 28 February 2023).
  32. Horel, J.; Cornejo, A. Convection along the Coast of Northern Peru during 1983: Spatial and Temporal Variation of Clouds and Rainfall; AMS: London, UK, 1986; Available online: https://journals.ametsoc.org/view/journals/mwre/114/11/1520-0493_1986_114_2091_catcon_2_0_co_2.xml (accessed on 2 March 2023).
  33. SENAMHI. Atlas de Temperaturas del Aire y Precipitación del Perú. 2021. Available online: https://www.gob.pe/institucion/senamhi/informes-publicaciones/2187243-atlas-de-temperatura-del-aire-y-precipitacion-del-peru (accessed on 4 March 2023).
  34. SENAMHI. Escenarios Climáticos en el Perú Para el año 2030. 2009. Available online: https://repositorio.senamhi.gob.pe/handle/20.500.12542/141 (accessed on 6 March 2023).
  35. SENAMHI. El Evento el Niño Oscilación sur 1997–1998: Su Impacto en el Departamento de Lambayeque. 2004. Available online: https://repositorio.senamhi.gob.pe/handle/20.500.12542/444#:~:text=%22En%20la%20presente%20investigaci%C3%B3n%20denominada%20%E2%80%9CEl%20evento%20El,en%20el%20Per%C3%BA%20y%20el%20departamento%20de%20Lambayeque (accessed on 8 March 2023).
  36. SENAMHI. Informe Técnico El Niño Costero 2017 Condiciones Termo—Pluviometricas a Nivel Nacional SENAMHI Perú 2017; SIGRID: Stockholm, Sweden, 2017; Available online: https://sigrid.cenepred.gob.pe/sigridv3/documento/3656 (accessed on 10 March 2023).
  37. SENAMHI. El Fenómeno El Niño en el Perú; MINAM: Lima, Peru, 2014; Available online: https://www.minam.gob.pe/wp-content/uploads/2014/07/Dossier-El-Ni%C3%B1o-Final_web.pdf (accessed on 12 March 2023).
  38. García, E. Fenómeno La Niña ya Está en el Perú; Gestión: Madrid, Spain, 2013; Available online: https://gestion.pe/economia/fenomeno-nina-peru-43293-noticia/ (accessed on 23 February 2024).
  39. Espinoza, J.; Lavado, W. Impactos de el Niño y la Niña en las Lluvias del Perú (1965–2007); SENAMHI: Lima, Peru, 2014; Available online: https://repositorio.senamhi.gob.pe/bitstream/handle/20.500.12542/97/Lavado-casimiro-2014-Impactos-de-el-nino-y-la-nina-en-la.pdf?sequence=1&isAllowed=y (accessed on 24 February 2024).
  40. SENAMHI. Escenarios de Lluvia; SENAMHI: Lima, Peru, 2007; Available online: https://www.senamhi.gob.pe/servicios/main.php?dp=lima&p=escenarios-lluvia (accessed on 23 February 2024).
  41. ENFEN. Eventos El Niño y La Niña Costeros; IGP: Mumbai, India, 2012; Available online: http://met.igp.gob.pe/elnino/lista_eventos.html (accessed on 26 February 2024).
  42. Valdivia, D. ¿Se Viene La Niña en Perú? Enfen Explica lo Que Podría Suceder en los Siguientes Meses; Infobae: Buenos Aires, Argentina, 2024; Available online: https://www.infobae.com/peru/2024/01/17/se-viene-la-nina-en-peru-enfen-senala-lo-que-ocurrira-en-el-pais-en-los-proximos-meses/#:~:text=Cuando%20se%20presenta%20La%20Ni%C3%B1a,la%20sierra%20y%20la%20selva (accessed on 24 February 2024).
  43. INAIGEM. Informe de la Situación de los Glaciares y Ecosistemas de Montaña en el Perú. 2017. Available online: https://www.inaigem.gob.pe/wp-content/uploads/2019/04/Interiores-Informe-anual-2017.pdf (accessed on 14 March 2023).
  44. Ortiz, B. Cambio Climático | Los Glaciares Peruanos Están en Camino Inminente a Desaparecer; El Comercio: Lima, Peru, 2021; Available online: https://elcomercio.pe/tecnologia/ciencias/medio-ambiente-cambio-climatico-los-glaciares-peruanos-estan-en-camino-inminente-a-desaparecer-noticia/ (accessed on 16 March 2023).
  45. Ali, A.; Riaz, S.; Iqbal, S. La deforestación y sus impactos en el cambio climático Una visión general de Pakistán. Artículos Sobre EL Cambio Glob. 2014, 21, 51. [Google Scholar] [CrossRef]
  46. Leon, M.; Cornejo, G.; Calderón, M.; González-Carrión, E.; Florez, H. Effect of Deforestation on Climate Change: A Co-Integration and Causality Approach with Time Series. Sustainability 2022, 14, 11303. [Google Scholar] [CrossRef]
  47. Panday, P.K.; Coe, M.T.; Macedo, M.N.; Lefebvre, P.; Castanho, A. AD La deforestación compensa los cambios en el balance hídrico debido a la variabilidad climática en el río Xingu en el este de la Amazonia. J. Hidrol. 2015, 523, 822–829. [Google Scholar] [CrossRef]
Figure 1. The total forest area in Peru.
Sustainability 16 02863 g001
Figure 2. (A) Direct causes of deforestation and degradation of the Amazonian Forests; (A’) Transitory and permanent crops in the Amazonian humid forest; (B) The underlying causes of deforestation and degradation of the Amazonian Forests.
Sustainability 16 02863 g002
Figure 3. The deforested area from 2001 to 2021.
Sustainability 16 02863 g003
Figure 4. Greenhouse gas emissions.
Sustainability 16 02863 g004
Figure 5. Carbon dioxide emissions, 2001 to 2020.
Sustainability 16 02863 g005
Figure 6. (A) Total carbon dioxide emissions by economic sector from 2001 to 2020; (B) Comparison of carbon dioxide emissions by economic sector in 2001 and 2020; (C) Carbon dioxide emissions by economic sector from 2001 to 2020.
Sustainability 16 02863 g006
Figure 7. Methane emissions from 2001 to 2020 in thousands of tons.
Sustainability 16 02863 g007
Figure 8. (A) Total methane emissions by economic sector from 2001 to 2020; (B) Comparison of methane emissions by economic sector in 2001 and 2020; (C) Methane emissions by economic sector from 2001 to 2020.
Sustainability 16 02863 g008
Figure 9. The climatic diversity of Peru: its 38 types of climate.
Sustainability 16 02863 g009
Figure 10. Average annual temperature by region from 2005 to 2021.
Sustainability 16 02863 g010
Figure 11. Average annual temperature per department from 2005 to 2021.
Sustainability 16 02863 g011
Figure 12. (A) The evolution of the El Niño phenomenon in 1983; (B) The evolution of the El Niño phenomenon in 1998; (C) The evolution of the El Niño phenomenon in 2017; (D) Positive and negative impacts of the El Niño phenomenon.
Sustainability 16 02863 g012
Figure 13. (A) La Niña phenomenon anomalies in Peru; (B) Magnitude of the La Niña phenomenon; (C) Effects of the La Niña phenomenon.
Sustainability 16 02863 g013
Figure 14. Average annual precipitation by region from 2005 to 2019.
Sustainability 16 02863 g014
Figure 15. Average annual precipitation by department 2005–2021.
Sustainability 16 02863 g015
Figure 16. The impact of climate change on Peruvian glaciers.
Sustainability 16 02863 g016
Figure 17. (A) Evolution of glacier coverage in the mountain range, 1930, 1970, 1987, 1990, 1996, 2003, 2012, and 2019 glaciers; (B) Loss of glacier surface at the national level, 1962–1970, 2003–2010, 2012–2019.
Sustainability 16 02863 g017
Figure 18. Glacier area and loss in the mountain ranges, 1962–1970, 2003–2010, 2012–2019.
Sustainability 16 02863 g018
Table 1. Deforested areas by department from 2001 to 2021.
DepartmentForest AreaLoss of Forest Area, 2020 [21]%Loss of Forest Area, 2021 [22]%Accumulated Data through 2022 %
Amazonas2,831,731 ha11,541 ha5.684329 ha3.14109,954 ha3.96
Ayacucho209,922 ha2711 ha1.33893 ha0.6521,121 ha0.76
Cajamarca346,762 ha1603 ha0.79384 ha0.2821,262 ha0.77
Cusco3,063,940 ha8858 ha4.365349 ha3.88104,750 ha3.78
Huancavelica17,299 ha172 ha0.0822 ha0.021298 ha0.05
Huánuco1,545,972 ha17,911 ha8.8115,021 ha10.89366,812 ha13.22
Junín1,850,889 ha20,766 ha10.2212,082 ha8.76198,049 ha7.14
La Libertad68,228 ha128 ha0.0625 ha0.021265 ha0.05
Loreto3,5047,942 ha34,77817.1119,829 ha14.37508,027 ha18.31
Madre de Dios7,905,744 ha23,04211.3423,142 ha16.77277,295 ha9.99
Pasco1,388,278 ha86774.275597 ha4.06129,619 ha4.67
Piura41,492 ha680.0325 ha0.023409 ha0.12
Puno1,423,073 ha56012.761891 ha1.3744,502 ha1.60
San Martín3,344,540 ha20,1499.9113,080 ha9.48480,774 ha17.33
Ucayali9,336,773 ha47,26723.2536,306 ha26.31506,424 ha18.25
Total68,422,585 ha203,272 ha100.00137,975 ha100.002,774,561 ha100.00
Disclaimer/Publisher’s Note: The statements, opinions and data contained in all publications are solely those of the individual author(s) and contributor(s) and not of MDPI and/or the editor(s). MDPI and/or the editor(s) disclaim responsibility for any injury to people or property resulting from any ideas, methods, instructions or products referred to in the content.

