1. Introduction
Solar energy has the advantages of cleanliness, safety, relative universality, sufficient resources, and potential low costs, playing an important role in the development of clean energy. New electric power systems are required to develop and utilize photovoltaic energy, which has been widely recognized and applied worldwide as a common form of solar energy resource utilization, and in the long process of its development, it continues to improve material technology, transportation technology and production technology, so as to promote the cross-use of solar photovoltaic technology and other fields, forming a photovoltaic + model.
There are several studies on distributed PV on an international scale. Distributed photovoltaic energy refers to distributed photovoltaic power generation. Photovoltaic power generation is divided into two forms: centralized and distributed. Distributed photovoltaic power generation refers to a form of photovoltaic power generation that is built near the user’s site, operates in a way that is characterized by self-generated self-use on the user’s side, excess electricity coming online, and balanced adjustments in the distribution system. The “PV + model” has mainly been proposed in China, and the same issue is known as “agrivoltaics” and “industrial photovoltaic” in other countries. In the SCI/SSCI literature database, which includes agrivoltaics and industrial photovoltaics as search topics, the earliest agrivoltaics paper was published in 2016, and the first paper on industrial photovoltaic was published even earlier.
By reading the above literature, we found that international research on agricultural and industrial PV is mainly in the following fields: firstly, research on the benefits of “agricultural PV” and “industrial PV”; secondly, research on the technology of combining PV with agriculture and the industry; and thirdly, the economic analysis of agricultural PV and industrial PV. The representative literature is as follows: photovoltaic power can increase the production of various crops, protect plants from the surplus of solar energy, and maintain food supplies [
1]. Agrivoltaics can increase the ecological benefits of AV by improving soil health and biodiversity [
2]. The advantages of agrivoltaic technology are rural electrification, water conservation, increased industrial output, sustainable income generation, and the reduced use of pesticides [
3]. Crops and solar photovoltaics (PV) are combined with agrophotovoltaics to provide sustainable development benefits for land, energy, and water systems [
4]. Installing photovoltaic boards in public buildings is a strategy to meet the demand for residential energy, especially for families without photovoltaic devices for their own use [
5]. In order to accelerate the adoption of the technology, we should clarify the meaning and classification of agrivoltaic technology, develop appropriate standards, and formulate rules and frameworks in favor of agrivoltaic technology, as well as developing programs and policies to stimulate the adoption of agrivoltaic technology [
6]. Agricultural photovoltaic demonstration projects have been carried out all over the world and experience has been gained in various design solutions for commercial use [
7]. The potential effects of agricultural photovoltaic design characteristics on the microclimates of solar farms and solar photovoltaic module surface temperatures were investigated [
8]. Growing crops under photovoltaic (PV) conditions is a huge challenge due to insufficient light transmission [
9]. Various databases and industry standards should be used to optimize and design agricultural power systems [
10]. Insights into the design and implementation of onboard photovoltaic systems for electric vehicles are discussed. Novel and efficient methods to maximize the performance of on-board photovoltaic systems are proposed [
11]. In order to analyze the optimal billing scenario, we compared three billing methods, including plant capacity factor, excess energy conversion, levelized cost of energy (LCOE), net present value (NPV), payback period, and feasibility index (PI) [
12]. The economic viability of investing in industrial PV systems of different sizes (200 kw, 400 kw, 1 mw, and 5 mw) is analyzed in terms of the net present value (NPV) and discounted payback period (DPBT) [
13]. In the case of a photovoltaic self-consumption system in an industrial park in the Basque Country (northern Spain), an economic efficiency analysis found that economic viability depends to a large extent on the compensation generated by the self-consumption of electricity and its injection into the grid, as well as on the assumed changes in the price of electricity [
14]. An economic evaluation methodology and an optimal allocation model for industrial photovoltaic microgrids are proposed using levelized energy costs, emission reduction benefits, and the payback period as economic indicators [
15].
In China, there are more research results on “PV +” and less on technical issues (which is reflected in international research), with representative results as follows: The organic combination of photovoltaic energy and agriculture has given birth to a new model of the integrated development of traditional agriculture and new energy [
16]. According to the comprehensive evaluation value, the seedling suitability of different soybean varieties in a photovoltaic environment was explored [
17]. In the context of the “double carbon” goal, the photovoltaic industry accelerated its development, combined with other industries in power generation, such as planting, animal husbandry, and fisheries, to achieve diversified development. The development of “agricultural light complementarity”, “animal husbandry light complementarity”, “fishing light complementarity” and other models can maximize the composite use of land resources, save land, and achieve a win–win situation of economic and ecological benefits [
18]. According to the different climate, soil, and terrain conditions in different regions, the combination of planting corresponding to medicinal plants and photovoltaic power generation in different regions can provide a feasible path for the construction of new energy and the development of traditional Chinese medicine [
19]. Photovoltaic agricultural greenhouses, as a new type of agricultural planting greenhouse, mainly refers to the installation of solar panels on top of traditional agricultural greenhouses for solar power generation, which can meet the needs of different crops in greenhouses in terms of light, promoting the green, clean, and sustainable development of China’s agriculture [
20]. Based on the analysis of the causes and composition of photovoltaic agriculture, the symbiotic elements, symbiotic efficiency standards, and symbiotic systems of photovoltaic agriculture are studied [
21]. Building photovoltaic power stations in desert areas can not only improve the quality desert land, but also provide high-quality clean power to the local area [
22]. The current situation and typical model of photovoltaic agriculture development in the Hangzhou area were analyzed, and countermeasures were suggested according to the restricting factors and main difficulties of photovoltaic agriculture [
23]. A new design of a distributed power generation scenario was presented, in which citrus is grown under the supplementary light power generation panel. By adding a light transfer film on a supplementary light power generation panel, a useless light wave is transformed into beneficial light wave, increasing the photosynthesis effect of citrus plants and maximizing the proportion of photovoltaic energy on the supplementary light power generation panel [
24].
It can be seen from the above literature that the PV + model only emerged in recent years. In practice, the PV + model has been widely used and received praised, and it has a trend of continuous development. Research on PV + mainly focuses on three aspects: summarizing the effect of the PV + model in agriculture, the industry, energy storage and other aspects; exploring in which fields and industries the photovoltaic + mode can be implemented; and improving implemented of the PV + model.
From the above international and Chinese research results, the future of the photovoltaic + model will form a new direction of development, where there is a lot of room for in-depth research on the economic value of photovoltaic + model. Therefore, it is necessary to analyze the economic value of PV + projects in order to provide a decision-making basis for their development.
There have been many achievements in the study of this model’s economic value, and various methods have been used to measure its economic value in many fields.
The economic value of triadic patents was studied using a regression analysis method [
25]. The economic and social value of forests were studied using a potential function to build a coupling model [
26]. A bio-economic model was used to derive the economic value of target vessels for national sheep breeding [
27]. Economic value was assessed using the travel cost method (TCM) in Kilim Karst Geoforest Park, Langkawi, Malaysia [
28]. The statistical tool of structural equation modeling was used to study economic value of a palm plantation in North Sumatera [
29]. The total value generated by spearfishing tournaments in two areas of eastern Australia was estimated using the travel cost approach [
30], and the economic value and cultural value were compared [
31]. In a sustainability assessment using economic value added [
32], the regression analysis method was adopted to calculate the economic value of patent portfolios [
33], such as The Economic Value of Wind Energy Nowcasting [
34]. The common methods for evaluating the economic value of ecosystem services are compared, such as the market price method, shadow price method, alternative cost method, and equivalent factor method [
35]. The GREET model is used to estimate the pollutant emissions from urban freight roads and rail transportation, creating the opportunity to design an economic value calculation model [
36]. Based on the meta-analysis method, the economic value of grassland ecosystems and other ecosystem services in China was systematically evaluated [
37]. The economic value of the digital economy is summarized from five perspectives, including reducing transaction costs, the relationship between supply and demand, real-time interactions, promoting knowledge diffusion, effectively supporting innovation, and developing a shared economy [
38]. The economic value realization path in environmental attributes of renewable energy power under different mechanisms [
39] and the economic value of forest carbon sink in Shanxi province were estimated using the carbon tax method [
40]. The ecosystem service functions of the cascade reservoirs in the upper reaches of the Yellow River are divided into production and supply, environmental regulation, and recreation. Production and supply and recreation belong to the direct use value, and the economic value is estimated by referencing the market value. The value of the environmental regulation function belongs to the indirect use value, and the economic value is estimated using the shadow engineering method [
41].
The economic value of environmental goods is evaluated suing the method of conditional value [
42]. The economic value evaluation of scenic tourism resources mainly adopts the income reduction method (ICM), recreation cost method (EM), hedonic pricing method (HPM), travel cost method (TCM), and conditional value method (CVM) [
43]. The cost method and Delphi method are used to evaluate the economic value of historical buildings [
44]. The contingent valuation method, the replacement cost approach, and market pricing approach are used to evaluate the economic value of a regional ecological environment [
45]. By compiling the energy table of water resources for an eco-economic system, the contribution rate of water resource energy is calculated to evaluate its economic value [
46]. In evaluating the economic value, methods such as the direct economic value assessment based on willingness to pay (WTP), indirect economic value assessment based on the agent market and traditional market, and quantitative analysis economic value process benefit assessment were used [
47]. An economic value evaluation model of a battery energy storage system is established with the highest economy value as the objective function, and the optimal capacity configuration scheme of battery energy storage system is obtained using a genetic algorithm [
48]. The value evaluation methods include market price valuation, the normative decision-making model, the descriptive behavioral response model, and contingent valuation. These four methods have their own advantages and disadvantages and need to be integrated in practice [
49].
To sum up, firstly, researchers are paying more and more attention to the evaluation of economic value. Economic value research can provide decision support for governments, enterprises, and individuals. The study of economic value can help optimize the allocation of resources. Second, Chinese and foreign scholars have used a variety of methods to calculate economic value in different fields, so there are many methods to calculate direct economic value. Third, the existing calculation essentially only considers the direct economic value of the research object, that is, the directly obtained monetary expression, and ignores the spillover value of the research object.
Research on the spillover value has also led to some achievements.
The panel data model and the spatial panel lag model are constructed to analyze the significant positive spillover effect of emerging industry spatial agglomeration in Anhui province [
50]. The influence of the degree of industrial advancement on the spillover effect of the economic strength of cities is empirically examined by constructing a spatial Durbin model [
51]. The cross-sectional data differential method is used to study the spillover benefits of targeted poverty alleviation [
52]. By selecting relevant data from 2016 to 2021 for 30 provinces in China, the interaction and spatial spillover effects between circulation digitalization and industrial structure upgrading are discussed by establishing the coupling coordination model and the spatial simultaneous equation [
53]. Based on provincial panel data from 2008 to 2020, this paper empirically tested the mechanism path and spatial impact of rural industry integration on agricultural carbon emissions by constructing the intermediary effect model and the spatial Durbin model [
54]. Based on the database of community change data from a 10-year census in the United States, the direct and indirect (overflow) effect of the community changes is analyzed using the space Durbin model [
55]. The heterogeneous overflow effect of external direct investment can be fully understood through traditional panel models, space Durbin models (SDM), and threshold models [
56].
As can be seen from the above, the spillover value has aroused attention from researchers in many aspects. However, existing research on the spillover value mainly focuses on whether there is a spillover effect, and most of the methods used are statistical tests and the Durbin model. There are no studies on calculating the spillover value.
Based on the above studies, this paper evaluates the economic value of the distributed PV + model from two aspects, direct economic value and spillover value, in order to provide a decision-making basis for promoting the development of the PV + model.
The main areas researched in this paper are as follows: (1) the necessity of an economic value assessment of the photovoltaic (PV +) model; (2) the economic value composition “Distributed PV +” model; the (3) economic value evaluation model of “distributed PV +” model; and the (4) application of the economic value of a “distributed PV +” model.
The paper is organized as follows:
Section 2 is related to processing methods; it includes evaluating the significance of PV +, analyzing the composition of PV + model economic value, and constructing PV + model economic value evaluation model.
Section 3 decribes the PV + model economic value assessment case analysis.
Section 4 describes the issues related to the economic value evaluation of “distributed PV +” model.
Section 5 presents the conclusions.
2. Methods
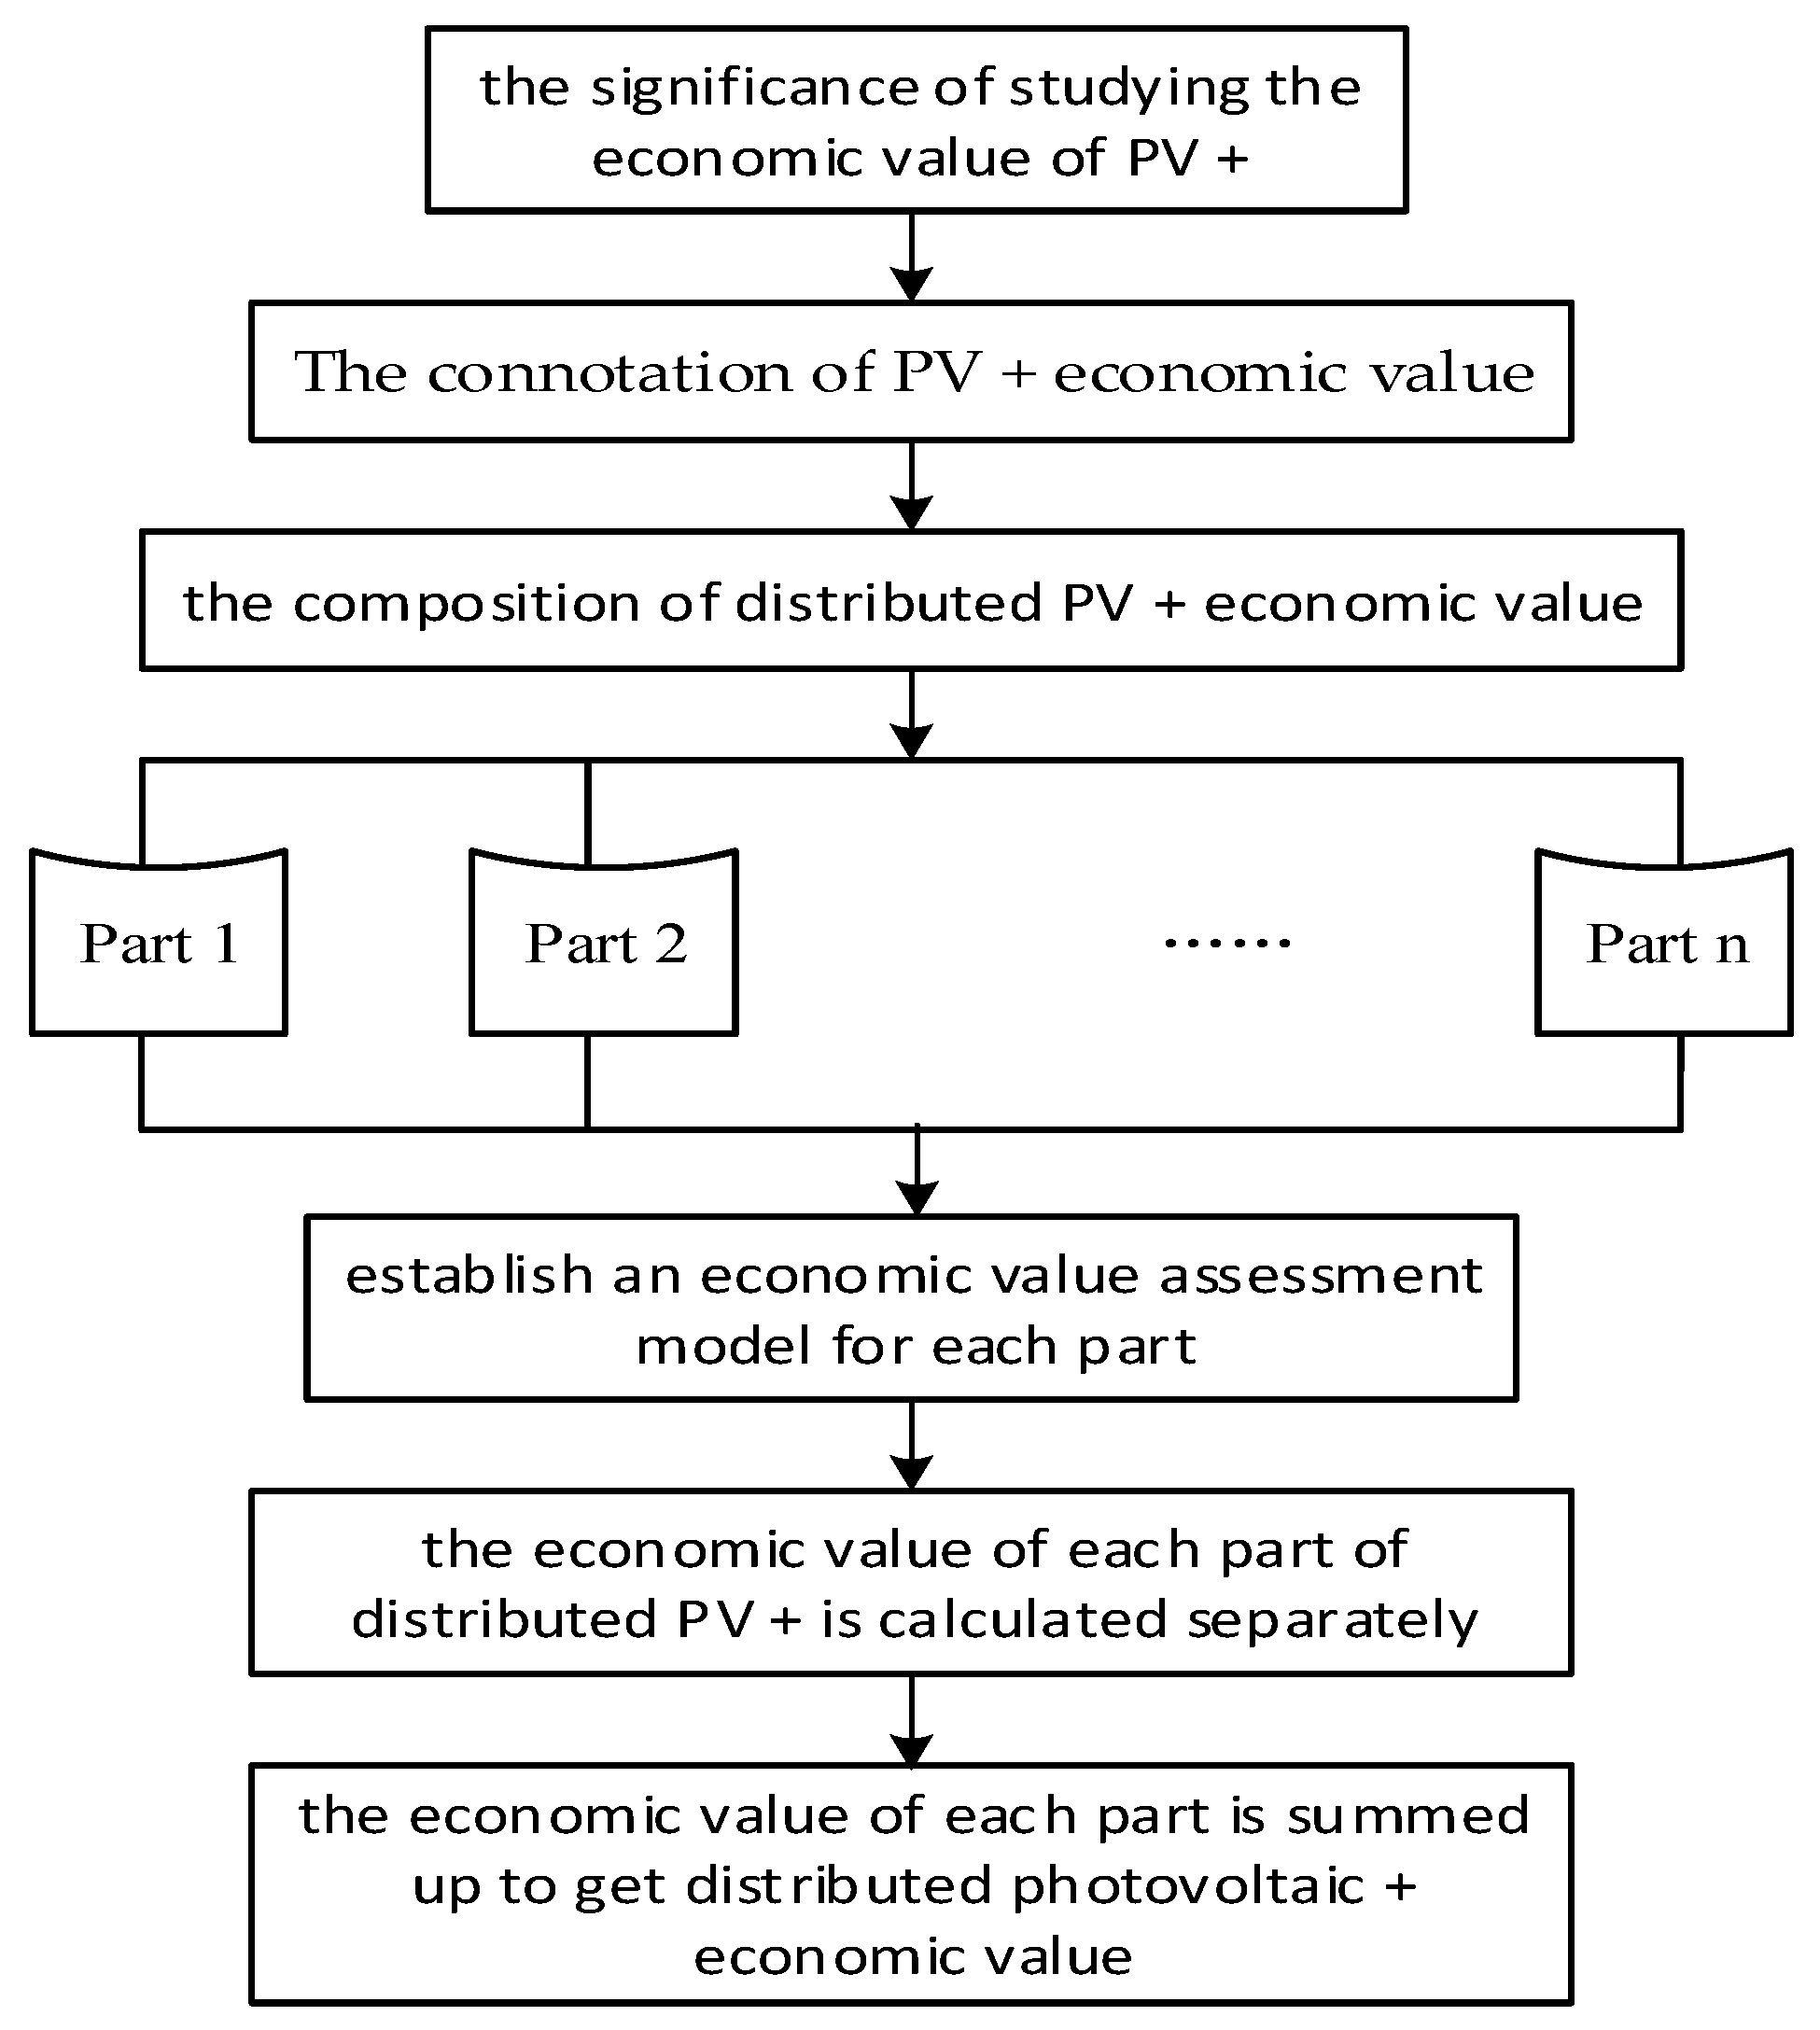
2.1. Research Ideas
The economic value of the distributed PV + model is used to measure the benefits of economic actors and other relevant actors from distributed PV + products and services, with currency as a unified unit of measurement. Firstly, the significance of studying the economic value of PV + is explained. Secondly, the composition of distributed PV + economic value is analyzed, and then an economic value assessment model for each part is established. The economic value of each part of distributed PV + is calculated separately according to the composition of the distributed PV + economic value. Finally, the economic value of each part is calculated to obtain the distributed photovoltaic + economic value. The research ideas are shown in
Figure 1.
2.2. The Significance of Evaluating the Economic Value of the PV + Model
The purpose of studying economic value is to help us better understand and evaluate the importance and effectiveness of the PV + model. The significance of evaluating the economic value of the PV + model is reflected in the following aspects:
(1) PV + combines solar power generation with other industries or fields, such as agriculture, construction, transportation, etc., to promote the development of the clean energy industry. This will help reduce our dependence on traditional fossil fuels and carbon emissions.
(2) The construction and operation of PV + requires a large amount of investment and human resources, thus creating jobs and driving the development of related industrial chains. By analyzing the economic contribution of PV +, we can provide a basis for formulating policies and strategies to promote economic growth.
(3) Solar power is a form of renewable energy that can replace the traditional method of energy supply, reduce energy consumption and costs, and improve energy efficiency. Photovoltaic + operation can save energy costs for enterprises and individuals.
(4) Solar energy is a widely distributed and renewable energy, and through the application of photovoltaic +, scattered solar energy resources can be converted into electricity, reducing the demand for traditional energy, and improving the stability and reliability of the energy supply. The development of photovoltaic + can alleviate the pressure on energy supply and demand.
(5) Assessing the economic value of the PV + model can provide decision-making support for governments, enterprises, and individuals, and by assessing the impact and benefits of PV+, it can help decision makers make more informed decisions and choose more economically valuable programs.
In short, evaluating the economic value of the PV + model can provide decision-making support for governments, enterprises and individuals, and optimize the allocation of energy resources from the perspective of the whole of society. Evaluating the economic value of PV + model will help promote the development of the clean energy industry. Evaluating the economic value of the PV + model can guide relevant stakeholders to formulate market strategies, product pricing and marketing strategies, and improve market competitiveness.
2.3. Analysis of the Economic Value of the “Distributed PV +” Model
2.3.1. Distributed PV + Mode
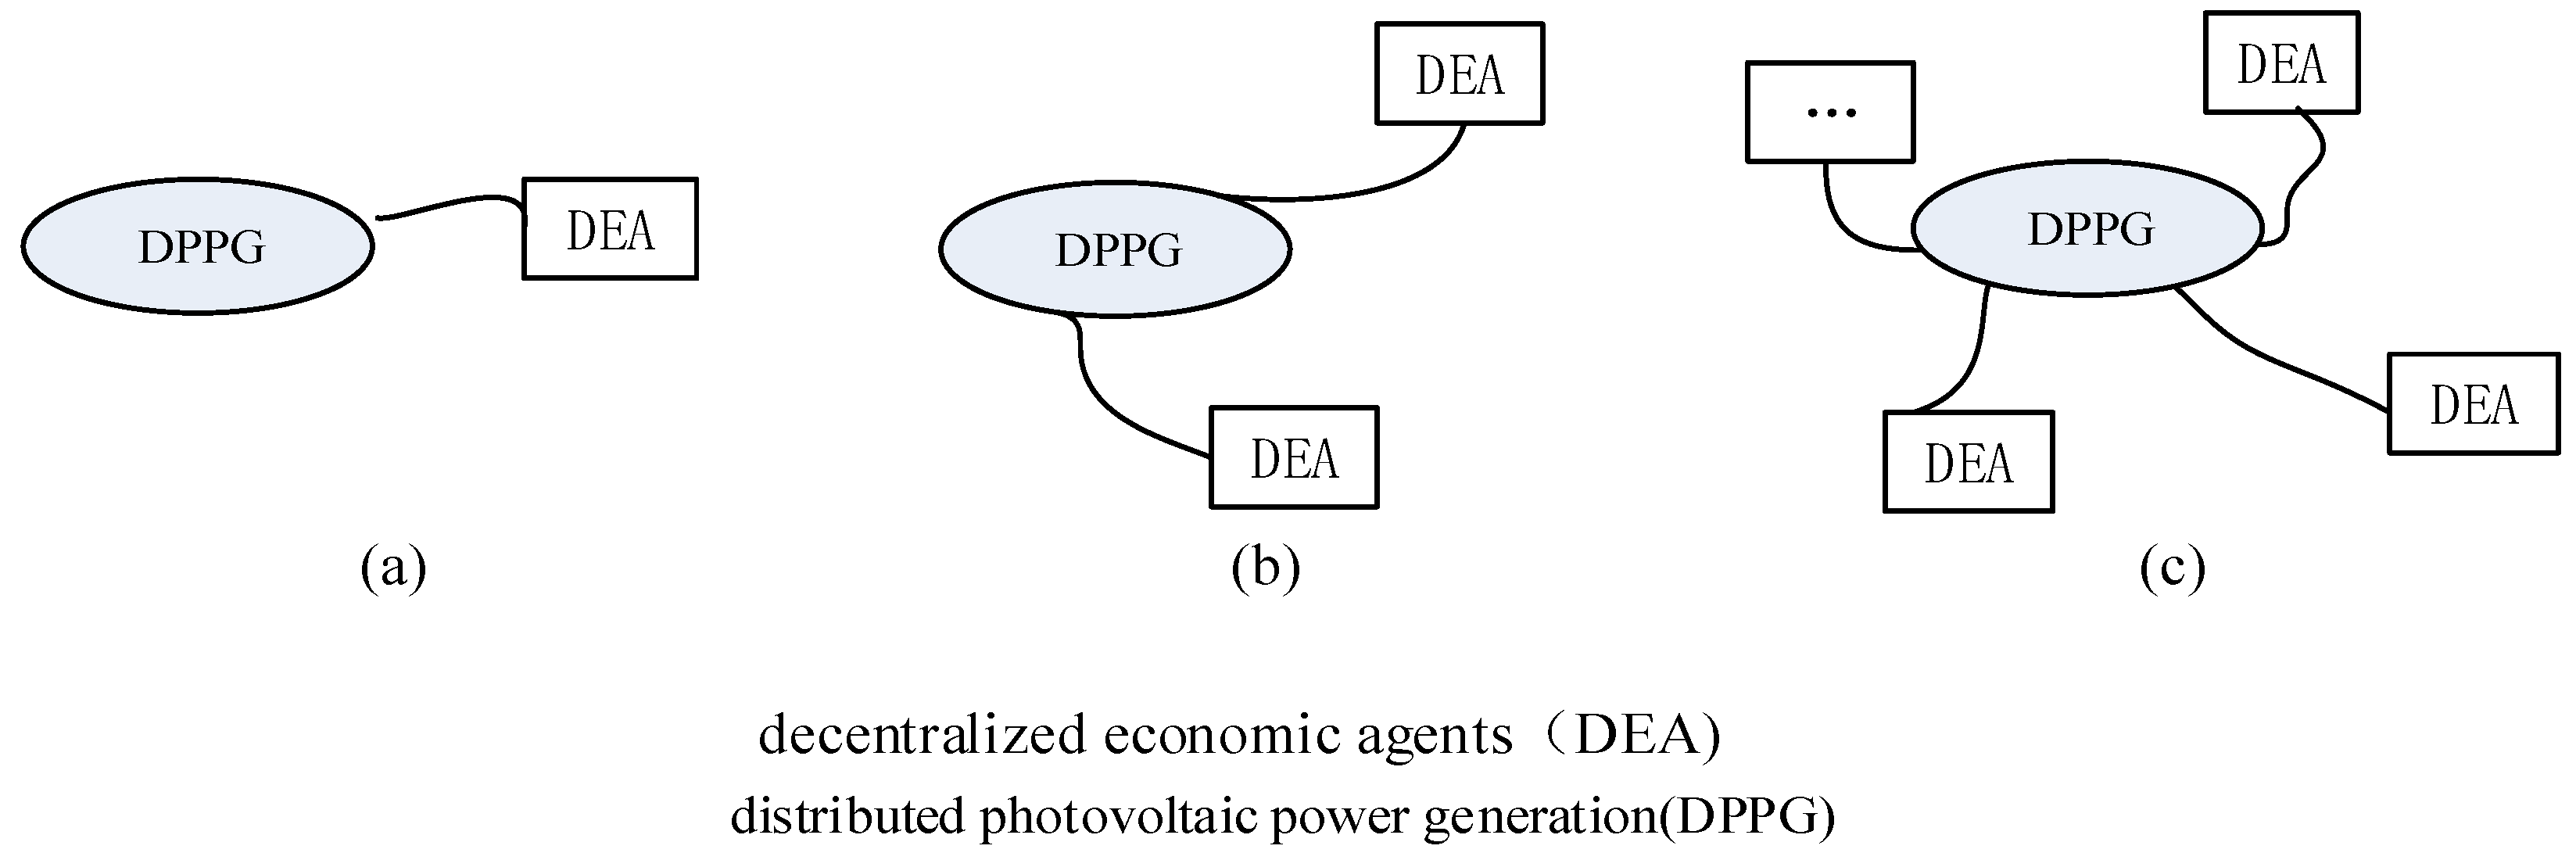
The “distributed photovoltaic +” model focuses on the use of distributed photovoltaic energy, forming a specific output and sharing model combining photovoltaic and decentralized economic entities. This model revolves around the use of distributed photovoltaic power generation. Diversified economic entities will form multiple scattered points. They are not connected to form an economic network together. They are independent, which makes the points scattered (
Figure 2).
Figure 2a–c show the one, two or even multiple decentralized economic units around distributed renewable energy separately.
There is a wide range of decentralized economic entities, so distributed photovoltaic can be integrated with agriculture, forestry, fisheries, tourism, processing industry, etc., to form a “distributed photovoltaic +” model, accelerate the development of regional distributed photovoltaic power, and expand distributed photovoltaic development and application scenarios, with local utilization as the main objective.
Taking photovoltaic + agriculture as an example, in the design, construction, and operation process of a photovoltaic power station, the space necessary for agricultural planting and breeding is reserved to ensure that while the normal power generation of photovoltaic power station is ongoing, the growth needs of plants and animals are met. The effect and benefit of agro-light complementarity are achieved, and the integration and innovation of ecological agriculture and circular agriculture technology models are realized. This will provide strong technical support for the sustainable development of agriculture.
2.3.2. Economic Value Composition of “Distributed PV +” Model
With the policy promotion of the energy revolution and the continuous maturity of new energy power generation technology, the mode innovation of the integrated development of new energy represented by “photovoltaic +” continues to emerge, and the formation of “photovoltaic + fishery”, “photovoltaic + processing industry”, “photovoltaic + agriculture”, etc., has been explored. It can be seen that “photovoltaic +” is an emerging form of photovoltaic development. This solves the problem of the power supply needed for relevant economic entities, avoids the situation of land conflict between the photovoltaic industry and relevant economic entities, and sells extra electricity to the grid. At the same time, agriculture, fisheries, and the processing industry have products or services to sell and will earn a certain income, and thus the “distributed photovoltaic +” model has a high economic value.
The economic value of the “distributed PV +” model refers to the economic output of distributed PV + for people, including the products and services provided by distributed PV + (agricultural products, forest products, aquatic products, processing products, etc.), the income from photovoltaic power generation, and other economic output generated by the use of distributed PV power generation in this model. The economic value evaluation is the estimation of the output of distributed photovoltaic + services and products by economic laws. The output of different photovoltaic + products and services is converted into monetary units by means of prices, which should generally be accounted for over the course of one year. The economic value of the “distributed photovoltaic+” model mainly consists of the following four aspects:
(1) Product revenue. The “Distributed PV +” model gains revenue by selling the corresponding products.
(2) Income from power generation. Power generation income is an important index to evaluate the economic value of a distributed photovoltaic system. By considering the installed capacity of the photovoltaic system, power generation, electricity prices, subsidy policies, and other factors, the annual power generation income of the system can be calculated.
(3) Cost savings. Distributed photovoltaic systems can reduce reliance on the traditional power grid, thereby reducing users’ electricity bills. By comparing the power purchase cost of a distributed photovoltaic system with the power purchase cost of a traditional grid, the cost savings of users can be assessed.
(4) Spillover value PV + model spillover value refers to the added value of PV + that is relevant to stakeholders (PV investors, decentralized economic entities, consumers who buy PV + products or services), which is the outward extension of PV + value, and the non-subjective willingness to extend to relevant stakeholders, thereby increasing the economic value of relevant parties. Therefore, the spillover value can bring additional added value to the relevant entities of the distributed PV + model.
From the perspective of economic entities, due to the low price of distributed photovoltaic, the cost of products (services) is reduced, and the purchase frequency and purchase amount of this type of commodity are increased, making the commodity more competitive in the market.
From the perspective of utility value theory, the reason why consumers buy products (services) in PV + is to obtain the maximum satisfaction from their total utility and marginal utility. PV + products (services) not only meet the functional needs of such consumers, but also meet the psychological needs of consumers in the pursuit of low prices.
From the perspective of externality theory, the economic value of the PV + model can not only lead to market competitive advantages and consumer attention towards decentralized economic entities, but also extend to other organizations or interest groups; therefore, the PV+ model economic value also has externalities and spillover values, and the spillover value has positive or negative externalities.
The price of distributed photovoltaic power generation is lower than the price of grid electricity. For the “distributed photovoltaic +” project, the cost of products (services) is reduced, and the revenue of products sold is increased. From the perspective of microeconomics, the sales volume of products will be increased because the cost is reduced, and the increased sales volume is obtained from photovoltaic power generation. Due to the reduction in cost, buyers will obtain the same utility and reduce expenditure, which is equivalent to increasing their real wages. These two parts of value are only available in the “distributed PV +” mode, which is the spillover value of the distributed PV + model mentioned in this paper. In other words, the spillover value of “distributed PV +” refers to the increased sales of products or services caused by the reduction in product (service) costs and the salaries of consumers, who achieve the same utility and spend less money (equivalent to an increase in real wages) in addition to the direct benefits of distributed PV generation.
Table 1 shows the economic value composition of the "distributed PV +" model.
2.4. “Distributed PV +” Economic Value Evaluation Model
To calculate the value of “distributed PV +”, methods such as the market value method and alternative cost method can be used.
Table 2 is the symbol description used in the value calculation of “distributed PV +”.
(1) Product (service) value
People can obtain various substances (services) from “distributed PV +” that can be exchanged in the market, such as food, wood, medicinal materials, agricultural products, catering services, etc., because these products are directly sold in the market, so the market value method can be used when calculating the value of products (services) in “distributed PV +”; see Formula (1).
(2) Value of photovoltaic power generation
Photovoltaic power generation is sold directly to customers, and the market value method can also be used to calculate the value of photovoltaic power generation; see Equation (2).
(3) Cost reduces value
When economic agents produce goods or services, the price of electricity is part of the cost. The cost reduction of a product or service is reflected in the reduction in electricity price. The cost reduction value of economic entities over a year should be the electricity price difference of before and after the use of the distributed photovoltaic energy according to the quantity of the product (services) produced. The calculation formula is shown in Equation (3).
(4) Spillover value
The spillover value is the sum of the added value of demand caused by the cost reduction (grid electricity price—renewable energy electricity price) of a product (service) —product price + cost reduction (grid electricity price—renewable energy electricity price)—caused by the added value of the actual income of product users. See Equations (4)–(6).
where
is known;
and
can be calculated by solving
and
.
Before solving and , the concepts of the utility function, demand function, indirect utility function, and expenditure function are introduced; the following are the cases of two goods (services).
The utility function is usually used to express the quantitative relationship between the utility obtained by consumers in consumption and the combination of commodities consumed, so as to measure the degree of satisfaction obtained by consumers from the consumption of a given combination of commodities. The utility function can be used to analyze more combinations of goods.
The expression of the utility function is: , where , , and , respectively, represent the quantity of a certain commodity involved in this pattern of consumer (cluster) consumption, and on the left side of the formula is the utility level.
In this model, goods are produced, the sales volume of the item is at price, and is the sales volume of another product consumed by the consumer (cluster); then, the consumer (cluster) utility function is . is the price of another product consumed by the consumer (cluster) at the same time as the consumption of item . The utility function measures the utility level of the consumer (cluster) in a certain consumption state, expressed by .
The demand function measures how much consumers (clusters) want goods at a given level of income and price.
Then, , , is the income that consumers (clusters) spend each year on purchasing the i-th good and another product consumed at the same time.
Bringing the demand function into the utility function gives you a new function, which again measures the utility level, but at a given level of income and price. This is the indirect utility function, expressed as .
The indirect utility function can be written as the inverse function , i.e., how much income is needed at a given utility and price level; this is the expenditure function.
Due to the use of renewable energy, if only the change in energy price is considered, the price of commodity
in this model decreases,
. The total effect of the price change is shown in Equation (7):
Substitution effects are the effects of removing the changes in real income levels due to changes in prices, the substitution caused only by relative price changes between commodities, i.e., .
The Slutsky substitution effect was used to calculate
. The Slutsky substitution effect refers to the consumption at the changed price level (
,
) under the income that can keep the original consumption situation unchanged. At this time, the income should be
. Therefore, the consumption is
The substitution effect is
; see Equation (8).
The compensation effect refers to the money that needs to be increased or decreased to keep the original utility unchanged after the energy price changes, i.e., . Notably, compensation is a neutral word, because when prices goes down, if the utility stays the same, it should be compensated by a negative monetary income, which is equivalent to an increase in real wages for consumers. If prices rise, then the holding utility constant should compensate for positive monetary income, equivalent to a reduction in consumers’ real wages.
According to the above conditions, in the case of price (
) and income
, utility can originally be expressed as
by the indirect utility function. For price (
), in order to keep the
utility unchanged, the revenue changes. Here, the spending function is
. Therefore, the consumer’s income
should be compensated; then,
is shown in Equation (9).
3. Results
3.1. Data
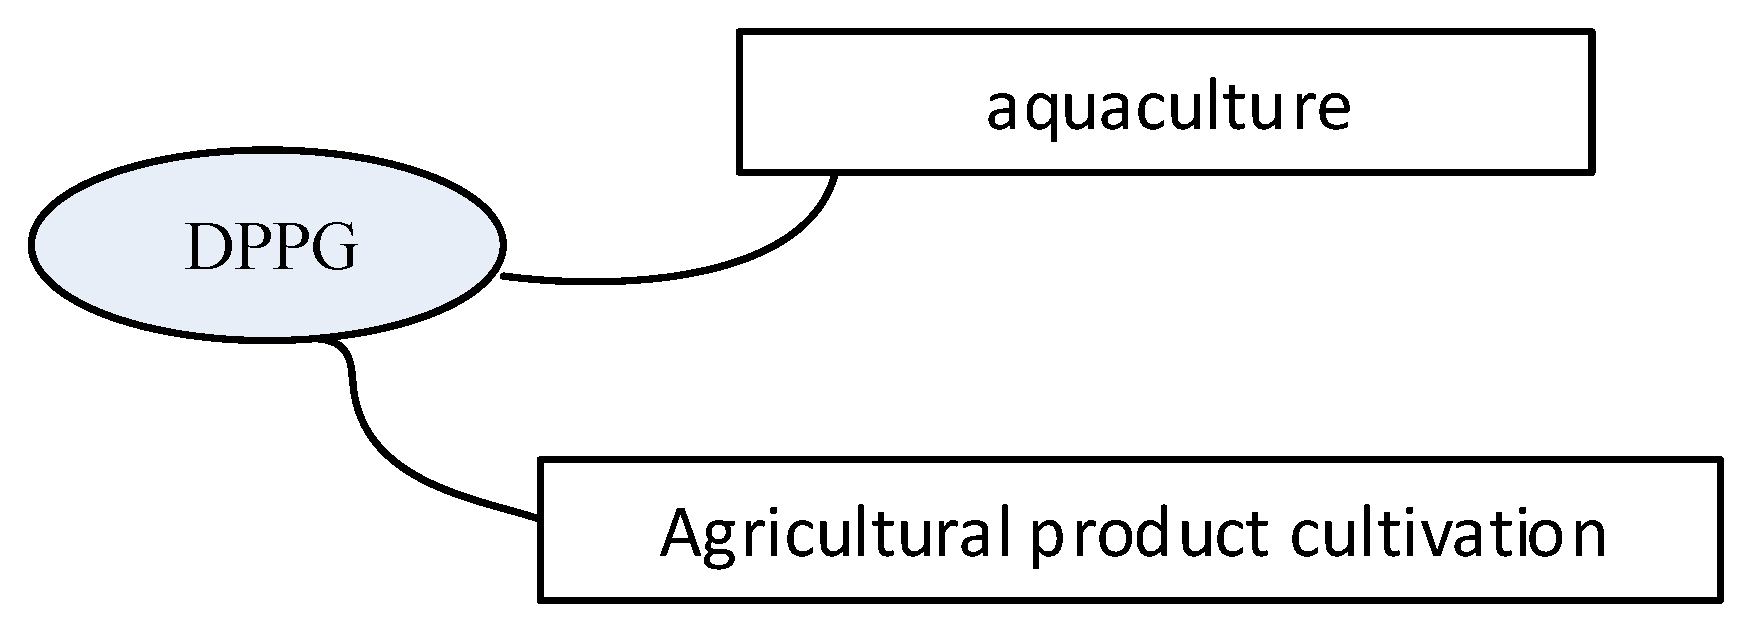
It is assumed that the model has two economic units, planting crops and aquaculture products under the photovoltaic panel, forming a “distributed photovoltaic + agriculture and aquaculture” model (
Figure 3), in which there are agricultural products and aquaculture products, where (
is 2), the price of agricultural products is
, and the price of aquaculture products is
.
For the first product in the model, an agricultural product, it is known that the annual income of a consumer (cluster) for the agricultural product and is CNY 15,000; the prices of the two goods are = CNY 50 and = CNY 100, respectively, and the utility function of this consumer (cluster) is .
For the second product in the model, the aquaculture product, it is known that the annual income of a consumer (cluster) for the aquaculture product and is 10,000 CNY, the prices of the two commodities are = CNY 60 and = CNY 80, respectively, and the utility function of the consumer (cluster) is u .
Products are produced and sold according to the principle of consumer utility maximization, and relevant data are shown in
Table 3.
3.2. Calculation of Results
Solution:
(1) Output calculation of agricultural products and aquaculture products:
By producing and selling products according to the principle of consumer utility maximization, the output of two products can be obtained.
For the first product, the utility function of this consumer (cluster) is , therefore, , .
According to the principle of consumer utility maximization, ; therefore, , .
Additionally, , have , .
Substituting , , can be solved.
For the second product in the pattern, let the utility function of consumers (cluster) be .
In the same way, , .
It is calculated that , .
(2) Product (service) value
Income from agricultural products: 100 × 36 = 3600 (CNY)
Aquaculture income: 83 × 51.565 = 4280 (CNY)
Income from Product (service): 3600 + 4280 = 7880 (CNY)
(3) Value of photovoltaic power generation
Income from photovoltaic power generation: (2000 + 1000) × 0.5 = 1500 (CNY)
(4) Cost reduces value (
Cost reduction quantity: (1.2 − 0.5) × (2000 + 1000) = 2100 (CNY)
(5) Spillover value
When , it is an agricultural product. In the utility function of the consumer (cluster) 1, there are two products involved: one is the agricultural product in the model. Its sales volume is denoted as and priced at . Additionally, represents the quantity of agricultural product consumed by consumer (cluster) 1 within the same group as the agricultural product in the model. The utility function of consumer (cluster) 1 given by . Furthermore, denotes the price of the product consumed by consumer (cluster) 1. Similarly, when , we consider the sales volume of cultured aquatic products at the price , denoted as . Additionally, represents the number of products consumed by consumer (cluster) 2 within the same group. The utility function for consumer (cluster) 2 is given by . Finally, represents the price of the product consumed by consumer (cluster) 2.
By substituting and into the utility function, we can obtain the utility level for consumers (cluster) as u .
Additionally, due to the use of photovoltaic technology, electricity prices decrease by , where .
The power consumption per product is calculated as the total power consumption divided by the number of products. For the first product, the power consumption is 2000/100 = 20 (KWH/PC). Consequently, the price of the first product is reduced by 20 × 0.7 = CNY 14, resulting in .
At
,
, the consumer (cluster) makes the following choices:
,
.
At this point, the utility level of the consumer (cluster) is u .
At prices , the amount of money required by consumers (clusters) to reach the pre-price utility level is .
Then,
, that is,
,
.
By substituting
and
into the utility function, the utility level of consumers (cluster) is
u . The decrease in electricity prices is attributed to the use of photovoltaic technology, denoted as
:
The power consumption per product is calculated as the total power consumption divided by the number of products. Therefore, the power consumption of the second product is 1000/83 = 12.05 (KWH/PC). Consequently, the price of the second product is reduced by 12.05 × 0.7 = 8.435 CNY, resulting in a new price of CNY.
At the price
, the consumer (cluster) choice is
,
The amount of money required by consumers (clusters) to reach their pre-price utility level is .
Then, , that is, =
It is calculated that:
.
Spillover value:
36 × (100 + 39) 50 × 100 + 51.565 × (83 + 14) × 83 = 21.805 (CNY)
(CNY)
If the economic value of PV + model is , then
= 7880 + 1500 + 2100 + 21.8 + 2344 = 13,845.8 (CNY)
4. Discussion
(1) The spillover value in the economic value of distributed PV + model
In existing studies, the economic evaluation method is only proposed from the indicators of energy cost, emission reduction benefit, and investment payback period [
15], and economic feasibility has been studied [
13,
14]. In the study of the distributed PV value, the economic value is not systematically studied, and the spillover value is proposed for the first time.
From the research results, the spillover value accounts for a relatively large share, which is the value behind the distributed PV + model, and is often the neglected part. This paper proposes the spillover value, reveals its value from the essential attributes of the distributed PV + model, and introduces the method for the quantitative calculation of the spillover value, which has important theoretical interpretation significance and practical value for promoting the PV + model on a social level, which is one of the innovation points of this paper.
(2) Different situations of the spillover value
Some studies analyze and estimate the electricity generation potential from photovoltaic panels [
5]; this paper proposes judging whether the PV + model should be vigorously promoted with the spillover value, which is also a new contribution.
The spillover value is implied in the PV+ model, due to the influence of market competition, photovoltaic price and other factors, the spillover value can have three theoretical situations: spillover value ≥ 0 or spillover value < 0.
When the spillover value is >0, it indicates that the spillover value of the PV+ model brings excess value returns to its economic entities. It shows that the price of photovoltaic power generation is low; the PV + model should be vigorously promoted, and it is feasible to carry out consumption-distributed PV + in a local area.
When the spillover value = 0, it indicates that the price of distributed photovoltaic power generation is not very low due to natural conditions in the region, and from the perspective of the use of photovoltaic energy, the photovoltaic+ model can be carried out in the local consumption of distributed photovoltaic. However, the economic entity in the distributed PV+ model does not obtain a spillover value, and its income is only represented by the value of selling products (services) and the value of cost reduction. The amount of cost reduction is not too large, so the attraction of economic entities will be affected.
When the spillover value is <0, it means that the price of distributed photovoltaic power generation is higher than the general price of electricity because the price of electricity is high, resulting in the high cost of products (services), and compared with non-distributed photovoltaic+ model products, it is not competitive in the market. Economic entities will not favor the PV+ modessl. Unless distributed photovoltaics must be promoted, they should not be carried out locally from the point of view of economic value.
(3) Utility function
There is currently no research on calculating the spillover value of the distributed PV + model. When it comes to the spillover problem, existing studies essentially use various methods to study whether there is spillover effect but do not achieve the quantitative calculation of spillover value [
51,
53,
54].
This paper applies a utility function to calculate the spillover value of the distributed PV + model, solves the problem of calculating the spillover value, and realizes the change from zero to one, which is a good result. However, the calculation of the spillover value using the utility function is also limited to some extent. This method is more suitable for the case where there are only two products in the same commodity market, so we should explore the calculation method of the spillover value described in this paper.


