
Mapping the Research Landscape of Industry 5.0 from a Machine Learning and Big Data Analytics Perspective: A Bibliometric Approach


Abstract
:1. Introduction
- Which are the most impactful journals for papers in the area of Industry 5.0 ML and big data?
- Which are the most representative universities in the analyzed field?
- Which are the most cited articles in the Industry 5.0 domain?
- Who are the most notable authors based on the number of papers and citations?
- How has the evolution of scientific production progressed?
- What are the most commonly used groups of words by the authors?
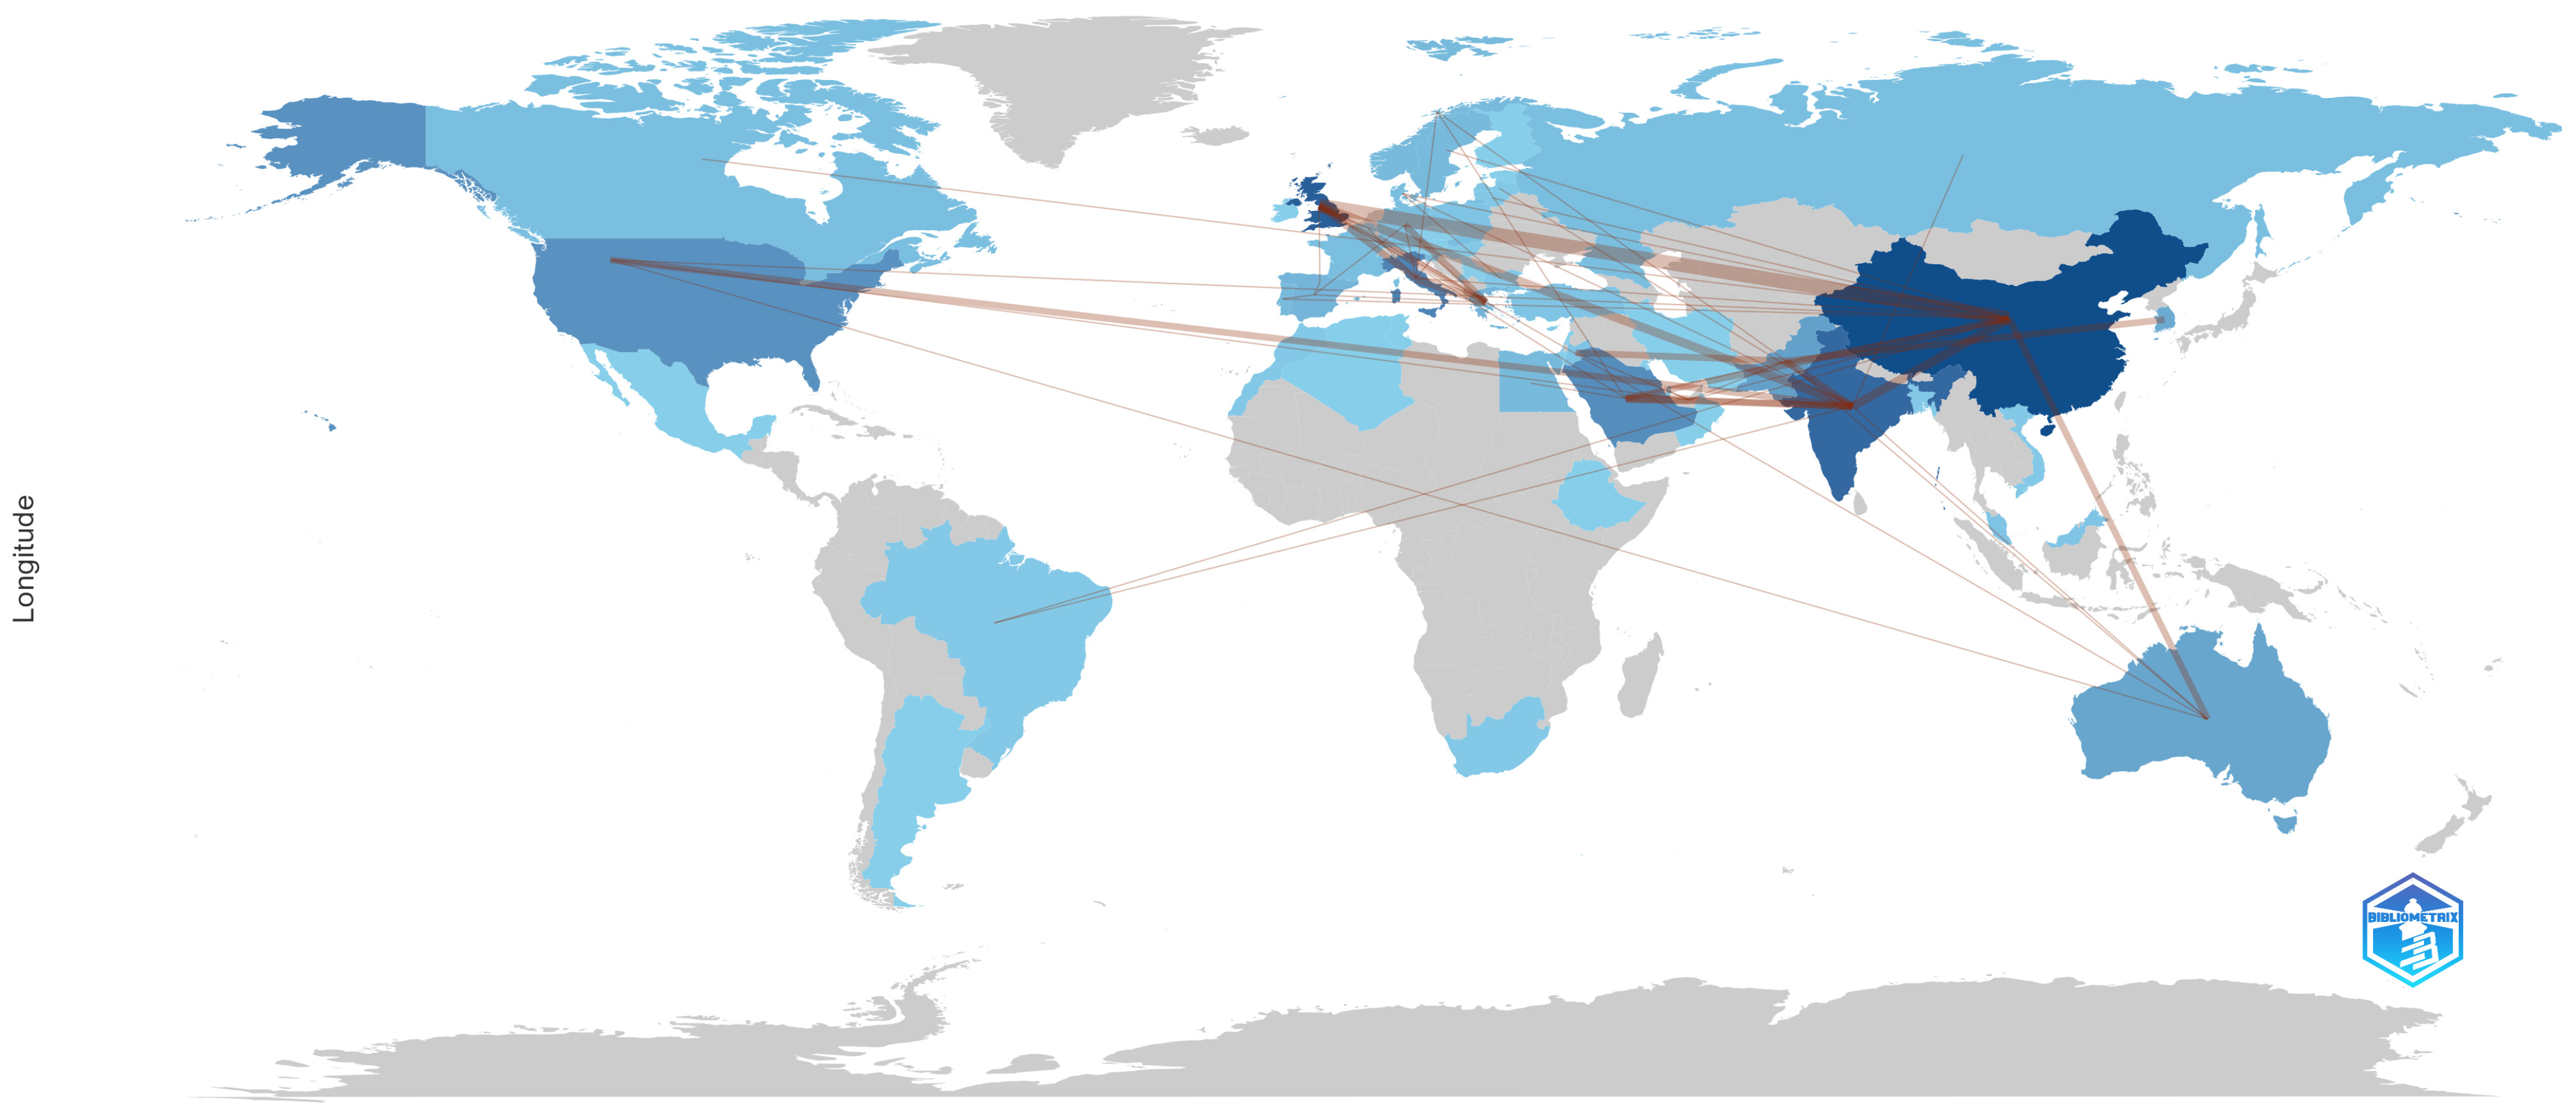
- Which countries collaborated on creating scientific articles over time on Industry 5.0?
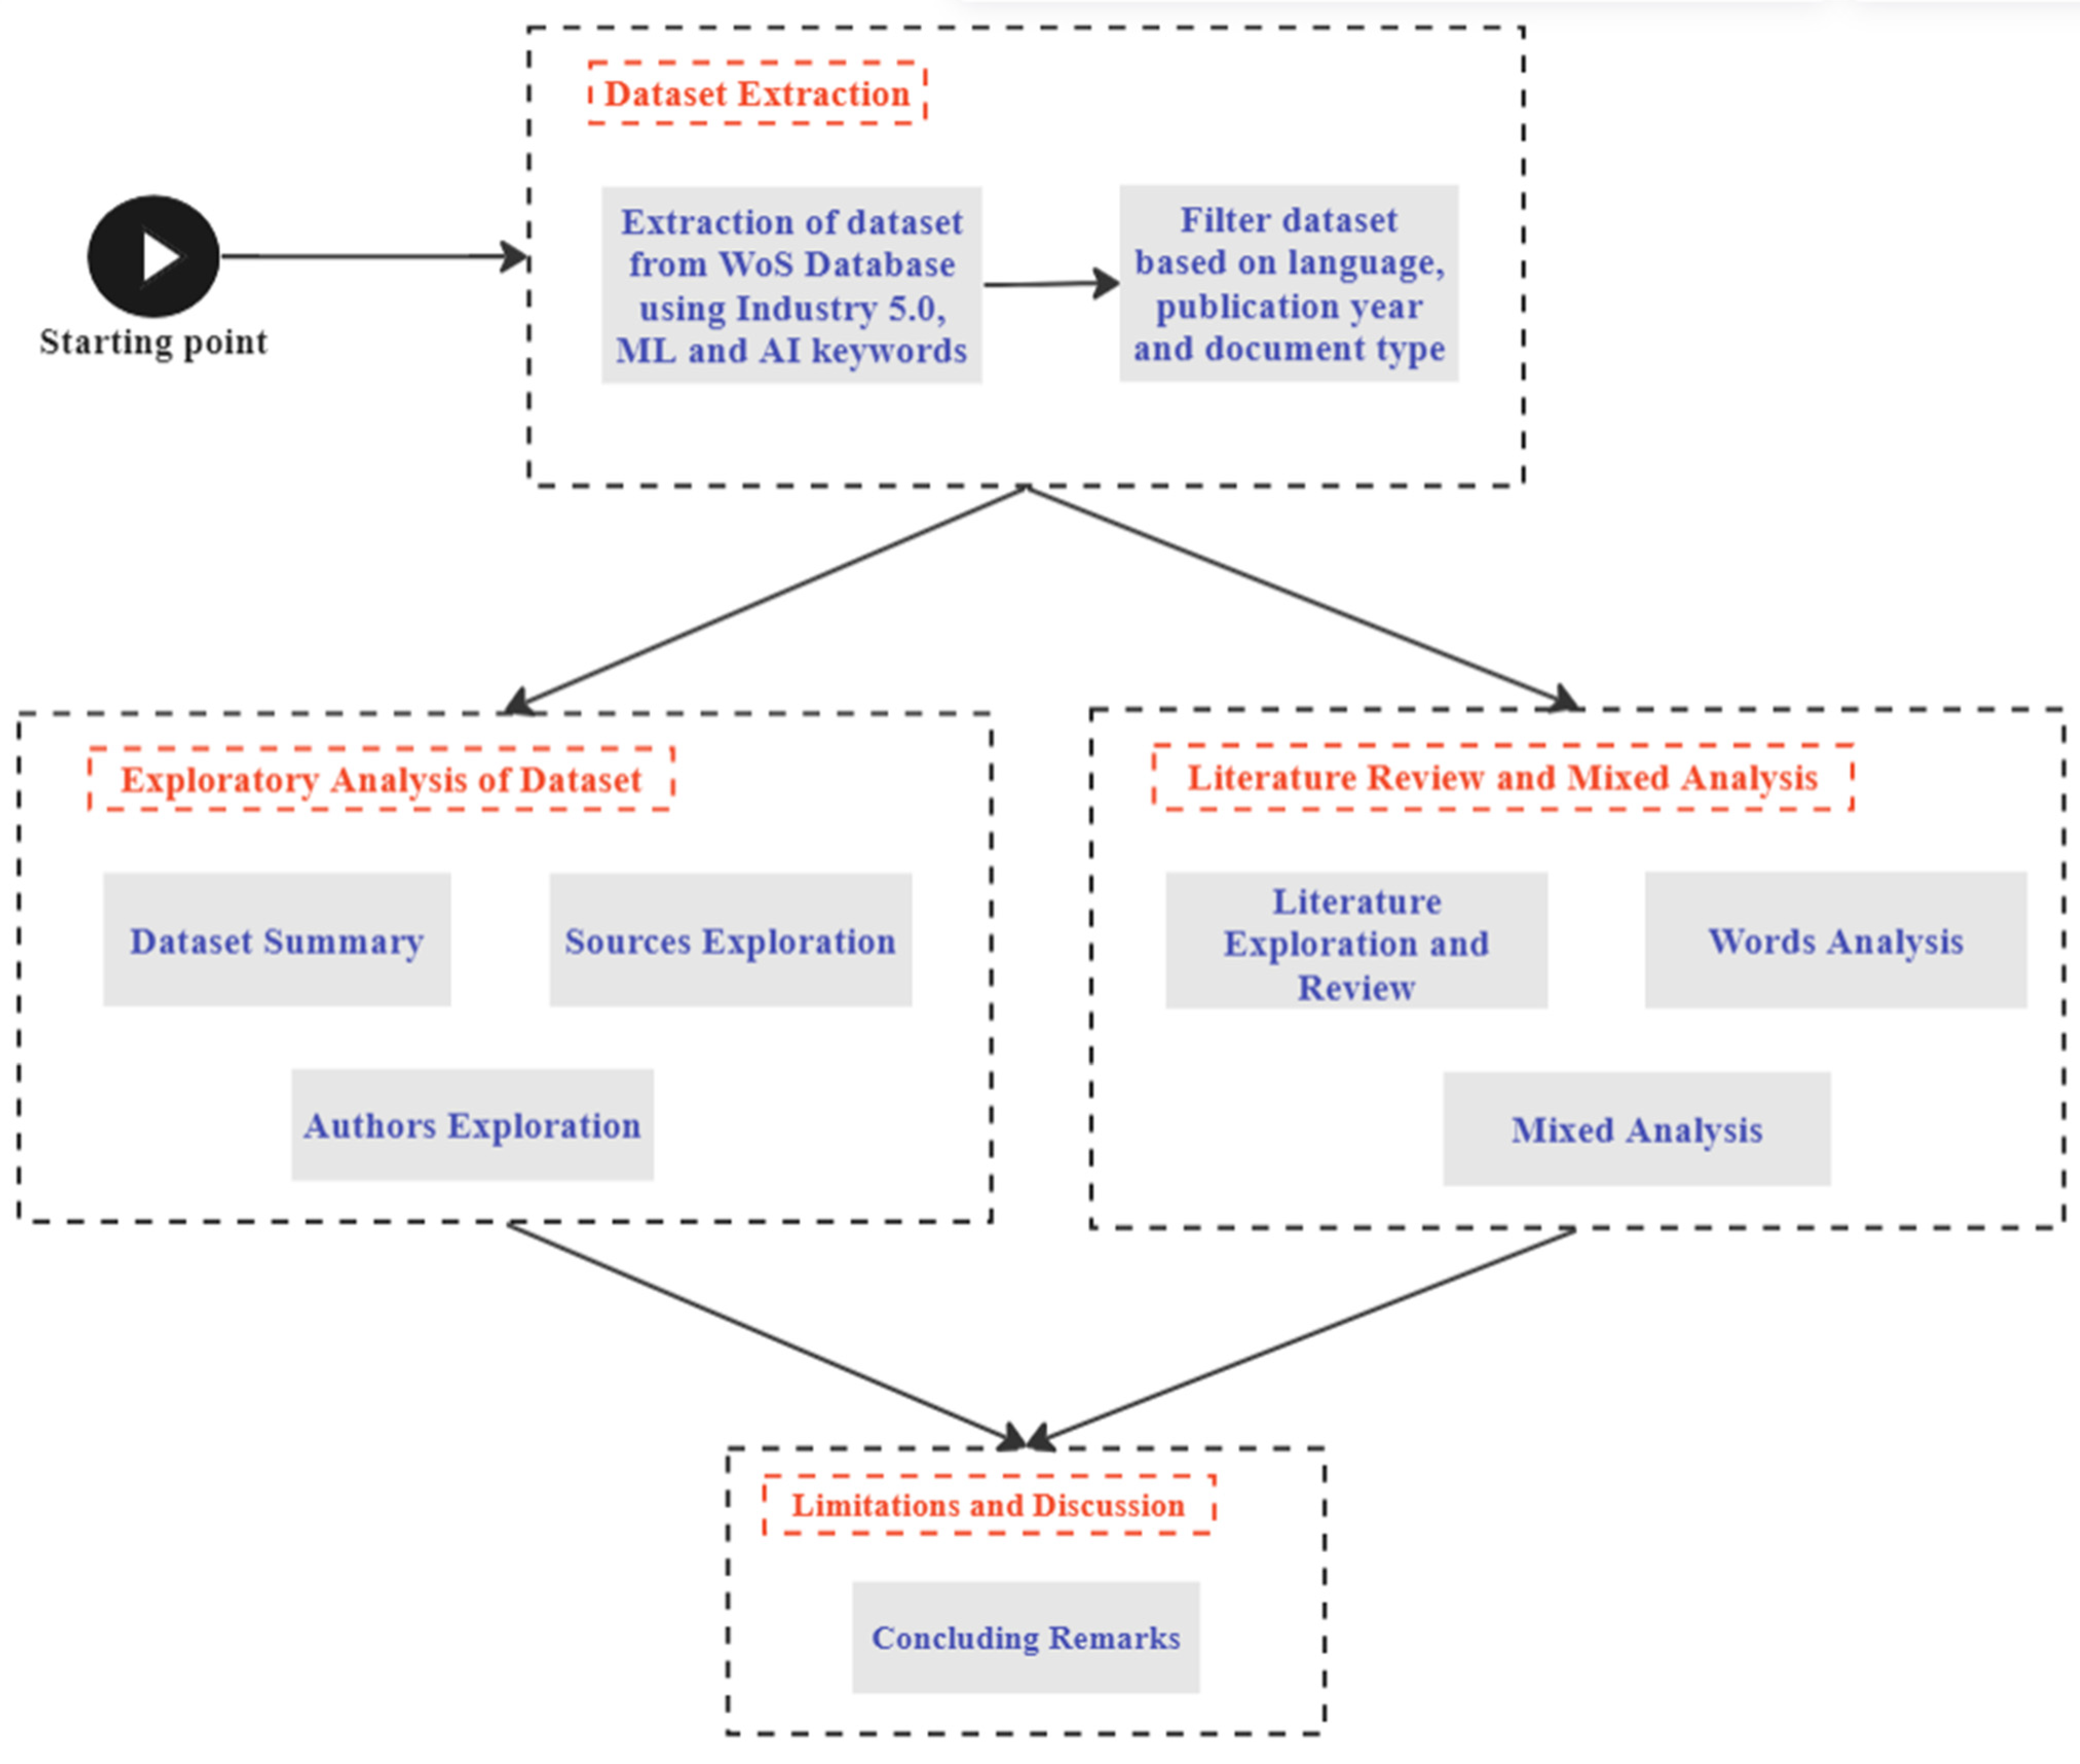
2. Dataset Extraction
- Conference Proceedings Citation Index—Social Sciences and Humanities (CPCI-SSH)—1990–present;
- Conference Proceedings Citation Index—Science (CPCI-S)—1990–present;
- Emerging Sources Citations Index (ESCI) 2005–present;
- Science Citation Index Expanded (SCIE)—1900–present;
- Arts and Humanities Citation Index (A&HCI)—1975–present;
- Social Sciences Citation Index (SSCI)—1975–present;
- Index Chemicus (IC)—2010–present;
- Book Citation Index—Social Sciences and Humanities (BKCI-SSH)—2010–present;
- Book Citation Index—Science (BKCI-S)—2010–present;
- Current Chemical Reactions (CCR-Expanded)—2010–present.
3. Exploratory Analysis of the Dataset
3.1. Dataset Summary
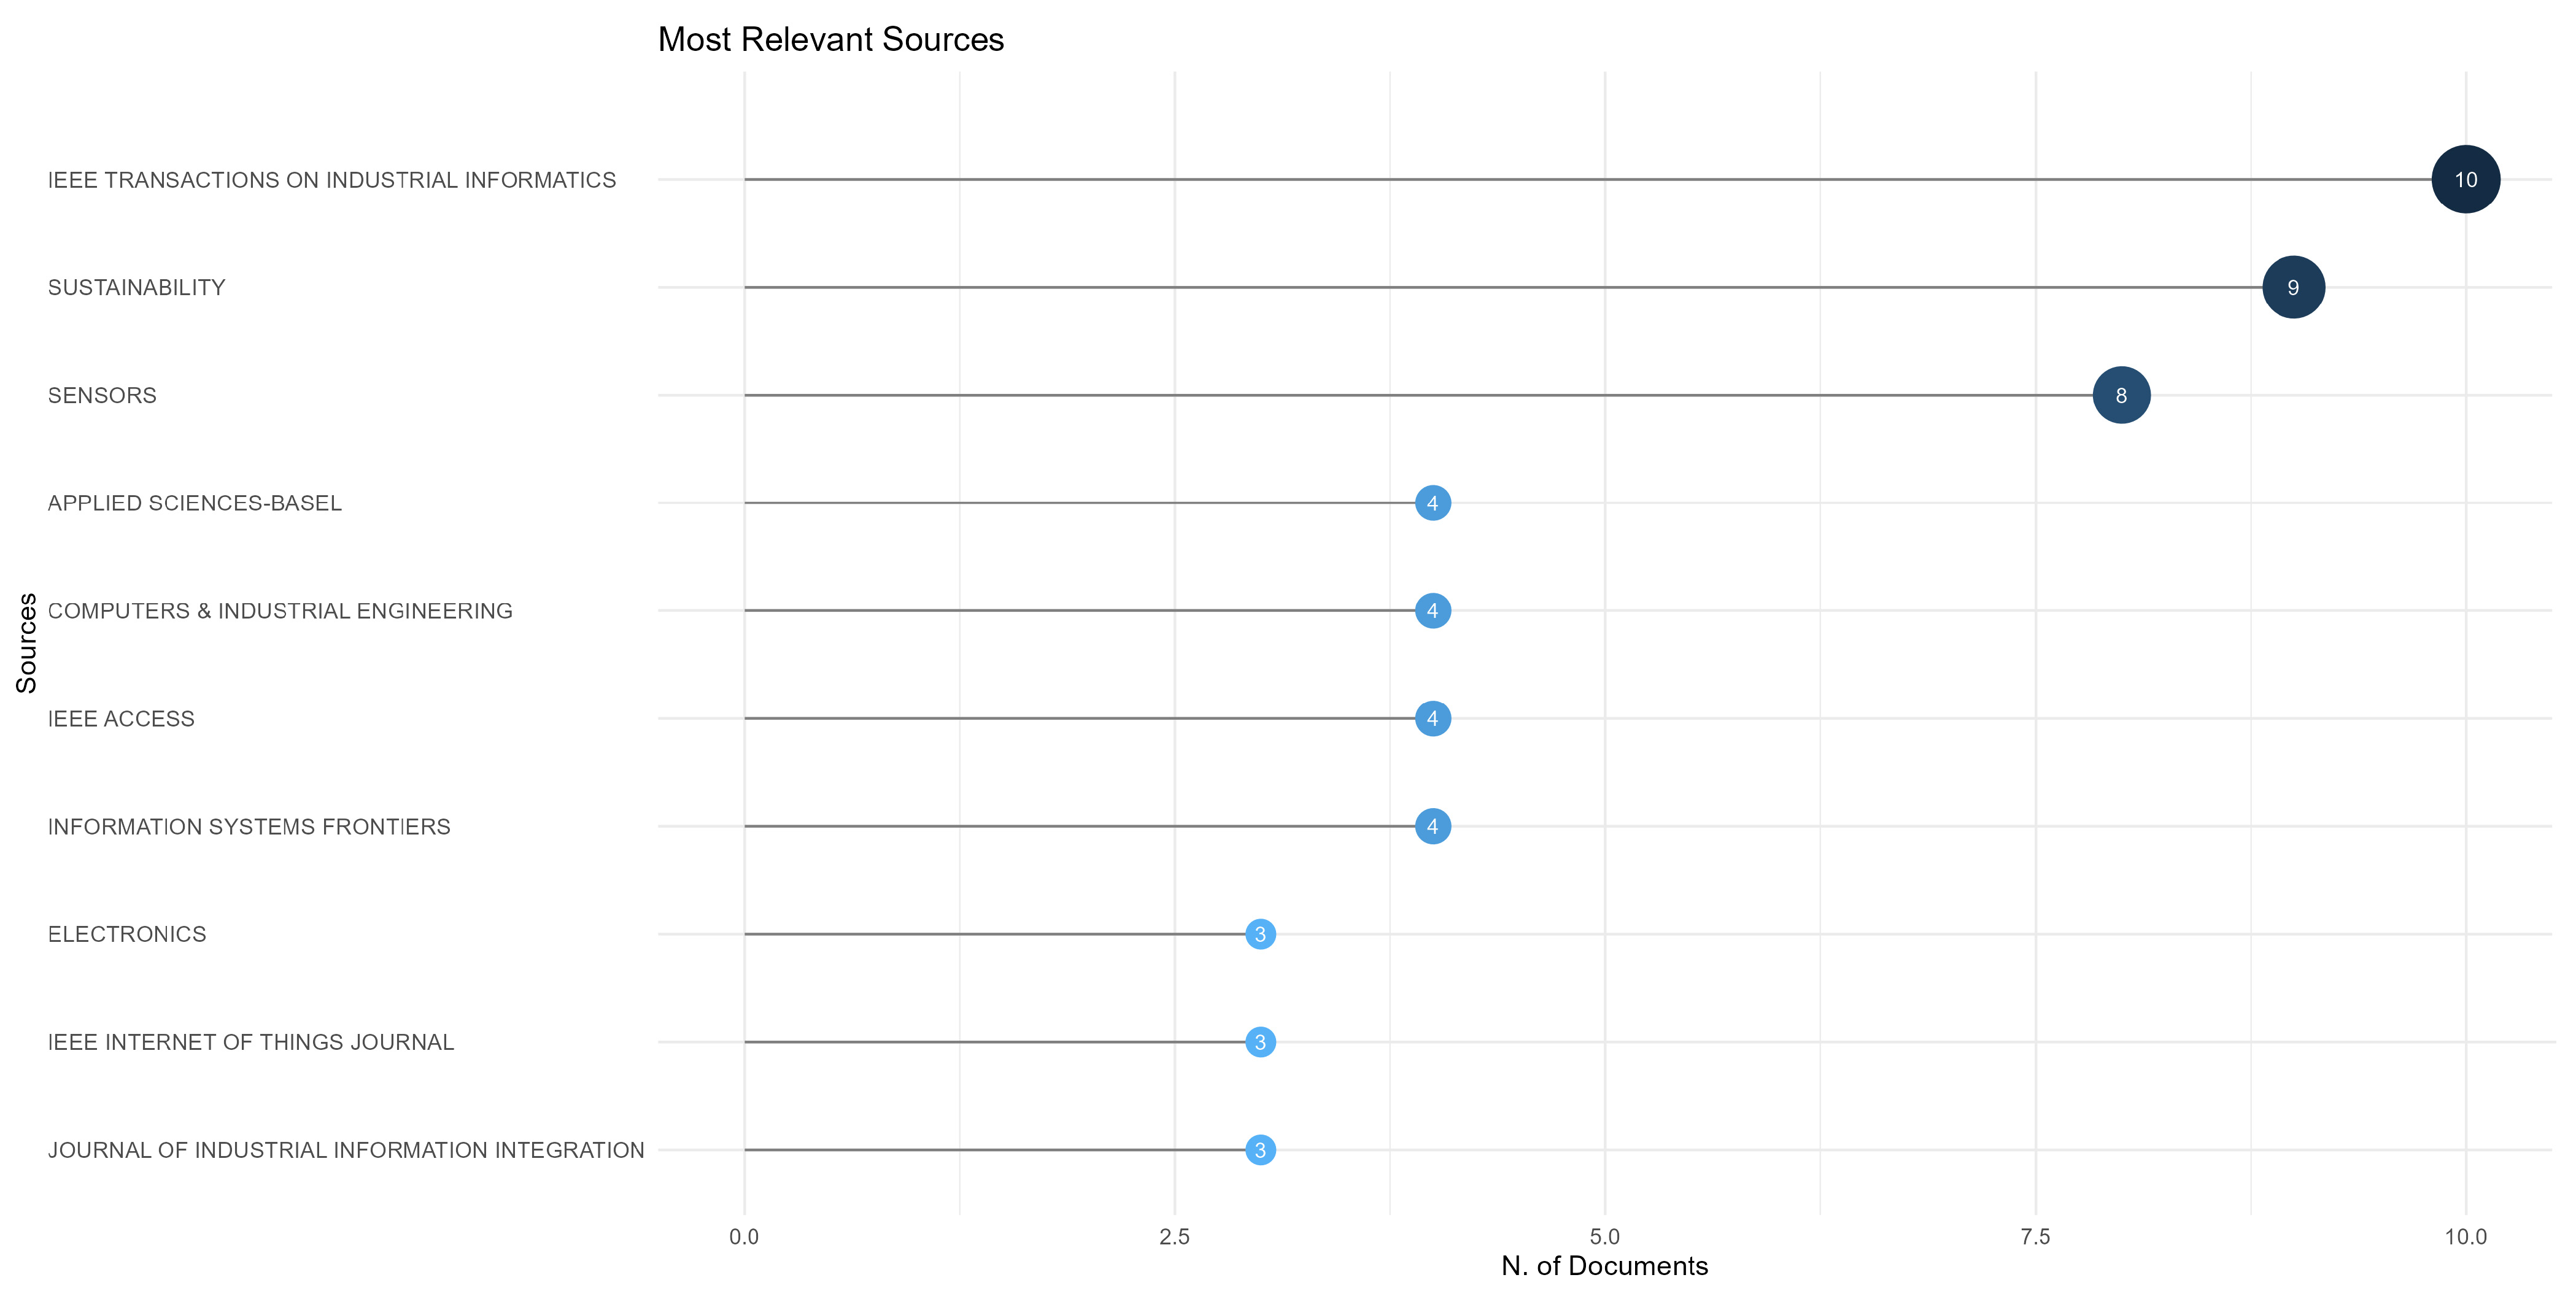
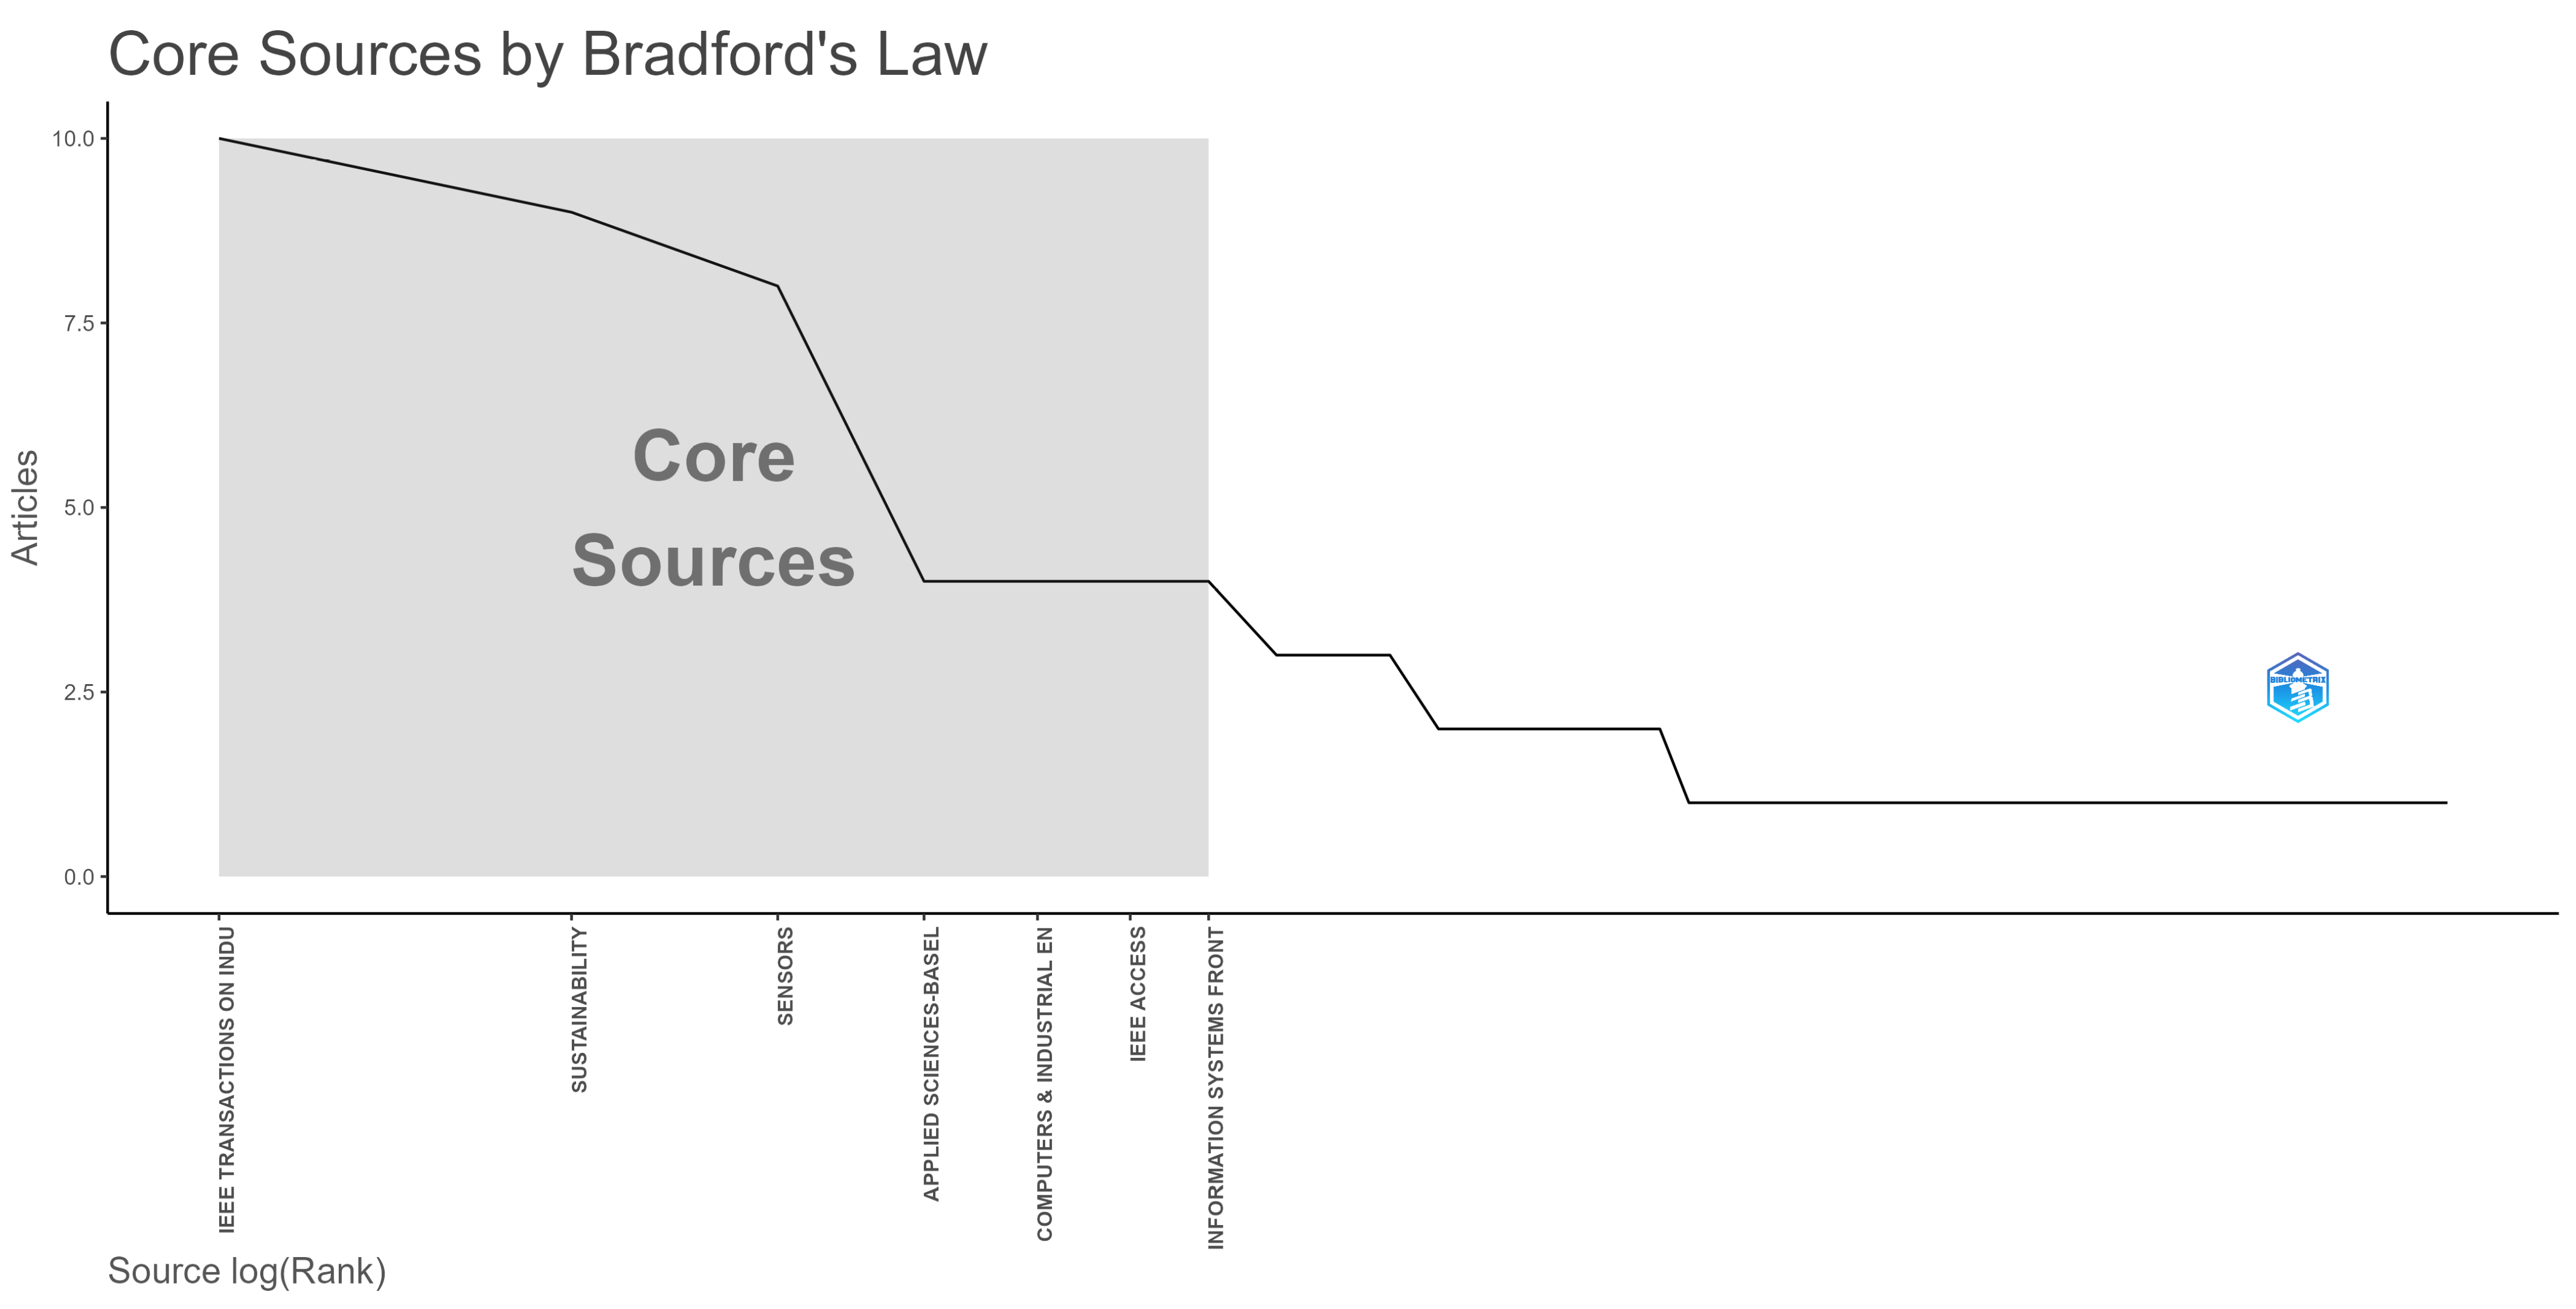
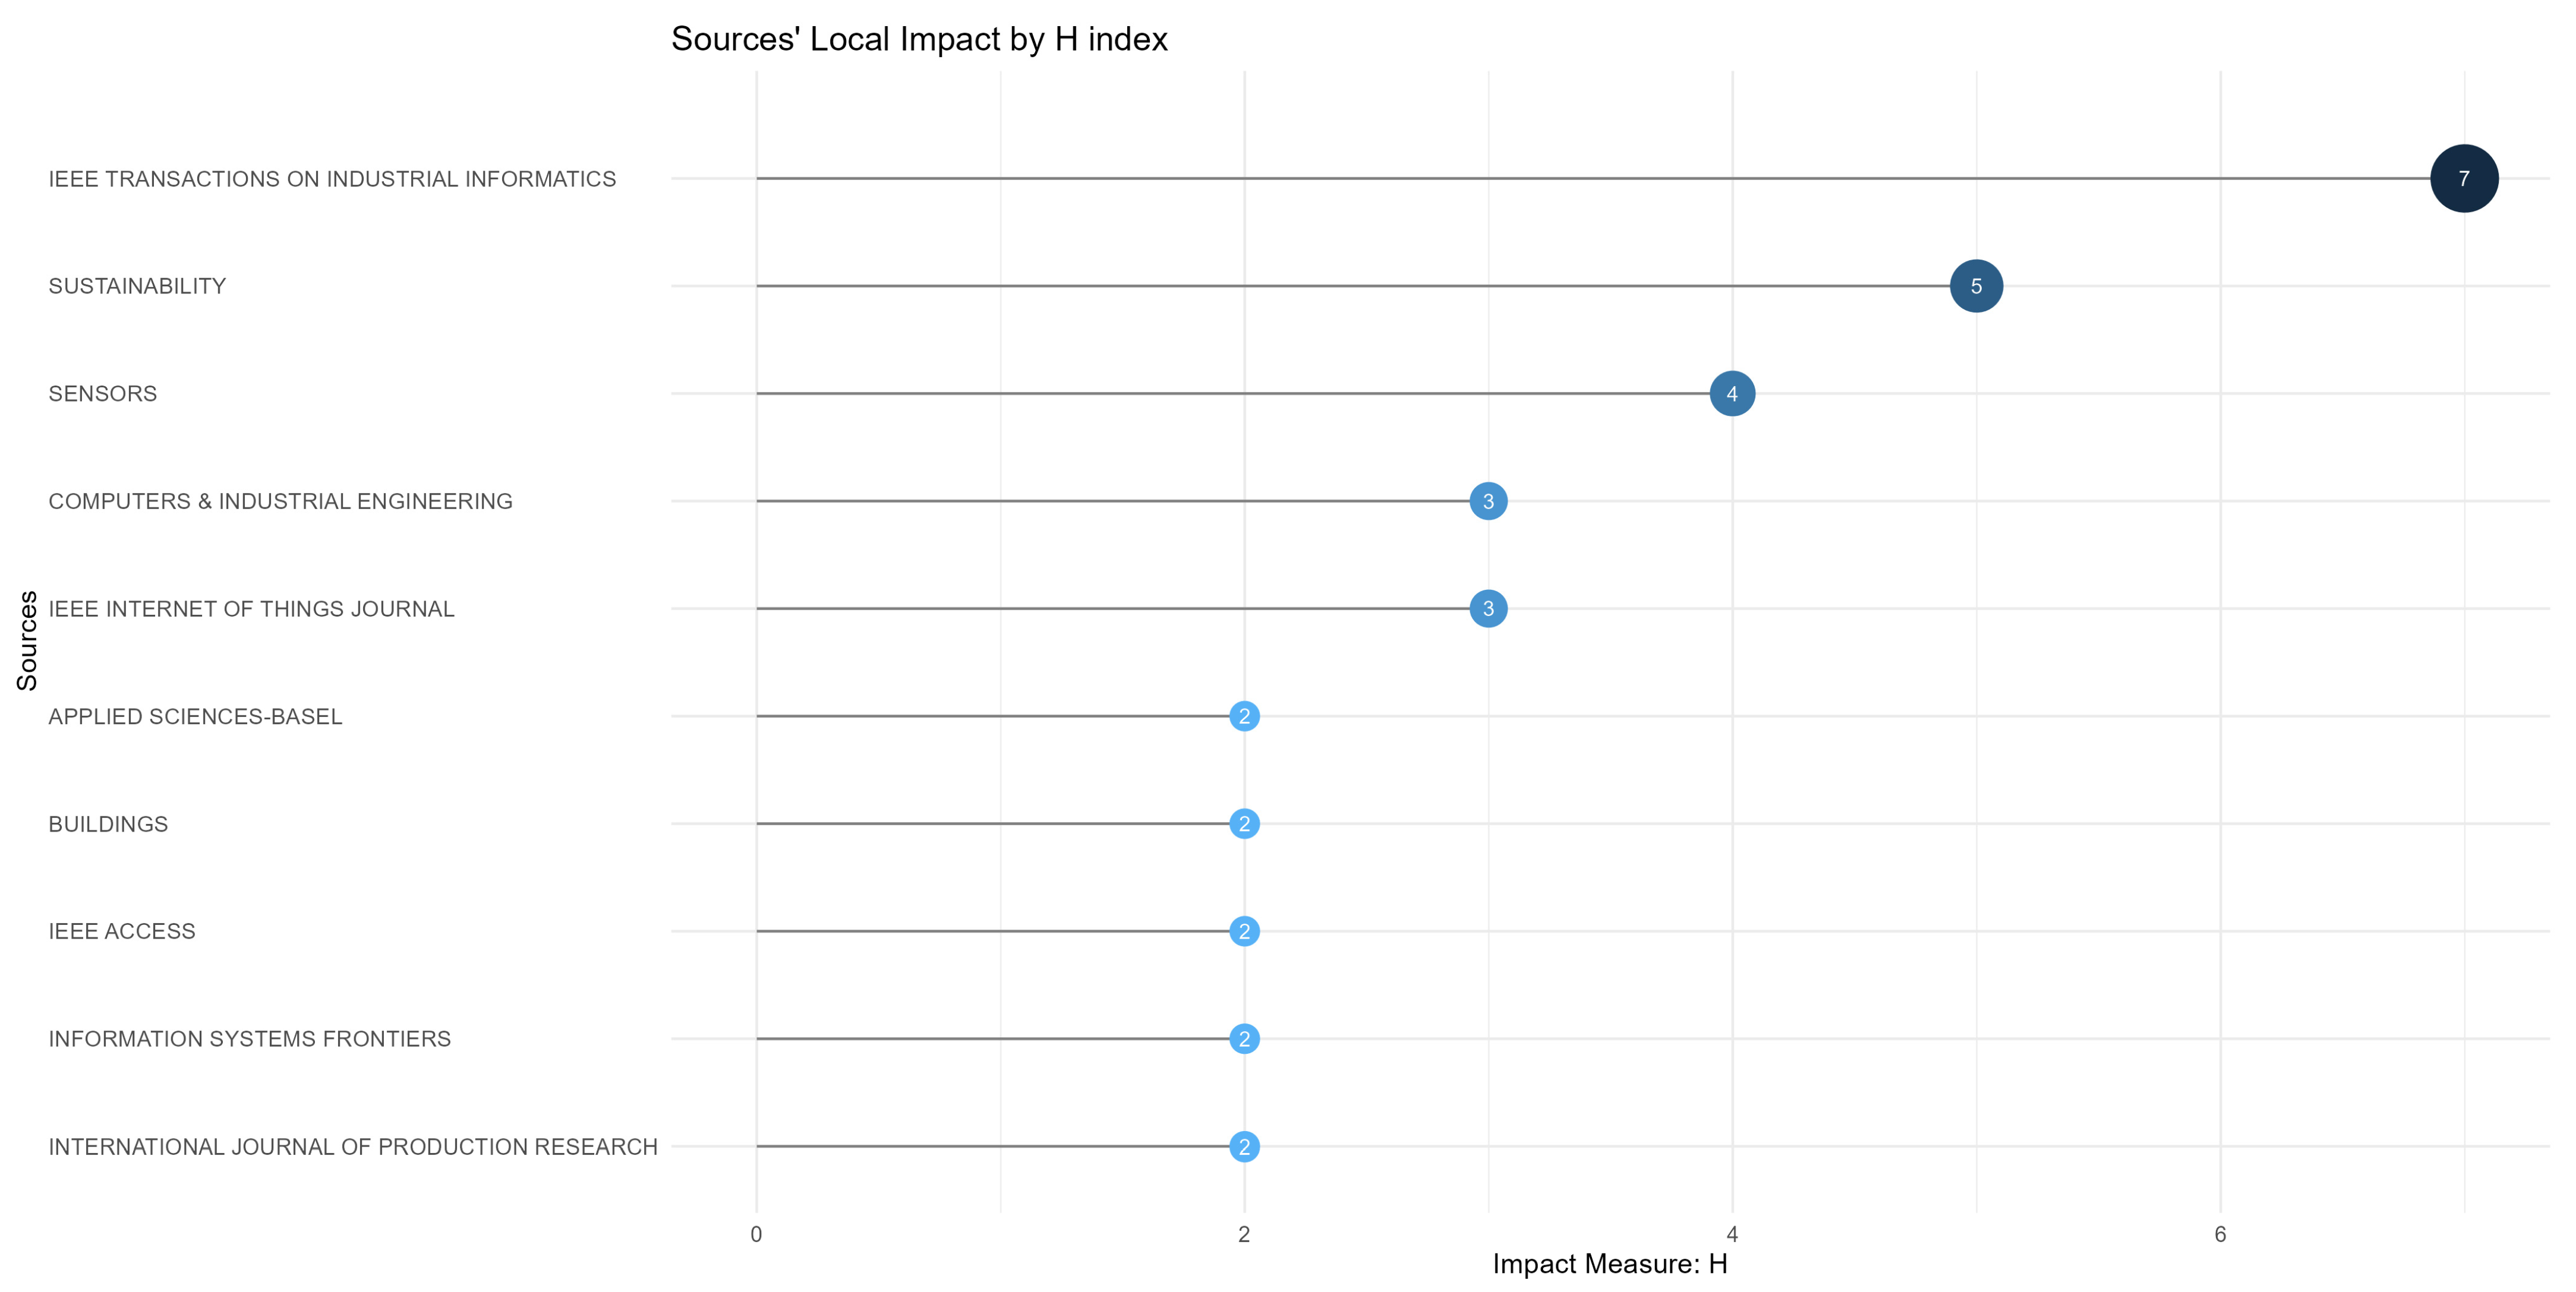
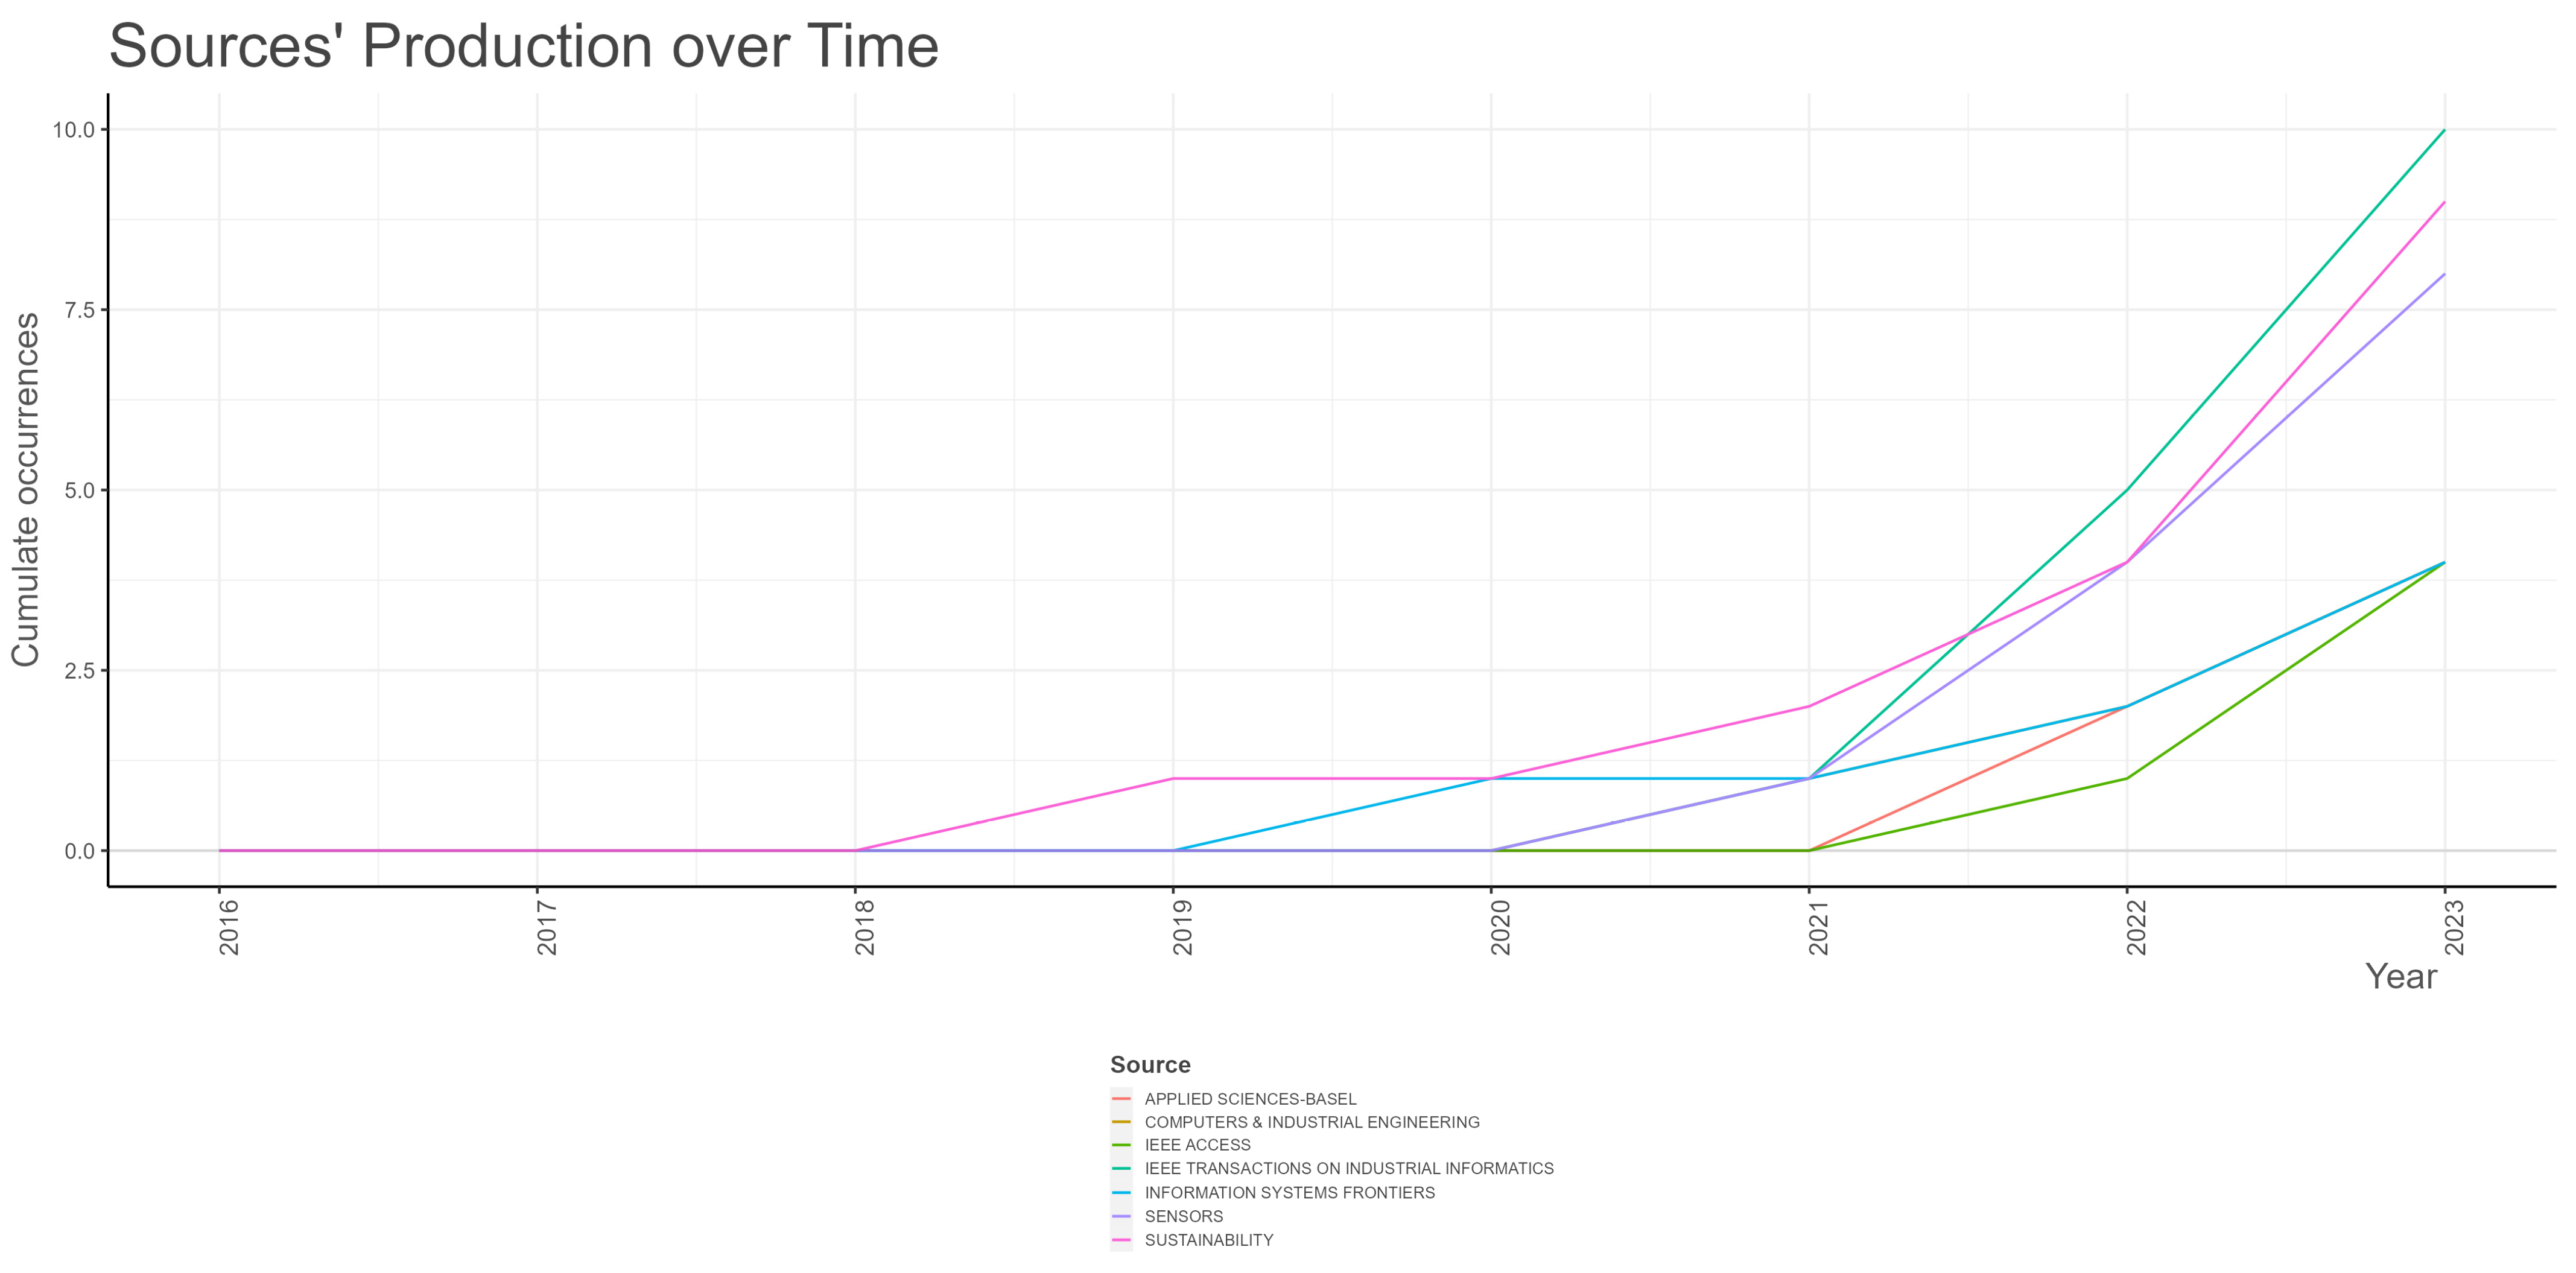
3.2. Sources Exploration
3.3. Authors’ Explanation
4. Literature Review and Mixed Analysis
4.1. Literature Exploration and Review
4.1.1. Top 10 Most Cited Papers—Overview

| No. | Paper (First Author, Year, Journal, Reference) | Number of Authors | Region | Total Citations (TC) | Total Citations per Year (TCY) | Normalized TC (NTC) |
|---|---|---|---|---|---|---|
| 1 | Nahavandi, Saeid, 2019, Applied System Inovation [1] | 1 | Australia | 345 | 57.50 | 1.00 |
| 2 | Choi, Tsan-Ming, 2022, Production and Operations Management [56] | 4 | China | 137 | 45.67 | 7.71 |
| 3 | Pillai Souji Gopalakrishna, 2021, International Journal of Hospitality Management [62] | 4 | USA | 113 | 28.25 | 3.48 |
| 4 | Javed, Abdul Rehman, 2022, Cities [63] | 7 | Australia | 104 | 34.67 | 5.85 |
| 5 | Bednar, Peter M., 2019, Information Systems Frontier [21] | 2 | UK | 98 | 19.60 | 1.98 |
| 6 | Javaid, Mohd, 2929, Journal of Industrial Integration and Management [64] | 2 | India | 70 | 14.00 | 1.41 |
| 7 | Fraga-Lamas, Paula, 2021, Sensors [65] | 3 | Spain, Portugal | 67 | 16.75 | 2.07 |
| 8 | Akundi, Aditya, 2022, Applied System Innovation [3] | 6 | USA | 58 | 19.33 | 3.26 |
| 9 | Sigov, Alexander, 2022, Information Systems Frontier, [68] | 4 | Russia | 58 | 19.33 | 3.26 |
| 10 | Sachsenmeier Peter, 2016, Engineering [69] | 1 | UK | 51 | 5.67 | 1.0 |
4.1.2. Top 10 Most Cited Papers—Review
4.2. Word Analysis
4.2.1. Most Frequent Words in Keywords Plus
4.2.2. Most Frequent Words in Authors’ Keywords
4.2.3. Most Frequent Words in Subject Categories
4.2.4. WordClouds for Keywords Plus and Authors’ Keywords
4.2.5. Bigrams and Trigrams in Abstracts and Titles
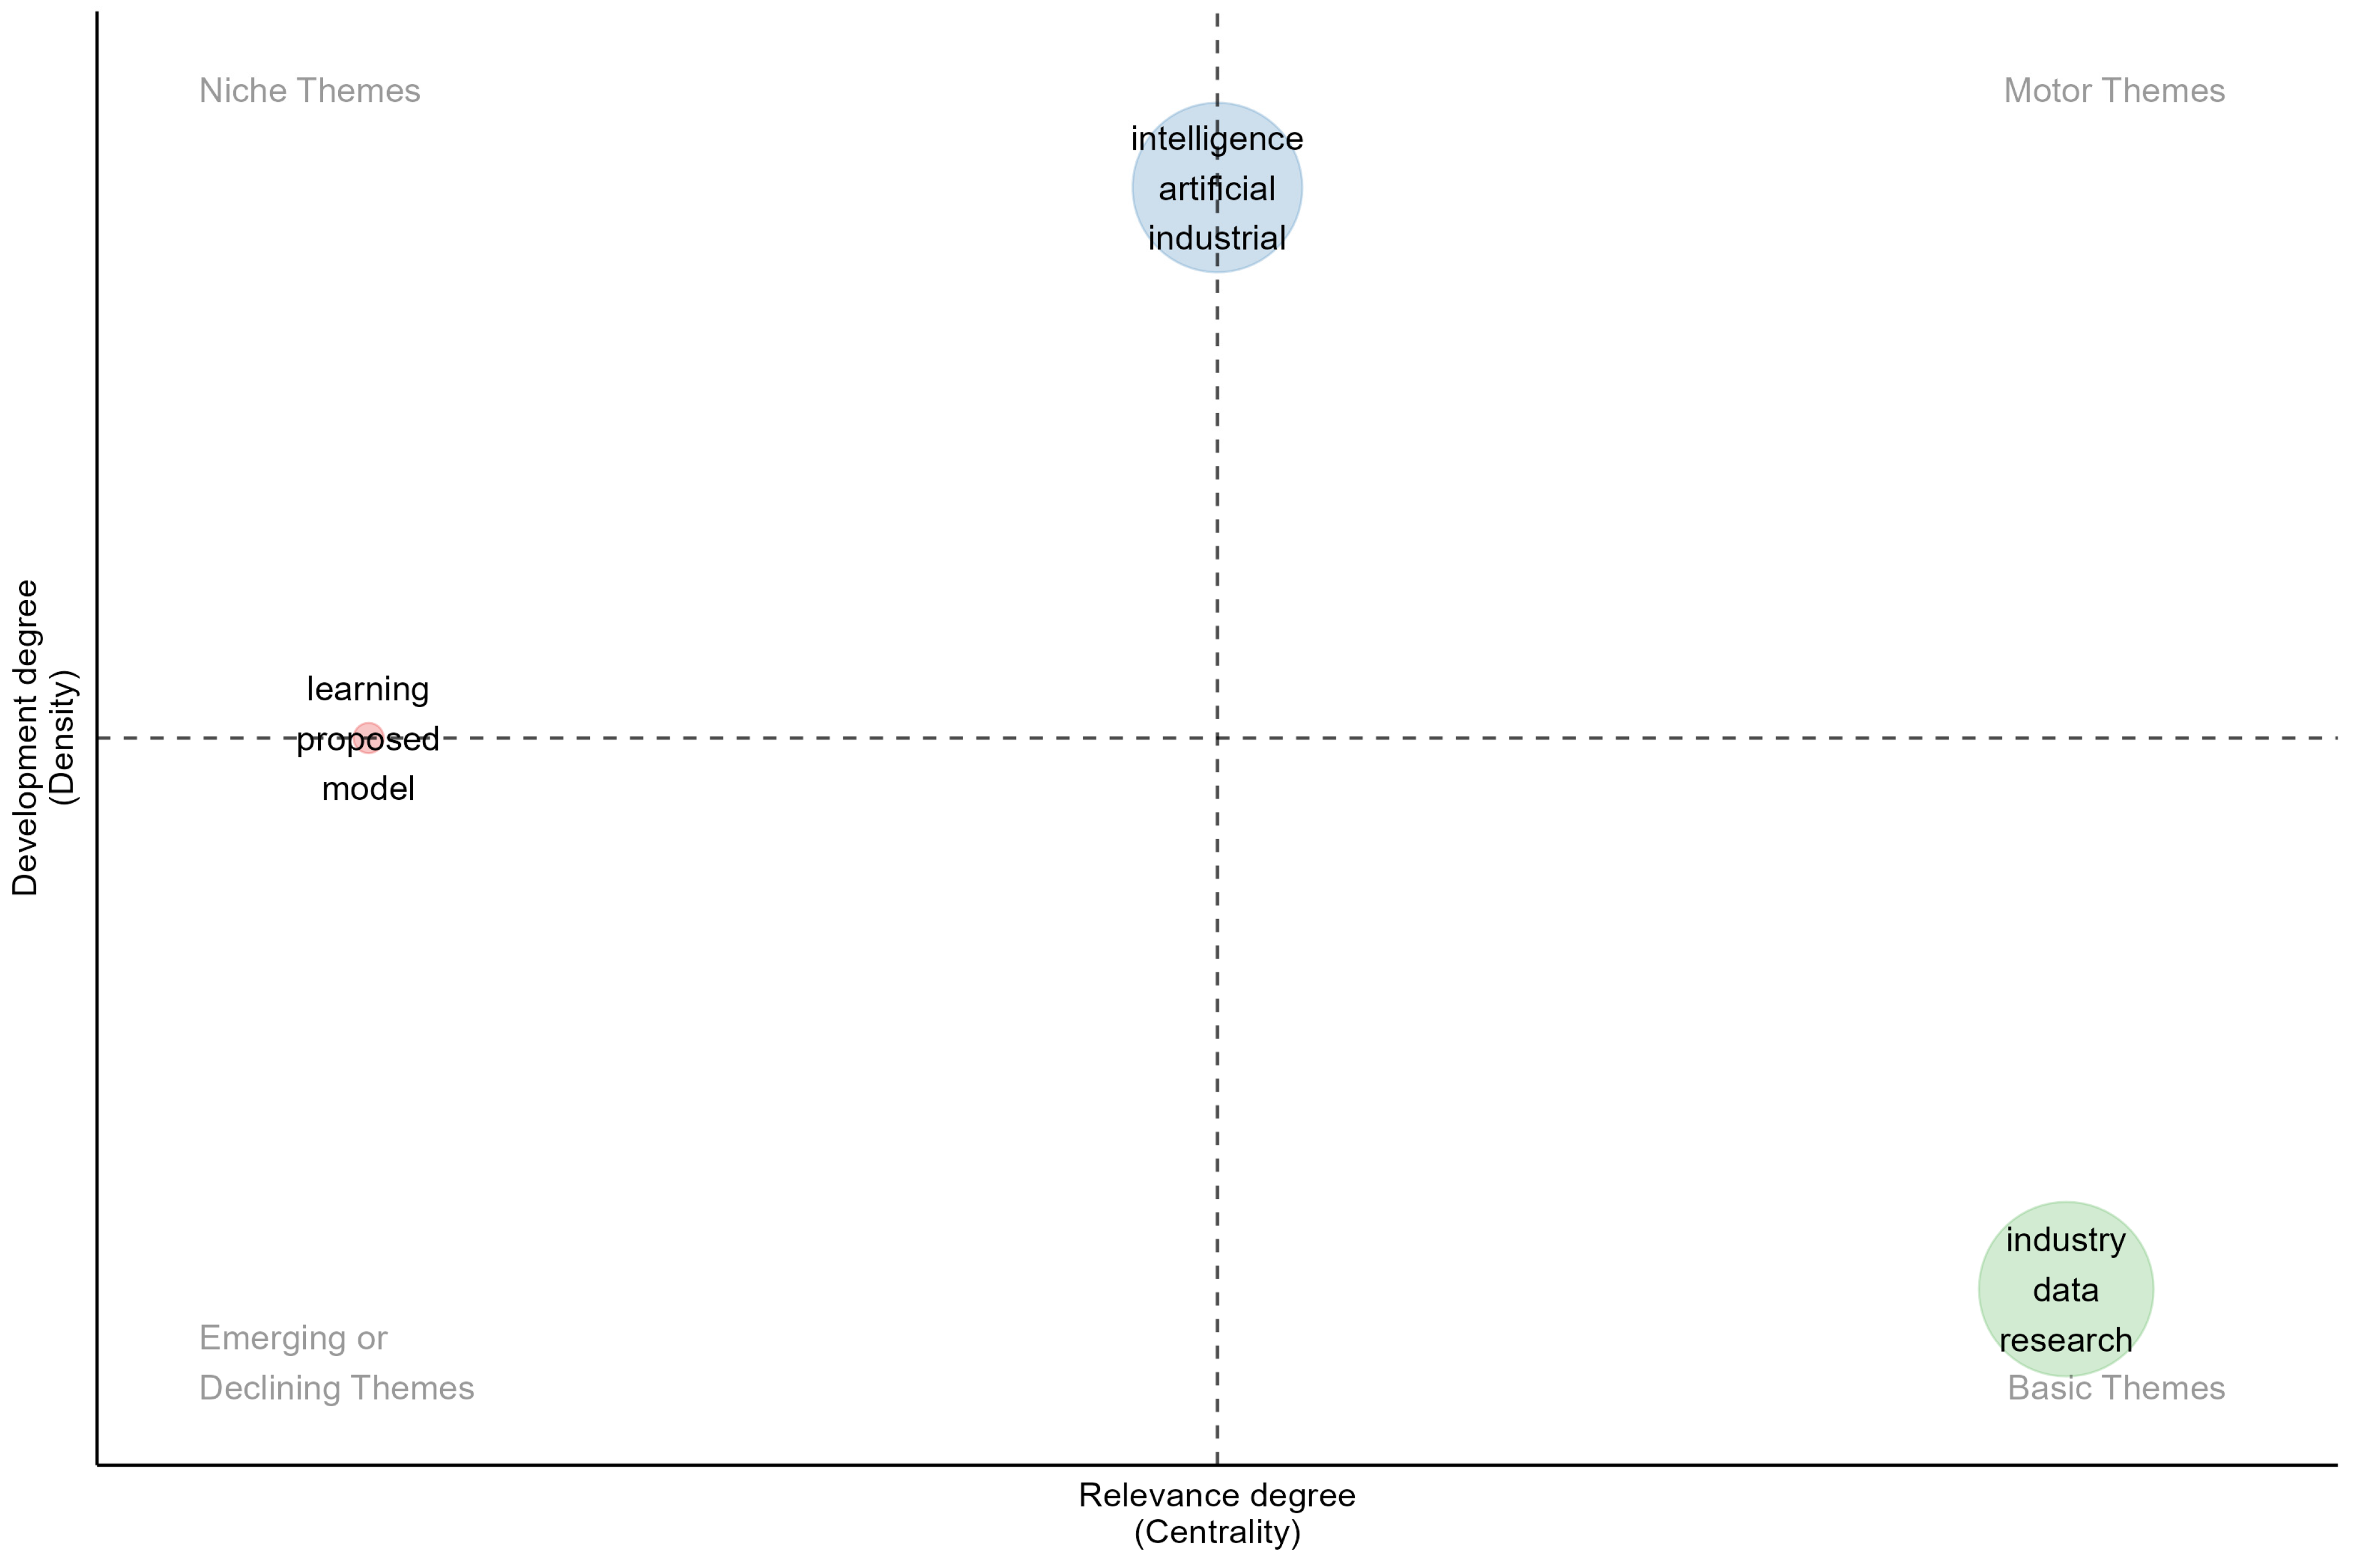
4.2.6. Thematic Map for Titles
4.2.7. Thematic Map for Keywords Plus
4.2.8. Thematic Map for Abstracts
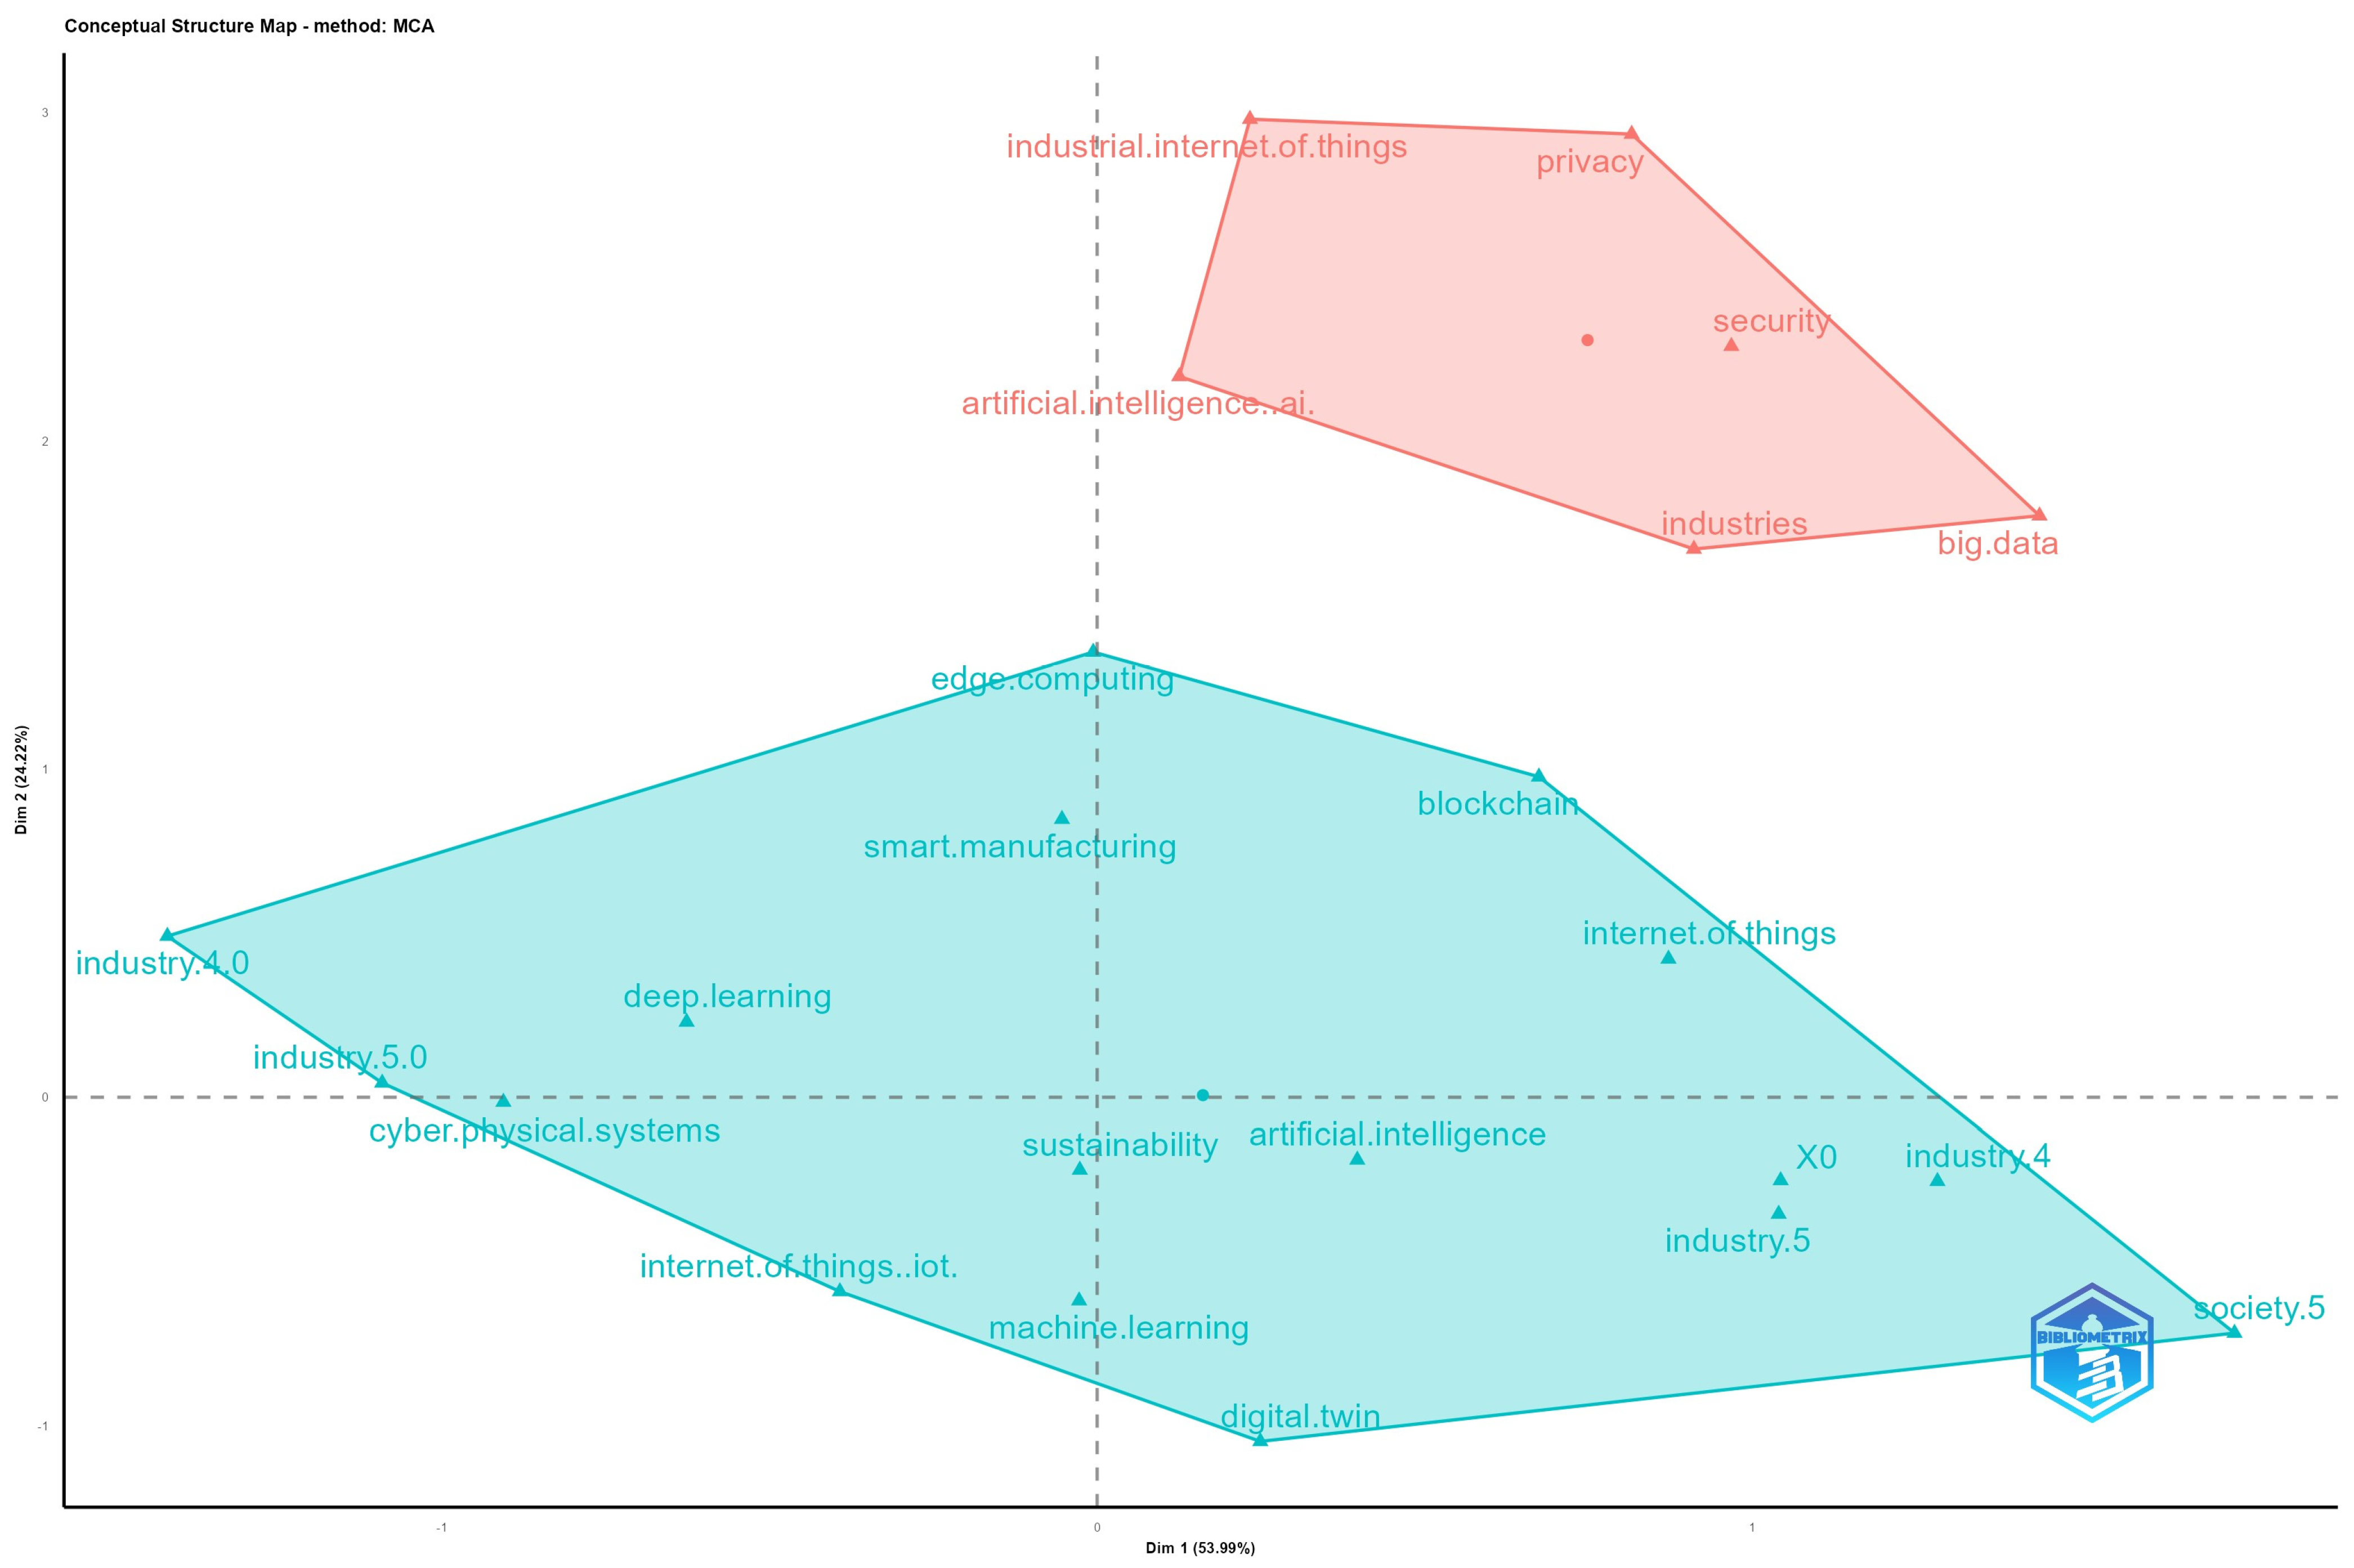
4.2.9. Factorial Analysis
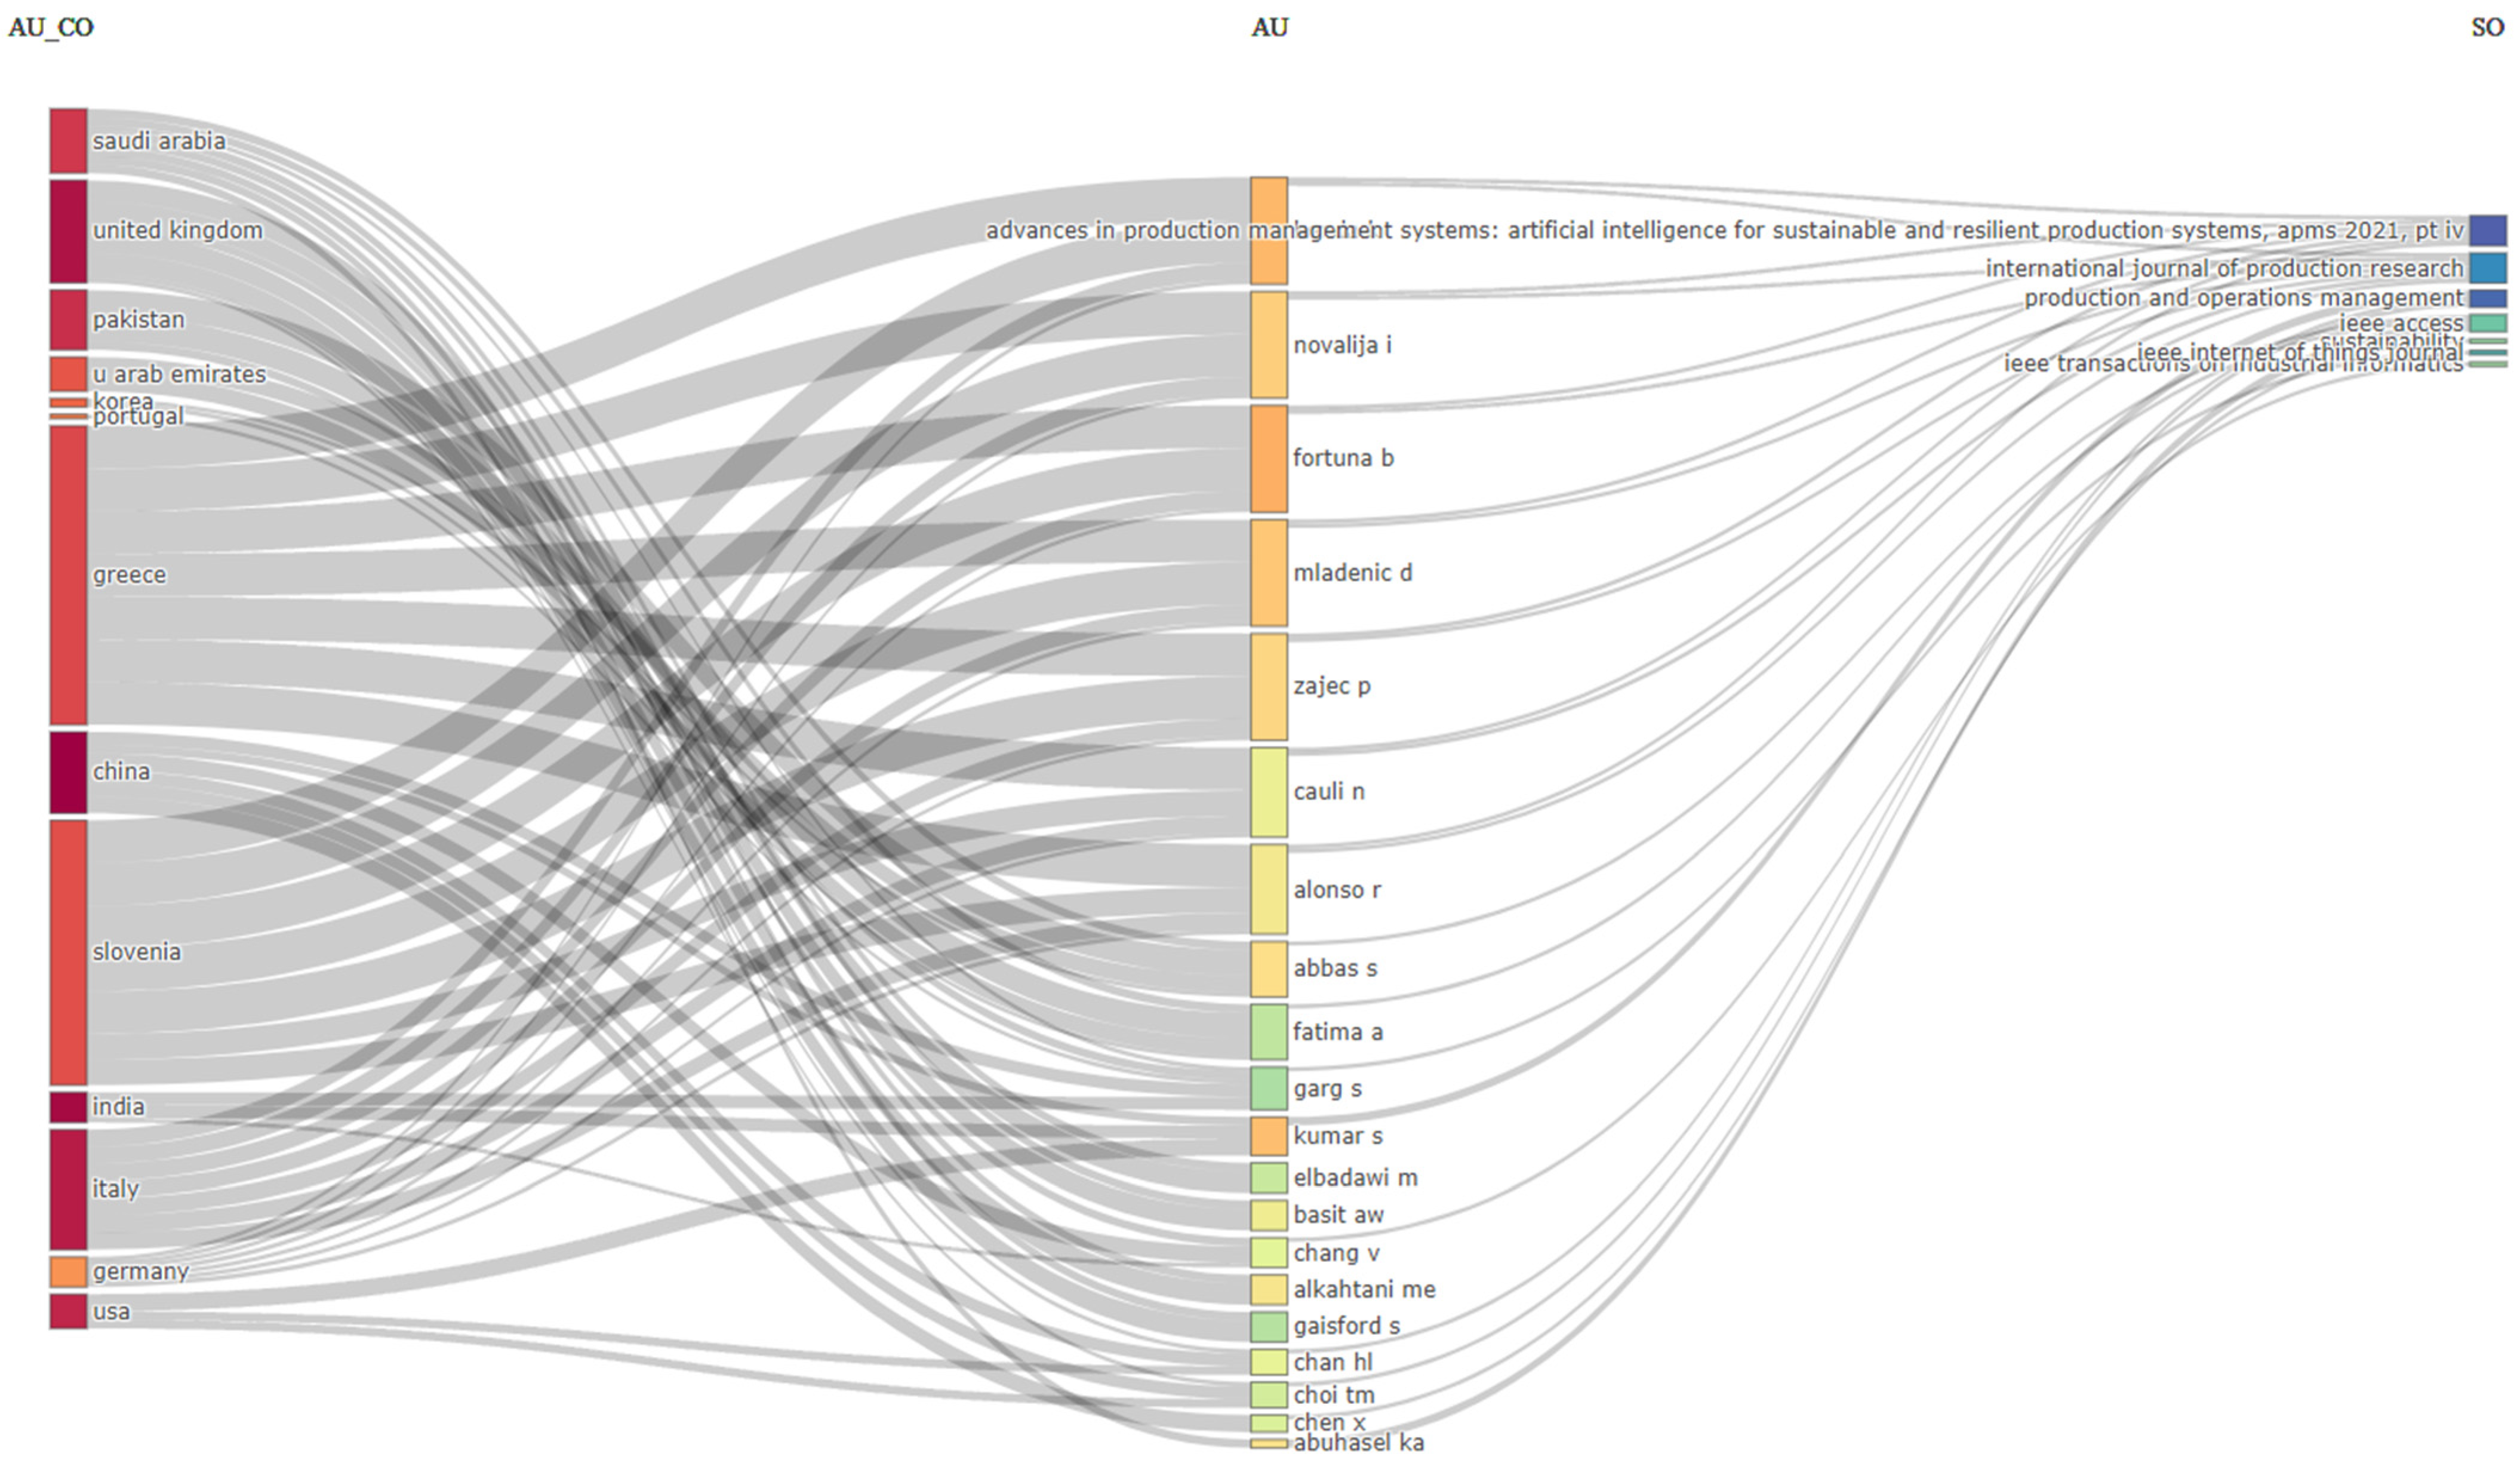
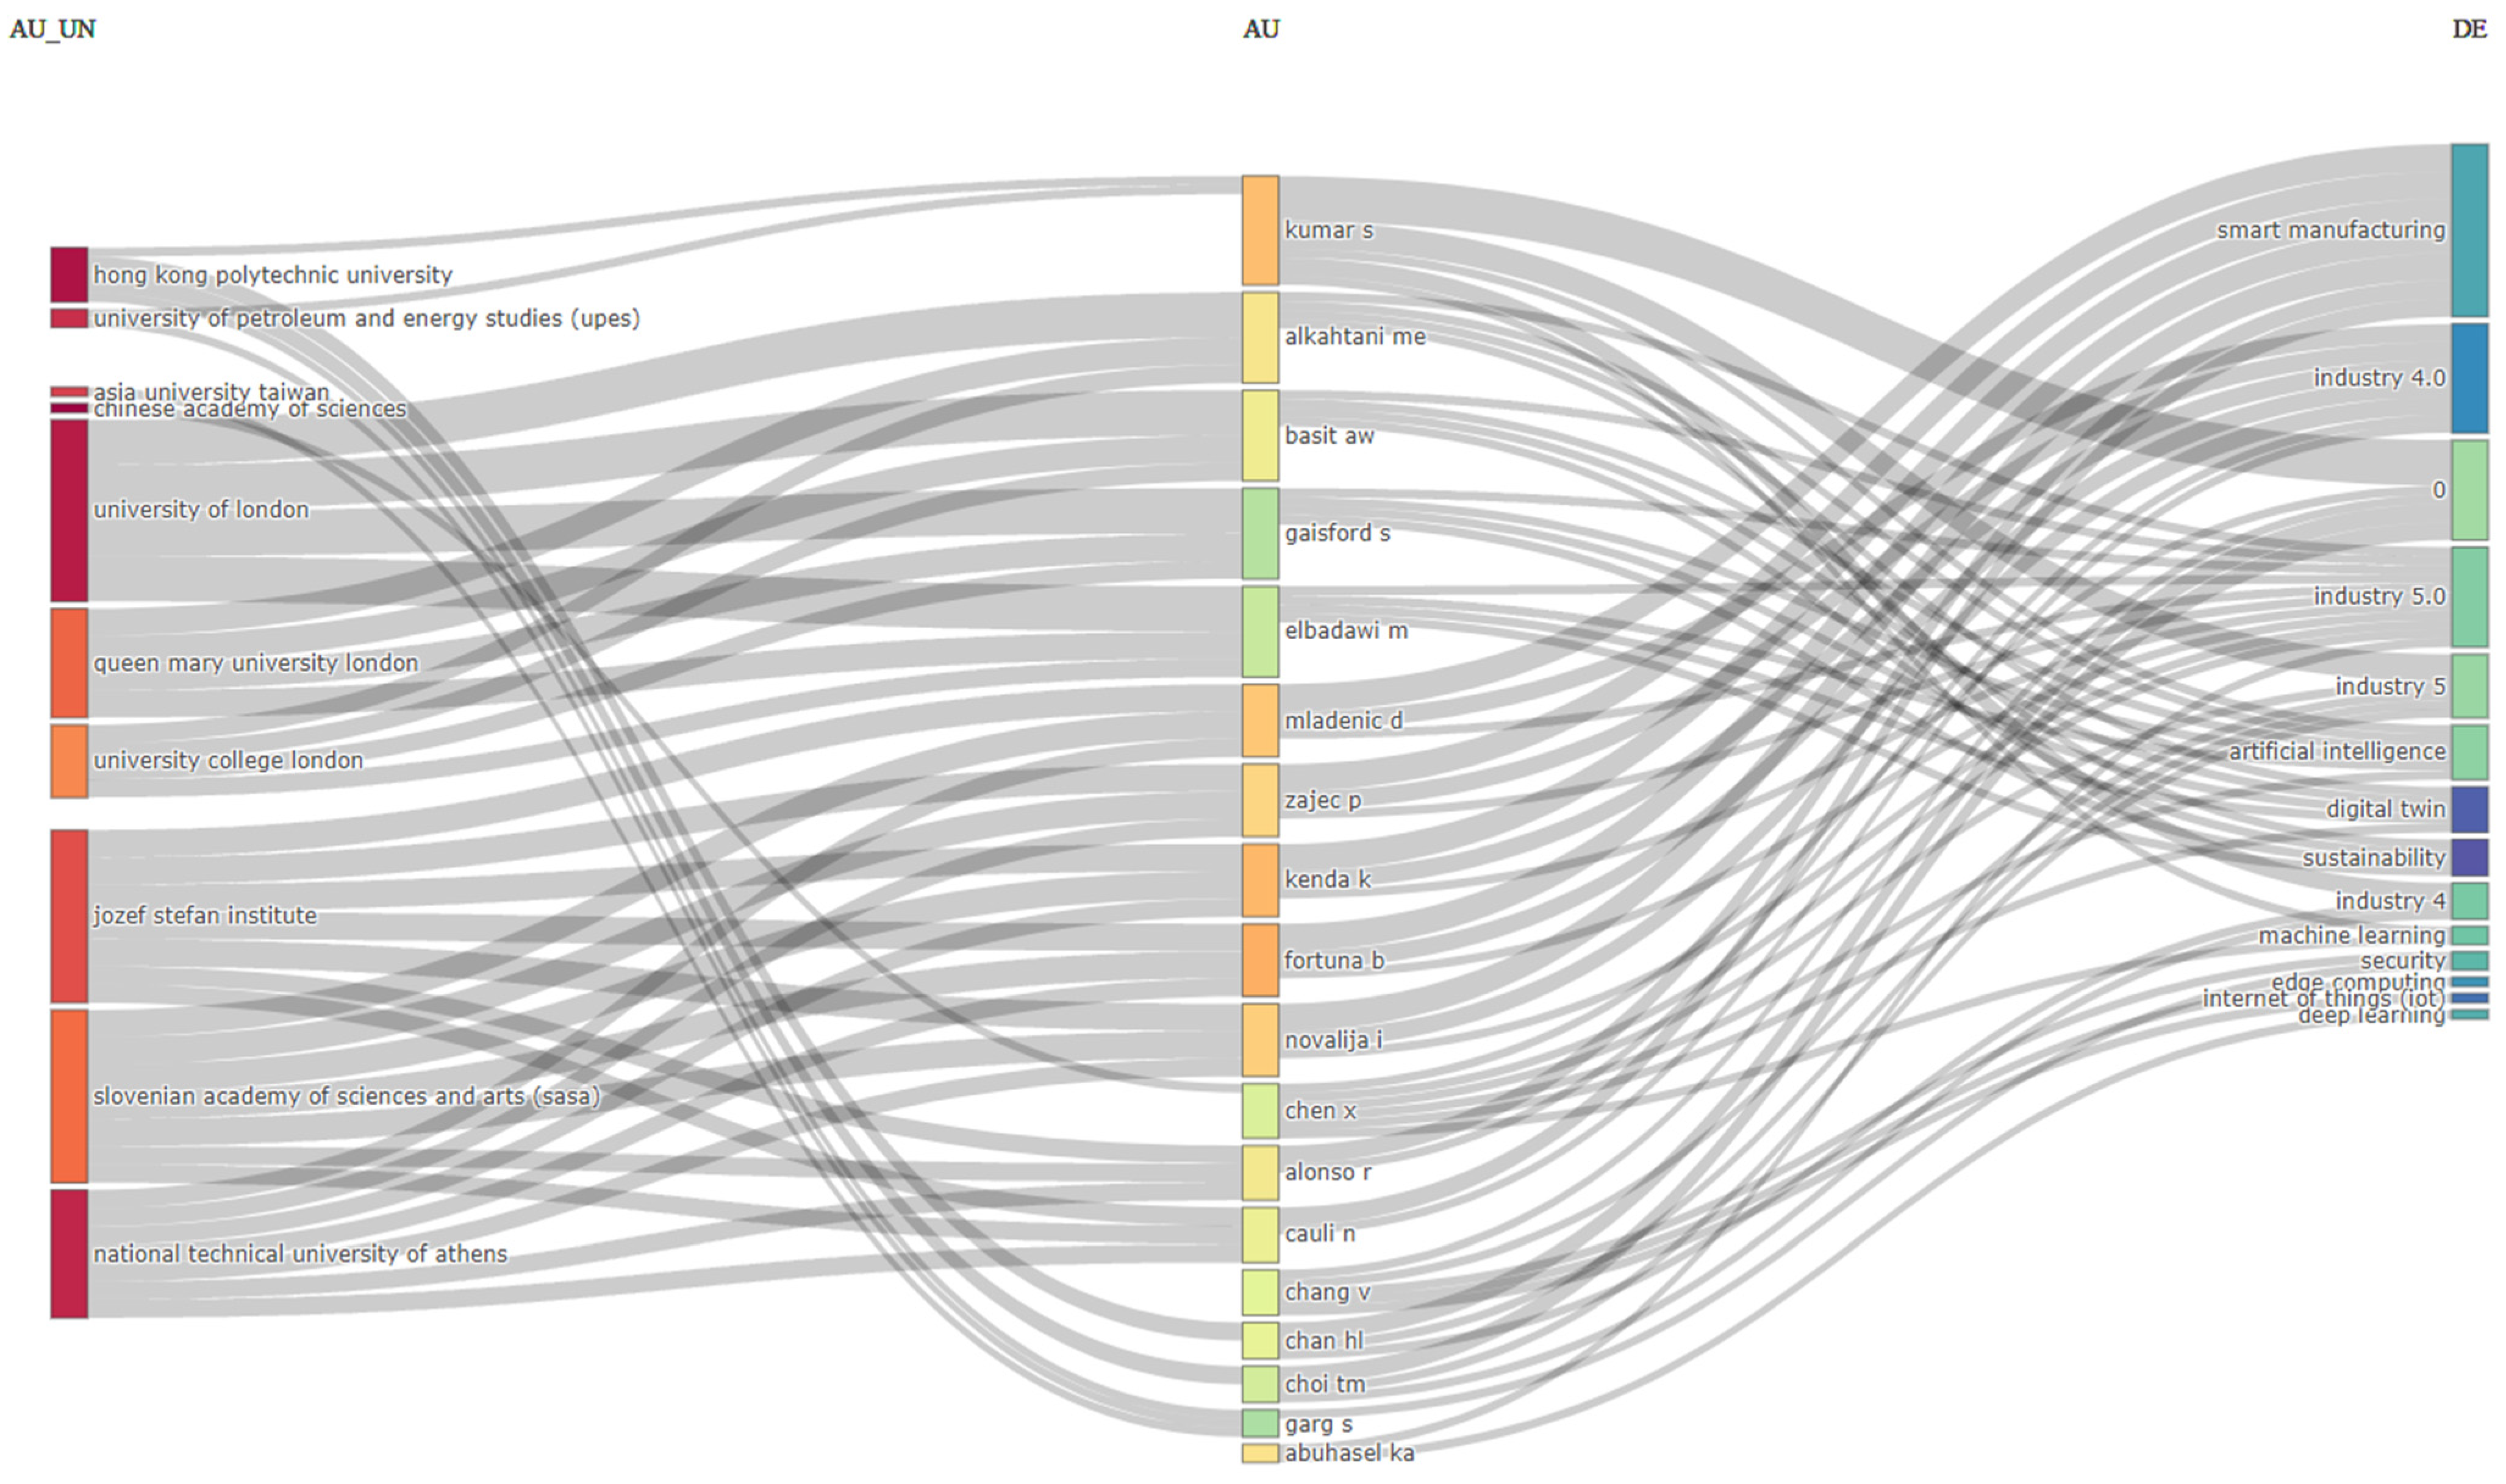
4.3. Mixed Analysis
5. Limitations
6. Conclusions
Author Contributions
Funding
Institutional Review Board Statement
Informed Consent Statement
Data Availability Statement
Acknowledgments
Conflicts of Interest
References
- Nahavandi, S. Industry 5.0—A Human-Centric Solution. Sustainability 2019, 11, 4371. [Google Scholar] [CrossRef]
- Bryndin, E. Formation and Management of Industry 5.0 by Systems with Artificial Intelligence and Technological Singularity. Am. J. Mech. Ind. Eng. 2020, 5, 24–30. [Google Scholar] [CrossRef]
- Akundi, A.; Euresti, D.; Luna, S.; Ankobiah, W.; Lopes, A.; Edinbarough, I. State of Industry 5.0—Analysis and Identification of Current Research Trends. Appl. Syst. Innov. 2022, 5, 27. [Google Scholar] [CrossRef]
- Skobelev, P.O.; Yu, B.S. On the Way from Industry 4.0 to Industry 5.0: From Digital Manufacturing to Digital Society. Industry 4.0 2017, 2, 307–311. [Google Scholar]
- Cao, K.; Liu, Y.; Meng, G.; Sun, Q. An Overview on Edge Computing Research. IEEE Access 2020, 8, 85714–85728. [Google Scholar] [CrossRef]
- Valette, E.; Bril El-Haouzi, H.; Demesure, G. Industry 5.0 and Its Technologies: A Systematic Literature Review upon the Human Place into IoT- and CPS-Based Industrial Systems. Comput. Ind. Eng. 2023, 184, 109426. [Google Scholar] [CrossRef]
- Sun, X.; Ansari, N. EdgeIoT: Mobile Edge Computing for the Internet of Things. IEEE Commun. Mag. 2016, 54, 22–29. [Google Scholar] [CrossRef]
- Khan, F.; Kumar, R.L.; Abidi, M.H.; Kadry, S.; Alkhalefah, H.; Aboudaif, M.K. Federated Split Learning Model for Industry 5.0: A Data Poisoning Defense for Edge Computing. Electronics 2022, 11, 2393. [Google Scholar] [CrossRef]
- Salama, R.; Al-Turjman, F. Sustainable Energy Production in Smart Cities. Available online: https://www.mdpi.com/2071-1050/15/22/16052 (accessed on 16 March 2024).
- Ramos, J.; Drakeford, B.; Madiedo, A.; Costa, J.; Leitão, F. A Bayesian Approach to Infer the Sustainable Use of Artificial Reefs in Fisheries and Recreation. Available online: https://www.mdpi.com/2071-1050/16/2/810 (accessed on 16 March 2024).
- Oprea, S.-V.; Bâra, A. Mind the Gap between PV Generation and Residential Load Curves: Maximizing the Roof-Top PV Usage for Prosumers with an IoT-Based Adaptive Optimization and Control Module. Expert Syst. Appl. 2023, 212, 118828. [Google Scholar] [CrossRef]
- Oprea, S.-V.; Bâra, A. Edge and Fog Computing Using IoT for Direct Load Optimization and Control with Flexibility Services for Citizen Energy Communities. Knowl.-Based Syst. 2021, 228, 107293. [Google Scholar] [CrossRef]
- Oprea, S.-V.; Bâra, A. An Edge-Fog-Cloud Computing Architecture for IoT and Smart Metering Data. Peer-Peer Netw. Appl. 2023, 16, 818–845. [Google Scholar] [CrossRef]
- Coelho, P.; Bessa, C.; Landeck, J.; Silva, C. Industry 5.0: The Arising of a Concept. Procedia Comput. Sci. 2023, 217, 1137–1144. [Google Scholar] [CrossRef]
- Wang, T.; Liang, Y.; Zhang, Y.; Zheng, X.; Arif, M.; Wang, J.; Jin, Q. An Intelligent Dynamic Offloading From Cloud to Edge for Smart IoT Systems With Big Data. IEEE Trans. Netw. Sci. Eng. 2020, 7, 2598–2607. [Google Scholar] [CrossRef]
- Ullah, I.; Adhikari, D.; Su, X.; Palmieri, F.; Wu, C.; Choi, C. Integration of Data Science with the Intelligent IoT (IIoT): Current Challenges and Future Perspectives. Digit. Commun. Netw. 2024, in press. [CrossRef]
- Madhavan, M.; Wangtueai, S.; Sharafuddin, M.A.; Chaichana, T. The Precipitative Effects of Pandemic on Open Innovation of SMEs: A Scientometrics and Systematic Review of Industry 4.0 and Industry 5.0. J. Open Innov. Technol. Mark. Complex. 2022, 8, 152. [Google Scholar] [CrossRef]
- Machado, E.A.; Scavarda, L.F.; Caiado, R.G.G.; Santos, R.S. Industry 4.0 and Sustainability Integration in the Supply Chains of Micro, Small, and Medium Enterprises through People, Process, and Technology within the Triple Bottom Line Perspective. Sustainability 2024, 16, 1141. [Google Scholar] [CrossRef]
- Zimmermann, V.; Gerber, P.; Marky, K.; Böck, L.; Kirchbuchner, F. Florian Kirchbuchner Assessing Users’ Privacy and Security Concerns of Smart Home Technologies. i-com 2019, 18, 197–216. [Google Scholar] [CrossRef]
- Vogt, J. Where Is the Human Got to Go? Artificial Intelligence, Machine Learning, Big Data, Digitalisation, and Human–Robot Interaction in Industry 4.0 and 5.0. AI Soc. 2021, 36, 1083–1087. [Google Scholar] [CrossRef]
- Bednar, P.M.; Welch, C. Socio-Technical Perspectives on Smart Working: Creating Meaningful and Sustainable Systems. Inf. Syst. Front. 2020, 22, 281–298. [Google Scholar] [CrossRef]
- Hunsberger, J.G.; Hickerson, D.H.M. Chapter 78—Biomanufacturing for Regenerative Medicine. In Principles of Tissue Engineering, 5th ed.; Lanza, R., Langer, R., Vacanti, J.P., Atala, A., Eds.; Academic Press: Cambridge, MA, USA, 2020; pp. 1469–1480. ISBN 978-0-12-818422-6. [Google Scholar]
- Selvam, A.; Aggarwal, T.; Mukherjee, M.; Verma, Y.K. Humans and Robots: Friends of the Future? A Bird’s Eye View of Biomanufacturing Industry 5.0. Biotechnol. Adv. 2023, 68, 108237. [Google Scholar] [CrossRef]
- Maddikunta, P.K.R.; Pham, Q.-V.; Prabadevi, B.; Deepa, N.; Dev, K.; Gadekallu, T.R.; Ruby, R.; Liyanage, M. Industry 5.0: A Survey on Enabling Technologies and Potential Applications. J. Ind. Inf. Integr. 2022, 26, 100257. [Google Scholar] [CrossRef]
- Leitner, G.; Felfernig, A.; Blazek, P.; Reinfrank, F.; Ninaus, G. Chapter 8—User Interfaces for Configuration Environments. In Knowledge-Based Configuration; Felfernig, A., Hotz, L., Bagley, C., Tiihonen, J., Eds.; Morgan Kaufmann: Boston, MA, USA, 2014; pp. 89–106. ISBN 978-0-12-415817-7. [Google Scholar]
- Korneev, N.V. Intelligent Complex Security Management System FEC for the Industry 5.0. IOP Conf. Ser. Mater. Sci. Eng. 2020, 950, 012016. [Google Scholar] [CrossRef]
- Sumathi, D.; Karthikeyan, S.; Sivaprakash, P.; Selvaraj, P. Chapter Eleven—5G Communication for Edge Computing. In Advances in Computers; Raj, P., Saini, K., Surianarayanan, C., Eds.; Edge/Fog Computing Paradigm: The Concept Platforms and Applications; Elsevier: Amsterdam, The Netherlands, 2022; Volume 127, pp. 307–331. [Google Scholar]
- Merigó, J.M.; Mas-Tur, A.; Roig-Tierno, N.; Ribeiro-Soriano, D. A Bibliometric Overview of the Journal of Business Research between 1973 and 2014. J. Bus. Res. 2015, 68, 2645–2653. [Google Scholar] [CrossRef]
- Block, J.H.; Fisch, C. Eight Tips and Questions for Your Bibliographic Study in Business and Management Research. Manag. Rev. Q. 2020, 70, 307–312. [Google Scholar] [CrossRef]
- Bakır, M.; Özdemir, E.; Akan, Ş.; Atalık, Ö. A Bibliometric Analysis of Airport Service Quality. J. Air Transp. Manag. 2022, 104, 102273. [Google Scholar] [CrossRef]
- Cobo, M.J.; Martínez, M.A.; Gutiérrez-Salcedo, M.; Fujita, H.; Herrera-Viedma, E. 25years at Knowledge-Based Systems: A Bibliometric Analysis. Knowl.-Based Syst. 2015, 80, 3–13. [Google Scholar] [CrossRef]
- Mulet-Forteza, C.; Martorell-Cunill, O.; Merigó, J.M.; Genovart-Balaguer, J.; Mauleon-Mendez, E. Twenty Five Years of the Journal of Travel & Tourism Marketing: A Bibliometric Ranking. J. Travel. Tour. Mark. 2018, 35, 1201–1221. [Google Scholar] [CrossRef]
- Domenteanu, A.; Delcea, C.; Chiriță, N.; Ioanăș, C. From Data to Insights: A Bibliometric Assessment of Agent-Based Modeling Applications in Transportation. Appl. Sci. 2023, 13, 12693. [Google Scholar] [CrossRef]
- Cibu, B.; Delcea, C.; Domenteanu, A.; Dumitrescu, G. Mapping the Evolution of Cybernetics: A Bibliometric Perspective. Computers 2023, 12, 237. [Google Scholar] [CrossRef]
- Liu, W. A Matter of Time: Publication Dates in Web of Science Core Collection. Scientometrics 2021, 126, 849–857. [Google Scholar] [CrossRef]
- WoS Document Types. Available online: https://webofscience.help.clarivate.com/en-us/Content/document-types.html (accessed on 3 December 2023).
- Fatma, N.; Haleem, A. Exploring the Nexus of Eco-Innovation and Sustainable Development: A Bibliometric Review and Analysis. Sustainability 2023, 15, 12281. [Google Scholar] [CrossRef]
- Aria, M.; Cuccurullo, C. Bibliometrix: An R-Tool for Comprehensive Science Mapping Analysis. J. Informetr. 2017, 11, 959–975. [Google Scholar] [CrossRef]
- Costas, R.; Bordons, M.; van Leeuwen, T.N.; van Raan, A.F.J. Scaling Rules in the Science System: Influence of Field-Specific Citation Characteristics on the Impact of Individual Researchers. J. Am. Soc. Inf. Sci. Technol. 2009, 60, 740–753. [Google Scholar] [CrossRef]
- Tahamtan, I.; Safipour Afshar, A.; Ahamdzadeh, K. Factors Affecting Number of Citations: A Comprehensive Review of the Literature. Scientometrics 2016, 107, 1195–1225. [Google Scholar] [CrossRef]
- Alqasemi, F.; Al-Hagree, S.; Shaddad, R.Q.; Zahary, A.T. An IEEE Xplore Database Literature Review Concerning Internet of Everything During 2020–2021. In Proceedings of the 2021 International Conference on Intelligent Technology, System and Service for Internet of Everything (ITSS-IoE), Sana’a, Yemen, 1–2 November 2021; pp. 1–8. [Google Scholar]
- Yang, J.-M.; Tseng, S.-F.; Won, Y.-L. A Bibliometric Analysis on Data Mining Using Bradford’s Law. In Proceedings of the 3rd International Conference on Intelligent Technologies and Engineering Systems (ICITES2014); Juang, J., Ed.; Springer International Publishing: Cham, Switzerland, 2016; pp. 613–620. [Google Scholar]
- Biblioshiny. Available online: https://www.bibliometrix.org/home/index.php/layout/biblioshiny (accessed on 10 January 2024).
- Xu, X.; Gou, X.; Zhang, W.; Zhao, Y.; Xu, Z. A Bibliometric Analysis of Carbon Neutrality: Research Hotspots and Future Directions. Heliyon 2023, 9, e18763. [Google Scholar] [CrossRef] [PubMed]
- Dong, F.; Zhang, Y.; Zhang, X.; Hu, M.; Gao, Y.; Zhu, J. Exploring Ecological Civilization Performance and Its Determinants in Emerging Industrialized Countries: A New Evaluation System in the Case of China. J. Clean. Prod. 2021, 315, 128051. [Google Scholar] [CrossRef]
- Ikudayisi, A.E.; Chan, A.P.C.; Darko, A.; Adedeji, Y.M.D. Integrated Practices in the Architecture, Engineering, and Construction Industry: Current Scope and Pathway towards Industry 5.0. J. Build. Eng. 2023, 73, 106788. [Google Scholar] [CrossRef]
- Barata, J.; Kayser, I. Industry 5.0—Past, Present, and Near Future. Procedia Comput. Sci. 2023, 219, 778–788. [Google Scholar] [CrossRef]
- Rožanec, J.M.; Novalija, I.; Zajec, P.; Kenda, K.; Tavakoli Ghinani, H.; Suh, S.; Veliou, E.; Papamartzivanos, D.; Giannetsos, T.; Menesidou, S.A.; et al. Human-Centric Artificial Intelligence Architecture for Industry 5.0 Applications. Int. J. Prod. Res. 2023, 61, 6847–6872. [Google Scholar] [CrossRef]
- Rožanec, J.M.; Zajec, P.; Kenda, K.; Novalija, I.; Fortuna, B.; Mladenić, D.; Veliou, E.; Papamartzivanos, D.; Giannetsos, T.; Menesidou, S.A.; et al. STARdom: An Architecture for Trusted and Secure Human-Centered Manufacturing Systems. In Proceedings of the Advances in Production Management Systems. Artificial Intelligence for Sustainable and Resilient Production Systems; Dolgui, A., Bernard, A., Lemoine, D., von Cieminski, G., Romero, D., Eds.; Springer International Publishing: Cham, Switzerland, 2021; pp. 199–207. [Google Scholar]
- Rožanec, J.; Trajkova, E.; Novalija, I.; Zajec, P.; Kenda, K.; Fortuna, B.; Mladenić, D. Enriching Artificial Intelligence Explanations with Knowledge Fragments. Future Internet 2022, 14, 134. [Google Scholar] [CrossRef]
- Li, H.; Alkahtani, M.E.; Basit, A.W.; Elbadawi, M.; Gaisford, S. Optimizing Environmental Sustainability in Pharmaceutical 3D Printing through Machine Learning. Int. J. Pharm. 2023, 648, 123561. [Google Scholar] [CrossRef]
- Sun, S.; Alkahtani, M.E.; Gaisford, S.; Basit, A.W.; Elbadawi, M.; Orlu, M. Virtually Possible: Enhancing Quality Control of 3D-Printed Medicines with Machine Vision Trained on Photorealistic Images. Available online: https://www.mdpi.com/1999-4923/15/11/2630 (accessed on 17 January 2024).
- Abbas, S.; Issa, G.F.; Fatima, A.; Abbas, T.; Ghazal, T.M.; Ahmad, M.; Yeun, C.Y.; Khan, M.A. Fused Weighted Federated Deep Extreme Machine Learning Based on Intelligent Lung Cancer Disease Prediction Model for Healthcare 5.0. Int. J. Intell. Syst. 2023, 2023, e2599161. [Google Scholar] [CrossRef]
- Khan, T.A.; Fatima, A.; Shahzad, T.; Atta-Ur-Rahman; Alissa, K.; Ghazal, T.M.; Al-Sakhnini, M.M.; Abbas, S.; Khan, M.A.; Ahmed, A. Secure IoMT for Disease Prediction Empowered With Transfer Learning in Healthcare 5.0, the Concept and Case Study. IEEE Access 2023, 11, 39418–39430. [Google Scholar] [CrossRef]
- Charitidis, C.; Sebastiani, M.; Goldbeck, G. Fostering Research and Innovation in Materials Manufacturing for Industry 5.0: The Key Role of Domain Intertwining between Materials Characterization, Modelling and Data Science. Mater. Des. 2022, 223, 111229. [Google Scholar] [CrossRef]
- Choi, T.; Kumar, S.; Yue, X.; Chan, H. Disruptive Technologies and Operations Management in the Industry 4.0 Era and Beyond. Prod. Oper. Manag. 2022, 31, 9–31. [Google Scholar] [CrossRef]
- Konstantopoulos, G.; Charitidis, C.A.; Bañares, M.A.; Portela, R.; Zangenberg, N.; Capria, E.; Sebastiani, M.; Goldbeck, G.; Koumoulos, E.; Boskovic, B.; et al. Materials Characterisation and Software Tools as Key Enablers in Industry 5.0 and Wider Acceptance of New Methods and Products. Mater. Today Commun. 2023, 36, 106607. [Google Scholar] [CrossRef]
- Chan, H.-L.; Choi, T.-M. Logistics Management for the Future: The IJLRA Framework. Int. J. Logist. Res. Appl. 2023, 1–19. [Google Scholar] [CrossRef]
- Delcea, C.; Javed, S.A.; Florescu, M.-S.; Ioanas, C.; Cotfas, L.-A. 35 Years of Grey System Theory in Economics and Education. Kybernetes 2023. ahead-of-print. [Google Scholar] [CrossRef]
- Sandu, A.; Cotfas, L.-A.; Delcea, C.; Crăciun, L.; Molănescu, A.G. Sentiment Analysis in the Age of COVID-19: A Bibliometric Perspective. Information 2023, 14, 659. [Google Scholar] [CrossRef]
- Sandu, A.; Ioanăș, I.; Delcea, C.; Geantă, L.-M.; Cotfas, L.-A. Mapping the Landscape of Misinformation Detection: A Bibliometric Approach. Information 2024, 15, 60. [Google Scholar] [CrossRef]
- Pillai, S.G.; Haldorai, K.; Seo, W.S.; Kim, W.G. COVID-19 and Hospitality 5.0: Redefining Hospitality Operations. Int. J. Hosp. Manag. 2021, 94, 102869. [Google Scholar] [CrossRef]
- Javed, A.R.; Shahzad, F.; ur Rehman, S.; Zikria, Y.B.; Razzak, I.; Jalil, Z.; Xu, G. Future Smart Cities: Requirements, Emerging Technologies, Applications, Challenges, and Future Aspects. Cities 2022, 129, 103794. [Google Scholar] [CrossRef]
- Javaid, M.; Haleem, A. Critical Components of Industry 5.0 Towards a Successful Adoption in the Field of Manufacturing. J. Ind. Intg. Mgmt. 2020, 05, 327–348. [Google Scholar] [CrossRef]
- Fraga-Lamas, P.; Lopes, S.I.; Fernández-Caramés, T.M. Green IoT and Edge AI as Key Technological Enablers for a Sustainable Digital Transition towards a Smart Circular Economy: An Industry 5.0 Use Case. Sensors 2021, 21, 5745. [Google Scholar] [CrossRef] [PubMed]
- The Greenhouse Effect. British Geological Survey. Available online: https://www.bgs.ac.uk/discovering-geology/climate-change/how-does-the-greenhouse-effect-work/ (accessed on 9 January 2024).
- Martin, L.; González-Romo, M.; Sahnoun, M.; Bettayeb, B.; He, N.; Gao, J. Effect of Human-Robot Interaction on the Fleet Size of AIV Transporters in FMS. In Proceedings of the 2021 1st International Conference On Cyber Management And Engineering (CyMaEn), Hammamet, Tunisia, 26–28 May 2021; pp. 1–5. [Google Scholar]
- Sigov, A.; Ratkin, L.; Ivanov, L.A.; Xu, L.D. Emerging Enabling Technologies for Industry 4.0 and Beyond. Inf. Syst. Front. 2022, 1–11. [Google Scholar] [CrossRef]
- Sachsenmeier, P. Industry 5.0—The Relevance and Implications of Bionics and Synthetic Biology. Engineering 2016, 2, 225–229. [Google Scholar] [CrossRef]
- Kosky, P.; Balmer, R.; Keat, W.; Wise, G. Chapter 14—Bioengineering. In Exploring Engineering, 3rd ed.; Kosky, P., Balmer, R., Keat, W., Wise, G., Eds.; Academic Press: Boston, MA, USA, 2013; pp. 301–316. ISBN 978-0-12-415891-7. [Google Scholar]
- Singh, S.P.; Bansal, S.; Pandey, A. Chapter 1—Basics and Roots of Synthetic Biology. In Current Developments in Biotechnology and Bioengineering; Singh, S.P., Pandey, A., Du, G., Kumar, S., Eds.; Elsevier: Amsterdam, The Netherlands, 2019; pp. 3–22. ISBN 978-0-444-64085-7. [Google Scholar]
- Naveen, S.; Kounte, M.R. In Search of the Future Technologies: Fusion of Machine Learning, Fog and Edge Computing in the Internet of Things. In Proceedings of the Proceeding of the International Conference on Computer Networks, Big Data and IoT (ICCBI—2018); Pandian, A.P., Senjyu, T., Islam, S.M.S., Wang, H., Eds.; Springer International Publishing: Cham, Switzerland, 2020; pp. 278–285. [Google Scholar]
- Agbo, F.J.; Oyelere, S.S.; Suhonen, J.; Tukiainen, M. Scientific Production and Thematic Breakthroughs in Smart Learning Environments: A Bibliometric Analysis. Smart Learn. Environ. 2021, 8, 1. [Google Scholar] [CrossRef]
- Abdi, H.; Valentin, D. Multiple Correspondence Analysis. Encycl. Meas. Stat. 2007, 2, 651–657. [Google Scholar]


| Section | Elements |
|---|---|
| Exploratory Analysis of the Dataset | Timespan |
| Sources | |
| Documents | |
| Average years from publication | |
| Average citations per document | |
| Average citations per year per document | |
| Keywords plus | |
| Author’s keywords | |
| References | |
| Authors | |
| Author appearances | |
| Authors of single-authored documents | |
| Authors of multi-authored documents | |
| Single-authored documents | |
| Documents per author | |
| Authors per document | |
| Co-authors per document | |
| Collaboration index | |
| Annual scientific production and average citations per year | |
| Top 10 most relevant journals | |
| Bradford’s law on source clustering | |
| Journals’ impact based on the h-index | |
| Journals’ growth (cumulative) based on the number of papers | |
| Top 10 authors based on the number of documents | |
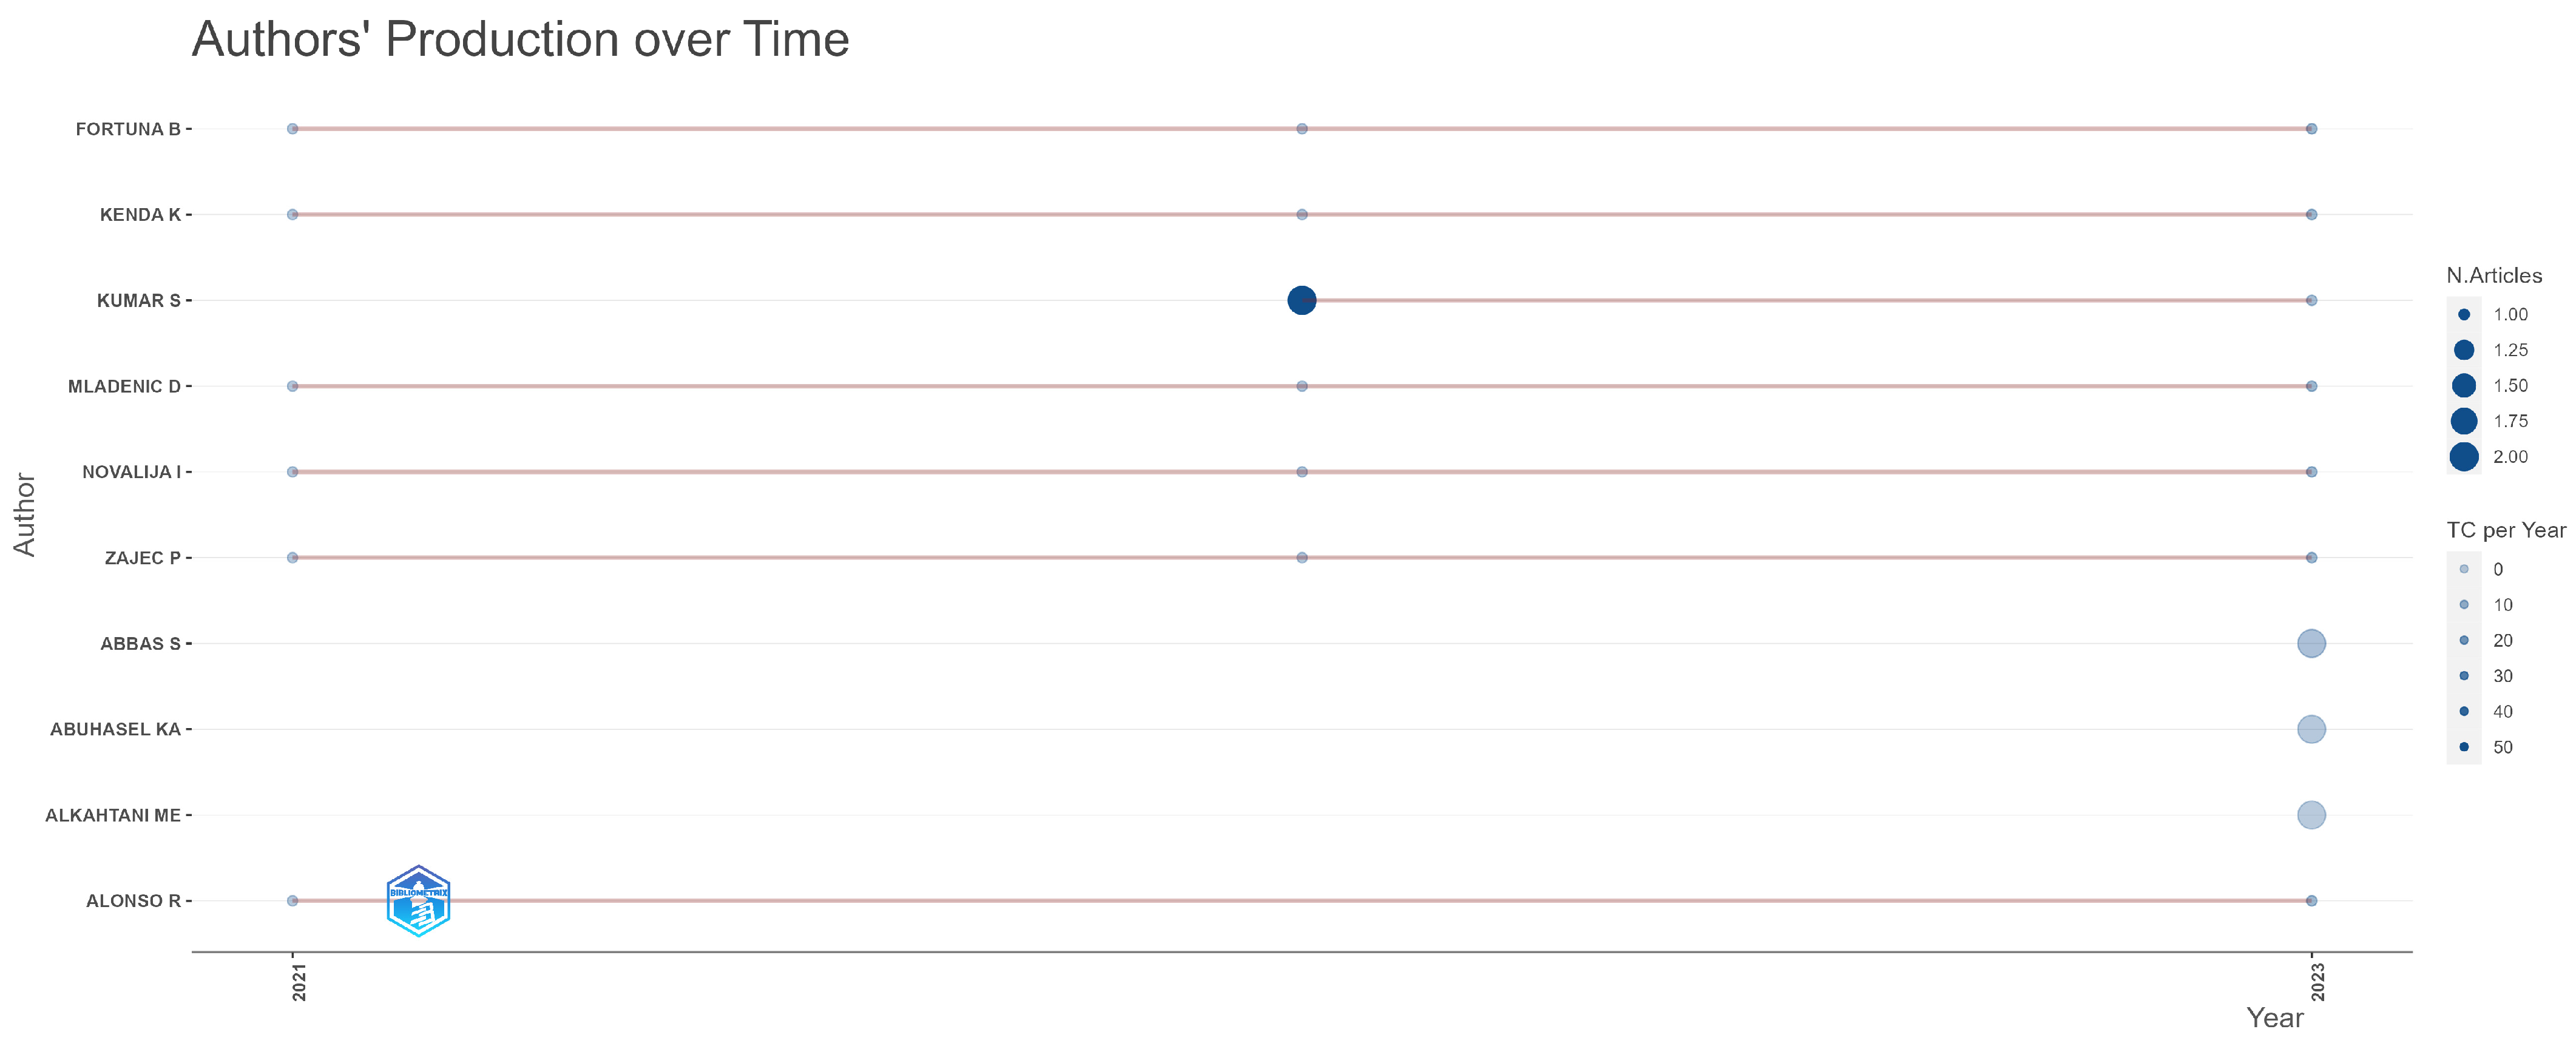
| Top 10 authors’ production over time | |
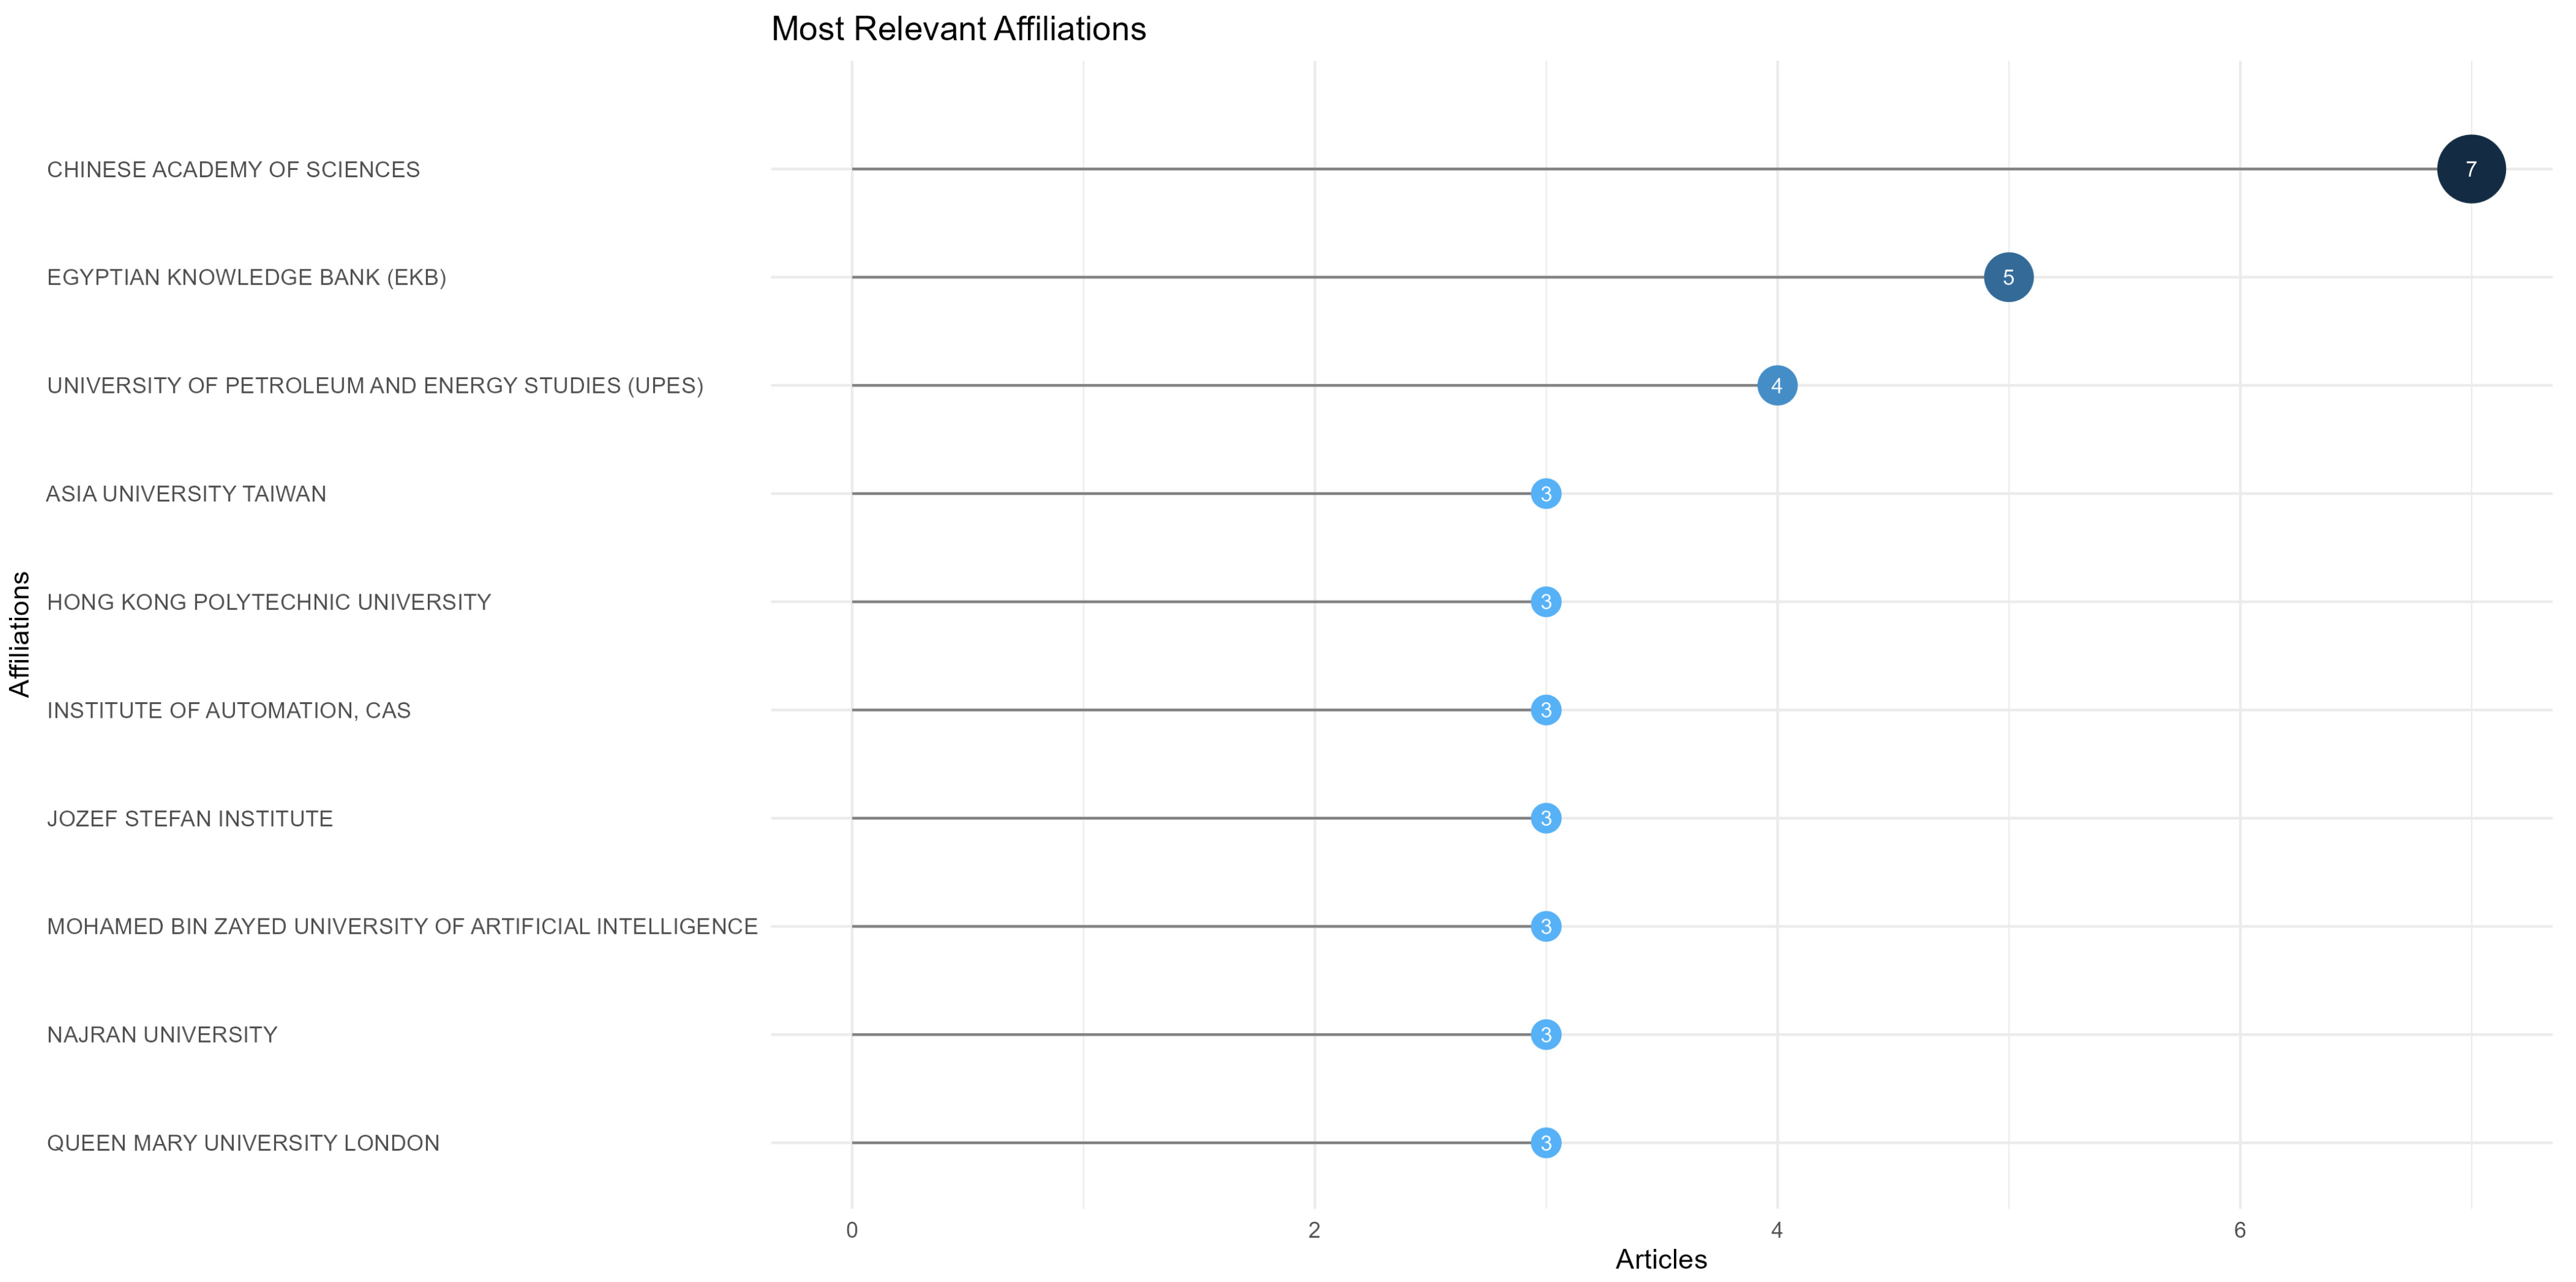
| Top 10 most relevant affiliations | |
| Top 10 most relevant corresponding authors’ countries | |
| Scientific production based on country | |
| Top 10 countries with the most citations | |
| Country collaboration map | |
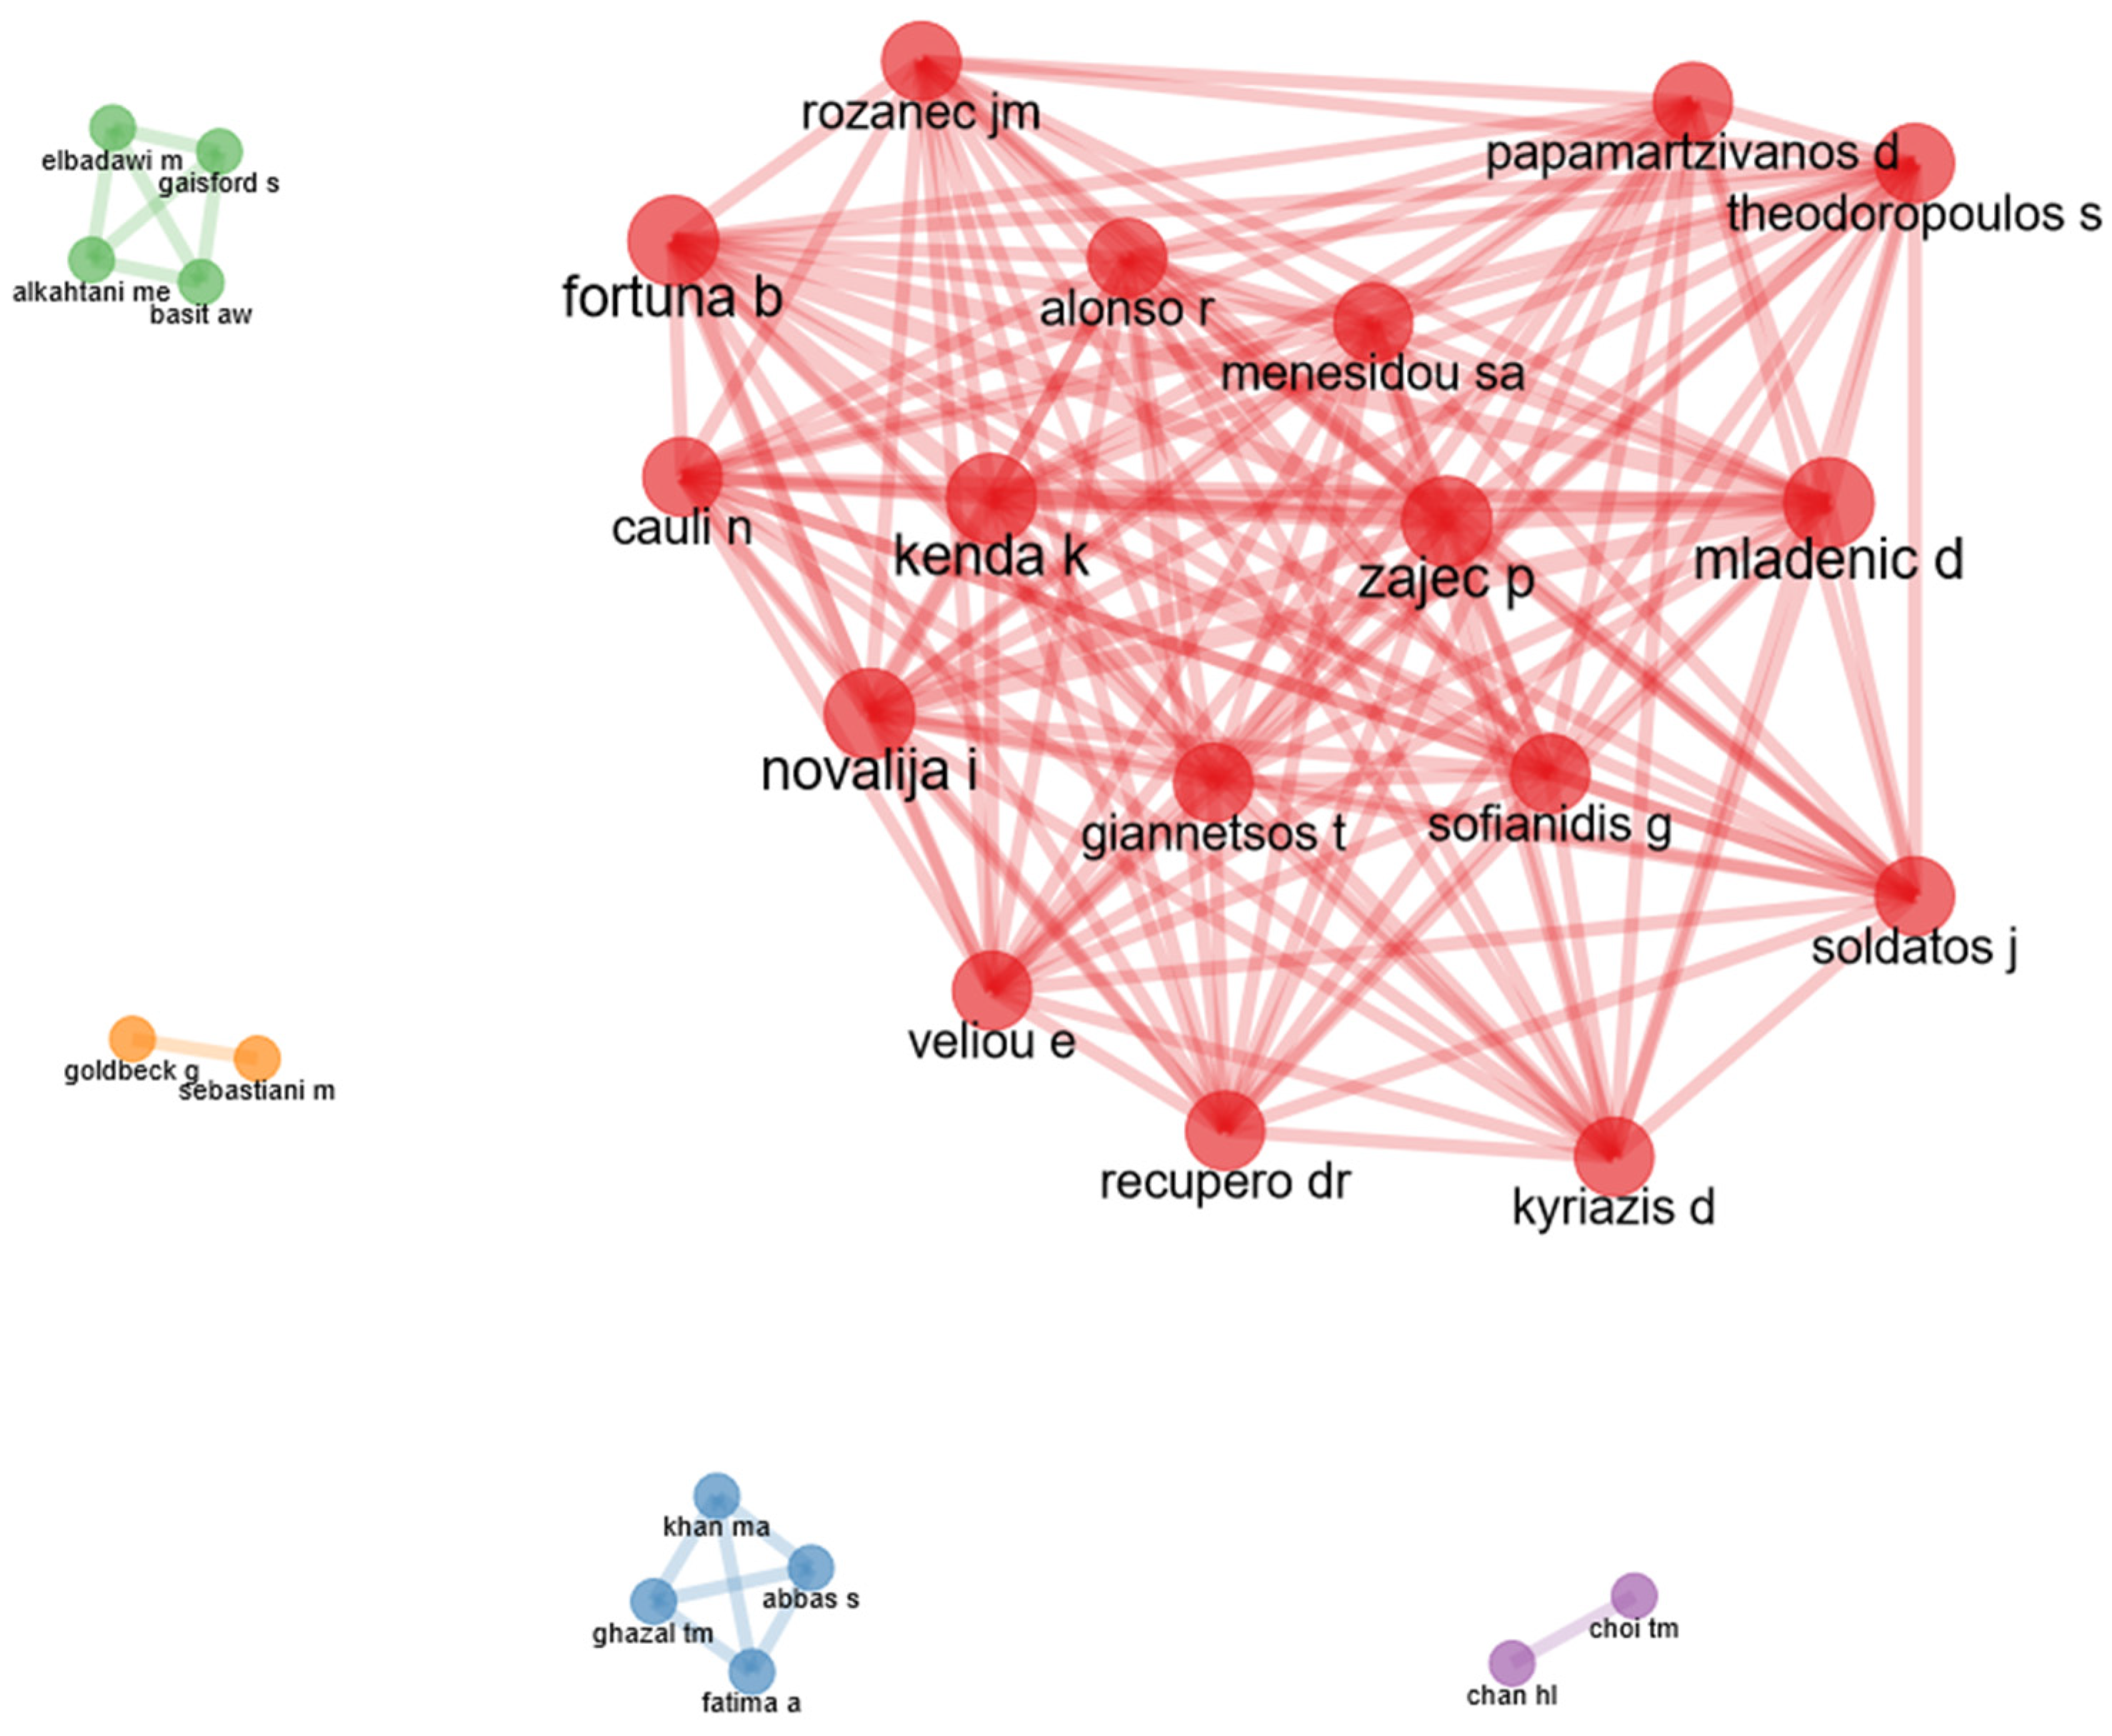
| Top 50 author collaboration network | |
| Literature Review and Mixed Analysis | Top 10 most globally cited documents |
| Brief summary of the content of the top 10 most globally cited documents | |
| Top 10 most frequent words in keywords plus | |
| Top 10 most frequent words in authors’ keywords | |
| Top 10 most frequent words in subject categories | |
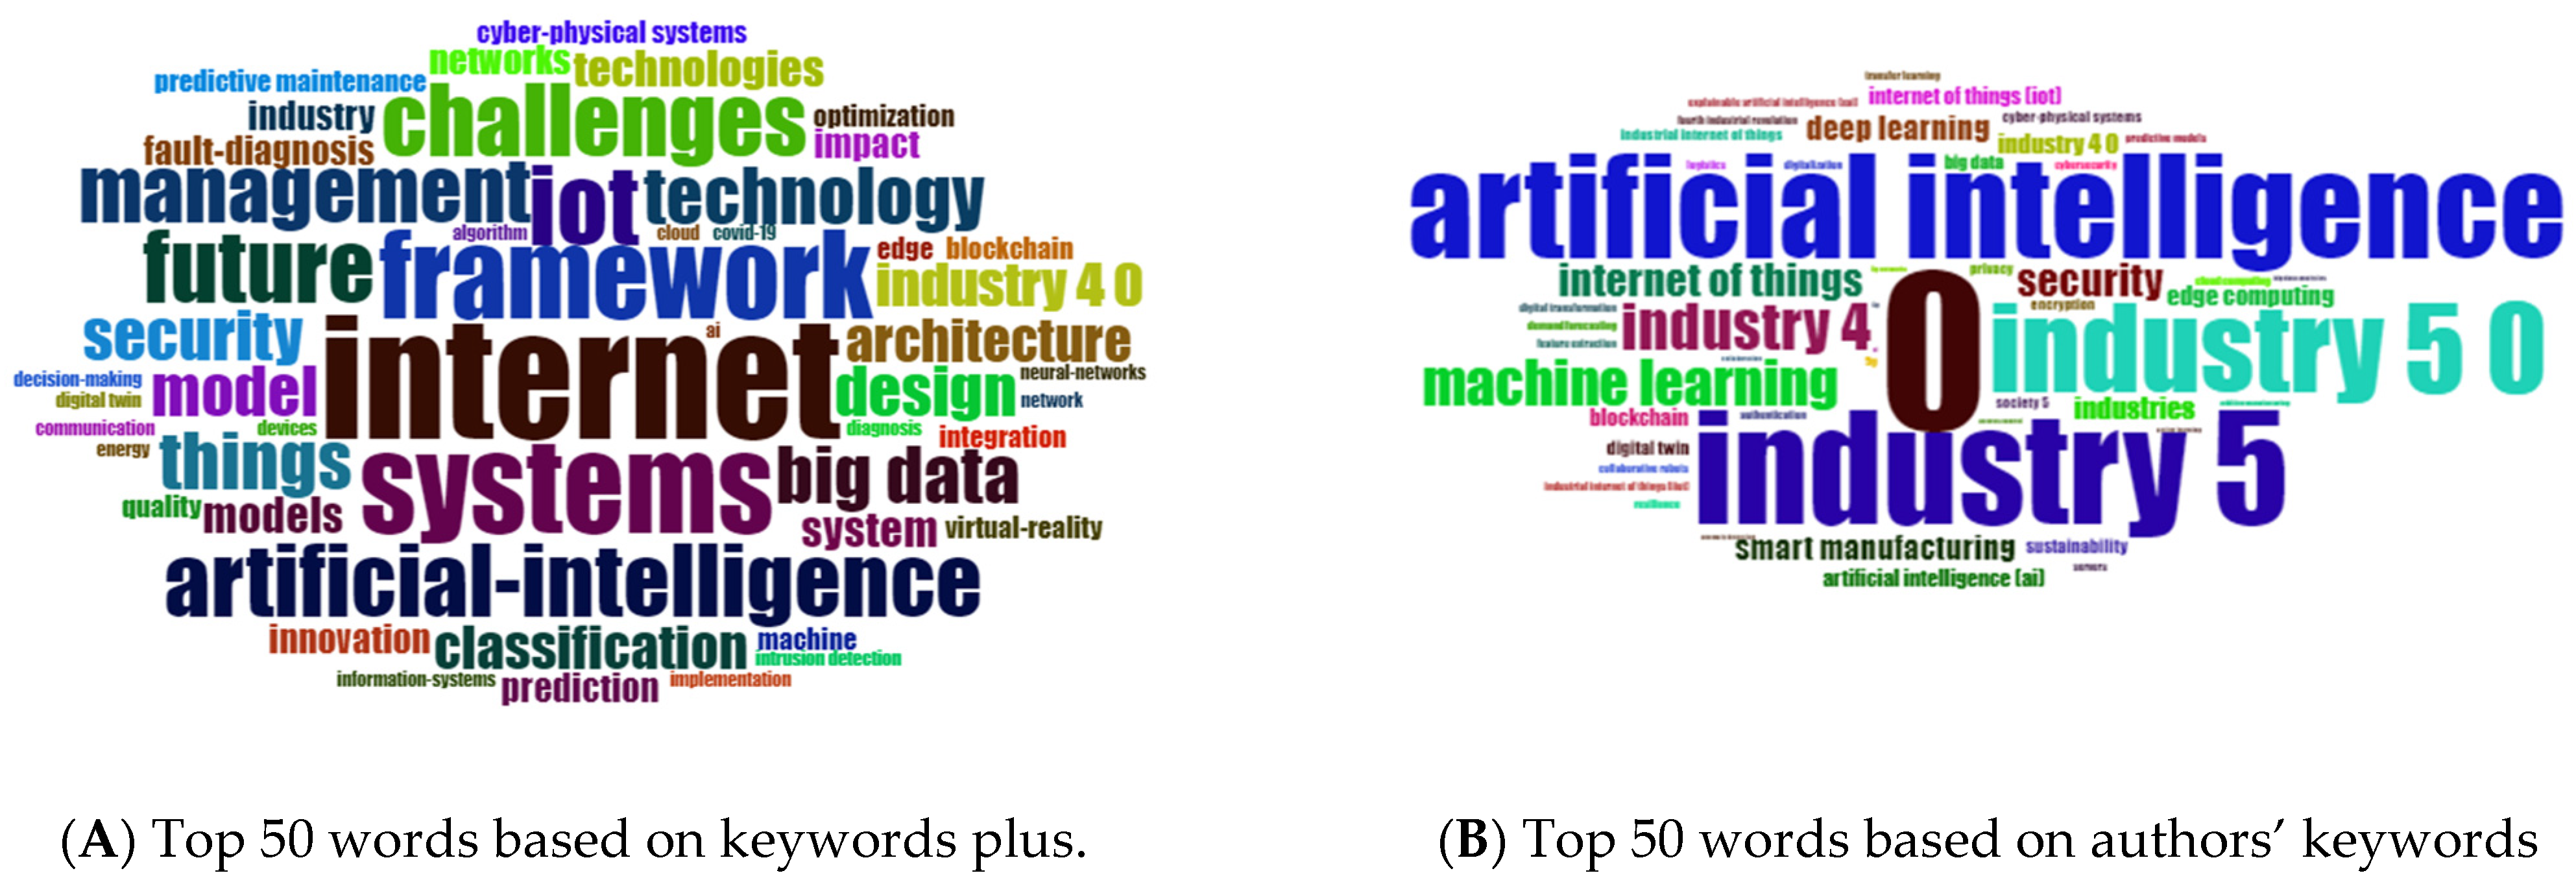
| Top 50 words based on keywords plus (A) and authors’ keywords (B) | |
| Top 10 most frequent bigrams in abstracts and titles | |
| Top 10 most frequent trigrams in abstracts and titles | |
| Thematic map for titles | |
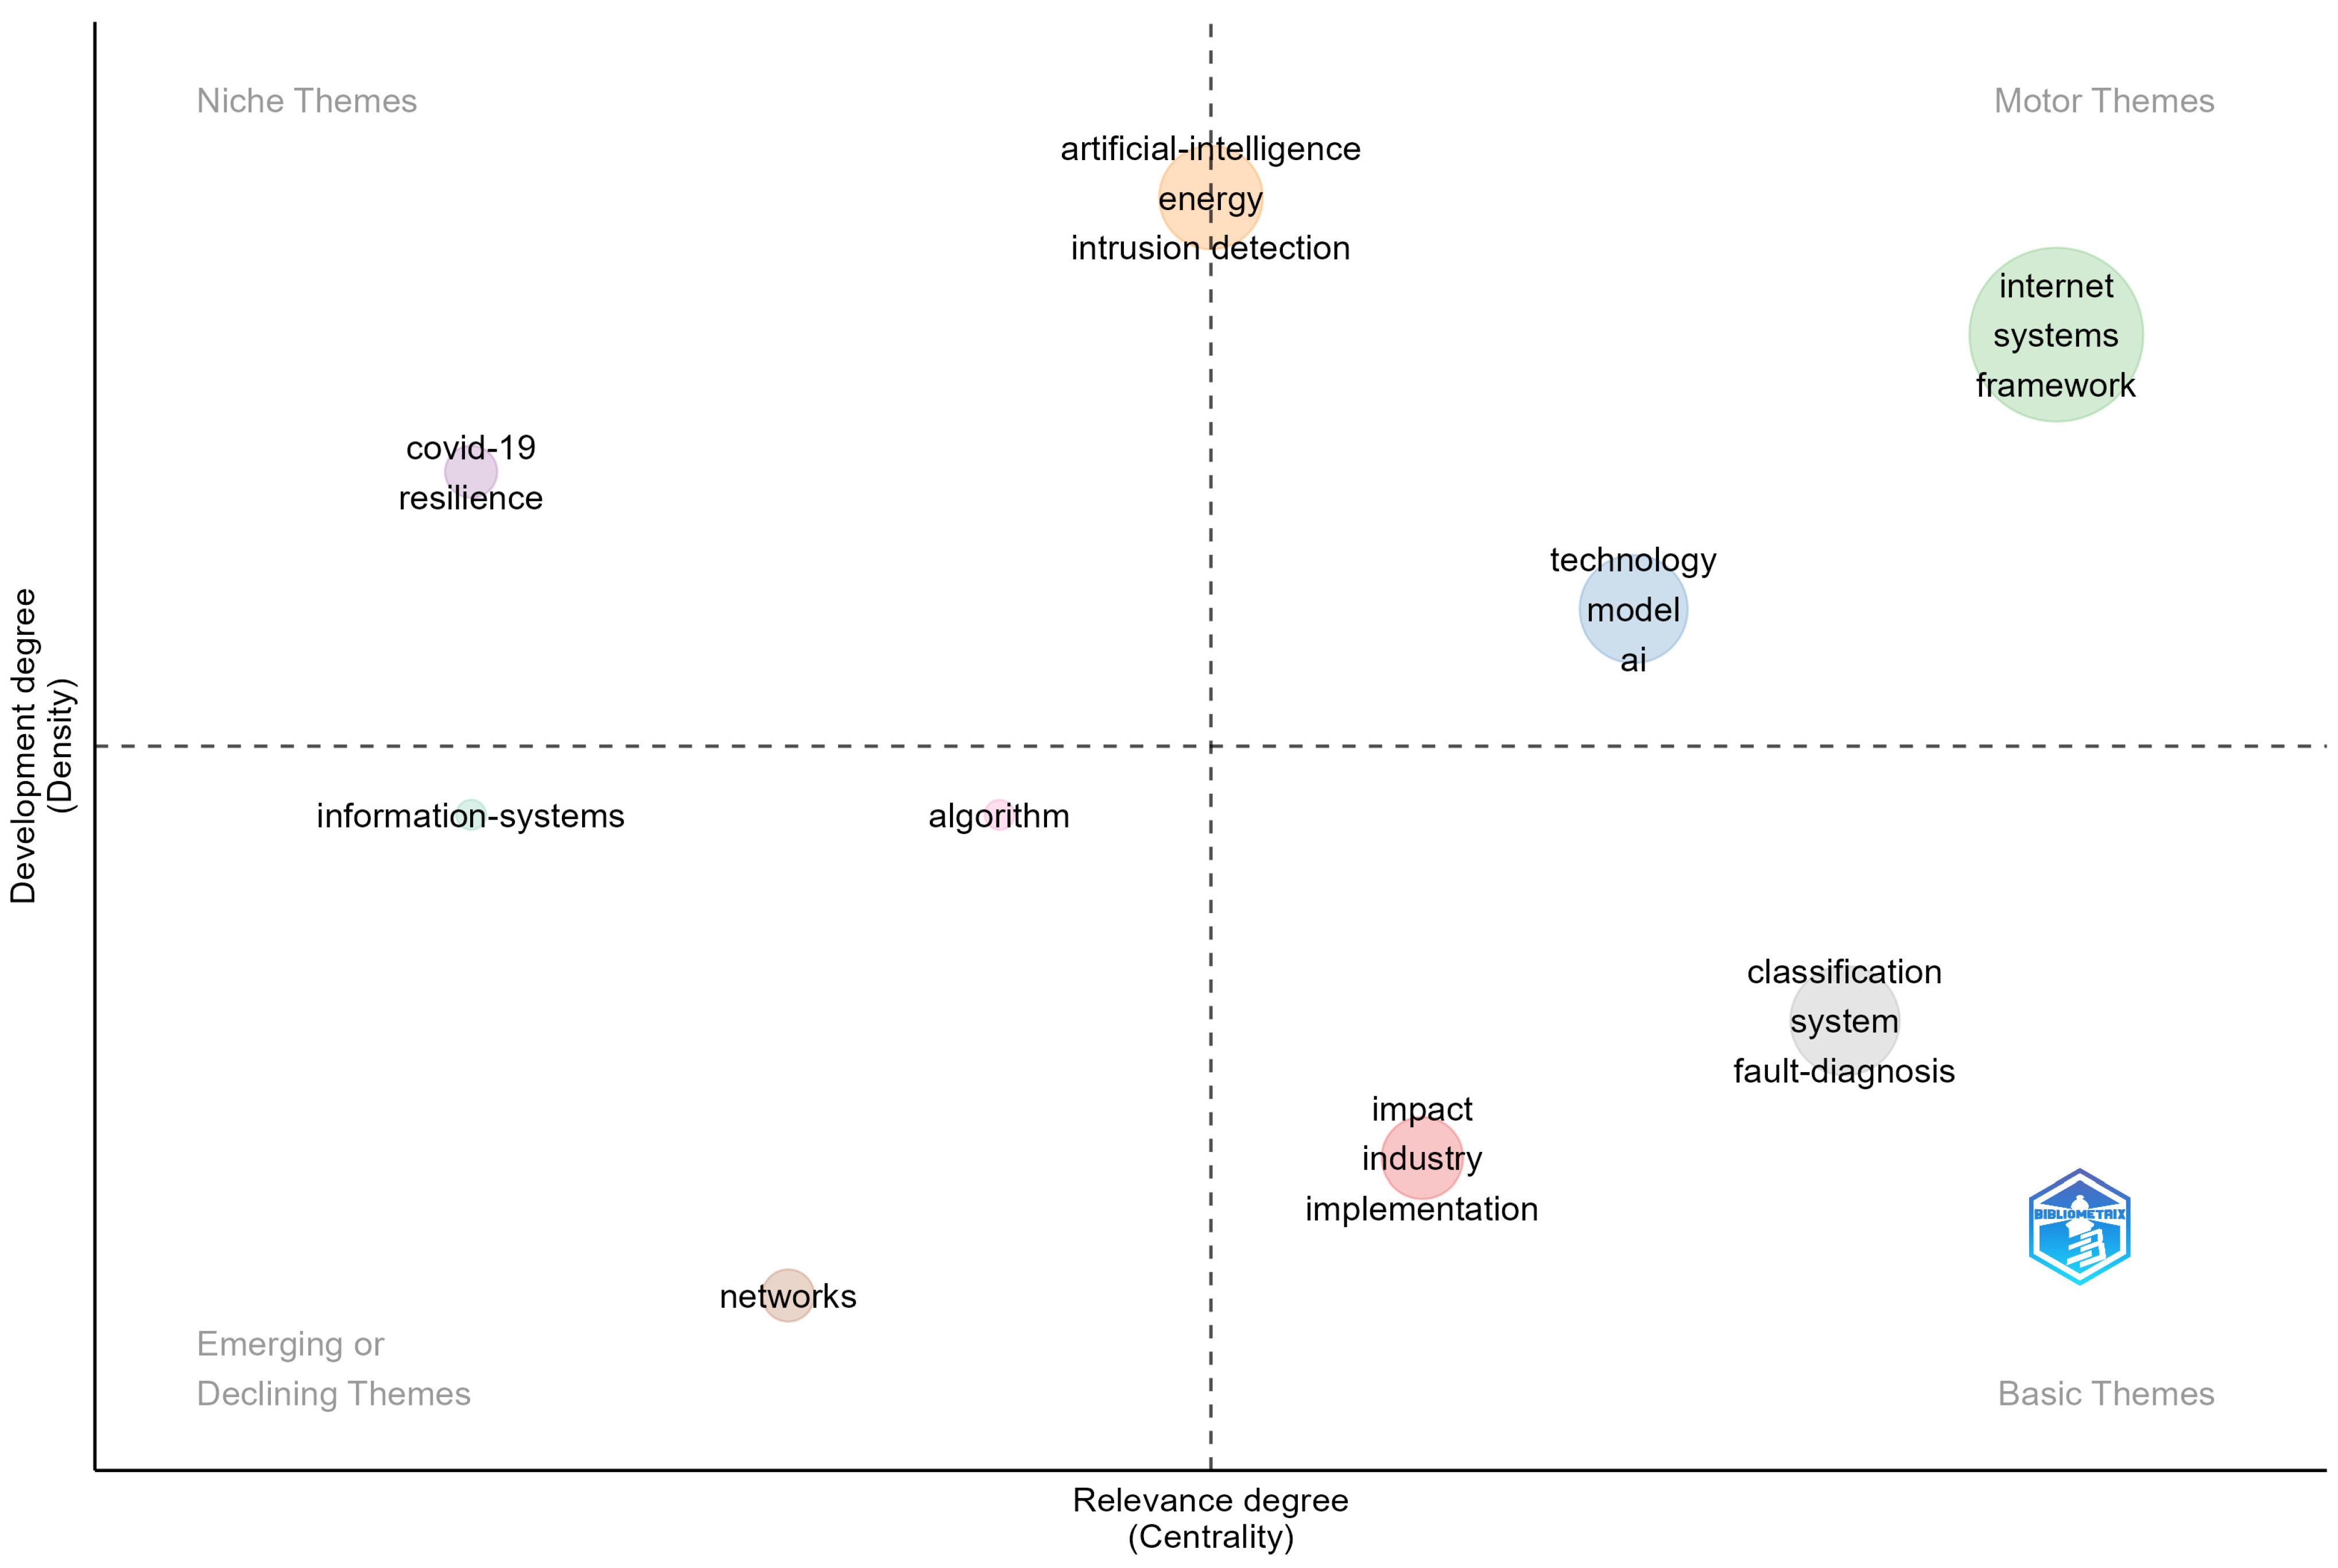
| Thematic map for keywords plus | |
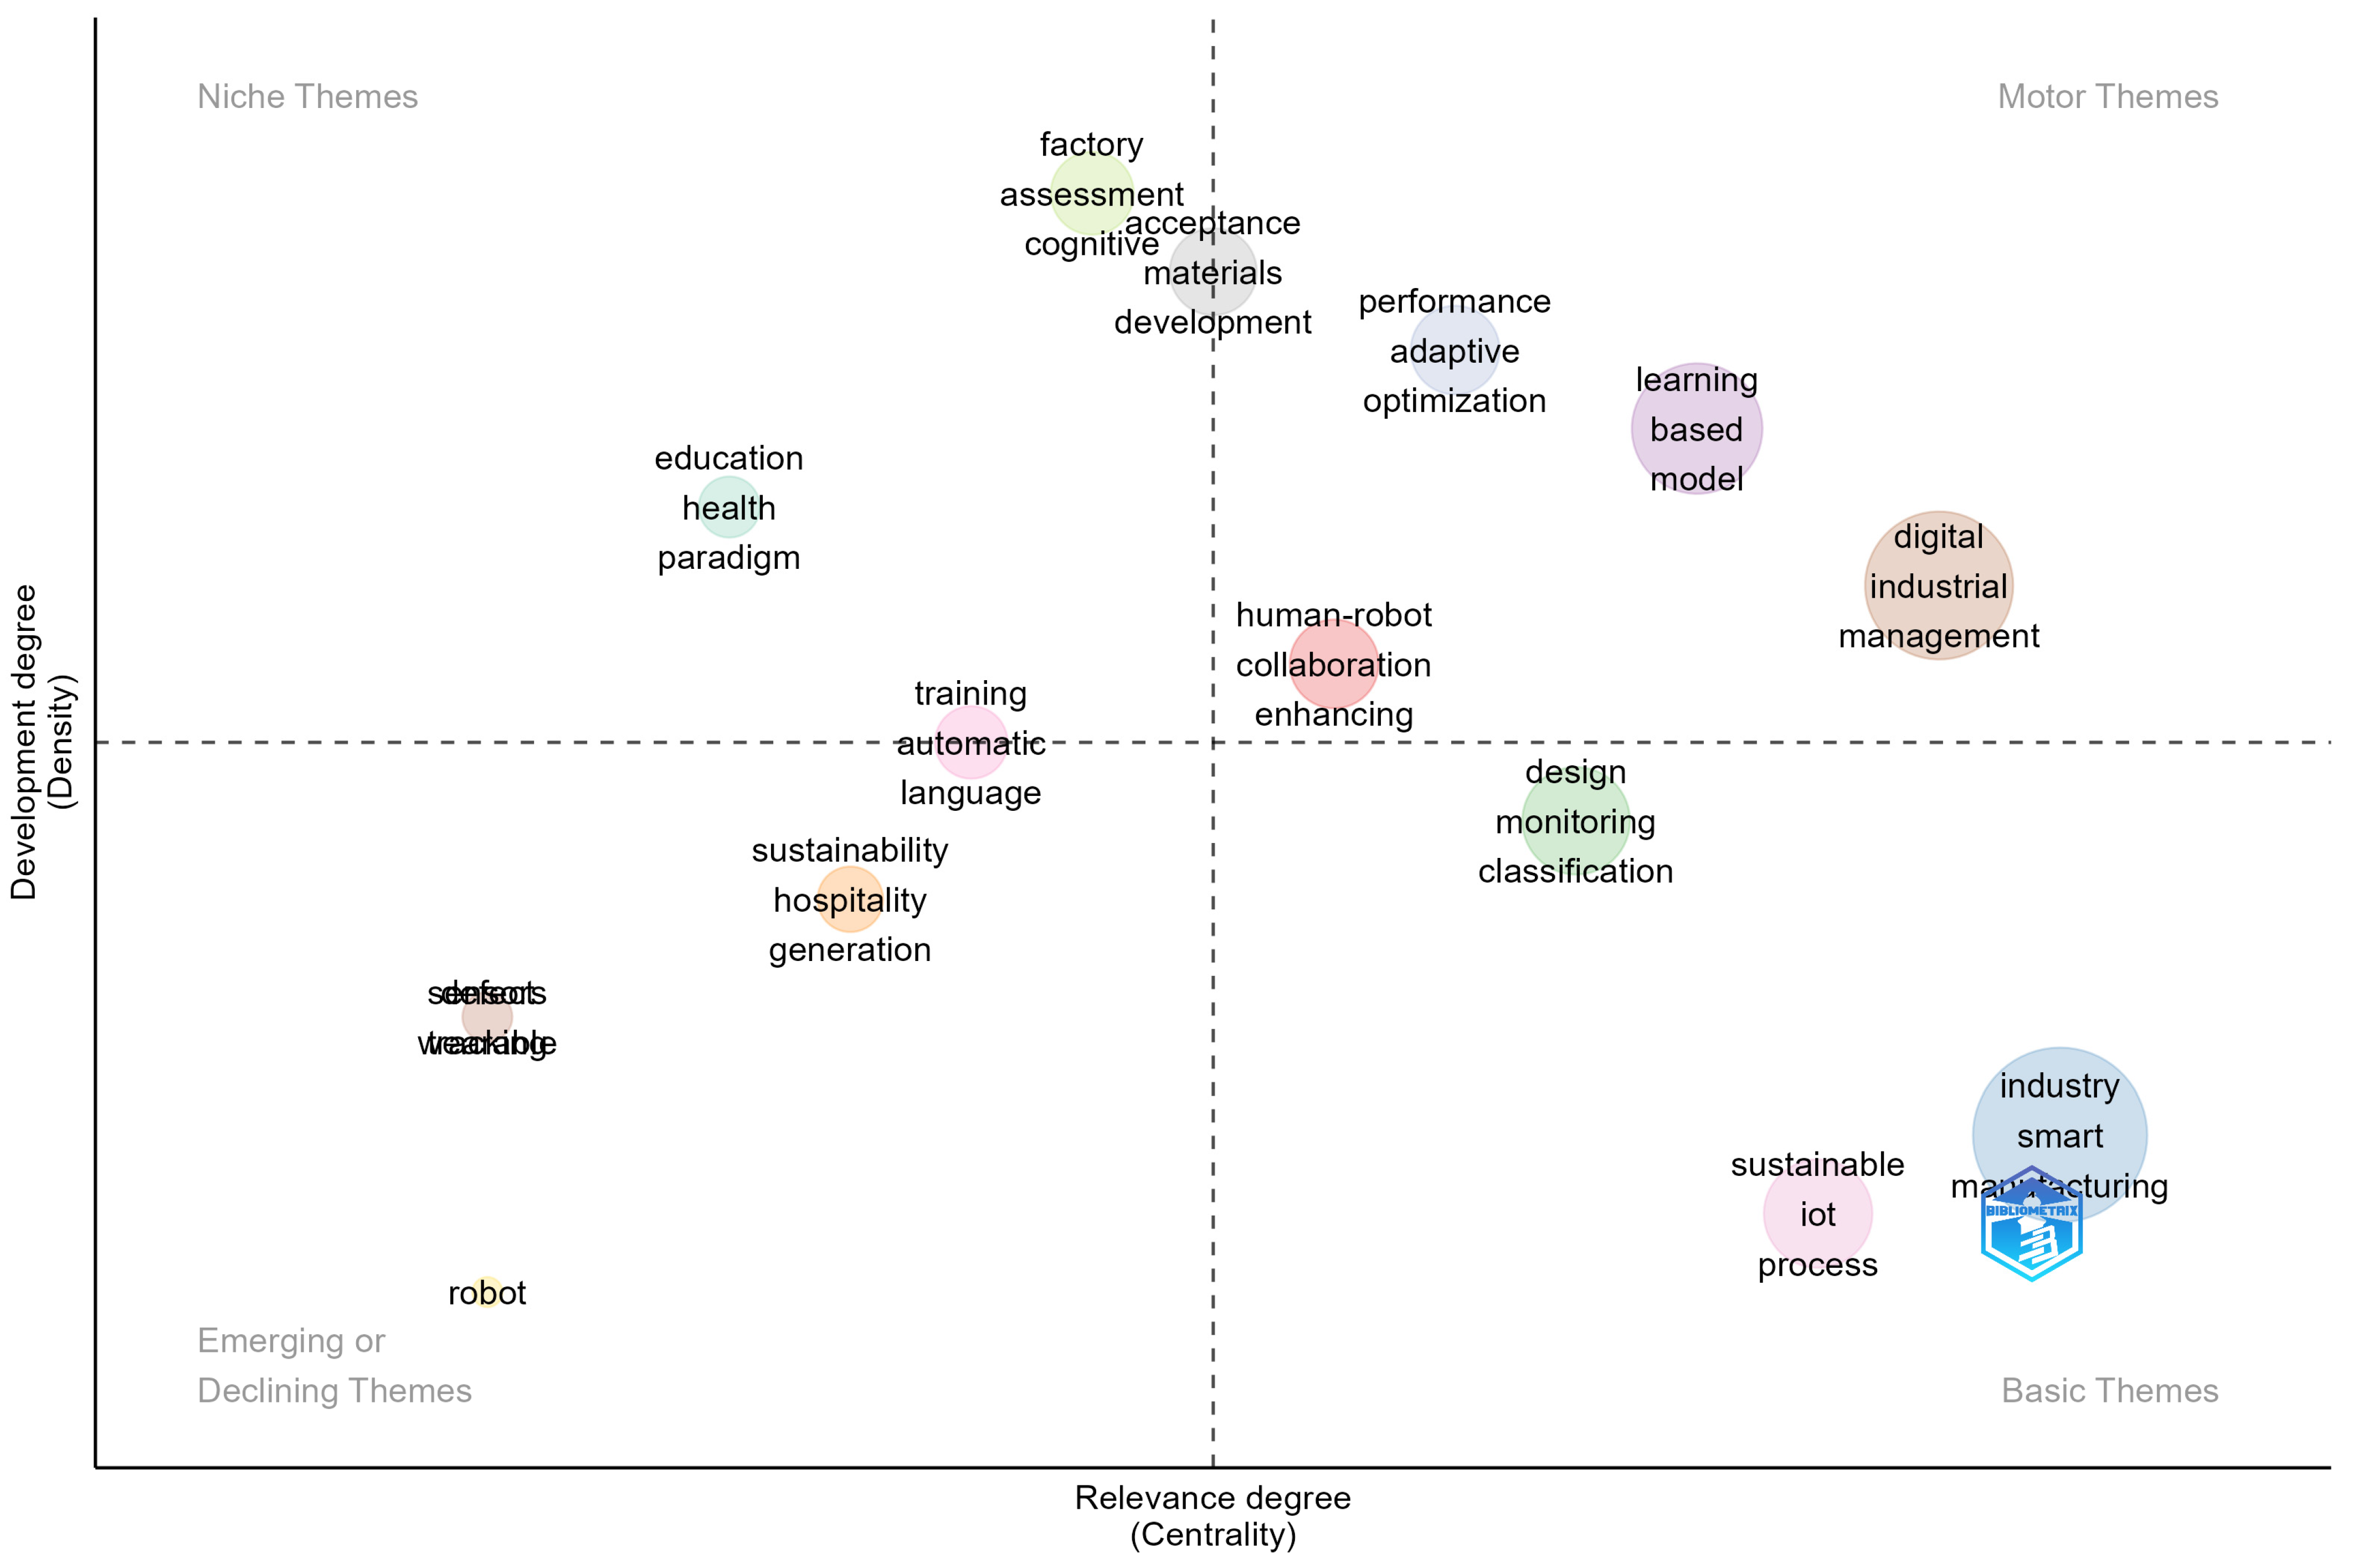
| Thematic map for abstracts | |
| Factorial Analysis | |
| Three-fields plot: countries (left), authors (middle), journals (right) | |
| Three-fields plot: affiliations (left), authors (middle), keywords (right) |
| Exploration Steps | Questions on the Web of Science | Description | Query | Query Number | Count |
|---|---|---|---|---|---|
| 1 | Title | Contains the specific keywords related to Industry 5.0 | TI = (industry_5.0) | #1 | 276 |
| 2 | Abstract | Contains the specific keywords related to Industry 5.0 | AB = (industry_5.0) | #2 | 572 |
| 3 | Keywords | Contains the specific keywords related to Industry 5.0 | AK = (industry_5.0) | #3 | 201 |
| 4 | Title/Abstract/Keywords | Contains the specific keywords related to Industry 5.0 | #1 OR #2 OR #3 | #4 | 661 |
| 5 | Title | Contains the specific keywords related to machine learning and big data analytics | ((((((((TI = (machine_learning)) OR TI = (supervised_learning)) OR TI = (artificial_intelligence)) OR TI = (unsupervised_learning)) OR TI = (deep_learning)) OR TI = (artificial_neural_network)) OR TI = (artificial_neural_networks)) OR TI = (big_data_analytics)) | #5 | 267,908 |
| 6 | Abstract | Contains the specific keywords related to machine learning and big data analytics | ((((((((AB = (machine_learning)) OR AB = (supervised_learning)) OR AB = (artificial_intelligence)) OR AB = (unsupervised_learning)) OR AB = (deep_learning)) OR AB = (artificial_neural_network)) OR AB = (artificial_neural_networks)) OR AB = (big_data_analytics)) | #6 | 603,935 |
| 7 | Keywords | Contains the specific keywords related to machine learning and big data analytics | ((((((((AK = (machine_learning)) OR AK = (supervised_learning)) OR AK = (artificial_intelligence)) OR AK = (unsupervised_learning)) OR AK = (deep_learning)) OR AK = (artificial_neural_network)) OR AK = (artificial_neural_networks)) OR AK = (big_data_analytics)) | #7 | 381,535 |
| 8 | Title/Abstract/Keywords | Contains the specific keywords related to machine learning and big data analytics | #5 OR #6 OR #7 | #8 | 775,358 |
| 9 | Title/Abstract/Keywords | Contains the specific keywords related to Industry 5.0 and the specific keywords related to machine learning and big data analytics | #4 AND #8 | #9 | 187 |
| 10 | Language | Contains only the papers in English | (#9) AND LA = (English) | #10 | 187 |
| 11 | Document Type | Limit to Article | (#10) AND DT = (Article) | #11 | 132 |
| 12 | Year published | Exclude 2024 | (#11) NOT PY = (2024) | #12 | 129 |
| Indicator | Value |
|---|---|
| Timespan | 2016–2023 |
| Sources | 80 |
| Documents | 129 |
| Average years from publication | 1.64 |
| Average citations per document | 14.49 |
| Average citations per year per document | 4.23 |
| Keywords plus | 241 |
| Authors’ keywords | 575 |
| References | 8394 |
| Indicator | Value |
|---|---|
| Authors | 531 |
| Author appearances | 582 |
| Authors of single-authored documents | 13 |
| Authors of multi-authored documents | 518 |
| Single-authored documents | 14 |
| Documents per author | 0.243 |
| Authors per document | 4.12 |
| Co-authors per document | 4.51 |
| Collaboration index | 4.5 |
| Year of Publication | Number of Published Papers | Average Citations per Year |
|---|---|---|
| 2016 | 1 | 5.7 |
| 2017 | 0 | 0 |
| 2018 | 0 | 0 |
| 2019 | 1 | 57.5 |
| 2020 | 4 | 9.9 |
| 2021 | 9 | 8.1 |
| 2022 | 41 | 5.9 |
| 2023 | 73 | 1.7 |
| Author Name | Number of Articles | Articles Fractionalized |
|---|---|---|
| Fortuna B | 3 | 0.25 |
| Kenda K | 3 | 0.25 |
| Kumar S | 3 | 0.92 |
| Mladenic D | 3 | 0.25 |
| Novalija I | 3 | 0.25 |
| Zajec P | 3 | 0.25 |
| Abbas S | 2 | 0.23 |
| Abuhasel KA | 2 | 2.00 |
| Alkahtani NE | 2 | 0.37 |
| Alonso R | 2 | 0.11 |
| Country | Articles | SCP | SCP_Percentage | MCP | MCP_Percentage | Percentage |
|---|---|---|---|---|---|---|
| China | 17 | 8 | 47.06% | 9 | 52.94% | 13.2% |
| UK | 16 | 5 | 31.25% | 11 | 68.75% | 12.4% |
| Italy | 10 | 7 | 70% | 3 | 30% | 7.8% |
| India | 9 | 6 | 66.67% | 3 | 33.33% | 7% |
| USA | 7 | 3 | 42.86% | 4 | 57.14% | 5.4% |
| Australia | 6 | 2 | 33.33% | 4 | 66.67% | 4.7% |
| Korea | 5 | 3 | 60% | 2 | 40% | 3.9% |
| Slovenia | 5 | 3 | 60% | 2 | 40% | 3.9% |
| Slovakia | 4 | 4 | 100% | 0 | 0% | 3.1% |
| Pakistan | 3 | 0 | 0 | 3 | 100% | 2.3% |
| Region | Frequency | Percentage |
|---|---|---|
| China | 64 | 14.71% |
| India | 43 | 9.89% |
| United Kingdom | 39 | 8.97% |
| Italy | 27 | 6.21% |
| United States of America | 18 | 4.14% |
| Pakistan | 17 | 3.91% |
| Saudi Arabia | 17 | 3.91% |
| Australia | 15 | 3.45% |
| Greece | 15 | 3.45% |
| Slovenia | 14 | 3.22% |
| Region | Number of Citations | Average Article Citations |
|---|---|---|
| Australia | 457 | 76.2 |
| USA | 340 | 48.6 |
| China | 296 | 17.4 |
| UK | 162 | 10.1 |
| India | 147 | 16.3 |
| Spain | 67 | 33.5 |
| Pakistan | 65 | 21.7 |
| Italy | 52 | 5.2 |
| United Arab Emirates | 49 | 16.3 |
| Slovenia | 29 | 5.8 |
| No. | Paper (First Author, Year, Journal, Reference) | Title | Data | Purpose |
|---|---|---|---|---|
| 1 | Nahavandi, Saeid, 2019, Sustainability [1] | Industry 5.0—A Human-Centric Solution | Real-time data received from users (theoretical approach of Industry 5.0) | To present the benefits of technology using Industry 5.0 and robots, which increase the productivity of humans, while not removing them from the manufacturing industry. Also describes the key features and concerns related to Industry 5.0 |
| 2 | Choi, Tsan-Ming, 2022, SageJournals [56] | Disruptive Technologies and Operations Management in the Industry 4.0 Era and Beyond | Real-time data received from users (theoretical approach of Industry 5.0) | To compare Industry 4.0 and Industry 5.0 and to explain the benefits of each industrial revolution |
| 3 | Pillai Souji Gopalakrishna, 2021, [62] | COVID-19 and hospitality 5.0: Redefining hospitality operations | Authors did not use data; they explained the concepts in a theoretic manner | To create an extension of Industry 5.0, create Hospitality 5.0 for the tourism domain, which suffered from the COVID-19 pandemic, using the latest technologies in order to reduce human interaction to a minimum |
| 4 | Javed, Abdul Rehman, 2022, Elsevier [63] | Future smart cities: requirements, emerging technologies, applications, challenges, and future aspects | Authors did not use data; they explained the concepts in a theoretic manner | To explain the concept of smart cities, what technologies should be used, what is the impact of technologies on the social and economic lives of people, and which cities are focusing on smart technologies |
| 5 | Bednar, Peter M., 2019, Springer [21] | Socio-Technical Perspectives on Smart Working: Creating Meaningful and Sustainable Systems | Authors did not use data; they explained the concepts in a theoretic manner | To present the focus of manufacturers, how technologies have improved production and the environment, and what is the real scope of Industry 5.0 implementation |
| 6 | Javaid, Mohd, 2929, Journal of Industrial Integration and Management [64] | Critical Components of Industry 5.0 Towards a Successful Adoption in the Field of Manufacturing | Authors did not use data; they explained the concepts in a theoretic manner | To point out the evolution of each industrial revolution, which are the particularities of each one, which are the main benefits of using Industry 5.0 when it is released |
| 7 | Fraga-Lamas, Paula, 2021, Sustainability [65] | Green IoT and Edge AI as Key Technological Enablers for a Sustainable Digital Transition towards a Smart Circular Economy: An Industry 5.0 Use Case | Data collected and analyzed using IoT | To explain how IoT can help the circular economy and develop a more sustainable world by digitalizing processes and to present practical use-cases where Industry 5.0 has been used |
| 8 | Akundi, Aditya, 2022, Sustainability [3] | State of Industry 5.0—Analysis and Identification of Current Research Trends | One hundred ninety-six documents from IEEE, Science Direct, and MDPI | To present the benefits of each industrial revolution, how Industry 4.0 and Industry 5.0 can change human and machine interactions. A literature review has been performed for 196 documents |
| 9 | Sigov, Alexander, 2022, Springer, [68] | Emerging Enabling Technologies for Industry 4.0 and Beyond | Authors did not use data; they explained the concepts in a theoretic manner | To describe the benefits of Industry 4.0, when it was implemented for the first time, what technologies have been used, where it was applied successfully, and why the evolution of Industry 4.0 is necessary |
| 10 | Sachsenmeier Peter, 2016, Elsevier [69] | Industry 5.0—The Relevance and Implications of Bionics and Synthetic Biology | Authors did not use data; they explained the concepts in a theoretic manner | To explain how the bionics domain is used in Industry 4.0, what Industry 5.0 is, how it can be implemented in order to obtain more sustainable fuels, and how industrial revolutions changed society |
| Words | Occurrences |
|---|---|
| Internet | 17 |
| Systems | 13 |
| Framework | 12 |
| IoT | 11 |
| Artificial intelligence | 10 |
| Challenges | 10 |
| Future | 10 |
| Management | 9 |
| Big Data | 8 |
| Technology | 8 |
| Words | Occurrences |
|---|---|
| Industry 5 | 40 |
| Artificial intelligence | 37 |
| Industry 5.0 | 32 |
| Industry 4 | 17 |
| Machine learning | 16 |
| Internet of Things | 12 |
| Security | 12 |
| Deep learning | 9 |
| Smart manufacturing | 9 |
| Industries | 8 |
| Words | Occurrences |
|---|---|
| Engineering electrical and electronic | 28 |
| Computer science information systems | 26 |
| Engineering industrial | 26 |
| Computer science interdisciplinary applications | 18 |
| Telecommunications | 15 |
| Automation and control systems | 13 |
| Instruments and instrumentation | 12 |
| Chemistry analytical | 11 |
| Environmental sciences | 10 |
| Physics applied | 10 |
| Bigrams in Abstracts | Occurrences | Bigrams in Titles | Occurrences |
|---|---|---|---|
| Artificial intelligence | 81 | Artificial intelligence | 9 |
| Machine learning | 45 | Machine learning | 6 |
| Industrial revolution | 30 | Digital twin | 5 |
| Intelligence AI | 30 | Edge computing | 5 |
| Deep learning | 24 | Supply chain | 4 |
| Digital twin | 20 | Deep learning | 3 |
| Manufacturing system | 15 | Federated learning | 3 |
| Supply chain | 15 | Human-robot collaboration | 3 |
| Digital twins | 14 | Industry application | 3 |
| Edge computing | 12 | Learning model | 3 |
| Trigrams in Abstracts | Occurrences | Trigrams in Titles | Occurrences |
|---|---|---|---|
| Artificial intelligence AI | 30 | Deep learning model | 2 |
| Machine learning (ML) | 11 | Future research directions | 2 |
| Industrial revolution industry | 10 | Hybrid deep learning | 2 |
| Smart healthcare industry | 8 | Supply chain management | 2 |
| Fourth industrial revolution | 7 | Web-based attack detection | 2 |
| Deep learning (DL) | 5 | Access control scheme | 1 |
| Deep extreme machine | 4 | Adaptive bead modeling | 1 |
| Explainable artificial intelligence | 4 | Adaptive human-robot collaboration | 1 |
| Extreme machine learning | 4 | Adaptive optimization algorithms | 1 |
| Federated deep extreme | 4 | Additive manufacturing machine | 1 |
Disclaimer/Publisher’s Note: The statements, opinions and data contained in all publications are solely those of the individual author(s) and contributor(s) and not of MDPI and/or the editor(s). MDPI and/or the editor(s) disclaim responsibility for any injury to people or property resulting from any ideas, methods, instructions or products referred to in the content. |
© 2024 by the authors. Licensee MDPI, Basel, Switzerland. This article is an open access article distributed under the terms and conditions of the Creative Commons Attribution (CC BY) license (https://creativecommons.org/licenses/by/4.0/).
Share and Cite
Domenteanu, A.; Cibu, B.; Delcea, C. Mapping the Research Landscape of Industry 5.0 from a Machine Learning and Big Data Analytics Perspective: A Bibliometric Approach. Sustainability 2024, 16, 2764. https://doi.org/10.3390/su16072764
Domenteanu A, Cibu B, Delcea C. Mapping the Research Landscape of Industry 5.0 from a Machine Learning and Big Data Analytics Perspective: A Bibliometric Approach. Sustainability. 2024; 16(7):2764. https://doi.org/10.3390/su16072764
Chicago/Turabian StyleDomenteanu, Adrian, Bianca Cibu, and Camelia Delcea. 2024. "Mapping the Research Landscape of Industry 5.0 from a Machine Learning and Big Data Analytics Perspective: A Bibliometric Approach" Sustainability 16, no. 7: 2764. https://doi.org/10.3390/su16072764