1. Introduction
The government is increasingly prioritizing environmental concerns and has enacted a series of pertinent laws aimed at holding original equipment manufacturers (OEMs) accountable for the sustainability of products throughout their lifecycle. This requires enterprises to continually adapt for their own development and to uphold a positive societal image. They must not only produce products that meet consumer demands but also consider the sustainability of these products [
1]. For designers and manufacturers, it is essential to consider the sustainability of the product throughout its lifecycle [
2]. Product lifecycles involve several stages, from pre-manufacturing (material selection and processing) through manufacturing (component manufacture and assembly) to use and post-use (recycling and reuse of products) [
3]. In the context of the current availability of limited resources, the negative impact of traditional manufacturing paradigms on the environment and society is not conducive to achieving a sustainable product lifecycle [
4].
Intelligent manufacturing has the potential to significantly enhance sustainable manufacturing competitiveness. By efficiently capturing relevant data, such as usage and recycling information from previous product generations, it can improve product design and subsequent sustainable manufacturing processes (SMPs) [
5]. Intelligent manufacturing is often categorized into two main types: base and front-end technologies [
6]. The base technologies, including cloud computing, internet of things (IoT), and big data analytics, provide connectivity and intelligence for the front-end technologies. The front-end technologies involve the restructuring of manufacturing activities using the intelligent technologies derived from the base technologies. The reconfiguration of manufacturing activities is largely influenced by product design. Therefore, it is essential to consider product design in conjunction with sustainable manufacturing activities.
Modular product family architecture (PFA) offers several advantages in achieving product sustainability and meeting the diverse needs of consumers [
7]. PFA relies on product platforms organized in family formats, where a variety of modules are selected to create product variations tailored to different market segments [
8]. This approach not only reduces development time and costs but also facilitates product dismantling and module reuse [
9].
In the realm of intelligent manufacturing, this paper explores the interrelation and optimization of modular PFA with SMPs in response to customer needs and product usage data. The solutions for each stage of PFA and SMPs are inherently interconnected. The inclusion of various module types within the product family—such as common, differentiated, and unique modules—significantly influences the selection of sustainable solutions [
10]. When designing PFAs, it is essential to consider the rationality of product architecture and the selection of module types based on functional, technical, and structural coupling, while also meeting the sustainability requirements of consumers and government regulators. For SMP activities, product sustainability should align with the company’s overall development objectives. Therefore, sustainable solutions must strike a balance between production costs, enterprise profitability, and environmental sustainability, rather than solely prioritizing the latter.
Limited articles currently address the design of joint optimization for PFA and SMPs [
11]. These articles often employ multi-objective programming methods [
12,
13,
14]. However, adopting this method faces limitations. Firstly, it often overlooks the coupling relationship between PFA and SMP scheme selection. Secondly, it fails to address conflicting objectives among different decision-makers [
15]. Specifically, technical challenges encompass the following facets.
Hierarchical joint optimization. The complexity lies in establishing the hierarchical joint optimization (HJO) decision-making framework. The PFA design and SMP selection involve distinct decision-makers: the PFA designers and the sustainable manufacturers of the product family, respectively. Enterprises may have different decision variables and goals, which can sometimes conflict [
15]. On one hand, PFA designers aim to maximize both customer-perceived utility and sustainable utility per unit cost. They can influence the choice of SMP scheme through modular architecture and configuration scheme design. On the other hand, sustainable manufacturers strive to make sustainable manufacturing solutions based on comprehensive evaluation indicators, which in turn feed back to the PFA designers and impact PFA decisions. The choice of PFA design and SMP selection constitutes an HJO problem, with the designer acting as the leader and the sustainable manufacturer as the follower. This necessitates an HJO decision-making framework that seeks a balanced solution through noncooperative games. Despite numerous studies on bilevel optimization, explicitly formulating an HJO decision-making framework to describe the PFA and SMP problems in engineering remains challenging [
16].
Heterogeneous decision criteria. Another challenge addressed in this paper is the construction of a heterogeneous decision criterion. PFA decisions primarily involve multiple levels of modules, whereas SMP decisions focus more on sustainability considerations. For instance, PFA design entails combining compound modules and configuring basic modules [
17]. Sustainable solutions encompass the selection of raw materials, processing methods, recycling methods, and end-of-life processing methods. Furthermore, these two types of decision problems entail diverse decision criteria, such as customer utilities, purchase preferences, modularization, and comprehensive sustainable certification standards, which encompass cost, quality, emissions, and energy consumption, among others [
18]. Dealing with multi-dimensional and heterogeneous decision criteria in the optimization problem presents another challenge in this paper.
The objective of this study is to establish an HJO model by which to address the hierarchical optimization problem of PFA and SMPs. Firstly, we must delve into the decision mechanism and achieve a hierarchical joint optimization process for PFA and SMP decisions based on a Stackelberg game. Secondly, a bilevel programming model implementing the joint optimization of PFA and SMPs must be designed, establishing heterogeneous decision criteria for different decision-makers. Thirdly, a nested genetic algorithm (NGA) that aligns with the HJO model solving mechanism must be developed, and its effectiveness and reliability must be validated through comparative experiments.
In light of these considerations, this paper employs the HJO method to analyze the PFA and SMP problems.
Section 2 provides a summary of previous research on PFA, SMPs, and bilevel programming.
Section 3 establishes a conceptual model for PFA and SMP solutions.
Section 4 formulates the mathematical model of bilevel 0–1 integer nonlinear programming.
Section 5 develops a nested genetic algorithm (NGA) based on the established HJO model.
Section 6 presents a laptop case study, demonstrating the applicability of the HJO model and NGA algorithm proposed in this paper. Finally,
Section 7 summarizes the research findings and outlines future research prospects.
3. Consideration Sustainable Product Family Design
3.1. Research Methodology
Based on the methodology of management science, a research framework is presented to better explain the development steps of our study.
First and foremost, the identification of the research problem is crucial. Through empirical research on manufacturing enterprises, it has been discovered that there is a mutual influence between PFA design and SMPs, and that a hierarchical relationship exists between product designers and sustainable manufacturers. Literature review reveals that the hierarchical relationship between the two agents has not been studied yet. Therefore, the problem is refined and formulated into key optimization decision issues, accompanied by an analysis and description of the problem.
Subsequently, the establishment of the research model is essential. A bilevel optimization model based on Stackelberg games is developed to characterize the relationship between PFA design and SMPs. The upper-level PFA design solutions are modeled based on product design theory and methods. The MNL model is used to estimate the probability of the product selection. SMPs are modeled based on the theory of the lifecycle manufacturing processes and the definition of sustainable development.
Furthermore, in line with the established 0-1 nonlinear bi-level optimization model, we develop an NGA tailored to meet the requirements of the bilevel optimization solving mechanism. Through case studies that focus on laptop design and sustainable manufacturing processes, we validate the efficacy of our proposed model and algorithm. Employing a conjoint analysis method in the case study has enabled us to quantitatively ascertain consumer preferences. Comparative experiments with integrated optimization methods and two-stage optimization methods corroborated the superiority of our proposed HJO model. The reliability of our proposed algorithm is emphasized through experiments that assess optimality and stability.
3.2. Problem Description
When an enterprise possesses a significant volume of product usage data, maintenance data, and customer demand information, it can intelligently optimize PFA and SMPs based on these data. This enables the development of the most optimal product family design and sustainable manufacturing plan in alignment with the current data landscape. In different markets, consumers exhibit distinct preferences for various product attributes. Accordingly, the size of each market segment, denoted as
, represents the number of consumers in the
i-th segment. There are
J product variants in the product families of each market segment, offering the possibility to meet consumers’ individualized product needs. At the same time, there are
competitive products in the market. As shown in
Figure 1, each product variant is composed of compound modules
, each compound module is composed of several basic modules
(
). Some basic modules have some optional module instances
(
l = 1,
), which represent different product attributes. Some compound modules (
) and basic modules (
and
) are standard parts that cannot be selected, and which are often the core part of the product.
We analyze sustainability across the product lifecycle through three key aspects: cost, energy consumption, and emissions. This is divided into four stages. The first stage involves selecting raw materials for the module instance, followed by the second stage, which encompasses the production methods of the compound modules. The third stage focuses on the selection of recycling methods for the product variant, while the final stage involves selecting end-of-life processing methods of the product family.
3.3. Hierachical Interactive Decisions for Dynamic Evalution
Assuming both designers and manufacturers are rational decision-makers. Designers hold a dominant position as they investigate market demands and production costs, they formulate product variant combinations for segmented markets. Manufacturers are subordinate because they need to implement SMPs at different stages based on PFA designs. The decisions made by designers can influence the decision-making of manufacturers regarding SMPs, thereby altering the costs, energy consumption, and emissions associated with SMPs. Simultaneously, sustainable decision-making can impact the utility and costs of a product family. Thus, a Stackelberg game emerges between the designer and manufacturer. An HJO problem arises between PFA and SMP schemes.
As shown in
Figure 2, an HJO decision mechanism is presented. The left is the HJO model, and the right is the HJO evaluation mechanism. The leader of the model is the design of the PFA and configuration in each market segment (
i). Its objective is to maximize unit cost (
C) utilities (
U + V). Costs include product design cost (
) and sustainable costs (
), which include raw material costs (
), manufacturing costs (
), recycling costs (
), and processing costs (
). Utilities cover customer-perceived utilities and sustainable manufacturing utilities which are determined by the combination of energy consumption (
S) and emissions (
D). The sustainable decision-making of the follower model has three aspects that need to be considered: costs, energy consumption and carbon emissions. The lower objective function is to minimize the comprehensive evaluation indices of the SMPs. Both the upper and lower constraints of the model include two parts: the logical constraints and the functional constraints. The right-to-left arrows indicate that our model is based on a Stackelberg game.
3.4. Illustrative Example
Taking a brand laptop as a case for discussion and analysis. According to the research of the market segment and the functional constraints of the computer architecture, the product type and the number of compound modules for a certain market segment are pseudo-located as follows:
J= {2, 3};
R= {2, 3, 4}. After the arrangement and combination, there are six cases, which are
J = 2,
R = 2;
J = 2,
R = 3;
J = 2,
R = 4;
J = 3,
R = 2;
J = 3,
R = 3;
J = 3,
R = 4. Based on the calculations of the final model, the optimal combination of PFA is obtained. For the sake of simplicity and without loss of generality, this paper properly handles the structure and data of the laptop. The PFA is shown in
Figure 3. Assume a laptop is divided into 12 basic modules: shell, display, speaker, motherboard, graphics card, CPU, RAM, keyboard, hard disk, battery, fan, and optical drive. Each basic module corresponds to several module instances, with each module instance representing an attribute feature. For example, the shell’s three module instances are black, red and white. In addition to the optimal PFA solution, the upper-level model will calculate the optimal combination of product configurations.
We provide an example to illustrate the lower-level model. If a market segment corresponds to a product family PF, there are three types of products: , . There are two compound modules, , in some product variants, three basic modules, , , and , are in , while has three attributes, , , and . As each module instance is composed of different materials, decisions need to be made regarding the types of raw materials at the module instance level. Assume that there are two materials to choose from for , each corresponding to different fixed costs, variable costs, energy consumption, and carbon emissions. A judgement must be made based on these data in order to provide a satisfactory materials selection for the module instance . Assume that for compound module , there are two production methods to choose, each of which corresponds to different production design costs, manufacturing costs, energy consumption and carbon emissions. In the same way, one must choose the most suitable production method. After the product variant PV is used from the consumer group, the corresponding recycling mechanism is formulated. At this stage, each PV has several recycling methods. It is assumed that has two recycling methods. A similar method is used to find the most reasonable recycling way. According to the characteristics of a product family, we give several treatments at a product’s end-of-life stage, such as incineration, reuse, landfill, etc. At this level, one or more processing methods are reasonably determined according to the characteristics of the product family. In conjunction with the other three levels of SMP choices, one must select the optimal approach for addressing sustainability.
4. Hierarchical Joint Optimization
We propose an HJO mechanism for PFA and SMPs based on Stackelberg game. The upper-level model decides the PFA scheme, and the lower-level model decides the SMPs of the product family.
4.1. Parameters
The parameters used in the HJO model are shown in
Table 1.
4.2. Decision Variables
The decision variables used in the model are as follows:
: Binary integer = 1 or 0, depending on whether the k-th basic module of the r-th compound module of the j-th product selects the l-th module instance.
: Binary integer = 1 or 0, depending on whether the l-th module instance of the k-th basic module of the r-th compound module of the j-th product selects the m-th raw material.
: Binary integer = 1 or 0, depending on whether the r-th compound module of the j-th product selects the p-th production method.
: Binary integer = 1 or 0, depending on whether the j-th product selects the c-th recycling method.
: Binary integer = 1 or 0, depending on whether the product family selects the e-th end-of-life processing method of the product family.
is the upper-level decision variable and
are the lower-level decision variables.
Figure 4 is a structural of the decision variables. The upper part describes the choice of PFA (
x), and the lower part describes the choice of SMPs. The upper-level decision variable x is passed to the lower-level model by calculating the upper-level objective function, and the lower-level decision variable
y feeds back to the upper-level model through the result of the lower-level objective function value, thus looping until the optimal solution satisfying the upper and lower-level constraints is obtained.
4.3. Upper-Level Optimization
The definition of PFA stands as a pivotal undertaking in any industry’s product development activity [
47]. Given that this paper focuses on the modular architecture of products and collaborative decision-making design, the upper-level modular architecture is solely for configuring functional elements (choosing module instances) and aligning functional elements with physical components (determining the quantity of product variants and compound modules). For the upper level of the model, the following assumptions are made:
- (1)
A product family contains multiple types of products [
8];
- (2)
In the same market segment, customers’ purchase preferences are basically the same [
48].
The conjoint analysis method is widely used to measure customer demand preferences for different attribute levels based on stronger analytical capabilities [
49]. The customer’s combined utility for a single product equals the weighted sum of each basic module instance utility that comprises the product. The utility is expressed as Equation (1).
Similarly, sustainable utility is expressed as follows:
includes two parts: energy consumption and emissions. Its specific expression is shown below:
where
indicates the weight and
indicates the energy consumption index during the product lifecycle for selecting the
m-th raw material of the
l-th module instance of the
k-th basic module of the
r-th compound module of the j-th product variant. The specific expression of
is shown in Equation (4):
where n represents the type of consumption, for example lighting and heating, ventilation, or air conditioning;
describes consumption performance of the
n-th type for selecting the
m-th raw material of the
l-th module instance of the
k-th basic module of the
r-th compound module of the
j-th product variant;
indicates the power consumption of group
n for selecting the m-th raw material of the
l-th module instance of the
k-th basic module of the
r-th compound module of the
j-th product variant; and
is fuel (natural gas/coals) consumption for selecting the
m-th raw material of the
l-th module instance of the
k-th basic module of the
r-th compound module of the
j-th product variant.
is total annual power consumption for selecting the
m-th raw material of the
l-th module instance of the
k-th basic module of the
r-th compound module of the
j-th product variant,
is total annual fuel consumption for selecting the
m-th raw material of the l-th module instance of the
k-th basic module of the
r-th compound module of the
j-th product variant.
Equation (5) represents the emission index.
where n represents the type of emission.
describes emission performance of the n-th type for selecting the
m-th raw material of the l-th module instance of the
k-th basic module of the r-th compound module of the
j-th product variant.
is reuse percentage of the n-th type for selecting the m-th raw material of the l-th module instance of the k-th basic module of the
r-th compound module of the
j-th product variant.
is total disposal amount of the
n-th type for selecting the
m-th raw material of the
l-th module instance of the
k-th basic module of the
r-th compound module of the
j-th product variant, tons/yr.
The multinomial logit (MNL) selection rules are known for providing a more realistic representation of consumer decision-making processes and are used to simulate customer selection probabilities for products in product design [
50]. Specifically, they are expressed as in Equation (6).
where
μ represents a positive scaling parameter of the MNL model. As
μ tends to infinity, the model approaches a deterministic selection rule. Conversely, as
μ tends to 0, the model approximates a uniformly distributed selection rule.
The total cost is composed of design cost and sustainable cost, which is as follows:
The design cost includes the following components: fixed design cost, raw material design cost, production method design cost, recycling method design cost, and end-of-life processing method design cost. The design cost is specifically expressed as follows:
4.4. Lower-Level Optimization
The lower-level model selects the sustainable solution for the product. In accordance with the upper decision-making scheme, the lower-level decision schemes are optimized to minimize the sustainable comprehensive evaluation indices.
For the lower level of the model, the following assumptions are made.
- (1)
Product family cost is divided by direct and indirect cost;
- (2)
The SMPs of the product family only consider the economic, environmental and consumer demands.
Equation (9) is the SMP cost for a product family. The sustainable cost of the product primarily encompasses the expenses associated with raw materials, production methods, recovery methods, and end-of-life processing methods.
Equations (10)–(13) represent the engineering cost of the four stages of the product family.
Equation (10) indicates that the module instances take both fixed and variable costs into account when selecting raw materials. Equation (11) represents the manufacturing cost of the compound modules, which is composed of fixed and variable costs. Equation (12) represents the recycling cost of product variants, including fixed and variable costs. Equation (13) represents the cost of different processing methods at the end-of-life stage of the product family, including fixed and variable costs.
Equation (14) is emissions.
Equation (15) represents the energy consumption.
4.5. HJO Decision Making of PFA and SMPs
The HJO model can be obtained as follows:
Equation (16) is the objective function of the PFA design problem. Equation (17) represents the unique constraint of the product variant. Equation (18) indicates that every basic module only selects one module instance. Equation (19) represents the product quantity constraint. Equation (20) represents the range constraint of the upper-level decision variable.
Equation (21) is the objective function of the SMP problem. indicates a single attribute scaling constant and is a normalising constant range from 0 to 1. Equation (22) represents the relationship between and . Equation (23) represents the relationship constraint for the instance selection variable and the raw material selection variable. Equation (24) indicates that only one production method can be selected for each compound module. Equation (25) indicates at least one or more recycling methods are available for each product variant. Equation (26) indicates at least one or more end-of-life process methods are available for the product family. Equation (27) is the range constraints of the lower-level decision variables.
In the HJO model, the upper-level PFA design determines the PFA and configuration scheme for a certain market segment. According to the decision results of the upper level, the lower level decides on the choice of raw materials , the production method , the recycling method , and the end-of-life processing method . The lower-level results determined according to the sustainable comprehensive evaluation indices are passed to the upper-level model. According to the results of the lower-level feedback, the upper level will adjust the product architecture, and then reevaluate the decision variable to maximize the upper-level objective function. The loop continues until it reaches the Stackelberg equilibrium. The optimal solution of the model is reached when neither decision-maker is willing to change their decisions further, and the upper- and lower-level objective function values are calculated based on this optimal solution.
5. Solution of the Model
5.1. Algorithm Construction and Evaluation
The above bilevel 0–1 integer nonlinear programming model established, based on the actual engineering characteristics, is an NP-hard problem [
43], which makes the model solution very difficult. The genetic algorithm is highly effective when efficiently discovering a global near-optimal solution and has the capability to evade local optima while overcoming the multimodality of the objective function [
51]. Given the complexity of our model, we have developed a nested framework aligned with the bilevel programming solution mechanism and applying genetic algorithms to this framework, forming an NGA.
Figure 5 illustrates the specific process of the NGA, with the detailed steps outlined as follows:
Step 1: Set the parameters: Set the parameters of PFA optimization, contain the upper-level and lower-level genetic algorithm population size N and M and the maximum number of iterations in upper and lower model GN and GM.
Step 2: Upper-level population initialization: According to the different PFA design and the upper-level bounds of the product variant configuration, the coding strategy of the variables are determined and the upper-level product variant is encoded.
Step 3: Determine that the upper-level constraints are satisfied: First, one must judge whether the individual population of the upper-level PFA design satisfies the upper-level constraint conditions. If it is satisfied, the individuals are passed to the lower-level and proceed to the next step. If not, set the upper-level fitness function to zero and jump to step 7. Secondly, the utility of unit cost of the whole product family is taken as the fitness function of the upper-level model.
Step 4: Lower-level population initialization: According to the different SMP schemes and the bounds of the lower-level decision variants, the coding strategy of the variables are determined and the lower-level SMP variants are encoded.
Step 5: Judgement of the lower-level constraints: Evaluate the parent populations of the lower-level model, setting their fitness values to zero if the populations do not satisfy the constraints. For populations that meet the constraints, utilize the lower-level sustainable comprehensive evaluation indices value as the fitness function values.
Step 6: Lower-level termination checking: Check whether the current number of iterations in the lower-level has reached the maximum limit set by GM. If the limit has been reached, record the optimal solutions along with their corresponding values. Then, feed back the decision variables for SMPs to the upper-level model. If the maximum iteration limit has not been reached, proceed with the selection, crossover, and mutation of the lower-level population individuals and move to step 5.
Step 7: Termination checking: Check whether the upper-level genetic algorithm has reached the maximum number of iterations, denoted as GN. If the maximum number of iterations has been reached, record the upper-level optimal solutions and their corresponding optimal value. If the maximum iteration limit has not been reached, continue with the selection, crossover, and mutation of individuals in the upper-level population and proceed to step 3.
5.2. Encoding
To facilitate the calculation, we encode the upper- and lower-level decision variables into two chromosomes of finite length. The upper chromosomes represent the PFA design, and its length is the sum of all modules and corresponding module instances in the product variants. As shown in
Figure 6a, the first layer represents the product family, and the different colors correspond with the products in the product family. Different PFAs result in different lengths of this layer. The second layer represents the product variants, and the product variant consists of several compound modules. As shown, the product variant
consists of
compound modules. The third layer represents the compound modules, which consists of several basic modules. The fourth layer represents module instances, with each corresponding number representing the selection of a specific module instance by a basic module. The upper-level code length is
. The lower-level chromosomes represent the choice of product family, product variants, compound modules and basic modules for the corresponding SMP solutions. The coding of the lower-level decision variables selects the 0–1 coding mode, 0 when a certain method is not selected and 1 when a certain method is selected. The specific coding method is shown in
Figure 6b.
5.3. Crossover and Mutation
The selection process involves the use of an operator to choose individuals with robust vitality from the population, thus generating new populations. This can be undertaken in order to obtain the best child chromosomes for survival in the evolution [
52]. In this study, the operator is generated by roulette. This means that the probability of each chromosome being selected for the next generation is determined by the ratio of its fitness value to the total fitness value of all individuals in the population. Consequently, individuals with higher fitness values are more likely to be selected for the next generation.
Crossover is the primary method for generating new chromosomes. Illustrated in
Figure 7, crossover involves two parent chromosomes exchanging part of their genes at a certain position to produce two new offspring chromosomes. Mutation, on the other hand, involves altering a portion of the chromosome’s gene with a small probability after the crossover operation. Through the mutation operation, the corresponding module selections, recycling methods, etc., can be randomly altered.
6. Case Study
6.1. Background Description
To verify the effectiveness of the proposed HJO model and NGA, it was applied to the design of a brand of a laptop computer product family. The laptop is a typical modular product. Its PFA is shown in
Figure 8. To ensure the company’s benign development while meeting the requirements of consumers, the company must determine the optimal PFA and corresponding configuration.
The modules information for the laptop family is presented in
Table 2. With a total of 12 modules, the number of potential options amounts to 46,656 (
). Given the considerable number of selected product variants, conducting individual market research for each one is impractical. Consequently, to gauge consumer preferences across product segments, orthogonal analysis is employed on the alternatives, yielding 32 orthogonal product profiles (detailed in
Table 3). Subsequently, a group of 50 consumers was selected to assess and rank the 32 product variants. Through conjoint analysis, the utility values of different modules within the product variants were determined for the market segment, as illustrated in
Table 4. The estimated sizes of these market segments were 5000, 6000 and 8000. The population size for both upper and lower levels was fixed at 40 generations, with crossover and mutation probabilities set to 0.8 and 0.05, respectively. Parameters
and
in the multi-attribute utility function are assigned values of 0.3, 0.35 and 0.35, respectively. The parameter
μ can be set to 0.6.
The compound module configuration classification is shown in
Table 5. For the SMP problem information for the module instances, the compound modules, the product variants and the product family can be introduced in
Table 6,
Table 7,
Table 8,
Table 9 and
Table 10. We assume that the information regarding the module instances of different products in each product family are the same.
6.2. Results of HJO Model
The developed solution method is adopted to solve the HJO model. The NGA is realized by MATLAB 2023b on an Intel(R) Core (TM)i5 and 16 GB RAM 3733 MHz with the following parameters: initial population scale is capped at 40; the crossover probability is set at 0.80; the mutation probability is 0.05; the maximal number of iterations is 150; and the precision of the binary code is set to 0.01, these settings are derived from experience in the domain of computational experiments.
Figure 9 displays the optimal results for PFA design in SMPs. Various colors represent different PFA combinations across distinct product variants.
Figure 9 comprises an x-axis representing the number of iterations and a y-axis representing the optimal value of the upper-level objective function for each scenario. The iteration count is set to 150 generations with a computational time of 2593 s.
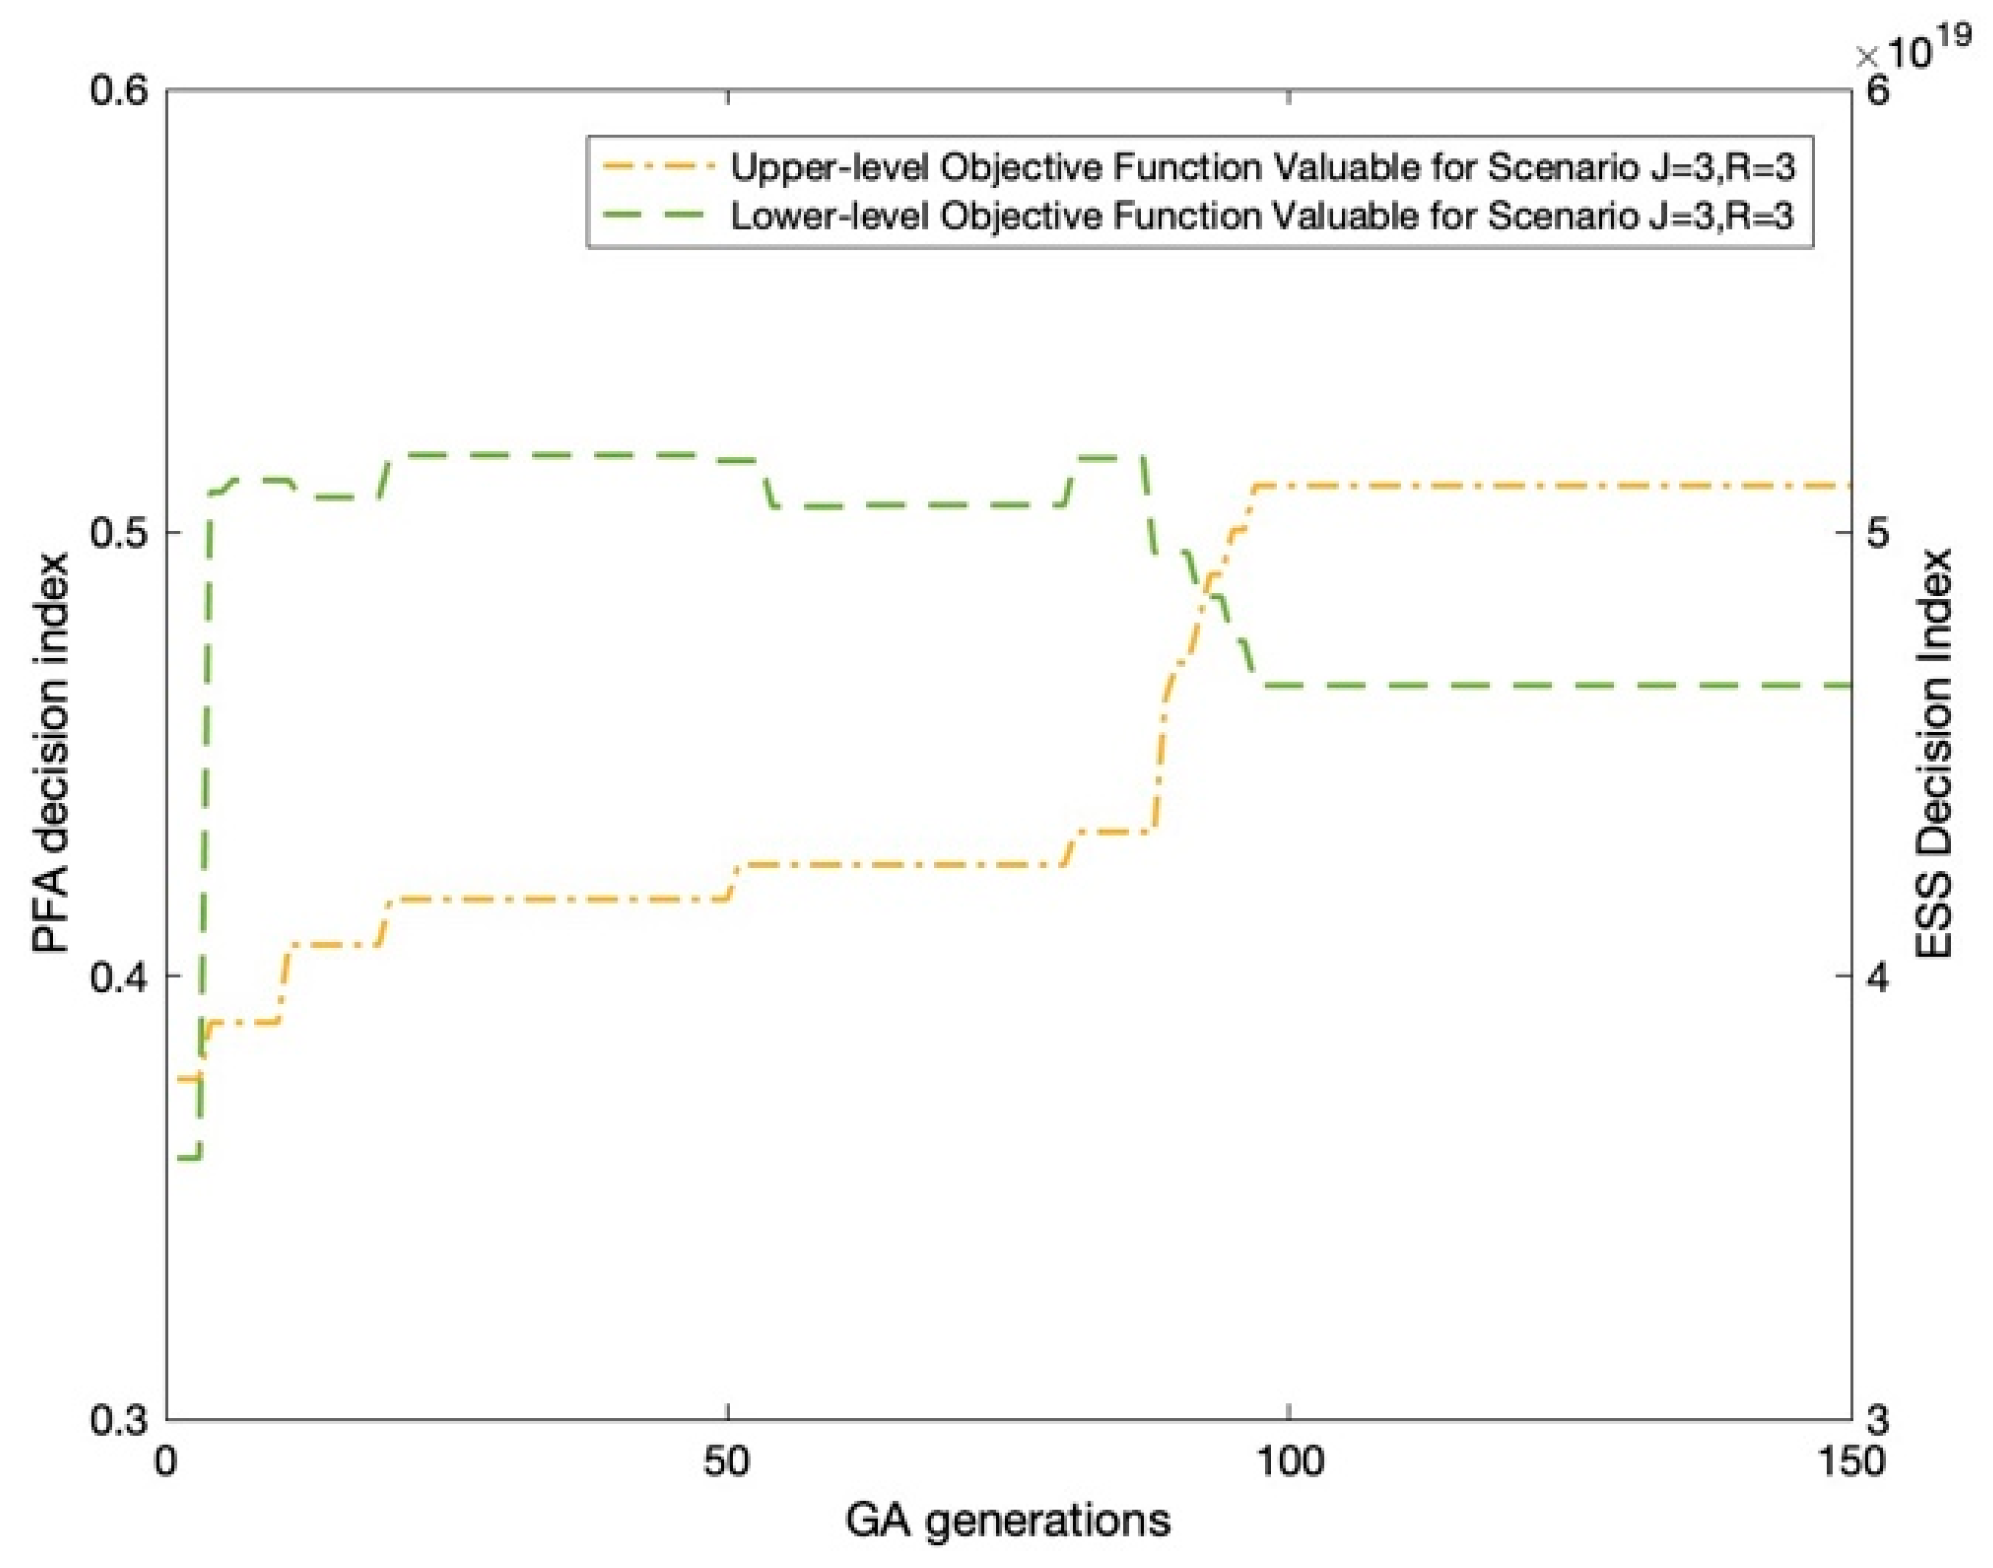
Figure 10 presents the results of the optimal SMPs for PFA scheme (J = 3, R = 3). The x-axis represents the number of iterations. The left y-axis illustrates the change in optimization results at the upper-level model, while the right y-axis depicts the change in optimization results at the lower-level model. Throughout the entire optimization process, there is a mutual influence between the upper and lower levels. The optimization outcomes of both the upper-level and lower-level models fluctuate with each generation and begin to converge around the 95th generation, continuing until the end of the iterations. Both the leader and follower are reluctant to further alter their decisions, which suggests that the two decision-makers have reached a state of equilibrium.
Table 11 shows the optimal SMPs for the laptop PFA design. For example, the first product variant consists of three compound modules, while
consists of four basic modules. Each basic module selects the corresponding product configuration
and
, and each module instance selects the corresponding raw material in the fourth column.
selects the corresponding second raw material.
selects the third production method, product variant 1 selects the second recycling method, and the product family selects the third end-of-life processing method.
6.3. Sustainability Analysis for Problem
To validate the advantages of our proposed sustainable product design and manufacturing process, we conducted comparative experiments between our proposed optimization design problem and a non-sustainable optimization design problem. In the non-sustainable optimization design model (NS-HJO), our upper-level optimization objective is to maximize the utility of unit cost. The lower-level optimization objective is to minimize the lifecycle cost. This means that the upper-level no longer considers sustainable manufacturing utilities, while the lower-level no longer considers consumption and emissions.
The experimental results are shown in
Table 12. One can observe that the optimal solutions for sustainable PFA schemes are different from those without sustainability considerations. For the former, the optimal solution involves three product variants in a product family, each with three combinations of compound modules. For the latter, the optimal PFA design involves three product variants in a product family, each with two combinations of compound modules. Additionally, compared with the non-sustainability optimization problem, the utility of unit cost obtained by considering the sustainability problem is increased by 155% from 2.0 ×
to 5.1 ×
. This suggests that considering sustainable product development activities not only meets consumer demands for the product family but also fulfills the environmental requirements of society, government, and customers.
6.4. Performance Analysis for Model
To demonstrate the superiority of the HJO model when addressing the optimal SMPs for PFA design, we compare the results obtained from this approach with those from two commonly used methods: the integrated optimization method (IOM) [
52] and the two-stage method (TSM) [
17]. The comparison results are presented in
Table 12.
The IOM method is not based on the HJO mechanism of PFA and SMPs. The two problems are combined into one problem and the PFA and SMP solutions are decided at the same time. The leader and follower objective functions of the HJO act as the objective functions in IOM method, and the decision variables and constraints of the leader and follower models are used in the calculation of the IOM method. After obtaining the value calculated by the IOM method, it is taken into the lower-level objective function in order to calculate the lower-level model result. Compared with the integrated optimization method in J = 3, R = 3, the utility of unit cost obtained by the HJO method is increased by 4.1% from 4.9 × to 5.1 × , while the comprehensive evaluation index is decreased by 2.13% from 4.8 × to 4.7 × . This is mainly because the HJO design method prioritizes the cost-to-utility ratio of the leader, placing the comprehensive evaluation indices of the follower after the PFA design. The first-mover advantage of PFA design in bilevel decision-making promotes excellent quality and a favorable cost-to-utility ratio. Conversely, in the IOM method, PFA design and SMP solutions are equally important. Consequently, the product design department loses the first-mover advantage, resulting in a lower utility of unit cost.
The TSM divides PFA design and SMP solutions into two stages. Firstly, the PFA is optimized, and then SMP solutions are determined according to the PFA and configuration results. In the first stage, based on historical data and existing data of channels such as second-hand market, the product family manufacturing cost and utility are estimated and optimized. In the second stage, according to the obtained PFA and configuration results, the corresponding raw materials, production methods, recovery methods and end-of-life process methods are selected, and sustainable comprehensive evaluation indices are calculated. In the first stage, the objective function is still the upper-level objective function, and the lower-level constraints are incorporated into the upper-level constraints. Compared with the two-stage method in J = 3; R = 3, the unit cost-utility ratio obtained by the HJO method increases by 8.5%, from 4.7 × to 5.1 × . Additionally, the sustainable comprehensive evaluation indices increase by 2.13%, from 4.8 × to 4.7 × . This is primarily attributed to the fact that the PFA cost and utility values are estimated solely through historical and secondary market data analysis, without considering the impact of SMPs on cost and utility. As a result, the PFA solution cannot be adjusted promptly when the SMP plan changes.
6.5. Reliability Analysis for Algorithm
We validate the reliability for the NGA algorithm through two sets of experiments.
Optimality Analysis: Particle swarm optimization (PSO) is a relatively recent heuristic algorithm inspired by the social behavior of crowded species like bird flocking and fish schooling, which has demonstrated success across a wide range of optimization tasks [
53]. Consequently, we undertake sensitivity analysis of the parameter μ in the MNL choice rule on the PFA objective function value using both our proposed NGA algorithm and the PSO algorithm within a bilevel solving framework in order to verify the reliability of our proposed algorithm in terms of optimality. An experiment is conducted by fixing μ as a series of constants ranging from 0 to 9 in increments of 1. The parameter settings of PSO are as follows: The number of swarms is 1, the number of particles is set to 20, and the number of generations is set to 100. The inertia weight (w) is set to 0.4 and 0.6. The acceleration coefficients (c1 and c2) are set to 2, and rand1 and rand2 follow a standard normal distribution with a mean of 0 and a variance of 1. As illustrated in
Figure 11, it is apparent that the PFA objective function value calculated by the nested PSO algorithm for 10 points ranging from 0 to 9 is inferior to those obtained by the NGA. Consequently, we can infer that the reliability of our proposed NGA in terms of optimality surpasses that of the PSO algorithm.
Stability Analysis: The second set of experiments involves conducting multiple trials for each value of the parameter μ in the MNL choice rule to determine deviation values. Subsequently, we assess the model’s stability by comparing the range of deviation intervals for each value. The shaded area depicts the error band from multiple trials. As illustrated in
Figure 11, the NGA displays varying levels of fluctuation across different parameter values. There is a smaller range of fluctuation compared with the PSO algorithm. Hence, we can infer that the reliability of our proposed NGA in terms of stability outperforms that of the PSO algorithm.


