
Radon and Its Short-Lived Products in Indoor Air: Present Status and Perspectives

Department of Environmental Sciences, Jožef Stefan Institute, Jamova cesta 39, SI-1000 Ljubljana, Slovenia
Sustainability 2024, 16(6), 2424; https://doi.org/10.3390/su16062424
Submission received: 31 December 2023
/
Revised: 22 January 2024
/
Accepted: 12 March 2024
/
Published: 14 March 2024
(This article belongs to the Special Issue Sustainability and Indoor Environmental Quality)
Abstract
:Initially, basic equations are given to express the activity concentrations and concentrations of potential α-energies of radon (222Rn) and thoron (220Tn) and their short-lived products in indoor air. The appearance of short-lived products as a radioactive aerosol is shown, and the fraction of the unattached products is particularly exposed, a key datum in radon dosimetry. This fundamental part is followed by giving the sources of radon and thoron indoors, and thus, their products, and displaying the dependence of their levels on the ground characteristics, building material and practice, and living–working habits of residents. Substantial hourly, daily, and seasonal changes in their activity concentrations are reviewed, as influenced by meteorological parameters (air temperature, pressure, humidity, and wind speed) and human activity (either by ventilation, air conditioning and air filtration, or by generating aerosol particles). The role of the aerosol particle concentration and their size distribution in the dynamics of radon products in indoor air has been elucidated, focusing on the fraction of unattached products. Intensifying combined monitoring of radon short-lived products and background aerosol would improve radon dosimetry approaches in field and laboratory experiments. A profound knowledge of the influence of meteorological parameters and human activities on the dynamics of the behaviour of radon and thoron accompanied by their products in the air is a prerequisite to managing sustainable indoor air quality and human health.
1. Introduction
In the three primordial radioactive chains, three radon isotopes are created by α-transformation of radium [1]: 222Rn (half-life, t1/2 = 3.82 days) in the uranium chain starting with 238U, 220Rn (t1/2 = 55.6 s) in the thorium chain starting with 232Th, and 219Rn (t1/2 = 3.9 s) in the actinium chain starting with 235U (Figure 1). Only a fraction of radon atoms (emanation fraction or emanation power) succeed in leaving the mineral grain due to their recoil energy and thus enter the void space, from where they migrate through the medium either by diffusion or, more effectively and to longer distances, by being carried by gas or water [2]. On its way, radon accumulates in underground rooms (e.g., fissures, karst caves, mines, basements) and, eventually, exhales in the atmosphere and appears in the air of living and working environments. Generally, the predominant 222Rn source for indoor activity concentration is its level in the ground on which a building stands [3,4,5]. Only seldom water or natural gas used in a household could be the primary source [6,7]. On the other hand, because of its short half-life, 220Rn cannot travel far from its source, and, therefore, it appears indoors at radiologically relevant levels mostly only when the floor, walls, or other indoor elements are made of material of elevated thorium content [8,9]. Only exceptionally high thoron levels in soil [10] or in outdoor air [11] can result in high levels in indoor air. 219Rn, with its very short half-life, is never met at relevant levels in ambient air. Hereafter, 222Rn is also referred to as radon and 220Rn is referred to as thoron.
Radon and thoron α-transformations are followed by radioactive chains of their short-lived metallic products (Figure 1). Radon (RnP) and thoron (TnP) products are initially mostly positive ions [12,13,14], which soon react with molecules of trace gases and vapours (mostly water) in air and are partly oxidised and form small charged and neutral clusters [13,14,15]. These are considered unattached RnP and TnP. Product ions and clusters also attach in part to the background aerosol particles. The extent of attachment depends on environmental conditions [13,16,17,18]. These products are denoted as attached RnP and TnP. Thus, RnP and TnP appear as radioactive aerosols. When breathing, aerosol particulates are partly deposited on the walls of the respiratory tract. It has been recognised that on average, globally, inhaled RnP and TnP contribute about half of the effective dose (the contribution of radon and thoron gas being minor) a member of the general public receives from all-natural radioactivity [19], and they are a major cause of lung cancer, second only to cigarette smoking [20].
Systematic and extensive radon measurements were first introduced and conducted in the uranium mines and mills in the uranium era, soon after the Second World War, as a means to maintain ventilation at workplaces sufficiently effective to ensure exposure to radon under acceptably low levels, which have been steadily lowering, under increased radiation protection concern for workers. Towards the end of the 20th century, it became clear that elevated radon levels could also appear in the indoor air of dwellings. As a result, international institutions responsible for health care and radiation protection of the general population started and have continued to publish recommendations that limit radon levels in the living and working environment, thus stimulating national governments to issue their related legislation. As a result, systematic and often extensive radon surveys in dwellings have been initiated and conducted in a large number of countries, mainly in Europe, the United States, and India [19]. In some countries, following the recommendations of the US Environmental Protection Agency [21,22], the national radon survey was first carried out in kindergartens and schools, as reviewed by Vaupotič [23], with a young population more vulnerable to radiation [24,25,26,27], and then continued in residential buildings. In his comprehensive review, Porstendörfer [11] reported and commented on the results of 149 works, only 27 of which were devoted to thoron. In another paper [28], thoron results were reviewed in 15 studies conducted in 10 countries.
In the beginning, priority was given to radon because of a general opinion that thoron, due to its short half-life, was less likely to accumulate at high levels indoors. This opinion was slowly changed as more papers appeared reporting thoron levels comparable to or even higher than radon levels [29], such as in traditional wooden Japanese houses [30,31], in Italian buildings made of volcanic material [8], or in cave dwellings in China [32]. Nonetheless, extensive monitoring of thoron and its products was not possible until recently, when the appropriate solid-state nuclear track detectors became commercially available. In many countries that had already finished their national radon programmes, thoron was measured recently, at least to a limited extent, to estimate its indoor levels and complement their previous radon database, e.g., Canada [33], Ireland [34], Germany [35], Poland [36], Hungary [37], Slovenia [38], Serbia and Kosovo [39,40], and North Macedonia [41]. On the other hand, extensive studies of radon, thoron, and their products have recently been conducted in various countries, particularly in several areas in India. Some solely discuss radon and thoron in indoor air, soil, and water [42,43,44], while others discuss radon, thoron, and their progeny in dwellings in different parts of the country [45,46], including thoron dose estimates [47,48,49,50], or are focused on measurement technique [51,52]. Nonetheless, the thoron database remains modest in comparison to that of radon.
The local and national radon surveys have generally been accompanied by radiation dose estimates and followed by radon mitigation in buildings with radon levels above a certain limit. In order to harmonise the results obtained in field measurements by different groups, several international intercomparison experiments have been organised. A significant aim has been achieved by the European Radon Atlas, to which a majority of the European countries have contributed with their indoor air and soil gas radon databases.
2. Fundamentals of Radon and Thoron Products
Figure 2 presents radon and thoron sub-chains. 218Po and 216Po are formed as positively charged and become neutralised in one of the following processes [13,14,15]: (i) recombination with ions produced by α, β, and γ emissions and recoil atoms during radioactive transformations of airborne radionuclides, as well as by background γ and cosmic rays, (ii) electron scavenging by OH radicals formed by radiolysis of water molecules, and (iii) charge transfer from molecules of lower ionisation potential. The states of 218Po, 216Po, and their oxides at the moment of their α-transformation into Pb are decisive because they determine the initial characteristics and behaviour of the subsequent members in the chains. For 218Po in 50% humid air at an ionisation rate of 3.2 pC kg–1 s–1 (45 μR h–1), the rate constants of the above processes of neutralisation are 0.07 × 10⁻² s–1, 1.07 × 10⁻² s–1, and 0.4 × 10⁻² s–1, respectively, and, eventually, more than half of the species (molecular clusters) are neutral [16]. The clusters of RnP and TnP species are called unattached RnP and TnP. The above processes are accompanied and followed by the attachment of clusters [13,16,17,18,53], both charged and already neutralised, to the background aerosol particles, thus forming attached RnP and TnP. The attachment rate constant λa (s−1) is proportional to the number concentration of aerosol particles (number of particles in the volume unit, N/cm−3) and the size-dependent [18] attachment probability (coefficient β/cm3 s−1), expressed as [54]:
λa = β N.
Because of the recoil energy (order of magnitude 100 eV) gained during α-transformation of the attached 218Po and 216Po, a considerable recoil fraction (r) of 214Pb and 212Pb atoms is ejected from the aerosol particles [55,56]. Attached RnP and TnP species behave as other radioactive and non-radioactive aerosol particles. As such, they are also subject to steady particle deposition. The deposition rate constant λd (s−1) depends on the particle deposition velocity (m s−1), corrected for friction velocity [57,58], and is proportional to the ratio of the available surface S (m2) in a room of volume V (m3) [56]:
The deposition rate constant λd is distinguished for the unattached () and attached () species. Instead of deposition velocity (Equation (2)), some authors use the so-called average or effective deposition velocity (), expressed by the deposition velocity of the unattached () and attached () species as [57,59]:
with fu—a fraction of unattached RnP or TnP.
Potential α-energies associated with RnP and TnP transformations (Figure 2) are summarised in Table 1 [56,60,61,62,63]. To each isotope, all energies are assigned and emitted in its transformations along the chain to the stable 206Pb for RnP and stable 208Pb for TnP. Thus, the 218Po atom has (6.00 + 7.69) MeV, and 214Pb and 214Bi atoms (though only β emitters) have 7.69 MeV. Because the TnP chain is branched after 212Bi, the average value of 7.81 MeV (=0.36 × 6.09 + 0.64 × 8.78) is assigned to 212Pb and 212Bi, and (6.78 + 7.81) MeV is assigned to 216Po. Energies are given per one atom and per 1 Bq (i.e., Eα and Eα/λ, λ—rate constant of radioactive transformation). For RnP, the summation of (Eα/λ)j, with j = 1 to 4, gives 34,520 MeV. To this sum, a fraction of kj = (Eα/λ)j/34,520 (Table 1) is contributed by each of RnP species, with a fraction of 218Po being negligible. Thus, the above situation represented as an imaginary secular equilibrium condition in which activities of all of the products are equal to the radon activity, i.e., 1 Bq, can be written as
with ARnP (Bq m−3), thus expressing the equilibrium-equivalent activity concentration of RnP (also denoted by EERC, EECRn, or, rarely, Ceq,Rn).
If 3700 Bq m−3 (100 pCi m−3) is taken instead of 1 Bq m−3, the concentration of potential α-energy is 1.29 × 10⁸ MeV m−3 (20.4 μJ m−3), which is equivalent to the RnP concentration of 1 WL (‘working-level’—an early radon limit for uranium miners), regardless of the degree of secular equilibrium between Rn and RnP.
By multiplying Eα/λ values from Table 1 with the activity concentrations of the related radionuclides, the concentration of potential α-energy of RnP is obtained (EαRnP/MeV m−3, also denoted as PAEC or PAECRn) as follows:
Referring to the energetics of TnP in Table 1 and applying the same reasoning as above for RnP, the equilibrium-equivalent activity concentration of TnP (ATnP) (also denoted by EETC, EECTn, or, rarely, Ceq,Tn) is expressed as
and the concentration of potential α-energy of TnP (EαTnP/MeV m−3, also denoted as PAEC or PAECTn) is expressed as:
As 1 Bq of TnP contains 47.1 × 10⁴ MeV (Table 1) and 1 WL is defined as 1.29 × 10⁸ MeV m−3, 1 WL of TnP corresponds to ATn = 275 Bq m−3 (=1.29 × 10⁸ MeV m−3/47.1 × 104 MeV Bq−1).
Exposure of 1 WLM (‘working-level-month’) is gained by breathing air of radon or thoron activity concentration of 1 WL for 170 h.
Due to all of the sinks of radon and thoron products (e.g., deposition, filtration), secular equilibria between radon and its products and thoron and its products are never reached in indoor and outdoor air, and the actual degree of equilibrium is expressed by the so-called equilibrium factor F, defined as:
and
FRn = ARnP/ARn for radon
FTn = ATnP/ATn for thoron.
Sometimes, when FRn is measured with the solid-state nuclear track detectors, the so-called reduced equilibrium factor, defined as [64,65]
or the proxy equilibrium factor, defined as [65]
are reported and may, under certain conditions, approximate the total equilibrium factor FRn well.
Dependence of particle deposition on their size [66,67] plays a crucial role in modelling the adsorption of aerosol particles (and thus RnP and TnP) to the walls of the respiratory tract along the lung generations during breathing. This is a prerequisite for radon dosimetry because it enables us to calculate dose conversion factors fDC (also denoted as DCF), expressing radiation dose (Gy or Sv) per unit exposure (Bq m−3 h or WLM) [68,69,70,71,72,73]. Birchall and James [72] and Marsh et al. [73] have shown that the parameter mainly affecting fDC is the fraction of unattached radon and thoron products (fu), defined as [1]
and
where , , , and are obtained if in Equations (4)−(7) the activity concentrations of only the unattached species of the individual products are included, and not their total concentrations (e.g., instead of ). Empirical formulae have been proposed to use to calculate fDC (in mSv WLM−1) for RnP [72,73]
and separately for
and [74]
As reviewed by Porstendörfer and Reineking [14], differs substantially from place to place, and depending on the environmental conditions, its value ranges from 0.006 to 0.83. Generally, it is inversely proportional to the number concentration of aerosol particles [75,76,77,78], the relationship being approximated by Papastefanou [18], Porstendörfer [74], and Huet et al. [79]:
Thus, is very low in mines with high aerosol concentration [75] and high in karst caves with very clean air [75,76,80,81,82,83].
The related empirical relation for thoron products is [18]:
3. Radon Short-Lived Products as Radioactive Aerosols
Ambient air is a suspension of fine solid particles or liquid droplets. Particles are of different sizes, shapes, and physical–chemical properties. A special class is radioactive aerosols made up of radioactive particles, both as molecular clusters of radionuclides and radionuclides attached to particulate matter [18]. Radon and thoron products belong to this class. The size of aerosol particles ranges from less than several nm for molecular clusters to about 100 μm for fog droplets and dust particles. Particles larger than 100 μm cannot remain suspended in air and may not, therefore, be considered as aerosol [84]. Classification of aerosols with respect to their particle size differs depending on the purpose of use, as well as the author [84,85,86,87,88]. Terms of ultrafine (<100 nm), fine (<1000 nm), and coarse particles (>1000 nm) are preferably used by toxicologists and regulatory bodies. On the other hand, aerosol scientists refer mainly to different modes [89]: nucleation (1–30 nm), Aitken (20–100 nm), and accumulation mode (90–1000 nm). Nevertheless, the borders are not strictly fixed and may differ from author to author. Neither is the term nano applied univocally. Although it may refer to any particle of <1 μm size, it is used for particles of <300 nm [86], <100 nm [85,90], <50 nm [91], or even smaller [92,93].
Monodisperse aerosols are very rare. The size distribution of aerosol particles is mathematically described either by differential or integral distribution function, usually in logarithmic form. Number size distribution , showing the number concentration of particles (in m−3 or, often, more conveniently, in cm−3 or even mm−3) within the size windows of particle diameters d over the entire size range is expressed in the logarithmic form as [88]:
For some purposes, the distribution of the concentration of mass, surface, or volume of particles (instead of the number) with respect to the particle size can be useful [18]. For radon and thoron products, as for other radioactive aerosol particles [18,53], the activity size distribution is commonly used:
For the activity size distribution, the activity median diameter (AMD) or geometric mean diameter (GMD) is reported. It is named AMAD (activity median aerodynamic diameter) when the impactor is used for measurement or AMTD (activity median thermodynamic diameter) when the diffusion battery is used [95].
Measurements in 31 occupied houses in New Jersey, USA showed a bimodal activity size distribution with GMD ranging from 1×/:1.38 nm to 9×/:2.61 nm for unattached and from 40×/:6.30 nm to 258×/:1.67 nm for attached RnP [96]. In another study, the same authors [95] showed that bimodal size distributions of RnP and TnP particles are similar and that they do not differ significantly even in a range of the aerosol particle number concentration from 2.3 to 180 mm−3 (Table 2). On the other hand, depending on the aerosol source and its concentration, uni-, bi-, and three-modal activity size distribution of RnP was observed [97].
Hopke et al. [98] considered unattached RnP as particles in the size range of 0.5–1.5 nm. According to a review by Porstendörfer and Reineking [14], AMD of the RnP clusters falls into the range of 0.9 nm to 30 nm, while AMAD of the aerosol particles that carry RnP attached are in the range of 50 nm to 500 nm. Measurements in indoor air also showed that within the unattached region of <10 nm, two (with AMD of 0.8 and 4.2 nm) or even three activity distribution peaks (0.60, 0.85, and 1.25 nm) may appear [74,99]. In addition, attached RnP appeared in the nucleation (attached to particles of 14–40 nm), accumulation (210–310 nm), and coarse mode (3000–5000 nm) [99]. In an intercomparison experiment carried out in a test chamber, the following average AMD values and regions (nm) were found for the unattached RnP [100]: 0.66 (0.53–0.86) for 218Po, 0.80 (0.53–1.76) for 214Pb, and 0.91 (0.53–2.20) for 214Bi. The following were found for TnP: 0.73 (0.53–0.97) for 212Pb and 0.85 (0.53–2.31) for 212Bi. According to Huet et al. [101], diameters (nm) of the unattached 218Po, 214Pb, and 214Bi in an aged aerosol were similar and close to 0.85×/:1.25, and of the attached RnP, to 190×/:1.64. In a radon chamber containing carrier aerosol, the AMD values of 0.82, 0.79, 1.70, and 0.82 nm were obtained for the unattached 218Po, 214Pb, 214Bi, and 214Po, respectively [102]. For unattached 212Pb, the diameter size range of 0.8–2.0 nm and AMTD of 1.32 nm have been reported, and for its attached form, the size range of 230–400 nm and AMTD of 352 nm [103]. An AMTD of 1.28 nm for unattached 218Po was in the range of 1.04–1.55 nm, and that for unattached 214Pb of 1.30 nm was in the range of 1.10–1.60 nm, while the AMAD for attached 214Pb was 353 nm in the range of 240–550 nm and that for attached 214Bi was 380 in the range of 250–540 nm [104]. Zhang et al. [105] have demonstrated a slight size increase of unattached RnP with increasing aerosol particle concentration (e.g., AMD of 218Po increases from 0.94 ± 0.17 nm to 0.98 ± 0.13 nm when N increases from 1.058 mm–3 to 10.46 mm–3). The typical values of those parameters have been adopted in lung dosimetry calculation by Marsh and Birchall [106].
In theoretical calculations, various AMD values are considered for unattached RnP, including, for instance, 0.9 nm [58], 0.5–5 nm [107], or 0.5–1 nm [108]. Or, instead of attached–unattached, the particle size is classified as nucleation (50 nm), accumulation (250 nm), and coarse modes (1500 nm) [109].
While the attachment of RnP and TnP species to background aerosol particles is related to the aerosol concentration (Equation (1)), deposition and filtration of particles strongly depend on the particle size [56,66,110]. Therefore, the behaviour of the unattached and attached RnP and TnP is governed by the concentration of the background aerosol particles and their size distribution.
It has been shown [66,111,112] that when there is no particle source indoors, most indoor particles are of outdoor origin and brought in by air penetration. The indoor/outdoor particle concentration ratio may range from 0 [111] to 2.46 [112,113], and it increases with particle diameter, reaching the highest values between 100 nm and 400 nm [111]. The number particle concentration indoors results from competition between particle sources (their penetration from outdoor air and production by human activity indoors) and particle sinks (through ventilation, deposition, and filtration). This can be described as [66,110,114,115,116,117]
with:
- N, Nout—indoor, outdoor particle number concentrations, m−3, cm−3 (particles per m3, cm3);
- pout→in—outdoor → indoor particle penetration coefficient;
- λv—ventilation rate constant, s−1;
- λd—deposition rate constant, s−1;
- λf—filtration rate constant, s−1;
- Qp—particle generation rate of indoor sources, s−1 (particles per s);
- V—room volume, m3, cm−3.
Coagulation and condensation are not included in Equation (22). Because pout→in [66,117], λv [66,111,112], λd [97,111], and λf [110] depend on particle size, their values in the equation should be considered either as for a selected size or as averaged over all particle sizes.
The solution of Equation (22) under steady-state conditions [117],
shows the particle number concentration in indoor air as a result of their sources and sinks. Coagulation and condensation are not taken into consideration.
Before human activity starts to produce indoor particles at time t = 0 (and Qp = 0), N(0) is equal to the first term on the right side of Equation (23) and is considered the baseline or background level of N before an event by human activity. With particle generation started, ∆N(t) = N(t) − N(0) begins to grow and reaches its maximum value ∆N(tM) at time t = tM after the indoor particle source has been stopped. ∆N(t) decay follows. Thus, ∆N(tM) shows the maximum increase in particle number concentration during an event caused by human activity. Assuming that N(0) is constant during a short human activity event, Equation (23) can be used to calculate the particle generation rate of indoor sources [66,117]:
The result for ∆N(tM)/2 gives the average particle generation rate Qp. If this Qp is multiplied by tM (duration of particle generation), the total number of particles emitted during an activated source is obtained.
The (λv + λd + λf) sum can be obtained from the slope of the exponential decay of N(t) with time, starting after ∆Nt(tM), by using the relation [66,117]
in which ∆N(tM+) is a value at a point after the maximum, where the exponential form of the ∆N(t) curve decay appears.
ln ∆N(t) = ln ∆N(tM+) − (λv + λd + λf) t, t > tM,
As for the background aerosol, the activity concentrations of aerosol particles of the individual radon and thoron products in a room are also a result of the competition between their sources and sinks. Radon and thoron entry from outside air and sub-floor space and their exhalations from the building material (and the much lower extent of using water and gas) are their sources. Their sinks are, in addition to ventilation (aeration), deposition, and filtration, radioactive transformations (λr, r—radionuclide), and for unattached species, they also include attachment to the background aerosol particles (λa).
By applying the Jacobi room model under the steady-state conditions [54,56,57,61,103,118,119,120,121], the activity concentrations of individual radionuclide (A/Bq m−3) can be calculated.
Equations for RnP and TnP are shown separately because of the specific characteristics of their chains. Table 3 shows the values of the physical quantities determining generations and losses of radon and thoron short-lived products to be used in the equations below, as they have been either measured or adopted as relevant values in modelling.
- Radon gas:
- Unattached RnP
First-term in Equations (31)−(34) (e.g., ) represents contributions of attached RnP in outdoor air entering the room through ventilation. This is justified because aerosol particles of a diameter between 100 nm and 400 nm have a high outdoor → indoor particle penetration coefficient pout→in [111]. For the same reason, these contributions due to unattached RnP outdoors are not included in Equations (27)−(30). Perhaps this term would be more correctly expressed through pout→in rather than through λv (cf. Equation (23)). It is often considered negligible and omitted in model calculations [57,121].
Because of the big difference in their half-lives, radon and thoron behave differently indoors [60]. For instance, radon half-life is long enough to enable radon to be distributed uniformly in a closed room [60,133,134,135]. On the other hand, because of its short half-life, thoron activity concentration decreases exponentially with the distance from the exhalation surface. Provided only diffusion is considered, this decrease can be mathematically described as [9,134,136]
in which ATn(0) and ATn(x) stand for thoron activity concentration at the exhalation surface and a distance x far from it, λTn is the rate constant of thoron α-transformation, DTn is its diffusion constant in air, and is its diffusion length in air. At a distance of 10−40 cm from the surface, ATn(x) reaches its asymptotic level, as measured in the middle of the room [134]. This should be borne in mind when designing the measurement points and reporting thoron levels and their doses. Nor may radon be considered uniformly distributed at a ventilation rate > 0.5 h−1 [137].
While air movement in a closed room (e.g., using a fan) does not change radon activity concentration unless at ventilation rates > 0.5 h−1 [137], it increases thoron activity concentration by distributing thoron uniformly in the room, thus establishing its average level [138,139]. In a room at a ventilation rate constant λv of volume V and thoron exhalation surface S (e.g., floor or wall), can be expressed by its exhalation rate from indoor surfaces (/Bq m−2 s−1) as [61]:
From the dosimetry point of view, of all TnPs, only 212Pb and 212Bi are interesting (as evident in Equation (7)). Because of the very short half-life of Tn, the contribution from the outdoor thoron () to is generally negligible unless at very high ventilation rates and may be omitted. Considering their half-lives, 216Po can be distributed homogeneously in a room, while thoron cannot. 216Po is close to the secular equilibrium with thoron, and one may write [60]:
4. Radon and Thoron Sources
4.1. Ground
Radon and thoron sources are 238U and 232Th, respectively (Figure 1), in the ground on which a building stands, in the building material, and in used tap water and gas. Because of their half-lives and associated diffusion lengths, radon enters a building predominantly from the ground, while for thoron, its exhalation from the floor and walls in a room is generally its predominant source indoors. Therefore, the correlation between radon and thoron activity concentrations indoors is weak [38], if any exists [46]. Nonetheless, the opposite situation also appears.
As reported by Kemski et al. [140], based on 4019 results for Germany, the radon concentration in soil gas can range from kBq m–3 to MBq m–3 levels, being highest in the igneous and lowest in sedimentary geological units. Surprisingly, soil radon influences indoor levels only above its threshold of 20 kBq m–3 in soil gas [140,141], and below that, there is no correlation between the radon levels in soil gas and indoor air [142,143]. According to 3512 data from 11 geological units in Lombardy, Italy [144], the highest indoor radon levels of around 200 Bq m–3 geometric mean appeared over dolomite rocks, acid rocks (igneous, metamorphic, granite, gneiss), and debris (landslides, rock falls). In a Polish study in 129 buildings, the highest indoor radon levels (reaching up to 400 Bq m–3) were measured in the Sudetes, with crystalline igneous and metamorphic rock on the surface [145]. In 800 buildings surveyed in Switzerland, the highest geometric means were observed in the Southern Alps, characterised by crystalline rocks of various chemical compositions [146]. In Belgium, about 10,000 houses were surveyed, and the results showed the highest indoor radon levels on sandstone, quartz-phyllite, psammite, and greywacke; moderate levels on phyllite, mica-sandstone, limestone, chalk, and calc-shale; and lowest levels on sand, clay and marl [147]. Elevated indoor levels of radon and thoron are also expected in buildings on volcanic ground and made of volcanic material, as seen from the studies in Italy and Spain [148,149,150]. Also, in Hungary, the highest indoor radon activity concentrations in 6154 one-storey, no-basement houses were found on Cenozoic volcanic rocks, followed by Paleozoic granites, with the lowest in houses constructed on sedimentary fluvial and partly Aeolian formations [151].
Tectonic and geological faults cause anomalies in the spatial distribution of radon in the soil, mainly expressed as increased radon activity concentration in soil gas [152,153]. Therefore, fault zones present potential radon-prone areas. In a study of 149 houses located in fossil regions, fault zones, and normal areas in the Aizawl district, India [154], the effect of faults on the indoor radon and thoron activity concentrations was observed. While GM (geometric mean) values of radon activity concentrations were highest within fault zones (48.5 Bq m–3) and lowest in fossil regions (35 Bq m–3), those of thoron were highest in normal areas (13.9 Bq m–3) and lowest within fault zones (11.2 Bq m–3), although single highest values for radon were in the normal area and those of thoron were in fault zones. Nonetheless, the differences were not significant.
In their radon measurements in 15 houses in the proximity of the Amer fault in La Vall d’en Bas in Spain, Moreno et al. [149] observed a tendency of increased indoor radon levels as they approached the fault: it was 20−30 Bq m–3 at a distance of 2 km away and increased to 60−130 Bq m–3 at a distance of fewer than 300 m to the fault.
Dai et al. [155] evaluated the efficacy of housing and geological characteristics to predict radon risk in DeKalb County, Georgia, USA. In the fault zones, indoor radon levels were more likely to exceed the USA action level (148 Bq m–3); they were significantly positively correlated to gamma readings but significantly negatively related to the presence of a crawlspace foundation and its combination with a slab.
Elevated indoor radon levels may also be found over carbonates [156,157,158]. Generally, carbonates have a low content of uranium/radium, but the presence of the terra rossa soil (possibly enriched in uranium and with high radon emanation) and karstic phenomena (cracks and fissures) facilitate radon migration and thus enhance its entry into a house [158,159,160]. Peake [157] reported for Wisconsin, USA even higher values in 212 homes over carbonates (167 ± 174 Bq m–3) than in 119 homes over granite (155 ± 181 Bq m–3).
Based on 330 indoor air radon concentrations measured in kindergartens and schools in Slovenia [161], the highest average values were found in buildings on limestone and dolomite located in the karstic southwest part of the country, and also those covered by several tectonic faults [162]. This was ascribed to higher 226Ra content in carbonates (range: 12−270 Bq kg–1, GM = 66 Bq kg–1) in a study showing its distribution at 70 sites in Slovenia [163]. As further explained, 238U and 226Ra migration by water and the high permeability of carbonate led to a wash-out of more mobile uranium and increased the 226Ra/238U ratio, for which a range of 0.8−3.2 and an arithmetic mean of two were observed. The radon emanation fraction of carbonates was also high (range: 0.010−0.55, GM = 0.18), second only to that of sea and lake sediments (range: 0.26−0.42, GM = 0.34) (Figure 3). Although correlations between radon emanation and uranium [164] and 226Ra content in soil are weak [162], a good correlation was observed between radium content and radon activity concentration in both soil gas and indoor air (Figure 4a,b) [163], thus predicting high indoor radon levels in karst buildings.
4.2. Building Material
Exhalation of radon and thoron from building materials can be their significant source indoors. Exhalation rates differ markedly from material to material. They have been systematically measured by Pillai et al. [165] in various building materials, as shown by their results in Table 4.
The results of Singh et al. [166] in Table 5 show how different exhalation rates from different building materials are reflected in different radon and thoron levels indoors. They attribute high radon levels in mud houses to direct radon exhalation from the floor and poor ventilation. Nonetheless, because of standard deviations of 37−47 Bq m−3 for ARn, 15−19 Bq m−3 for ARnP, 43−57 Bq m−3 for ATn, and 1.25−1.44 Bq m−3 for ATnP, differences between different materials do not seem significant.
While a similarly weak dependence of indoor radon and thoron levels on the type of building material has also been observed in some other studies [46,154], on the other hand, there are reports on well-pronounced differences among building materials [50,167,168,169,170,171]. As an example, results obtained in 23 dwellings in Devon and Cornwall, United Kingdom, are pointed out [169]. The highest values of both ARnP and ATnP were obtained with granite (26 Bq m−3, 0.68 Bq m−3) and limestone (26 Bq m−3, 0.77 Bq m−3) as building materials.
Another example is the results obtained in 62 houses in Yamuna, Tons, and Kedar valleys in Garhwal, Himalaya, India [50]. Old-style mud houses are made of local mud and stone, with a roof covered by slates. When cement, stone, and brick are used for walls, for the floor, and for the roof, cement, concrete, and iron bars are used. For traditional wooden houses, mainly wood is used. Average activity concentrations of radon, thoron, and their products are higher on the ground floor than on the first floor, indicating that the ground is the prevailing source of radon and thoron. From the ground to the first floor (with cement, stone, and brick as building materials), ARn decreased to 32% and ATn to 58%, suggesting that building material is for thoron an important source.
The data on the building materials in the above tables are not satisfactory for critically evaluating the role of building materials in determining indoor RnP and TnP levels. For this purpose, more detailed information would be needed, including, for instance, on the nature and quality of the building material, size, and dimensions of floors and walls, aeration, occupancy, and living habits.
The trend of decreasing radon activity concentration from the basement (or ground floor) towards higher floors has been observed generally [28,146,160,170,172,173,174,175,176]. Nevertheless, there are places where this trend is not strictly followed, as obtained in 487 dwellings in Alto Lazio and 255 dwellings in Rome, Italy [150]. Although in Alto Lazio, the radon level decreases towards higher floors, this decrease is slow, i.e., on the first–second floor, its value is still 47% of the value in the basement for tuff and 59% for brick, thus indicating building material as an important radon source in addition to the ground. These percentages are similar in Rome, but here, the radon level on the ground floor is more than twice as high as that in the basement, thus further confirming building material as a strong radon source. In addition, in 14 buildings under study in Alto Lazio, Sciocchetti et al. [150] found 7 buildings in which concentrations of potential α-energy of RnP and TnP were higher on the upper floors than in the basement. Measurements in 601 dwellings in Kuwait revealed the highest radon level in the basement, followed by the first floor, while it was the lowest on the ground floor [177].
Also very interesting are the results of radon and thoron measurements by Tu et al. [178] in 40 homes and six public buildings in New York, New Jersey, Colorado, Illinois, and Pennsylvania, USA. Their results (as concentrations of α-potential energy EαRnP and EαTnP) are divided into three groups with respect to EαRnP levels as follows: group A, >400 nJ m−3, group B, 100−400 nJ m−3, and group C, <100 nJ m−3. In group B, the ratio between the ground floor and the basement values was 1.04 for EαRnP and 2.4 for EαTnP. The correlation coefficient of the EαRnP versus EαTnP relationship was 0.78 for the basement and 0.16 for the ground floor. This suggests a common source of radon and thoron in the basement and separate sources on the ground floor. In the same study [178], in basements (B) and on ground floors (GF) in 16 buildings in New Jersey and 7 buildings in New York, the correlation coefficient for EαTnP between the basement and ground floor was 0.99, and it was 0.79 for EαRnP. In seven buildings (30%), the GF/B ratio for thoron was above 1 (i.e., 1.29, 1.42, 2.25, 1.35, 1.6, 4.46, 1.21), and in two additional buildings, it was close to 1. These high values were accompanied by GF/B ratios for radon close to 1 (but always <1). In seven buildings with GF/B < 0.25 for thoron, GF/B for radon was also low at 0.04−0.38. This suggests that in these buildings, the major thoron source is not the ground.
Nevertheless, caution is suggested when reading or reporting differences in radon and thoron levels on the ground and first floors. In rooms on the first floor of detached houses, which are usually less frequently entered and aerated than those on the ground floor, radon levels may be easily higher than downstairs [177].
4.3. Age of Building
The age of a building also affects its indoor radon and thoron levels. With ageing, failures and cracks in the main concrete slab and walls connecting the ground may occur, and radon entry from the ground is facilitated [179]. More important are changes in construction with time, such as in the type of building, use of building materials, hydro and thermal insulation (also doors and windows), heating systems, and many other details. According to a survey of 450 dwellings in South Korea [168], higher thoron levels were observed in older, detached, one-family houses (both of traditional and modern building material), but no change was observed in blocks of flats. A radon survey in 400 dwellings in Slovenia has shown lower average activity concentrations in houses built after 1966 (due to the steadily decreasing use of stone as a building material) but with exceptions of very high values ascribed to lower aeration rates in tight buildings with effective thermal insulation [180]. On the other hand, a thorough analysis by Kemski et al. [140] has shown a steady decrease in indoor radon levels in newer houses, but this is dependent on the region because of local specifics in construction. Nevertheless, they have strongly emphasised that because the indoor radon level depends on a great number of influencing parameters, considerable caution is required when discussing geology, building materials, and building ages without knowing all of the necessary information, including details. Similarly, Finne et al. [181] observed a considerable reduction in radon activity concentrations in newly built houses in Norway after the implementation of the new building regulations in 2010. The concentrations vary between different dwelling categories (e.g., in detached houses, the average radon concentration dropped from 76 to 40 Bq m−3).
Here, it is also important to mention an enhanced energy retrofit of buildings by achieving better tightness. One of the very effective measures is the replacement of old windows, which can significantly increase indoor radon concentrations. Pampuri et al. [182] surveyed 154 buildings before and after energy remediation and revealed an increase in indoor radon concentration on average of 22% (increase in 100 buildings, decrease in 52 buildings, no change in 2 buildings). Collignan and Powaga [183] pointed out that any thermal retrofit process in the building must be associated with the relevant ventilation system to avoid a significant increase in indoor radon concentration. Towards greater energy conservation in buildings, a Spanish study [184] revealed significantly lower radon concentrations in dwellings built in the traditional style than in new houses.
5. Temporal Variations in Radon and Thoron Levels in Indoor Air
Radon emanation from mineral grains, its migration in the ground, and thus its entry into the building depend on meteorological conditions. In addition, both radon and thoron (and thus RnP and TnP) levels indoors and their hourly, diurnal, and seasonal variations are also greatly influenced by the construction characteristics and the inhabitants’ habits and indoor activities.
Two-day radon measurements in a weakly ventilated experimental house have shown that outdoor air pressure and humidity and water content in soil under the building had more of an effect on the indoor radon levels than the air temperature, rainfall, wind velocity, and soil temperature [185].
In another work [160], radon and meteorological parameters (indoor and outdoor air temperature and relative humidity, outdoor air pressure, rainfall height, and wind speed) were monitored year-long (frequency once an hour) in two living rooms in a high-radon dwelling in the Slovenian Karst, with one on the ground floor under normal household activities and the other on the first floor, which was closed and very rarely entered. The correlation coefficients (r) obtained between radon level and meteorological parameters based on the monthly averages of measured data showed the following general conclusions: (i) correlation coefficients (r) vary substantially (both in size and sign) between rooms and between months, (ii) on the ground floor, outdoor air temperature better correlates with the radon level than indoor temperature, and the opposite is valid for the first floor, (iii) a similar situation was seen for air humidity, (iv) on the ground floor, the correlation for outdoor air temperature was generally negative, while that for outdoor air humidity was positive, (v) ignoring months with |r| ≤ 0.1, correlations for pressure were negative except for several months, (vi) no general regularity was observed between r values and values of the influential parameter except for indoor and outdoor air humidity on the ground floor and indoor and outdoor air temperature on the first floor, with higher r values being associated with higher parameter values, and (vii) large variations in correlation are attributed to the combined action of a great number of environmental parameters (often interrelated) [186,187] and residents’ living habits. The interrelation between wind speed and air pressure [188] has not been evaluated.
Correlation coefficients were also calculated from the hourly values of parameters for the entire year [160]. The correlation between the radon concentration and the outdoor air temperature was moderately negative on both floors, thus identifying this parameter as the most influential [189]. The correlation coefficient was also moderate for indoor air temperature on the first floor and the temperature difference between indoors and outdoors on the ground floor. The outdoor relative air humidity had a poorer correlation with the radon level than the outdoor air temperature, which was negative on the ground floor and positive on the first floor. The indoor relative air humidity had a stronger effect on the ground than on the first floor. The correlation for pressure was minor and, on both floors, negative. The effect of wind appeared to be not negligible on the first floor, as observed in public buildings in Italy [190], and that of rain was very small in both rooms. Groves-Kirkby et al. [191] have critically evaluated the influence of meteorological parameters on radon behaviour indoors.
In the living room on the ground floor of the two-storey dwelling in the above study [160], typical diurnal variations of radon activity concentration were observed. Radon maxima coincided well with Tin − Tout maxima (air temperature difference between indoors and outdoors). A thermal air lift, caused by Tin − Tout increase, enhanced the room aeration by allowing the inflow of fresh air, but on the other hand, it also increased the entry of sub-slab radon-rich air into the room [192,193,194,195].
Seasonal variation in radon activity concentrations is generally reported by values in the spring, summer, autumn (or rainy season in tropics), and winter, and only seldom by monthly radon activity concentrations [186,190,196,197,198,199,200]. It can often be approximated by a sinusoidal function, with a maximum in winter and a minimum in summer [159,170,186,198,201,202].
The winter-to-summer (W/S) ratio of the radon activity concentrations may differ substantially from country to country [170,196,202,203,204,205], from region to region within a country [198,199,206,207], from building to building in the same region [187], and from floor to floor in the same building [160,190,208]. It can be higher at higher altitudes (mountain versus valley), as observed in rooms on the first floor but not on the ground floor [170].
In 4742 dwellings in 21 regions in Italy [206], W/S values between 0.1 and 7.1 were found, with <1 value appearing in each region. In North Macedonia [170], the W/S ratio in 437 dwellings in eight regions ranged from 0.05 to 3.27, with an average of 0.47. In the UK [198], it ranged from 0.4 to 5.3 in 728 determinations, being <1 in 4% cases, >1.25 in 68% cases, and 0.75−1.25 in 27% cases. Substantially lower [149] or higher W/S values [159,160] could be observed in buildings connected to underground cavities or caves in karst regions.
Reports on the temporal variation of thoron activity concentration are modest in comparison to that of radon. In addition, reports on seasonal variations of activity concentrations of radon and thoron short-lived products have appeared only recently [45,49,50,166,209].
The diurnal variation of thoron activity concentration often follows that of radon, as in living rooms in two high-radon dwellings in Niška Banja, Serbia [210] (Figure 5). A significant increase in radon activity concentration overnight was observed only in house 2 (factor of about 1.5) but not in house 5 (factor of about 1.2). This is not always the case, and the two variations may also differ, as reported by Németh et al. [135].
In their paper, Ramola et al. [50] report on activity concentrations of radon, thoron, and their short-lived products (in attached and unattached forms), equilibrium factor, and unattached fraction obtained in the summer, winter, spring, and rainy season in 122 houses in Yamuna, Tons, and Kedar valleys in Garhwal Himalaya, India. Their average values for the summer and winter (for comparison with the radon data above) are summarised in Table 6. For ARn, the W/S value was comparable to values obtained in Europe despite a difference in the climate. Only for FRn and were W/S values close to 1, and they ranged from 1.5 to 2 for other radon parameters. Except for and FRn, W/S values for other thoron parameters were markedly lower than those for the related radon parameters.
Activity concentrations of radon, thoron, and their short-lived products in wintertime, together with their W/S ratio, obtained in India, are also reported for 96 dwellings in Hamirpur district, Himachal Pradesh [211], 35 dwellings in Pauri Garhwal, Uttarakhand, Himalaya [45], 27 dwellings in Yamuna and Tons valleys, Garhwal, Himalaya [49], and 25 dwellings in Rajpur region, Uttarakhand, Himalaya [209]. The values are similar to those in Table 6 for the related parameters. In total, W/S values in the Himalaya area occur in the ranges of 1.49−2.24 for ARn, 1.22−2.44 for ARnP, 1.28−5.25 for ATn, and 1.26−1.88 for ATnP.
Another study reported year-round indoor radon, thoron, and their short-lived product concentrations (together with particulate matter (PM2.5)) in Beijing and Changchun, China and Aomori, Japan, three metropolises with different air quality levels. The annual mean equilibrium equivalent radon (EERC) and thoron (EETC) concentrations were 17.2 and 1.1 Bq m−3 in Beijing, 19.4 and 1.3 Bq m−3 in Changchun, and 10.8 and 0.9 Bq m−3 in Aomori, respectively, being the highest in winter [212].
To successfully implement sustainable policies for indoor air quality, it is crucial to consider the temporal variations in radon levels caused by meteorological parameters.
6. Impact of Human Activities on Radon Behaviour Indoors
Because of its adverse effects on health, we intend to keep the activity concentration of radon and thoron and their short-lived products indoors below reasonably low levels. For this purpose, the first concern is how to minimise radon and thoron sources in a building. Entry of the radioactive gas from the ground can be efficiently reduced or even stopped by constructing high-quality floor slabs and walls contacting the ground, which is particularly necessary for radon-prone areas (geology, lithology). In addition, building materials should be carefully selected, bearing in mind uranium and thorium content. Only seldom can using water and natural gas in a household increase radon levels significantly [6,7].
When a building is already constructed, the indoor levels of radon, thoron, and their short-lived products are strongly influenced by human behaviour in addition to meteorological parameters. Human habits and activities play an important role in sustainable indoor air quality management.
6.1. Ventilation
Ventilation, either mechanically or through opening windows, is simple and has proven to be a dominant human-influenced factor in controlling indoor radon levels [118,123,131,213,214,215,216,217], and it is even more effective than using a building material low in uranium and thorium [214]. However, cost-effectiveness should be borne in mind, as more fresh air requires enhanced heating in the wintertime [218]. An example of reducing activity concentrations by increasing the ventilation rate from 0.2 h−1 to 0.5 h−1 in a dwelling made of clay and brick is presented for radon, thoron, and their products in Table 7 [215]. In this small λv range, the slope of the relationship is linear, but it turns into an exponential trend afterwards [119,124,214]. In the last row (i.e., 0.2/0.5) in Table 7a,b, the ratio of the values at 0.2 h−1 and 0.5 h−1 flow rates is shown. The ratio is similar for Rn and 218Po and Tn and 216Po, being higher for the former two. It is higher for 212Pb, 212Bi, and 212Po than for 214Pb, 214Bi, and 214Po.
Recently, some authors have included simulations of radon and carbon dioxide concentrations in their studies of ventilation efficiency and compared them to measurements. Concerning radon, García-Tobar [219] proposed a methodology for estimating radon levels in a naturally and mechanically ventilated dwelling in a radon-prone area using the CONTAM program. Further, García-Tobar [220] analysed the influence of weather on indoor radon concentration in a new multi-storey building in a radon-prone area. Dovjak et al. [221] checked legislative requirements and recommendations for ventilation efficiency. For a renovated school, with the average measured radon concentration of 200−1000 Bq m–3, radon concentration was simulated by varying the design ventilation rates (DVRs). The DVRs were insufficient in 24% of cases, according to the EU, and in 56% of cases, according to the WHO guidelines. In the following study, Dovjak et al. [222] checked the ventilation efficiency of radon and carbon dioxide concentrations with measurements and simulations in a small apartment. The results indicate the need for further research on outdoor/indoor interactions, emphasizing ventilation in the built environment.
6.2. Air Conditioning
Radon levels are also affected by air conditioning [30,177,223,224]. As an example, Table 8 presents results obtained when running the air-conditioning system under different conditions in the auditorium of the Lublin University of Technology, Lublin, Poland [223]. Comparing rows 1 and 2 reveals that switching off the system increased ARn, ARnP, and N. Averages of ARn and ARnP were lower in the daytime than overnight, but no difference in N (rows 3 and 4) was discerned. Increasing the flow rate from 5400 m3 h−1 to 7200 m3 h−1 (rows 5 and 6) reduced ARnP but did not change either ARn or N; only a further flow rate increase to 9000 m3 h−1 (rows 6 and 7) reduced both ARn and N, leaving ARnP unchanged. From additional measurements in the same auditorium, the influence of air conditioning on the partitioning between unattached and attached radon products was obtained [224]. During the ‘on’ periods, radon concentration was decreased (due to the addition of fresh outside air), as was the attached fraction of radon products, while the contribution of the unattached radon products was increased. While no change in particle number concentration was observed (except its range), the mass concentration of PM1 particles (smaller than 1 μm) decreased from 45.7 μg cm−3 to 21.7 μg cm−3. Presumably, bigger and heavier particles were deposited and replaced by smaller and lighter ones. Interestingly, a good correlation (r = 0.61) was observed for the versus N relationship during the ‘off’ periods, but no correlation was observed during the ‘on’ periods.
An increase in radon levels overnight, when the air conditioning was switched off, was also observed in two offices, one on the 6th floor of an 8-storey building and the other on the 10th floor of a 44-storey building [30]. Their results in November were, for the 6th floor, from 9 am to 5 pm, ARn = 34 Bq m–3, ARnP = 12 Bq m–3; for the whole day, ARn = 58 Bq m–3, ARnP = 28 Bq m–3; for the 10th floor, from 9 am to 5 pm, ARn = 13 Bq m–3, ARnP = 5 Bq m–3; for the whole day, ARn = 19 Bq m–3, ARnP = 8 Bq m–3. The reason for this increase at such high floors could not result from soil gas or outdoor air; therefore, the authors ascribed it to building materials and an airtight structure. It has also been shown that a central air-conditioning system (in which conditioned air circulates through a number of rooms) for a building ensures lower radon levels than separate windows or room devices (in which conditioned air circulates in a closed loop of the room) [177].
6.3. Air Filtration
Air filtration reduces indoor levels of radon short-lived products efficiently, but not of radon [110,139,225,226,227,228,229]. This efficiency was checked in the 24.3 m3 radon chamber at the National Institute of Radiological Sciences (NIRS), Chiba, Japan [225], where an AMU-04 (Airtech, Tokyo, Japan) air cleaner was used with a HEPA (high-efficiency particulate air) filter. They compared ARn, ARnP, and for periods when the cleaner was in operation (on: ARn = 11,000 Bq m–3, ARnP = 180 Bq m–3, and 0.65) and when it was not in use (off: ARn = 11,000 Bq m–3, ARnP = 860 Bq m–3, and 0.12). During filtration, the concentration of aerosol markedly decreased but without any shift in particle size distribution. With the unchanged radon level, the activity concentration of its products was substantially reduced, and the fraction of unattached products substantially increased, thus leading to an increase in the radon dose conversion factor (cf. Equations (14)−(16)). Air filtration using a HEPA filter alone and in combination with a carbon filter in the kitchen and shower room in a flat on the fifth floor in Kobe, Japan showed [228] a similar efficiency for radon products removal but also a slight, though statistically significant, decrease in radon concentration.
A study carried out in the HMGU thoron experimental house at the Helmholtz Zentrum München, Germany [139] demonstrated how the concentrations of potential α-energy of the attached radon and thoron short-lived products (, ) decreased concomitantly with a decrease in aerosol concentration during air filtration using a HEPA filter at various radon and thoron levels, aerosol concentrations, and ventilation rates. On the other hand, both and increased steadily, and in 84 h, when aerosol concentration decreased from 2000 cm−3 to 600 cm−3, the former reached 120% and the latter 400% of its initial value. The authors supported this behaviour with theoretical calculations.
The following filtration experiments were carried out during weekends in a playroom of a kindergarten in Ljubljana, Slovenia [110]. For this purpose, a 125 W mobile air cleaner was run at airflow rates (m3 h−1) at 300 in step 1, 700 in step 2, and 1200 in step 3. Activity concentrations of radon and its short-lived products in the unattached and attached form were measured (once every two hours) using an EQF3020-2 device (Sarad, Dresden, Germany). The number concentration and size distribution of aerosol particles in the 5–530 nm size range were measured with an SMPS + C instrument, Series 5.400 with the medium DMA unit (Grimm, Hamburg, Germany). The instrument gives (every four minutes) the total number concentration of particles (N), particle number concentrations in each of the 44 size windows (Nd), particle number size distribution (dN/dlnd, with d being the electrical mobility-equivalent particle diameter), and the geometric mean of particle diameter (dGM).
When the cleaner was turned on, the total number concentration (N) of particles, with size distribution maximised at 100 nm [110], started to decrease and reached its minimum in about an hour due to the removal of the >30 nm particles. After that, the concentration of >30 nm particles (N30−200) continued to decrease slowly towards the end of filtration, while the concentration of smaller particles (N<10) started to increase, reaching its maximum in the middle of step 2 and remaining constant afterwards. They were ascribed to the operation of the electric motor in the cleaner [230]. These changes in aerosol characteristics influenced the behaviour of radon products as follows: ARnP and FRn decreased and increased rapidly in the beginning and more slowly afterwards. According to Equation (16), = 0.09 prior to filtration would give fDC for nasal breathing of 7.7 mSv WLM–1, and = 0.48 at the end of filtration, 14.3 mSv WLM–1, i.e., about twice as much. On the other hand, during this time, ARnP decreased from 1200 Bq m–3 to 200 Bq m–3 by a factor of six. Thus, at the end of air filtration under the above conditions, the effective dose rate was reduced by a factor of about three, which is more than reported earlier [228].
6.4. Emission of Nanoparticles
Concentration and size distribution of nanoparticles in indoor air determine the degree of secular equilibrium between radon and its products and thoron and its products (FRn, FTn) and also the fraction of unattached radon and thoron products (, ), two key parameters in radon and thoron dosimetry. Therefore, knowledge of the sources of particles and their behaviour indoors is a prerequisite to reliably assess exposure to radon and thoron and to understand its dependence on the habits and activities of inhabitants in addition to the environmental parameters.
In periods without any human activity, aerosol concentration indoors is usually between 0.7 mm−3 and 19 mm−3 [113,230,231], and, in most cases, it is lower than outdoors [66,112,113]. Any human activity generates aerosol particles, even simple walking [232]. A large variety of human activities indoors comprises simple entering and leaving rooms, preparation of meals (following various recipes and using different household appliances), personal affairs (smoking, showering, drying hair, using the sauna), cleaning (with different tools), laundry, ventilation (naturally by opening windows or mechanically with fans and air conditioners), heating (using electricity or different fuels, either centrally for the building or locally in rooms), and others, depending on the habits of occupants. According to a review of over 20 indoor activities by He et al. [115] and Morawska et al. [233], the highest number concentration of aerosol and the highest particle emission rate were measured when using the stove, grill, and fan heater, and the lowest were during hair drying and dusting. Some of these results are shown in Table 9 [115].
Often, the highest particle concentration was exhibited by burning candles (not included in the above review); for instance, 241 mm−3 [234], 400−500 mm−3 [230], and 1200 mm−3 [235]. In contrast, candle burning was found by Hussein et al. [111] to be the weakest particle source in comparison to smoking, frying, and using a stove and aroma lamp.
In order to provide a rough insight into the sizes of particles emitted during different indoor activities, Table 10 shows part of the results obtained in a townhouse in Reston, VA, USA [236]. As is evident, except for the citronella candle, 2/3 of particles emitted indoors fall into the 10–100 nm size range (% in second column).
Vargas Trassierra et al. [63] have shown how differences in aerosol characteristics formed during smoking traditional and electronic cigarettes exhibited differences in concentration of the potential α-energy of both unattached and attached radon short-lived products ( and ), as well as their equilibrium factor (FRn). Experiments were carried out in the radon chamber at the National Institute of Ionizing Radiation Metrology (INMRI-ENEA), Rome, Italy. Only part of their results is presented in Table 11. As smoking started, the concentration of aerosol particles started to increase and, as a consequence [56,101,176], the contribution of the attached radon products and equilibrium factors started to be enhanced and that of unattached products was reduced. These processes did not stop when smoking was finished in 12 min but continued because the creation and formation of radon product species need time [126] to reach a maximum in and FRn and a minimum in , with a delay of several hours. Although the increase in aerosol concentration with a traditional cigarette was substantially higher than with electronic ones, the increase in and FRn was higher with the electronic cigarette (last row in Table 11).
Another experiment [237] shows the effect of the aerosol particles from smoking an electronic cigarette on the particle size distribution in indoor air and air in a radon chamber. Activity size distributions are clearly bimodal, with modes corresponding to the unattached RnP and RnP attached to the smoke particles of the electronic cigarette. The activity of the unattached RnP occurs at about 1 nm in diameter size and is nearly monodisperse. Activity size distribution of the attached RnP, occurring in a size range between 0.1 and 0.4 μm diameter, is heterodisperse and corresponds to the distribution of the electronic cigarette smoke particles.
6.5. Cigarette Smoking and Candle Burning—Detailed Description
The role of the aerosol particles generated during cigarette smoking and candle burning on the behaviour of radon short-lived products in indoor air has been presented in more detail by results obtained in a basement kitchen of a family house in a suburban area in Ljubljana city, Slovenia [231,235]. For this purpose, activity concentrations of radon and its short-lived products in the unattached and attached form were measured using an EQF3020-2 (and seldom EQF3220) device (Sarad, Dresden, Germany), and the number concentration and size distribution of aerosol particles in the 5–530 nm size range were monitored with an SMPS + C instrument, Series 5.400, with the medium DMA unit (Grimm, Hamburg, Germany), as described in Section 6.3 Air Filtration.
6.5.1. Cigarette Smoking
Several experiments were carried out, and the results of one are presented in Figure 6. The initial aerosol concentration N prior to smoking was 3.6 mm−3 (Figure 6a), showing a bimodal particle size distribution, with diameters from 5 to 9 nm and from 10 to 200 nm (Figure 7), resulting in an overall geometric mean of particle diameter dGM = 44.5 nm (Figure 6a). As a person started to smoke a cigarette (at 10:24), N started to increase and reached its maximum of 435 mm−3 at the end of smoking (at 10:40). This value was lower than the 504 mm−3 recently reported by Vargas Trassierra et al. [63], similar to that reported by Reineking et al. [230], and much higher than values reported by other authors, which are between 240 mm−3 and 300 mm−3 [101,118,234] or even lower [111,115]. The highest contribution to the maximum N originated from particles with a diameter around 100 nm, followed by those with diameters around 70 nm and 150 nm, and substantially lower than others, as evidenced by Figure 8a, showing the number concentration of particles in the following size windows: 9.3 nm (8.5−9.3 nm), 29.6 nm (27.1−29.6 nm), 68.4 nm (62.2−68.4 nm), 101.4 nm (91.8−101.4 nm), 153.9 nm (138.3−153.9 nm), 215.2 nm (192−215.2 nm), and 308.7 nm (272.9−308.7 nm). The initial number fraction of particles smaller than 10 nm (x<10) was reduced from 0.14 to less than 0.001 (Figure 6b). After its maximum, N started to decrease, but even after 4 h, it did not fall to its initial value. Changes in particle size distribution are shown in Figure 7 at four times during the experiment: (i) prior to smoking (8:40), (ii) at dGM = minimum (10:26), (iii) at N = maximum (10:51), and (iv) two hours after smoking (12:39). The simultaneous decrease in N and increase in dGM have been attributed to coagulation of the emitted particles [234].
An increase in N was expected to cause an enhancement in FRn and a reduction of [56,101,176], and this is also seen in Figure 6d and Figure 6c, respectively; the former changed from 0.36 to 0.60, and the latter from 0.16 to 0.03. The decrease in resulted from a marked decrease in the contribution of the unattached 218Po species (Figure 6e) and an increase in the attached 218Po and 214Bi species (Figure 6f), bearing in mind that the coefficient at 218Po in Equation (4) is only 0.11 and that at 214Bi is 0.38. For N = 3.6 mm−3, Equation (17) would predict =0.11, which is close to the measured value of 0.16 prior to smoking, and for 434.9 mm−3, the prediction is 0.00092, which is far below our measured value of 0.04 during the smoking. Towards the next RnP measurement at 12:40, did not change significantly despite the N decrease to 60 mm−3. This may not be understood as a violation of the relationship expressed by Equation (17) but instead ascribed to the nature of the processes monitored. Changes in the number concentration and size distribution of aerosol particles during smoking were rapid, lasting only minutes. It is not expected that a change in size distribution will cause an immediate redistribution between unattached and attached RnP. It is more likely to influence only the newly born RnP atoms and clusters. The creation of RnP atoms through radioactive transformations takes time; also, their neutralisation, clustering, and attachment to and detachment from aerosol particles through recoil are processes with defined values of rate constants. Taking this into account, the calculation would show [126] that a time delay of even more than an hour [139] necessarily appears between a change in aerosol characteristics and a change in . Therefore, for short changes in aerosol, the above relationship appears to be masked or even totally obscured [107,231,235].
6.5.2. Candle Burning
For these experiments, ordinary tea candles were used, which burned down in three to four hours, and the maximum number concentration of particles emitted reached values from 1300 mm−3 to 1600 mm−3. Time variations of the monitored parameters for one of the experiments are presented in Figure 9.
Soon after lighting the candle, N increased from 5.8 mm−3 to 1600 mm−3, and dGM decreased from 85 nm to 11 nm (Figure 9a), a similar size as that obtained recently [238]. In contrast to smoking, mostly particles smaller than 10 nm were emitted, as seen in Figure 8b (presenting the number concentrations of particles in the same size windows as in the previous section). After its maximum, N dropped by about 500 mm−3 (Figure 9a), primarily due to a decrease in concentrations of both 9.3 nm and 29.6 nm particles (Figure 8b), presumably due to not constantly burning and not due to particle coagulation because the appearance of larger particles (e.g., 68.4 nm) was delayed and, in addition, their concentration did not follow the trend of steady concentration increases of smaller particles (Figure 8b). Two hours after burning, <20 nm particles had almost completely disappeared from the size distribution (Figure 10).
During candle burning, both ARn and ARnP were slightly enhanced (a shadowed region in Figure 9c), while, as expected [56,101,176], FRn was increasing and was decreasing. FRn changed from 0.31 to 0.41 (factor of increase of 1.33) and from 0.08 to 0.05 (Figure 9d). The decrease in originated mostly from the increase in concentrations of the attached 214Pb and 214Bi species (Figure 9e,f). The initial decrease was compensated by the increase and vice versa; later, the increase was compensated by the decrease. For the above values of 0.08 and 0.05, Equation (16) would give values of 7.54 and 7.04, respectively, i.e., a factor of decrease of 1.07 for fDC. Hence, FRn increase would raise the effective dose by a factor of 1.33, and for , a drop would reduce it by a factor of 1.07, leading to an overall increase of 1.24. Thus, during candle burning in a room, a person would be heavily exposed to nanoparticles and, in addition, would receive about 25% of a higher effective dose than without candle burning.
The candle burning was long enough to show the impact of aerosol characteristics on the behaviour of more clearly than in the much shorter smoking experiment. However, based on Figure 9b with a very high fraction of the <10 nm particles (associated with the unattached RnP), an increase in would be expected instead of a decrease. An explanation of this false anticipation is presented in Figure 11, showing the ratios of the number concentrations and of the surface area concentrations of the <10 nm particles versus >10 nm particles. Although the number concentration of smaller particles during candle burning was up to twice as much as that of larger ones, their surface area concentration was only from 4 to 14% of that of bigger particles. Hence, the interaction of RnP species with bigger aerosol particles was preferred, thus leading to a decrease. The role of the surface area of aerosol particles in governing the behaviour [231,235] was also reported recently by Vargas Trassierra et al. [108].
7. Conclusions
Exposure of the population to radon and thoron and their short-lived products has been one of the focal concerns of the national and international institutions responsible for human health for decades. Their concern is based on radon and thoron surveys carried out in a large number of countries worldwide. In many countries, systematic measurements were conducted at the national level or at least in selected areas. Although the priority was given to dwellings, workplaces (other than uranium mines) have not been ignored. Radon levels indoors were complemented by levels in soil gas, outdoor air, and water, with the ultimate aim of assessing the population’s radiation dose and keeping it sufficiently low. Findings from the laboratory experiments have enriched the results of field measurements. Epidemiological studies have played a significant role. A considerable effort has also been devoted to modelling the pathways of radon and thoron and their products from their sources, entry into buildings, dynamics in indoor air, deposition in lungs, and the effects on health. The database for indoor radon and its products is far more extensive than that for thoron and its products, although this gap has narrowed recently, and this trend should continue.
Efforts to harmonise the results of different radon groups worldwide should also be continued. The goal of preparing a radon atlas for continents other than Europe, or even a global one, should not be considered too optimistic.
It should also be borne in mind that the exposure of the population to radon and thoron and their products in a region or a country is not fixed and may change due to changes in living–working habits or construction characteristics (e.g., passive buildings with better thermal insulation). If this happens, radon should be re-checked.
In recent decades, the intensity of massive radon measurements in the indoor air of dwellings and public buildings has been enhanced, and rich knowledge of radon dynamics under real living and working conditions has been gained. Meanwhile, the extent of fundamental research on radon under well-defined experimental conditions in radon chambers has not increased proportionally or has even decreased. This trend should be reversed in the future because the results obtained in the laboratory may, firstly, serve as helpful guidance in designing measurement protocols in field radon campaigns and, secondly, should be a prerequisite for interpreting the data measured therein. Laboratory results on the role of aerosol characteristics in the dynamics of radon products would be beneficial, particularly their partitioning between attached and unattached forms. This would shed more light on the radon dosimetry approach and could eventually change or improve it. Sustainable indoor air quality management requires a balance between real-world measurements and laboratory-based studies.
Funding
This research was funded by the Slovenian Research and Innovation Agency (research core funding No. P1-0143, Cycling of substances in the environment, mass balances, modelling of environmental processes and risk assessment), the Ministry of Higher Education, Science and Innovation, and the European Union from the European Regional Development Fund (Development of research infrastructure for the international competitiveness of the Slovenian RRI space–RI-SI-EPOS).
Conflicts of Interest
The author declare no conflict of interest.
References
- Nero, A.V. Radon and Its Decay Products in Indoor Air; Nazaroff, W.W., Nero, A.V., Jr., Eds.; John Wiley & Sons, Inc.: New York, NY, USA, 1988; pp. 1–53. [Google Scholar]
- Etiope, G.; Martinelli, G. Migration of carrier and trace gases in the geosphere: An overview. Phys. Earth Planet. Inter. 2002, 129, 185–204. [Google Scholar] [CrossRef]
- Friedmann, H.; Gröller, J. An approach to improve the Austrian Radon Potential Map by Bayesian statistics. J. Environ. Radioact. 2010, 101, 804–808. [Google Scholar] [CrossRef]
- Kemski, J.; Siehl, A.; Stegemann, R.; Valdivia-Manchego, M. Mapping the geogenic radon potential in Germany. Sci. Total Environ. 2001, 272, 217–230. [Google Scholar] [CrossRef]
- Neznal, M.; Neznal, M.; Šmarda, J. Assessment of radon potential of soils—A five-year experience. Environ. Int. 1996, 22, 819–828. [Google Scholar] [CrossRef]
- Jobbágy, V.; Altzitzoglou, T.; Malo, P.; Tanner, V.; Hult, M. A brief overview on radon measurements in drinking water. J. Environ. Radioact. 2017, 173, 18–24. [Google Scholar] [CrossRef] [PubMed]
- Mitchell, A.L.; Griffin, W.M.; Casman, E.A. Lung cancer risk from radon in marcellus shale gas in northeast U.S. homes. Risk Anal. 2016, 36, 2105–2119. [Google Scholar] [CrossRef] [PubMed]
- Bochicchio, F.; Campos-Venuti, G.; Nuccetelli, C.; Risica, S.; Tancredi, F. Indoor measurements of 220Rn and 222Rn and their decay products in a Mediterranean climate area. Environ. Int. 1996, 22, 633–639. [Google Scholar] [CrossRef]
- McLaughlin, J. An overview of thoron and its progeny in the indoor environment. Radiat. Prot. Dosim. 2010, 141, 316–321. [Google Scholar] [CrossRef] [PubMed]
- Li, Y.; Schery, S.D.; Turk, B. Soil as a source of indoor 220Rn. Health Phys. 1992, 62, 453–457. [Google Scholar] [CrossRef]
- Porstendörfer, J. Properties and behaviour of radon and thoron and their decay products in the air. J. Aerosol Sci. 1994, 25, 219–263. [Google Scholar] [CrossRef]
- Chu, K.D.; Hopke, P.K. Neutralization kinetics for polonium-218. Environ. Sci. Technol. 1988, 22, 711–717. [Google Scholar] [CrossRef]
- Hopke, P.K. The initial atmospheric behavior of radon decay products. J. Radioanal. Nucl. Chem. 1996, 203, 353–375. [Google Scholar] [CrossRef]
- Porstendörfer, J.; Reineking, A. Indoor behaviour and characteristics of radon progeny. Radiat. Prot. Dosim. 1992, 45, 303–311. [Google Scholar] [CrossRef]
- Goldstein, S.D.; Hopke, P.K. Environmental neutralization of polonium-218. Environ. Sci. Technol. 1985, 19, 146–150. [Google Scholar] [CrossRef]
- Dankelmann, V.; Reineking, A.; Porstendörfer, J. Determination of neutralisation rates of 218Po ions in air. Radiat. Prot. Dosim. 2001, 94, 353–357. [Google Scholar] [CrossRef] [PubMed]
- Pagelkopf, P.; Porstendörfer, J. Neutralisation rate and the fraction of the positive 218Po-clusters in air. Atmos. Environ. 2003, 37, 1057–1064. [Google Scholar] [CrossRef]
- Papastefanou, C. Radioactive aerosols. In Radioactivity in the Environment; Baxter, M.S., Ed.; Elsevier: Amsterdam, The Netherlands, 2008; Volume 12, pp. 11–54. [Google Scholar]
- United Nations Scientific Committee on the Effect of Atomic Radiation (UNSCEAR). Sources and Effect of Ionizing Radiation; UNSCEAR 2000 Report to the General Assembly, with Scientific Annexes; United Nations: New York NY, USA, 2000; pp. 83–156. [Google Scholar]
- Darby, S.; Hill, D.; Auvinen, A.; Barros-Dios, J.M.; Baysson, H.; Bochicchio, F.; Deo, H.; Falk, R.; Forastiere, F.; Hakama, M.; et al. Radon in homes and risk of lung cancer: Collaborative analysis of individual data from 13 European case-control studies. BMJ 2005, 330, 223. [Google Scholar] [CrossRef] [PubMed]
- US Environmental Protection Agency (US EPA). Radon Measurements in Schools—Revised Edition; EPA 402-R-92-0014; US EPA: Washington, DC, USA, 1993.
- US Environmental Protection Agency (US EPA). Radon Measurements in Schools—An Interim Report; EPA 520/1-89-010; US EPA: Washington, DC, USA, 1989.
- Vaupotič, J. Radon in kindergartens and schools: A review. In Handbook of Radon: Properties, Applications, and Health; Zachary, L., Ed.; Nova Science: New York, NY, USA, 2011; pp. 477–524. [Google Scholar]
- International Commission on Radiological Protection (ICRP). Lung Cancer Risk from Indoor Exposures to Radon Daughters; ICRP publication 50; Pergamon Press: Oxford, UK, 1987. [Google Scholar]
- Hofmann, W.; Steinhausler, F.; Pohl, E. Dose calculations for the respiratory tract from inhaled natural radioactive nuclides as a function of age—I. Compartmental deposition, retention and resulting dose. Health Phys. 1979, 37, 517–532. [Google Scholar] [CrossRef] [PubMed]
- Hofmann, W. Dose calculations for the respiratory tract from inhaled natural radioactive nuclides as a function of age—II. Basal cell dose distributions and associated lung cancer risk. Health Phys. 1982, 43, 31–44. [Google Scholar]
- Hofmann, W.; Martonen, T.B.; Menache, M.G. Age-dependent lung dosimetry of radon progeny. In Extrapolation of Dosimetric Relationships for Inhaled Particles and Gases; Crapo, J.D., Miller, F.J., Eds.; Academic Press: Cambridge, MA, USA, 1989; pp. 317–344. [Google Scholar]
- Mjönes, L.; Falk, R.; Mellander, H.; Nyblom, L.; Nilsson, I. 220Rn and its progeny in buildings in Sweden. Environ. Int. 1996, 22 (Suppl. 1), S1125–S1133. [Google Scholar] [CrossRef]
- Steinhäusler, F.; Hofmann, W.; Lettner, H. Thoron exposure of man: A negligible issue? Radiat. Prot. Dosim. 1994, 56, 127–131. [Google Scholar] [CrossRef]
- Tokonami, S.; Furukawa, M.; Shicchi, Y.; Sanada, T.; Yamada, Y. Characteristics of radon and its progeny concentrations in air-conditioned office buildings in Tokyo. Radiat. Prot. Dosim. 2003, 106, 71–76. [Google Scholar] [CrossRef] [PubMed]
- Yamazaki, N. Studies of Thoron Progeny Concentrations in the Living Environment. Ph.D. Thesis, Nagoya University, Nagoya, Japan, 1995. [Google Scholar]
- Tokonami, S.; Sun, Q.; Akiba, S.; Zhuo, W.; Furukawa, M.; Ishikawa, T.; Hou, C.; Zhang, S.; Narazaki, Y.; Ohji, B.; et al. Radon and thoron exposures for cave residents in Shanxi and Shaanxi provinces. Radiat. Res. 2004, 162, 390–396. [Google Scholar] [CrossRef] [PubMed]
- Chen, J.; Bergman, L.; Falcomer, R.; Whyte, J. Results of simultaneous radon and thoron measurements in 33 metropolitan areas of Canada. Radiat. Prot. Dosim. 2014, 163, 210–216. [Google Scholar] [CrossRef] [PubMed]
- McLaughlin, J.; Murray, M.; Currivan, L.; Pollard, D.; Smith, V.; Tokonami, S.; Sorimachi, A.; Janik, M. Long-term measurements of thoron, its airborne progeny and radon in 205 dwellings in Ireland. Radiat. Prot. Dosim. 2011, 145, 189–193. [Google Scholar] [CrossRef] [PubMed]
- Gierl, S.; Meisenberg, O.; Feistenauer, P.; Tschiersch, J. Thoron and thoron progeny measurements in German clay houses. Radiat. Prot. Dosim. 2014, 160, 160–163. [Google Scholar] [CrossRef]
- Chałupnik, S.; Meisenberg, O.; Bi, L.; Wang, J.; Skubacz, K.; Tschiersch, J. Measurements of radon and thoron decay products in air. An application of LSC and TLD methods. Rom. J. Phys. 2013, 58, S62–S72. [Google Scholar] [CrossRef] [PubMed]
- Szabó, Z.; Jordan, G.; Szabó, C.; Horváth, Á.; Holm, Ó.; Kocsy, G.; Csige, I.; Szabó, P.; Homoki, Z. Radon and thoron levels, their spatial and seasonal variations in adobe dwellings—A case study at the great Hungarian plain. Isotopes Environ. Health Stud. 2014, 50, 211–225. [Google Scholar] [CrossRef]
- Vaupotič, J.; Kávási, N. Preliminary study of thoron and radon levels in various indoor environments in Slovenia. Radiat. Prot. Dosim. 2010, 141, 383–385. [Google Scholar] [CrossRef]
- Žunić, Z.S.; Čeliković, I.; Tokonami, S.; Ishikawa, T.; Ujić, P.; Onischenko, A.; Zhukovsky, M.; Milić, G.; Jakupi, B.; Čuknić, O.; et al. Collaborative investigations on thoron and radon in some rural communities of Balkans. Radiat. Prot. Dosim. 2010, 141, 346–350. [Google Scholar] [CrossRef]
- Gulan, L.; Milic, G.; Bossew, P.; Omori, Y.; Ishikawa, T.; Mishra, R.; Mayya, Y.S.; Stojanovska, Z.; Nikezic, D.; Vuckovic, B.; et al. Field experience on indoor radon, thoron and their progenies with solid-state detectors in a survey of Kosovo and Metohija (Balkan region). Radiat. Prot. Dosim. 2012, 152, 189–197. [Google Scholar] [CrossRef]
- Stojanovska, Z.; Bossew, P.; Tokonami, S.; Zunic, Z.S.; Bochicchio, F.; Boev, B.; Ristova, M.; Januseski, J. National survey of indoor thoron concentration in FYR of Macedonia (continental Europe-Balkan region). Radiat. Meas. 2013, 49, 57–66. [Google Scholar] [CrossRef]
- Reddy, K.V.K.; Reddy, B.S.; Reddy, M.S.; Reddy, C.G.; Reddy, P.Y.; Reddy, K.R. Baseline studies of radon/thoron concentration levels in and around the Lambapur and Peddagattu areas in Nalgonda district, Andhra Pradesh, India. Radiat. Meas. 2003, 36, 419–423. [Google Scholar] [CrossRef]
- Virk, H.S.; Sharma, N. Indoor radon/thoron survey report from Hamirpur and Una districts, Himachal Pradesh, India. Appl. Radiat. Isot. 2000, 52, 137–141. [Google Scholar] [CrossRef] [PubMed]
- Prasad, G.; Prasad, Y.; Gusain, G.S.; Ramola, R.C. Measurement of radon and thoron levels in soil, water and indoor atmosphere of Budhakedar in Garhwal Himalaya, India. Radiat. Meas. 2008, 43, S375–S379. [Google Scholar] [CrossRef]
- Joshi, V.; Dutt, S.; Yadav, M.; Mishra, R.; Ramola, R.C. Measurement of radon, thoron and their progeny concentrations in the dwellings of Pauri Garhwal, Uttarakhand, India. Radiat. Prot. Dosim. 2016, 171, 234–237. [Google Scholar] [CrossRef] [PubMed]
- Omori, Y.; Prasad, G.; Sorimachi, A.; Sahoo, S.K.; Ishikawa, T.; Vidya Sagar, D.; Ramola, R.C.; Tokonami, S. Long-term measurements of residential radon, thoron, and thoron progeny concentrations around the Chhatrapur placer deposit, a high background radiation area in Odisha, India. J. Environ. Radioact. 2016, 162–163, 371–378. [Google Scholar] [CrossRef] [PubMed]
- Singh, P.; Singh, P.; Singh, S.; Sahoo, B.K.; Sapra, B.K.; Bajwa, B.S. A study of indoor radon, thoron and their progeny measurement in Tosham region Haryana, India. J. Radiat. Res. Appl. Sci. 2015, 8, 226–233. [Google Scholar] [CrossRef]
- Omori, Y.; Tokonami, S.; Sahoo, S.K.; Ishikawa, T.; Sorimachi, A.; Hosoda, M.; Kudo, H.; Pornnumpa, C.; Nair, R.R.K.; Jayalekshmi, P.A.; et al. Radiation dose due to radon and thoron progeny inhalation in high-level natural radiation areas of Kerala, India. J. Radiol. Prot. 2017, 37, 111–126. [Google Scholar] [CrossRef] [PubMed]
- Prasad, M.; Rawat, M.; Dangwal, A.; Prasad, G.; Mishra, R.; Ramola, R.C. Study of radiation exposure due to radon, thoron and progeny in the indoor environment of Yamuna and Tons Valleys of Garhwal Himalaya. Radiat. Prot. Dosim. 2016, 171, 187–191. [Google Scholar] [CrossRef]
- Ramola, R.C.; Prasad, M.; Kandari, T.; Pant, P.; Bossew, P.; Mishra, R.; Tokonami, S. Dose estimation derived from the exposure to radon, thoron and their progeny in the indoor environment. Sci. Rep. 2016, 6, 31061. [Google Scholar] [CrossRef]
- Barooah, D.; Laskar, I.; Goswami, A.K.; Ramachandran, T.V.; Nambi, K.S.V. Estimation of indoor radon, thoron and their progeny using twin cup dosemeters with solid-state nuclear track detectors in Digboi of Upper Assam. Radiat. Meas. 2003, 36, 461–463. [Google Scholar] [CrossRef]
- Dwivedi, K.K.; Mishra, R.; Tripathy, S.P.; Kulshreshtha, A.; Sinha, D.; Srivastava, A.; Deka, P.; Bhattacharjee, B.; Ramachandran, T.V.; Nambi, K.S.V. Simultaneous determination of radon, thoron and their progeny in dwellings. Radiat. Meas. 2001, 33, 7–11. [Google Scholar] [CrossRef]
- Schery, S.D. Understanding Radioactive Aerosols and Their Measurement; Springer Science & Business Media: Dordrecht, The Netherlands, 2001. [Google Scholar]
- Reineking, A.; Porstendörfer, J. Unattached fraction of short-lived Rn decay products in indoor and outdoor environments: An improved single-screen method and results. Health Phys. 1990, 58, 715–727. [Google Scholar] [CrossRef] [PubMed]
- Mercer, T.T. The effect of particle size on the escape of recoiling RaB atoms from particulate surfaces. Health Phys. 1976, 31, 173–175. [Google Scholar] [PubMed]
- Porstendörfer, J. Behaviour of radon daughter products in indoor air. Radiat. Prot. Dosim. 1984, 7, 107–113. [Google Scholar] [CrossRef]
- Rout, R.P.; Mishra, R.; Prajith, R.; Jalaluddin, S.; Sapra, B.K. Measurement of 222Rn and 220Rn decay product deposition velocities using SSNTD based passive detectors. J. Radioanal. Nucl. Chem. 2014, 302, 1495–1499. [Google Scholar] [CrossRef]
- Stevanovic, N.; Markovic, V.M.; Nikezic, D. Deposition rates of unattached and attached radon progeny in room with turbulent airflow and ventilation. J. Environ. Radioact. 2009, 100, 585–589. [Google Scholar] [CrossRef] [PubMed]
- Mishra, R.; Prajith, R.; Sapra, B.K.; Mayya, Y.S. An integrated approach for the assessment of the thoron progeny exposures using direct thoron progeny sensors. Radiat. Prot. Dosim. 2010, 141, 363–366. [Google Scholar] [CrossRef] [PubMed]
- Meisenberg, O.; Tschiersch, J. Specific properties of a model of thoron and its decay products in indoor atmospheres. Nukleonika 2010, 55, 463–469. [Google Scholar]
- Meisenberg, O.; Tschiersch, J. Thoron in indoor air: Modeling for a better exposure estimate. Indoor Air 2011, 21, 240–252. [Google Scholar] [CrossRef] [PubMed]
- Ramachandran, T.V.; Eappen, K.P.; Nair, R.N.; Mayya, Y.S.; Sadasivan, S. Radon-Thoron Levels and Inhalation Dose Distribution Patterns in India Dwellings; Bhabha Atomic Research Centre: Bombay, India, 2003. [Google Scholar]
- Vargas Trassierra, C.; Cardellini, F.; Buonanno, G.; De Felice, P. On the interaction between radon progeny and particles generated by electronic and traditional cigarettes. Atmos. Environ. 2015, 106, 442–450. [Google Scholar] [CrossRef]
- Amgarou, K.; Font, L.; Baixeras, C. A novel approach for long-term determination of indoor 222Rn progeny equilibrium factor using nuclear track detectors. Nucl. Instrum. Methods Phys. Res. Sect. A 2003, 506, 186–198. [Google Scholar] [CrossRef]
- Yu, K.N.; Nikezic, D.; Ng, F.M.F.; Leung, J.K.C. Long-term measurements of radon progeny concentrations with solid-state nuclear track detectors. Radiat. Meas. 2005, 40, 560–568. [Google Scholar] [CrossRef]
- Hussein, T.; Hameri, K.; Heikkinen, M.; Kulmala, M. Indoor and outdoor particle size characterization at a family house in Espoo–Finland. Atmos. Environ. 2005, 39, 3697–3709. [Google Scholar] [CrossRef]
- Hussein, T.; Hruška, A.; Dohányosová, P.; Džumbová, L.; Hemerka, J.; Kulmala, M.; Smolík, J. Deposition rates on smooth surfaces and coagulation of aerosol particles inside a test chamber. Atmos. Environ. 2009, 43, 905–914. [Google Scholar] [CrossRef]
- Hofmann, W.; Sturm, R.; Winkler-Heil, R.; Pawlak, E. Stochastic model of ultrafine particle deposition and clearance in the human respiratory tract. Radiat. Prot. Dosim. 2003, 105, 77–79. [Google Scholar] [CrossRef]
- Hofmann, W.; Winkler-HeiI, R.; Truta, L.A.; Tschiersch, J. Application of a monte carlo lung dosimetry code to the inhalation of thoron progeny. Radiat. Prot. Dosim. 2014, 160, 96–99. [Google Scholar] [CrossRef] [PubMed]
- Nikezić, D.; Yu, K.N.; Cheung, T.T.K.; Haque, A.K.M.M.; Vučić, D. Effects of different lung morphometry models on the calculated dose conversion factor from Rn progeny. J. Environ. Radioact. 2000, 47, 263–277. [Google Scholar] [CrossRef]
- Nikezić, D.; Haque, A.K.M.M.; Yu, K.N. Effects of different deposition models on the calculated dose conversion factors from 222Rn progeny. J. Environ. Radioact. 2002, 61, 305–318. [Google Scholar] [CrossRef]
- Birchall, A.; James, A.C. Uncertainty analysis of the effective dose per unit exposure from radon progeny and implications for ICRP risk-weighting factors. Radiat. Prot. Dosim. 1994, 53, 133–140. [Google Scholar] [CrossRef]
- Marsh, J.W.; Birchall, A.; Butterweck, G.; Dorrian, M.D.; Huet, C.; Ortega, X.; Reineking, A.; Tymen, G.; Schuler, C.; Vargas, A.; et al. Uncertainty analysis of the weighted equivalent lung dose per unit exposure to radon progeny in the home. Radiat. Prot. Dosim. 2002, 102, 229–248. [Google Scholar] [CrossRef]
- Porstendörfer, J. Radon: Measurements related to dose. Environ. Int. 1996, 22, 563–583. [Google Scholar] [CrossRef]
- Butterweck, G.; Porstendörfer, J.; Reineking, A.; Kesten, J. Unattached fraction and the aerosol size distribution of the radon progeny in a natural cave and mine atmospheres. Radiat. Prot. Dosim. 1992, 45, 167–170. [Google Scholar] [CrossRef]
- Cheng, Y.S.; Chen, T.R.; Wasiolek, P.T.; Van Engen, A. Radon and radon progeny in the carlsbad caverns. Aerosol Sci. Technol. 1997, 26, 74–92. [Google Scholar] [CrossRef]
- Khalaf, H.N.B.; Mostafa, M.Y.A.; Zhukovsky, M. A combined system for radioactive aerosol size distribution measurements of radon decay products. Radiat. Phys. Chem. 2019, 165, 108402. [Google Scholar] [CrossRef]
- Mostafa, M.Y.A.; Khalaf, H.N.B.; Zhukovsky, M. Radon decay products equilibrium at different aerosol concentrations. Appl. Radiat. Isotopes 2020, 156, 108981. [Google Scholar] [CrossRef] [PubMed]
- Huet, C.; Tymen, G.; Boulaud, D. Long-term measurements of equilibrium factor and unattached fraction of short-lived radon decay products in a dwelling-comparison with Praddo model. Aerosol Sci. Technol. 2001, 35, 553–563. [Google Scholar] [CrossRef]
- Iskra, I.; Kávási, N.; Vaupotič, J. Nano aerosols in the Postojna Cave. Acta Carsol. 2010, 39, 523–528. [Google Scholar] [CrossRef]
- Sainz, C.; Quindós, L.S.; Fuente, I.; Nicolás, J.; Quindós, L. Analysis of the main factors affecting the evaluation of the radon dose in workplaces: The case of tourist caves. J. Hazard. Mater. 2007, 145, 368–371. [Google Scholar] [CrossRef] [PubMed]
- Thinová, L.; Burian, I. Effective dose assessment for workers in caves in the Czech Republic: Experiments with passive radon detectors. Radiat. Prot. Dosim. 2008, 130, 48–51. [Google Scholar] [CrossRef]
- Vaupotič, J. Nanosize radon short-lived decay products in the air of the Postojna Cave. Sci. Total Environ. 2008, 393, 27–38. [Google Scholar] [CrossRef]
- Colbeck, I. Introduction to aerosol science. In Physical and Chemical Properties of Aerosols; Colbeck, I., Ed.; Thomson Science: London, UK, 1998; pp. 5–120. [Google Scholar]
- Buseck, P.R.; Adachi, K. Nanoparticles in the atmosphere. Elements 2008, 4, 389–394. [Google Scholar] [CrossRef]
- Kumar, P.; Fennell, P.; Robins, A. Comparison of the behaviour of manufactured and other airborne nanoparticles and the consequences for prioritising research and regulation activities. J. Nanoparticle Res. 2010, 12, 1523–1530. [Google Scholar] [CrossRef]
- Turner, J.; Colbeck, I. Environmental chemistry of aerosols. In Environmental Chemistry of Aerosols; Colbeck, I., Ed.; Thomson Science: London, UK, 2008; pp. 1–29. [Google Scholar]
- Wen, C.S. The Fundamentals of Aerosol Dynamics; World Scientific Publishing Co. Pte. Ltd.: Singapore, 1996. [Google Scholar]
- Kumar, P.; Robins, A.; Vardoulakis, S.; Britter, R. A review of the characteristics of nanoparticles in the urban atmosphere and the prospects for developing regulatory controls. Atmos. Environ. 2010, 44, 5035–5052. [Google Scholar] [CrossRef]
- Nowack, B.; Bucheli, T.D. Occurrence, behavior and effects of nanoparticles in the environment. Environ. Pollut. 2007, 150, 5–22. [Google Scholar] [CrossRef] [PubMed]
- Morawska, L.; Ristovski, Z.; Jayaratne, E.R.; Keogh, D.U.; Ling, X. Ambient nano and ultrafine particles from motor vehicle emissions: Characteristics, ambient processing and implications on human exposure. Atmos. Environ. 2008, 42, 8113–8138. [Google Scholar] [CrossRef]
- Anastasio, C.; Martin, S.T. Atmospheric nanoparticles. In Nanoparticles and the Environment; Bafield, J., Navrotsky, A., Eds.; Mineralogical Society of America: Chantilly, VA, USA, 2001; pp. 293–349. [Google Scholar]
- Shi, J.P.; Evans, D.E.; Khan, A.A.; Harrison, R.M. Sources and concentrations of nanoparticles (less than 10 nm diameter) in the urban atmosphere. Atmos. Environ. 2001, 35, 1193–1202. [Google Scholar] [CrossRef]
- Porstendörfer, J.; Zock, C.; Reineking, A. Aerosol size distribution of the radon progeny in outdoor air. J. Environ. Radioact. 2000, 51, 37–48. [Google Scholar] [CrossRef]
- Tu, K.W.; Knutson, E.O.; George, A.C. Thoron versus radon: Comparison of measured progeny aerosol size distributions. Aerosol Sci. Technol. 1994, 20, 266–274. [Google Scholar] [CrossRef]
- Tu, K.W.; Knutson, E.O.; George, A.C. Indoor radon progeny aerosol size measurements in urban, suburban, and rural regions. Aerosol Sci. Technol. 1991, 15, 170–178. [Google Scholar] [CrossRef]
- Morawska, L.; Jamriska, M. Deposition of radon progeny on indoor surfaces. J. Aerosol Sci. 1996, 27, 305–312. [Google Scholar] [CrossRef]
- Hopke, P.K.; Wasiolek, P.; Montassier, N.; Cavallo, A.; Gadsby, K.; Socolow, R. Measurements of activity-weighted size distributions of radon decay products in a normally occupied home. Radiat. Prot. Dosim. 1992, 45, 329–331. [Google Scholar] [CrossRef]
- Porstendörfer, J. Physical parameters and dose factors of the radon and thoron decay products. Radiat. Prot. Dosim. 2001, 94, 365–373. [Google Scholar] [CrossRef] [PubMed]
- Cheng, Y.S.; Chen, T.R.; Yeh, H.C.; Bigu, J.; Holub, R.; Tu, K.; Knutsond, E.O.; Falk, R. Intercomparison of activity size distribution of thoron progeny and a mixture of radon and thoron progeny. J. Environ. Radioact. 2000, 51, 59–78. [Google Scholar] [CrossRef]
- Huet, C.; Tymen, G.; Boulaud, D. Size distribution, equilibrium ratio and unattached fraction of radon decay products under typical indoor domestic conditions. Sci. Total Environ. 2001, 272, 97–103. [Google Scholar] [CrossRef] [PubMed]
- Fukutsu, K.; Yamada, Y.; Tokonami, S.; Iida, T. Newly designed graded screen array for particle size measurements of unattached radon decay products. Rev. Sci. Instrum. 2004, 75, 783–787. [Google Scholar] [CrossRef]
- Mohery, M.; El-Hussein, A.; Alddin, S.H.; Al Howaity, S. Unattached fractions and aerosol attached of radon progeny in indoor air. Int. J. Phys. Sci. 2012, 7, 5089–5096. [Google Scholar]
- Yuness, M.; Mohamed, A.; Nazmy, H.; Moustafa, M.; Abd El-hady, M. Indoor activity size distribution of the short-lived radon progeny. Stoch. Environ. Res. Risk Assess. 2016, 30, 167–174. [Google Scholar] [CrossRef]
- Zhang, H.; Chen, B.; Zhuo, W.; Zhao, C. Measurements of the size distribution of unattached radon progeny by using the imaging plate. Radiat. Meas. 2014, 62, 41–44. [Google Scholar] [CrossRef]
- Marsh, J.W.; Birchall, A. Sensitivity analysis of the weighted equivalent lung dose per unit exposure from radon progeny. Radiat. Prot. Dosim. 2000, 87, 167–178. [Google Scholar] [CrossRef]
- Trevisi, R.; Cardellini, F.; Leonardi, F.; Vargas Trassierra, C.; Franci, D. A comparison of radon and its decay products’ behaviour in indoor air. Radiat. Prot. Dosim. 2014, 162, 171–175. [Google Scholar] [CrossRef] [PubMed]
- Vargas Trassierra, C.; Stabile, L.; Cardellini, F.; Morawska, L.; Buonanno, G. Effect of indoor-generated airborne particles on radon progeny. J. Hazard. Mater. 2016, 314, 155–163. [Google Scholar] [CrossRef] [PubMed]
- Nikezić, D.; Stevanović, N. Room model with three modal distributions of attached 220Rn progeny and dose conversion factor. Radiat. Prot. Dosim. 2007, 123, 95–102. [Google Scholar] [CrossRef] [PubMed]
- Vaupotič, J.; Bezek, M.; Kobal, I. The effect of air filtration on the fraction of unattached radon products. Rad. Appl. 2017, 2, 115–117. [Google Scholar]
- Hussein, T.; Glytsos, T.; Ondráček, J.; Dohányosová, P.; Ždímal, V.; Hämeri, K.; Lazaridis, M.; Smolík, J.; Kulmala, M. Particle size characterization and emission rates during indoor activities in a house. Atmos. Environ. 2006, 40, 4285–4307. [Google Scholar] [CrossRef]
- Matson, U. Indoor and outdoor concentrations of ultrafine particles in some Scandinavian rural and urban areas. Sci. Total Environ. 2005, 343, 169–176. [Google Scholar] [CrossRef] [PubMed]
- Morawska, L.; He, C.; Hitchins, J.; Gilbert, D.; Parappukkaran, S. The relationship between indoor and outdoor airborne particles in the residential environment. Atmos. Environ. 2001, 35, 3463–3473. [Google Scholar] [CrossRef]
- Chen, H.; Namdeo, A.; Bell, M. Classification of road traffic and roadside pollution concentrations for assessment of personal exposure. Environ. Model. Softw. 2008, 23, 282–287. [Google Scholar] [CrossRef]
- He, C.; Morawska, L.; Hitchins, J.; Gilbert, D. Contribution from indoor sources to particle number and mass concentrations in residential houses. Atmos. Environ. 2004, 38, 3405–3415. [Google Scholar] [CrossRef]
- Petros, K.; Briggs, S.L.K.; Leaderer, B.P. Source apportionment of indoor aerosols in Suffolk and Onondaga Counties, New York. Environ. Sci. Technol. 1992, 26, 521–527. [Google Scholar]
- Wallace, L.; Emmerich, S.J.; Howard-Reed, C. Source strengths of ultrafine and fine particles due to cooking with a gas stove. Environ. Sci. Technol. 2004, 38, 2304–2311. [Google Scholar] [CrossRef] [PubMed]
- El-Hussein, A. Unattached fractions, attachment and deposition rates of radon progeny in indoor air. Appl. Radiat. Isot. 1996, 47, 515–523. [Google Scholar] [CrossRef]
- Jacobi, W. Activity and potential energy of 222Rn- and 222Rn-daughters in different air atmospheres. Health Phys. 1972, 22, 441–450. [Google Scholar] [CrossRef]
- Knutson, E.O. Characteristics and behaviour of radon decay products. In Radon and Its Decay Products in Indoor Air; Nazaroff, W.W., Nero, A.V., Jr., Eds.; John Wiley & Sons: New York, NY, USA, 1988. [Google Scholar]
- Nikezić, D.; Yu, K.N. Long-term determination of airborne concentrations of unattached and attached radon progeny using stacked LR 115 detector with multi-step etching. Nucl. Instrum. Methods Phys. Res. Sect. A 2010, 613, 245–250. [Google Scholar] [CrossRef]
- Bruno, R.C. Verifying a model of radon decay product behavior indoors. Health Phys. 1983, 45, 471–480. [Google Scholar] [CrossRef] [PubMed]
- Zarcone, M.J.; Schery, S.D.; Wilkening, M.H.; McNamee, E. A comparison of measurements of thoron, radon and their daughters in a test house with model predictions. Atmos. Environ. 1986, 20, 1273–1279. [Google Scholar] [CrossRef]
- Gadgil, A.J.; Kong, D.; Nazaroff, W.W. Deposition of unattached radon progeny from enclosure flows. Radiat. Prot. Dosim. 1992, 45, 337–341. [Google Scholar] [CrossRef]
- Islam, G.S.; Mazumdar, S.C.; Ashraf, M.A. Influence of various room parameters upon radon daughter equilibrium indoor. Radiat. Meas. 1996, 26, 193–201. [Google Scholar] [CrossRef]
- Nikolopoulos, D.; Vogiannis, E. Modelling radon progeny concentration variations in thermal spas. Sci. Total Environ. 2007, 373, 82–93. [Google Scholar] [CrossRef] [PubMed]
- Mishra, R.; Mayya, Y.S.; Kushwaha, H.S. Measurement of 220Rn/222Rn progeny deposition velocities on surfaces and their comparison with theoretical models. J. Aerosol Sci. 2009, 40, 1–15. [Google Scholar] [CrossRef]
- Stevanovic, N.; Markovic, V.M.; Urosevic, V.; Nikezic, D. Determination of parameters of the Jacobi room model using the Brownian motion model. Health Phys. 2009, 96, 48–54. [Google Scholar] [CrossRef] [PubMed]
- Stevanovic, N.; Markovic, V.M.; Nikezic, D. Relationship between deposition and attachment rates in Jacobi room model. J. Environ. Radioact. 2010, 101, 349–352. [Google Scholar] [CrossRef] [PubMed]
- Yu, K.N.; Nikezic, D. Long-term measurements of unattached radon progeny concentrations using solid-state nuclear track detectors. Appl. Radiat. Isot. 2012, 70, 1104–1106. [Google Scholar] [CrossRef] [PubMed]
- Li, H.; Zhang, L.; Guo, Q. The influence of environmental factors on the deposition velocity of thoron progeny. Radiat. Prot. Dosim. 2012, 152, 84–88. [Google Scholar] [CrossRef]
- Mishra, R.; Rout, R.; Prajith, R.; Jalalluddin, S.; Sapra, B.K.; Mayya, Y.S. Innovative easy-to-use passive technique for 222Rn and 220Rn decay product detection. Radiat. Prot. Dosim. 2016, 171, 181–186. [Google Scholar] [CrossRef]
- Doi, M.; Kobayashi, S.; Fujimoto, K. A passive measurement technique for characterisation of high-risk houses in Japan due to enhanced levels of indoor radon and thoron concentrations. Radiat. Prot. Dosim. 1992, 45, 425–430. [Google Scholar] [CrossRef]
- Kolarž, P.; Vaupotič, J.; Kobal, I.; Ujić, P.; Stojanovska, Z.; Žunić, Z.S. Thoron, radon and air ions spatial distribution in indoor air. J. Environ. Radioact. 2017, 173, 70–74. [Google Scholar] [CrossRef]
- Németh, C.; Tokonami, S.; Ishikawa, T.; Takahashi, H.; Zhuo, W.; Shimo, M. Measurements of radon, thoron and their progeny in Gifu prefecture, Japan. J. Radioanal. Nucl. Chem. 2005, 267, 9–12. [Google Scholar] [CrossRef]
- Zhuo, W.; Chen, B.; Wei, M. Estimation of indoor 220Rn progeny concentrations with 220Rn measurements. Radiat. Prot. Dosim. 2010, 141, 408–411. [Google Scholar] [CrossRef]
- Zhuo, W.; Iida, T.; Moriizumi, J.; Aoyagi, T.; Takahashi, I. Simulation of the concentrations and distributions of indoor radon and thoron. Radiat. Prot. Dosim. 2001, 93, 357–367. [Google Scholar] [CrossRef] [PubMed]
- Ramola, R.C.; Negi, M.S.; Choubey, V.M. Radon and thoron monitoring in the environment of Kumaun Himalayas: Survey and outcomes. J. Environ. Radioact. 2005, 79, 85–92. [Google Scholar] [CrossRef] [PubMed]
- Wang, J.; Meisenberg, O.; Chen, Y.; Karg, E.; Tschiersch, J. Mitigation of radon and thoron decay products by filtration. Sci. Total Environ. 2011, 409, 3613–3619. [Google Scholar] [CrossRef] [PubMed]
- Kemski, J.; Klingel, R.; Siehl, A.; Valdivia-Manchego, M. From radon hazard to risk prediction-based on geological maps, soil gas and indoor measurements in Germany. Environ. Geol. 2009, 56, 1269–1279. [Google Scholar] [CrossRef]
- Kemski, J.; Klingel, R.; Siehl, A.; Stegemann, R. Radon transfer from ground to houses and prediction of indoor radon in Germany based on geological information. In The Natural Radiation Environment VII, Seventh International Symposium on the Natural Radiation in Environment (NRE-VII); McLaughlin, J.P., Simopoulos, S.E., Steinhäusler, F., Eds.; Elsevier Ltd.: Oxford, UK, 2005; pp. 820–832. [Google Scholar]
- Mihci, M.; Buyuksarac, A.; Aydemir, A.; Celebi, N. Indoor and outdoor radon concentration measurements in Sivas, Turkey, in comparison with geological setting. J. Environ. Radioact. 2010, 101, 952–957. [Google Scholar] [CrossRef]
- Vaupotič, J.; Andjelov, M.; Kobal, I. Relationship between radon concentrations in indoor air and in soil gas. Environ. Geol. 2002, 42, 583–587. [Google Scholar]
- Borgoni, R.; Tritto, V.; Bigliotto, C.; de Bartolo, D. A geostatistical approach to assess the spatial association between indoor radon concentration, geological features and building characteristics: The case of Lombardy, Northern Italy. Int. J. Environ. Res. Public Health 2011, 8, 1420–1440. [Google Scholar] [CrossRef]
- Przylibski, T.A.; Zebrowski, A.; Karpińska, M.; Kapała, J.; Kozak, K.; Mazur, J.; Grządziel, D.; Mamont-Cieśla, K.; Stawarz, O.; Kozłowska, B.; et al. Mean annual 222Rn concentration in homes located in different geological regions of Poland—First approach to whole country area. J. Environ. Radioact. 2011, 102, 735–741. [Google Scholar] [CrossRef]
- Crameri, R.; Brunner, H.H.; Buchli, R.; Wernli, C.; Burkart, W. Indoor Rn levels in different geological areas in Switzerland. Health Phys. 1989, 57, 29–38. [Google Scholar] [CrossRef]
- Zhu, H.C.; Charlet, J.M.; Tondeur, F. Geological controls to the indoor radon distribution in southern Belgium. Sci. Total Environ. 1998, 220, 195–214. [Google Scholar] [CrossRef] [PubMed]
- Bochicchio, F.; Campos-Venuti, G.; Felici, F.; Grisanti, A.; Grisanti, G.; Kalita, S.; Moroni, G.; Nuccetelli, C.; Risica, S.; Tancredi, F. Characterisation of some parameters affecting the radon exposure of the population. Radiat. Prot. Dosim. 1994, 56, 137–140. [Google Scholar] [CrossRef]
- Moreno, V.; Baixeras, C.; Font, L.; Bach, J. Indoor radon levels and their dynamics in relation with the geological characteristics of La Garrotxa, Spain. Radiat. Meas. 2008, 43, 1532–1540. [Google Scholar] [CrossRef]
- Sciocchetti, G.; Bovi, M.; Cotellessa, G.; Baldassini, P.G.; Batella, C.; Porcu, I. Indoor radon and thoron surveys in high radioactivity areas of Italy. Radiat. Prot. Dosim. 1992, 45, 509–513. [Google Scholar] [CrossRef]
- Minda, M.; Tóth, G.; Horváth, I.; Barnet, I.; Hámori, K.; Tóth, E. Indoor radon mapping and its relation to geology in Hungary. Environ. Geol. 2009, 57, 601–609. [Google Scholar] [CrossRef]
- Swakoń, J.; Kozak, K.; Paszkowski, M.; Gradziński, R.; Łoskiewicz, J.; Mazur, J.; Janik, M.; Bogacz, J.; Horwacik, T.; Olko, P. Radon concentration in soil gas around local disjunctive tectonic zones in the Krakow area. J. Environ. Radioact. 2005, 78, 137–149. [Google Scholar] [CrossRef] [PubMed]
- Vaupotič, J.; Gregorič, A.; Kobal, I.; Žvab, P.; Kozak, K.; Mazur, J.; Kochowska, E.; Grządziel, D. Radon concentration in soil gas and radon exhalation rate at the Ravne Fault in NW Slovenia. Nat. Hazards Earth Syst. Sci. 2010, 10, 895–899. [Google Scholar] [CrossRef]
- Rohmingliana, P.C.; Vanchhawng, L.; Thapa, R.K.; Sahoo, B.K.; Mishra, R.; Zoliana, B.; Mayya, Y.S. Measurement of indoor concentrations of radon and thoron in Mizoram, India. Sci. Vis. 2010, 10, 148–152. [Google Scholar]
- Dai, D.; Neal, F.B.; Diem, J.; Deocampo, D.M.; Stauber, C.; Dignam, T. Confluent impact of housing and geology on indoor radon concentrations in Atlanta, Georgia, United States. Sci. Tot. Environ. 2019, 668, 500–511. [Google Scholar] [CrossRef]
- Long, S.C.; Fenton, D.; Scivyer, C.; Monahan, E. Factors underlying persistently high radon levels in a house located in a karst limestone region of Ireland—Lessons learned about remediation. Nukleonika 2016, 61, 327–332. [Google Scholar] [CrossRef]
- Peake, R.T. Radon and geology in the United States. Radiat. Prot. Dosim. 1988, 24, 173–178. [Google Scholar] [CrossRef]
- Žvab, P.; Vaupotič, J.; Dolenec, T. Reasons for elevated radon levels inside the building in Divača. Geologija 2006, 49, 405–415. [Google Scholar] [CrossRef]
- Gammage, R.B.; Dudney, C.S.; Wilson, D.L. Unusually amplified summer or winter indoor levels of radon. In Proceedings of the 6th International Conference on Indoor Air Quality and Climate, Helsinki, Finland, 4–8 July 1993; pp. 511–516. [Google Scholar]
- Vaupotič, J.; Brodar, A.; Gregorič, A.; Kobal, I. Radon dynamics in a dwelling with high radon levels in a karst area. In Radon, Health and Natural Hazards; Gillmore, G.K., Perrier, F.E., Crockett, R.G.M., Eds.; The Geological Society: London, UK, 2018; pp. 63–82. [Google Scholar]
- Popit, A.; Vaupotič, J. Indoor radon concentrations in relation to geology in Slovenia. Environ. Geol. 2002, 42, 330–337. [Google Scholar] [CrossRef]
- Kardos, R.; Gregorič, A.; Jónás, J.; Vaupotič, J.; Kovács, T.; Ishimori, Y. Dependence of radon emanation of soil on lithology. J. Radioanal. Nucl. Chem. 2015, 304, 1321–1327. [Google Scholar] [CrossRef]
- Kovács, T.; Szeiler, G.; Fábián, F.; Kardos, R.; Gregorič, A.; Vaupotič, J. Systematic survey of natural radioactivity of soil in Slovenia. J. Environ. Radioact. 2013, 122, 70–78. [Google Scholar] [CrossRef] [PubMed]
- Miles, J.C.H.; Appleton, J.D. Mapping variation in radon potential both between and within geological units. J. Radiol. Prot. 2005, 25, 257–276. [Google Scholar] [CrossRef] [PubMed]
- Pillai, G.S.; Khan, S.M.M.N.; Hameed, P.S.; Balasundar, S. Radon exhalation rate from the building materials of Tiruchirappalli district (Tamil Nadu State, India). Radiat. Prot. Environ. 2014, 37, 150–156. [Google Scholar]
- Singh, K.; Semwal, P.; Pant, P.; Gusain, G.S.; Joshi, M.; Sapra, B.K.; Ramola, R.C. Measurement of radon, thoron and their progeny in different types of dwelling in Almora district of Kumaun Himalayan region. Radiat. Prot. Dosim. 2016, 171, 223–228. [Google Scholar] [CrossRef] [PubMed]
- Deka, P.C.; Sarkar, S.; Bhattacharjee, B.; Goswami, T.D.; Sarma, B.K.; Ramachandran, T.V. Measurement of radon and thoron concentration by using LR-115 type-II plastic track detectors in the environ of Brahmaputra Valley, Assam, India. Radiat. Meas. 2003, 36, 431–434. [Google Scholar] [CrossRef]
- Kim, C.K.; Kim, Y.J.; Lee, H.Y.; Chang, B.U.; Tokonami, S. 220Rn and its progeny in dwellings of Korea. Radiat. Meas. 2007, 42, 1409–1414. [Google Scholar] [CrossRef]
- Proctor, L.A. A study of indoor 220Rn and 222Rn decay product concentrations in the UK. Radiat. Prot. Dosim. 2006, 121, 175–178. [Google Scholar] [CrossRef]
- Stojanovska, Z.; Januseski, J.; Bossew, P.; Zunic, Z.S.; Tollefsen, T.; Ristova, M. Seasonal indoor radon concentration in FYR of Macedonia. Radiat. Meas. 2011, 46, 602–610. [Google Scholar] [CrossRef]
- Syuryavin, A.C.; Park, S.; Nirwono, M.M.; Lee, S.H. Indoor radon and thoron from building materials: Analysis of humidity, air exchange rate, and dose assessment. Nucl. Eng. Technol. 2020, 52, 2370–2378. [Google Scholar] [CrossRef]
- Bahtijari, M.; Stegnar, P.; Shemsidini, Z.; Ajazaj, H.; Halimi, Y.; Vaupotič, J.; Kobal, I. Seasonal variation of indoor air radon concentration in schools in Kosovo. Radiat. Meas. 2007, 42, 286–289. [Google Scholar] [CrossRef]
- Buchli, R.; Burkart, W. Influence of subsoil geology and construction technique on indoor air 222Rn levels in 80 houses of the central Swiss Alps. Health Phys. 1989, 56, 423–429. [Google Scholar] [CrossRef]
- Dudney, C.S.; Hawthorne, A.R.; Wallace, R.G.; Reed, R.P. Levels of 222Rn and its short-lived progeny in Alabama houses. Health Phys. 1988, 54, 89–92. [Google Scholar] [PubMed]
- Hadad, K.; Hakimdavoud, M.R.; Hashemi-Tilehnoee, M. Indoor radon survey in Shiraz-Iran using developed passive measurement method. Iran. J. Radiat. Res. 2011, 9, 175–182. [Google Scholar]
- Jasaitis, D.; Girgždys, A. The investigation of tobacco smoke influence on the changes of indoor radon and its short-lived decay products volumetric activities. J. Environ. Eng. Landsc. Manag. 2013, 21, 59–66. [Google Scholar] [CrossRef]
- Al-Azmi, D.; Abu-Shady, A.I.; Sayed, A.M.; Al-Zayed, Y. Indoor radon in Kuwait. Health Phys. 2008, 94, 49–56. [Google Scholar] [CrossRef] [PubMed]
- Tu, K.W.; George, A.C.; Lowder, W.M.; Gogolak, C.V. Indoor thoron and radon progeny measurements. Radiat. Prot. Dosim. 1992, 45, 557–560. [Google Scholar] [CrossRef]
- Vaupotič, J. Identification of sources of high radon levels in Slovenian schools. Radiat. Prot. Dosim. 2002, 102, 75–80. [Google Scholar] [CrossRef]
- Vaupotič, J.; Gregorič, A.; Leban, M.; Bezek, M.; Žvab Rožič, P.; Zmazek, B.; Kobal, I. Radon survey within a regular grid in homes in Slovenia. In VII. Hungarian Radon Forum and Radon and Environment Satellite Workshop; University of Pannonia: Veszprém, Hungary, 2013; pp. 195–200. [Google Scholar]
- Finne, I.E.; Kolstad, T.; Larsson, M.; Olsen, B.; Prendergast, J.; Rudjord, A.L. Significant reduction in indoor radon in newly built houses. J. Environ. Radioact. 2019, 196, 259–263. [Google Scholar] [CrossRef]
- Pampuri, L.; Caputo, P.; Valsangiacomo, C. Effects of buildings’ refurbishment on indoor air quality. Results of a wide survey on radon concentrations before and after energy retrofit interventions. Sustain. Cities Soc. 2018, 42, 100–106. [Google Scholar] [CrossRef]
- Collignan, B.; Powaga, E. Impact of ventilation systems and energy savings in a building on the mechanisms governing the indoor radon activity concentration. J. Environ. Radioact. 2019, 196, 268–273. [Google Scholar] [CrossRef] [PubMed]
- Baeza, A.; García-Paniagua, J.; Guillén, J.; Montalbán, B. Influence of architectural style on indoor radon concentration in a radon prone area: A case study. Sci. Tot. Environ. 2018, 610–611, 258–266. [Google Scholar] [CrossRef] [PubMed]
- Sun, Q.; Tokonami, S.; Yamada, Y.; Akiba, S. Main meteorological parameters to influence indoor radon level. Radioisotopes 2002, 51, 120–126. [Google Scholar] [CrossRef]
- Gillmore, G.K.; Phillips, P.S.; Denman, A.R. The effects of geology and the impact of seasonal correction factors on indoor radon levels: A case study approach. J. Environ. Radioact. 2005, 84, 469–479. [Google Scholar] [CrossRef] [PubMed]
- Karpińska, M.; Mnich, Z.; Kapała, J.; Antonowicz, K.; Przestalski, M. Time changeability in radon concentration in one-family dwelling houses in the northeastern region of Poland. Radiat. Prot. Dosim. 2005, 113, 300–307. [Google Scholar] [CrossRef] [PubMed]
- Schubert, M.; Musolff, A.; Weiss, H. Influences of meteorological parameters on indoor radon concentrations (222Rn) excluding the effects of forced ventilation and radon exhalation from soil and building materials. J. Environ. Radioact. 2018, 192, 81–85. [Google Scholar] [CrossRef] [PubMed]
- Hubbard, L.M.; Mellander, H.; Swedjemark, G.A. Studies on temporal variations of radon in Swedish single-family houses. Environ. Int. 1996, 22 (Suppl. 1), 715–722. [Google Scholar] [CrossRef]
- De Francesco, S.; Tommasone, F.P.; Cuoco, E.; Tedesco, D. Indoor radon seasonal variability at different floors of buildings. Radiat. Meas. 2010, 45, 928–934. [Google Scholar] [CrossRef]
- Groves-Kirkby, C.J.; Crockett, R.G.M.; Denman, A.R.; Phillips, P.S. A critical analysis of climatic influences on indoor radon concentrations: Implications for seasonal correction. J. Environ. Radioact. 2015, 148, 16–26. [Google Scholar] [CrossRef]
- Font, L.; Baixeras, C.; Domingo, C. Uncertainty, variability and sensitivity analysis applied to the RAGENA model of radon generation, entry and accumulation indoors. Sci. Total Environ. 2001, 272, 25–31. [Google Scholar] [CrossRef]
- Froňka, A. Indoor and soil gas radon simultaneous measurements for the purpose of detail analysis of radon entry pathways into houses. Radiat. Prot. Dosim. 2011, 145, 117–122. [Google Scholar] [CrossRef] [PubMed]
- Keskikuru, T.; Kokotti, H.; Lammi, S.; Kalliokoski, P. Effect of various factors on the rate of radon entry into two different types of houses. Build. Environ. 2001, 36, 1091–1098. [Google Scholar] [CrossRef]
- Wang, F.; Ward, I.C. Radon entry, migration and reduction in houses with cellars. Build. Environ. 2002, 37, 1153–1165. [Google Scholar] [CrossRef]
- Kozak, K.; Mazur, J.; Kozłowska, B.; Karpińska, M.; Przylibski, T.A.; Mamont-Cieśla, K.; Grządziel, D.; Stawarz, O.; Wysocka, M.; Dorda, J.; et al. Correction factors for determination of annual average radon concentration in dwellings of Poland resulting from seasonal variability of indoor radon. Appl. Radiat. Isot. 2011, 69, 1459–1465. [Google Scholar] [CrossRef] [PubMed]
- Miles, J.C.H. Temporal variation of radon levels in houses and implications for radon measurement strategies. Radiat. Prot. Dosim. 2001, 93, 369–376. [Google Scholar] [CrossRef] [PubMed]
- Miles, J.C.H.; Howarth, C.B.; Hunter, N. Seasonal variation of radon concentrations in UK homes. J. Radiol. Prot. 2012, 32, 275–287. [Google Scholar] [CrossRef] [PubMed]
- Wysocka, M.; Kozłowska, B.; Dorda, J.; Kłos, B.; Chmielewska, I.; Rubin, J.; Karpińska, M.; Dohojda, M. Annual observations of radon activity concentrations in dwellings of Silesian Voivodeship. Nukleonika 2010, 55, 369–375. [Google Scholar]
- Xie, D.; Liao, M.; Kearfott, K.J. Influence of environmental factors on indoor radon concentration levels in the basement and ground floor of a building—A case study. Radiat. Meas. 2015, 82, 52–58. [Google Scholar] [CrossRef]
- Bossew, P.; Lettner, H. Investigations on indoor radon in Austria, Part 1: Seasonality of indoor radon concentration. J. Environ. Radioact. 2007, 98, 329–345. [Google Scholar] [CrossRef] [PubMed]
- Groves-Kirkby, C.J.; Denman, A.R.; Phillips, P.S.; Crockett, R.G.M.; Sinclair, J.M. Comparison of seasonal variability in European domestic radon measurements. Nat. Hazards Earth Syst. Sci. 2010, 10, 565–569. [Google Scholar] [CrossRef]
- Chen, C.-J.; Liu, C.-C.; Lin, Y.-M. Diurnal variation of radon progeny in indoor and outdoor air of a subtropical city. Environ. Int. 1996, 22, 723–728. [Google Scholar] [CrossRef]
- Leghrouz, A.A.; Abu-Samreh, M.M.; Shehadeh, A.K. Seasonal variation of indoor radon-222 levels in dwellings in Ramallah province and East Jerusalem suburbs, Palestine. Radiat. Prot. Dosim. 2012, 148, 268–273. [Google Scholar] [CrossRef]
- Muntean, L.E.; Cosma, C.; Cucos Dinu, A.; Dicu, T.; Moldovan, D.V. Assessment of annual and seasonal variation of indoor radon levels in dwelling houses from Alba County, Romania. Rom. J. Phys. 2014, 59, 163–171. [Google Scholar]
- Bochicchio, F.; Campos-Venuti, G.; Piermattei, S.; Nuccetelli, C.; Risica, S.; Tommasino, L.; Torri, G.; Magnoni, M.; Agnesod, G.; Sgorbati, G.; et al. Annual average and seasonal variations of residential radon concentration for all the Italian Regions. Radiat. Meas. 2005, 40, 686–694. [Google Scholar] [CrossRef]
- Burke, Ó.; Murphy, P. Regional variation of seasonal correction factors for indoor radon levels. Radiat. Meas. 2011, 46, 1168–1172. [Google Scholar] [CrossRef]
- Papaefthymiou, H.; Mavroudis, A.; Kritidis, P. Indoor radon levels and influencing factors in houses of Patras, Greece. J. Environ. Radioact. 2003, 66, 247–260. [Google Scholar] [CrossRef] [PubMed]
- Kandari, T.; Aswal, S.; Prasad, M.; Pant, P.; Bourai, A.A.; Ramola, R.C. Study of radiation exposure due to radon, thoron and their progeny in the indoor environment of Rajpur region of Uttarakhand Himalya. Radiat. Prot. Dosim. 2016, 171, 204–207. [Google Scholar] [CrossRef] [PubMed]
- Vaupotič, J.; Streil, T.; Tokonami, S.; Žunić, Z.S. Diurnal variations of radon and thoron activity concentrations and effective doses in dwellings in Niška Banja, Serbia. Radiat. Prot. Dosim. 2013, 157, 375–382. [Google Scholar] [CrossRef] [PubMed]
- Singh, P.; Saini, K.; Mishra, R.; Sahoo, B.K.; Bajwa, B.S. Attached, unattached fraction of progeny concentrations and equilibrium factor for dose assessments from 222Rn and 220Rn. Radiat. Environ. Biophys. 2016, 55, 401–410. [Google Scholar] [CrossRef]
- Hu, J.; Wu, Y.; Saputra, M.A.; Song, Y.; Yang, G.; Tokonami, S. Radiation exposure due to 222Rn, 220Rn and their progenies in three metropolises in China and Japan with different air quality levels. J. Environ. Radioact. 2022, 244–245, 106830. [Google Scholar] [CrossRef] [PubMed]
- Alharbi, S.H.; Akber, R.A. Radon and thoron concentrations in public workplaces in Brisbane, Australia. J. Environ. Radioact. 2015, 144, 69–76. [Google Scholar] [CrossRef]
- Ashok, G.V.; Nagaiah, N.; Shiva Prasad, N.G. Indoor radon concentration and its possible dependence on ventilation rate and flooring type. Radiat. Prot. Dosim. 2012, 148, 92–100. [Google Scholar] [CrossRef] [PubMed]
- Misdaq, M.A.; Ezzahery, H.; Lamine, J. Influence of the building material and ventilation rate on the concentration of radon, thoron and their progenies in dwelling rooms using SSNTD and Monte Carlo simulation. J. Radioanal. Nucl. Chem. 2002, 252, 67–74. [Google Scholar] [CrossRef]
- Misdaq, M.A.; Flata, K. The influence of the cigarette smoke pollution and ventilation rate on alpha-activities per unit volume due to radon and its progeny. J. Environ. Radioact. 2003, 67, 207–218. [Google Scholar] [CrossRef] [PubMed]
- Abdo, M.A.S.; Boukhair, A.; Fahad, M.; Ouakkas, S.; Arhouni, F.E.; Hakkar, M.; Belahbib, L.; Al-Suhbani, M.N. Estimation of unattached and aerosol-attached activities of airborne short-lived radon progeny in indoor environments. J. Environ. Radioact. 2021, 237, 106665. [Google Scholar] [CrossRef] [PubMed]
- Katona, T.; Kanyár, B.; Somlai, J. Cost assessment of ventilation and averted dose due to radon in dwellings. J. Environ. Radioact. 2005, 79, 223–230. [Google Scholar] [CrossRef]
- García-Tobar, J. A comparative study of indoor radon levels between two similar dwellings using CONTAM Software. Environments 2018, 5, 59. [Google Scholar] [CrossRef]
- García-Tobar, J. Weather-dependent modelling of the indoor radon concentration in two dwellings using CONTAM. Indoor Built Environ. 2019, 28, 1341–1349. [Google Scholar] [CrossRef]
- Dovjak, M.; Virant, B.; Krainer, A.; Šijanec-Zavrl, M.; Vaupotič, J. Determination of optimal ventilation rates in educational environment in terms of radon dosimetry. Int. J. Hyg. Environ. Health 2021, 234, 113742. [Google Scholar] [CrossRef]
- Dovjak, M.; Vene, O.; Vaupotič, J. Analysis of ventilation efficiency as simultaneous control of radon and carbon dioxide levels in indoor air applying transient modelling. Int. J. Environ. Res. Public Health 2022, 19, 2125. [Google Scholar] [CrossRef]
- Grządziel, D.; Kozak, K.; Mazur, J.; Połednik, B.; Dudzińska, M.R.; Bilska, I. The influence of air conditioning changes on the effective dose due to radon and its short-lived decay products. Nukleonika 2016, 61, 239–244. [Google Scholar] [CrossRef]
- Kozak, K.; Grządziel, D.; Połednik, B.; Mazur, J.; Dudzińska, M.R.; Mroczek, M. Air conditioning impact on the dynamics of radon and its daughters concentration. Radiat. Prot. Dosim. 2014, 162, 663–673. [Google Scholar] [CrossRef] [PubMed]
- Iwaoka, K.; Tokonami, S.; Ishikawa, T.; Yonehara, H. Mitigation effects of radon decay products by air cleaner. J. Radioanal. Nucl. Chem. 2013, 295, 639–642. [Google Scholar] [CrossRef]
- Kojima, H.; Abe, S.; Fujitaka, K. Detailed behaviour of indoor radon daughters focused on effectiveness of an air cleaner. Radiat. Prot. Dosim. 1992, 45, 589–592. [Google Scholar] [CrossRef]
- Tokonami, S.; Ishikawa, T.; Yonehara, H.; Yamada, Y.; Matsuzawa, T.; Iimoto, T. Changes of indoor aerosol characteristics and their associated variation on the dose conversion factor due to radon progeny inhalation. Radioisotopes 2003, 52, 285–292. [Google Scholar] [CrossRef]
- Yasuoka, Y.; Ishikawa, T.; Tokonami, S.; Takahashi, H.; Sorimachi, A.; Shinogi, M. Radon mitigation using an air cleaner. J. Radioanal. Nucl. Chem. 2009, 279, 885–891. [Google Scholar] [CrossRef]
- Song, Y.; Shang, B.; Cui, H.; Wu, Y. Study on the effect of air purifier for reducing indoor radon exposure. Appl. Radiat. Isot. 2021, 173, 109706. [Google Scholar]
- Reineking, A.; Becker, K.H.; Porstendörfer, J. Measurements of the unattached fractions of radon daughters in houses. Sci. Total Environ. 1985, 45, 261–270. [Google Scholar] [CrossRef]
- Smerajec, M.; Vaupotič, J. Nanoaerosols including radon decay products in outdoor and indoor air at a suburban site. J. Toxicol. 2012, 2012, 510876. [Google Scholar] [CrossRef]
- Luoma, M.; Batterman, S.A. Characterization of particulate emissions from occupant activities in offices. Indoor Air 2001, 11, 35–48. [Google Scholar] [CrossRef] [PubMed]
- Morawska, L.; He, C.; Hitchins, J.; Mengersen, K.; Gilbert, D. Characteristics of particle number and mass concentrations in residential houses in Brisbane, Australia. Atmos. Environ. 2003, 37, 4195–4203. [Google Scholar] [CrossRef]
- Afshari, A.; Matson, U.; Ekberg, L.E. Characterization of indoor sources of fine and ultrafine particles: A study conducted in a full-scale chamber. Indoor Air 2005, 15, 141–150. [Google Scholar] [CrossRef]
- Vaupotič, J. Nano particles including radon decay products in ambient air. In Chemistry, Emission Control, Radioactive Pollution and Indoor Air Quality; Mazzeo, N.A., Ed.; InTech: Rijeka, Croatia, 2011; pp. 153–190. [Google Scholar]
- Wallace, L. Indoor sources of ultrafine and accumulation mode particles: Size distributions, size-resolved concentrations, and source strengths. Aerosol Sci. Technol. 2006, 40, 348–360. [Google Scholar] [CrossRef]
- Khalaf, H.N.; Mostafa, M.Y.A.; Zhukovsky, M. Effect of electronic cigarette (EC) aerosols on particle size distribution in indoor air and in a radon chamber. Nukleonika 2019, 64, 31–38. [Google Scholar] [CrossRef]
- Skubacz, K.; Wołoszczuk, K. Size distribution of ambient and radioactive aerosols formed by the short-lived radon progeny. J. Sustain. Min. 2019, 18, 61–66. [Google Scholar] [CrossRef]
Figure 1.
Radioactive chains of (a) thorium (232Th) and (b) uranium (238U); adapted by the World Nuclear Association, http://www.world-nuclear.org/information-library/safety-and-security/radiation-and-health/naturally-occurring-radioactive-materials-norm.aspx (accessed on 21 March 2023).
Figure 1.
Radioactive chains of (a) thorium (232Th) and (b) uranium (238U); adapted by the World Nuclear Association, http://www.world-nuclear.org/information-library/safety-and-security/radiation-and-health/naturally-occurring-radioactive-materials-norm.aspx (accessed on 21 March 2023).

Figure 2.
Radioactive sub-chains of (a) thoron (220Rn) and (b) radon (222Rn).

Figure 3.
Box and whiskers diagram of the distribution of radon emanation fraction (fem) concerning the lithological units at 58 points in Slovenia: A—alluvial and glacial deposits, B1—clastic sediments containing clay, B2—coarse clastic sediments, B3—flysch, C—carbonates, D—metamorphic rocks, E—sea and lake sediments. Adapted by Kardos et al. [162].

Figure 4.
Correlation between 226Ra activity concentration in soil ARa at 70 points in Slovenia and (a) radon activity concentration in soil gas () and (b) radon activity concentration in outdoor air (). Adapted by Kovács et al. [163].
Figure 4.
Correlation between 226Ra activity concentration in soil ARa at 70 points in Slovenia and (a) radon activity concentration in soil gas () and (b) radon activity concentration in outdoor air (). Adapted by Kovács et al. [163].

Figure 5.
Diurnal variation of radon (ARn) and thoron (ATn) activity concentrations in the bedroom of (a) dwelling 2 and (b) dwelling 5 in Niška Banja, Serbia. Adapted by Vaupotič et al. [210].
Figure 5.
Diurnal variation of radon (ARn) and thoron (ATn) activity concentrations in the bedroom of (a) dwelling 2 and (b) dwelling 5 in Niška Banja, Serbia. Adapted by Vaupotič et al. [210].

Figure 6.
Cigarette smoking experiment with a time run of (a) the total number concentration of aerosol particles (N) and the geometric mean of their diameters (dGM), (b) the number fraction of particles smaller than 10 nm (x<10), (c) the activity concentration of radon (ARn) and radon products (ARnP), (d) the unattached fraction of radon short-lived products () and equilibrium factor between radon and its short-lived products (FRn), (e) activity concentrations of the unattached RnP species, 218Po (), 214Pb (), and 214Bi (), and (f) activity concentrations of the attached RnP species, 218Po (), 214Pb (), and 214Bi ().

Figure 7.
Cigarette smoking experiment: number size distribution of aerosol nanoparticles before cigarette smoking (at 8:40), at dGM = minimum (at 10:26), at N = maximum (at 10:51), and after smoking (at 12:39).
Figure 7.
Cigarette smoking experiment: number size distribution of aerosol nanoparticles before cigarette smoking (at 8:40), at dGM = minimum (at 10:26), at N = maximum (at 10:51), and after smoking (at 12:39).

Figure 8.
Number concentrations (Nd) of particles in the selected size windows of 9.3, 29.6, 68.4, 101.4, 153.9, 215.2, and 308.7 nm during (a) cigarette smoking and (b) candle burning.
Figure 8.
Number concentrations (Nd) of particles in the selected size windows of 9.3, 29.6, 68.4, 101.4, 153.9, 215.2, and 308.7 nm during (a) cigarette smoking and (b) candle burning.

Figure 9.
Candle burning experiment with a time run of (a) the total number concentration of aerosol particles (N) and the geometric mean of their diameters (dGM), (b) the number fraction of particles smaller than 10 nm (x<10), (c) the activity concentration of radon (ARn) and radon products (ARnP), (d) the unattached fraction of radon short-lived products () and equilibrium factor between radon and its short-lived products (FRn), (e) activity concentrations of the unattached RnP species, 218Po (), 214Pb (), and 214Bi (), and (f) activity concentrations of the attached RnP species, 218Po (), 214Pb (), and 214Bi ().

Figure 10.
Candle burning experiment: number size distribution of aerosol nanoparticles before candle burning (at 5:58), at N = maximum and at dGM = minimum (at 7:35), and after cigarette smoking (at 13:42).
Figure 10.
Candle burning experiment: number size distribution of aerosol nanoparticles before candle burning (at 5:58), at N = maximum and at dGM = minimum (at 7:35), and after cigarette smoking (at 13:42).

Figure 11.
Candle burning experiment: the ratios of the number concentrations of the <10 nm and >10 nm particles (N<10/N>10) and of the surface area concentrations of the <10 nm and >10 nm particles (S<10/S>10).
Figure 11.
Candle burning experiment: the ratios of the number concentrations of the <10 nm and >10 nm particles (N<10/N>10) and of the surface area concentrations of the <10 nm and >10 nm particles (S<10/S>10).


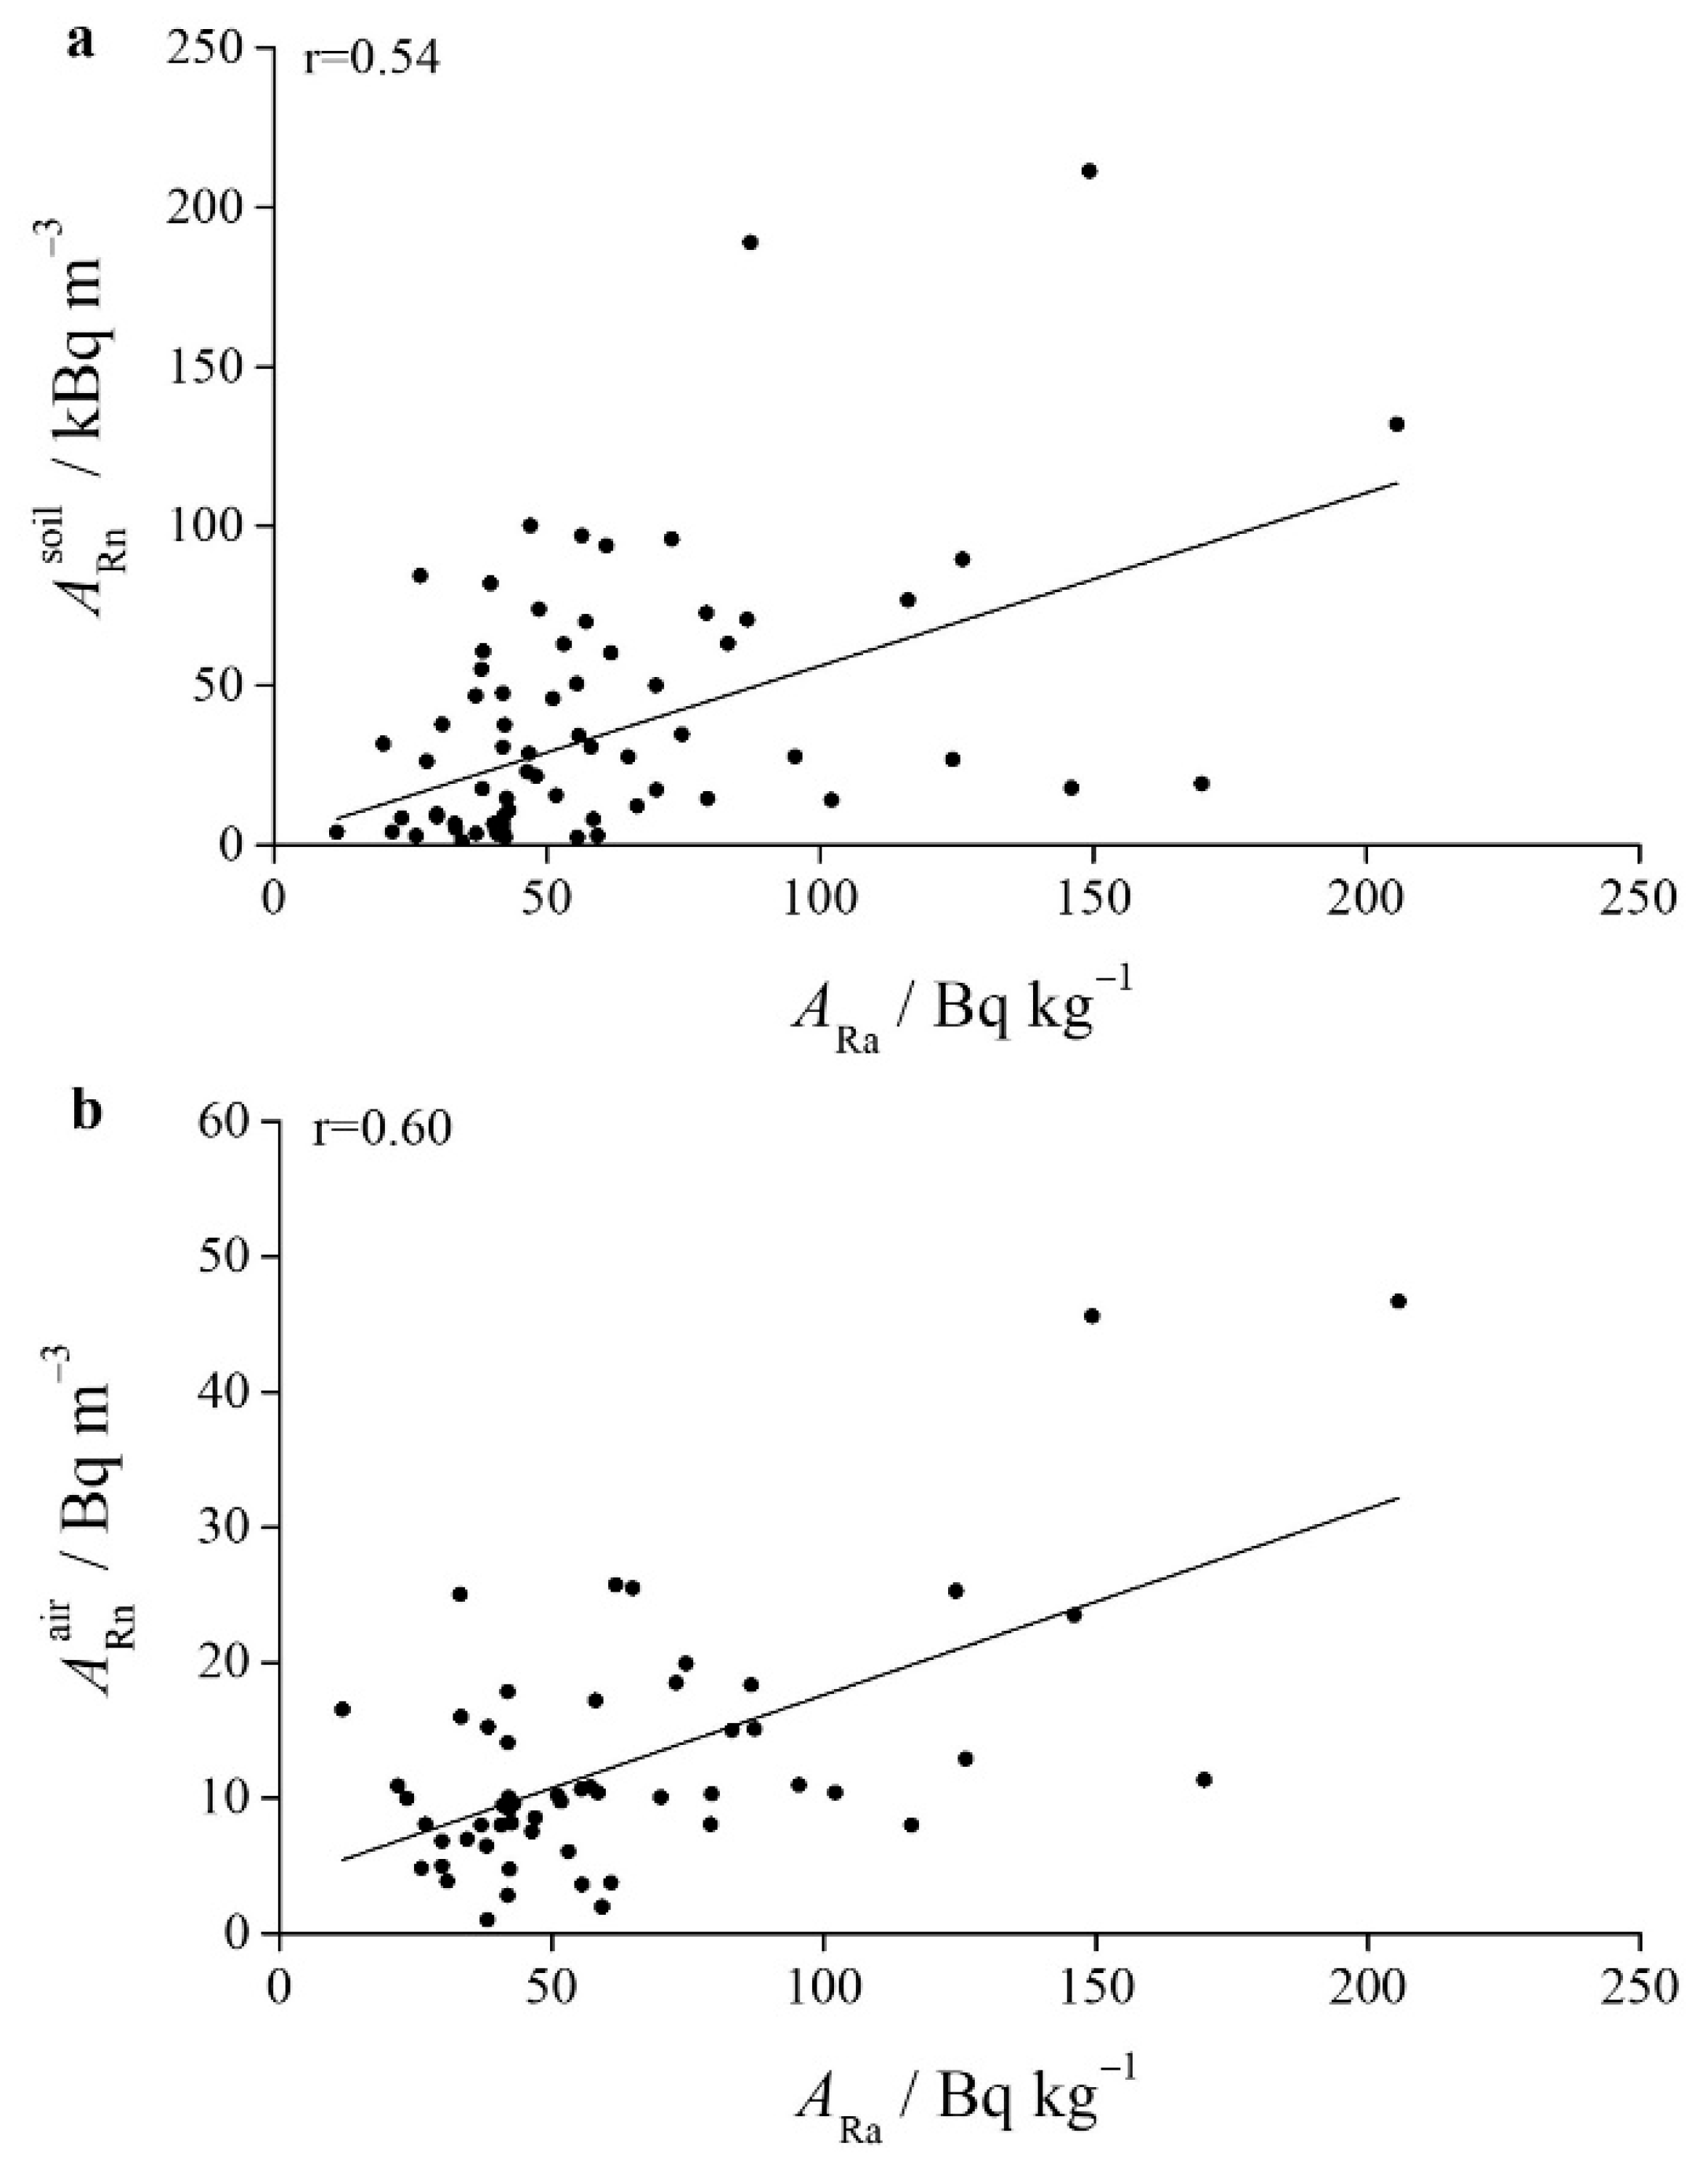
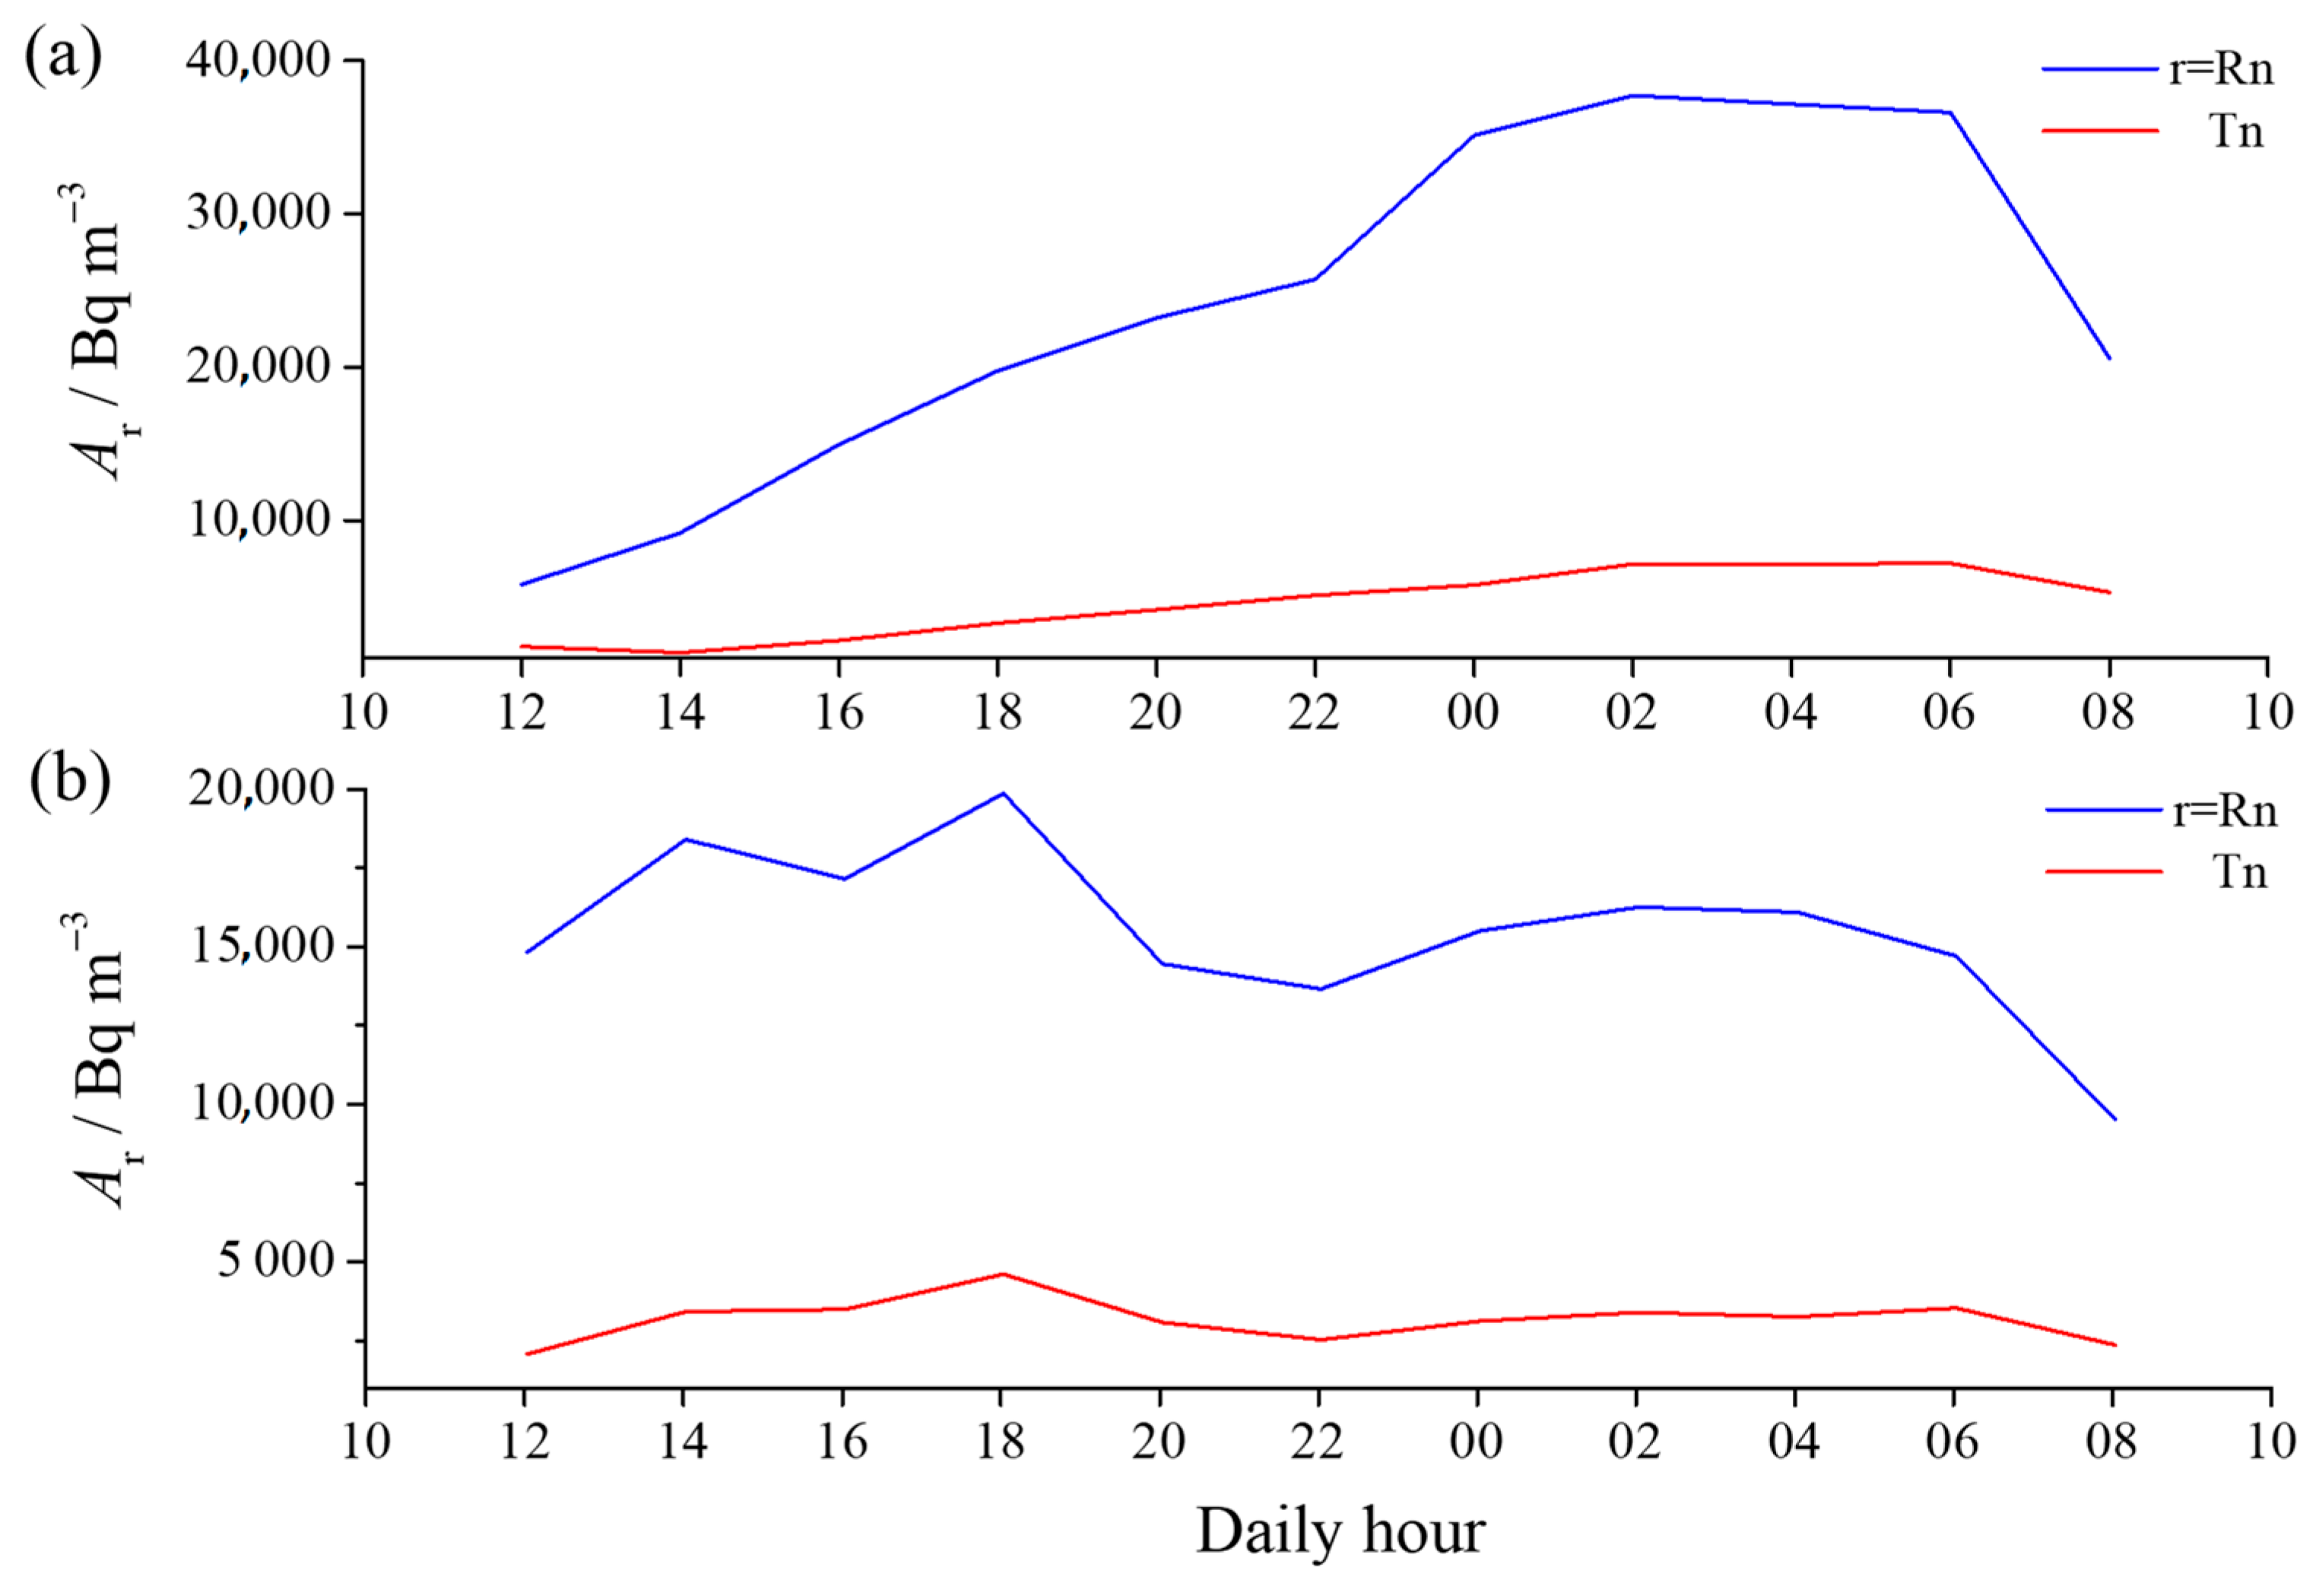
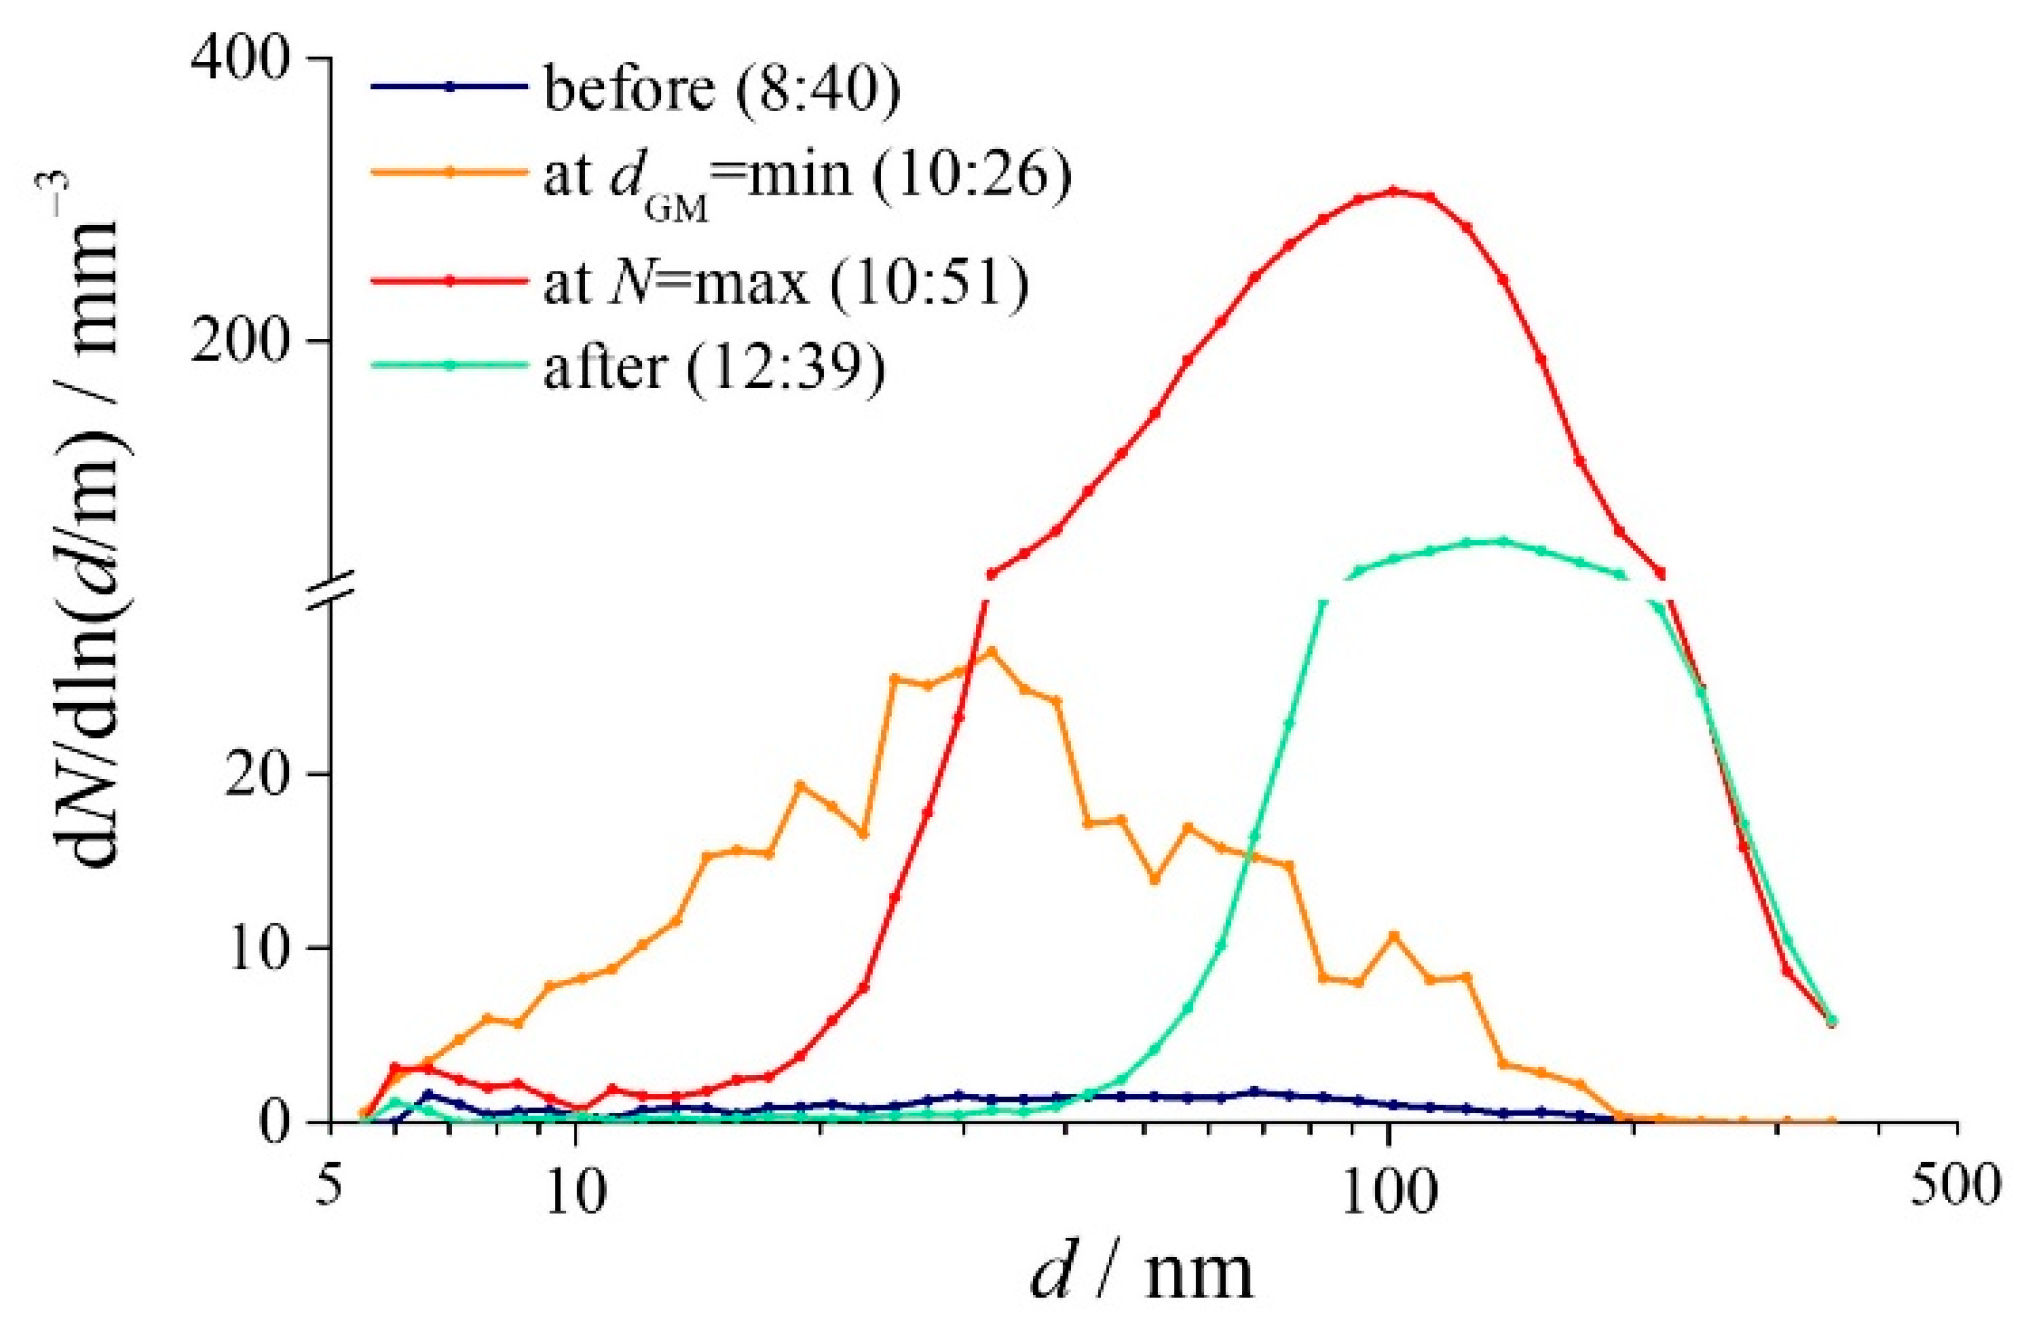
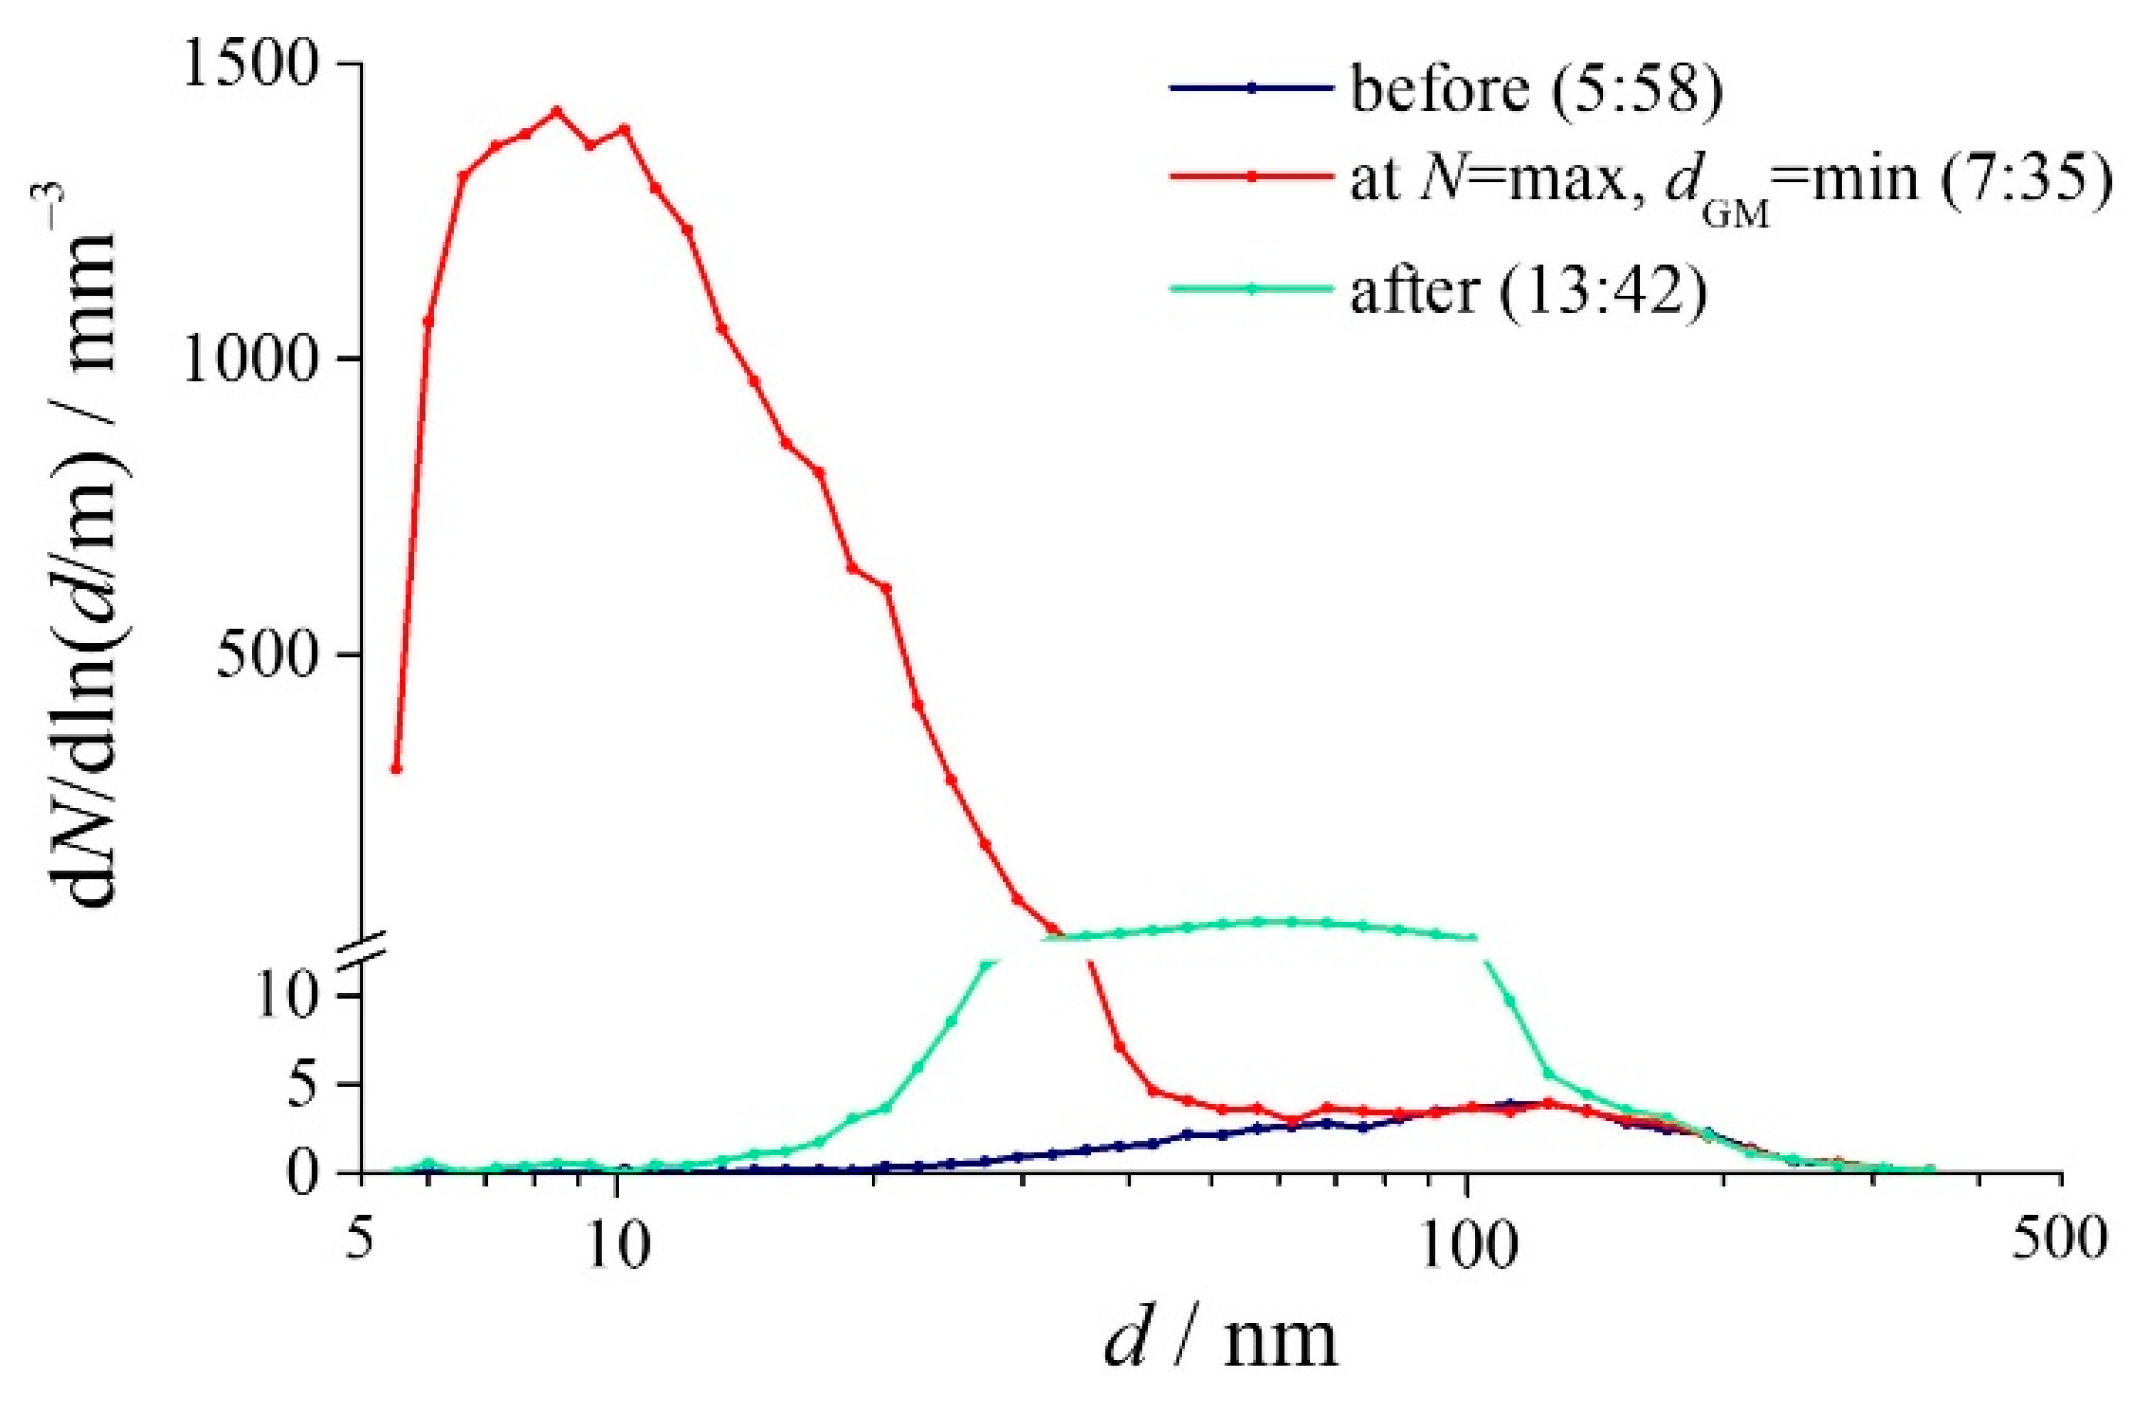
Table 1.
Energetics of radon (222Rn) and thoron (220Rn) and their short-lived products: λ—rate constant of radioactive transformation (‘decay constant’), t1/2—half-life (ln 2/λ), Eα—potential α-energy of radioactive transformation.
Table 1.
Energetics of radon (222Rn) and thoron (220Rn) and their short-lived products: λ—rate constant of radioactive transformation (‘decay constant’), t1/2—half-life (ln 2/λ), Eα—potential α-energy of radioactive transformation.
| Eα per 1 Atom | per 1 Bq | ||||||
|---|---|---|---|---|---|---|---|
| Radionuclide | j | t1/2 | MeV | pJ | MeV | nJ | kj |
| 222Rn | 0 | 3.82 d | 19.18 | 3.07 | 9.2 × 10⁶ | 147 | / |
| 218Po | 1 | 3.05 min | 13.69 | 2.19 | 3620 | 0.579 | 0.106 |
| 214Pb | 2 | 26.8 min | 7.69 | 1.23 | 17,800 | 2.86 | 0.515 |
| 214Bi | 3 | 19.9 min | 7.69 | 1.23 | 13,100 | 2.1 | 0.379 |
| 214Po | 4 | 164 μs | 7.69 | 1.23 | 2 × 10⁻³ | 2.9 × 10⁻⁵ | 6 × 10⁻⁸ |
| 34.52 × 10³ | |||||||
| 220Rn | 0 | 55.6 s | 20.88 | 3.34 | 1660 | 0.265 | / |
| 216Po | 1 | 0.15 s | 14.59 | 2.33 | 3.32 | 5.3 × 10⁻⁴ | 7 × 10⁻⁶ |
| 212Pb | 2 | 10.6 h | 7.81 | 1.25 | 4.3 × 10⁵ | 6.91 | 0.913 |
| 212Bi | 3 | 60.5 min | 7.81 | 1.25 | 4.1 × 10⁴ | 6.56 | 0.087 |
| 212Po | 4 | 299 ns | 8.78 | 1.41 | 3.9 × 10⁻⁶ | 6.9 × 10⁻¹⁰ | 8 × 10⁻¹² |
| 47.1 × 10⁴ | |||||||
kj values for RnP and TnP sub-chains are calculated by: .
Table 2.
Activity median thermodynamic diameters (AMTDs) and their geometric standard deviations (GSD) at various aerosol concentrations (N) and concentrations of RnP and TnP potential α-energy (EαRnP and EαTnP), measured in radon chamber by Tu et al. [95].
Table 2.
Activity median thermodynamic diameters (AMTDs) and their geometric standard deviations (GSD) at various aerosol concentrations (N) and concentrations of RnP and TnP potential α-energy (EαRnP and EαTnP), measured in radon chamber by Tu et al. [95].
| Unattached | Attached | |||||||||
|---|---|---|---|---|---|---|---|---|---|---|
| N mm−3 | Eα μJ m−3 | RnP | TnP | RnP | TnP | |||||
| EαRnP | EαTnP | AMTD | GSD | AMTD | GSD | AMTD | GSD | AMTD | GSD | |
| 2.3 | 1.4 | 1.52 | 2 | 1.36 | 2 | 1.42 | 153 | 2.44 | 165 | 1.78 |
| 5.2 | 3.45 | 13.5 | 3 | 1.77 | 4 | 1.73 | 181 | 2.04 | 162 | 2.22 |
| 30 | 5.95 | 26.6 | 2 | 1.49 | 2 | 1.48 | 174 | 2.30 | 183 | 2.06 |
| 180 | 1.31 | 7.32 | 4 | 1.95 | 2 | 1.47 | 136 | 2.35 | 120 | 2.04 |
Table 3.
Values of physical quantities determining generations and losses of (a) radon and (b) thoron short-lived products in applying the Jacobi room model: —radon generation rate of indoor sources, N—number concentration of aerosol particles, λv—ventilation rate constant, λa—attachment rate constant of the short-lived product to aerosol particles, β—attachment coefficient (cf. Equation (1)), —deposition rate constant of the unattached short-lived products, —deposition rate constant of the attached short-lived products, —deposition velocity of the unattached short-lived products, —deposition velocity of the attached short-lived products, —effective deposition velocity (Equation (3)), r—recoil fraction of short-lived products from aerosol particles. Where, in a row, three values are given for λa, , or , they refer to 218Po, 214Pb, and 214Bi, respectively.
| (a) Radon | ||||||||||
|---|---|---|---|---|---|---|---|---|---|---|
| QRn | N | λv | β/10−3 | λa | r | Reference | ||||
| q m−3 s−1 | mm−3 | h−1 | cm3 h−1 | h−1 | h−1 | h−1 | m h−1 | m h−1 | ||
| 0.3−1.0 | 20−180 | 1−200 | 0.7 | Jacobi [119] | ||||||
| 0.5−1.25 | 1−200 | Bruno [122] | ||||||||
| <0.3 | 2.2−4.7 | 10 | 0.1 | 2 | 0.2 | Porstendörfer [56] | ||||
| 1−2 | 30 | 0.3 | Porstendörfer [56] | |||||||
| 86 | 100 | 0.1 | Zarcone et al. [123] | |||||||
| 0.55 0.2−1.5 | 50 5−500 | 20 10−40 | 0.2 0.1−0.4 | Knutson [120] | ||||||
| 138 | 7−389 | <0.5 | 5.2 | 54 | 0.21 | 0.83 | Reineking and Porstendörfer [54] | |||
| 218Po 0.72−1.4 | Gadgil et al. [124] | |||||||||
| 15 | 50−200 | 8 | 0.08 | Tu et al. [95] | ||||||
| 4.5−9.3 | 4.5−9.3 | Morawska and Jamriska [97] | ||||||||
| 100 | 0.57 2−81 | 3 | 300 | 46.8 30−67 | 0.47 0.33−0.67 | 0.80 | Islam et al. [125] | |||
| 7−14 | 2.9 1.3−4.6 | 0.3 | 91 56−184 | 170 94−354 | 0.225 0.05−0.66 | 0.63 | El-Hussein [118] | |||
| 260 | <0.3 | 3600 | 0.47 0.28 | El-Hussein [118] | ||||||
| 0.2−0.25 | 1.5−930 | 20 | 0.2 | 0.83 | Huet [79] | |||||
| 0.59−0.6 | 50−52 105−112 0.5−0.8 | 102−103 112−120 0.6−2.1 | 4.9−5.0 0.9−1.0 3.7−4.0 | Nikolopoulos and Vogiannis [126] | ||||||
| 0.59−0.6 | 200−203 90−96 0.8−0.9 | 169−171 98−105 0.5−0.6 | 0.9−1.1 0.25−0.26 1.8−2.1 | Nikolopoulos and Vogiannis [126] | ||||||
| 0.55 0.1−2 | 50 10−100 | 20 | 0.2 | Nikezić and Stevanović [109] | ||||||
| 0.075 | Mishra et al. [127] | |||||||||
| 0.1−1.0 | 3−110 | 0.015−0.35 | Stevanovic et al. [58] | |||||||
| 1−10 | 60−170 41−120 43−122 | 39−47 30−36 31−37 | (20−40) × 10−4 (7−1.5) × 10−4 (9−1.5) × 10−4 | Stevanovic et al. [128] | ||||||
| 0.1−1.0 | 10−100 | 0.012−0.46 | Stevanovic et al. [129] | |||||||
| 0.6−50 | 212Pb: 0.28 | 0.11 | Meisenberg and Tschiersch [61] | |||||||
| 5−11 | 2.6 1.3−4.3 | 0.4 | 67 23−103 | 94 36−172 | 0.12 0.05−0.43 | Mohery et al. [103] | ||||
| 5−11 | 29 8−43 | 0.5 | 69 24−108 | 110 28−202 | 0.09 0.05−0.42 | 0.54 0.24−1 | Mohery et al. [103] | |||
| 0.55 | 50 | 20 | 0.2 | Yu and Nikezic [130] | ||||||
| 0.045 | Li et al. [131] | |||||||||
| : 0.126 | Rout et al. [57] | |||||||||
| 20 | 1 | : 0.169 | Mishra et al. [132] | |||||||
| (b) Thoron | ||||||||||
| N | λv | β/10−3 | Reference | |||||||
| mm−3 | h−1 | cm3 h−1 | h−1 | m h−1 | m h−1 | |||||
| 212Pb: 0.36−1.1 | Gadgil et al. [124] | |||||||||
| 0.132 ± 0.004 | Mishra et al. [127] | |||||||||
| 30 | 0.5−1.0 | 0.075 | Mishra et al. [127] | |||||||
| 0.083 | 0.028 | Mishra et al. [59] | ||||||||
| 0.6−50 | 212Pb: 0.28 | 0.11 | Meisenberg and Tschiersch [61] | |||||||
| : 0.059 | Rout et al. [57] | |||||||||
| 20 | 1 | : 0.079 | Mishra et al. [132] | |||||||
Table 4.
Ranges and geometric (GM) or arithmetic (AM *) means of radon exhalation rates (in mass unit mBq kg−1 h−1 and surface unit mBq m−2 h−1) of selected building materials by Pillai et al. [165].
Table 4.
Ranges and geometric (GM) or arithmetic (AM *) means of radon exhalation rates (in mass unit mBq kg−1 h−1 and surface unit mBq m−2 h−1) of selected building materials by Pillai et al. [165].
| Radon Exhalation Rate | |||||
|---|---|---|---|---|---|
| mBq kg−1 h−1 | mBq m−2 h−1 | ||||
| Material | No. of Samples | Range | GM or AM | Range | GM or AM |
| Sedimentary rock | 14 | 1.8−29 | 6.2×/:2.28 | 13−215 | 46.2×/:2.29 |
| Igneous rock | 9 | 13−156 | 31.5×/:2.24 | 94−1127 | 388×/:2.13 |
| River sand | 5 | 16−90 | 36.6×/:2.84 | 118−49 | 265×/:1.18 |
| Bricks | 10 | 4.2−76 | 18.6×/:2.14 | 31−551 | 135×/:2.14 |
| Cement | 11 | 24−41 | 31.7 ± 4.9 * | 170−297 | 229 ± 36 * |
Table 5.
Geometric means (GMs) and ranges (in brackets) of indoor activity concentrations (Bq m−3) of radon (ARn), thoron (ATn), and their short-lived products (ARnP, ATnP) in dwellings made of different building materials by Singh et al. [166].
Table 5.
Geometric means (GMs) and ranges (in brackets) of indoor activity concentrations (Bq m−3) of radon (ARn), thoron (ATn), and their short-lived products (ARnP, ATnP) in dwellings made of different building materials by Singh et al. [166].
| Building Material | No | ARn | ARnP | ATn | ATnP |
|---|---|---|---|---|---|
| Mud | 17 | 111 (45−180) | 37 (13−76) | 76 (14−151) | 2.69 (0.99−2.30) |
| Stone, cement plaster | 17 | 97 (42−208) | 38 (21−72) | 76 (9−196) | 2.66 (1.25−5.88) |
| Cement | 18 | 94 (41−200) | 31 (7.9−65) | 87 (10−253) | 2.26 (1.25−5.43) |
Table 6.
Average values of the parameters given in the first column, obtained in winter and summer, and the winter-to-summer ratio (W/S), in 122 houses in Yamuna, Tons, and Kedar valleys in Garhwal Himalaya, India by Ramola et al. [50].
Table 6.
Average values of the parameters given in the first column, obtained in winter and summer, and the winter-to-summer ratio (W/S), in 122 houses in Yamuna, Tons, and Kedar valleys in Garhwal Himalaya, India by Ramola et al. [50].
| Winter | Summer | ||||||
|---|---|---|---|---|---|---|---|
| Parameter | Min | Max | GM | Min | Max | GM | W/S |
| ARn/Bq m−3 | 36 ± 4 | 182 ± 9 | 66 | 5 ± 1 | 174 ± 9 | 34 | 1.94 |
| ARnP/Bq m−3 | 6.7 ± 1 | 65.1 ± 2.5 | 22.6 | 2.1 ± 0.4 | 37.6 ± 1.9 | 13.0 | 1.74 |
| /Bq m−3 | 5.7 ± 1.1 | 47.5 | 16.7 | 1.4 ± 0.5 | 34 ± 2.7 | 11.1 | 1.50 |
| /Bq m−3 | 0.2 | 27.8 | 2.6 | 0.26 | 13.0 | 1.3 | 2.0 |
| 0.01 | 0.84 | 0.11 | 0.01 | 0.87 | 0.11 | 1.0 | |
| FRn | 0.10 | 0.91 | 0.34 | 0.10 | 0.83 | 0.37 | 0.92 |
| ATn/Bq m−3 | 2 ± 1 | 210 ± 10 | 33 | 4 ± 1 | 195 ± 10 | 27 | 1.22 |
| ATnP/Bq m−3 | 0.3 ± 0.1 | 4.8 ± 0.2 | 1.6 | 0.3 ± 0.1 | 11.2 ± 0.3 | 1.2 | 1.33 |
| /Bq m−3 | 0.3 ± 0.1 | 4.7 ± 0.3 | 1.4 | 0.2 ± 0.1 | 9.6 ± 0.5 | 0.9 | 1.56 |
| /Bq m−3 | <0.05 | 1.8 | 0.1 | 0.1 | 1.8 | 0.3 | 0.33 |
| 0.01 | 0.46 | 0.07 | 0.01 | 0.70 | 0.21 | 0.33 | |
| FTn | 0.01 | 0.21 | 0.05 | 0.01 | 0.31 | 0.05 | 1.0 |
Table 7.
Effect of the ventilation rate constant (λv/h−1) in a dwelling made of clay and brick on the activity concentrations (Ar/Bq m−3, r—radionuclide) of (a) radon and its products and (b) thoron and its products (* in the last row indicated as ‘0.2/0.5’; the ratio of the values at λv = 0.20 h−1 and λv = 0.50 h−1 is shown) by Misdaq et al. [215].
| (a) Radon and its products | ||||||
| λv | ARn | A218Po | A214Pb | A214Bi | A214Po | FRn |
| 0.20 | 69.4 ± 4.9 | 54.8 ± 3.0 | 42.2 ± 1.9 | 34.6 ± 1.7 | 34.3 ± 2.0 | 0.58 ± 0.03 |
| 0.25 | 67.7 ± 4.7 | 53.4 ± 2.1 | 40.1 ± 2.2 | 32.1 ± 1.7 | 31.7 ± 1.6 | 0.56 ± 0.03 |
| 0.30 | 58.4 ± 4.0 | 46.1 ± 3.2 | 33.7 ± 2.4 | 26.3 ± 1.3 | 26.0 ± 1.8 | 0.55 ± 0.03 |
| 0.35 | 49.4 ± 3.4 | 39.0 ± 1.9 | 28.1 ± 1.4 | 21.9 ± 1.1 | 21.7 ± 0.7 | 0.54 ± 0.03 |
| 0.50 | 38.4 ± 2.7 | 29.9 ± 1.5 | 19.8 ± 1.0 | 14.4 ± 0.9 | 14.7 ± 0.7 | 0.48 ± 0.02 |
| 0.2/0.5 * | 1.81 | 1.83 | 2.13 | 2.40 | 2.33 | 1.21 |
| (b) Thoron and its products | ||||||
| λv | ATn | A216Po | A212Pb | A212Bi | A212Po | FTn |
| 0.20 | 2.22 ± 0.11 | 2.19 ± 0.12 | 0.260 ± 0.010 | 0.158 ± 0.008 | 0.156 ± 0.006 | 0.110 ± 0.008 |
| 0.25 | 2.51 ± 0.14 | 2.48 ± 0.11 | 0.273 ± 0.010 | 0.155 ± 0.008 | 0.154 ± 0.007 | 0.100 ± 0.005 |
| 0.30 | 2.75 ± 0.13 | 2.72 ± 0.10 | 0.270 ± 0.010 | 0.147 ± 0.008 | 0.145 ± 0.007 | 0.090 ± 0.004 |
| 0.35 | 2.30 ± 0.11 | 2.27 ± 0.13 | 0.210 ± 0.010 | 0.108 ± 0.006 | 0.107 ± 0.008 | 0.080 ± 0.004 |
| 0.50 | 1.48 ± 0.10 | 1.46 ± 0.07 | 0.100 ± 0.005 | 0.048 ± 0.002 | 0.047 ± 0.003 | 0.060 ± 0.004 |
| 0.2/0.5 * | 1.50 | 1.50 | 2.60 | 3.29 | 3.32 | 1.83 |
Table 8.
Activity concentrations of radon (ARn) and its short-lived products (ARnP) and number concentration of aerosol (N) when air conditioning was in operation under various regimes in the auditorium at the Lublin University of Technology, Lublin, Poland, by Grządziel et al. [223].
Table 8.
Activity concentrations of radon (ARn) and its short-lived products (ARnP) and number concentration of aerosol (N) when air conditioning was in operation under various regimes in the auditorium at the Lublin University of Technology, Lublin, Poland, by Grządziel et al. [223].
| Operation Time | Airflow m3 h−1 | Addition of Fresh Air % | ARn Bq m−3 | ARnP Bq m−3 | N mm−3 | |
|---|---|---|---|---|---|---|
| 1 | all time | 25 ± 16 | 1.2 ± 0.9 | 4.1 ± 3.6 | ||
| 2 | 8 a.m.–8 p.m. | 31 ± 19 | 5.0 ± 3.1 | 5.2 ± 4.1 | ||
| 3 | 6 a.m.–8 p.m. | 30 ± 18 | 4.4 ± 3.1 | 5.2 ± 4.6 | ||
| 4 | 9 p.m.–5 a.m. | 33 ± 19 | 6.1 ± 2.8 | 5.2 ± 3.1 | ||
| 5 | all time | 5400 | 85 | 17 ± 8 | 2.5 ± 1.1 | 2.7 ± 2.6 |
| 6 | all time | 7200 | 85 | 20 ± 10 | 0.8 ± 0.7 | 2.5 ± 1.7 |
| 7 | all time | 9000 | 85 | 12 ± 6 | 0.9 ± 0.6 | 1.8 ± 1.1 |
Table 9.
Median values and standard deviations (SD) of the maximum number concentration of aerosol particles (NM) emitted during an indoor activity, the ratio between NM and background (Nb) aerosol concentration (NM/Nb), and the particle generation–emission rate (Qp), measured in houses in the residential suburb of Brisbane, Australia by He et al. [115].
| NM/mm–3 | NM/Nb | Qp/1011 s–1 | ||||
|---|---|---|---|---|---|---|
| Activity | Median | SD | Median | SD | Median | SD |
| Cooking | 126 | 177 | 10.3 | 19.3 | 5.67 | 8.61 |
| Frying | 154 | 21.3 | 10.0 | 6.1 | 4.75 | 2.34 |
| Grilling | 161 | 69.9 | 8.69 | 5.27 | 7.34 | 5.06 |
| Microwave | 16.3 | 28.6 | 1.12 | 1.55 | 0.55 | 1.94 |
| Stove | 179 | 287 | 12.5 | 10.5 | 7.33 | 51.4 |
| Toasting | 114 | 160 | 6.34 | 7.44 | 6.75 | 16.7 |
| Smoking | 26.6 | 13.6 | 1.54 | 0.96 | 1.91 | 1.92 |
| Vacuuming | 41.3 | 17.6 | 1.51 | 1.17 | 0.97 | 1.57 |
| Sweep floor | 34.9 | 5.86 | 1.05 | 0.01 | 0.12 | 0.02 |
| Washing | 30.9 | 18.5 | 1.30 | 0.83 | 0.96 | 2.60 |
| Dusting | 14.1 | 1.00 | ||||
| Fan heater | 87.1 | 27.2 | 4.07 | |||
| Hair dryer | 9.5 | 1.06 | 0.11 | |||
| Shower | 10.7 | 1.37 | 0.78 | |||
| Washing machine | 11.1 | 1.18 | 0.15 | |||
Table 10.
Examples of particle number concentration (N/mm−3) in selected ranges of particle diameter emitted during various indoor activities in a townhouse in Reston, VA, USA (with % for the contribution of 10–100 nm particles) by Wallace [236].
Table 10.
Examples of particle number concentration (N/mm−3) in selected ranges of particle diameter emitted during various indoor activities in a townhouse in Reston, VA, USA (with % for the contribution of 10–100 nm particles) by Wallace [236].
| Ranges of Particle Diameter/nm | |||||
|---|---|---|---|---|---|
| Particle Source | 10–100 (%) | 100–200 | 200–450 | 450–950 | Total |
| No source | 2.56 (75) | 0.68 | 0.183 | 0.018 | 3.38 |
| Outdoors | 9.52 (31) | 18.35 | 3.03 | 0.016 | 30.92 |
| Tea | 5.76 (99) | 0.058 | 5.82 | ||
| Tea + toast | 9.53 (100) | 0.001 | 9.53 | ||
| Breakfast | 19.97 (99) | 0.117 | 0.013 | 20.10 | |
| Fried eggs | 22.51 (90) | 2.20 | 0.317 | 0.053 | 25.08 |
| Dinner | 30.46 (92) | 2.31 | 0.321 | 0.041 | 33.13 |
| Tortillas | 39.70 (81) | 8.39 | 0.823 | 0.072 | 48.99 |
| Broiled fish | 47.23 (95) | 2.63 | 0.098 | 0.017 | 49.98 |
| Gas oven | 29.74 (95) | 1.40 | 0.068 | 0.021 | 31.23 |
| Incense | 6.68 (69) | 2.31 | 0.722 | 9.71 | |
| Citronella candle | 3.14 (45) | 1.61 | 1.63 | 0.576 | 6.96 |
Table 11.
Average values of number aerosol concentration (N/mm−3), the geometric mean of particle diameter (dGM/nm), the concentration of potential α-energy of attached (/MeV cm−3) and unattached radon short-lived products (/MeV cm−3), and their equilibrium factor (FRn), as measured before and at the end of 12 min of ‘smoking’ traditional and electronic cigarettes in the radon chamber (at 1.6 kBq m−3 radon concentration) at INMRI-ENEA, Rome, Italy; the last row shows the ratio between the maximum and background values by Vargas Trassierra et al. [63].
| Traditional Cigarette | Electronic Cigarette | |||||||||
|---|---|---|---|---|---|---|---|---|---|---|
| Smoking Step | N | dGM | FRn | N | dGM | FRn | ||||
| a: before | 3.36 | 14.1 | 2.14 | 0.31 | 3.36 | 67 | 7.47 | 3.18 | 0.23 | |
| b: at the end | 506 | 18.6 | 0.48 | 0.38 | 62.9 | 87 | 12.6 | 2.53 | 0.30 | |
| b/a | 150 | 1.32 | 0.22 | 1.22 | 18 | 1.69 | 0.80 | 1.30 | ||
Disclaimer/Publisher’s Note: The statements, opinions and data contained in all publications are solely those of the individual author(s) and contributor(s) and not of MDPI and/or the editor(s). MDPI and/or the editor(s) disclaim responsibility for any injury to people or property resulting from any ideas, methods, instructions or products referred to in the content. |
© 2024 by the author. Licensee MDPI, Basel, Switzerland. This article is an open access article distributed under the terms and conditions of the Creative Commons Attribution (CC BY) license (https://creativecommons.org/licenses/by/4.0/).
Share and Cite
MDPI and ACS Style
Vaupotič, J. Radon and Its Short-Lived Products in Indoor Air: Present Status and Perspectives. Sustainability 2024, 16, 2424. https://doi.org/10.3390/su16062424
AMA Style
Vaupotič J. Radon and Its Short-Lived Products in Indoor Air: Present Status and Perspectives. Sustainability. 2024; 16(6):2424. https://doi.org/10.3390/su16062424
Chicago/Turabian StyleVaupotič, Janja. 2024. "Radon and Its Short-Lived Products in Indoor Air: Present Status and Perspectives" Sustainability 16, no. 6: 2424. https://doi.org/10.3390/su16062424
Note that from the first issue of 2016, this journal uses article numbers instead of page numbers. See further details here.