Article

Impact Mechanism of Renewable Energy Technology Innovation on Carbon Productivity Based on Spatial Durbin Model

1
School of Economics, Tianjin University of Commerce, Tianjin 300134, China
2
School of Finance, Taxation and Public Administration, Tianjin University of Finance and Economics, Tianjin 300222, China
*
Author to whom correspondence should be addressed.
Sustainability 2024, 16(5), 2100; https://doi.org/10.3390/su16052100
Submission received: 22 January 2024 / Revised: 27 February 2024 / Accepted: 1 March 2024 / Published: 3 March 2024
(This article belongs to the Topic Energy Economics and Sustainable Development)

Abstract

:
Given the threats to international energy security and the restructuring of energy sources in various countries, China faces the dual challenge of achieving the goals of carbon peaking and carbon neutrality. To promote a reduction in carbon emissions and enhance carbon productivity, it is crucial to innovate renewable energy technology for long-term, low-carbon transformational development. This paper identifies the key factors that affect carbon productivity through pathway analysis and quantitatively examines the direct and spatial spillover impacts of technological advancements in renewable energy using the spatial Durbin model. Finally, this study verifies the pathways through which innovations affect carbon productivity by combining them with the spatial mediation model. The results indicate that innovations in renewable energy technologies significantly enhance carbon productivity. The indirect effects of regional spillover are even more pronounced.

1. Introduction

Climate change and environmental sustainability are critical issues that human society must address in its development [1]. In September 2020, China pledged to the international community to peak carbon dioxide emissions before 2030 and achieve carbon neutrality before 2060 [2]. This commitment is not only a response to global climate change but also a crucial goal of socialist modernization in China’s new era. The report of the 20th National Congress of the Communist Party of China proposed ‘to actively and prudently advance carbon peaking and carbon neutrality, based on China’s energy resource endowment, adhering to the principle of establishing before breaking’ regarding how to achieve this goal [3].
In order to adhere to the principle of ‘establishing before breaking’ in energy transition, it is crucial to vigorously develop renewable energy (RE) and implement renewable energy substitution actions [4]. Technological innovation, as the fundamental driving force, can promote the large-scale and leapfrog development of renewable energy in our country. China has successively supported and guided the development of renewable energy technologies through financial and fiscal policies, standard setting, and international cooperation [5]. As an emerging branch within the field of technological innovation research, Renewable Energy Technology Innovation (REIT) has not yet reached a consensus among scholars regarding its categorization. Currently, the terms widely used include green technology (environmental technology and clean technology) and low-carbon technology [6,7]. This paper focuses on technologies that reduce carbon emissions (CEs) within the realm of green technology innovation, primarily referring to technological advancements and innovative activities in the development and utilization of RE, including improvements in existing technologies such as solar, wind, hydropower, geothermal energy, and biomass energy. This is important for attaining economic development while fostering environmental sustainability, lowering greenhouse gas emissions, and decreasing reliance on fossil fuels [8,9]. Technological innovations can reduce the cost and increase the efficiency of RE, promoting its global use and positively impacting the fight against climate change [10,11].
Due to its zero-carbon and low-carbon attributes and established foundation for mature applications, REIT is considered to have immense potential for addressing climate change and promoting green productivity. It is a crucial pathway for industries, such as energy production, manufacturing, transportation, and construction, to achieve reductions in CEs and enhancements in carbon productivity (CP) [12,13]. CP typically refers to the CEs that accompany a unit of output in a given process or system. This concept can be applied to various areas, including industrial production, agricultural production, and energy production. CP is a macroeconomic indicator used to measure the carbon efficiency of an entire economy [14,15]. Increasing CP allows for the creation of more economic value while generating less CE. This is typically achieved through the adoption of cleaner and more efficient energy and production technologies [16].
However, the mechanism by which REIT impacts CP has not garnered sufficient attention within the academic community. While previous studies have recognized the significant impact of technological progress on regional environmental performance in the context of REIT, this impact is particularly pronounced in promoting the reduction in CEs and the transition to a low-carbon economy. Only a few studies on REIT have focused on the spatial heterogeneity of CP across different economic regions. Based on the analysis above, this study adopts a spatial spillover perspective and utilizes national and provincial panel data from 2001 to 2020, integrating REIT and CP into a cohesive analytical framework. It investigates the spatial heterogeneity in the impact of REIT on CP across different economic regions and explores potential reasons for such variations. The objective is to provide theoretical support for regionally differentiated low-carbon development policies.
This paper is organized as follows: Section 2 introduces studies related to REIT and CP. Section 3 presents the research theories, models, and hypotheses. Section 4 examines the model analysis methods, influencing factors, and indicator selection. Section 5 presents the empirical analysis results, while Section 6 summarizes this study’s findings and proposes policy recommendations for change.

2. Literature Review

Under significant development issues such as climate change and technological innovation, the relationship between technological innovation, CE, and CP has attracted considerable attention in the academic community, with various studies conducted on this topic [17,18]. Some scholars affirm the environmental benefits of technological innovation, finding through their research on its impact and mechanisms that the enhancement of technological innovation levels can lead to a reduction in carbon emissions and an increase in CP by improving energy use efficiency, adjusting energy consumption structures, and promoting local industrial upgrading [19]. Conversely, some studies have found that technological innovation not only fails to enhance CP but may even lead to an increase in total CEs [20]. This is explained by the Environmental Kuznets Curve (EKC) and the energy rebound effect, which suggest that the emission reduction effect brought about by advances in energy efficiency through technological progress cannot fully offset the CEs associated with economic growth, ultimately leading to an increase rather than a decrease in CP [21].
Regarding the relationship between REIT and CP, existing studies have confirmed that REIT can achieve carbon CEs and improve CP. Wang et al. and Lin et al. found that REIT can significantly reduce CEs and improve CP based on provincial-level data from China. This effect is gradually strengthened as the proportion of RE use increases [22,23].
REIT exhibits significant regional heterogeneity in promoting CE reduction, enhancing CP, and transitioning to a low-carbon economy [24,25]. For instance, L. Xin et al. developed an evaluation system to measure China’s inclusive low-carbon development from 2006 to 2020. They also explored the spatial effects of REIT on inclusive low-carbon development and its regional boundaries. The research findings suggest that REITs have a significant impact on promoting inclusive low-carbon development in the region and its surrounding areas, exhibiting a regional pattern of ‘high in the east, low in the west’ [26]. This heterogeneity is influenced by factors such as the market, environmental regulation, technological R&D, industrial structure, energy consumption structure, and government competition. However, environmental regulation is the most critical factor. Only when environmental regulations reach a certain intensity can REIT reduce CEs and enhance CP [19]. The structures of energy consumption, energy intensity, and the energy rebound effect are significant factors contributing to a circular economy. High energy intensity, a coal-dominated energy structure, and a high energy rebound effect are not conducive to enhancing CEs [27]. Additionally, the effect of CEs is closely related to technological research and development and its stage of development. The process of researching, developing, and promoting technology is influenced by various external factors, including the economy, policies, and the market environment [26]. REIT relies heavily on the guidance of local governments, particularly due to its high costs, long development cycles, and high investment risks. For instance, Y. Xu et al. (2019) examined the relationship between REIT and low-carbon transition in 30 Chinese provinces from 2006 to 2019. They used the System Generalized Method of Moments and panel threshold models and found that competition among local governments hindered the positive impact of REIT on the low-carbon transition. Additionally, the impact on low-carbon transition varied across regions with different levels of competition intensity [28]. Financial markets with high liquidity, a standardized environment for technology sharing and transfer, and relatively strict environmental regulations, along with accompanying industrial support policies, can better support REITs, thereby enhancing CP.
In summary, existing literature explores the relationship between REIT and CE, CP, and the transition to a low-carbon economy from a regional perspective. It analyzes the causes of heterogeneity from aspects such as the market, environmental regulations, technological research and development, industrial structure, energy consumption structure, and government competition. Although previous studies have recognized the significant impact of technological progress on regional environmental performance in the context of REIT, this impact is particularly pronounced in promoting the reduction in CEs and the transition to a low-carbon economy. It is challenging to provide a more relevant and comprehensive factual basis for a holistic analysis of the impact of REIT on CP across different regions and the formulation of related policies. The research conclusions do not fully depict the mechanism by which REIT impacts CP. Addressing these shortcomings, the novelty and contribution of this paper lie in integrating REIT and CP into a unified analytical framework from the perspective of spatial spillover, investigating the spatial heterogeneity of REIT’s impact on CP across different economic regions, and exploring potential reasons for such variations. The aim is to deepen the understanding of REIT’s role in enhancing CP in different regions, providing scientific support to policymakers for designing and implementing more effective regionally differentiated low-carbon policies and incentives for technological innovation.

3. Theoretical Analysis and Research Hypothesis

The introduction emphasizes that there is no consensus among scholars regarding the categorization of REIT, an emerging branch of technological innovation research. This paper focuses on carbon emission reduction technologies within the realm of green technology innovation, specifically referring to technological advancements and innovative activities in the development and utilization of RE, including improvements in existing technologies such as solar, wind, hydropower, geothermal energy, and biomass energy. Compared to traditional energy technologies that rely on fossil fuels, these RE technologies share common features: they utilize continuously renewable and almost inexhaustible energy sources and produce significantly lower CEs during use, resulting in relatively lower environmental impacts [10,11]. RE is becoming an increasingly important energy option as technology advances and costs decrease. The term “REIT” describes the creation of new technologies within RE as well as the enhancement of current technologies; these innovations are aimed at lowering prices, increasing energy availability, and improving energy efficiency, all while minimizing their negative effects on the environment. REIT is a key driver of the energy mix transition and has a significant impact on increasing CP. CP, a measure of the carbon efficiency of economic activity, reflects the economic value generated per unit of CE energy. REIT contributes to the enhancement of CP by promoting the improvement in energy efficiency and the reduction in CEs [12,13]. Technological advancements in one region may have an impact on CP in nearby regions, as the spatial Durbin model (SDM) can capture the spatial spillover effects (SE) of REIT across many regions [29]. More precise analysis of the direct and indirect impacts of REIT on CP is possible with SDM. The following theories are put forth by this study in light of the theoretical analysis above:
Hypothesis 1.
REIT positively affects CP.
It is assumed that the REIT can directly increase the CP of the region in which it is located. This is because new and cleaner energy sources are applied, and energy efficiency is typically improved along with technological developments, which lowers the CEs and raises economic efficiency.
Hypothesis 2.
REITs have spatial spillovers.
Based on the SDM, this study further hypothesizes that REIT in a region not only affects CP in the region but also has an impact on neighboring regions. This spatial SE may originate from the dissemination of technological knowledge, interregional energy cooperation, and so on.
Hypothesis 3.
There are three possible channels of REIT’s impact on CP, namely, industrial distribution (ID), degree of openness to the outside world (DOOW), and intensity of environmental regulation (IER).
This study hypothesizes that regional characteristics, such as ID, DOOW, and IER, may moderate the impact of REIT on CP. These characteristics in different regions may affect the efficiency and scope of the application of technological innovations.

4. The Mechanism of the Influence of Renewable Energy Technological Innovation on CP under Spatial Econometric Modeling

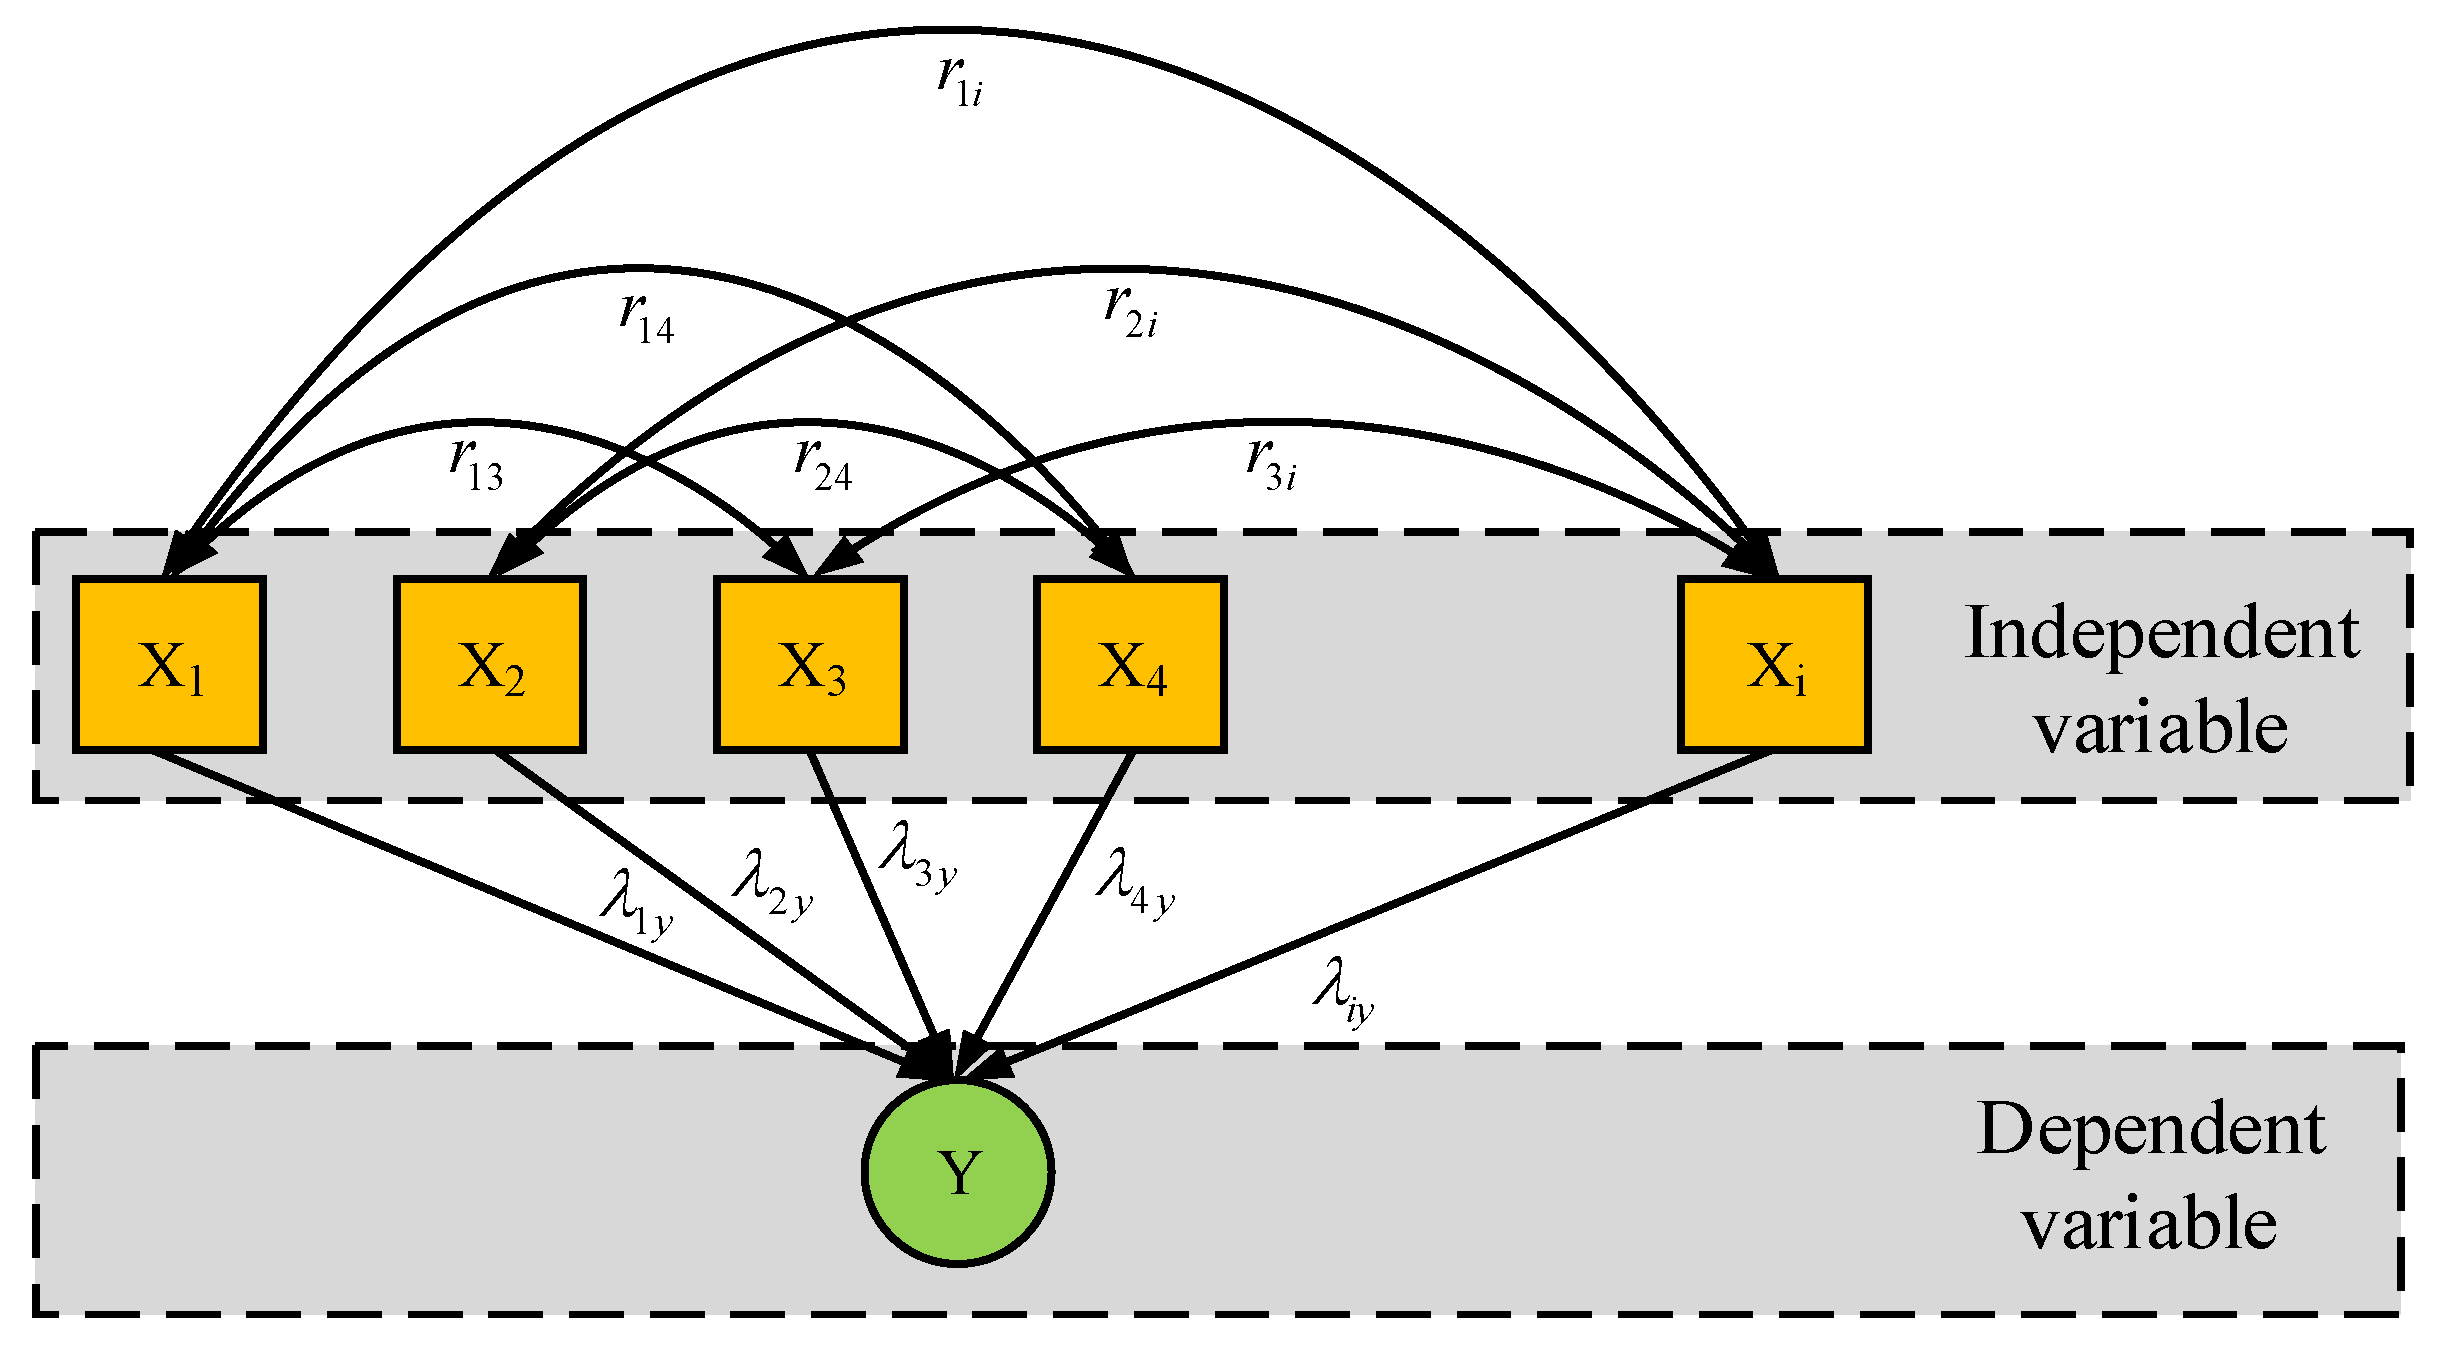
4.1. Methods of Pathway Analysis

Pathway analysis is a statistical analysis method used to study complex causal relationships between variables. This method was first proposed by geneticist Sewall Wright and is mainly used in the fields of social sciences, biology, and economics [30,31]. The fundamental concept of pathway analysis is to visually represent the links between various factors by categorizing them into direct and indirect effects. Generally, the through path analysis will divide the variable relationships into causal and parallel relationships, and its linear equation is shown in Equation (1).
{ λ 1 y + r 12 λ 2 y + r 13 λ 3 y + + r 1 k λ k y = r 1 y r 21 λ 1 y + λ 2 y + r 23 λ 3 y + + r 2 k λ k y = r 2 y r k 1 λ 1 y + r k 2 λ 2 y + r k 3 λ 3 y + + λ k y = r k y
In Equation (1), both k and y denote constants, which take values starting from 1. r k y denotes the correlation coefficient between the dependent variable and the outcome. λ k y denotes the pathway relationship, which is categorized into direct and indirect pathways [32]. Assuming that the independent variable is X i , and the dependent variable is Y , the detailed expressions for direct and indirect pathways are obtained as shown in Equation (2).
{ X 1 Y X 1 X i X 1 X 2 Y X 1 , X 2 X i
In Equation (2), X 1 Y and X 1 X 2 Y denote direct and indirect pathways, respectively. X 1 , X 2 are independent variables. The structure of the pathway is shown in Figure 1.
The independent variables in Figure 1 are the ones in the boxes, and the dependent variables are the ones in the circles. The one-way arrow represents a causal relationship between the variables, pointing from the independent variable to the dependent variable. Bidirectional arrows, on the other hand, indicate a correlation between two variables. Assuming that Y is determined by X i and error, the expression for the dependent variable model is obtained as shown in Equation (3).
Y = X 1 + X 2 + + X i + e
In Equation (3), e denotes the error. Normalization of Equation (3) yields Equation (4).
Y Y ¯ σ Y = P 1 y ( X 1 X ¯ 1 σ 1 ) + P 2 y ( X 2 X ¯ 2 σ 2 ) + + P i y ( X i X ¯ i σ i ) + P e y ( e σ e )
In Equation (4), σ denotes the standard deviation, which varies as σ e when the mean is 0. P 1 y , P 2 y , P i y , P e y all represent the standardized regression coefficients for each of the items, also called the pass-through coefficients. Due to the variety and complexity of the causes of economic change, it is difficult to do an analysis of all the influencing variables. In order to better express the pass-through effect of omitted variables and economic error terms on Y , the concept of residual effect is introduced to explain it, and its expression is shown in Equation (5).
P a = 1 i = 1 k p i r i
In Equation (5), P a denotes the residual effect coefficient, and when the value of this coefficient is less than 0.05, it means that this study included the main variables for analysis. p i and r i denote omitted variables and economic error terms, respectively.

4.2. Identification of CP-Influencing Factors

It was discovered after a thorough examination of related research conducted by others that REIT influences CP in a number of ways in addition to its direct impact [33]. After a detailed analysis of related literature, this study identified several factors that affect CP, including REIT, GDP per capita (GDPPC), energy composition (EC), urbanization level (UL), DOOW, ID, level of foreign investment (LFI), IER, and government support (GS) [34,35]. In order to further analyze how REIT indirectly affects CP through these factors, thus providing theoretical guidance to improve CP and achieve high-quality and sustainable development in the future, this study will utilize the pass-through analysis method in 3.1 to identify the factors influencing REIT’s influence on CP.
CP is usually calculated by comparing economic output with CE, which can be used to measure how much CEs occur in the process of generating a certain amount of economic value, thus reflecting the carbon efficiency of economic activities. The formula for calculating CP is shown in Equation (6).
CP = E1/CE
In Equation (6), E 1 denotes economic output, respectively. Economic output can be measured by GDP. According to the geographic distribution, this study chose to analyze the CP of cities in 30 provinces in China and divided the 30 provinces into eight economic zones, as shown in Figure 2 [36].
In Figure 2, a total of 30 provinces are divided into eight comprehensive economic zones. According to the China Statistical Yearbook, to collect the CEs dioxide information for each province during the 20-year period from 2001 to 2020, the CP trend of the eight economic zones in China can be obtained by utilizing Equation (6), as shown in Figure 3.
In Figure 3, the changes in CP in China’s eight economic regions from 2001 to 2020 are shown. According to the statistical results in Figure 3, it can be found that with the change of time, the current CP of each economic region in China shows a gradual upward trend as a whole. As a result, the CEs and economic development level of each region in China generally show coordinated development. Among the eight economic regions, the southern and eastern coastal economic regions have a greater CP compared to other economic regions. In 2016, the CP of the southern coastal economic zone exceeded 1.0 for the first time, and in 2018, the CP of the eastern coastal economic zone also exceeded 1.0. It can be seen that these two regions have higher GDPs due to CE, and therefore, the low-carbon policies in these two regions are relatively more complete and effective.
In addition to calculating the CP of each province in China during the period from 2001 to 2020, this study also used the database of the State Intellectual Property Office of China to collect the patent data of RE technology in each province, which was calculated as shown in Equation (7) [37,38].
R E I T i t = j = 0 t R P A T i j exp [ β 1 ( t j ) ] { 1 exp [ β 2 ( t j ) ] }
In Equation (7), R E I T i t denotes the total patent data. β 1 and β 2 denote the depreciation rate and diffusion rate, respectively, taking the values of 0.36 and 0.30. t is the time, i denotes the province, and j is the patent type. Considering that it takes a period of time for a patent application to be examined before it is authorized, there will be a long-term difference. Instead of counting the number of patents awarded, this study focused on the patent applications to guarantee the temporal accuracy of the data used and to minimize the lag effect on the model estimation. Figure 4 displays the variations in the quantity of patent applications for RE innovations among the eight economic areas.
Figure 4 shows how the quantity of patent applications for RE innovations has changed across China’s eight economic zones. In Figure 4, the number of patent applications in the northern and eastern coastal economic zones has a large increase over time, while the patent applications in the other six economic zones show a slow growth trend. The level of RE technology in each location is starting to mature when the number of patent applications reaches a particular point and then stays there.
After determining the indicators for the calculation of CP and REIT, this study collects national panel data for the period of 2001 to 2020 for pass-through analysis. GDPPC, EC, UL, DOOW, ID, LFI, IER, and GS were selected as the other variables to obtain the output of the normality test for CP, as shown in Table 1.
In Table 1, the results of both Kolmogorov–Smirnov and Shapiro–Wilk tests in the normality test show that the significance of CP is greater than 0.05, which shows that the CP data do not obey the original hypothesis, and therefore the data set is considered to be normally distributed. The output of CP was obtained by using stepwise regression with the nine variables mentioned above, as indicated in Table 2.
In Table 2, other variables are introduced into the regression equation separately, and it can be found that the correlation coefficient and decision coefficient are gradually becoming larger, which indicates that the progressively added variables are gradually deepening the influence of CP. Model 4 has a correlation coefficient and decision coefficient that are both significantly higher than those of the previous three models—0.998 and 0.996, respectively. This shows that the other variables in Model 4 are more able to reflect the changes in CP, and the final linear regression equation is obtained, as shown in Equation (8).
ln C P = 3.384 + 0.158 ln R E I T + 0.980 ln I D + 0.980 ln D O O W 0.248 ln I E R
In Equation (8), CP, REIT, ID, DOOW, and IER denote the determination of CP, REIT, ID, DOOW, and IER, respectively. Based on Equation (8) and Table 2, the specific coefficient values of each model can be obtained, as shown in Table 3.
The specific correlation coefficients and decision coefficients for the four models are given in Table 3. The values of various coefficients in Model 4 are closer to 1, indicating that the variables selected in Model 4 are more capable of reflecting the changes in CP. The four independent variables, X 1 , X 2 , X 3 , and X 4 , are represented by the letters REIT, ID, DOOW, and IER respectively. Equations (1)–(5) can be used to incorporate these four independent variables, and the result is the pass-through relationship between REIT and the other three influencing factors, as indicated in Table 4.
From Table 4, it can be obtained that the indirect pass-through coefficients of R E I T ( X 1 ) for I D ( X 2 ) , D O O W ( X 3 ) , and I E R ( X 4 ) are 0.368, 0.031, and −0.112, respectively. This shows that REIT can directly promote the growth of CP with a direct pass-through coefficient of 0.598. In addition, the indirect effects of REIT on CP through ID and DOOW are 0.368 and 0.031, respectively, with positive coefficients, which indicate an indirect promotion effect, while REIT has an indirect inhibitory effect on CP enhancement through IER.

4.3. Indicator Selection and Modeling

Considering that different individuals have certain differences in spatial distribution, which can lead to the phenomena of spatial dependence and spatial overflow, this study further builds a spatial measurement model to analyze the spatial influence between the factors. First, the spatial weight matrix is constructed, and its mathematical expression is shown in Equation (9) [39,40].
W = ( w 11 w 1 m w n 1 w n m )
In Equation (9), W denotes the spatial weight matrix. w n m denotes the geographic location relationship between the two regions n and m . Based on the location information of the provinces selected for this research, the 01-neighborhood matrix w n m is constructed, as shown in Equation (10).
w n m = { 1 adjacent 0 not   adjacent
In Equation (10), w n m is denoted as 1 when regions n and m are spatially neighboring, and 0 when they are not. Equation (11) shows the formula for the Morans’ I index, which is used to measure the spatial correlation of a given variable.
M o r a n s I = n = 1 i m = 1 i w n m ( X n X ¯ ) ( X m X ¯ ) S 2 n = 1 i m = 1 i w n m
In Equation (11), S 2 denotes the variable variance. X ¯ denotes the variable mean. X n , X m all denote variables. n = 1 i m = 1 i w n m denotes the sum of all elements in the spatial weights. Equation (12) illustrates how this study’s final spatial measurement model was constructed using SDM based on the pass-through results.
C P i t = ρ 1 W C P i t + φ 1 R E I T i t + ρ 2 W R E I T i t + φ 2 X i t + ρ 3 W X i t + C + v i t + ε i t
In Equation (12), C P i t denotes the explanatory variable CP. R E I T i t denotes the core explanatory variable REIT. X i t denotes the control variables. W C P i t , W R E I T i t , and W X i t denote the spatial lag terms of each variable, respectively. ρ 1 , ρ 2 , and ρ 3 denote the spatial correlation coefficients of each variable, respectively. φ1 and φ2 denote the regression coefficients of each variable, respectively. C is the constant term.

5. Empirical Results on the Impact of Renewable Energy Technology Innovation on CP under SDM

5.1. Spatial Durbin Model Test Results

To further show the spatial autocorrelation of CP, this study was analyzed using Stata 15 software. Additionally, Table 5 displays the spatial association of CP among provinces for the years 2001 to 2020.
In Table 5, the CPM IMoran values of each province are greater than 0 from 2001 to 2020. Additionally, starting in 2003, there was a considerable positive geographical autocorrelation of CP between each province, as evidenced by the drastically varied Morans’ I values of each province. Table 6 displays the results of each spatial model’s LM test.
In Table 6, the four tests of LM-lag, Robust LM-lag, LM-error, and Robust LM-error were conducted simultaneously and found to be significant at the 1% level, which shows that the SDM should be selected for analysis. Furthermore, the results of the Wald, LR, and Hausman tests are significant at the 1% level, suggesting that the SDM does not degenerate into a spatial error model and a spatial lag model.

5.2. Results of Descriptive Statistics

The estimation of each variable in the model further yields the double-fixed space Durbin estimation of the model, as shown in Table 7.
In Table 7, the coefficients of the core explanatory variables and the spatial lag term of CP are both significant at the 1% level and take positive values, which shows that CP has spatial auto-correlation and there will be an effect between CPs between places. REIT has a favorable promotion of CP and spatial SEs, as evidenced by the significant results of its spatial lag term and core explanatory variables at the 1% and 5% levels, respectively. Since the spatial lag term of REIT is 0.161, the CP of this province will be boosted by 0.161% with each 1% increase in REIT in other provinces. Possible reasons are that CP is driven by technological progress, enhances economic output, achieves a sustainable economy, and exhibits regional differences. Within the research interval, there is a large-scale international capacity transfer and technological upgrading, coupled with the advantage of renewable energy technology utilization in economically developed areas, which allows REIT to generate SE through economic relations and geographical linkages, causing spatial spillover effects on CP in neighboring provinces.
The direct decomposition effect and indirect decomposition effect of REIT on CP are demonstrated in Table 8. Table 8 displays significant results for the direct, indirect, and total decomposition effects of REIT at the 1%, 5%, and 1% levels, respectively. The direct decomposition coefficient of REIT is 0.146, which thus indicates that a 1% increase in REIT in a specific province increases local CP by 0.146%. The indirect decomposition coefficient of REIT is 0.189, which thus indicates that a 1% increase in REIT in a specific province increases local CP by 0.189%, which includes 0.161% of the surrounding provinces, i.e., there is a feedback effect of 0.028. In summary, REIT not only directly promotes the growth of CP in specific provinces but also indirectly promotes further growth of CP through the increase in REIT in neighboring provinces. The possible reason is that, within the research interval, technological innovation in one area can spread to other areas through mechanisms such as ID, DOOW, and IER. The interrelated economic activities among provinces and the competitive attractiveness among regions can lead to the spatial flow of technology and capital, accelerating the promotion and application of RE technology. This, in turn, raises the level of RE in neighboring provinces and further promotes the increase in CP within the region through spatial SEs.

5.3. Endogeneity Test Results

The robustness and endogeneity test results of the REIT were measured in terms of patents in order to further demonstrate the stability of the empirical analysis’s findings. The regression test was conducted using a double-fixed Durbin model, and the robustness test results were obtained as shown in Table 9.
In Table 9, the regression results of the double-fixed Durbin model show that the regression coefficient of REIT for CP is positive, and the REIT with spatial lag term added is also significant at the 5% level, which can further illustrate that REIT has a robust and positive facilitating effect and spatial SE on CP.
The final endogeneity test findings are obtained, and the variables to be examined are the lagged one and two periods of REIT in Table 10. In Table 10, the estimation of lagged one-period REIT and lagged two-period REIT can effectively alleviate the endogeneity problem of the model, which shows that the effect of lagged REIT on CP is still significant. In summary, changes in REIT (whether increases or decreases) have a sustained impact on CP. The possible reason is that, considering the lag in the diffusion, application, and economic benefit realization of technological innovations, the innovation and application of renewable energy technologies, policy support, and market acceptance of renewable energy technologies all change over time. Lagged one-period and lagged two-periods within the research interval can capture the long-term impact and persistence of the cumulative effects of REIT on CP.

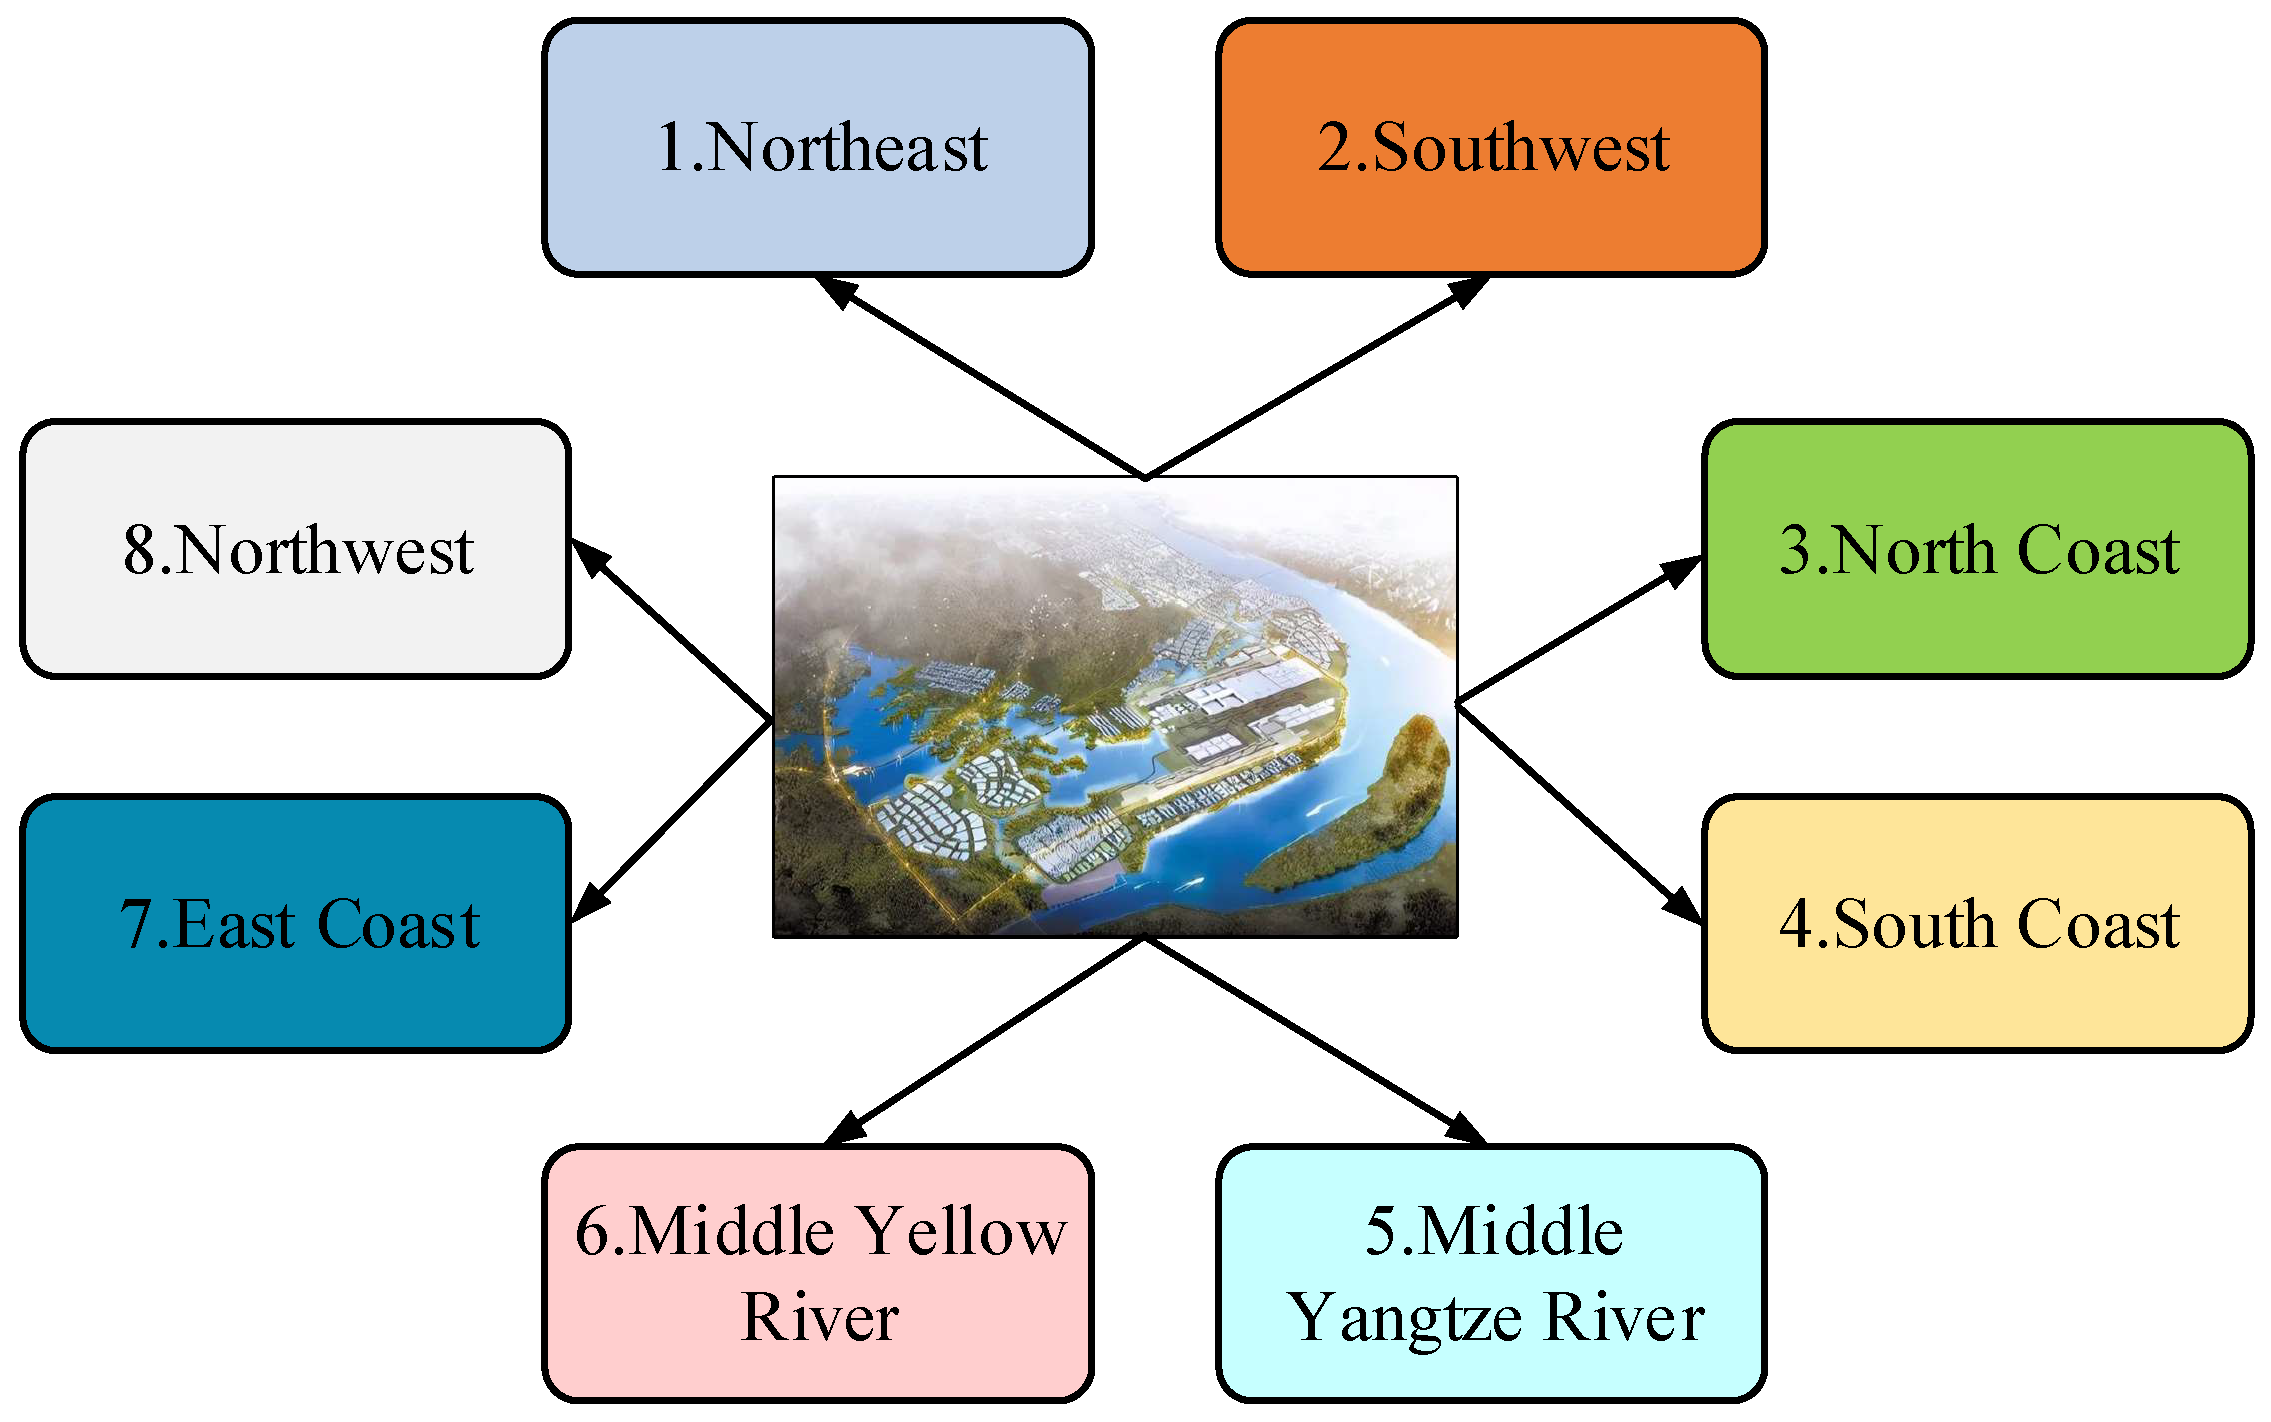
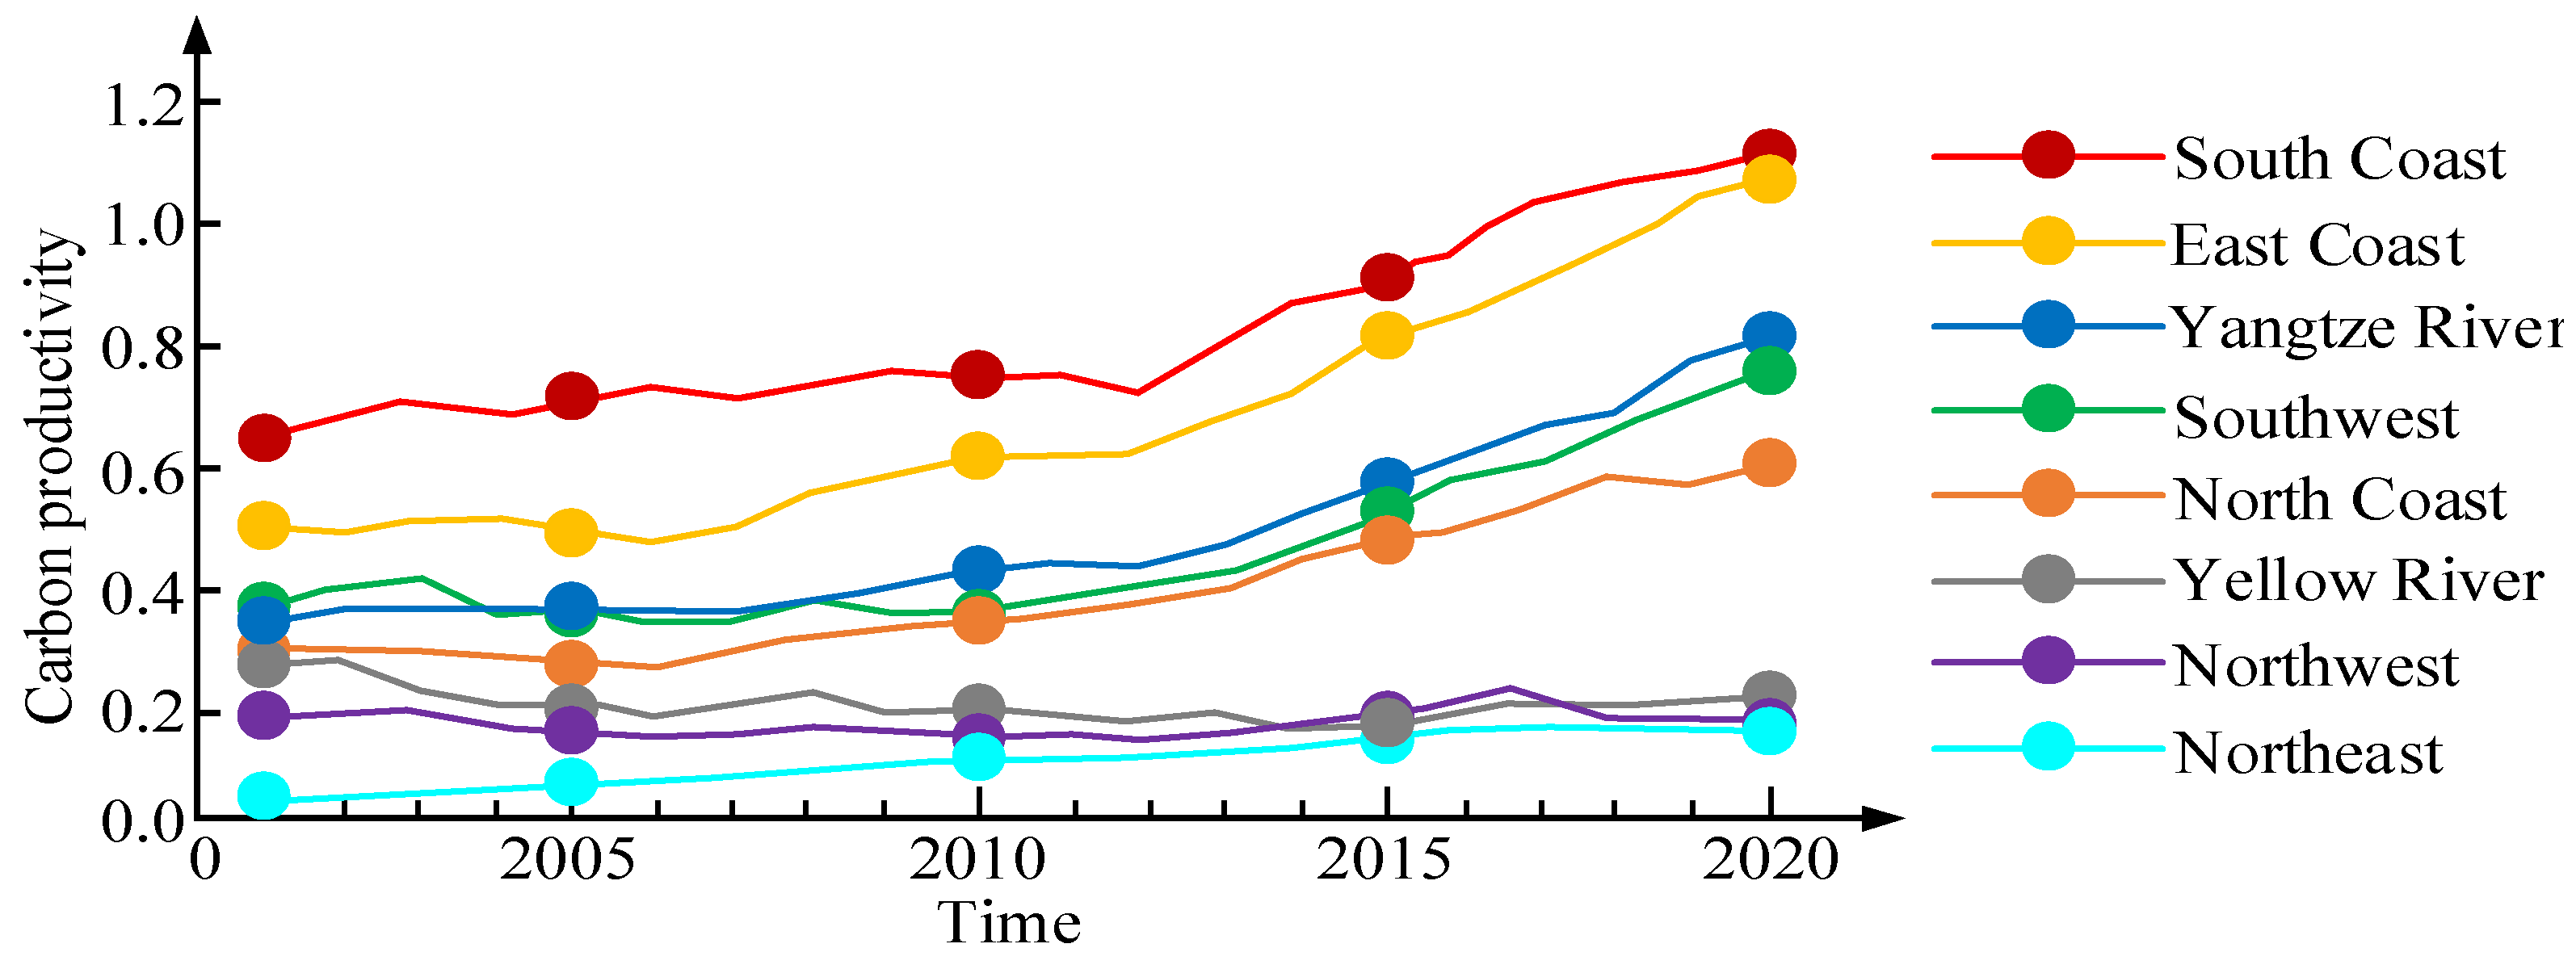
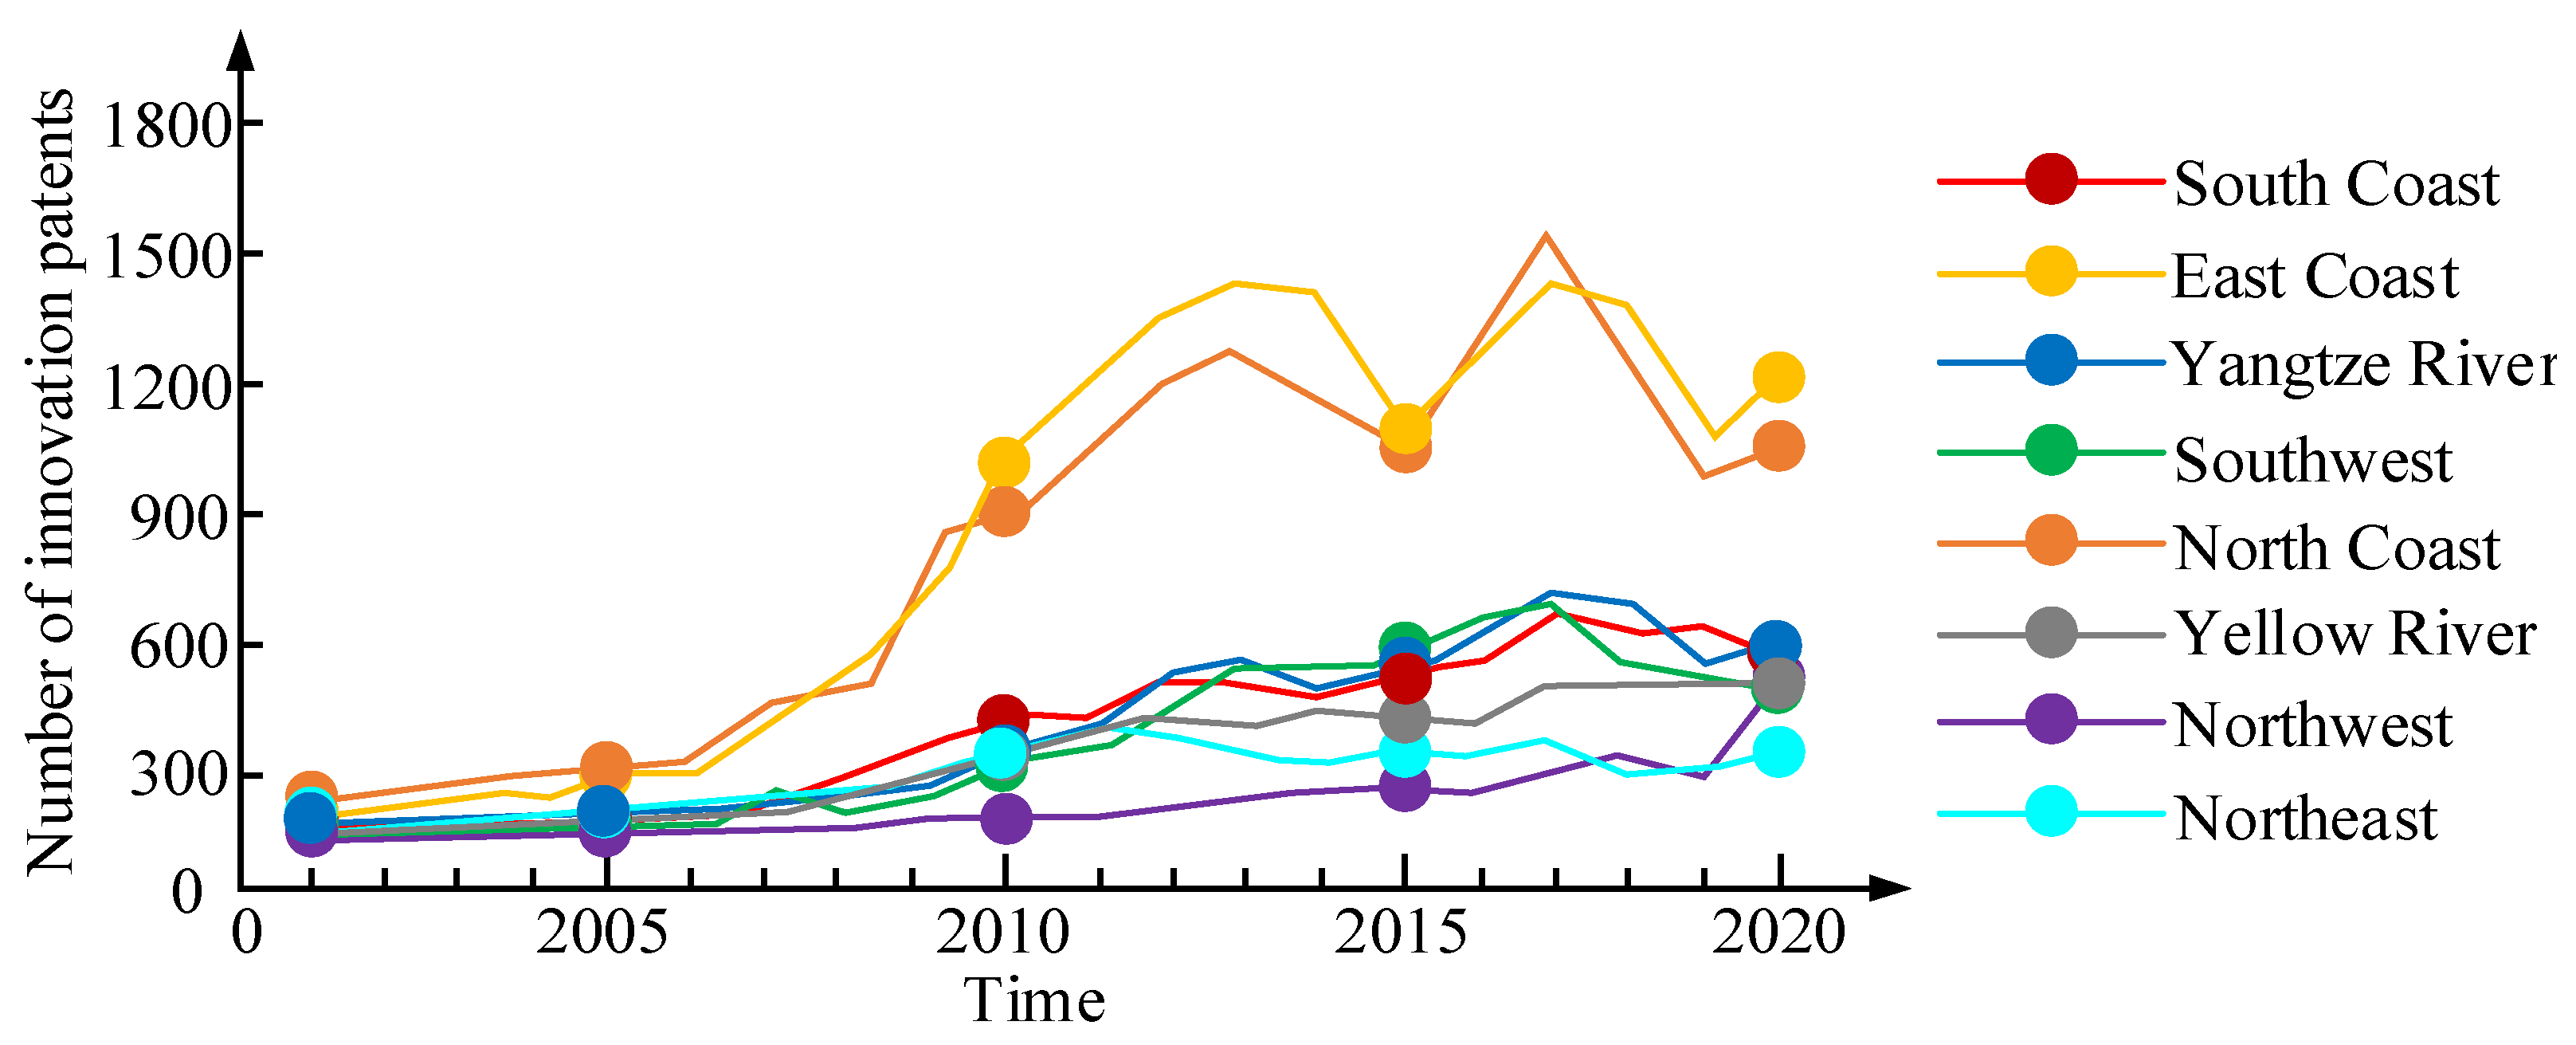
5.4. Heterogeneity Analysis Results

This study uses double-fixed SDM to estimate the mechanism of the impact of REIT on CP for each of the eight economic areas in order to analyze the mechanism of the influence of various economic regions on CP. The results of the heterogeneity analysis obtained are displayed in Table 11.
In Table 11, REIT in the eight regions can have different impacts on CP, of which REIT in the five regions of Northeast, Southwest, North Coast, East Coast, and Middle Reaches of the Yangtze River can show different levels of significance on CP, while in the three regions of Northwest, South Coast, and Middle Reaches of the Yellow River, it is not significant. This shows that REIT in the five regions of the Northeast, Southwest, North Coast, East Coast, and Middle Reaches of the Yangtze River can promote CP. Among them, the REIT in the North Coast and East Coast regions has a stronger spatial SE on CP. In contrast, the three regions of the Northwest, South Coast, and Middle Yellow River have a weak level of REIT; thus, the spatial SE of REIT on CP is not obvious enough.
Possible reasons include that the five regions of the Northeast, Southwest, North Coast, East Coast, and Middle Reaches of the Yangtze River have higher levels of economic development, more advanced infrastructure, a stronger industrial base, more robust policy support, and more financial investment. These factors collectively promote the implementation of renewable energy projects and the application of new technologies. They boost the development and application of REIT, effectively enhancing CP. The North Coast and East Coast regions, with higher levels of high-tech industry development, have greater openness and connections to international markets, making it easier to attract domestic and foreign investments, technology, and high-end talent. Enterprises and research institutions in these areas have more R&D investments and achievements in renewable energy technology, energy efficiency improvement, and low-carbon technologies. This accelerates the innovation and application of renewable energy technology, resulting in a stronger spatial spillover effect of REIT on CP.
In addition, there are differences in the impact of UL, GDPPC, GS, EC, LFI, and other factors on CP across regions, which is due to the inconsistency of the actual situation in each region. UL has a positive impact on CP in the Northeast, North Coast, East Coast, and South Coast regions; GDPPC has a positive impact on CP in six regions: Northeast, Northwest, Southwest, North Coast, South Coast, and the Middle Yellow River; GS has a positive impact on CP in the North Coast and East Coast regions; EC has a positive impact on CP in five regions: Northwest, North Coast, East Coast, South Coast, and the Middle Yellow River; and LFI has a positive impact on CP in five regions: Northwest, Southwest, South Coast, Middle Yellow River, and the Middle Reaches of the Yangtze River. These differences are due to the unique conditions of each region.
The possible reasons are as follows: (1) The higher level of UL in the Northeast, North Coast, East Coast, and South Coast regions includes improved infrastructure, public services, energy efficiency, and waste management systems. This often leads to a shift in the industrial structure towards higher value-added and lower carbon emissions, creating a favorable environment for industrial upgrading. This agglomeration effect can enhance production efficiency and innovation capacity in these four regions, thereby increasing CP. (2) The Northeast, Northwest, Southwest, North Coast, South Coast, and Middle Yellow River regions have higher GDPPC, indicating a higher level of economic development and living standards. This means that additional resources can be allocated for research and development and the adoption of clean energy technologies in these six regions, leading to an improvement in CP. (3) The North Coast and East Coast regions have strong GS, with financial subsidies, tax incentives, policy guidance, and increased investment in renewable energy, all aimed at promoting the use of low-carbon technologies and practices and enhancing CP. (4) The Northwest, North Coast, East Coast, South Coast, and Middle Yellow River regions are shifting their EC towards cleaner sources, such as solar and wind energy. This transition helps to reduce dependence on fossil fuels, lower CE, and increase CP. (5) The regions of the Northwest, Southwest, South Coast, Middle Yellow River, and the Middle Reaches of the Yangtze River have higher LFI. This attracts advanced technology and management experience, promoting technology transfer and knowledge spillover. As a result, the energy efficiency and innovation capacity of local enterprises are enhanced, thereby improving CP.

6. Conclusions and Policy Implications

6.1. Conclusions

This study incorporates renewable energy technology innovation and carbon productivity into a unified analytical framework from the perspective of spatial spillover, using national and provincial panel data from 2001 to 2020. Through theoretical and empirical analysis, it explores the relationship between technological innovation and carbon productivity in the context of renewable energy, as well as the role of innovation across different economic regions, aiming to provide a basis for formulating regionally differentiated low-carbon policies. Many valuable conclusions are drawn, as follows:
(1) The analytical validation of the spatial Durbin model clarified that renewable energy innovation technologies have a significant positive promotion effect on carbon productivity. This study of indirect and direct effects found that the indirect effect of renewable energy innovation technologies on carbon productivity is larger than its direct effect, revealing a significant spatial spillover effect.
(2) Significant differences in the impact of renewable energy innovation technologies on carbon productivity were found among different economic regions. Renewable energy innovation technologies in the eight regions can have different impacts on carbon productivity, of which renewable energy innovation technologies in the five regions of Northeast, Southwest, North Coast, East Coast, and Middle Reaches of the Yangtze River can show different levels of significance on carbon productivity, while those in the three regions of Northwest, South Coast, and Middle Reaches of the Yellow River are not significant.
(3) The main channels through which renewable energy innovation technologies affect carbon productivity include the three main factors of industrial distribution, degree of openness to the outside world, and intensity of environmental regulation.
(4) Innovation in renewable energy technologies significantly increased carbon productivity. The coefficients of lnREIT-Direct, lnREIT-Indirect, and lnREIT-Total were 0.146, 0.189, and 0.325, respectively, and the local carbon productivity increased by 0.146%, 0.189%, and 0.325% when renewable energy technology innovation increased by 1% under the three coefficients, respectively.
(5) The optimization of industrial structure also positively affects carbon productivity through technological innovation, showing a positive channel effect.
On average, the results obtained are consistent with the existing literature. Additionally, this study provides novel and convincing evidence, which is crucial for emerging countries like China to achieve carbon neutrality. It will facilitate the Chinese government departments in formulating targeted regionally differentiated low-carbon policies, promoting and implementing action plans for dual carbon goals in a targeted manner, and helping provide theoretical and empirical references for developing countries to promote environmentally friendly and coordinated development.

6.2. Policy Implications

We propose the following policy recommendations, mainly from the perspective of developing countries choosing governments as facilitators.
First, the government should formulate and implement renewable energy policies based on local conditions to enhance the spatial spillover effects of renewable energy technology innovation on carbon productivity. Specific measures can include the following: (1) Implement policies and provide benefits to enhance mechanisms for talent attraction and development, with the goal of creating a dynamic and innovative human resource pool to drive technological innovation and industrial advancement. (2) Speed up urbanization by improving urban planning and infrastructure development to enhance the quality of life and economic vitality of urban residents while ensuring environmentally sustainable city growth. Optimize the investment environment and strengthen international cooperation to attract more foreign investment and promote diversified economic development, with the goal of further enhancing the per capita gross domestic product and levels of foreign direct investment. (3) Improve policy support by providing fiscal subsidies, tax incentives, research and development inputs, and facilitating market access. This will provide a solid foundation of support for businesses and innovative activities.
Second, the government should optimize the current industrial structure and promote innovation in renewable energy technologies. Relevant departments ought to establish laws and regulations to limit carbon emissions. Specific measures that can be taken include: (1) the government should optimize the current industrial structure and strongly support key industries that bring long-term sustainable benefits to economic development, such as high technology, green energy, and environmental industries. It should also increase investment in research and development and promote breakthroughs in renewable energy technologies, including but not limited to solar, wind, biomass, and other new energy technologies, to improve energy utilization efficiency and the overall competitiveness of the economy. (2) The government aims to coordinate development and resource protection by actively promoting the use of new and renewable energy sources. This will be achieved through optimizing factors and energy structures. Government departments will gradually phase out high-pollution, high-energy-consuming traditional industries through policy guidance and financial support. Sufficient incentives will be provided to encourage businesses and individuals to reduce reliance on fossil fuels and shift towards cleaner, more sustainable energy usage methods. (3) In order to effectively implement these policies and measures, it is necessary to establish a multi-stakeholder monitoring and evaluation mechanism. This mechanism should include government agencies, industry associations, research institutions, and public representatives, who will jointly oversee progress in reducing carbon emissions and promoting and applying renewable energy technologies. This will ensure the achievement of policy objectives.

Author Contributions

Investigation, Y.W. and X.C.; Writing—original draft, X.C.; Writing—review & editing, Y.W.; Supervision, Y.W. All authors have read and agreed to the published version of the manuscript.

Funding

This research received no external funding.

Institutional Review Board Statement

Not Applicable.

Informed Consent Statement

Not Applicable.

Data Availability Statement

Data are contained within the article.

Conflicts of Interest

The authors declare no conflict of interest.

References

  1. Mperejekumana, P.; Shen, L.; Zhong, S.; Muhirwa, F.; Gaballah, M.S.; Nsigayehe, J.M.V. Integrating climate change adaptation into water-energy-food-environment nexus for sustainable development in East African Community. J. Clean. Prod. 2024, 434, 140026. [Google Scholar] [CrossRef]
  2. Jiang, H.-D.; Pradhan, B.K.; Dong, K.; Yu, Y.-Y.; Liang, Q.-M. An economy-wide impacts of multiple mitigation pathways toward carbon neutrality in China: A CGE-based analysis. Energy Econ. 2024, 129, 107220. [Google Scholar] [CrossRef]
  3. Hu, Z.; Yu, B.; Daigo, I.; Tan, J.; Sun, F.; Zhang, S. Circular economy strategies for mitigating metals shortages in electric vehicle batteries under China’s carbon-neutral target. J. Environ. Manag. 2024, 352, 120079. [Google Scholar] [CrossRef] [PubMed]
  4. Ren, X.; Yang, W.; Jin, Y. Geopolitical risk and renewable energy consumption: Evidence from a spatial convergence perspective. Energy Econ. 2024, 131, 107384. [Google Scholar] [CrossRef]
  5. Ba, Z.; Zhao, Y.C.; Liu, X.; Li, G. Spatio-temporal dynamics and determinants of new energy policy diffusion in China: A policy citation approach. J. Clean. Prod. 2022, 376, 134270. [Google Scholar] [CrossRef]
  6. Xu, Z.; Wang, X.; Wu, G. Exploring the coupling relationship of industrial agglomeration and low-carbon economy considering spatiotemporal differentiation: An empirical study in China’s construction machinery industry. Front. Eng. Manag. 2023, 10, 285–299. [Google Scholar] [CrossRef]
  7. Ullah, K.; Abbas, S.; Tariq, M.; Mahmood, N.; Kaechele, H. The symmetric and asymmetric impacts of green energy, eco-innovation, and urbanization in explaining low-carbon economy for Pakistan. Environ. Sci. Pollut. Res. 2023, 30, 33375–33395. [Google Scholar] [CrossRef]
  8. Yang, X.; Jia, Z.; Yang, Z. Effect mechanism of intellectual property rights protection on city-level CO2 emissions in China: A spatial econometric perspective. Environ. Eng. Sci. 2022, 39, 178–192. [Google Scholar] [CrossRef]
  9. Karimi, A.N.; Ahmadi, S.M.T.; Nazeer, N.; Zangoei, S.; Dehdar, F. The role of renewable energy consumption on environmental degradation in EU countries: Do institutional quality, technological innovation, and GDP matter? Environ. Sci. Pollut. Research. Knowl. Data Eng. 2023, 30, 44607–44624. [Google Scholar] [CrossRef]
  10. Tiangui, L.; Hu, H.; Zhang, X.; Hualin, X.; Wang, L.; Shufei, F. Spatial spillover effects of urbanization on carbon emissions in the Yangtze River Delta urban agglomeration, China. Environ. Sci. Pollut. Res. 2022, 29, 33920–33934. [Google Scholar] [CrossRef]
  11. Guo, Z.; Chen, S.S.; Yao, S.; Mkumbo, A.C. Does foreign direct investment affect SO2 emissions in the Yangtze River Delta? A spatial econometric analysis. Chin. Geogr. Sci. 2021, 31, 400–412. [Google Scholar] [CrossRef]
  12. Panzera, D.; Postiglione, P. The impact of regional inequality on economic growth: A spatial econometric approach. Reg. Stud. 2022, 56, 687–702. [Google Scholar] [CrossRef]
  13. Safdar, S.; Khan, A.; Andlib, Z. Impact of good governance and natural resource rent on economic and environmental sustainability: An empirical analysis for South Asian economies. Environ. Sci. Pollut. Res. 2022, 29, 82948–82965. [Google Scholar] [CrossRef]
  14. Meng, S.; Sun, R.; Guo, F.; Deng, Y. The mechanism of renewable energy consumption, technological innovation and carbon productivity-an empirical study of Chinese data. Environ. Sci. Pollut. Res. 2023, 30, 20673–20687. [Google Scholar] [CrossRef] [PubMed]
  15. Yang, Y.; Wu, D.; Xu, M.; Yang, M.; Zou, W. Capital misallocation, technological innovation, and green development efficiency: Empirical analysis based on China provincial panel data. Environ. Sci. Pollut. Res. 2022, 29, 65535–65548. [Google Scholar] [CrossRef] [PubMed]
  16. Hasanov, F.J.; Khan, Z.; Hussain, M.; Tufail, M. Theoretical framework for the carbon emissions effects of technological progress and renewable energy consumption. Sustain. Dev. Knowl. Data Eng. 2021, 29, 810–822. [Google Scholar] [CrossRef]
  17. Dunyo, S.K.; Odei, S.A.; Chaiwet, W. Relationship between CO2 emissions, technological innovation, and energy intensity: Moderating effects of economic and political uncertainty. J. Clean. Prod. 2024, 440, 140904. [Google Scholar] [CrossRef]
  18. Zhao, X.; Xu, H.; Yin, S.; Zhou, Y. Threshold effect of technological innovation on carbon emission intensity based on multi-source heterogeneous data. Sci. Rep. 2023, 13, 19054. [Google Scholar] [CrossRef] [PubMed]
  19. Dabuo, F.T.; Du, J.; Madzikanda, B.; Coulibaly, P.T. Influence of research and development, environmental regulation, and consumption of energy on CO2 emissions in China-novel spatial Durbin model perspective. Environ. Sci. Pollut. Res. 2023, 30, 29065–29085. [Google Scholar] [CrossRef] [PubMed]
  20. Gan, T.; Zhou, Z.; Li, S.; Tu, Z. Carbon emission trading, technological progress, synergetic control of environmental pollution and carbon emissions in China. J. Clean. Prod. 2024, 442, 141059. [Google Scholar] [CrossRef]
  21. Li, R.; Wang, Q.; Guo, J. Revisiting the Environmental Kuznets Curve (EKC) Hypothesis of Carbon Emissions: Exploring the Impact of Geopolitical Risks, Natural Resource Rents, Corrupt Governance, and Energy Intensity. J. Environ. Manag. 2024, 351, 119663. [Google Scholar] [CrossRef]
  22. Wang, Z.; Yang, Z.; Zhang, Y.; Yin, J. Energy technology patents—CO2 emissions nexus: An empirical analysis from China. Energy Policy 2012, 42, 248–260. [Google Scholar] [CrossRef]
  23. Lin, B.; Zhu, J. The role of renewable energy technological innovation on climate change: Empirical evidence from China. Sci. Total Environ. 2019, 659, 1505–1512. [Google Scholar] [CrossRef]
  24. Segbefia, E.; Dai, B.; Adotey, P.; Sampene, A.K.; Amoako, T.; Lamptey, C. Renewable energy, technological innovation, carbon emission, and life expectancy nexus: Experience from the NAFTA economies. Environ. Sci. Pollut. Res. 2023, 30, 108959–108978. [Google Scholar] [CrossRef]
  25. Raihan, A.; Muhtasim, D.A.; Khan, M.N.A.; Pavel, M.I.; Faruk, O. Nexus between carbon emissions, economic growth, renewable energy use, and technological innovation towards achieving environmental sustainability in Bangladesh. Clean. Energy Syst. 2022, 3, 100032. [Google Scholar] [CrossRef]
  26. Xin, L.; Sun, H.; Xia, X. Renewable energy technology innovation and inclusive low-carbon development from the perspective of spatiotemporal consistency. Environ. Sci. Pollut. Res. 2023, 30, 20490–20513. [Google Scholar] [CrossRef] [PubMed]
  27. Yang, M.; Wang, D.; Chen, X.; Lei, X.; Cao, L. Influence mechanism of technological innovation of electric power industry on carbon emission reduction in China. Int. J. Clim. Change Strateg. Manag. 2023, 15, 232–246. [Google Scholar] [CrossRef]
  28. Xu, Y.; Ge, W.; Liu, G.; Su, X.; Zhu, J.; Ran, Q. The impact of local government competition and green technology innovation on economic low-carbon transition: New insights from China. Environ. Sci. Pollut. Res. 2023, 30, 23714–23735. [Google Scholar] [CrossRef] [PubMed]
  29. Haque, M.I. Oil price shocks and energy consumption in GCC countries: A system-GMM approach. Environ. Dev. Sustain. Knowl. Data Eng. 2020, 23, 9336–9351. [Google Scholar] [CrossRef]
  30. Wang, Z.; Wang, X.; Liang, L. Green economic efficiency in the Yangtze River Delta: Spatiotemporal evolution and influencing factors. Ecosyst. Health Sustain. 2019, 5, 20–35. [Google Scholar] [CrossRef]
  31. Hu, H.; Lv, T.; Zhang, X.; Xie, H.; Fu, S.; Geng, C.; Li, Z. Spatiotemporal heterogeneity and decoupling decomposition of industrial carbon emissions in the Yangtze River Delta urban agglomeration of China. Environ. Sci. Pollut. Res. 2023, 30, 50412–50430. [Google Scholar] [CrossRef]
  32. Liu, Y.; Han, Y. Impacts of urbanization and technology on carbon dioxide emissions of yangtze river economic belt at two stages: Based on an extended stirpat model. Sustainability 2021, 13, 7022. [Google Scholar] [CrossRef]
  33. Zhao, Q.; Yan, Q.; Tian, J.; Wang, H. Low-carbon economy transformation performance evaluation and spatial trends in China: A provincial aspect. Greenh. Gases Sci. Technol. 2019, 9, 886–904. [Google Scholar] [CrossRef]
  34. Yu, S.; Hu, X.; Zhang, X.; Li, Z. Convergence of per capita carbon emissions in the Yangtze River Economic Belt, China. Energy Environ. 2018, 30, 776–799. [Google Scholar] [CrossRef]
  35. Li, X.; Han, L.; Yang, L.; Zhang, T. Green Development Efficiency and Spatial Characteristics of Urban Clusters: A Case of Yangtze River Delta City Cluster. Emerg. Mark. Financ. Trade 2023, 59, 1993–2007. [Google Scholar] [CrossRef]
  36. Wang, L.J.; Yang, P.L.; Ma, J.J.; Zhu, Z.N.; Tian, Z.H. Digital economy and industrial energy efficiency performance: Evidence from the city of the Yangtze River Delta in China. Environ. Sci. Pollut. Res. 2023, 30, 30672–30691. [Google Scholar] [CrossRef]
  37. Zhang, B.; Yin, J.; Jiang, H.; Qiu, Y. Spatial–temporal pattern evolution and influencing factors of coupled coordination between carbon emission and economic development along the Pearl River Basin in China. Environ. Sci. Pollut. Res. 2023, 30, 6875–6890. [Google Scholar] [CrossRef] [PubMed]
  38. Wu, Z.; Zhao, Y.; Zhang, N. A Literature Survey of Green and Low-Carbon Economics Using Natural Experiment Approaches in Top Field Journal. GLCE 2023, 1, 2–14. [Google Scholar] [CrossRef]
  39. Chen, D.; Hu, W.; Li, Y.; Zhang, C.; Lu, X.; Cheng, H. Exploring the temporal and spatial effects of city size on regional economic integration: Evidence from the Yangtze River Economic Belt in China. Land Use Policy 2023, 132, 106770. [Google Scholar] [CrossRef]
  40. Ling, X.; Gao, Y.; Wu, G. How Does Intensive Land Use Affect Low-Carbon Transition in China? New Evidence from the Spatial Econometric Analysis. Land 2023, 12, 1578. [Google Scholar] [CrossRef]
Figure 1. Diagram of the through-hole structure.
Sustainability 16 02100 g001
Figure 2. Structure of the eight economic zones.
Sustainability 16 02100 g002
Figure 3. Changes in carbon productivity in the eight economic regions.
Sustainability 16 02100 g003
Figure 4. Changes in the number of patent applications for renewable energy innovations in the eight economic regions.
Sustainability 16 02100 g004
Table 1. Results of the normality test for carbon productivity.
TypeIndicatorsCPlnCP
Kolmogorov–SmirnovStatistical value0.1530.137
Degree of freedom2020
Significance0.2110.211
Shapiro–WilkStatistical value0.9260.952
Degree of freedom2020
Significance0.0920.262
Table 2. The output of CP was obtained using nine variables.
ModelVariableBetatpPartial Correlation
1REIT0.48111.8600.0010.956
DOOW0.3632.7780.0140.568
LFI−0.261−2.6810.017−0.556
IER0.3024.5160.0000.749
GS0.1311.3240.2070.315
GDPPC−0.119−0.3910.703−0.101
UL−0.078−0.3510.659−0.093
2LFI0.1412.7970.0030.582
DOOW0.049−0.8110.4280.198
IER−0.151−2.5220.016−0.543
GS0.0631.7260.1120.401
GDPPC−0.083−0.7810.458−0.121
UL0.3362.5560.0230.548
3LFI−0.013−0.0590.965−0.024
IER−0.157−3.5520.002−0.686
GS0.0421.0930.2850.271
GDPPC0.1271.1690.2760.297
UL0.2642.3920.0310.535
4LFI0.0150.1290.1000.043
GS0.0250.6010.5610.169
GDPPC0.1331.6830.1180.419
UL0.0240.0770.9500.027
Table 3. Each model specific coefficient values results.
ModelCorrelation CoefficientDecision CoefficientAdjusted Decision CoefficientStandard Error
10.9440.8820.8760.114
20.9850.9870.9850.046
30.9950.9920.9890.030
40.9980.9960.9950.033
Table 4. Pathway relationships between impact factors.
VariableTotal ImpactDirect Passage CoefficientIndirect Passage CoefficientDecision-Making Factor
I D ( X 2 ) D O O W ( X 3 ) I E R ( X 4 ) Total Indirect Flux Coefficient
R E I T ( X 1 ) 0.8850.5980.3680.031−0.1120.2870.872
Table 5. Spatial association results of CP among provinces from 2001 to 2020.
YearsIMoranp
20010.1200.094
20020.1290.083
20030.1420.045
20040.3710.001
20050.3940.001
20060.4180.000
20070.3720.000
20080.3920.000
20090.3920.000
20100.3760.000
20110.3940.000
20120.3800.000
20130.3850.001
20140.3570.000
20150.3550.000
20160.3320.001
20170.3200.001
20180.3250.000
20190.3420.001
20200.3510.000
Table 6. LM test results.
ItemTest Datap
LM-lag78.4310.000
Robust LM-lag0.1420.008
LM-error117.7130.000
Robust LM-error39.4250.000
Hausman15.960.003
LR-SDM-SAR85.230.000
LR-SDM-SEM106.570.000
Wald-SDM-SAR18.680.001
Wald-SDM-SEM28.770.000
Table 7. Double-fixed space Durbin estimation results.
VariableCore Explanatory VariablesSpatial Lag Terms
CP0.791 ***0.324 ***
0.0000.000
REIT0.141 ***0.161 **
0.0000.002
UL−1.752 ***0.546
0.0000.241
GDPPC0.830 ***−0.675 *
0.0000.041
GS−0.186 ***0.275 ***
0.0000.000
EC0.0250.126
0.3510.381
LFI0.101 ***0.136 ***
0.0000.001
Variance-σ0.117 ***/
0.000/
Observations600600
R-squared0.2480.248
Number of mun3030
Note: At the 10%, 5%, and 1% statistical levels, respectively, the variables in the table are indicated by the symbols *, **, and ***.
Table 8. Effect decomposition results.
VariableDirect Decomposition ResultsIndirect Decomposition ResultsTotal Results
REIT0.146 ***0.189 **0.325 ***
0.0000.0410.000
UL−1.757 ***0.388−1.375 ***
0.0000.4310.000
GDPPC0.848 ***−0.613 ***0.246
0.0000.0010.590
GS−0.182 ***0.283 ***0.112
0.0000.0000.312
EC−0.021−0.156−0.173
0.7890.3530.395
LFI0.116 ***0.169 ***0.275 ***
0.0000.0000.000
Note: At the 5% and 1% statistical levels, respectively, the variables in the table are indicated by the symbols ** and ***.
Table 9. Robustness test results.
VariableCore Explanatory VariablesSpatial Lag Terms
REIT0.069 *0.143 **
0.0610.045
UL−1.648 ***0.986 **
0.0000.033
GDPPC0.781 ***−0.889 **
0.0000.001
GS−0.162 ***0.315 ***
0.0100.000
EC−0.019−0.147
0.9250.341
LFI0.098 ***0.095*
0.0000.062
Sigma2-e0.118 ***/
0.000/
Observations600600
R-squared0.2420.242
Number of mun3030
Note: At the 10%, 5%, and 1% statistical levels, respectively, the variables in the table are indicated by the symbols *, **, and ***.
Table 10. Endogeneity test results.
VariableFirst-Stage Core Explanatory VariablesSecond Stage Explanatory Variables
Lagged one-period REIT0.998 ***/
0.000/
Lagged two-period REIT/0.195 ***
/0.000
Control variable constant−0.113−1.691 ***
0.2150.000
F-value295.68/
Adj R-squared0.9160.154
Sample size570570
Note: At the 1% statistical levels, the variables in the table are indicated by the symbol ***.
Table 11. Results of heterogeneity analysis.
VariablesNortheastNorthwestSouthwestNorth CoastalEast CoastalSouth CoastalMiddle Yellow RiverMiddle Reaches of the Yangtze River
REIT0.077 *0.0980.134 ***0.041 *0.088 ***0.1950.0890.041 *
WREIT0.119 **0.0810.195 ***0.113 **0.163 ***0.2470.0740.128 *
UL3.276 ***−12.101 ***−3.601 ***2.230 ***0.113 ***3.238−2.514 ***−2.285 *
GDPPC2.752 ***9.950 **1.341 ***2.259−0.829 ***7.066 ***2.080 ***−1.298
GS−0.235 ***−0.275−0.601 ***0.0420.101 ***−0.458 **−0.062−0.126
EC−0.1481.691 ***−0.940 ***0.196 ***0.212 ***0.713 ***0.113−0.352 ***
LFI−0.0340.161 *0.153 ***−0.051−0.071 ***0.4750.294 ***0.284 ***
Variance—σ0.001 ***0.075 ***0.015 ***0.001 ***0.001 ***0.035 ***0.009 ***0.003 ***
N60801008060608080
R20.8210.0230.0170.4330.5510.0130.0100.651
Note: *, **, and *** in the table indicate that the variable is significant at the 10%, 5%, and 1% statistical levels, respectively.
Disclaimer/Publisher’s Note: The statements, opinions and data contained in all publications are solely those of the individual author(s) and contributor(s) and not of MDPI and/or the editor(s). MDPI and/or the editor(s) disclaim responsibility for any injury to people or property resulting from any ideas, methods, instructions or products referred to in the content.

