1. Introduction
Hydrogen is widely regarded as an ideal fuel due to its environmentally friendly nature and heating value higher than conventional fuels [
1]. Hydrogen storage and transportation systems can be categorized into three primary groups: material-based, physical-based, and chemical-based methods. Material-based methods include physical absorption (physisorption) and chemical absorption (hydrides). Although considered safe, these methods lack the storage performance required for large-scale storage and transportation [
2,
3]. Physical-based methods involve storing hydrogen in its natural state without relying on chemical reactions or sorbent materials. This category encompasses hydrogen compression, hydrogen liquefaction, and two-phase storage systems of cryo-compression and slush hydrogen. Among all, compressed gas storage is the most widely used method globally, constituting 80% of all hydrogen refueling stations, followed by liquid storage [
4]. Two prevalent chemical-based methods for hydrogen storage are methanol and ammonia. Methanol boasts a superior volumetric energy density and lower toxicity than ammonia. This positions methanol as a highly favorable choice as an energy carrier, complementing the use of liquid hydrogen [
5].
Therefore, an alternative for hydrogen liquefaction for energy transportation is the reaction of purified hydrogen with CO
2 to convert it into liquid methanol [
6,
7], which offers advantages such as a higher liquefaction temperature, enhanced safety, and the ability to reduce CO
2 concentrations in the atmosphere [
8,
9]. This makes methanol a safer and more cost-effective energy carrier, eliminating the need for expensive hydrogen liquefaction processes [
8,
10].
The hydrogen produced in many processes is not pure, limiting its diverse applications [
11,
12]. Several hydrogen purification methods have been developed to address this, with the cryogenic method being recognized as one of the most effective options for large-scale recovery [
13].
In a recent study, which is the reference paper for the presented research [
14], a novel method was devised to simultaneously achieve multiple objectives: producing methanol at a rate of 4.74 tons per hour, generating 297.7 kW of electricity, and yielding 35.73 tons of hot water per hour. This comprehensive process involved components like a hydrogen purification system, regenerative organic Rankine cycle (ORC), absorption–compression refrigeration cycle (ACRC), and the integration of parabolic solar troughs.
The primary focus of the previous study was addressing safety concerns linked to hydrogen storage and transport by converting it to methanol for efficient long-distance energy transportation. The heat generated by the methanol reactor was effectively recovered using the ORC and ACRC processes, with added thermal power from parabolic solar troughs in the methanol distillation tower. The integrated structure’s thermal efficiency was 78.14%, while the liquid methanol production cycle exhibited 60.91% efficiency.
The thorough evaluation included energy, exergy, and sensitivity analyses. Notably, the mixture temperature of H2 and LP fuel gas before separation emerged as a critical parameter affecting hydrogen purity in the methanol reactor, resulting from the sensitivity analysis in the reference paper.
The cryogenic process, with the highest recovery rate for hydrogen, offered lower purity than other methods. Efforts in the field have been geared toward minimizing the cryogenic method’s energy consumption due to its high energy use and purification cost [
15].
Research has been performed focusing on optimizing the required heat, power generation and consumption, economic costs, efficiencies, and environmental friendliness of industrial processes as one of the promising methods used in economic assessments of thermally integrated processes [
16,
17,
18]. Multi-objective optimization using a combination of neural networks and genetic algorithms of Non-dominated Sorting Genetic Algorithm-II (NSGA-II) has been widely used in related studies, with decision-making methods (e.g., fuzzy, LINMAP, and TOPSIS) to find final optimal data from the analysis.
In recent research, a novel approach was introduced to produce portable and environmentally friendly liquid methanol from coke oven gas and exhaust gas emanating from power plants [
16]. The method encompasses several components, including a CO
2 capture unit aimed at separating carbon dioxide from the exhaust gases, a process for purifying and liquefying natural gas to generate liquefied natural gas (LNG), and a cycle for methanol production. Utilizing the Annualized Cost of the Structure (ACS) methodology for economic assessment yielded noteworthy results for the payback period and a prime cost for the manufactured methanol. Integrating the non-dominated sorting genetic algorithm into the thermo-economic optimization of the hybrid system, accompanied by decision-making facilitated by the TOPSIS and LINMAP methods, led to the determination of optimal parameters.
Ghorbani et al. introduced an optimal thermally integrated process designed for hydrogen storage, aiming for net-zero CO
2 emissions [
19]. Utilizing fuel cells to mitigate carbon dioxide emissions and simultaneously fulfill heat and power requisites for hydrogen production and liquefaction under elevated temperatures is a central facet of this approach. The enhancement of investment return periods and efficiencies was achieved through the synergistic amalgamation of genetic algorithms and artificial intelligence methodologies, ensuring optimal outcomes. Within multi-objective optimization, a trio of decision-making methodologies were harnessed to guide the process effectively.
In a previous study, an industrial methanol plant was modeled in Aspen Plus and optimized in Matlab to enhance carbon capture endeavors [
20]. Considering the design parameters and capital costs, aided by a sensitivity analysis, led to generating response surfaces by varying bagasse for energy cogeneration. The objective was to boost the net present value while curbing CO
2 emissions across scenarios. Mathematically, chemical process synthesis becomes a multi-objective optimization task involving mixed integer nonlinear programming (moMINLP), encompassing economic and environmental factors. This study employed the ε-constraint method, translating one objective into an extra constraint and solving iteratively across epsilon values. The intricate optimization was successfully tackled with the enhanced scatter search (eSS) technique.
Taghdisian et al. introduced an eco-design approach for fostering the sustainable advancement of methanol production, executed by applying a multi-objective optimization model centered around CO
2 efficiency [
21]. Upon conducting an inventory analysis via life cycle assessment, it became evident that carbon dioxide emerged as the primary emission from methanol production. Hence, the multi-objective model was structured to concurrently maximize methanol production and minimize CO
2 emissions, ultimately yielding a set of Pareto-optimal solutions. The multi-objective model was transformed into a singular objective optimization problem using the weighted product method to streamline the process into a single optimal solution. The ensuing task of identifying the optimal single point was successfully accomplished by employing a genetic algorithm.
Another study aimed to enhance bio-methanol production from sugar cane bagasse through pyrolysis, primarily focusing on maximizing output [
22]. Employing experimental data, a robust model describing bio-methanol yield was developed using the fuzzy logic technique. Subsequently, the Particle Swarm Optimization (PSO) algorithm was applied to pinpoint optimal operating parameter values for maximizing bio-methanol output. The parameters under control encompassed the reaction temperature, reaction time, and nitrogen flow. The outcomes revealed a strong alignment between the fuzzy model and experimental data, surpassing predictions from an artificial neural network (ANN) model employed earlier. Building upon this model, the particle swarm optimizer achieved a notable enhancement of 20% in the bio-methanol yield compared to the experimental baseline.
Dehghani et al. undertook an extensive investigation encompassing steady-state simulations of a Radial Flow Gas-Cooled Reactor and a Radial Flow Gas-Cooled Membrane Reactor [
23]. The central aim of their study was to enhance the process of CO
2 removal during methanol synthesis. By employing the NSGA-II, the research adopted a two-pronged optimization approach. The primary objectives were twofold: maximizing the methanol production rate while ensuring optimal selectivity. In order to identify the ultimate Pareto-optimal solution, the research employed decision-making techniques such as TOPSIS, LINMAP, and Shannon’s Entropy. Of particular note, Shannon’s Entropy emerged as the frontrunner with the lowest deviation index, resulting in impressive enhancements of 78.3% for CO
2 removal and 10.77% for methanol production rates.
In a particular investigation, a novel electro-thermochemical process leveraging industrial flue gas thermal energy and wind turbines was conceptualized for the dual purposes of CO
2 absorption and hydrogen storage via methanol, formic acid, and ammonium bicarbonate [
24]. The validity, verification, and exploration of sensitivities were supplemented by the integration of a multi-objective optimization methodology combining a hybrid neural network and a genetic algorithm, thereby facilitating an all-encompassing evaluation of the proposed system. The requisite objective functions, decision variables, and constraints for the optimization phase were elucidated through a meticulous sensitivity analysis. Multiple multi-criteria decision assessment techniques were employed to prioritize and select the optimal point from the available Pareto set. Subsequently, energy and exergy efficiencies were computed using the TOPSIS/LINMAP methods, while the power consumption, energy, and exergy efficiencies under optimal operating conditions were determined using the Bellman–Zadeh approach.
Ghahraloud et al. [
25] undertook an investigation centered around the modeling and optimization of the methanol oxidation process utilizing an iron-molybdenum oxide catalyst within a fixed bed reactor. With a focus on achieving both formaldehyde production capacity and selectivity, the study approached it as a multi-objective optimization challenge. The problem formulation involved considering feed and coolant temperatures, along with the air-to-methanol ratio, as pivotal decision variables. The non-dominated multi-objective genetic algorithm facilitated the derivation of a Pareto-optimal front by integrating a developed mathematical process model and a multi-objective optimization model. Subsequently, the TOPSIS decision-making method was employed to select the singular optimal point from the comprehensive optimal Pareto front.
The primary objective of this study is to assess economically and optimize the initial design delineated in the reference paper [
14]. While the reference paper primarily concentrated on the innovative design, energy, exergy, and sensitivity analyses, the present study seeks to appraise the economic viability of the design through economic analysis. Additionally, this study aims to optimize the integrated structure both thermodynamically and economically utilizing a multi-objective optimization method. This involves a comprehensive analysis of the key parameters that exert the most significant influence on the performance of the original design. This study aims to focus on efficiency optimization and optimize the return period of investment using data resulting from a sensitivity analysis and within the context of economic implications.
In addressing the imperative of sustainable development, this study strives to significantly contribute to environmental stewardship by optimizing the economic viability and thermodynamic efficiencies of the integrated process for liquid methanol production, aligning with the broader goals of sustainability in the energy storage.
2. A Brief Description of the Process under Study
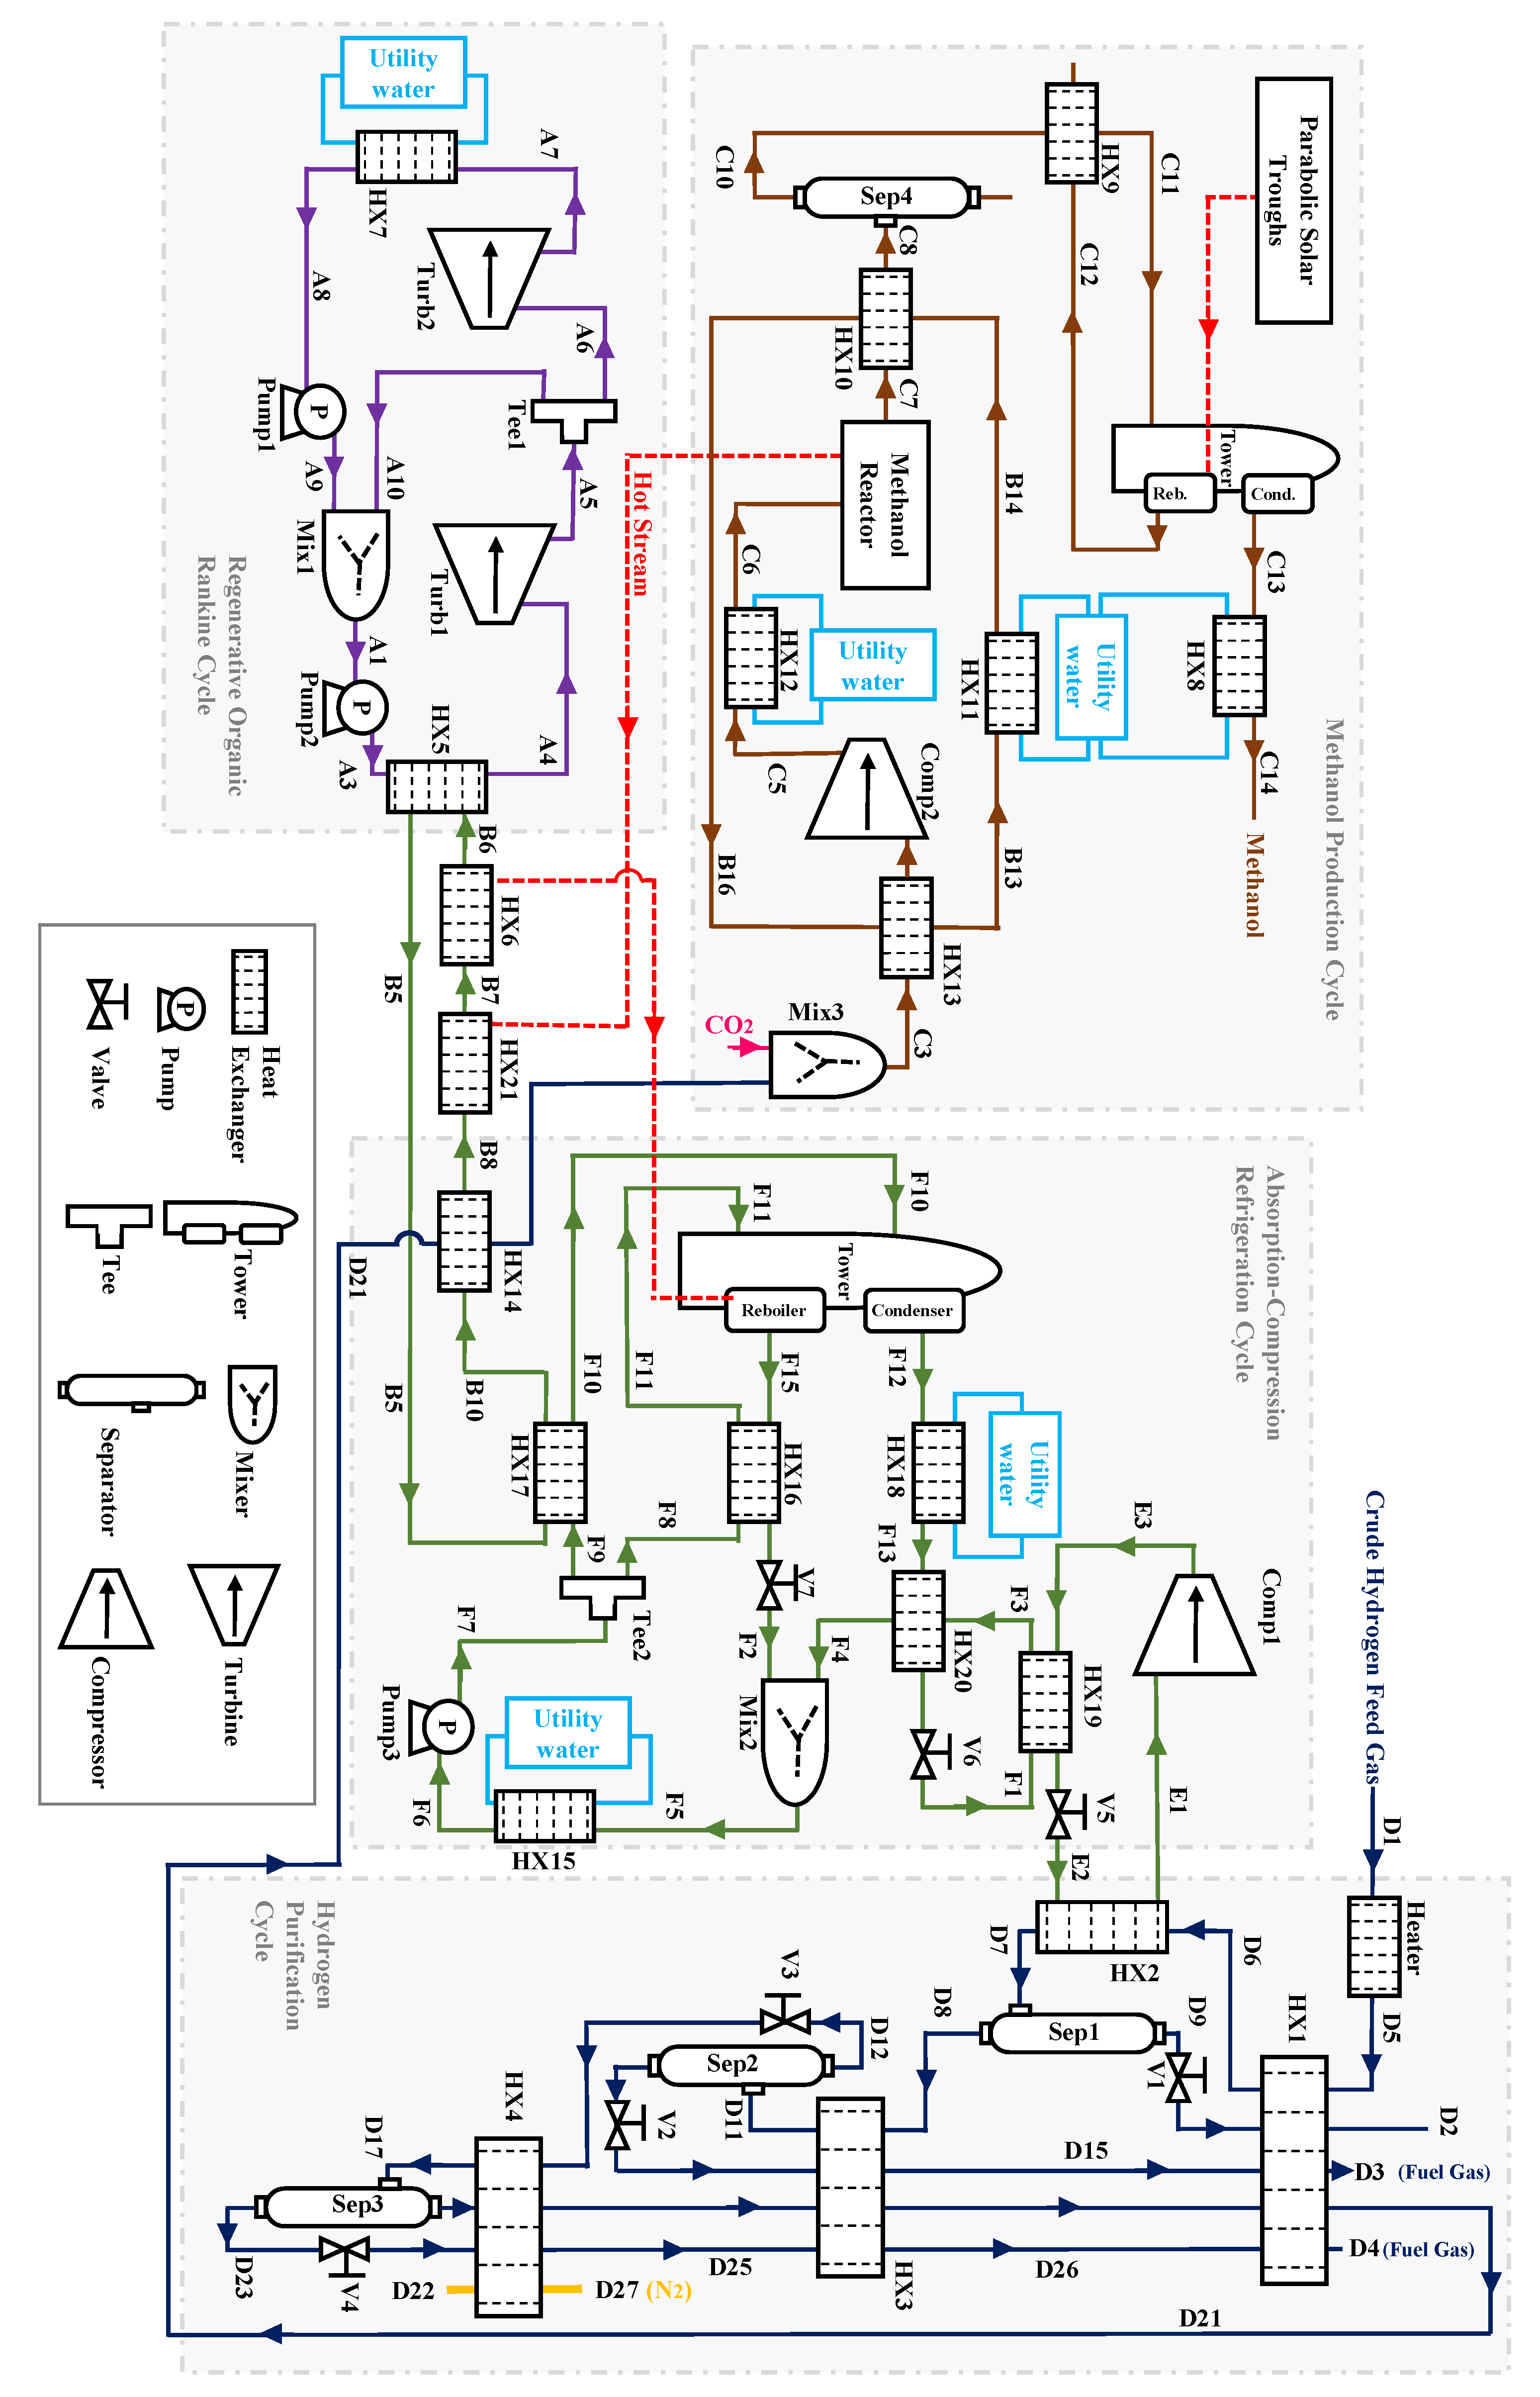
In the referenced article, an integrated structure was developed to generate methanol, heating, and power. The system included various sub cycles of the organic Rankine cycle, solar troughs, the liquid methanol generation system, the cryogenic cycle to purify H
2, and an absorption–compression refrigeration cycle. The block flow diagram (BFD) corresponding to the overall process is shown in
Figure 1 [
14].
The process started with a crude hydrogen stream with 55% molar purity for hydrogen and 39% for methane. The absorption compression refrigeration cycle (ACRC) provided precooling in the purification cycle. In a flash drum, stream D17 separated into stream D23 with methane in a liquid phase (95.08% mol) and stream D18 of H2 (88.5% mol).
The ACRC played a critical role in precooling the cryogenic hydrogen purification cycle. It consisted of various elements, including a generator to separate ammonia and water, a purifier to remove the remaining water droplets from ammonia, a condenser for ammonia liquefaction, an evaporator for cycle cooling by CO2 evaporation, and an absorbent for water absorption in ammonia. A CO2 ACRC cycle also provided cooling for the process at −42 °C. In the methanol generation cycle, after mixing hydrogen with CO2, the temperature and pressure were raised to 200 °C and 50 bar, respectively. Subsequently, the C6 stream entered the plug flow methanol reactor. The methanol production process was exothermic, and its waste heat was recovered in two other cycles, including the ACRC cycle for thermal power generation and the ORC cycle to produce electricity. For harnessing solar energy, parabolic troughs were designed as thermal collectors, collecting 3435 kW of thermal power from the sun to support the methanol reactor temperature, operating within the required temperature range of 200 °C. By incorporating cogeneration systems in this integrated structure, the efficiency was improved, and equipment requirements were reduced compared to individual subsystems working independently. The consolidated system received a flow of 6.6 tons/h of carbon dioxide and 10 tons/h of crude hydrogen, 3.4 kW of thermal energy from parabolic troughs, and 19.6 kW of cooling via liquid nitrogen. The system yielded 4.7 tons/h of liquid methanol, 297.7 kW of net electricity, and 35.7 tons/h of heated water. The byproducts encompassed low-pressure and high-pressure fuel gases along with aromatic compounds. The ORC harnessed excess heat from the methanol reactor, resulting in 475 kW of power generation, while the ACRC cycle furnished 25 kW of cooling for hydrogen purification. The outcomes demonstrated a 98 percent efficiency in extracting hydrogen from the initial crude feed during the purification phase.
3. Economic Analysis Methodology
The economic evaluation of the process relies on the Annualized Cost of the Structure (ACS) approach. The essential factors for determining the optimal setup include the investment’s returns period, the net annual benefit, and the electricity’s prime cost. The ACS method involves calculating the total design costs depending on the technical lifespan of the entire system. To find the values used in the ACS of the designed process, the following equation is utilized [
26]:
represents the cost of annualized maintenance and
represents the cost of annualized replacement.
and
are the annualized operating and capital prices of the process. The project’s useful life is considered twenty years, and the replacement price for the components is omitted. For calculating the price of the components, the chemical engineering plant cost index (CEPCI) can be implemented as follows [
27,
28]:
Here,
and
are considered the cost index and components’ cost. The following equation can calculate the annualized capital cost for components considered in the plant’s lifespan [
29]:
where
is the capital recovery factor. The real interest rate and the project’s useful life are represented as
and
, respectively. The nominal interest rate can be calculated by the following relation [
30,
31]:
∂, representing the nominal interest rate, and
, symbolizing the annual inflation rate, serve as pivotal factors in financial assessments. The calculation of the net present value in the prime year (NPV) follows a specific method [
30]:
To calculate the product’s prime cost (PC), the assessment of the operating flow costs (OFCs), volume of product (VOP), and initial investment costs (CCs) is needed, using the equation provided below [
32]:
The determination of the Summary of Product Cost (SOPC) in the market and the computation of the Net Annual Benefit (NAB) follow specific methodologies tailored to the intricate financial dynamics of each metric. By applying these calculated values, businesses gain insights into cost structures and annual financial gains, facilitating informed strategic planning [
32]:
Within the net annual benefit framework, two significant elements, the value-added tax rate (VATR) and income generated from byproduct sales stemming from the referenced process, are incorporated. The economic landscape further unfolds through essential parameters like the rate of return (ROR), the investment period of return (POR), and additive value (AV), each of which finds an attainable definition through specific methodologies. Engaging with these variables generates a comprehensive financial understanding, guiding decision-makers toward effective strategies and informed choices [
32]:
The additive value represents the disparity between the product’s cost and its prime price in the market. This figure has the potential to fluctuate based on the application of a range of up-to-date technologies during the manufacturing procedure.
3.1. Results of Economic Evaluation
An organized methodology is developed through mathematical and thermodynamic analyses aimed at optimizing the efficiency of the liquid methanol storage system. This involves the seamless integration of Aspen HYSYS V10 software, complemented by a MATLAB m-file code. This study examines the impact of methanol and crude hydrogen prices, as well as electricity and fuel gas costs, on key economic parameters. Through an economic analysis, the objective is to evaluate the viability of the design, ensuring a satisfactory return on the investment timeframe. Additionally, a sensitivity analysis on the economic facets of the design aims to ascertain that variations in the market prices of feedstocks, utilities, and products maintain the profit margin within an acceptable range.
The successful integration of thermal processes in various subsystems leads to the elimination of external utility requirements, subsequently resulting in a notable enhancement of the system’s overall efficiency. At the core of the economic assessment of this hybrid system lie critical determinants, including but not limited to the duration necessary for the return on investments, the primary cost associated with electricity, the net annual profits generated, and the initial expenditures required for investment. Within the domain of economic scrutiny, the analysis considers the economic backdrop, entailing factors such as an annual inflation rate set at one percent, a nominal interest rate of 1.5 percent, and a foreseeable operational lifetime spanning twenty years. For a comprehensive understanding of calculating the equipment’s costs utilized within the newly devised framework, valuable and in-depth insights can be sourced from dependable references [
33,
34,
35,
36]. The economic facets of the system are assessed through a meticulous consideration of the scale of the methanol production reactor. After this initial evaluation, an in-depth sensitivity analysis is executed to uncover the intricate ways various parameters exert influence over the system’s size and its associated economic variables. Determining prices for essential elements such as methanol, hydrogen, electrical power, and components is a complex task, heavily swayed by factors ranging from the geographic location to specific applications.
Consequently, the prevailing prices within analogous configurations are embraced as the foundation for a reference to establish a solid baseline for economic scrutiny. Embedded within the ambit of this research is a comprehensive investigation into the repercussions of methanol and crude hydrogen price fluctuations, in conjunction with the fluctuations in electricity and fuel gas costs, meticulously undertaken to ascertain their impact on pivotal economic indicators. The comprehensive results of this intricate economic analysis are presented in
Table 1, affording a lucid exposition of the outcomes yielded by the evaluation process. Based on the average market price of 0.4 USD/kg methanol [
37], the derived outcomes from the analysis provide notable insights: the calculated return period stands at 6.63 years, while the prime price of the product is determined to be 0.15 USD/kg, and a substantial annual net benefit of 9.34 MMUSD is observed. The levelized cost of methanol production for the different natural-gas-based methanol production processes ranges between 0.252 and 0.280 Euro/kg methanol [
38], and a cost parity between renewable and conventional methanol production methods is anticipated in 2032 [
39]. The levelized cost of the product resulting from the present study shows a competitive value compared to the conventional methods.
Sensitivity Analysis
The sensitivity analysis encompasses an in-depth exploration and identification of operational parameters that hold significant sway over the economic efficiency of the evolving system. This analysis also encompasses a comprehensive study of how the designated objective function responds to alterations made to the chosen decision variables. A detailed examination is conducted to ascertain the impact of costs associated with liquid nitrogen, fuel gas, electricity, and methanol on many economic parameters embedded within the system. By extrapolating valuable insights from the results of this rigorous sensitivity assessment, it becomes possible to devise pragmatic strategies to enhance the process of designing and optimizing crucial parameters. This iterative approach enables a refined understanding of the intricate interplay between various elements, paving the way for improved decision-making and a more robust system configuration.
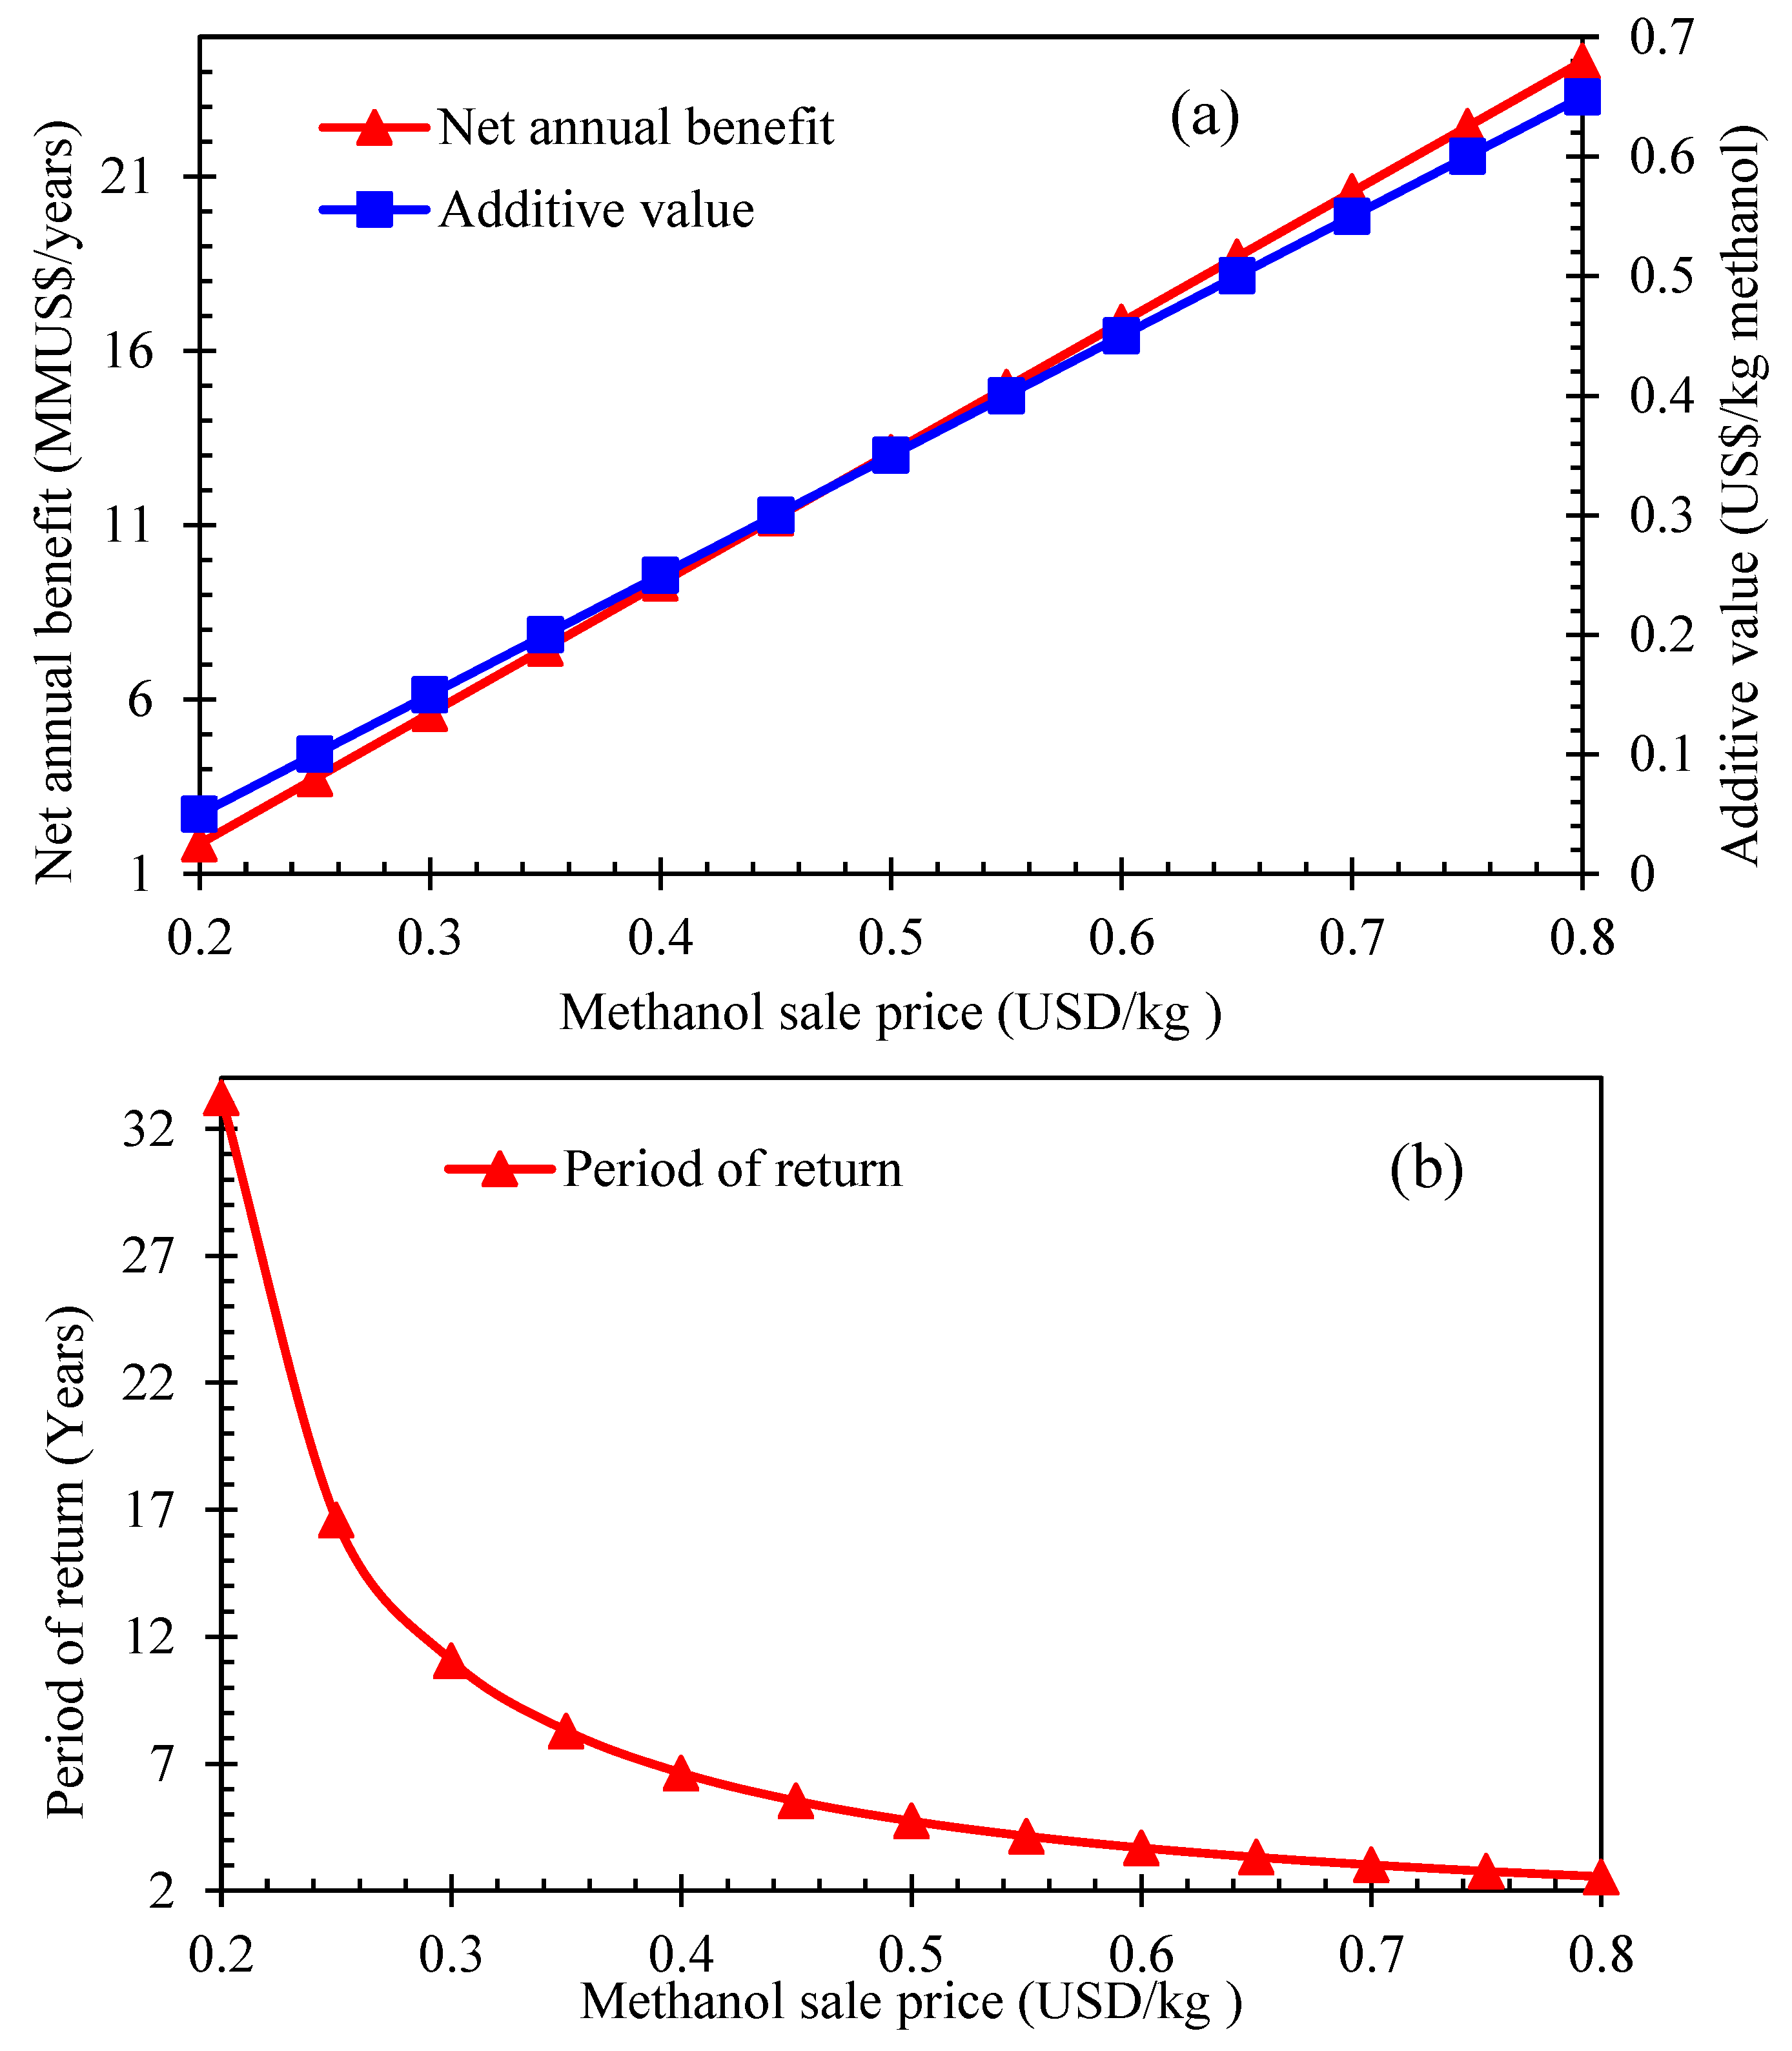
As illustrated in
Figure 2a,b, the produced methanol price in the market has a significant impact on the return period, where an increase in the main product price (liquid methanol) from 0.35 to 0.8 USD/Kg means the period of return exponentially decreases from 8.30 to 2.55 years. This change in the methanol market price has a direct and almost linear relationship with both the additive value and annual net benefit. Quadrupling the price of methanol from 0.2 to 0.8 USD/Kg means that values related to the added value and annual benefit will grow by almost twelve times.
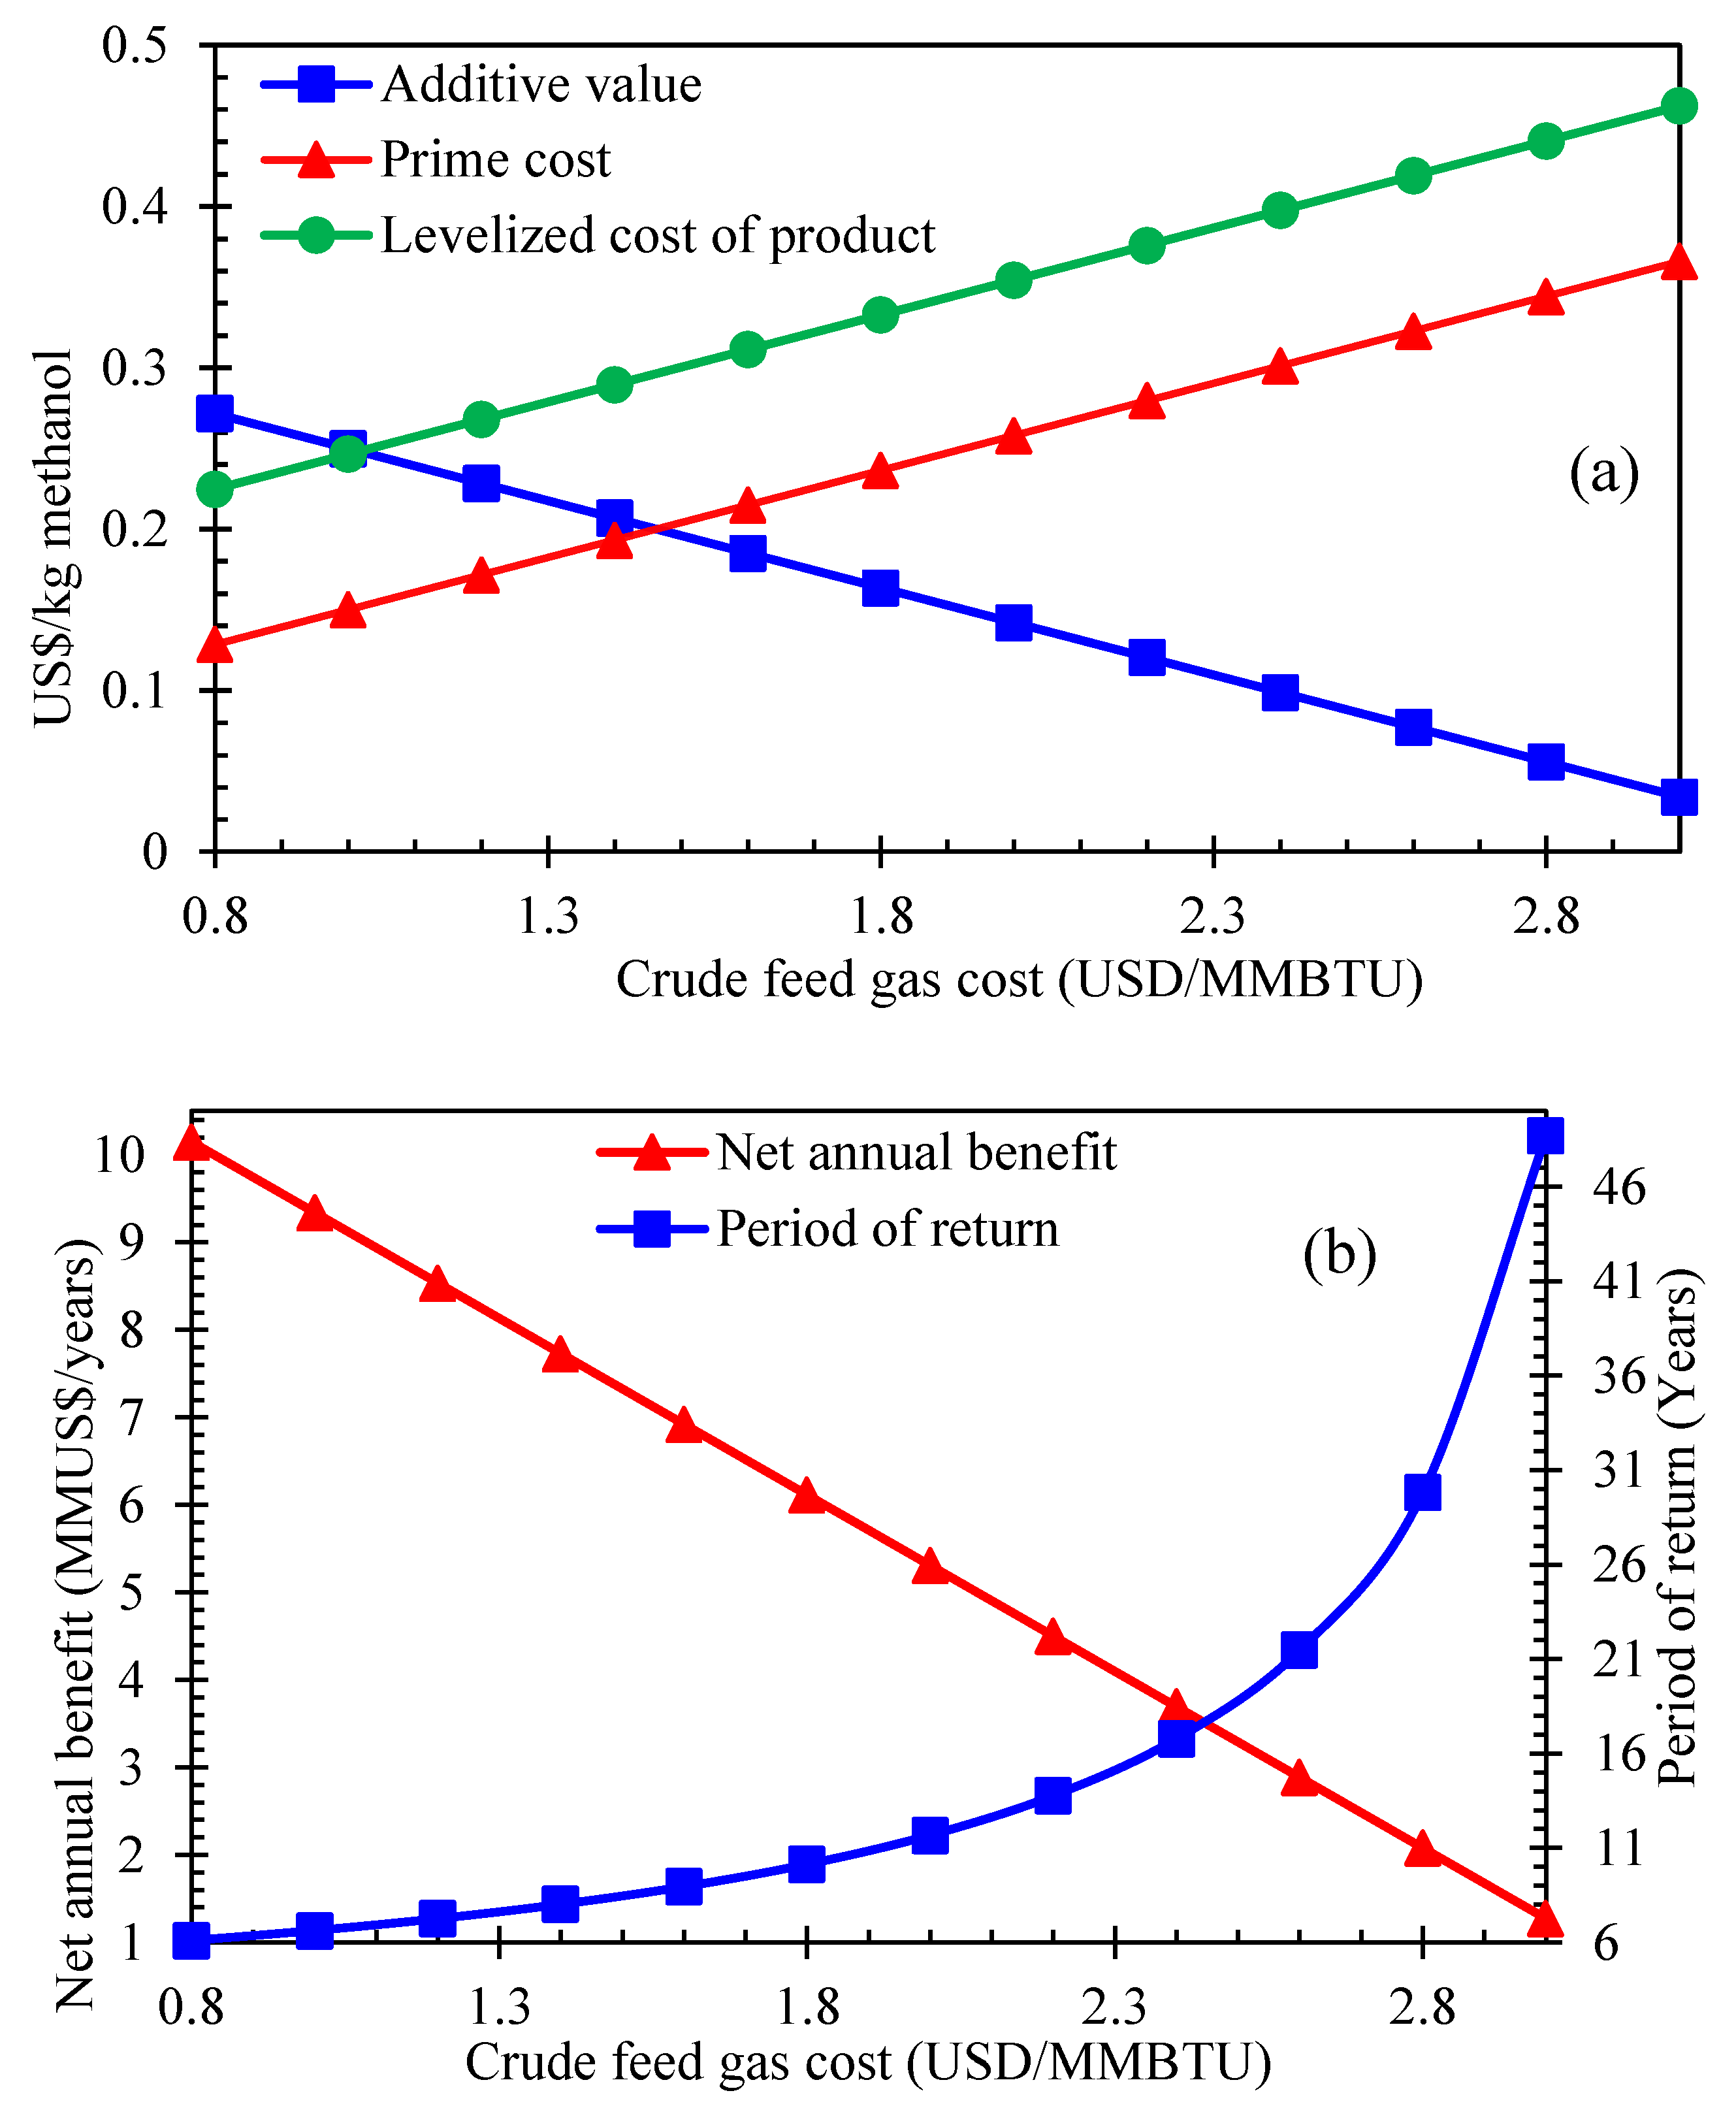
Crude gas containing hydrogen is considered the process’s main feed. Based on the sensitivity analysis results in
Figure 3a,b, a rise in the feed gas price from 0.8 to 3 USD/MMBTU grows the prime and levelized costs from 0.13 to 0.36 and 0.22 to 0.46 USD/kg methanol. However, it lowers the net annual benefits and additive value from 10.15 and 0.271 to 1.273 and 0.034, respectively. When the crude feed gas cost is more than 1.8 USD/MMBTU, the period of return in an exponential trend passes 10 years, which puts the whole project’s cost-effectiveness into question.
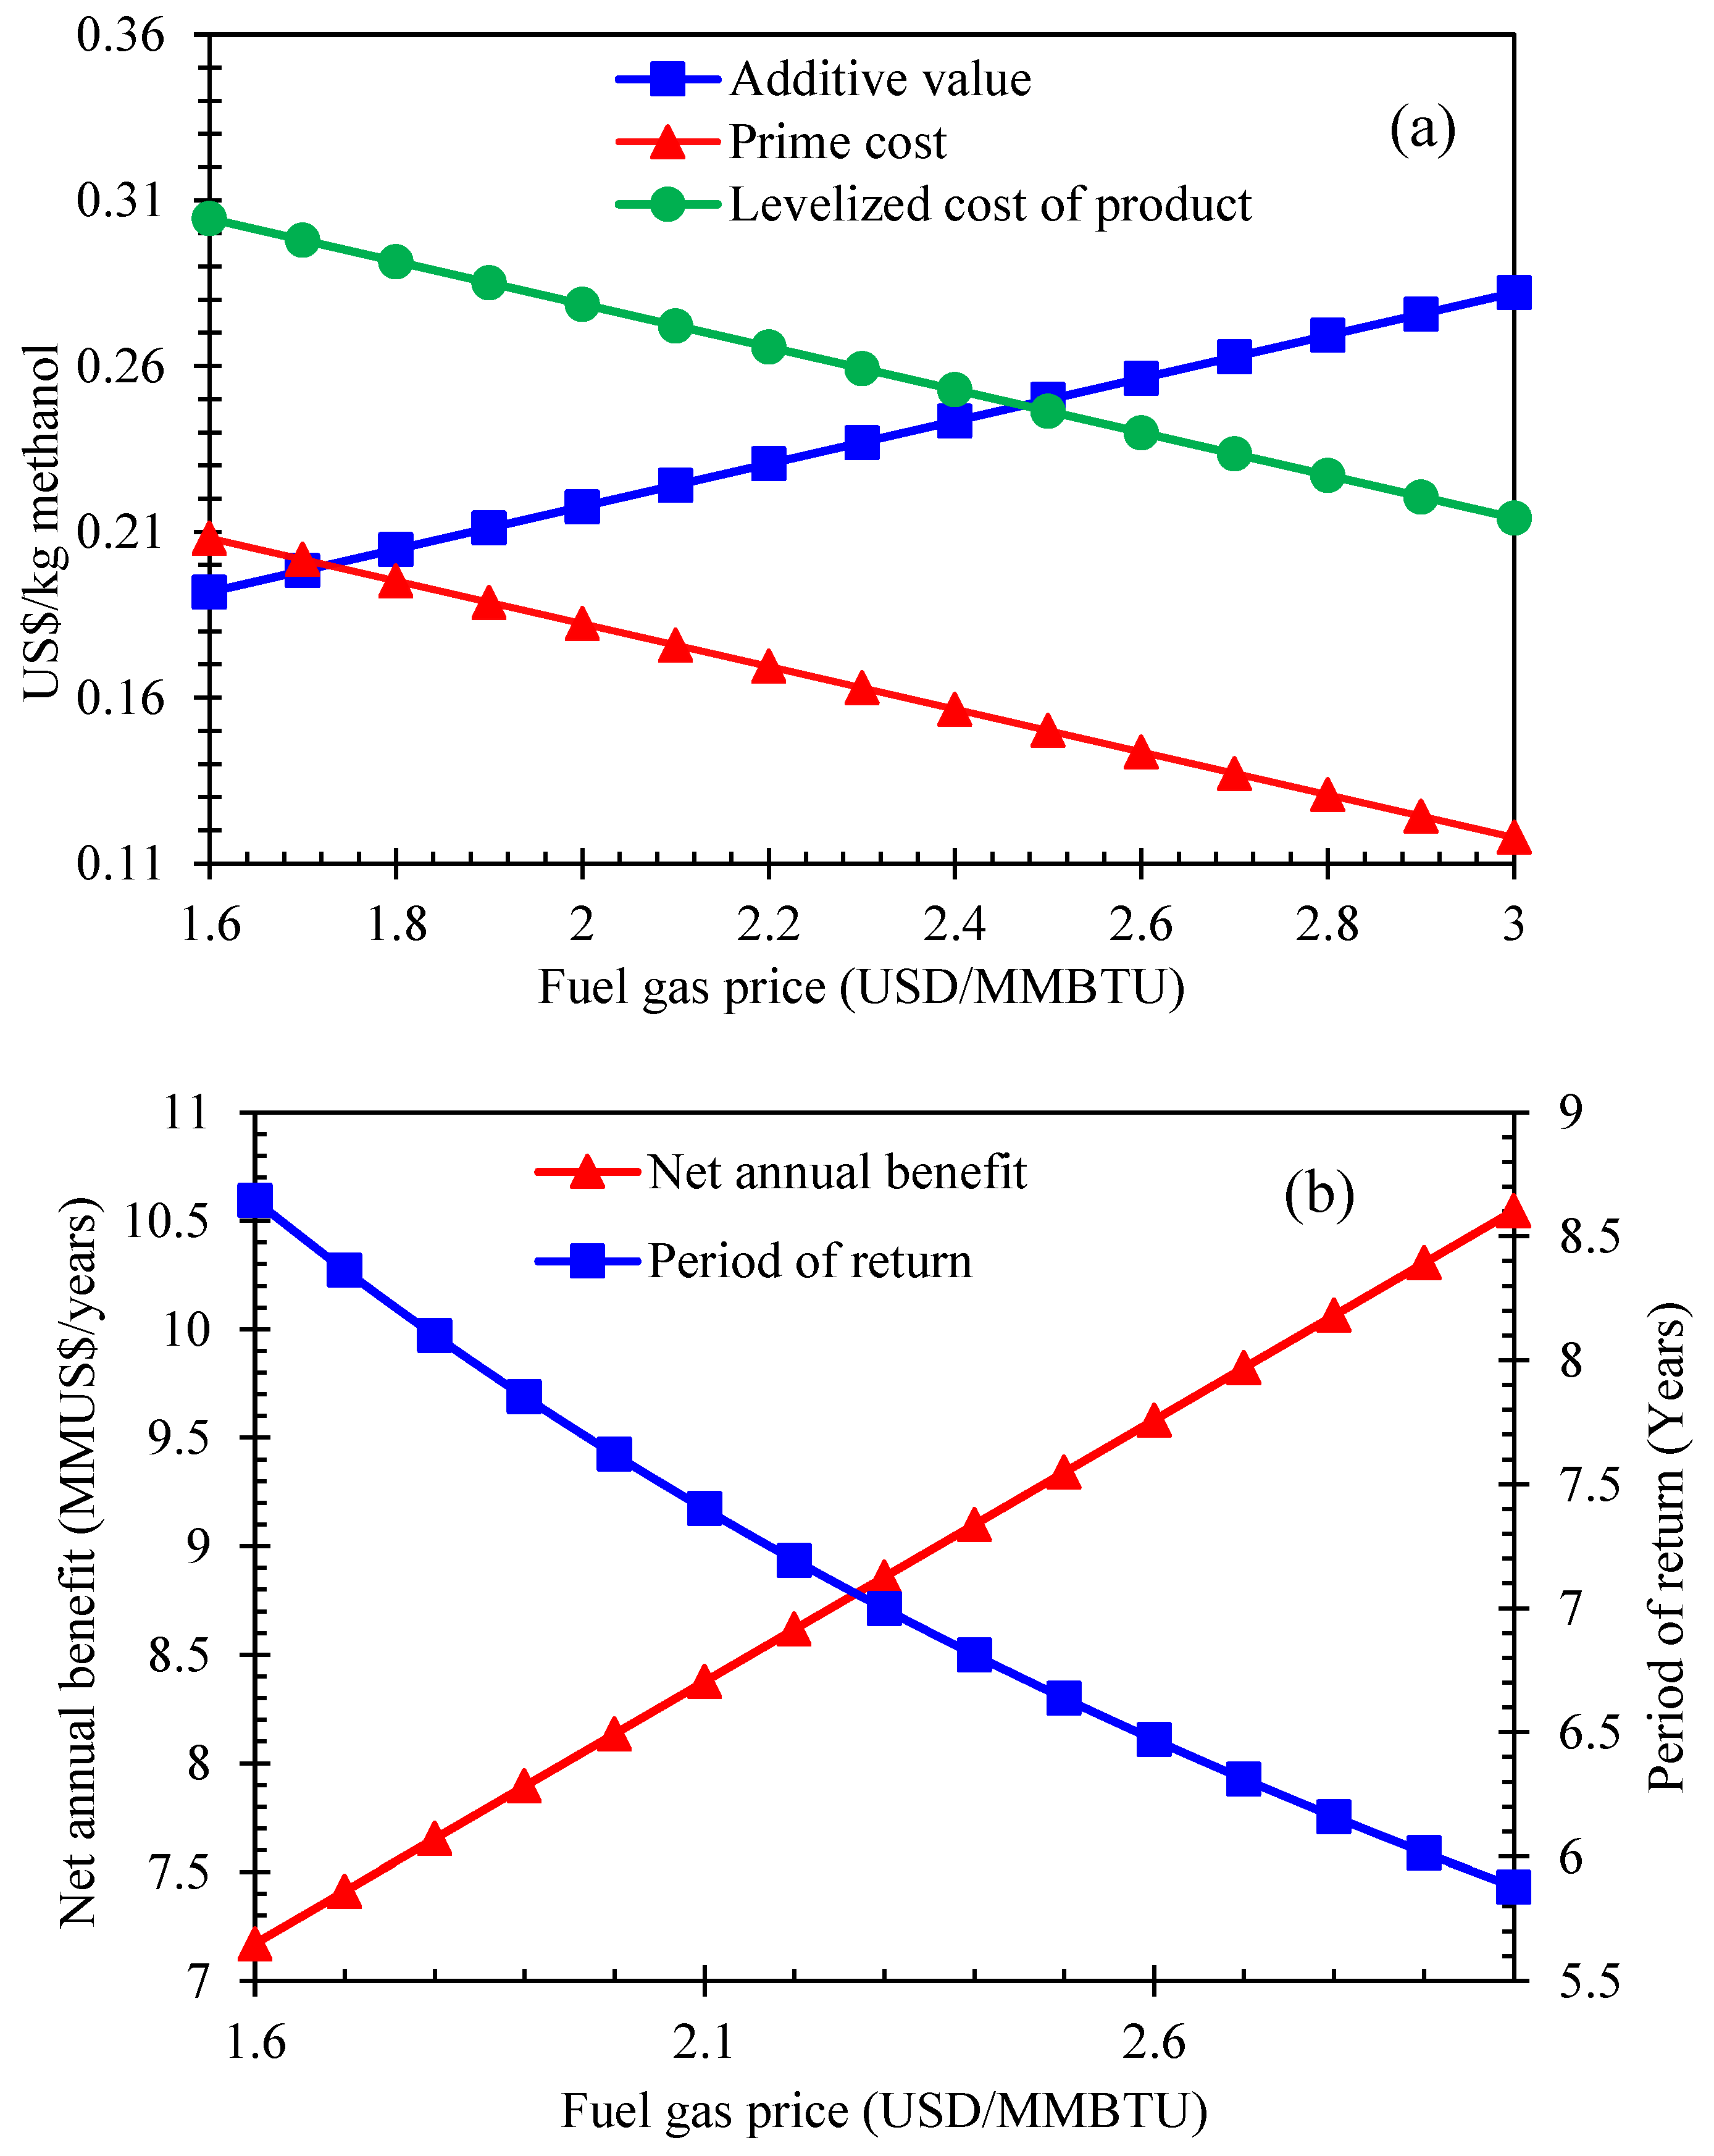
As depicted in
Figure 4a,b, the price of fuel gas, as the side product of the process, affects the critical parameters of the economic analysis in the same manner as the price of methanol. The fuel gas cost growth from 1.6 to 3 USD/MMBTU means that the additive value and annual net benefits rise from 7.653 to 10.546 MMUSD/years and from 0.191 to 0.282 USD/kg methanol, respectively. Nevertheless, this increase in the fuel gas price lowers the prime and levelized product cost from 0.208 to 0.117 and 0.304 to 0.214 USD/kg methanol and the return period from 8.645 to 5.878 years. As shown, the changes in the methanol price have more significant effects on the main parameters of economic analysis compared to that of fuel gas prices.
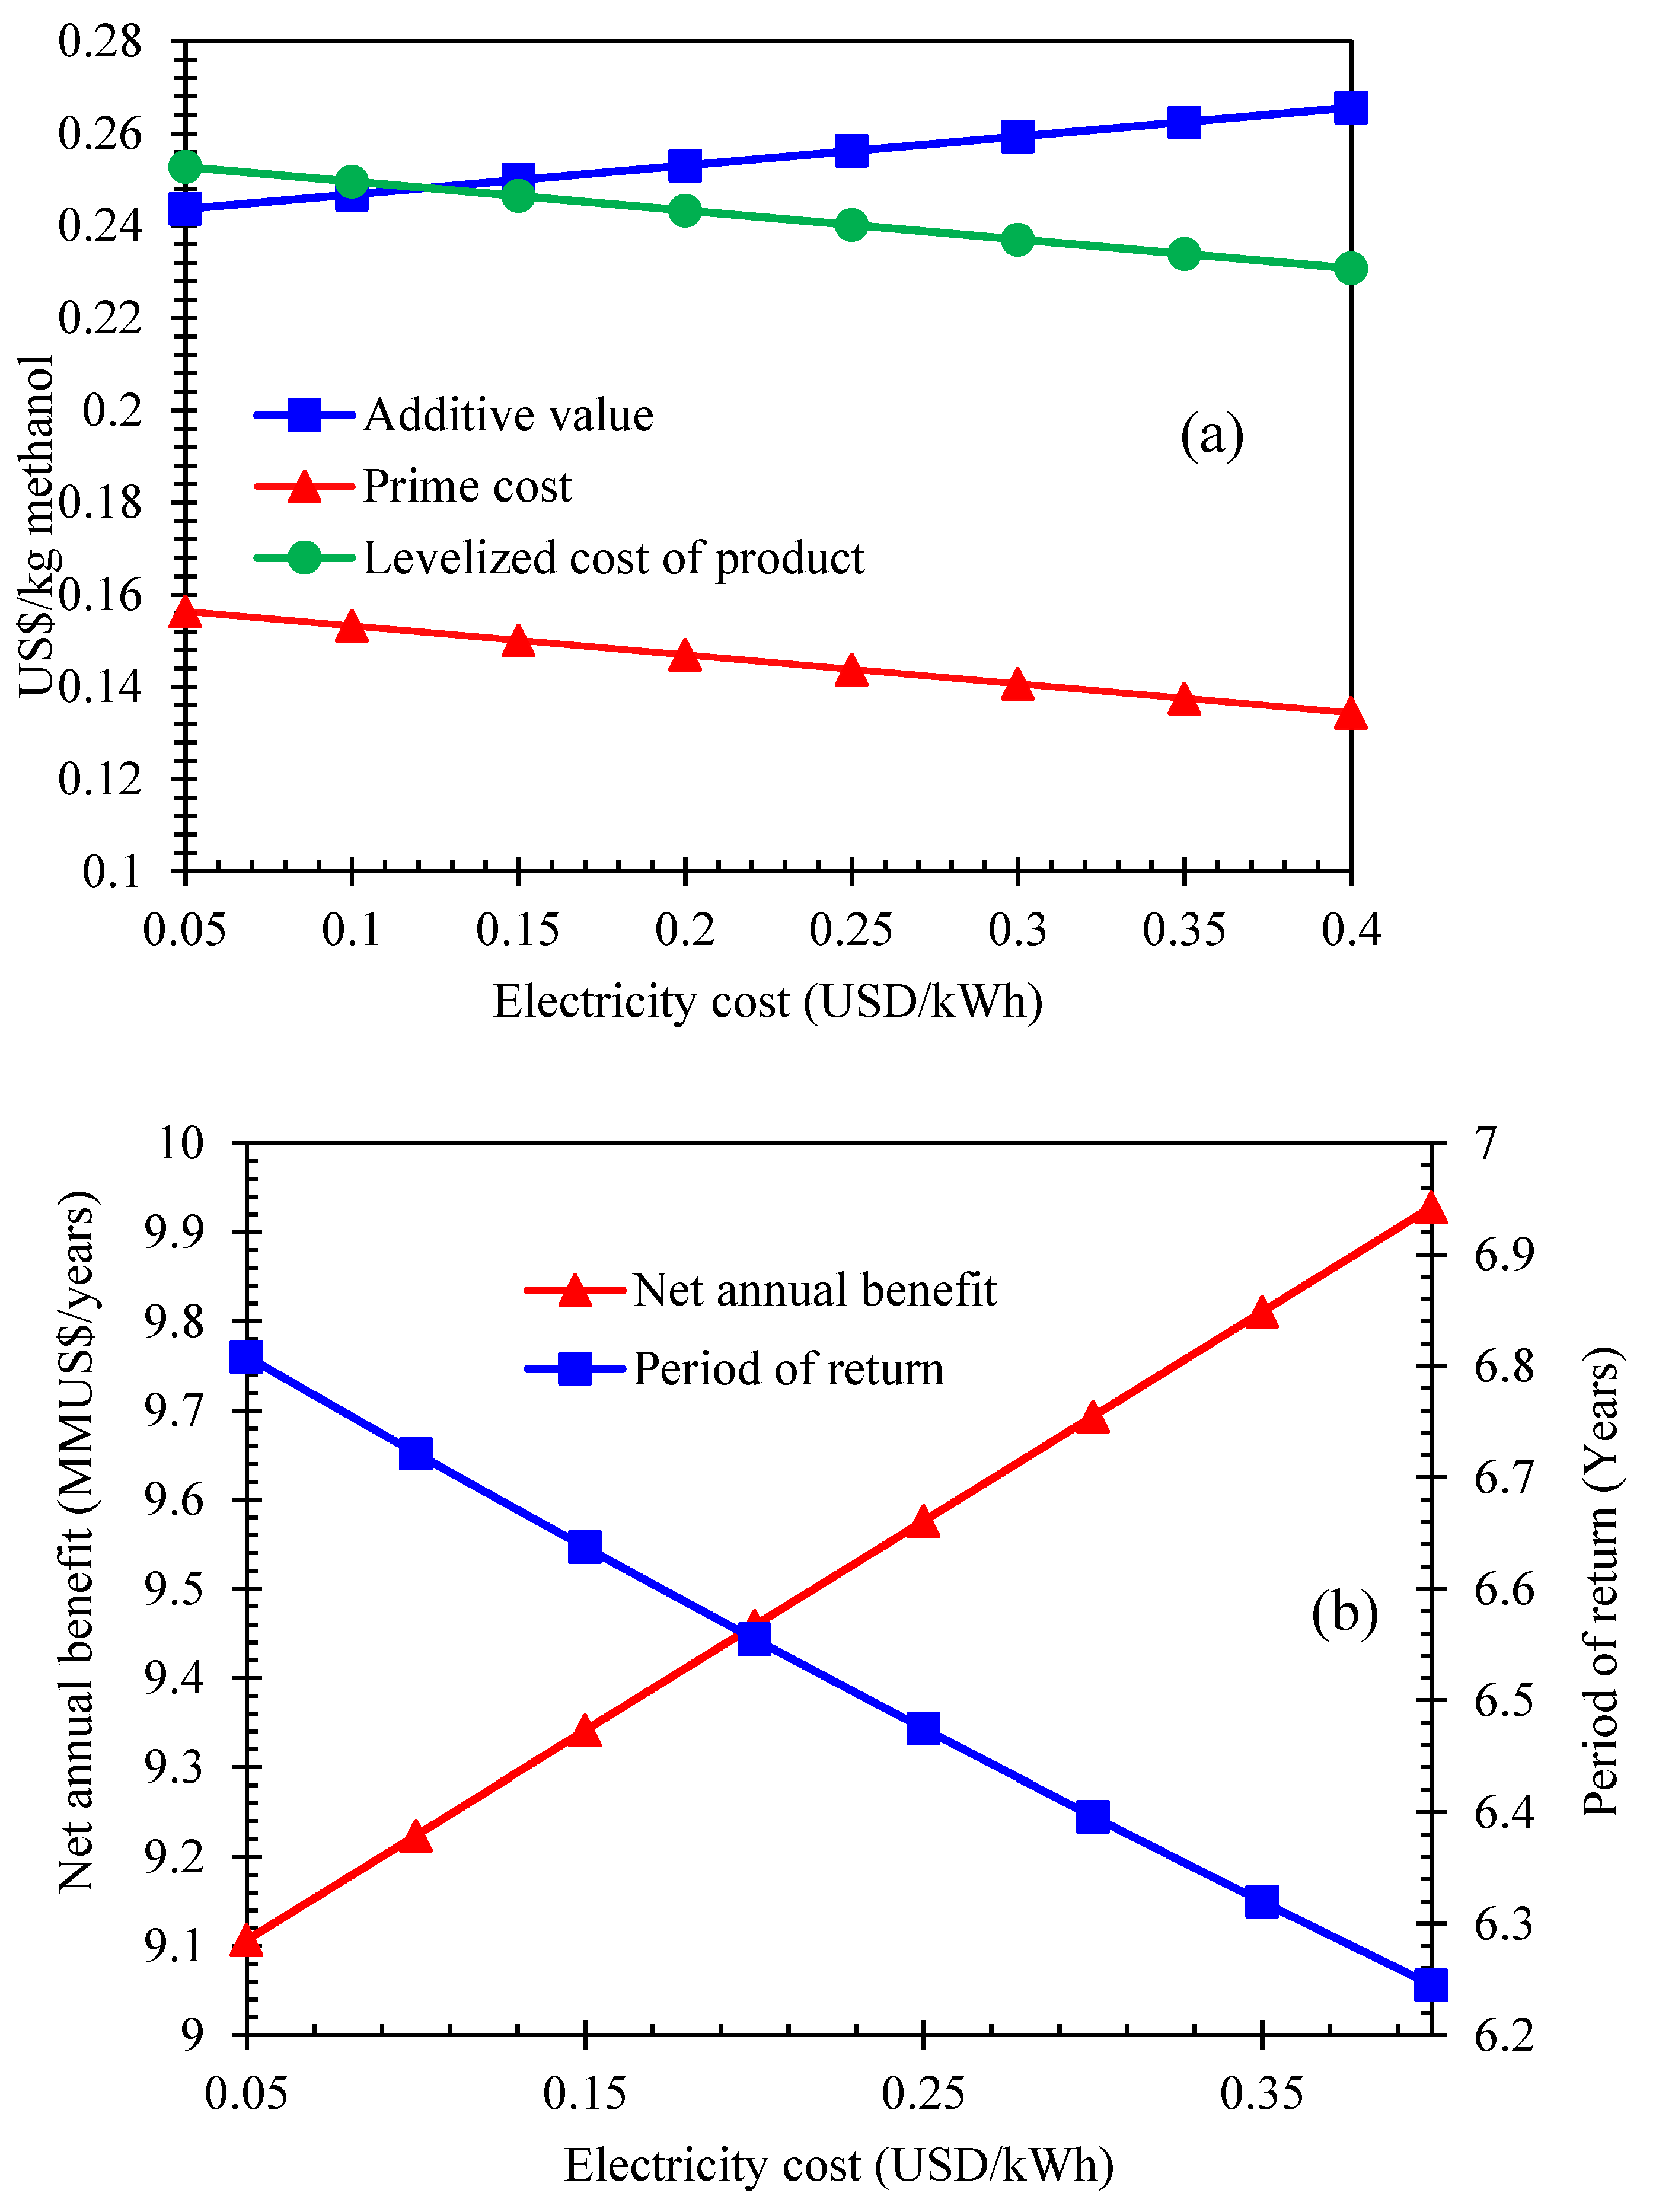
As can be seen in
Figure 5a,b, even after a noticeable change in the electricity price from 0.05 to 0.4 USD/kWh, the period of return, additive value, net annual benefits, and levelized cost of the product may experience marginal changes of less than 9 percent. In comparison, the product’s prime cost will decrease by 14 percent from 0.156 to 0.134 USD/kg methanol.
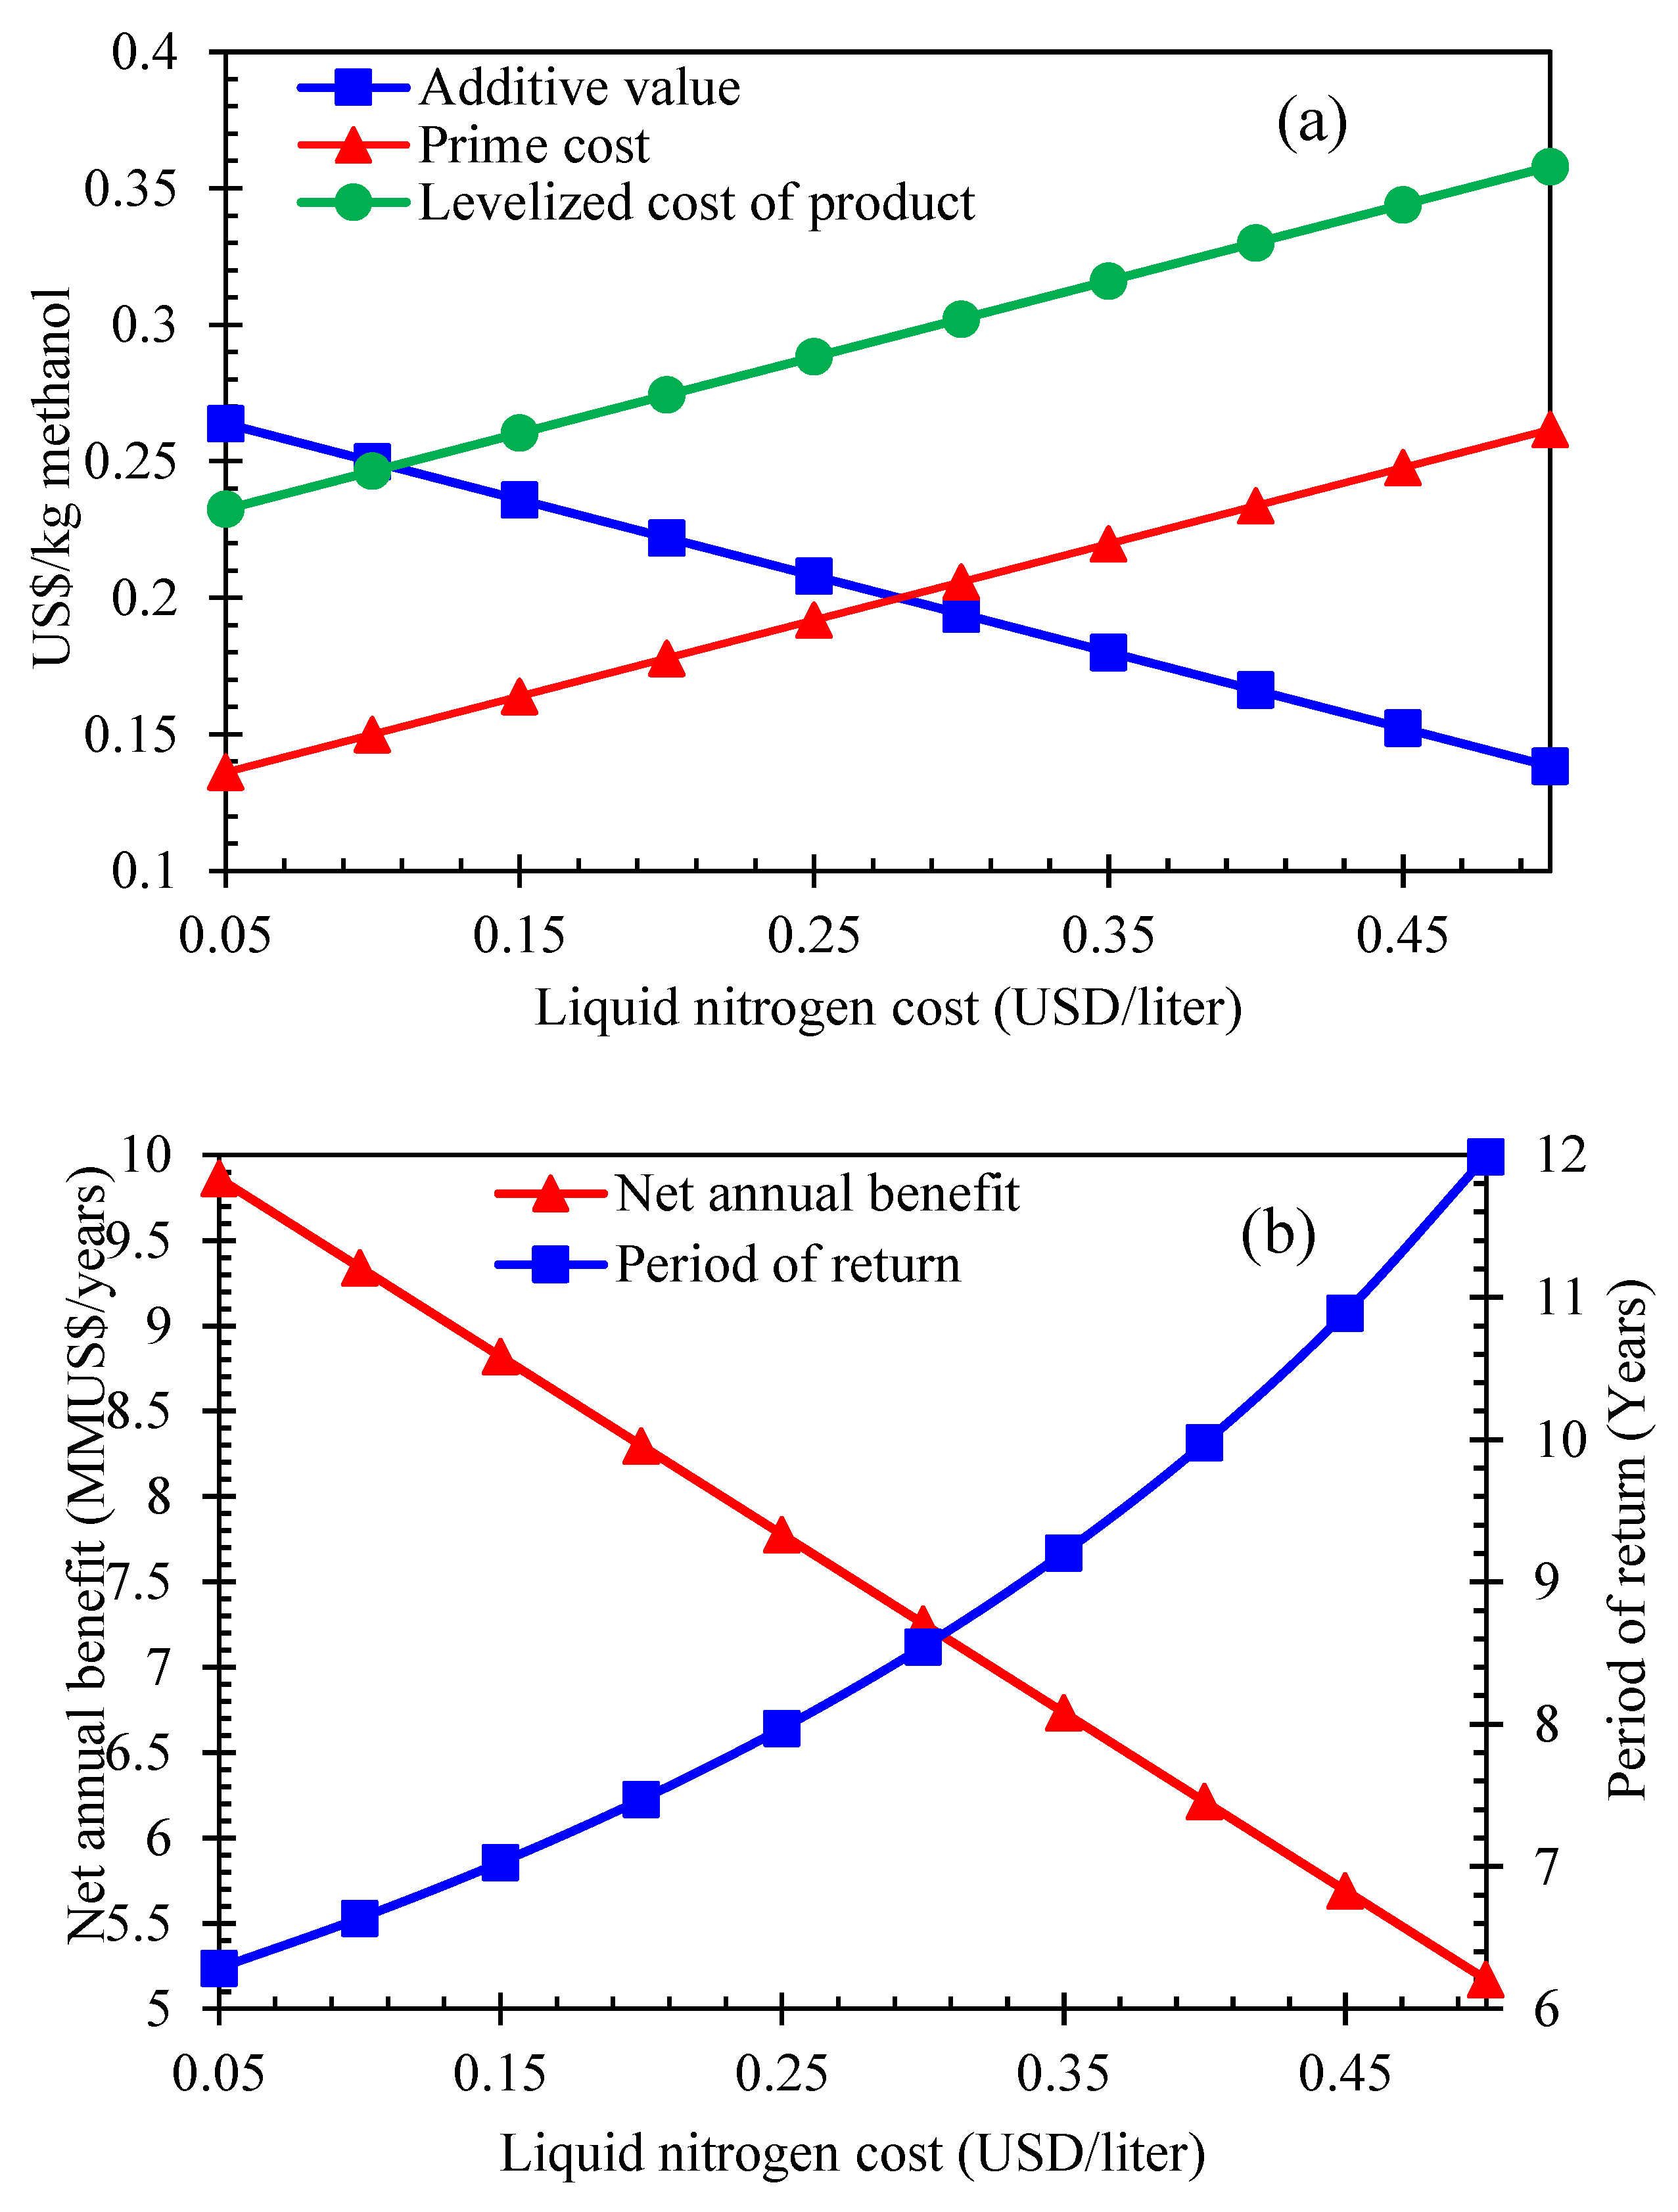
Liquid nitrogen is used in the hydrogen purification cycle (lines D22 and D27 in the heat exchanger HX4). The rise in the cost of liquid hydrogen from 0.1 to 0.5 USD/liter almost doubles the return period from 6.286 to 11.99 years (see
Figure 6a,b). It also increases the prime and the product levelized cost by 0.125 USD/kg methanol from 0.136 and 0.232 USD/kg methanol, respectively.
4. Optimization Methodology
Extracted from Hysys, the seamless communication between objective functions and decision variables is ingeniously achieved through integrating a hybrid approach. This innovative method harmonizes the capabilities of the Group Method of Data Handling (GMDH)-type polynomial neural network with the genetic algorithm’s (GA) effectiveness. Within this algorithmic framework, multiple neurons in each layer establish intricate connections utilizing a polynomial equation in the second order, effectively giving rise to the inception of fresh neurons in subsequent layers. The focal point of this hybridization is the training process of the GMDH network. The primary goal of this network training is the anticipation of the output
values nestled within intricate input vectors denoted as
. The progression of this training can be articulated in comprehensive detail as follows [
40]:
The objective is to reduce the squared disparities between the observed results and their associated anticipated values. This entails aiming for a closer alignment between the actual outcomes and the values predicted for them [
41]:
One can employ an equation derived from the Volterra series to depict the interconnectedness between the inlet and outlet points. This expression encapsulates the relationship between these points, offering insights into their shared dynamics [
41]:
The equation mentioned above can be characterized as a bivariate polynomial comprising solely of two variables (neurons), as demonstrated below [
41]:
The determination of the coefficient
involves employing regression techniques. It entails minimizing the discrepancy between the calculated value
and the real value
for each set of input variables,
and
. Furthermore, the coefficients of each second-order equation
are derived to achieve the optimal outlet alignment within the comprehensive input–output data pairs [
42]. The error function (
E) is calculated as depicted below:
The input vectors encompass the hydrogen content within the feed gas, the temperature of stream D17, and the incoming carbon dioxide flow rate. As for the output vectors, they include the return period, exergy efficiency, and thermodynamic efficiency. The process employs multi-objective optimization with the dual objectives of minimizing the return period while simultaneously maximizing the thermodynamic and exergy efficiencies. The NSGAII genetic algorithm method is utilized to carry out this optimization. For each set of optimal operational parameters, the Pareto frontier is derived, and from among the points along this frontier, the ultimate optimal point is selected through techniques such as LINMAP, fuzzy Bellman–Zadeh, and TOPSIS. The optimization model is presented in the following format [
16]:
Here,
represents the objective function,
denotes the n-dimensional variable vectors, and
and
signify the constraints inherent to the model that must be satisfied. Due to the differing dimensions of the objective functions, it becomes necessary to apply scaling and normalization to the target space before constructing a decision. Various normalization techniques are employed within the decision-making procedure, encompassing methods like non-dimensionalized fuzzy and Euclidean approaches. The non-dimensionalized objective utilizing the Euclidean method is delineated as follows [
43]:
represents a matrix for objectives corresponding to different points along the Pareto frontier, where i designates the route index along the Pareto boundary, and j signifies the indicator for objectives across the objective space. The application of non-dimensionalization involves utilizing the Euclidean method in the TOPSIS/LINMAP approaches, and the Bellman–Zadeh approach relies on the fuzzy method. The non-dimensionalized objective using the fuzzy method is characterized as follows [
44]:
4.1. TOPSIS and LINMAP Approaches
The point of optimality situated along the Pareto boundary signifies a circumstance in which each individual objective achieves its maximum value in isolation from the influences of the other objectives. In contrast, the non-ideal point denotes specific coordinates within the targeted space wherein each objective assumes its least advantageous condition. The TOPSIS technique involves computing the distances between the parameters residing along the Pareto frontier and on both the most optimal and least favorable points. This computation is executed through the utilization of a specific formula, which encapsulates the essence of the calculation process in this method. By employing this formula, the TOPSIS technique establishes a structured approach to evaluating and quantifying the discrepancies between different parameter sets and their corresponding optimal and suboptimal benchmarks [
45]:
denotes the objective index within the Pareto frontier, while i represents the solutions along the Pareto frontier (i = 1, 2, ….,
). Within the framework of the LINMAP methodology for making decisions, the notion of optimality takes on a distinct characterization: it pertains to the configuration that maintains the minimal distance conceivable from the ideal state. This method emphasizes the significance of minimizing the disparity between the achieved and theoretically perfect states, underscoring the importance of aligning outcomes as closely as possible with the optimal objective conditions [
46].
In the previously mentioned equations,
and
represent the parameter distances within the Pareto boundary from the least favourable and most optimal scenarios. Subsequently, the criterion of decision is derived from
. The point characterized by the maximum
parameter is regarded as the optimal point according to the TOPSIS decision-making methodology. Within the equations mentioned earlier, the variables
and
assume roles that signify the extent of parameter deviations along the Pareto boundary concerning the least favourable and most optimal instances. Consequently, the decision criterion is extracted from the value of the parameter
. Notably, within the context of this methodology, the point distinguished by the highest
parameter value is identified as the optimal point, serving as the pinnacle of decision-making in accordance with the TOPSIS approach. This strategic selection is driven by maximizing the calculated parameter, aligning to attain the most desirable outcome within the decision-making process [
45].
4.2. Bellman–Zadeh Approach
Incorporating the Bellman and Zadeh methodology results in converting each individual objective into either a fuzzy objective function or a separate fuzzy group, representing a pivotal aspect of this approach. Central to this methodology is the introduction of membership matrix functions, a fundamental component of the process. In this framework, the columns of the matrix are dedicated to encapsulating the membership functions corresponding to the objectives, which are articulated in a fuzzy manner to account for uncertainty and imprecision. This matrix structure serves as a structural foundation for the transformation and manipulation of objective-related information within the context of the fuzzy framework introduced by Bellman and Zadeh [
47]. The rows within the membership matrix are in direct correspondence with the values attributed to the membership function that specifically relate to the trajectory obtained through the process of deriving from the Pareto boundary. To provide further clarification, the exact count of objectives perfectly aligns with the number of columns currently present within the matrix representing the membership function. In a similar manner, the total quantity of solutions that are strategically positioned along the Pareto boundary effectively coincides with the precise number of rows that are encompassed within the aforementioned matrix. By effectively utilizing the Bellman–Zadeh methodology, the initial route originating from the Pareto frontier is systematically determined through the meticulous process of identifying the maximum value inherent within the membership function attributed to the lower-level objective.
4.3. Results of Optimization Approaches
In a departure from concentrating solely on a single optimal point, the methods discussed are implemented to unveil an array of optimal solutions. Genetic algorithms have gained prominence due to their effectiveness in optimizing various functions. In the specific framework of this study, the NSGAII technique is skillfully employed to discern the operational arrangement that offers the utmost advantages.
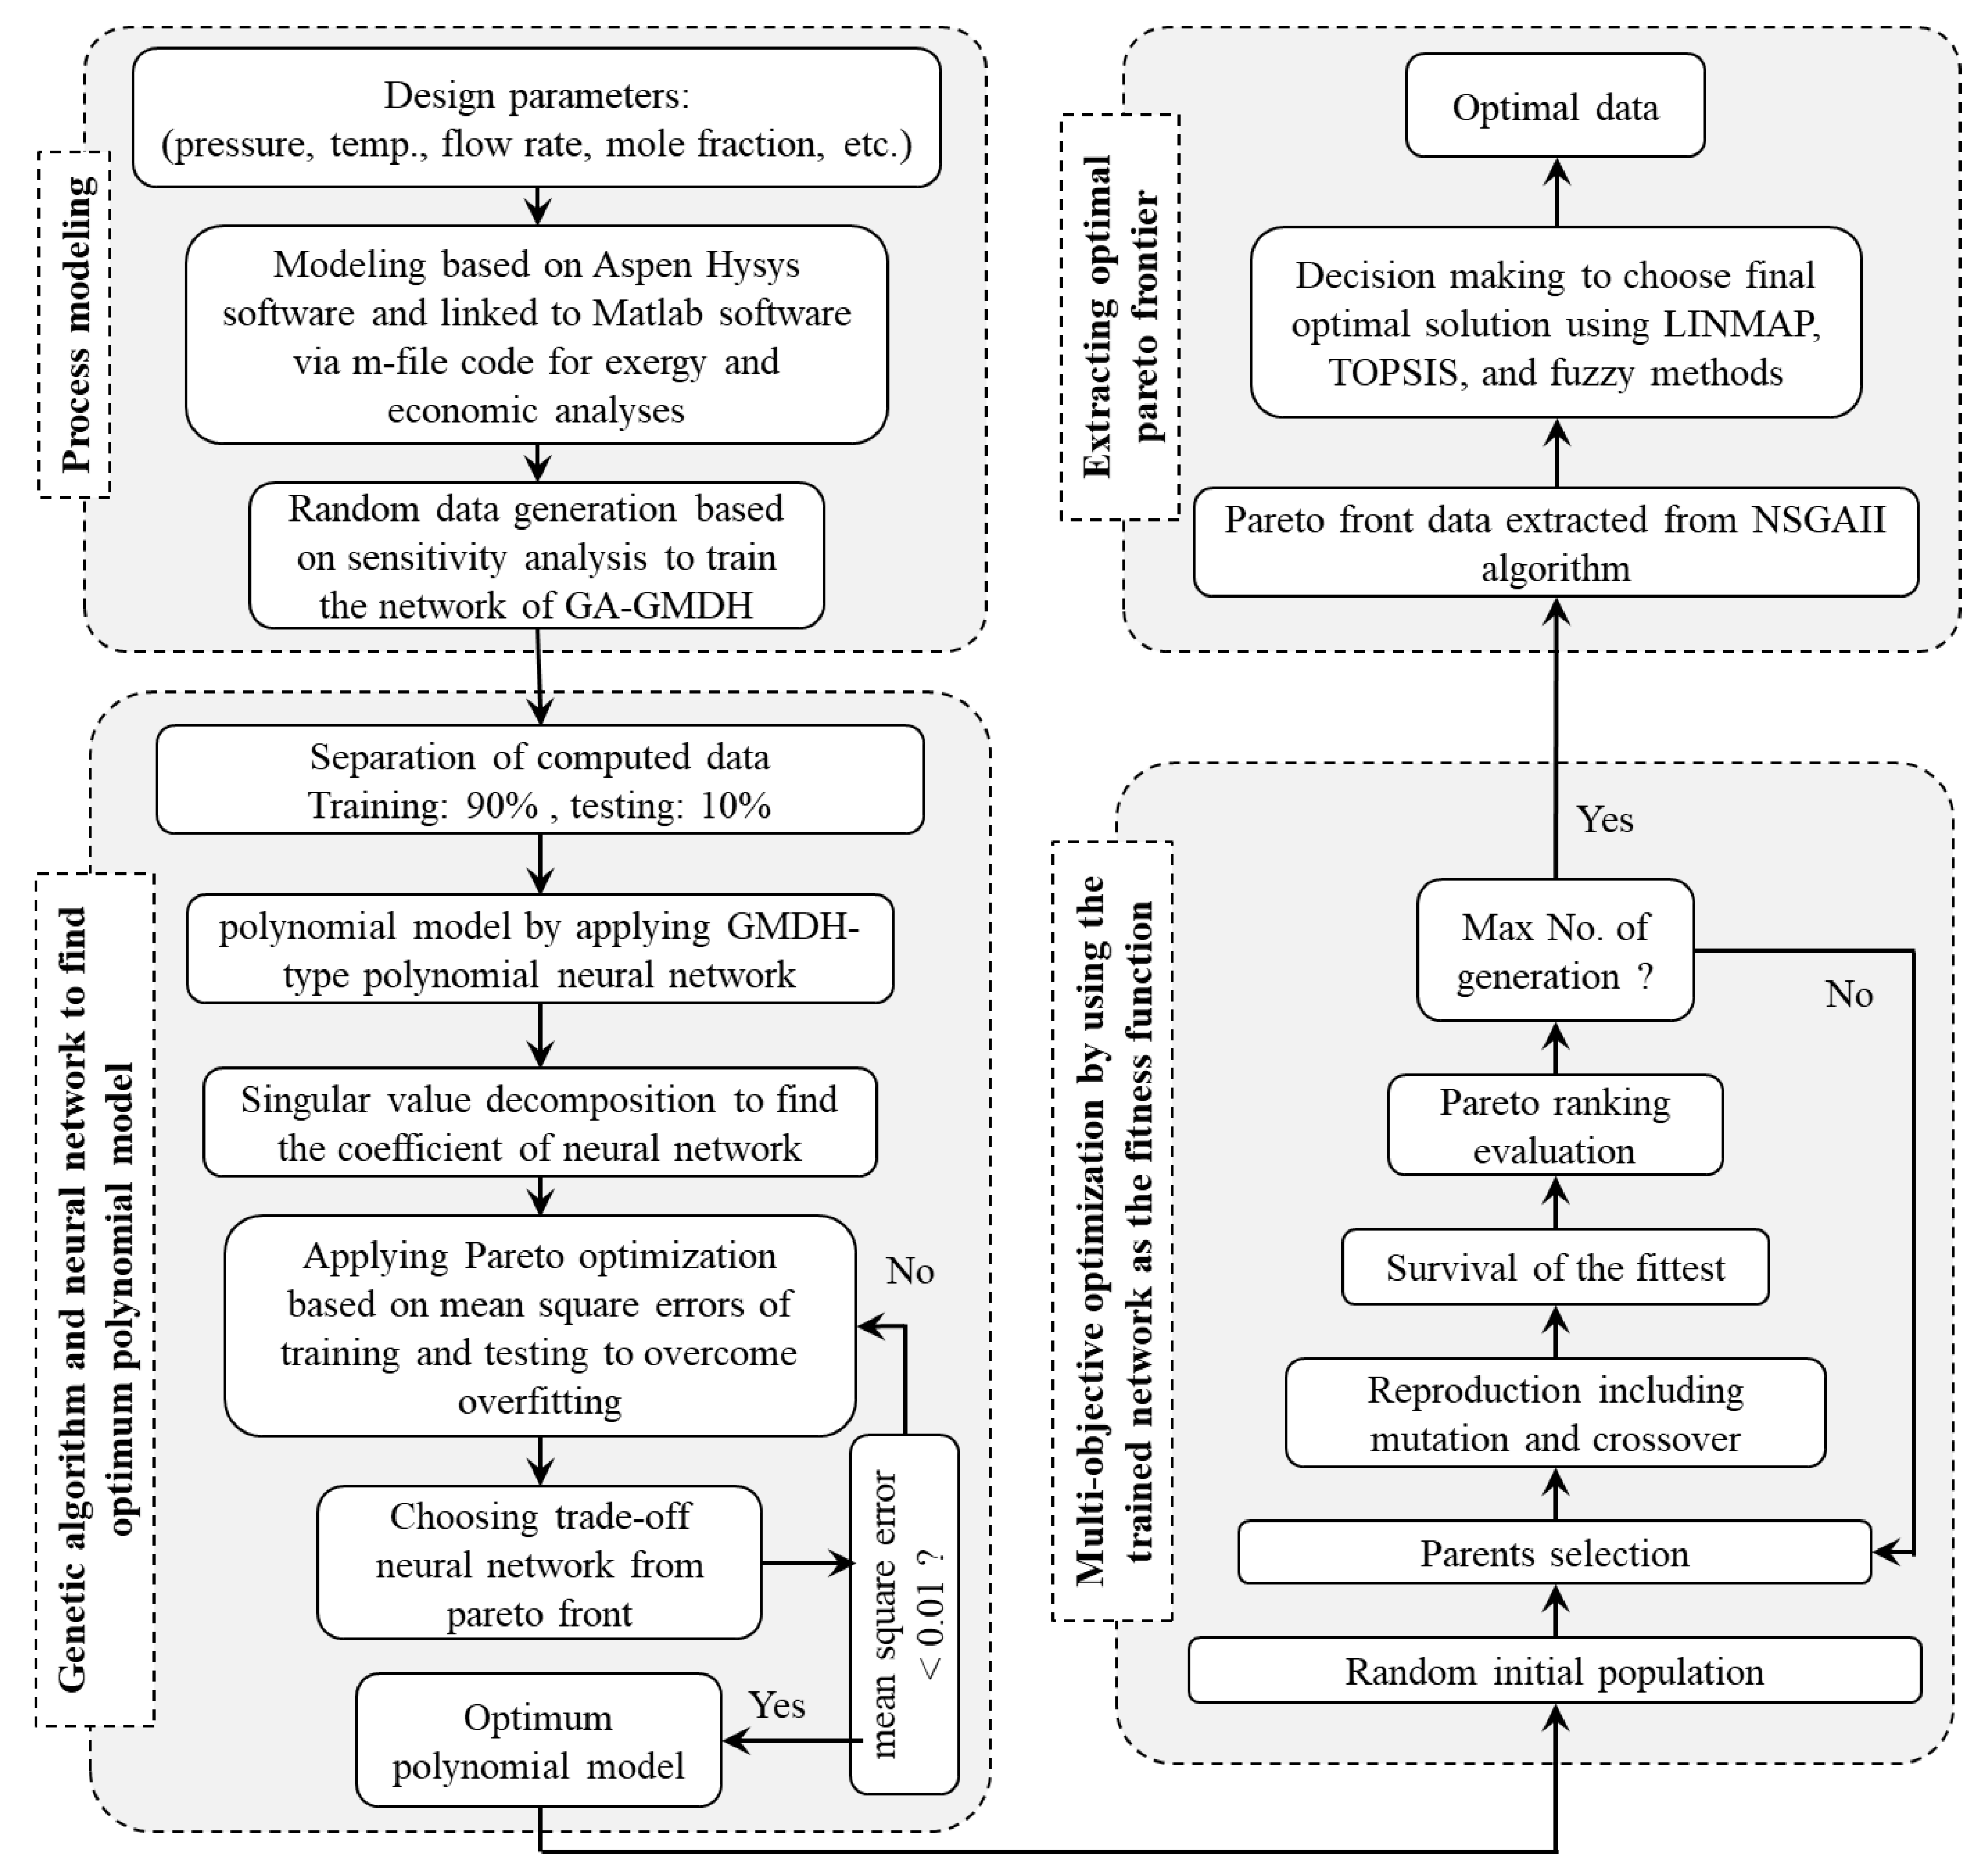
Figure 7 serves as a visual guide, offering a comprehensive overview of the optimization process pertaining to the procedure under examination.
The architectural arrangement of the network and the calculation of coefficients within the governing equations are both orchestrated through the concurrent application of the genetic algorithm and the singular value decomposition (SVD) technique. The genetic algorithm’s role in this context involves efficiently constraining the search range of the GMDH neural network, thereby facilitating the SVD method’s optimal integration to ascertain the six factors of communication that oversee interactions between the two neurons. Beyond this, the optimization process encompasses the critical task of determining the most appropriate count of neurons within each latent layer in conjunction with their intricate intercommunication structure. These efforts are all directed towards the ultimate objective of extracting the most advantageous compilation of coefficients of the quadratic polynomial.
The Pareto-optimal boundary is established, and the optimal points are identified by applying decision-making methods such as TOPSIS, LINMAP, and the fuzzy Bellman–Zadeh methods. Within this research, the objective functions during the thermodynamic and economic evaluation phase are the proposed system’s overall thermal and exergy efficiencies, along with the return period.
Table 2 enumerates the objective functions, decision variables, and constraints determined via a sensitivity analysis for utilization within the optimization stage. By employing a sensitivity analysis to scrutinize the design and its responsiveness to variations in diverse parameters, the identification of decision variables is undertaken. The criterion for selecting parameters for deliberation typically revolves around those wielding substantial influence over efficiency and cost implications. In this context, five parameters are designated as decision variables and constraints, encompassing the temperature of the D17 stream, hydrogen content in the feed gas, inlet CO
2 flow rate, minimum temperature approach of heat exchangers, and the compressor pressure ratio. These parameters are strategically chosen for their discernible impact on the overall efficacy and economic considerations within the examined system. Through the application methodologies for decision-making, establishing the Pareto-optimal boundary is achieved, concurrently identifying the most favorable points. Within the framework of this research endeavor, the objective functions employed throughout the evaluation stages span both thermodynamic and economic domains, specifically encompassing the comprehensive assessment of the system’s thermal and exergy efficiencies and determining the return period. The consequential outcomes derived from the sensitivity analysis, meticulously outlining the enumeration of constraints, objective functions, and decision variables, as meticulously documented in
Table 2, collectively play an indispensable role as pivotal inputs for the forthcoming optimization phase.
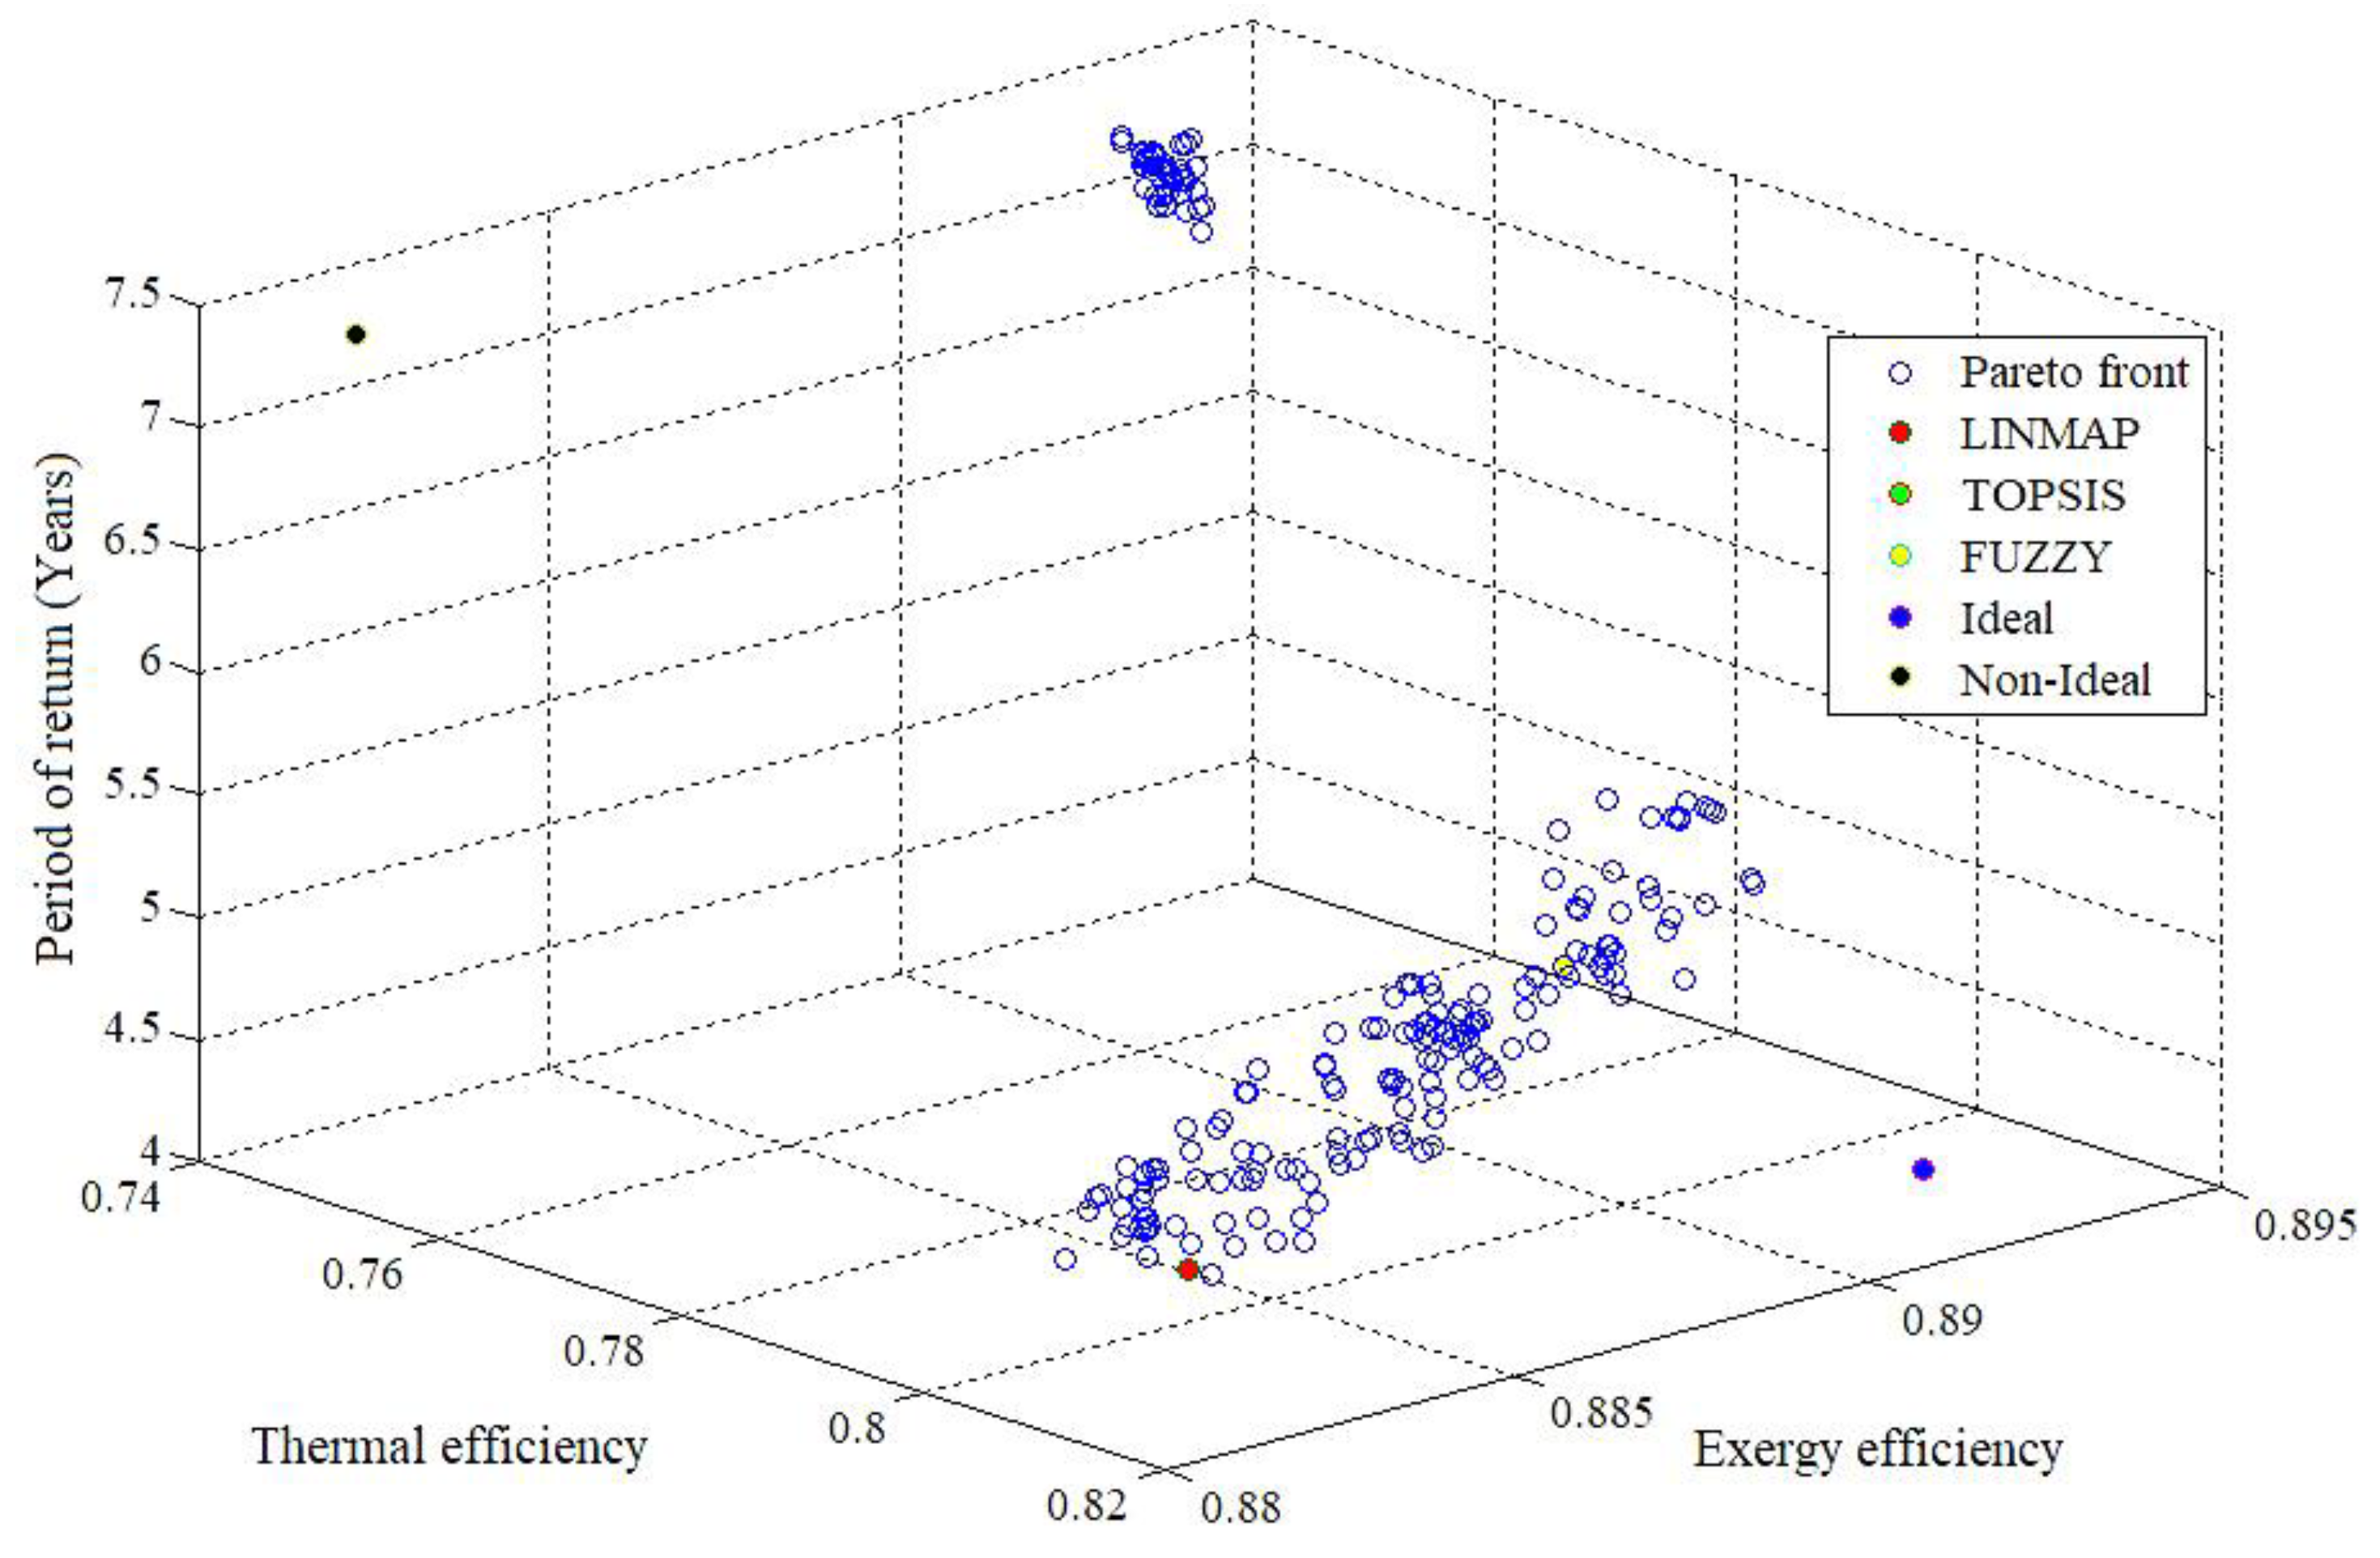
Figure 8 presents the visualization of the Pareto frontier, resulting from the implementation of the NSGAII algorithm. Throughout the procedure, a diverse array of outcomes is produced by employing different decision-making strategies, with the findings from the TOPSIS/LINMAP approaches revealing a striking degree of similarity.
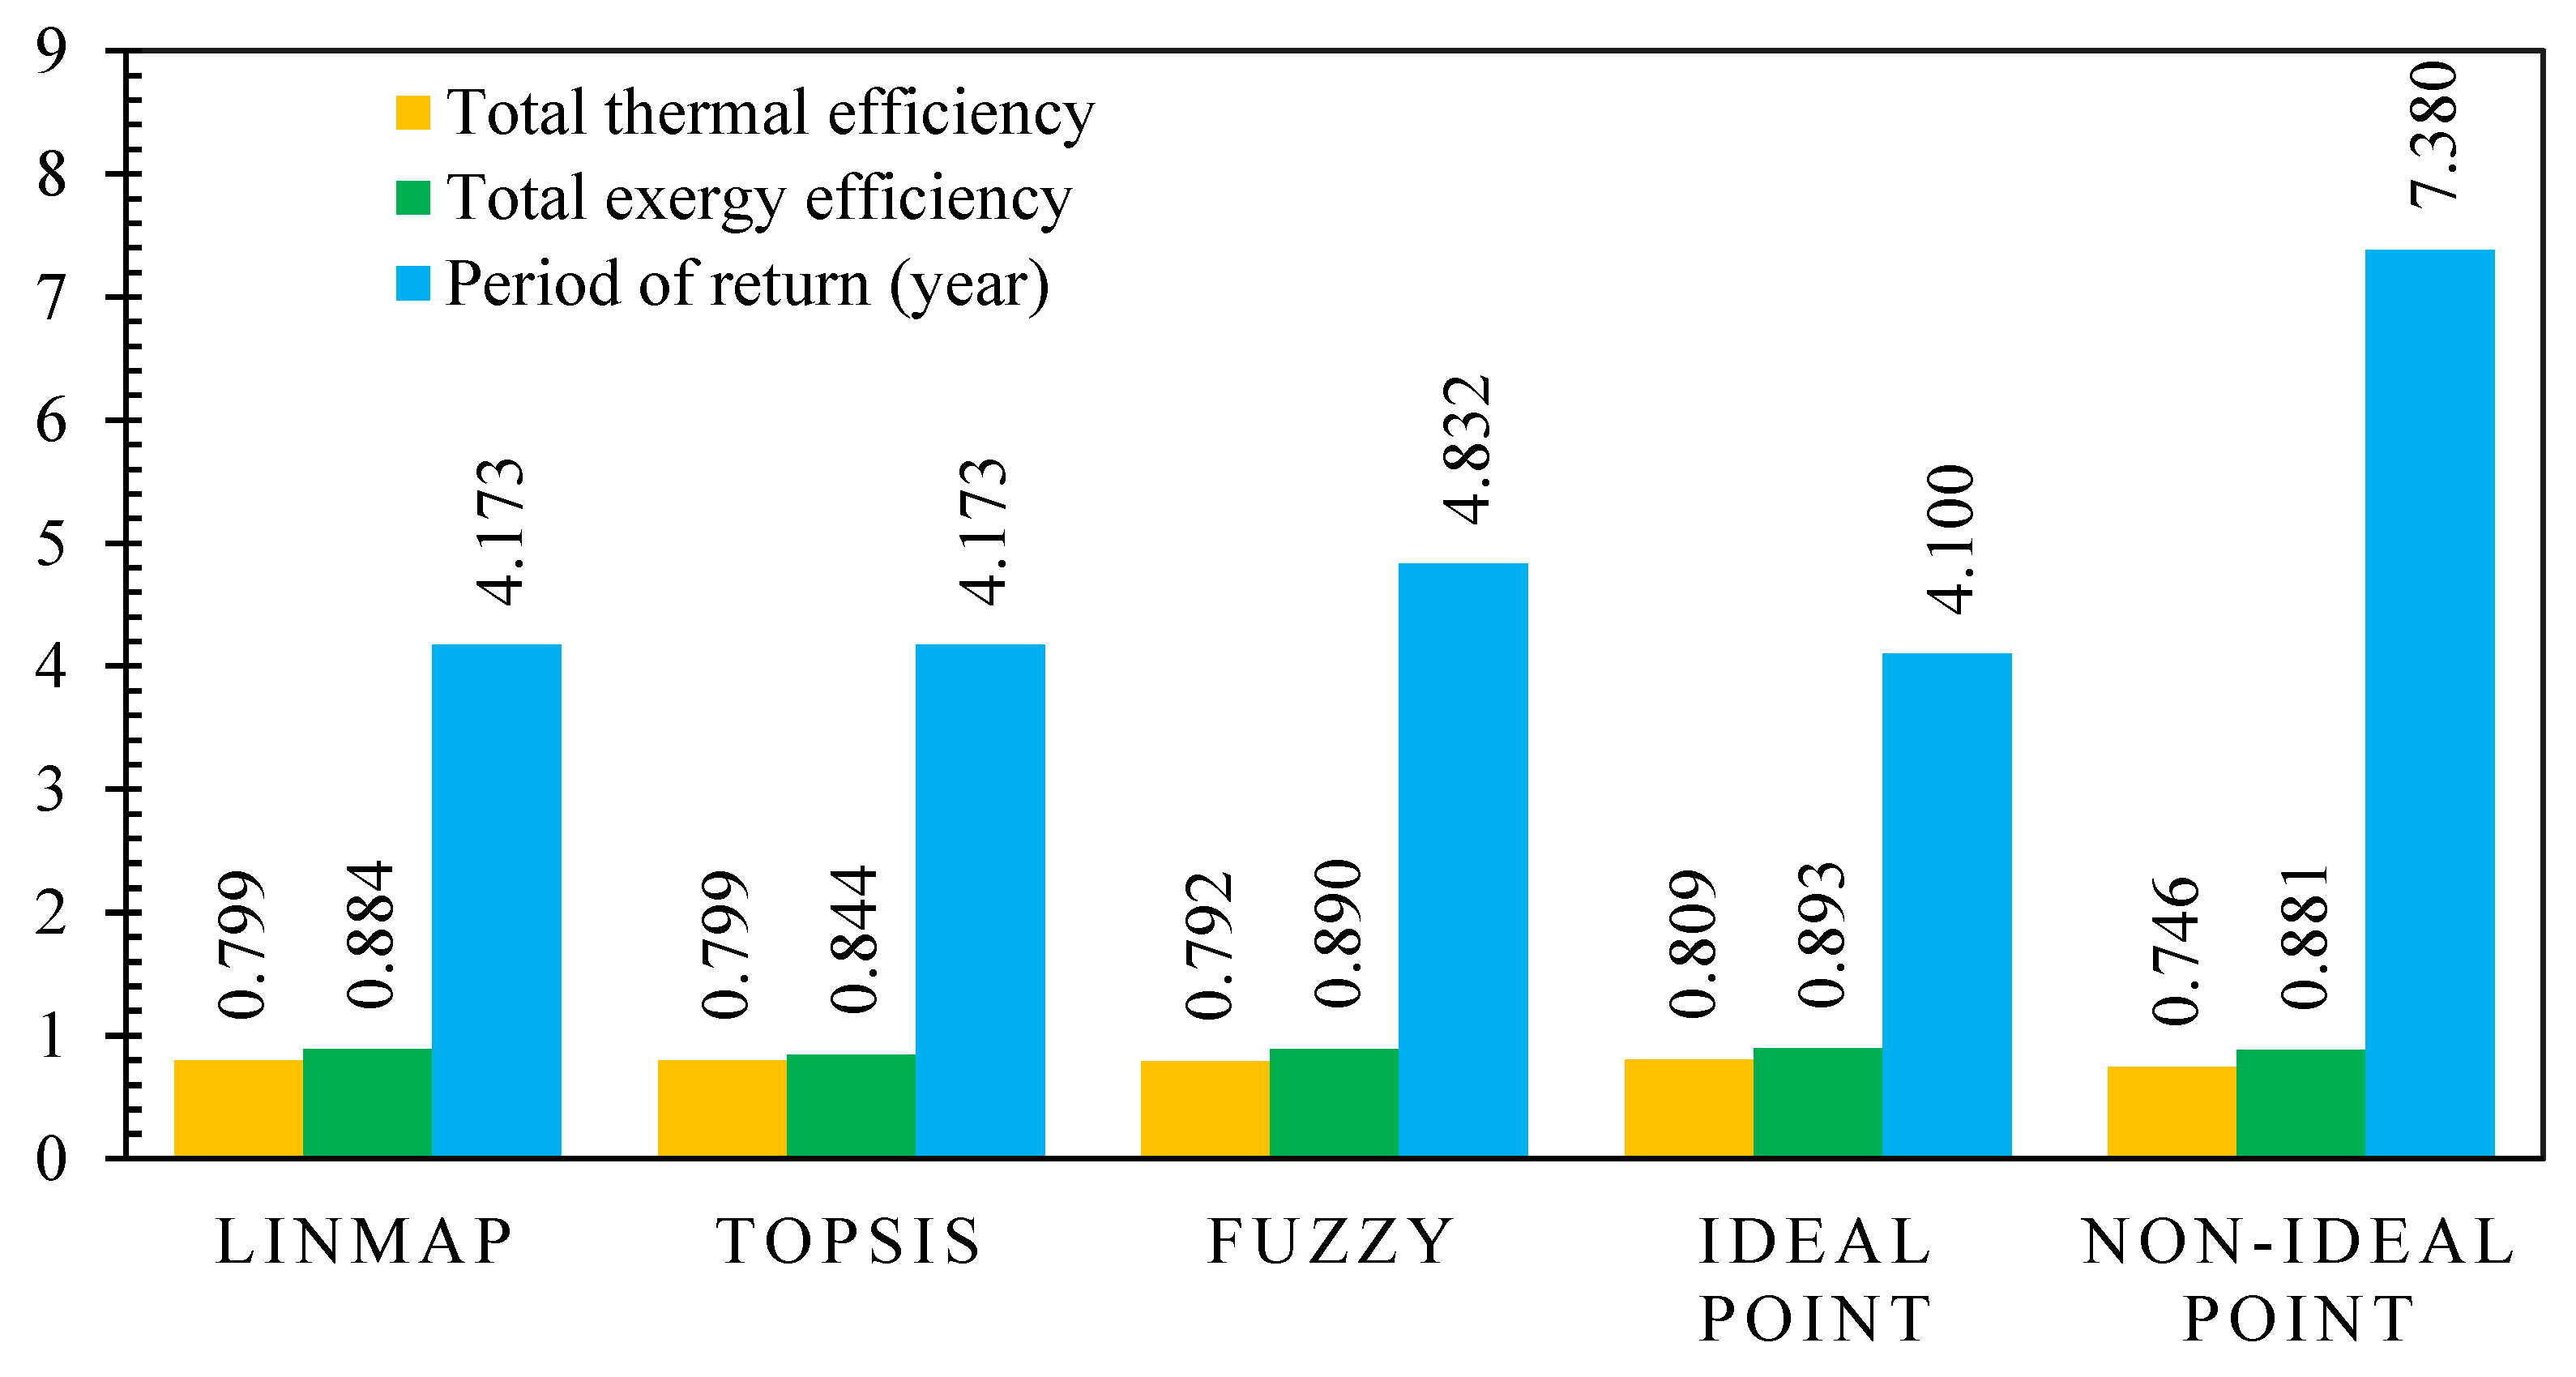
Figure 9 serves as a platform to showcase the ultimate optimal results achieved via each distinct approach, further accentuated by the representation of non-ideal and ideal points within the study context.
The outcomes demonstrate that the return period of the process after optimization is 38.16 percent lower than the base scenario by using the TOPSIS and LINAMP methods. The value for the return period in the fuzzy Bellman–Zadeh approach is 4.832 years, 15.8% higher than the two other decision-making methods. The optimum total thermal efficiency of the process calculated from all the methods is almost the same, with the result of the fuzzy Bellman–Zadeh method being 0.7 percent lower than the LINAP and TOPSIS methods (79.9%). However, the integrated process from the fuzzy method has a higher exergy efficiency than the system chosen based on the other two approaches. The values of the ideal point for the total thermal efficiency, total efficiency for exergy, and return period are calculated to be 80.9%, 89.3%, and 4.1 years, respectively.
5. Conclusions
The findings of this research underscore a substantial contribution to sustainability within the realm of process engineering. Through the application of a robust hybrid optimization approach, our study not only achieves remarkable reductions in the investment return period but concurrently enhances thermal efficiency. These improvements directly translate to reduced energy consumption and a more sustainable operation, aligning with the global agenda for environmentally conscious industrial practices. To achieve the study goals, an economic assessment was performed by employing the ACS methodology. This was performed to investigate the economic viability of a combined system designed to produce liquid methanol. The effect of methanol and crude hydrogen prices, electricity, and fuel gas costs on effective economic parameters is investigated. By combining artificial intelligence with neural networks and a GA, the results for the return period of investment and thermodynamic efficiencies are improved in the next step. Moreover, applying the three methodologies investigated plays a pivotal role in facilitating decision-making within the employment of optimization. The following are the primary outcomes of the study:
The results indicate that the return period, net annual benefit, and prime cost of methanol are 6.63 years, 9.34 MMUSD/year, and 0.15 USD/kg, respectively.
The methanol market price significantly impacts the return period. A rise in the main product price (liquid methanol) from 0.35 to 0.8 USD/Kg sharply cuts the return period from 8.30 to 2.55 years. This shift connects directly and almost linearly with the additive value and net annual benefit. Elevating the feed gas price from 0.8 to 3 USD/MMBTU increases the prime and levelized costs for methanol production, reaching 0.13 to 0.36 and 0.22 to 0.46 USD/kg, respectively. Conversely, this raises costs and reduces net annual benefits and additive value, decreasing from 10.15 and 0.271 to 1.273 and 0.034, respectively. Additionally, if the crude feed gas cost exceeds 1.8 USD/MMBTU, the return period increases drastically beyond 10 years.
The optimized process showcases a remarkable 38.16% reduction in the return period compared to the base case, as indicated by the TOPSIS and LINMAP methods. However, within the fuzzy Bellman–Zadeh framework, the return period value computes 4.832, marking a 15.8% increase compared to the other decision-making methods. While the optimal total thermal efficiency remains nearly constant across all the methods, the fuzzy Bellman–Zadeh approach records a mere 0.7% deviation, slightly lower than the LINMAP and TOPSIS methods (79.9%).
For future research, analyses of uncertainty, flexibility, and sustainability can be investigated for the developed process to assess the overall robustness, adaptability, and credibility of the design and evaluate the climatic and environmental impact of the project during its life cycle from an economic point of view.


