Article

Identifying the Role of Knowledge-Intensive Business Services in the Korean Economy as a Sustainable Innovation Tool Using Input–Output Analysis

Division of Artificial Intelligence Convergence, Sahmyook University, Seoul 01795, Republic of Korea
Sustainability 2024, 16(5), 1823; https://doi.org/10.3390/su16051823
Submission received: 11 January 2024 / Revised: 15 February 2024 / Accepted: 19 February 2024 / Published: 22 February 2024
(This article belongs to the Special Issue Sustainable Economic Policy and Econometrics Strategy)

Abstract

:
This study aimed to determine the role of KIBSs as a tool for sustainable innovation in a country’s economic system. Specifically, the degree and role of their impact on the Korean economy were analyzed and compared for the entire KIBS sector, T-KIBSs (a new technology-based professional service), P-KIBSs (a traditional professional service), and every subsector. For this purpose, the demand inducement model, supply inducement model, and interlinkage effects method were applied using the 2019 input–output table published in 2022. The analysis showed that the indirect production inducement effect of the entire KIBS industry on other industries was KRW 0.800, the indirect added value inducement effect was KRW 0.330, and the supply disruption effect was KRW 1.144. For T-KIBS, the indirect production inducement effect was KRW 0.687, the indirect added value inducement effect was KRW 0.272, and the supply disruption effect was KRW 0.730. For P-KIBSs, the indirect production inducement effect was KRW 1.472, the indirect added value inducement effect was KRW 0.646, and the supply disruption effect was KRW 2.657. Finally, regarding the economic ripple effect of the KIBS subsector, legal and management support services and advertisements corresponding to P-KIBSs showed higher figures than the T-KIBS subsectors in all sectors, including production inducement, the added value inducement effect, and the supply disruption effect. These results revealed that in the South Korean economic system, KIBSs contribute to production and value addition across all industrial sectors. It is apparent that the absence of supply significantly disrupts other industries. Furthermore, production inducement effects are evenly distributed among all the KIBS subsectors in the secondary and tertiary sectors, while the value-added effects have a greater impact on the tertiary sector. In terms of the supply shortage effects, the secondary sector experiences a more significant impact. This underscores the crucial role of KIBSs in sustaining and enhancing overall economic activity in South Korea.

1. Introduction

The Fourth Industrial Revolution has leveraged advanced information systems, including artificial intelligence and the Internet of Things, as general-purpose technologies to drive innovation across industries. This integration with various business models has enabled the fulfillment of entirely new demands. Furthermore, the exponential pace of technological development is expected to catalyze unprecedented innovation, granting access to infinite knowledge and information through hyperconnectivity, hyperconvergence, and hyperintelligence. These advancements are expected to induce structural transformations in production, management, and governance on a global scale [1].
In this context, while technology serves as a catalyst for the economic structural innovations of the Fourth Industrial Revolution, there will inevitably be limitations to relying solely on technology to generate positive structural shocks and new value. In particular, it is crucial to thoroughly consider rapid changes in social structure, as they not only signify social issues such as deepening inequality but also contribute to the depletion of natural resources and exert negative impacts on the environment [2]. In order to achieve successful sustainable innovation in this situation, support must be provided to solve ecological and social problems that may arise, along with the introduction and operation of technology. In other words, the role of complementary assets is necessary for sustainable innovation. Within the service industry, knowledge-intensive business services (KIBS) fulfill this role. Professional services contribute to the creation, accumulation, and dissemination of new knowledge, thereby fostering the generation of freshly added value. As entities have engaged in business activities related to emerging technology, KIBSs not only act as users of new technology but also serve as producers driving technological innovation and innovators [3,4,5,6,7].
KIBSs are an industry positioned to act as a complementary asset essential for the key technologies of the Fourth Industrial Revolution and to generate value and transform the economic system appropriately. While the definition of KIBSs may vary among scholars and institutions, Miles et al. (1995) identified three primary characteristics that align with the consensus of most experts: (1) heavy reliance on expert knowledge, (2) serving as the main source of information and knowledge or utilizing knowledge to provide intermediate services necessary for the customer’s production process, and (3) primarily supplying businesses with a competitive advantage [3]. KIBS entities play a central role in fostering innovation as knowledge operators, producers, and mediators within national and regional economies [8,9,10,11,12]. Moreover, they possess characteristics such as a heightened awareness of knowledge activities, the ability to interpret and resolve various problems, and the ability to provide services. Catalyzing constant systemic change, KIBSs, particularly professional producers and users in the knowledge-intensive service industry, have led to transformations within complex innovation systems [6].
Research on KIBSs is primarily centered on industries driven by companies seeking KIBS support [13,14,15,16,17,18,19]. This research spans the regional and national levels [20,21,22] and has been conducted over several years, examining various types of innovations. Additionally, research has been conducted on the mediating role of sustainable innovation in the green economy related to the energy and resource sectors [23,24,25,26]. The results of these studies consistently underscore the role of KIBSs in supporting sustainable innovation within target units [25,26,27,28,29,30,31,32]. Specifically, the findings reveal variations based on factors such as the degree of connectivity and concentration of KIBSs, the skill level of the labor force, and the age and size of entities utilizing the KIBSs within a given region.
As KIBSs are a knowledge-intensive industry, there are limitations when analyzing results obtained within a short period; therefore, research has been conducted in regions with mature industries over a long period. However, as national economies become globalized and knowledge transfer methods diversify, interest in KIBSs is growing even in developing countries, and research is being conducted on regions and industries in various countries. In addition, because the size and characteristics of the economy vary in each region and country, how KIBSs operate may also differ [6]. Therefore, although KIBS research has been conducted for a long time, it is meaningful to measure the role and degree of influence of KIBSs depending on the country and period.
Since we are currently undergoing significant socio-structural changes due to advanced information technology, it is essential to discuss KIBSs as a critical intermediary industry in promoting sustainable innovation. In particular, examining the impact and role of KIBSs within a specific country is crucial for the effective utilization of these services.
Therefore, this study investigates the impact of knowledge-intensive business services (KIBSs) on the Korean economy. The focus is on analyzing and contrasting the level of influence and contribution of the overall KIBS sector, T-KIBSs (new technology-based professional services), P-KIBSs (traditional professional services), and their respective subsectors within the Korean economy.
For this analysis, information on how much the KIBSs sector invests in other industries and how output occurs in other industries must be considered. Therefore, this study applied the demand inducement model, supply inducement model, and interlinkage effects method to an industry linkage table. Through this analysis, one can see how all the sectors covered by the KIBSs sector play a role in the Korean economy and how much influence they have.

2. Literature Review

2.1. KIBSs and Classification

KIBSs are an industry that largely falls under the category of KSs (knowledge services). A “knowledge service” is defined as a high-value-added industry that requires creativity and expertise through intensively utilizing intangible assets embedded with knowledge and is a core sector of the service industry. KIBSs are defined in Eurofound (2006) as a group of service activities that affect the quality and efficiency of production by supplying intermediate goods to other companies or organizations to complement or replace the internal service functions of a company or organization [33].
The role of the KIBSs has been considered important in academia since the mid-1990s, and many scholars have conducted research on KIBSs and attempted to define them [3,4,5,10,34]. Miles et al. (1995) [3] defined “knowledge-intensive services” as services related to economic activities aimed at creating knowledge-intensive services and presented the following three main operating principles: (1) They rely heavily on expert knowledge. (2) They are either primary resources of information and knowledge in their own right or use this knowledge to produce intermediate services for their customers’ production processes. (3) They are competitively significant and primarily supply businesses [3]. Bettencourt et al. (2002) defined knowledge-intensive firms as enterprises engaged in the primary value-adding activity of accumulating, generating, or disseminating knowledge to develop tailored services or product solutions that meet customer demands [34]. Conversely, Hertog (2000) described them as private companies or organizations heavily relying on specialized knowledge associated with specific fields or functional domains to supply intermediate products or services related to a particular sector [4]. Muller and Doloreux (2009) noted that several scholars have proposed three key elements—“business service”, “knowledge-intensive”, and “knowledge-intensive firms”—through their definitions of KIBSs [5].
Depending on their roles and characteristics, KIBS entities are divided into traditional professional services, P-KIBSs, and new technology-based services, T-KIBSs. P-KIBSs is a traditional professional service encompassing business and management services, law, and accounting-related services, while T-KIBSs include services related to information and communication technology [3]. In addition, such a KIBS classification inevitably has limitations when distinguishing between detailed classifications depending on the characteristics of the data used; however, several scholars have broadly categorized them into information and communication activities (J) and professional, scientific, and technical (M), based on the European NACE (Nomenclature générale des Activités économiques dans les Communautés Européennes) Rev. 2, as shown in Table 1. Activities (M) are divided into two sections and seven subdivisions. Among these, the divisions corresponding to P_KIBSs are division 69, legal, law and accounting, and consulting activities; division 70, head office activities and management consultancy activities; and division 73, advertising and market research. The other four divisions are included in T-KIBSs [35].

2.2. Relationship between KIBSs and Sustainable Innovation

KIBSs play a role in supporting sustainable innovation rather than the service itself by contributing to knowledge diffusion through knowledge input and output between economic units [23,24,25,26,27,28,29,30,31,32]. Various studies related to the important role of KIBSs have been conducted across organizations, industries, regions, and countries.
Company-level research has been conducted on how KIBSs can support innovation in specific industries, and many of these studies have been conducted in the manufacturing sector [13,14,15,16,17,18]. In addition, studies have been conducted to determine whether these studies would produce the same results in specific countries or regions and to show how the KIBS sector works in each region [16,20,21]. Furthermore, many studies have shown that the KIBS sector serves as a resource for innovation in other service fields [19].
Another mainstay of KIBS research is its use as a regional innovation tool. This is because KIBSs provide highly skilled knowledge services; therefore, the degree of KIBS utilization may vary depending on the skill of the supply of labor resources and the sophistication of services in regional and national economies [6]. Accordingly, many studies have been conducted on the role of KIBSs in specific regions or countries, but most have been carried out in Europe and North America, which led the industrial revolution [36,37,38,39,40,41]. With the recent economic growth in Asia, countries such as China and Singapore are paying attention to KIBSs, and research on them is also underway in the region [42,43,44,45].
Research has focused on the impact of KIBSs on innovation and economic growth in subunits of economic systems, such as industries [6,17,18], regions [46], and countries, based on the scope of KIBSs support or demand. These studies have often focused on specific outcomes, including internationalization and export orientation, and have examined the implications of the KIBS sector on various facets of economic systems [16,47]. While these studies vary in their emphasis on different aspects of KIBS support and target demand, they consistently conclude that KIBSs play a supportive role in innovation and economic growth. Differences in the extent of innovation are attributed to factors such as the size and age of businesses [16,47,48], the maturity of the workforce, and the concentration of intellectual resources [46].
In addition, as several studies have been published showing that KIBSs are an important intermediary industry in the green economy field related to energy and resources, KIBSs are being supported as an industry that contributes not only to economic innovation but also to sustainable innovation [23,24,25,26]. In particular, Schmitz and Lema (2015) further assert that KIBSs act as intermediaries in cooperation between businesses and nations in the energy sector, as part of the green economy [26]. Strambach and Lindner (2017) posit that KIBSs play a crucial role in providing complex knowledge products and services by interconnecting knowledge, even in the context of sustainable innovation [25]. Sustainable innovation, in this context, encompasses not only the fundamental concept of innovation associated with economic benefits in the business aspect but also the broader implications of sustainability in ecological and social dimensions [49,50]. While aligning with the perspective that innovation contributes to economic growth, it distinguishes itself by having the resolution of ecological and social issues as its foundation. Overall, these studies highlight the multifaceted contributions of KIBSs to fostering sustainable innovation and economic development.

2.3. KIBS Industry Status in Korean Economy

Table 2 and Table 3 reconstruct the share and growth rate of KIBSs in the Korean economy from 2010 to 2019 using the 2019 industry correlation table announced by the Bank of Korea in 2022. KIBSs can be classified as P-KIBSs and T-KIBSs, as presented in Section 2.1. Therefore, in this study, P-KIBSs correspond to M (711)—legal and management support services and M (712)—advertising, and T-KIBSs correspond to J (610)—information services, J (621)—software development supply, J (including 629)—other IT services, M (700) R&D, M (721)—architectural and civil engineering services, and M (729)—other scientific, technical, and professional services. The KIBS classification is based on this standard in future industry-linkage analyses.
Table 2 shows the proportion of KIBSs’ total output. In 2010, the total output of KIBSs in the Korean economy was 4.2%; however, in 2019, it grew significantly to 7.2%, showing an average annual growth rate of 9.6%. These figures show steep growth compared to the total output of the entire Korean economy, which demonstrated an average annual growth rate of 3.4%. The share of T-KIBSs in the Korean economy was 3.5% in 2010 and 5.1% in 2019, with an average annual growth rate of 7.8%. For the P-KIBS sector, the rate was only 0.8% in 2010 and 2.1% in 2019, with an annual average of 15.6%. In particular, legal and management support services, a subcategory of P-KIBSs, accounted for only 0.5% of the entire Korean economy in 2010 but grew to 1.8% in 2019, with an average annual growth rate of 19.5%. Among the T-KIBS subcategories, the sector that grew most rapidly was software development supply, with an average annual growth rate of 9.7%, whereas R&D showed an 8.8% growth rate.
Table 3 shows the added value of KIBSs and their share in the Korean economy. The value-added share of all the KIBS sectors in the Korean economy was 6.2% in 2010 and 9.1% in 2019, with an average annual growth rate of 9.3%. It is evident that these figures are higher than the average annual growth rate of 4.8% in terms of Korea’s added value. In addition, it was higher than the total output share of 7.2% in 2019. However, the average annual growth rate was 9.3%, which was slightly lower than the average annual growth rate of the total output of 9.6%.
Considering the KIBS subcategories, the value-added proportion of T-KIBSs increased from 5.2% in 2010 to 7.6% in 2019, and the average annual growth rate was 9.4%, and that of P-KIBSs increased from 1.0% in 2010 to 1.4% in 2019. The annual average rate was 8.7%, indicating a higher proportion and growth rate for T-KIBSs than for P-KIBSs. Among the detailed classifications of the KIBS sectors, the industries with the highest added value as of 2019 were R&D, corresponding to T-KIBSs at 3.0%, and software development supply at 2.1%, with average annual growth rates of 9.6% and 12.1%, respectively.

3. Data and Methodologies

This study is an analysis and comparison of the degree of influence and role of the entire KIBS sector, T-KIBSs (a new technology-based professional service), P-KIBSs (a traditional professional service), and sub-sectors on the Korean economy. For this purpose, among the input–output analysis methodologies, an analysis was conducted on the industry linkage effect, which involved an examination of the forward and backward effects of each research target industry, the production inducement effect of the demand inducement model, the value-added inducement effect, and the supply shortage effect of the supply inducement model. In addition, an exogenous specification method was used to distinguish between the indirect ripple effect of the industry under analysis in other industries and the direct ripple effect of the subject of analysis [51].

3.1. Input–Output Table

The input–output table is a comprehensive statistical table that records the inter-industry trade relationships of goods and services produced in a country over a period of time [45]. Input–output analysis using this method is advantageous for analyzing the economic structure based on inter-industry relationships [52]. In addition, input–output analysis shows how changes in the level of production in one sector generate continuous demand for the products of other sectors; this is a general equilibrium model that emphasizes the link between sales and purchases of inputs. Owing to its nature, it is a useful method for analyzing and predicting the overall economic impact [52].
Therefore, this study involved an industry linkage analysis using the 2019 industry linkage table published by the Bank of Korea in 2022 to examine the influencing relationships and roles of KIBS sectors on the Korean economy.

3.2. Input–Output Analysis

3.2.1. Demand Inducement Model

This study is based on an examination of the production inducement and value-added inducement effects among detailed demand inducement models. Here, production-inducement effects and value-added inducement effects refer to the direct and indirect production inducement and value-added inducement amounts on the same industry and other industries when KRW 1 is produced or invested in the industry being analyzed. To calculate this effect, Equations (1)–(4) were used.
The input coefficient ( α i j ) in Equation (1) is the intermediate input amount ( x i j ) of raw materials purchased by each industrial sector from other industrial sectors for the production of the goods and services of that industrial sector divided by the total input amount ( x i ) [53]. If this is expressed in the same array form as the endogenous part of the input–output table, it becomes the input coefficient matrix (A). The input coefficient ( α i j ) is calculated using the input–output table that reclassifies each of the industries subject to analysis. Equation (1) is as below.
Inter - industry   input   coefficient   α i j = X i j X i  
-
x i : Input amount in subsector i ;
-
x i j : Input amount in subsector j by intermediate input x i .
The production inducement coefficient converts the industry subject to be analyzed into an exogenous variable and then uses basic Equation (2).
Production   inducement   coefficient   α i j = ( I A ) 1 A s
-
A s : Row vector of the input coefficients of the reclassified industries subject to analysis;
-
I : Diagonal matrix of 1 (diagonal matrix);
-
A : Input coefficient ( α i j ) matrix.
The value-added coefficient in Equation (3) is the sum of the added value of each industrial sector in the input–output table divided by the total output.
Value   added   coefficient   of   the   subsector j ,       v j = V j X i
-
v j : Added value of subsector j .
The added value inducement coefficient, Equation (4), is calculated by multiplying the added value coefficient derived from Equation (3) by the production inducement coefficient derived from Equation (2) [53]. This refers to the net national economic value that can be obtained from the industry being analyzed.
V a l u e   a d d e d   i n d u c e m e n t   c o e f f i c i e n t = v i ˇ ( I A ) 1 A s
-
v i ˇ : Diagonal vector of the value-added coefficient;
-
( I A ) 1 A s : Production inducement coefficient.

3.2.2. Supply Inducement Model

The supply shortage effect indicates the degree of production reduction in other industries, excluding the target industry, when the production of the target industry is not produced by KRW 1 [51].
To calculate these supply shortage effects, the output coefficient ( R i j ) in Equation (5) is first created using the output coefficient table [51]. This is the number of intermediate inputs, such as raw materials, purchased from other sectors for production in that sector, divided by the total output [51].
Output   coefficient   of   the   inter - industry   effect   of   i j   R i j = X i j X j
-
x j : Output of subsector j ;
-
x i j : Output amount in subsector i by intermediate output x j .
The supply shortage coefficient is calculated by exogenizing the industry subject for analysis and using the following basic model Equation (6).
Supply   Shortage   coefficient = R s ( I R ) 1
-
R s : Output coefficient horizontal vector of the subsector;
-
I : One diagonal matrix with a diagonal vector 1;
-
R : Output coefficient matrix ( r i j ).

3.2.3. Industry Linkage Effect

The industry linkage effect consists of backward linkage effects ( B L j ) and forward linkage effects ( F L i ). Here, the forward linkage effect ( F L i ) in Equation (7) is the value calculated by dividing the row sum of the production inducement coefficient ( α i j ) matrix of the industry by the average of all industries [53], which represents all final demands in all sectors as one unit. It indicates the ratio of the units that the i th industry must produce in order to increase the unit to the average value of all industries.
F L i = 1 n j = 1 n α i j 1 n 2 i = 1 n j = 1 n α i j  
The backward linkage effects ( B L j ), Equation (8), are the sum of the columns of the production inducement coefficient matrix of the industry being analyzed divided by the average of all industries. This refers to the influence on all industrial sectors when one unit of final demand for the industry is generated [53].
B L j = 1 n i = 1 n α i j 1 n 2 i = 1 n j = 1 n α i j

3.3. Research Procedure and Reclassification of KIBS

This study investigates the role of KIBSs as a tool for economic system innovation. Utilizing input–output tables for input–output analysis, the research applied the demand inducement model, supply inducement model, and interlinkage effects to examine various economic ripple effects. The objective was to understand the role of the KIBS sector in an economic system and to quantify its economic ripple effects, thereby discerning how the KIBS sector functions as a tool for economic system innovation.
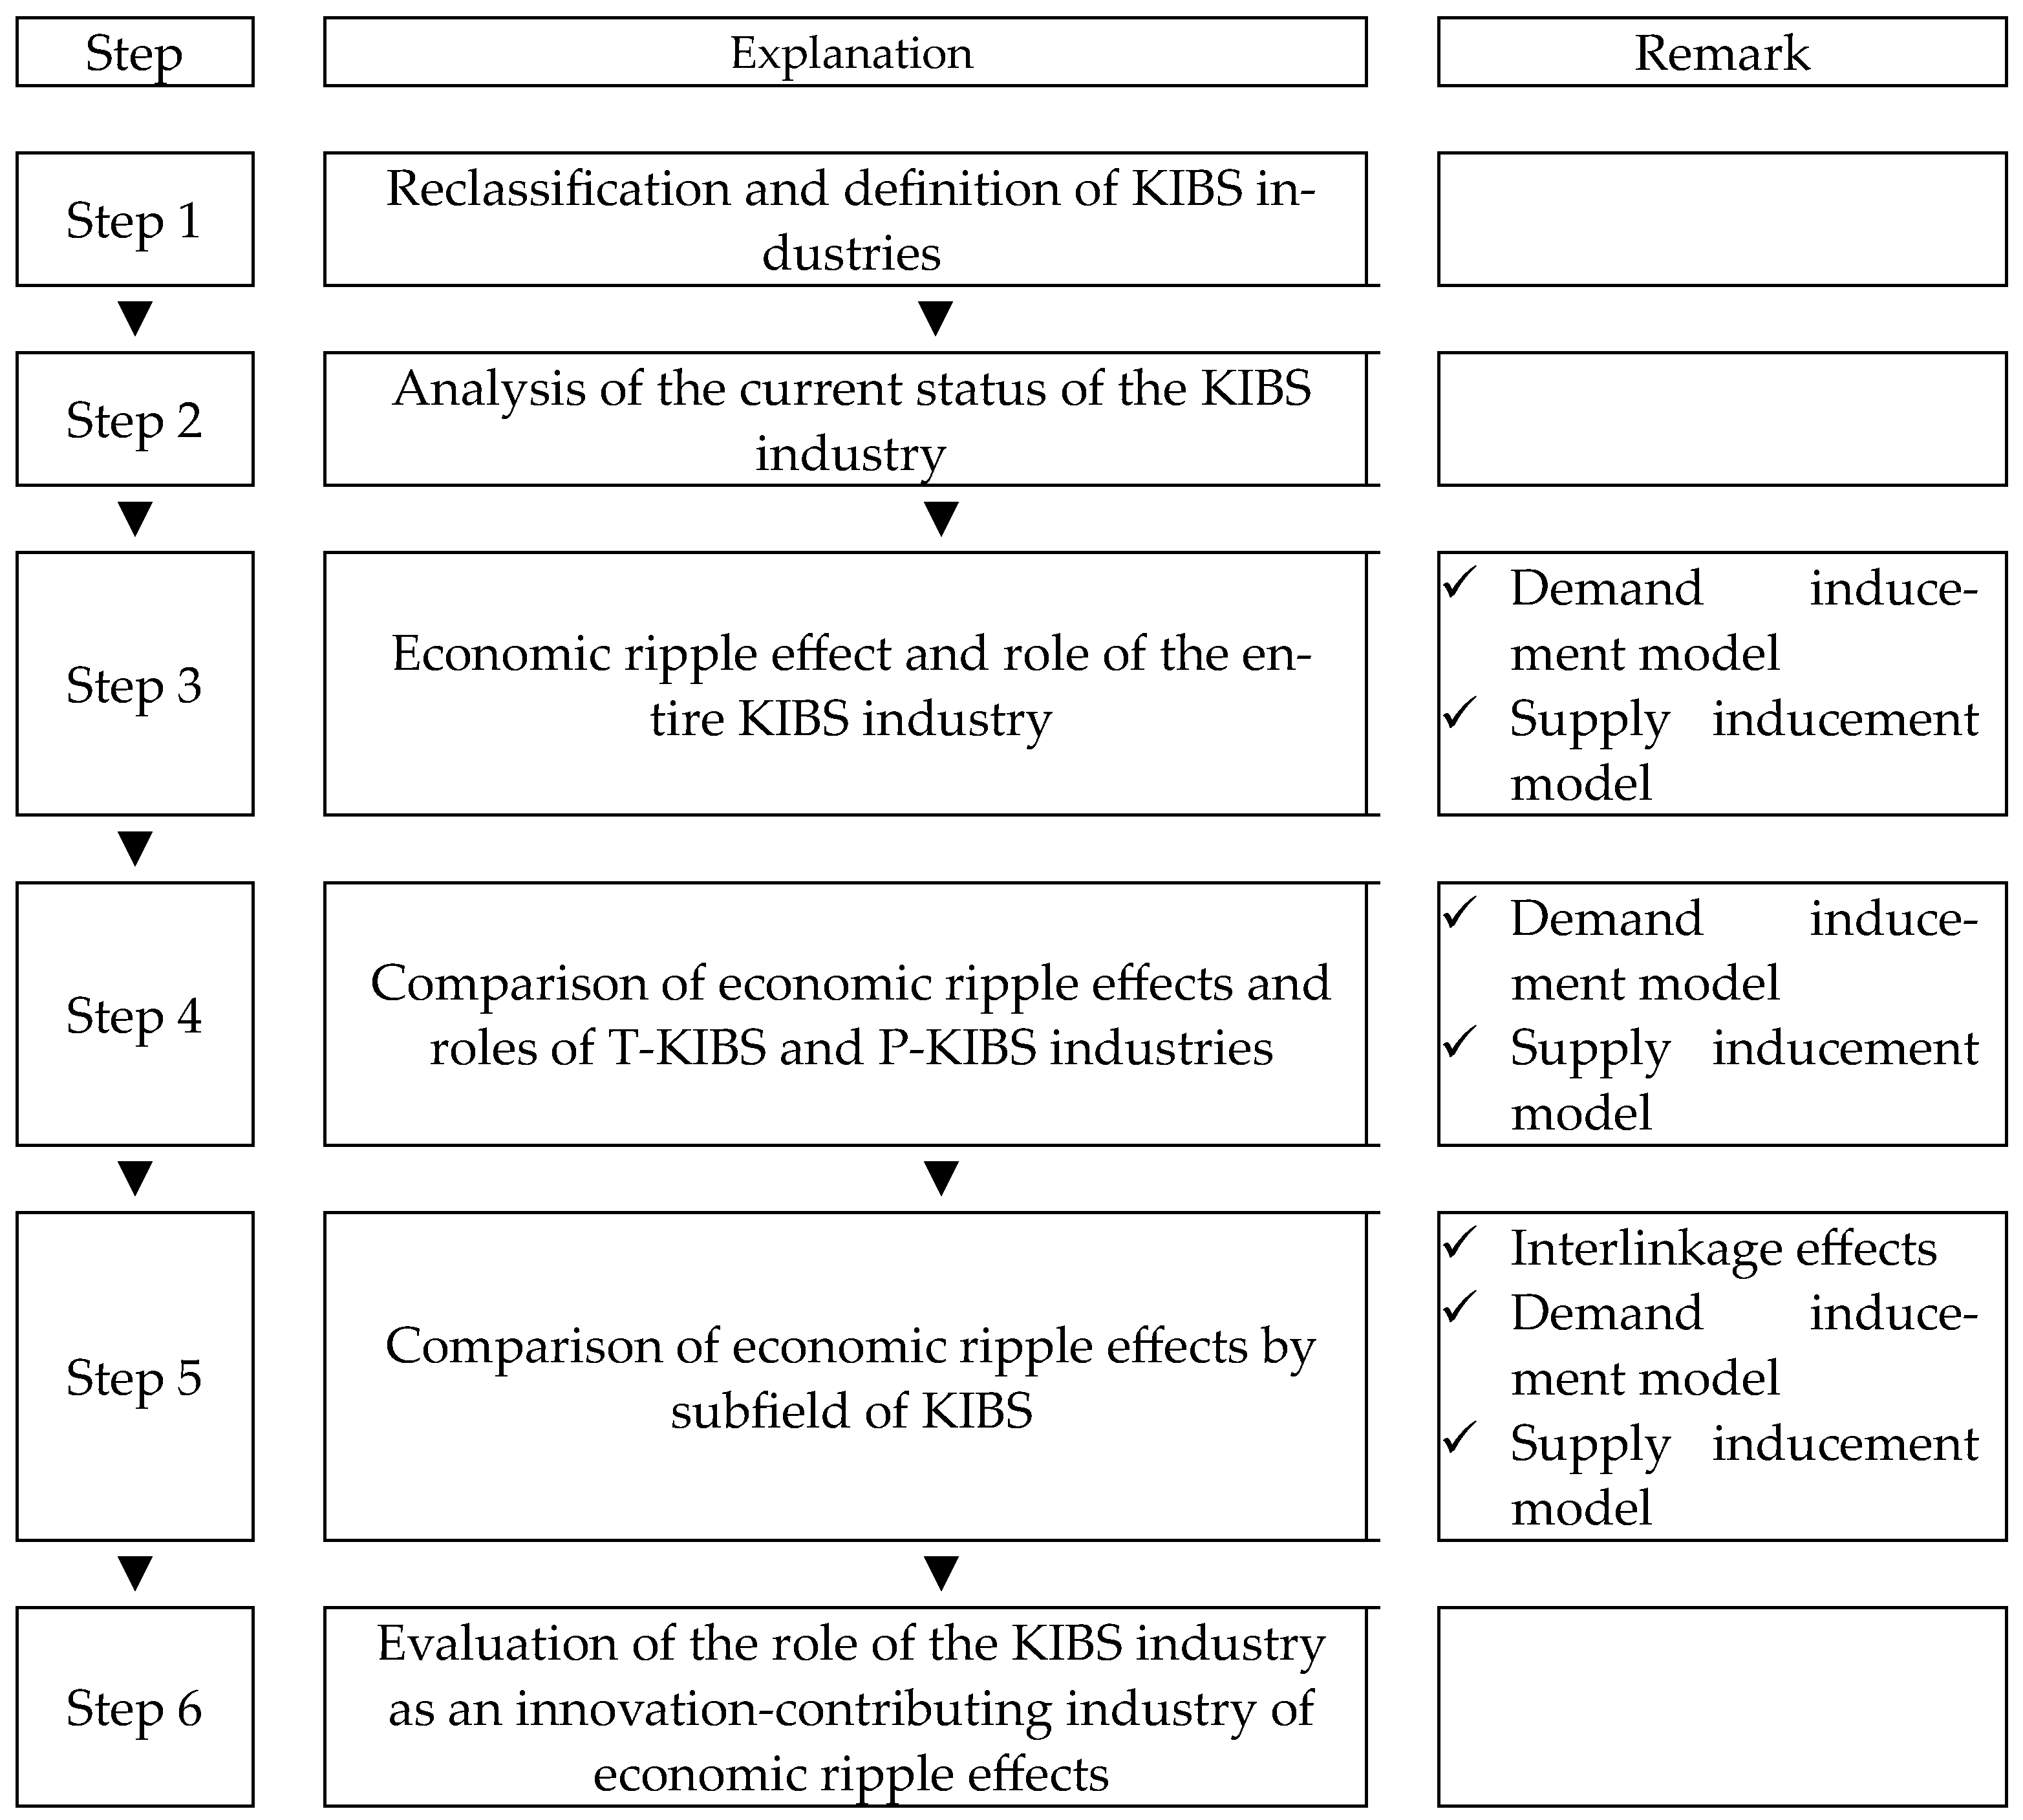
To differentiate this research and provide specificity for the role of KIBSs, we distinguished KIBSs from T-KIBSs and P-KIBSs. This study examined the economic ripple effects and roles of each industry in these classifications. The specific research procedure is detailed in Figure 1, with the goal of delineating the distinctive roles and economic impacts of T-KIBSs and P-KIBSs.
The steps of this study are illustrated in Figure 1. Step 1 is a necessary preliminary step in examining the role of the KIBS sector in the Korean economic system. To this end, based on previous works in the literature, KIBSs are classified in detail according to their characteristics, and the industry is reclassified in a form that can be analyzed. Currently, KIBS entities are divided into the entire KIBS industry, technology-based KIBSs, and P-KIBSs, which are classified as traditional professional services. In addition, each detailed KIBS subindustry is classified for analysis.
Step 2 presents the analysis of the status of the KIBS industry. The second step examines the share of the KIBS industry and the value-added output in the KIBS industry, the KIBS industry classifications, and the detailed classifications.
Steps 3–4 examine the impact of KIBSs on the overall Korean economic system and the differences in the economic ripple effects of T-KIBSs and P-KIBSs on the Korean economic system. For this purpose, we analyzed the supply shortage effects, which are the production inducement, value-added inducement, and supply shortage effects of the demand inducement model. Through the results, we can specifically identify which industries the KIBS sector influences in the Korean economic system.
Step 5 analyzes the demand inducement, supply inducement, and interlinkage effects for each sector to examine the roles and ripple effects of each KIBS subcategory in the Korean economic system. We also compared the KIBS, T-KIBS, and P-KIBS results analyzed previously.
Finally, Step 6 uses the literature review and analysis presented above to evaluate the role of KIBSs as a tool for innovation in the Korean economic system.
Table 4 presents the industrial classifications used in this study. First, for industrial linkage analysis, the KIBS sector, the industry subject to analysis, is reclassified and redefined as a single industry. In addition, to understand the impact of the industry being analyzed on other industries, each industry is presented based on the Bank of Korea Input–Output Table of Industrial Representative Classifications.
Looking at the KIBS reclassification, eight industries fall into this category based on the Bank of Korea’s industrial classifications’ subclassifications. Among these, six industries fall under T-KIBSs: J (610)—information services, J (621)—software development supply, J (629)—other IT services, M (700)—R&D, and M (721)—architecture, which includes civil engineering services, and M (729)—other science, technology, and professional services. In addition, P-KIBSs include two industries: M (711)—legal and management support services and M (721)—advertisement.

4. Results

This section presents the results of Steps 3–5 of the analytical process. The data used in the analysis were analyzed using the 2019 industry correlation table published by the Bank of Korea in 2022.
First, in Section 4.1, we treat the eight sectors of the KIBS industry as a single industry and examine their overall impact on the South Korean economy. Following that, in Section 4.2 and Section 4.3, we delve into the individual impacts of T-KIBSs and P-KIBSs on the entire South Korean economy, as well as the mutual influence between the two types of KIBSs. Finally, to understand the roles of specific sectors within the KIBS sector and their impact on the South Korean economy, the economic ripple effects of each sector are compared.

4.1. Results of the Economic Ripple Effect in the KIBS Industry

Table 5 examines the ripple effects of the KIBS sector on the Korean economy through the demand inducement model, production inducement effects, value-added inducement effects, and the supply inducement model’s supply shortage effects.
First, production inducement effects indicate how much production is induced in other industries when KRW 1 of final demand is generated in the sector being analyzed (or can be interpreted as investment). The KIBS sector showed that when the final demand of an industry was KRW 1, the production inducement from other industries was KRW 0.8. At this time, the production inducement effects of the industry were KRW 1.195, showing a total of KRW 1.995 of production inducement effects.
Looking at the sectors in which KIBSs have the largest indirect ripple effect on other industries, C09—computers, electronics, and optics—had the highest at KRW 0.075, followed by C05—chemicals, at KRW 0.063; N—business services, at KRW 0.058; J—broadcasting and newspaper and publishing—showed an effect of KRW 0.055. Conversely, the sectors with the lowest scores were P—education services (KRW 0.001), O—public administration, defense, and social security (KRW 0.001), and others (KRW 0.002). The indirect effect of production inducement on the primary industry was KRW 0.053 for accounting, for a rate of 6.6%; the secondary industry effect, corresponding to the manufacturing industry, was KRW 0.341, accounting for 42.6%; and the tertiary industry effect, corresponding to the service industry, was KRW 0.406, accounting for 50.8%.
Value-added inducement effects indicate how much added value is induced in other industries when KRW 1 of final demand is generated in the sector being analyzed (or can be interpreted as investment). The indirect effect of the KIBS sector on inducing added value in other industries was found to be KRW 0.330, and the added value induced by the industry itself was KRW 0.551, for a total of KRW 0.881. The sector that generated the most added value due to KIBSs was N—business services—with KRW 0.039, followed by C09—computers, electronics, and optics—with KRW 0.030, and L—real estate services—with 0.027. Conversely, the least affected sector was T—others—with a value close to 0, P—education services—with KRW 0.001, and O—public administration, defense, and social security—with KRW 0.001. KIBS’ indirect value-added inducement effects were KRW 0.026 or 7.8% for the primary industry, KRW 0.106 or 32.0% for the secondary industry, and KRW 0.198 or 60.2% for the tertiary industry. Value-added inducement effects were found to have a greater impact on the tertiary industry than production inducement effects.
The following supply shortage effects can be used to determine how much production fails to occur in other industries when the industry being analyzed does not produce KRW 1; that is, when KRW 1 is not supplied. The supply shortage effects of the KIBS sector on other industries totaled KRW 1.144. The most affected sector was C05—chemicals—at KRW 0.113, followed by construction at KRW 0.107, G—wholesale and retail trade services—at KRW 0.086, and C12—transportation equipment—at KRW 0.084. In contrast, the sectors least affected by KIBSs were T—others—at KRW 0.001, minerals (KRW 0.001), and E—water, waste disposal, and recycling services (KRW 0.006). Supply shortage effects were found to affect the primary, secondary, and tertiary industries by 1.2%, 50.7%, and 48.0%, respectively. Compared to the production and value-added inducement effects analyzed previously, the supply shortage effects on the primary industry were found to be low. However, the impacts on secondary and tertiary industries appeared even.

4.2. Results of the Economic Ripple Effect of the T-KIBS Industry

This section is an examination of the ripple effects of T-KIBSs on South Korea’s economy (Table 6). Through this analysis, the impact of T-KIBSs and their influence on P-KIBSs were investigated. First, looking at production inducement effects, the impact of T-KIBSs on other industries was found to be KRW 0.687, and the effect on their own industry was KRW 1.084, for a total of KRW 1.771. The sector most affected by T-KIBSs was C09—computers, electronics, and optics—at KRW 0.085, followed by C05—chemicals—at KRW 0.053, P-KIBSs at KRW 0.047, and transportation services at KRW 0.042. However, the least affected sectors were P—education services—at KRW 0.001, O—public administration, defense, and social security—at KRW 0.001, and T—others—at KRW 0.002. In addition, the primary industry’s rate was 5.7% with a KRW value of 0.039; for secondary industry, the rate was 45.7% with a KRW value of 0.314; and for tertiary industry, the rate was 48.7%.
The value-added inducement effect of T-KIBSs on other industries was KRW 0.272, the direct effect was KRW 0.654, and the total value-added inducement effect was KRW 0.926. The sector most affected by T-KIBSs was production inducement effects, with C09—computers, electronics, and optics—at KRW 0.034, followed by N—business services—at KRW 0.028, G—wholesale and retail trade services—at KRW 0.021, and L—real estate services—at KRW 0.017. The value-added inducement effect on P-KIBSs was KRW 0.014, showing the seventh largest impact among the 33 industries. In contrast, the least affected sector was T—others—which was close to 0, followed by P—education services—at KRW 0.001, O—public administration, defense, and social security—at KRW 0.001, and C13—other manufacturing products—at KRW 0.001. The primary industry represented KRW 0.019 (6.9%), the secondary industry was KRW 0.099 (36.4%), and the tertiary industry was KRW 0.154 (56.7%), respectively.
In the case of supply shortage effects, the effect of T-KIBSs on other industries was KRW 0.730, of which the most affected sector was construction (KRW 0.104), followed by C12—transportation equipment (KRW 0.056), C05—chemicals (KRW 0.046), and C09—computers, electronics, and optics (KRW 0.046). In addition, the supply shortage effect of T-KIBSs on P-KIBSs was KRW 0.041, the sixth highest. In contrast, the least affected sectors were B—minerals—at KRW 0.001, T—others—at KRW 0.001, and C13—other manufacturing products—at KRW 0.004. The primary, secondary, and tertiary industries accounted for 1.2%, 43.8%, and 55%, respectively.

4.3. Results of the Economic Ripple Effect of the P-KIBS Industry

This section is an examination of the ripple effects of P-KIBSs on the Korean economy (Table 7). In addition, this study examined the effect of P-KIBSs on T-KIBSs. First, looking at the production inducement effects, the ripple effect of P-KIBSs on other industries was KRW 1.472 and the direct effect was KRW 1.086, resulting in a total effect of KRW 2.558. Looking at the sectors in which P-KIBSs had the greatest impact, J—broadcasting, newspaper, and publishing—had the largest at KRW 0.136, followed by N—business services—at KRW 0.111, T-KIBSs at KRW 0.120, and D—electricity, gas, and steam—at KRW 0.102. Conversely, the industries least affected were P—education services—at KRW 0.002, O—public administration, defense, and social security—at KRW 0.002, and T—others—at KRW 0.003. Among the indirect effects, the impacts on primary, secondary, and tertiary industries were KRW 0.101 (6.8%), KRW 0.471 (32.0%), and KRW 0.901 (61.2%), respectively.
In the case of value-added inducement effects, the indirect effect of P-KIBSs on other industries was KRW 0.646, and the direct effect was KRW 0.301 for a total of KRW 0.947. Among the indirect effects, the sectors that showed the largest effect were N—business services at KRW 0.075; T-KIBSs at KRW 0.067; J—broadcasting and newspapers and publishing—at KRW 0.057; and L—real estate services—at KRW 0.057. In contrast, the least affected sector was T—others—with a value close to 0, followed by P—education services and O—public administration, defense, and social security with KPW 0.001 each, and C06—nonmetallic mineral products—with KRW 0.002. Among the indirect effects, the impacts on the primary, secondary, and tertiary industries were KRW 0.048 (7.5%), KRW 0.141 (21.9%), and KRW 0.457 (70.7%), respectively.
In the case of supply shortage effects, the sectors most affected by P-KIBSs were C05—chemicals—at KRW 0.301, G—wholesale and retail trade services—at KRW 0.234, C12—transportation equipment—at KRW 0.175, and F—construction—at KRW 0.133, while T-KIBSs had an effect of KRW 0.118. It was ranked seventh highest. However, the least affected sectors were T—others—at KRW 0.002, B—minerals—at KRW 0.003, and E—water, waste disposal, and recycling services—at KRW 0.013. Thus, the supply shortage effect of P-KIBSs on other industries was found to total KRW 2.657, of which the primary industry accounted for KRW 0.029 or 1.1%, the secondary industry accounted for 51.5% with an effect of KRW 1.368, and the tertiary industry accounted for 51.5% with an effect of KRW 1.368. This accounted for 47.4% (KRW 1.261).

4.4. Results of the Economic Ripple Effect of KIBS Sectors

4.4.1. Results of Interlinkage Effects by KIBS Sectors

Table 8 presents the interlinkage effects of T-KIBSs, P-KIBSs, and KIBSs. This allowed us to examine the role of each KIBS department in detail. First, the interlinkage effects were divided into forward and backward linkage effects. Here, forward linkage effects view the output of the analysis target as a raw material resource from another industry, while backward linkage effects, on the contrary, view the analysis target as a final good and view other industries as providing raw materials.
Based on this result, Yoo and Yoo (2009) divided the interlinkage effects into four types based on a value of 1 for each backward-linkage effect: “First, if the coefficients of all Backward linkage effects are high, it is a medium-demand manufacturing type. Second, if Backward linkage effects are low and Forward-linkage effects are high, it is a medium-demand primitive industry type. Third, if Forward linkage effects are low and Backward linkage effects are high, it is a medium-demand manufacturing type. If it is high, it is called final demand manufacturing type. Fourth, if both forward linkage effects and backward linkage effects are low, it is called final demand type of primitive industry type” [51].
Based on this industry classification, the types of KIBS subsectors are classified as shown in Table 8. First, considering P-KIBSs, both forward and backward chain effects were greater than one; therefore, it was classified as a demand-manufacturing type. Legal and management support services, a detailed division of the P-KIBS sector, also appeared as the first-demand manufacturing type, with both forward and backward chain effects higher than one. Advertisement ranked third, with forward linkage effects lower than one and backward linkage effects higher than one. This is classified as final demand manufacturing. In the case of T-KIBSs, all backward linkage effects showed values lower than one; therefore, they were classified as the fourth final demand type of the primitive industry, and all detailed sectors were classified as the fourth area.
As a result of analyzing the interlinkage effects by reorganizing a total of eight detailed divisions of KIBSs into one division, this was classified as a second medium-demand manufacturing type with forward linkage effects higher than one and backward linkage effects lower than one.
In this way, it can be seen that each of the detailed divisions of KIBSs play a different role in the Korean economic system depending on industrial characteristics and maturity. In particular, this research confirmed that P-KIBSs and T-KIBSs perform distinctly different roles.

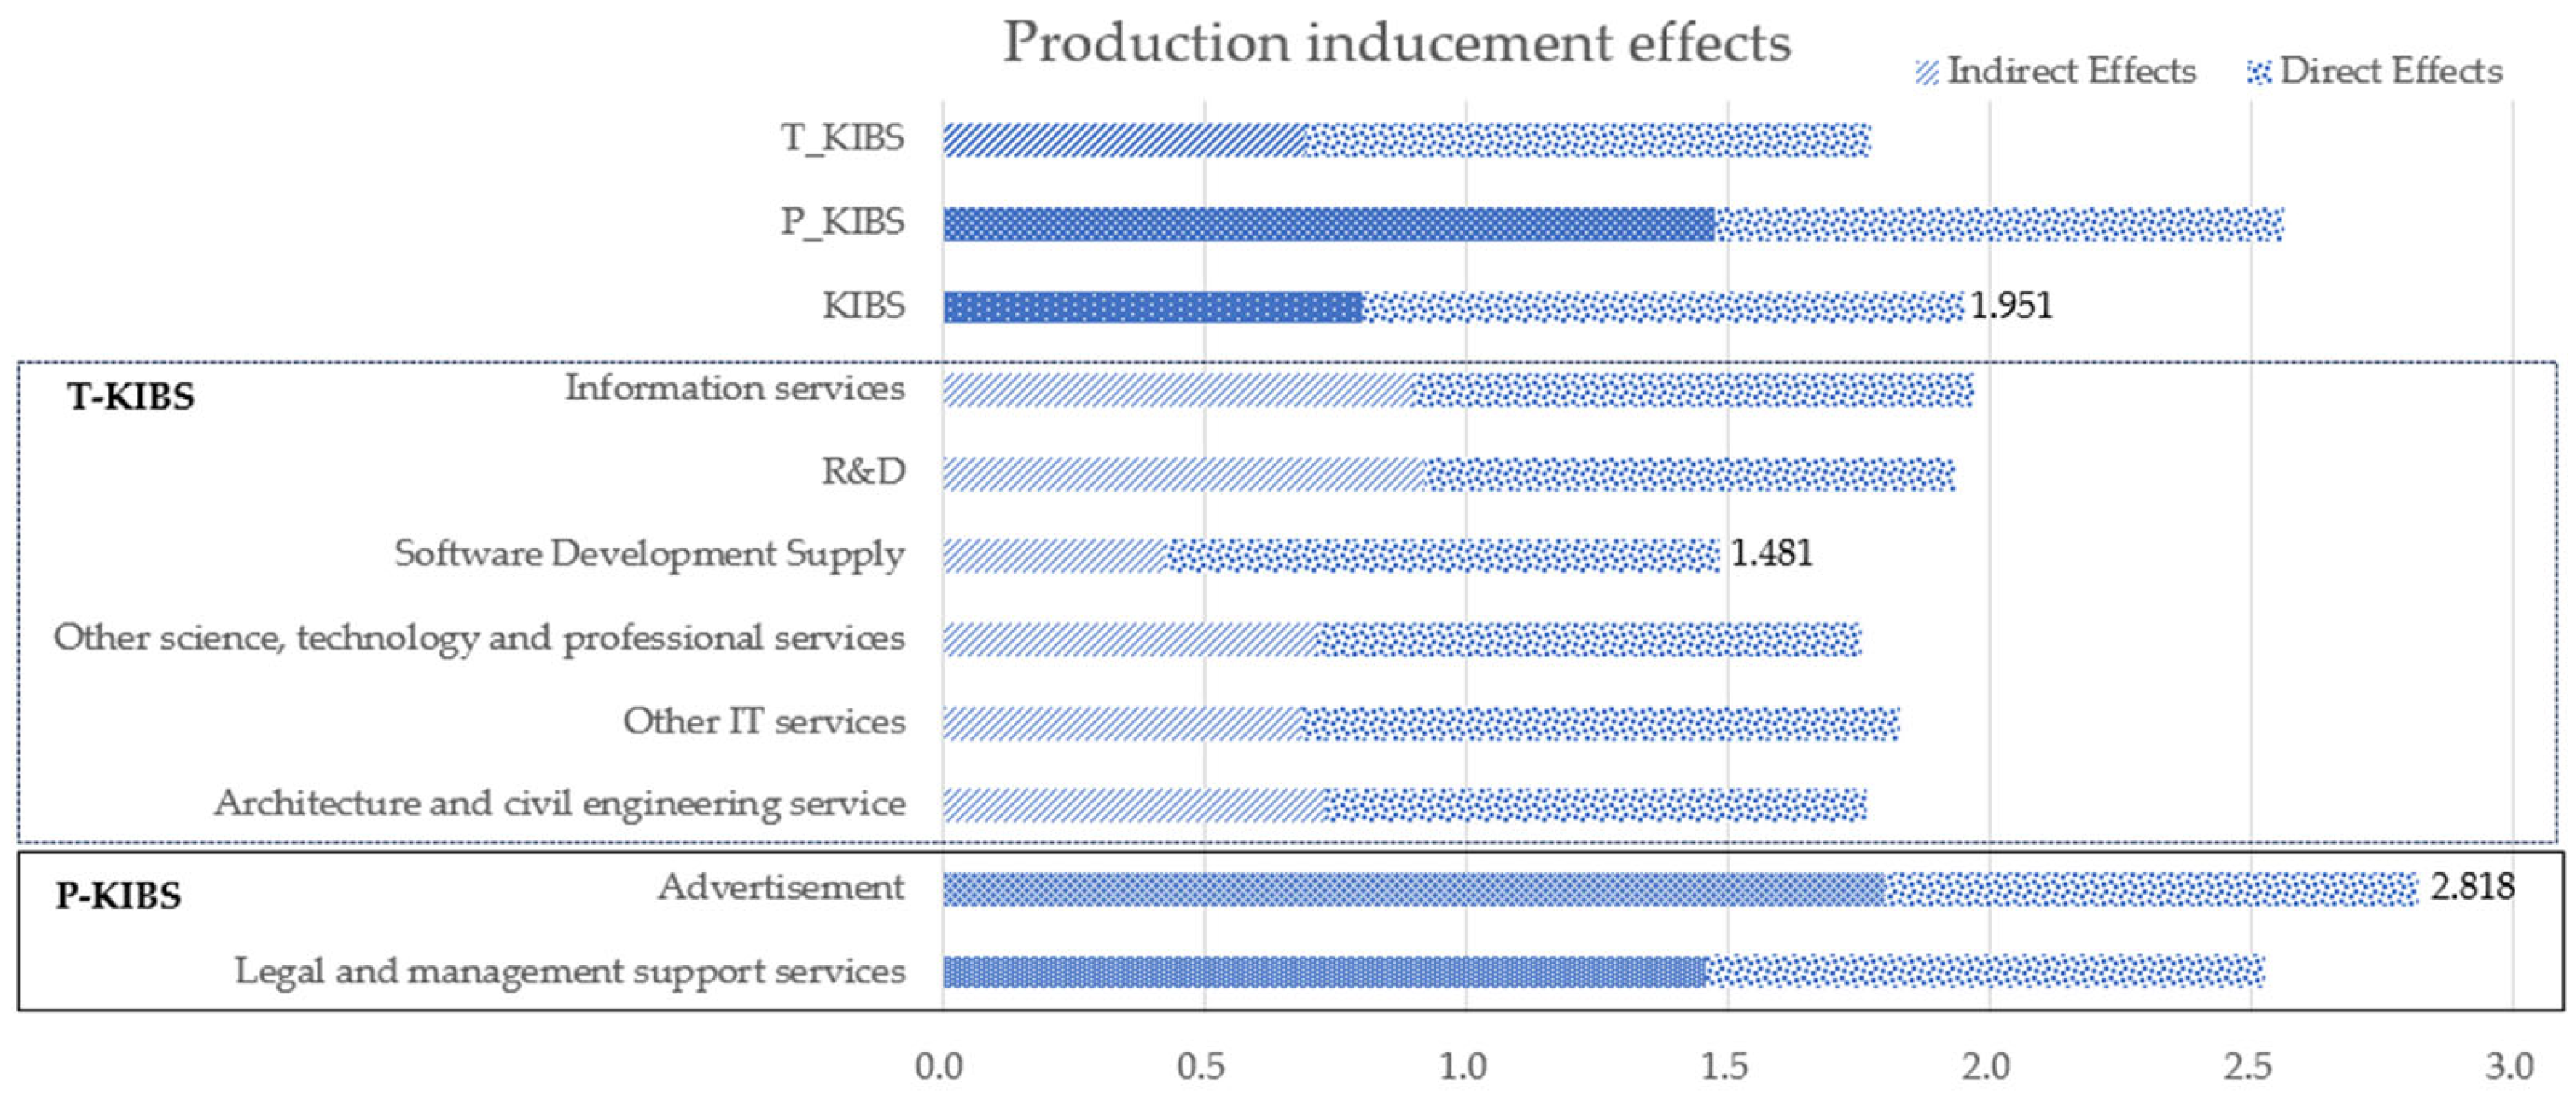
4.4.2. Results of Production Inducement Effects by KIBS Sectors

Table 9 compares the production inducement effects of the KIBS divisions. This table focuses on the differences in the indirect effects of each detailed KIBS sector and the proportion of the impact on each industry. First, looking at the indirect effect, advertisement, a subdivision of P-KIBSs, was the highest at KRW 1.801, followed by legal and management support services at KRW 1.455. However, the production inducement effects of T-KIBSs were weaker than those of P-KIBSs alone. Among these, the sector with the highest figure was R&D at KRW 0.920, followed by information services at KRW 0.896, and the sector with the lowest figure was software development supply at KRW 0.422. When P-KIBSs were analyzed as one sector, the production inducement indirect effect was found to be KRW 1.472, which was higher than the T-KIBSs’ KRW 0.687. When these two sectors were reorganized and analyzed as one KIBS sector, they were found to have an effect of KRW 0.800 (Figure 2).
When examining the production inducement effects of KIBSs on other industries, the impact on primary industries was found to be in the single digits, ranging from 2.8% to 7.6% across all detailed subsectors. In contrast, the effects on secondary industries ranged significantly from 18.9% to 47.6%. Among the detailed subsectors, advertisements within the P-KIBS subcategory had the least impact, whereas the sector had the most substantial influence.
The proportion of impact on tertiary industries varied, with R&D having the lowest at 45.0%, and advertisements showing the highest at 78.3%. When considering P-KIBSs and T-KIBSs as a single category for analysis, P-KIBSs demonstrated a more significant impact on secondary (32.0%) and tertiary industries (61.2%). By contrast, T-KIBSs exhibited a slightly higher influence on the secondary (45.7%) and tertiary industries (48.7%). T-KIBSs had a more balanced impact on both the secondary and tertiary sectors than P-KIBSs.

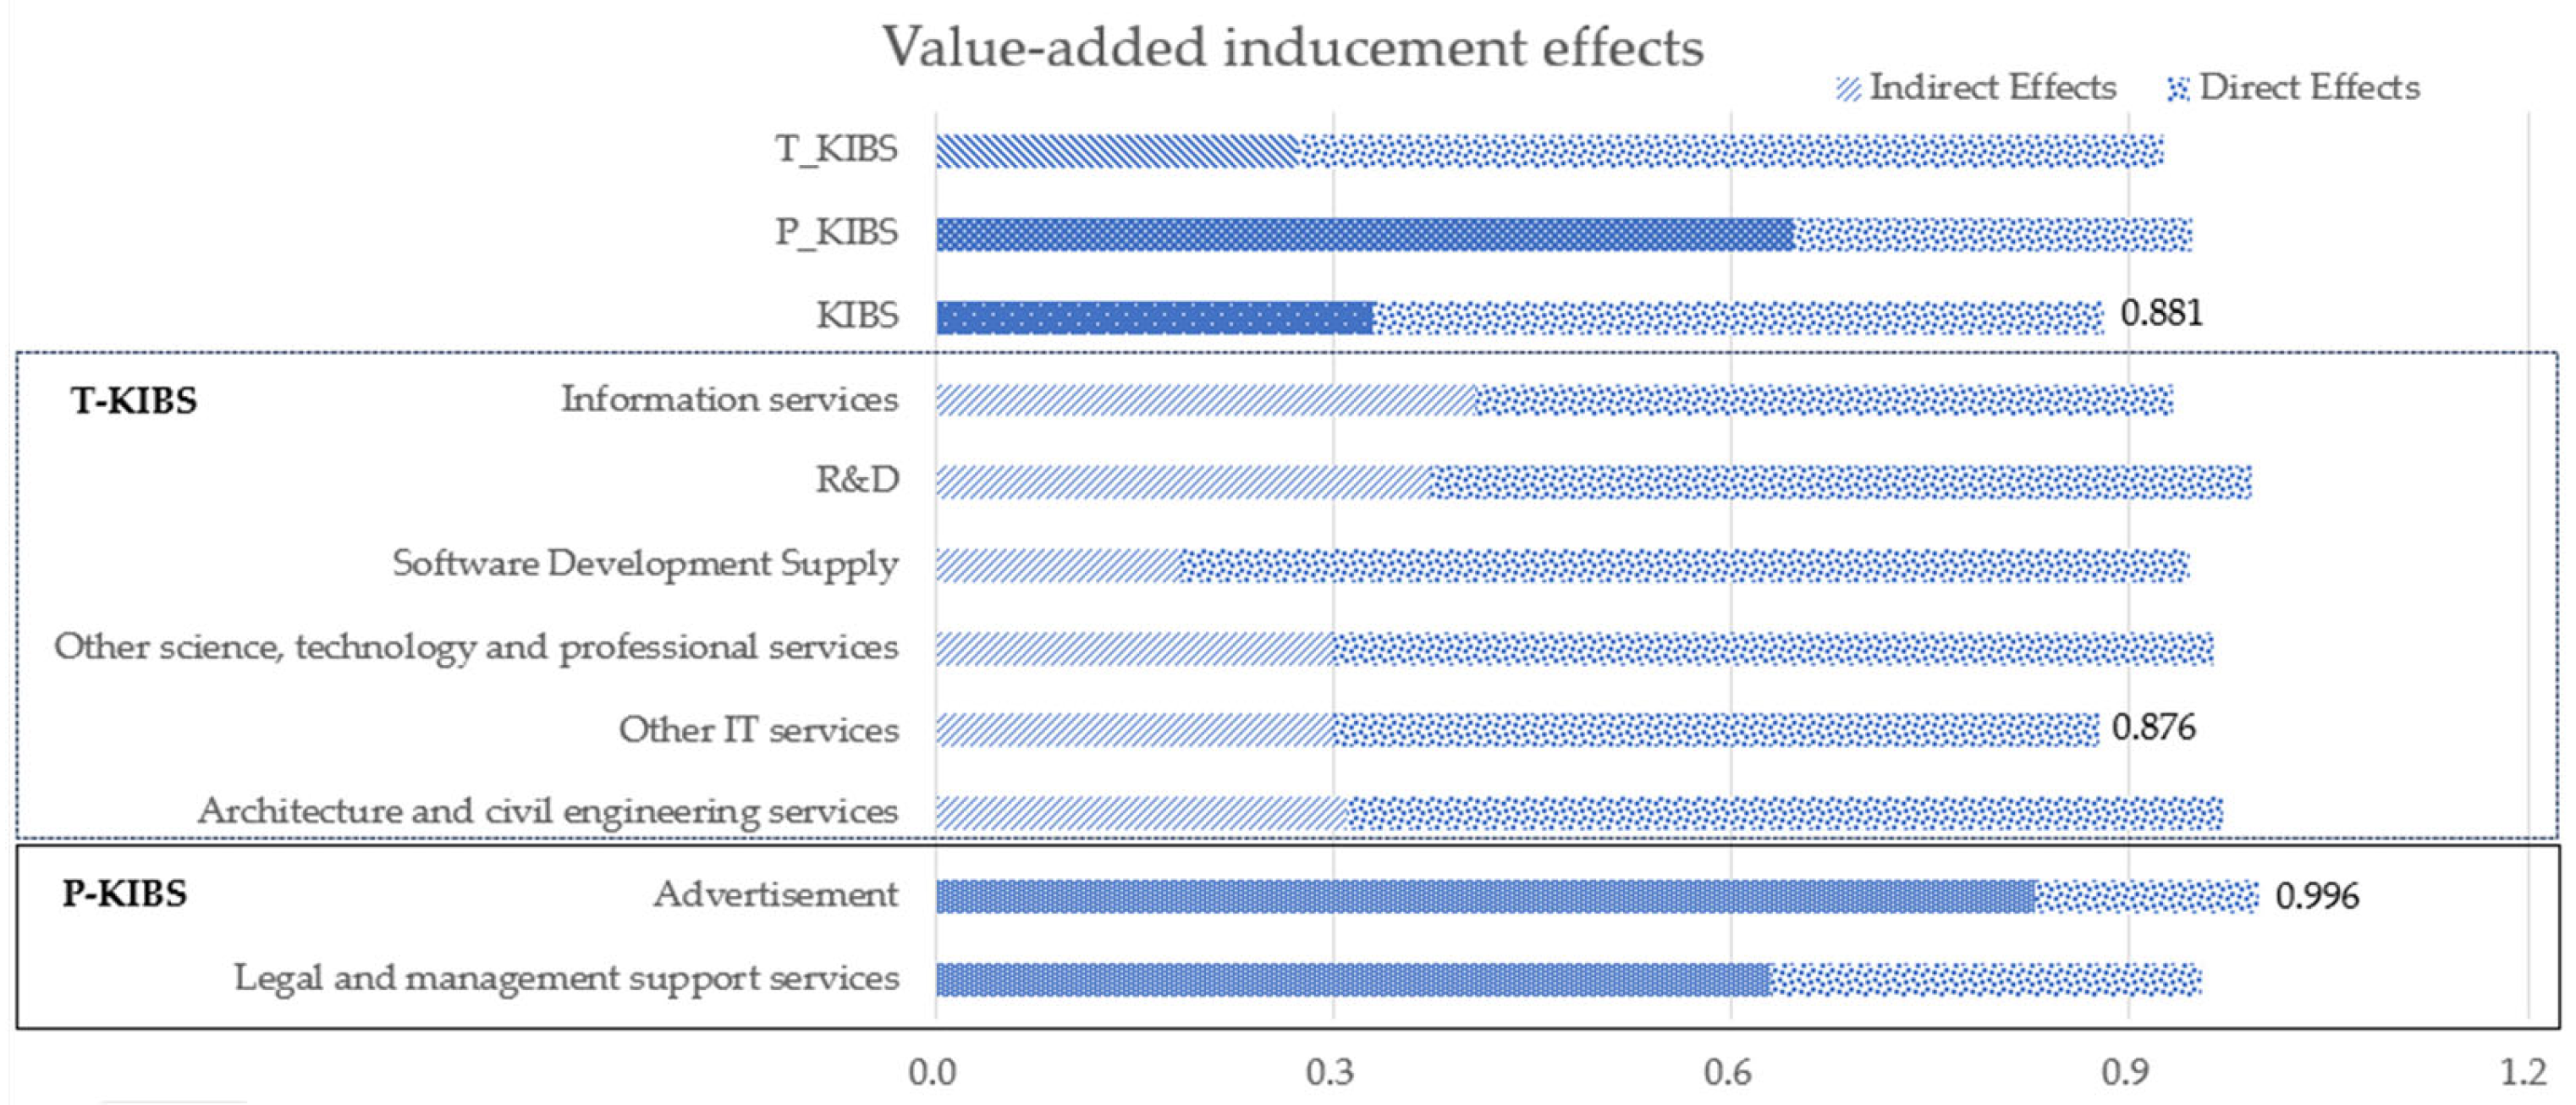
4.4.3. Results of Value-Added Inducement Effects by KIBS Sector

Table 10 compares the value-added inducement effects of the KIBS sectors. First, looking at the indirect effects on other industries, the sector with the greatest impact was advertisement, corresponding to P-KIBSs with a KRW value of 0.828, followed by legal and management support services with a value of KRW 0.63. Conversely, the sector with the least impact was software development supply, which corresponds to T-KIBSs, at KRW 0.184. Overall, the detailed sectors of T-KIBSs showed lower value-added inducement effects on industries other than P-KIBSs. However, when looking at the total effect, considering the sector’s own value-added inducement effects, advertisements showed the highest value at KRW 0.996, but their own value-added inducement effects were the lowest at KRW 0.169. The next was R&D, which was the highest, at KRW 0.991, and architecture and civil engineering services, which had a value of KRW 0.970 (Figure 3).
Analyzing P-KIBSs and T-KIBSs as one sector each, the value-added inducement effect on other industries for P-KIBSs was KRW 0.646, and for T-KIBSs it was KRW 0.272, which is more than twice the value of P-KIBSs. It showed a high value. However, if you look at the total effect, considering the direct effect, it can be seen that P-KIBSs had a value of KRW 0.947 and T-KIBSs had a value of KRW 0.926, which were approximate figures compared with the indirect effect. P-KIBSs showed a large indirect effect and T-KIBSs showed a larger direct effect; thus, there was no significant difference in the total effect.
Next, when examining the impact that KIBS sectors have on other industry sectors, the influence on primary industries ranged from a minimum of 2.9%, observed in advertisement, to a maximum of 8.5% in legal and management support services. In secondary industry, advertising was the lowest at 12.7%, and R&D was the highest at 37.9%. In tertiary industry, R&D was the lowest at 55.1%, and advertising was the highest at 84.4%. When analyzing P-KIBSs as a single sector, the primary, secondary, and tertiary industries accounted for 7.5%, 21.9%, and 70.7%, respectively. In addition, an analysis of T-KIBSs showed that 6.9%, 36.4%, and 56.7% of the industries were composed of primary, secondary, and tertiary industries, respectively. Both KIBS sectors had a large impact on tertiary industry, and P-KIBSs appeared to have an even greater impact on tertiary industry.

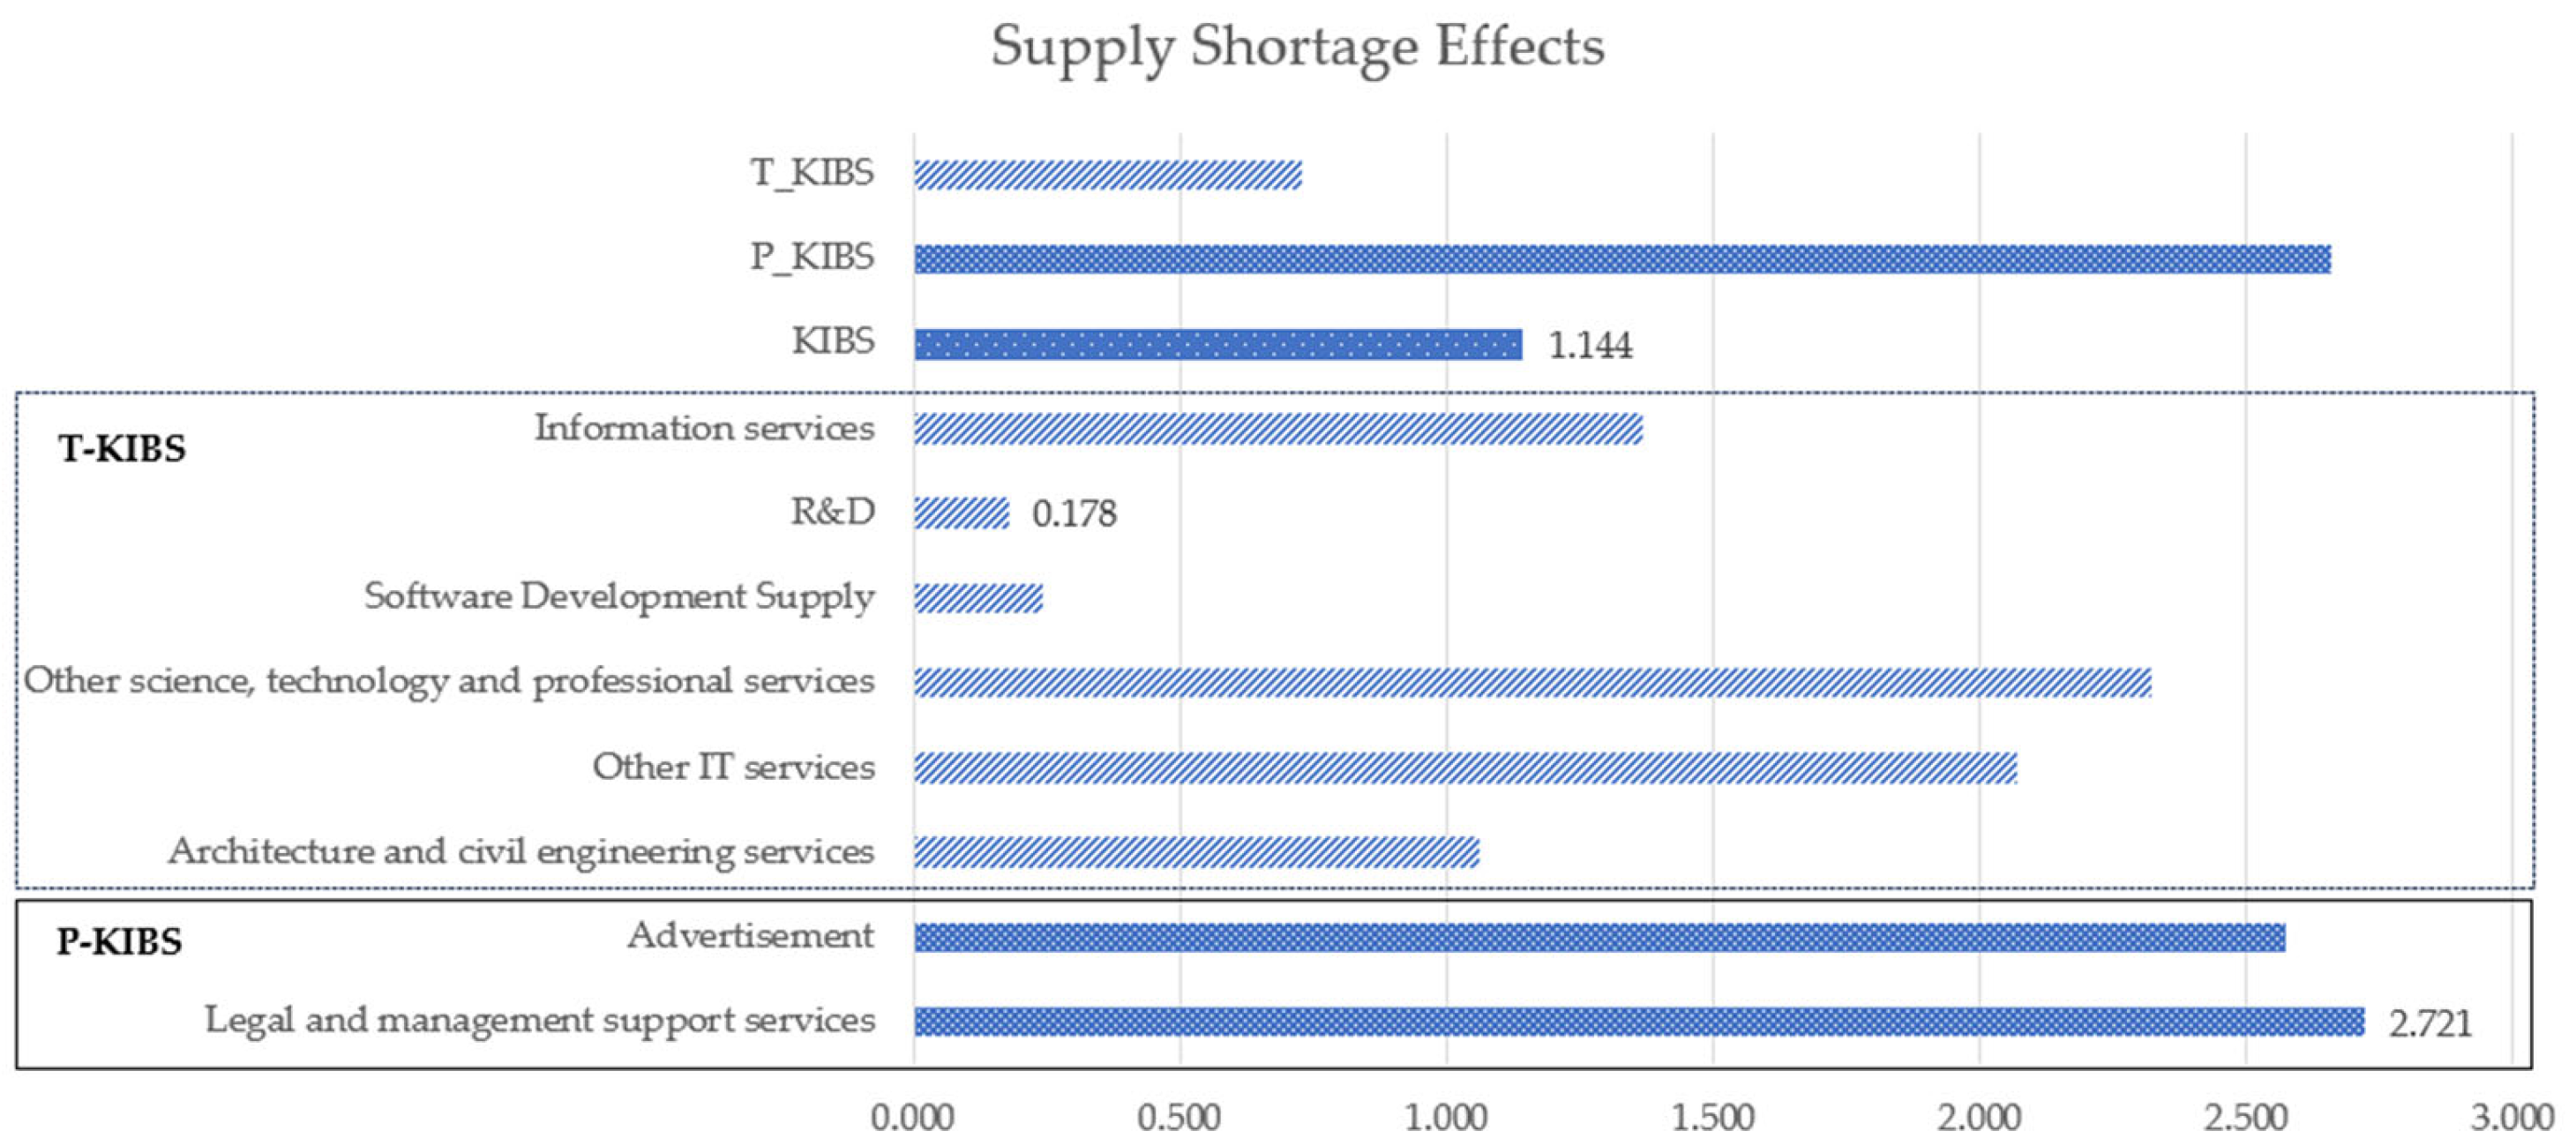
4.4.4. Results of Supply Shortage Effects by KIBS Sector

Table 11 compares the value-added inducement effects of the KIBS sectors. Among the KIBS subsectors, the sectors with the greatest supply shortage effects were the two P-KIBS subsectors, with legal and management support services at KRW 2.721 and advertisements at KRW 2.573. Next, other science- and technology-related services earned KRW 2.321 and other IT services earned KRW 2.071. Conversely, R&D showed the lowest figures, at KRW 0.178, and software development supply had a value of KRW 0.242. P-KIBSs showed a high supply shortage effect of KRW 2.657 and T-KIBSs showed KRW 0.730 (Figure 4).
When examining industry-specific proportions, it is evident that in the primary industry sector, architecture and civil engineering services ranged from 0.1% compared to other science and technology-related services at 1.9%, showing proportions lower than the production and value-added inducement effects. The impact on secondary industry was the lowest at 4.4% for architecture and civil engineering services and the highest at 68.7% for R&D. In the tertiary industry, R&D was the lowest at 30.7% and architecture and civil engineering services had the highest at 95.5%. For P-KIBSs, the primary, secondary, and tertiary industries accounted for 1.1%, 51.5%, and 47.4%, respectively; for T-KIBSs, the primary, secondary, and tertiary industries accounted for 1.2%, 43.8%, and 55%, respectively.
In the case of production and value-added inducement effects, both P-KIBSs and T-KIBSs had a significant impact on tertiary industry, and P-KIBSs had a greater impact on tertiary industry. However, in terms of supply shortage effects, P-KIBSs showed a higher impact on secondary industry, at 51.5%, than on tertiary industry. T-KIBSs showed that tertiary industries accounted for more than the majority (55.0%), but the proportion of influence on secondary industries was also high, at 43.8%.

5. Conclusions

In this study, we investigated the role of KIBSs, a sustainable innovation tool, in Korea’s economic system. For this purpose, the demand inducement, supply inducement, and interlinkage effects were analyzed using the 2019 industry linkage table published by the Bank of Korea for 2022. This method can identify the impact of the KIBS sector on the growth of other industries by analyzing production inducement effects, value-added inducement effects on the Korean economy, and their position in the Korean economic ecosystem through interlinkage effects. This analysis was conducted to compare and analyze each impact by analyzing the overall KIBS sector, T-KIBSs, P-KIBSs, and detailed subsectors of KIBSs. These methodologies and approaches can provide useful information when attempting to foster sustainable innovation in the national economy and enhance the KIBS industry by identifying the impact and role of sustainable innovation in a detailed analysis of KIBS subsectors.
The following implications can be drawn based on the results. First, the results confirmed that KIBSs are growing as an industry in the Korean economy. Examining the proportion of KIBSs allows us to demonstrate that the proportion of added value and job creation is high compared to the total output. In addition, the total output has grown rapidly at an average annual rate of 9.6% over the past 10 years. These results confirm that the demand for KIBSs in other industries is increasing.
Second, when examining the results of the interlinkage effects, indicators have emerged that clearly demonstrate distinct roles within the South Korean economic system based on the type of KIBS. All KIBSs were classified as medium-demand manufacturing, with forward linkage effects higher than the standard value of one and backward linkage effects lower than one. This can be attributed to the significant difference between the P-KIBS and T-KIBS results. This is because T-KIBSs showed a value lower than the previous backward linkage effects’ standard value of one and were classified as a final demand type of primitive industry, whereas P-KIBSs were classified as a demand manufacturing type higher than the standard value of one.
Third, the KIBS sector was confirmed to have different impacts on Korea depending on the impact indicators. In addition, it was confirmed that the differences varied depending on the KIBS type. The KIBS sector was found to have a high production inducement effect on other industries and affected secondary and tertiary industries evenly. Value-added inducement effects had a greater impact on tertiary industries than on secondary ones, and supply shortage effects appeared to have a greater impact on secondary industries than the results obtained through the demand inducement model. Looking at the KIBS details, P-KIBSs had a higher impact on industries than T-KIBSs for all indicators. However, this indicator alone cannot be used to determine the more important type of KIBS.
These results and implications can provide the following additional policy and academic implications. Unlike previous studies that predominantly focused on the manufacturing or service industries, this study explores the ripple effect by examining all sectors within the national economy. In contrast, prior studies have primarily focused on confirming differences in the presence and extent of impact [16,20] through econometric approaches. However, this study goes beyond that by investigating which industries are more significantly impacted by KIBS sectors and the specific effects they exert. These insights are substantiated through quantitative figures. Such an approach has proven to be valuable for analyzing KIBSs and providing support for sustainable innovation within the national economic system. The anticipated outcomes are expected to contribute substantially to the formulation of effective economic policies.
This approach became feasible due to the distinctive features of the input–output table and the diverse array of analysis models. Importantly, it holds significance not only for analyzing KIBSs as a collective industry group, utilizing the advantages provided by industry linkage analysis, but also for scrutinizing and comparing sub-detailed sectors. This approach enables a meticulous examination of the influencing relationships between KIBSs and other industries. Consequently, unlike previous studies, the outcomes presented in this study are anticipated to provide increased practical relevance in shaping economic policies, especially in fostering sustainable innovation within the national economy.
Despite these implications, this study has several limitations. First, it is difficult to clarify the reference points for the indicator results because comparisons with other countries have not been made. These issues pose a risk in that the interpretation and application of the results may differ depending on the people who use the data. We did not consider the scale of other industries in this study; therefore, additional research needs to be conducted to apply them to companies or specific industrial units.

Funding

This paper was supported by the Sahmyook University Research Fund in 2023.

Institutional Review Board Statement

Not applicable.

Informed Consent Statement

Not applicable.

Data Availability Statement

Data is contained within the article.

Conflicts of Interest

The author declares no conflicts of interest.

References

  1. The World Economic Forum. The Fourth Industrial Revolution: What It Means, How to Respond. 2016. Available online: https://www.weforum.org/agenda/2016/01/the-fourth-industrial-revolution-what-it-means-and-how-to-respond/ (accessed on 9 January 2024).
  2. Oláh, J.; Aburumman, N.; Popp, J.; Khan, M.A.; Haddad, H.; Kitukutha, N. Impact of Industry 4.0 on Environmental Sustainability. Sustainability 2020, 12, 4674. [Google Scholar] [CrossRef]
  3. Miles, I.; Kastrinos, N.; Flanagan, K.; Bilderbeek, R.; Den Hertog, P.; Huntink, W.; Bouman, M. Knowledge-Intensive Business Services: Users. In Carriers and Sources of Innovation; EIMS Publication: Bournemouth, UK, 1995; No. 15. [Google Scholar]
  4. Hertog, P.D. Knowledge-intensive business services as co-producers of innovation. Int. J. Innov. Manag. 2000, 4, 491–528. [Google Scholar] [CrossRef]
  5. Muller, E.; Doloreux, D. What we should know about knowledge-intensive business services. Technol. Soc. 2009, 31, 64–72. [Google Scholar] [CrossRef]
  6. Muller, E.; Zenker, A. Business services as actors of knowledge transformation: The role of KIBS in regional and national innovation systems. Res. Policy 2001, 30, 1501–1516. [Google Scholar] [CrossRef]
  7. Pina, K.; Tether, B.S. Towards understanding variety in knowledge intensive business services by distinguishing their knowledge bases. Res. Policy 2016, 45, 401–413. [Google Scholar] [CrossRef]
  8. Bessant, J.; Rush, H. Innovation Agents and Technology Transfer 1. In Services and the Knowledge-Based Economy; Routledge: London, UK, 2019; pp. 155–169. [Google Scholar]
  9. Hipp, C.; Grupp, H. Innovation in the service sector: The demand for service-specific innovation measurement concepts and typologies. Res. Policy 2005, 34, 517–535. [Google Scholar] [CrossRef]
  10. Toivonen, M. Expertise as Business: Long-Term Development and Future Prospects of Knowledge-Intensive Business Services. Ph.D. Thesis, Laboratory of Industrial Management, Helsinki University of Technology, Espoo, Finland, 2004. [Google Scholar]
  11. Wood, P. Consultancy and Innovation: The Business Service Revolution in Europe; Routledge: London, UK, 2003. [Google Scholar]
  12. Czarnitzki, D.; Spielkamp, A. Business services in Germany: Bridges for innovation. Serv. Ind. J. 2003, 23, 1–30. [Google Scholar] [CrossRef]
  13. Gotsch, M.; Hipp, C. Measurement of innovation activities in the knowledge-intensive services industry: A trademark approach. Serv. Ind. J. 2012, 32, 2167–2184. [Google Scholar] [CrossRef]
  14. Lafuente, E.; Vaillant, Y.; Vendrell-Herrero, F. Territorial servitization: Exploring the virtuous circle connecting knowledge-intensive services and new manufacturing businesses. Int. J. Prod. Econ. 2017, 192, 19–28. [Google Scholar] [CrossRef]
  15. Kohtamäki, M.; Partanen, J. Co-creating value from knowledge-intensive business services in manufacturing firms: The moderating role of relationship learning in supplier–customer interactions. J. Bus. Res. 2016, 69, 2498–2506. [Google Scholar] [CrossRef]
  16. Seclen, J.P.; Barrutia, J. KIBS and innovation in machine tool manufacturers. Evidence from the Basque Country. Int. J. Bus. 2018, 10, 112–131. [Google Scholar] [CrossRef]
  17. Mohan, P.; Strobl, E.; Watson, P. Innovation, market failures and policy implications of KIBS firms: The case of Trinidad and Tobago’s oil and gas sector. Energy Policy 2021, 153, 112250. [Google Scholar] [CrossRef]
  18. Bustinza, O.F.; Opazo-Basáez, M.; Tarba, S. Exploring the interplay between Smart Manufacturing and KIBS firms in configuring product-service innovation performance. Technovation 2022, 118, 102258. [Google Scholar] [CrossRef]
  19. Paallysaho, S.; Kuusisto, J. Intellectual property protection as a key driver of service innovation: An analysis of innovative KIBS businesses in Finland and the UK. Int. J. Serv. Technol. Manag. 2008, 9, 268–284. [Google Scholar] [CrossRef]
  20. Ciriaci, D.; Montresor, S.; Palma, D. Do KIBS make manufacturing more innovative? An empirical investigation of four European countries. Technol. Forecast. Soc. Change 2015, 95, 135–151. [Google Scholar] [CrossRef]
  21. Liu, Y.; Lattemann, C.; Xing, Y.; Dorawa, D. The emergence of collaborative partnerships between knowledge-intensive business service (KIBS) and product companies: The case of Bremen, Germany. Reg. Stud. 2019, 53, 376–387. [Google Scholar] [CrossRef]
  22. Almenar-Llongo, V.; Muñoz-de-Prat, J.; Maldonado-Devis, M. Growth of total productivity of the factors, innovation and spillovers from advanced business services. Econ. Res. Ekon. Istraživanja 2023, 36, 2172739. [Google Scholar] [CrossRef]
  23. Weber, G.; Mateescu, R.M.; Lange, S.; Rauch, M. Knowledge intensive business services (KIBS) in the context of changing energy economics in Germany. Amfiteatru Econ. J. 2016, 18, 89–103. [Google Scholar]
  24. Belousova, V.; Bondarenko, O.; Chichkanov, N.; Lebedev, D.; Miles, I. Coping with Greenhouse Gas Emissions: Insights from Digital Business Services. Energies 2022, 15, 2745. [Google Scholar] [CrossRef]
  25. Strambach, S.; Lindner, F. Border-crossing sustainable innovation processes: German knowledge-intensive business services (KIBS) in green construction. Sustain. Innov. Reg. Dev. Rethink. Innov. Milieus 2017, 27, 63–85. [Google Scholar]
  26. Schmitz, H.; Lema, R. The global green economy. In The Triple Challenge for Europe, 1st ed.; Oxford University Press: Oxford, UK, 2015; pp. 119–142. [Google Scholar]
  27. Roberts, J.; Miles, I.; Hull, R.; Howells, J.; Andersen, B. Introducing the new service economy. In Knowledge and Innovation in the New Service Economy; Andersen, B., Howells, J., Hull, R., Miles, I., Roberts, J., Eds.; Edward Elgar: Cheltenham, UK; Northampton, MA, USA, 2020; Chapter 1; pp. 1–6. [Google Scholar]
  28. Moulaert, F.; Djellal, F. Information technology consultancy firms: Economies of agglomeration from a wide-area perspective. Urban Stud. 1995, 32, 105–122. [Google Scholar] [CrossRef]
  29. Gallouj, F. Knowledge-intensive business services: Processing knowledge and producing innovation. In Productivity Innovation and Knowledge in Services; Gadrey, J., Gallouj, F., Eds.; Edward Elgar: Cheltenham, UK; Northampton, MA, USA, 2002; Chapter 11; pp. 256–284. [Google Scholar]
  30. Aslesen, H.W.; Isaksen, A. New perspectives on knowledge-intensive services and innovation. Geogr. Ann. Ser. B Hum. Geogr. 2007, 89 (Suppl. 1), 45–58. [Google Scholar] [CrossRef]
  31. Tether, B.; Howells, J. Changing understanding of innovation in services. Innov. Serv. 2007, 9, 21–60. [Google Scholar]
  32. Miles, I. Knowledge-intensives services an innovation. In The Handbook of Services Industries; Bryson, J.R., Daniels, P.W., Eds.; Edward Elgar: Cheltenham, UK; Northampton, MA, USA, 2007; pp. 246–275. [Google Scholar]
  33. Eurofound. The Future of Knowledge Intensive Business Services (KIBS) in Europe—Unlocking the Potential of the Knowledge Based Economy. 2006. Available online: https://www.eurofound.europa.eu/en/resources/article/2015/future-knowledge-intensive-business-services-kibs-europe-unlocking-potential (accessed on 10 January 2024).
  34. Bettencourt, L.A.; Ostrom, A.L.; Brown, S.W.; Roundtree, R.I. Client co-production in knowledge-intensive business services. Calif. Manag. Rev. 2002, 44, 100–128. [Google Scholar] [CrossRef]
  35. Bumberova, V.; Kanovska, L. Sustainable marketing strategy under globalization: A comparison of the P-KIBS and T-KIBS sectors. In SHS Web of Conferences, Proceedings of the 19th International Scientific Conference Globalization and Its Socio-Economic Consequences 2019—Sustainability in the Global-Knowledge Economy, Rajecke Teplice, Slovakia, 9–10 October 2019; EDP Sciences: Les Ulis, France, 2020; Volume 74, p. 01003. [Google Scholar]
  36. Koch, A.; Stahlecker, T. Regional innovation systems and the foundation of knowledge intensive business services. A comparative study in Bremen, Munich, and Stuttgart, Germany. Eur. Plan. Stud. 2006, 14, 123–146. [Google Scholar] [CrossRef]
  37. Miozzo, M.; Grimshaw, D. (Eds.) Knowledge Intensive Business Services: Organizational Forms and National Institutions; Edward Elgar Publishing: Cheltenham, UK; Northampton, MA, USA, 2006. [Google Scholar]
  38. Amara, N.; Landry, R.; Halilem, N.; Traore, N. Patterns of innovation capabilities in KIBS firms: Evidence from the 2003 statistics Canada innovation survey on services. Ind. Innov. 2010, 17, 163–192. [Google Scholar] [CrossRef]
  39. Rodríguez, A.; Nieto, M.J.; Santamaría, L. International collaboration and innovation in professional and technological knowledge-intensive services. Ind. Innov. 2018, 25, 408–431. [Google Scholar] [CrossRef]
  40. Figueroa-Armijos, M. Does public entrepreneurial financing contribute to territorial servitization in manufacturing and KIBS in the United States? Reg. Stud. 2019, 53, 341–355. [Google Scholar] [CrossRef]
  41. Muler, E.; Zenker, A.; Héraud, J.A. Knowledge Angels: Creative Individuals fostering Innovation in KIBS Observations from Canada, China, France, Germany and Spain. Manag. Int. Int. Manag. Gestion Int. 2015, 19, 201. [Google Scholar]
  42. Ye, K.; Liu, G.; Shan, Y. Networked or Un-Networked? A Preliminary Study on KIBS-Based Sustainable Urban Development: The Case of China. Sustainability 2016, 8, 509. [Google Scholar] [CrossRef]
  43. Zhu, Y.M. Study on the Governance Mechanism of Innovation of High-Tech Industrial Cluster in China--Based on KIBS Collaboration. In Advances in Economics, Business and Management Research, Proceedings of the 2016 International Conference on Management Science and Management Innovation, Guilin, China, 13–14 August 2016; Atlantis Press: Amsterdam, The Netherlands, 2016. [Google Scholar]
  44. Wang, J.; Zhang, X.; Yeh, A.G. Spatial proximity and location dynamics of knowledge-intensive business service in the Pearl River Delta, China. Habitat Int. 2016, 53, 390–402. [Google Scholar] [CrossRef]
  45. Deng, W. A Comparative Study on Competitiveness of KIBS in HK and Singapore. Mod. Econ. 2016, 7, 1086. [Google Scholar] [CrossRef]
  46. Shearmur, R. Are cities the font of innovation? A critical review of the literature on cities and innovation. Cities 2012, 29, S9–S18. [Google Scholar] [CrossRef]
  47. Moreno-Gómez, J.; Escandón-Charris, D.; Moreno-Charris, A.; Zapata-Upegui, L. Analysis of the role of process innovation on export propensity in KIBS and non-KIBS firms in Colombia. Compet. Rev. Int. Bus. J. 2021, 31, 497–512. [Google Scholar] [CrossRef]
  48. Rizzi, P.; Campanini, F.; Costa, S. Hybrid Innovation: The Case of the Italian Machine Tool Industry. Symphonya 2012, 2012, 45–56. [Google Scholar]
  49. Faber, N.; Jorna, R.; Van Engelen, J.O. The sustainability of “sustainability”—A study into the conceptual foundations of the notion of “sustainability”. J. Environ. Assess. Policy Manag. 2005, 7, 1–33. [Google Scholar] [CrossRef]
  50. Godin, B.; Gaglio, G. How does innovation sustain ‘sustainable innovation’. In Handbook of Sustainable Innovation; Edward Elgar Publishing: Cheltenham, UK; Northampton, MA, USA, 2019; pp. 27–37. [Google Scholar]
  51. Yoo, S.H.; Yoo, T.H. The role of the nuclear power generation in the Korean national economy: An input–output analysis. Prog. Nucl. Energy 2009, 51, 86–92. [Google Scholar] [CrossRef]
  52. Miller, R.E.; Blair, P.D. Input-Output Analysis: Foundations and Extensions; Cambridge University Press: Cambridge, UK, 2009. [Google Scholar]
  53. The Bank of Korea. Input-Output Statistics; The Bank of Korea: Seoul, Republic of Korea, 2016. [Google Scholar]
Figure 1. Research procedure.
Sustainability 16 01823 g001
Figure 2. Production inducement effects by KIBS sector.
Sustainability 16 01823 g002
Figure 3. Value-added inducement effects by KIBS sector.
Sustainability 16 01823 g003
Figure 4. Comparison of supply shortage effects by KIBS sector.
Sustainability 16 01823 g004
Table 1. KIBSs classification and relevant industries.
SectionNACE Rev.2Description of DivisionP-KIBST-KIBS
Information and communication activities (J)J, division 62Computer programming, consultancy, and related activities
J, division 63Information service activities
Professional, scientific, and technical activities (M)M, division 69Legal, law and accounting, consulting activities
M, division 70Activities of head offices, management consultancy activities
M, division 71Architectural and engineering activities, technical testing and analysis
M, division 72Scientific research and development
M, division 73Advertising and market research
Source: Bumberova and Kanovska (2020) [35].
Table 2. KIBSs’ total output status. (Unit: million KRW (South Korean Won)).
Sector201020152019Growth Rate
OutputRateOutputRateOutputRate
Information services7,480,7300.2%8,480,2990.2%13,131,2920.3%6.5%
Software development supply23,223,3830.7%42,784,1481.1%53,241,7241.2%9.7%
Other IT services9,187,9520.3%14,481,5310.4%15,828,0400.4%6.2%
R&D42,447,9061.3%68,495,4621.8%91,023,5742.1%8.8%
Services related to architecture and civil engineering13,843,2090.4%17,693,3480.5%19,040,2380.4%3.6%
Other science services16,858,2050.5%26,221,6360.7%29,939,7150.7%6.6%
T-KIBSs113,041,3853.5%178,156,4244.6%222,204,5835.1%7.8%
Legal and management support services15,520,6690.5%61,613,9491.6%77,023,2301.8%19.5%
Advertisement9,159,2020.3%12,499,7850.3%14,198,7190.3%5.0%
P-KIBSs24,679,8710.8%74,113,7341.9%91,221,9492.1%15.6%
Total KIBSs137,721,2564.2%252,270,1586.6%313,426,5327.2%9.6%
Total output3,243,909,369100.0%3,833,562,080100.0%4,365,917,265100.0%3.4%
Table 3. KIBSs’ total added value status. (Unit: million KRW).
Sector201020152019Growth Rate
OutputRateOutputRateOutputRate
Information services3,577,4740.3%4,380,2210.3%6,900,4680.4%7.6%
Software development supply14,471,9931.2%30,376,5761.9%40,502,2412.1%12.1%
Other IT services3,927,3730.3%7,425,4230.5%9,147,2470.5%9.8%
R&D24,585,5662.0%43,077,6512.6%56,313,6313.0%9.6%
Services related to architecture and civil engineering6,869,4070.6%12,108,1850.7%12,567,2140.7%6.9%
Other science services11,385,5430.9%17,419,5281.1%19,886,1031.0%6.4%
T-KIBSs64,817,3565.2%114,787,5847.0%145,316,9047.6%9.4%
Legal and management support services11,366,3790.9%20,323,4281.2%25,022,9611.3%9.2%
Advertisement1,538,7450.1%2,080,1210.1%2,394,2580.1%5.0%
P-KIBSs12,905,1241.0%22,403,5491.4%27,417,2191.4%8.7%
Total KIBSs77,722,4806.2%137,191,1338.4%172,734,1239.1%9.3%
Total value added1,244,630,570100.0%1,637,450,668100.0%1,900,740,904100.0%4.8%
Table 4. Industry sectors and KIBS classifications.
CodeSectorCodeSectorRemark
AAgricultural, forestry, and fishery productsIAccommodation and food services
BMineralsJBroadcasting and newspaper and publishing
C01Food and beveragesKFinance/insurance/banking
C02Textiles and leather productsLReal estate services
C03Wood and paper and printingNBusiness services
C04Coal and petroleum productsOPublic administration, defense, and social security
C05ChemicalsPEducation services
C06Nonmetallic mineral productsQHealth and social services
C07Primary metal productsRArts, sports, and leisure services
C08Fabricated metal productsSOther services
C09Computers, electronics, and opticsTOthers
C10Electrical equipmentMProfessional, scientific, and technical servicesT-KIBSKIBS
C11Machinery and equipmentJ (610)Information services
C12Transportation equipmentJ (621)Software development supply
C13Other manufacturing productsJ (629)Other IT services
C14Manufacturing and industrial equipment repairsM (700)R&D
DElectricity, gas, and steamM (721)Architecture and civil engineering services
EWater, waste disposal, and recycling servicesM (729)Other science, technology, and professional services
FConstructionM (711)Legal and management support servicesP-KIBS
GWholesale and retail trade servicesM (712)Advertisement
Note: The industry classification in this study is based on the sector classification of the Bank of Korea’s Input–Output table [53].
Table 5. Results of economic effects of KIBSs.
SectorProduction Inducement EffectsValue-Added Inducement EffectsSupply Shortage Effects
EffectsRankingEffectsRankingEffectsRanking
AAgricultural, forestry, and fishery products0.012200.006170.01327
BMinerals0.04190.01970.00131
C01Food and beverages0.025140.006160.0429
C02Textiles and leather products0.010220.002270.01922
C03Wood and paper and printing0.027130.009120.01325
C04Coal and petroleum products0.033120.008130.0458
C05Chemicals0.06320.01790.1131
C06Nonmetallic mineral products0.004280.001290.01423
C07Primary metal products0.019160.004220.0576
C08Fabricated metal products0.013190.005180.03015
C09Computers, electronics, and optics0.07510.03020.0655
C10Electrical equipment0.023150.007150.03814
C11Machinery and equipment0.012210.004210.04013
C12Transportation equipment0.015180.003230.0844
C13Other manufacturing products0.007250.002280.00829
C14Manufacturing and industrial equipment repairs0.015170.008140.01324
DElectricity, gas, and steam0.04480.012110.02817
EWater, waste disposal, and recycling services0.005260.003240.00630
FConstruction0.005270.002250.1072
GWholesale and retail trade services0.04660.02540.0863
HTransportation services0.04850.01780.04111
IAccommodation and food services0.04670.016100.04210
JBroadcasting and newspaper and publishing0.05540.02350.04012
KFinance/insurance/banking0.038100.02360.0567
LReal estate services0.036110.02730.02319
NBusiness services0.05830.03910.02021
OPublic administration, defense, and social security0.001310.001300.02320
PEducation services0.001320.001310.02318
QHealth and social services0.004290.002260.02916
RArts, sports, and leisure services0.008240.004190.01228
SOther services0.009230.004200.01326
TOthers0.002300.000320.00132
KIBSs0.800100%0.330100%1.144100%
Primary industry0.0536.6%0.0267.8%0.0141.2%
Secondary industry0.34142.6%0.10632.0%0.58150.7%
Tertiary industry0.40650.8%0.19860.2%0.55048.0%
(Direct effects)1.150 0.551
Total effects1.951 0.881
Table 6. Results of different effects of T-KIBSs.
SectorProduction Inducement EffectsValue-Added Inducement EffectsSupply Shortage Effects
EffectsRankingEffectsRankingEffectsRanking
AAgricultural, forestry, and fishery products0.011220.006170.00824
BMinerals0.02890.01380.00133
C01Food and beverages0.021140.005180.01816
C02Textiles and leather products0.009230.002260.00923
C03Wood and paper and printing0.018170.006150.00629
C04Coal and petroleum products0.024110.006140.02311
C05Chemicals0.05320.01560.0493
C06Nonmetallic mineral products0.004280.001290.00727
C07Primary metal products0.019160.004220.0328
C08Fabricated metal products0.013200.005190.01717
C09Computers, electronics, and optics0.08510.03410.0464
C10Electrical equipment0.020150.006160.02113
C11Machinery and equipment0.013210.004200.02610
C12Transportation equipment0.016180.003230.0562
C13Other manufacturing products0.005260.001300.00431
C14Manufacturing and industrial equipment repairs0.014190.007120.00726
DElectricity, gas, and steam0.025100.007130.01421
EWater, waste disposal, and recycling services0.005270.003250.00430
FConstruction0.004290.002270.1041
GWholesale and retail trade services0.03960.02130.0357
HTransportation services0.04240.01550.02212
IAccommodation and food services0.03670.012100.01914
JBroadcasting and newspaper and publishing0.02880.012110.0319
KFinance/insurance/banking0.023130.01390.0435
LReal estate services0.023120.01740.01520
NBusiness services0.04250.02820.00922
OPublic administration, defense, and social security0.001320.001310.01915
PEducation services0.001330.001320.01618
QHealth and social services0.003300.002280.01519
RArts, sports, and leisure services0.006250.004210.00728
SOther services0.007240.003240.00725
TOthers0.002310.000330.00132
P_KIBSs0.04730.01470.0416
T_KIBSs0.687100%0.272 0.730100%
Primary industry0.0395.7%0.0196.9%0.0091.2%
Secondary industry0.31445.7%0.09936.4%0.32043.8%
Tertiary industry0.33448.7%0.15456.7%0.40155.0%
(Direct effects)1.084 0.654
Total effects1.771 0.926
Table 7. Results of different effects of P-KIBSs sectors.
SectorProduction Inducement EffectsValue-Added Inducement EffectsSupply Shortage Effects
EffectsRankingEffectsRankingEffectsRanking
AAgricultural, forestry, and fishery products0.019190.010180.02629
BMinerals0.08270.03970.00332
C01Food and beverages0.041150.011160.1138
C02Textiles and leather products0.013230.003290.04820
C03Wood and paper and printing0.054140.017130.03325
C04Coal and petroleum products0.064120.016140.1109
C05Chemicals0.10050.027100.3011
C06Nonmetallic mineral products0.005300.002300.03524
C07Primary metal products0.021170.004230.1325
C08Fabricated metal products0.016210.006210.06818
C09Computers, electronics, and optics0.060130.024120.1246
C10Electrical equipment0.036160.010170.08913
C11Machinery and equipment0.013250.004240.08614
C12Transportation equipment0.014220.003280.1753
C13Other manufacturing products0.013260.004260.02130
C14Manufacturing and industrial equipment repairs0.021180.011150.03226
DElectricity, gas, and steam0.10240.02880.07116
EWater, waste disposal, and recycling services0.008270.004220.01331
FConstruction0.008280.003270.1334
GWholesale and retail trade services0.074100.03960.2342
HTransportation services0.072110.026110.10012
IAccommodation and food services0.08080.02890.10910
JBroadcasting and newspaper and publishing0.13610.05730.07115
KFinance/insurance/banking0.08760.05150.10311
LReal estate services0.07890.05740.04621
NBusiness services0.11120.07510.04919
OPublic administration, defense, and social security0.002320.001310.03623
PEducation services0.002330.001320.04522
QHealth and social services0.007290.004250.07017
RArts, sports, and leisure services0.013240.007200.02828
SOther services0.017200.008190.03027
TOthers0.003310.000330.00233
T_KIBSs0.10230.06720.1187
P_KIBSs1.472100%0.646100%2.657100%
Primary industry0.1016.8%0.0487.5%0.0291.1%
Secondary industry0.47132.0%0.14121.9%1.36851.5%
Tertiary industry0.90161.2%0.45770.7%1.26147.4%
(Direct effects)1.086 0.301
Total effects2.558 0.947
Table 8. Comparison of interlinkage effects.
Interlinkage EffectsForward LinkageBackward LinkageClass.
EffectsRankingEffectsRanking
P-KIBSsLegal and management support services1.118131.038171
Advertisement0.519281.137103
T-KIBSsArchitecture and civil engineering services0.459330.728304
Other IT services0.579260.784294
Other science, technology, and professional services0.655260.726304
Software development Supply0.474310.614344
R&D0.454330.788294
Information services0.495300.828294
KIBSs1.73030.826282
P-KIBSs1.23381.052171
T-KIBSs0.978170.731304
Note: 1: medium-demand manufacturing type, 2: medium-demand manufacturing type, 3: final demand manufacturing type, 4: final demand type of primitive industry type.
Table 9. Production inducement effects by KIBS sector.
Production Inducement Effects PrimarySecondaryTertiaryIndirectDirectTotal
P-KIBSsLegal and management support serviceseffects0.1110.5010.8431.4551.0702.526
rating7.6%34.4%57.9%100%
Advertisementeffects0.0500.3411.4101.8011.0172.818
rating2.8%18.9%78.3%100%
T-KIBSsArchitecture and civil engineering serviceseffects0.0410.2620.4270.7301.0321.761
rating5.6%35.9%58.5%100%
Other IT serviceseffects0.0250.3250.3340.6841.1421.826
rating3.6%47.6%48.9%100%
Other sciences, etc.effects0.0410.2830.3880.7121.0401.752
rating5.7%39.8%54.5%100%
Software development supplyeffects0.0180.1470.2560.4221.0591.481
rating4.3%34.9%60.8%100%
R&Deffects0.0530.4530.4140.9201.0101.930
rating5.8%49.2%45.0%100%
Information serviceseffects0.0370.2590.6000.8961.0751.971
rating4.2%28.9%66.9%100%
KIBSseffects0.0530.3410.4060.8001.1501.951
rating6.6%42.6%50.8%100%
P_KIBSseffects0.1010.4710.9011.4721.0862.558
rating6.8%32.0%61.2%100%
T_KIBSseffects0.0390.3140.3340.6871.0841.771
rating5.7%45.7%48.7%100%
Table 10. Value-added inducement effects by KIBS sector.
Value-Added Inducement Effects PrimarySecondaryTertiaryIndirectDirectTotal
P-KIBSsLegal and management support serviceseffects0.0530.1500.4270.6300.3250.955
rating8.5%23.8%67.8%100%
Advertisementeffects0.0240.1050.6990.8280.1690.996
rating2.9%12.7%84.4%100%
T-KIBSsArchitecture and civil engineering serviceseffects0.0200.0810.2090.3100.6600.970
rating6.3%26.0%67.6%100%
Other IT serviceseffects0.0120.1120.1740.2980.5780.876
rating4.0%37.6%58.4%100%
Other science, technology, and professional serviceseffects0.0200.0880.1910.2990.6640.963
rating6.6%29.4%64.1%100%
Software development supplyeffects0.0090.0480.1260.1840.7610.944
rating4.8%26.4%68.8%100%
R&Deffects0.0260.1410.2050.3720.6190.991
rating6.9%37.9%55.1%100%
Information serviceseffects0.0180.0820.3070.4070.5250.932
rating4.4%20.1%75.5%100%
KIBSseffects0.0260.1060.1980.3300.5510.881
rating7.8%32.0%60.2%100%
P_KIBSseffects0.0480.1410.4570.6460.3010.947
rating7.5%21.9%70.7%100%
T_KIBSseffects0.0190.0990.1540.2720.6540.926
rating6.9%36.4%56.7%100%
Table 11. Supply shortage effects by KIBS sector.
Supply Shortage Effects PrimarySecondaryTertiaryIndirect
P-KIBSsLegal and management support serviceseffects0.0311.4681.2222.721
rating1.1%53.9%44.9%100%
Advertisementeffects0.0240.8731.6762.573
rating0.9%33.9%65.1%100%
T-KIBSsArchitecture and civil engineering serviceseffects0.0010.0471.0151.064
rating0.1%4.4%95.5%100%
Other IT serviceseffects0.0150.6121.4442.071
rating0.7%29.5%69.8%100%
Other sciences, etc.effects0.0451.2711.0052.321
rating1.9%54.8%43.3%100%
Software development supplyeffects0.0020.0900.1500.242
rating0.8%37.2%62.0%100%
R&Deffects0.0010.1220.0540.178
rating0.6%68.7%30.7%100%
Information serviceseffects0.0100.3700.9851.365
rating0.7%27.1%72.1%100%
KIBSs 0.0140.5810.5501.144
1.2%50.7%48.0%100%
P_KIBSs 0.0291.3681.2612.657
1.1%51.5%47.4%100%
T_KIBSs 0.0090.3200.4010.730
1.2%43.8%55.0%100%
Disclaimer/Publisher’s Note: The statements, opinions and data contained in all publications are solely those of the individual author(s) and contributor(s) and not of MDPI and/or the editor(s). MDPI and/or the editor(s) disclaim responsibility for any injury to people or property resulting from any ideas, methods, instructions or products referred to in the content.

