Article

Enhancement of Indoor Air Quality with a Displacement Ventilation System Comprising a 4-Way Fan Coil Unit and Multiple Air Purifiers

1
School of Mechanical Engineering, Hanyang University, Seoul 04763, Republic of Korea
2
EURUS, Hwaseong-si 18545, Republic of Korea
*
Author to whom correspondence should be addressed.
Sustainability 2024, 16(5), 1740; https://doi.org/10.3390/su16051740
Submission received: 8 January 2024 / Revised: 14 February 2024 / Accepted: 18 February 2024 / Published: 20 February 2024
(This article belongs to the Topic Ventilation and Indoor Air Quality, 2nd Volume)

Abstract

:
In indoor spaces without mechanical ventilation systems, a common approach involves using a ceiling-mounted 4-way fan coil unit (4WFCU) to regulate indoor temperature and placing floor-level air purifiers (APs) to remove indoor pollutants. This study introduces a differentiated displacement ventilation system (DVS) that connects multiple APs to the 4WFCU using ductwork. The age of air was compared between the case where the newly designed DVS was implemented and the reference case where 4WFCU and APs operated independently. When there were no obstacles in the office central area, the reference system exhibited a lower age of air. Conversely, when obstacles such as desks and partitions were present in the central area, the proposed DVS was found to improve indoor air quality. The DVS resulted in minimal interference among pathlines of the air discharged from multiple floor-level APs and their efficient suction through the ceiling-mounted 4WFCU and diffusers, significantly reducing stagnant air zones, while pathlines of the air discharged from the 4WFCU and APs interfered significantly when they operated independently, leading to larger stagnant areas in the air distribution. Therefore, modifying office spaces with ceiling-mounted 4WFCUs using the proposed DVS is anticipated to substantially enhance indoor air quality through a straightforward installation process.

1. Introduction

Most modern individuals spend more time indoors than outdoors [1]. Various harmful substances that can threaten human health may exist indoors. The major harmful substances existing indoors include CO, CO2, SO2, NO2, VOCs, fine particulate matter, etc. [2,3,4,5,6]. Indoor pollutants mainly originate from incoming outdoor air or are generated from materials within the indoor environment, and the concentration of indoor pollutants varies significantly depending on the ventilation level [7]. Prolonged exposure to these indoor pollutants can worsen health and reduce productivity [8]. If exposed for an extended period to colorless, odorless pollutants in spaces with inadequate ventilation, gas poisoning or even fatal consequences can occur [4]. The fine particulate matter suspended in indoor air can enter the lungs and bloodstream upon inhalation, potentially leading to cardiovascular and respiratory diseases [6]. Therefore, indoor air quality management is crucial, and it can be achieved by various methods of ventilation. In the absence of an indoor ventilation system, it is possible to improve indoor air quality by establishing appropriate strategies for natural ventilation or using air purifiers [9]. When a building has a ventilation system installed, enhancing indoor air quality can be further optimized by complementing the ventilation system with natural ventilation or air purifiers [10,11].
On the other hand, many countries mandate the installation of mechanical ventilation systems in new buildings [12]. Mechanical ventilation systems are devices designed to improve indoor air quality in buildings by supplying fresh outdoor air and exhausting contaminated indoor air, and their primary purpose is to dilute indoor pollutants. There are different types of mechanical ventilation systems based on the location of supply and exhaust points, such as stratum ventilation (SV), displacement ventilation (DV), mixing ventilation (MV), hybrid air distribution (HAD), etc. Among these, MV and DV systems have been extensively studied by various researchers for a long time.
MV is a ventilation method that supplies fresh outdoor air into indoor spaces to ensure thorough mixing with indoor air, thereby reducing indoor pollutant concentrations. Sandberg et al. [13] conducted an experimental study on office spaces equipped with an MV system, and they found that when supply inlet and exhaust outlet were placed together on each of the two opposite walls of the office, indoor air exchange occurred rapidly. Lee and Awbi [14] conducted a study on MV using laboratory-scale chambers, and they reported that placing both supply inlet and exhaust outlet on the ceiling was more advantageous for indoor air exchange in indoor spaces with partitions. Kong et al. [15] conducted a study comparing the ventilation efficiency between MV with supply inlet and exhaust outlet on the ceiling and SV with supply inlet on the side walls and exhaust outlet on the ceiling, and they noted that the ventilation efficiency between these two systems could vary according to the indoor environment. Krajčík et al. [16] investigated the differences in indoor air quality based on the location of supply inlet and exhaust outlet in a laboratory-scale chamber with an MV system, and they concluded that placing supply inlet and exhaust outlet according to the spatial characteristics can significantly enhance indoor air quality.
While MV primarily aims to effectively mix indoor air to dilute pollutants, DV focuses on exhausting pollutants to the outside by utilizing the displacement between supply inlet and exhaust outlet within the space. DV is recognized for its excellent ventilation performance in environments where there is a high concentration of occupants or in situations where human activity is minimal [17]. Awbi and Gan [18] evaluated the ventilation performance of a DV system applied to empty spaces through numerical analysis, and they found that placing supply inlet at the bottom of the side wall and exhaust outlet at the top of the same wall increased ventilation efficiency. Lee and Lam [19] conducted a numerical study on spaces with DV, and they noted that the placement of supply inlet at the bottom of the side wall and exhaust outlet on the ceiling could lead to different temperature distributions depending on the space height. Lee et al. [20] set up a simple office space with DV by placing supply inlet on the floor or side wall and exhaust outlet on the ceiling, and they observed differences in ventilation efficiency based on the space height. Wei et al. [21] and Wang et al. [22] conducted research in factories equipped with DV to reduce pollutant concentrations, and they reported that effective reduction of pollutant concentrations in the factory could be achieved by placing supply inlet on the side walls and exhaust outlet on the ceiling. Liu et al. [23] performed a study on the improvement of indoor air quality in aircraft cabins by adjusting the ventilation rates of both DV and MV, and they found that applying equal ventilation rates to DV and MV resulted in the highest ventilation efficiency. Berlanga et al. [24] conducted research on airborne infection isolation rooms with DV, and they suggested that effectively utilizing the DV method could potentially replace existing room ventilation systems.
Moreover, numerous studies have not only evaluated the individual characteristics of MV and DV methods but have also compared the ventilation efficiency between MV and DV. Qiu-Wang and Zhen [25] conducted research in a laboratory-scale space simulating an office environment. They compared the ventilation efficiency between MV, where both supply inlet and exhaust outlet were placed on the ceiling, and DV, where the supply inlet was positioned on the side floor and the exhaust outlet was on the ceiling. They concluded that DV outperformed MV in terms of ventilation efficiency. He et al. [26] conducted an analysis of pollutant exposure levels for occupants in a simulated office space, and they found that MV resulted in the highest pollutant exposure for occupants while DV had the least exposure, among the ventilation methods tested. In a simulated office space, Tian et al. [27] compared the ventilation efficiency between MV, DV, and SV, and they found that DV exhibited the highest ventilation efficiency while MV had the lowest. Liu et al. [28] compared the ventilation efficiency between MV and DV in a simulated office space, and they concluded that DV was superior to MV in terms of indoor air quality improvement and pollutant exhaust capability.
Many studies have been conducted on MV and DV, and both methods have been reported to significantly contribute to improving indoor air quality. In particular, DV is known as an effective ventilation method for efficiently removing indoor pollutants and has been widely adopted not only in typical indoor spaces but also in environments such as factories and aircraft. Research on DV has primarily focused on evaluating ventilation efficiency based on the placement of supply inlet and exhaust outlet, and these studies have mostly been conducted in empty spaces or laboratory-scale settings with simple structures. However, there is a lack of research conducted in real-world settings, and there have been few comparisons with other types of ventilation devices, such as air purifiers (APs). Differing from conventional DV systems, this study introduces a novel displacement ventilation system (DVS) that connects an air conditioning unit installed on the ceiling with AP units installed on the floor. The DVS was implemented and tested in an actual office setting. This study aimed to assess the effectiveness of the newly designed DVS in enhancing indoor air quality by comparing the age of air between the case where the newly designed DVS was implemented and the reference case where an air conditioning unit and APs operated independently.

2. Materials and Methods

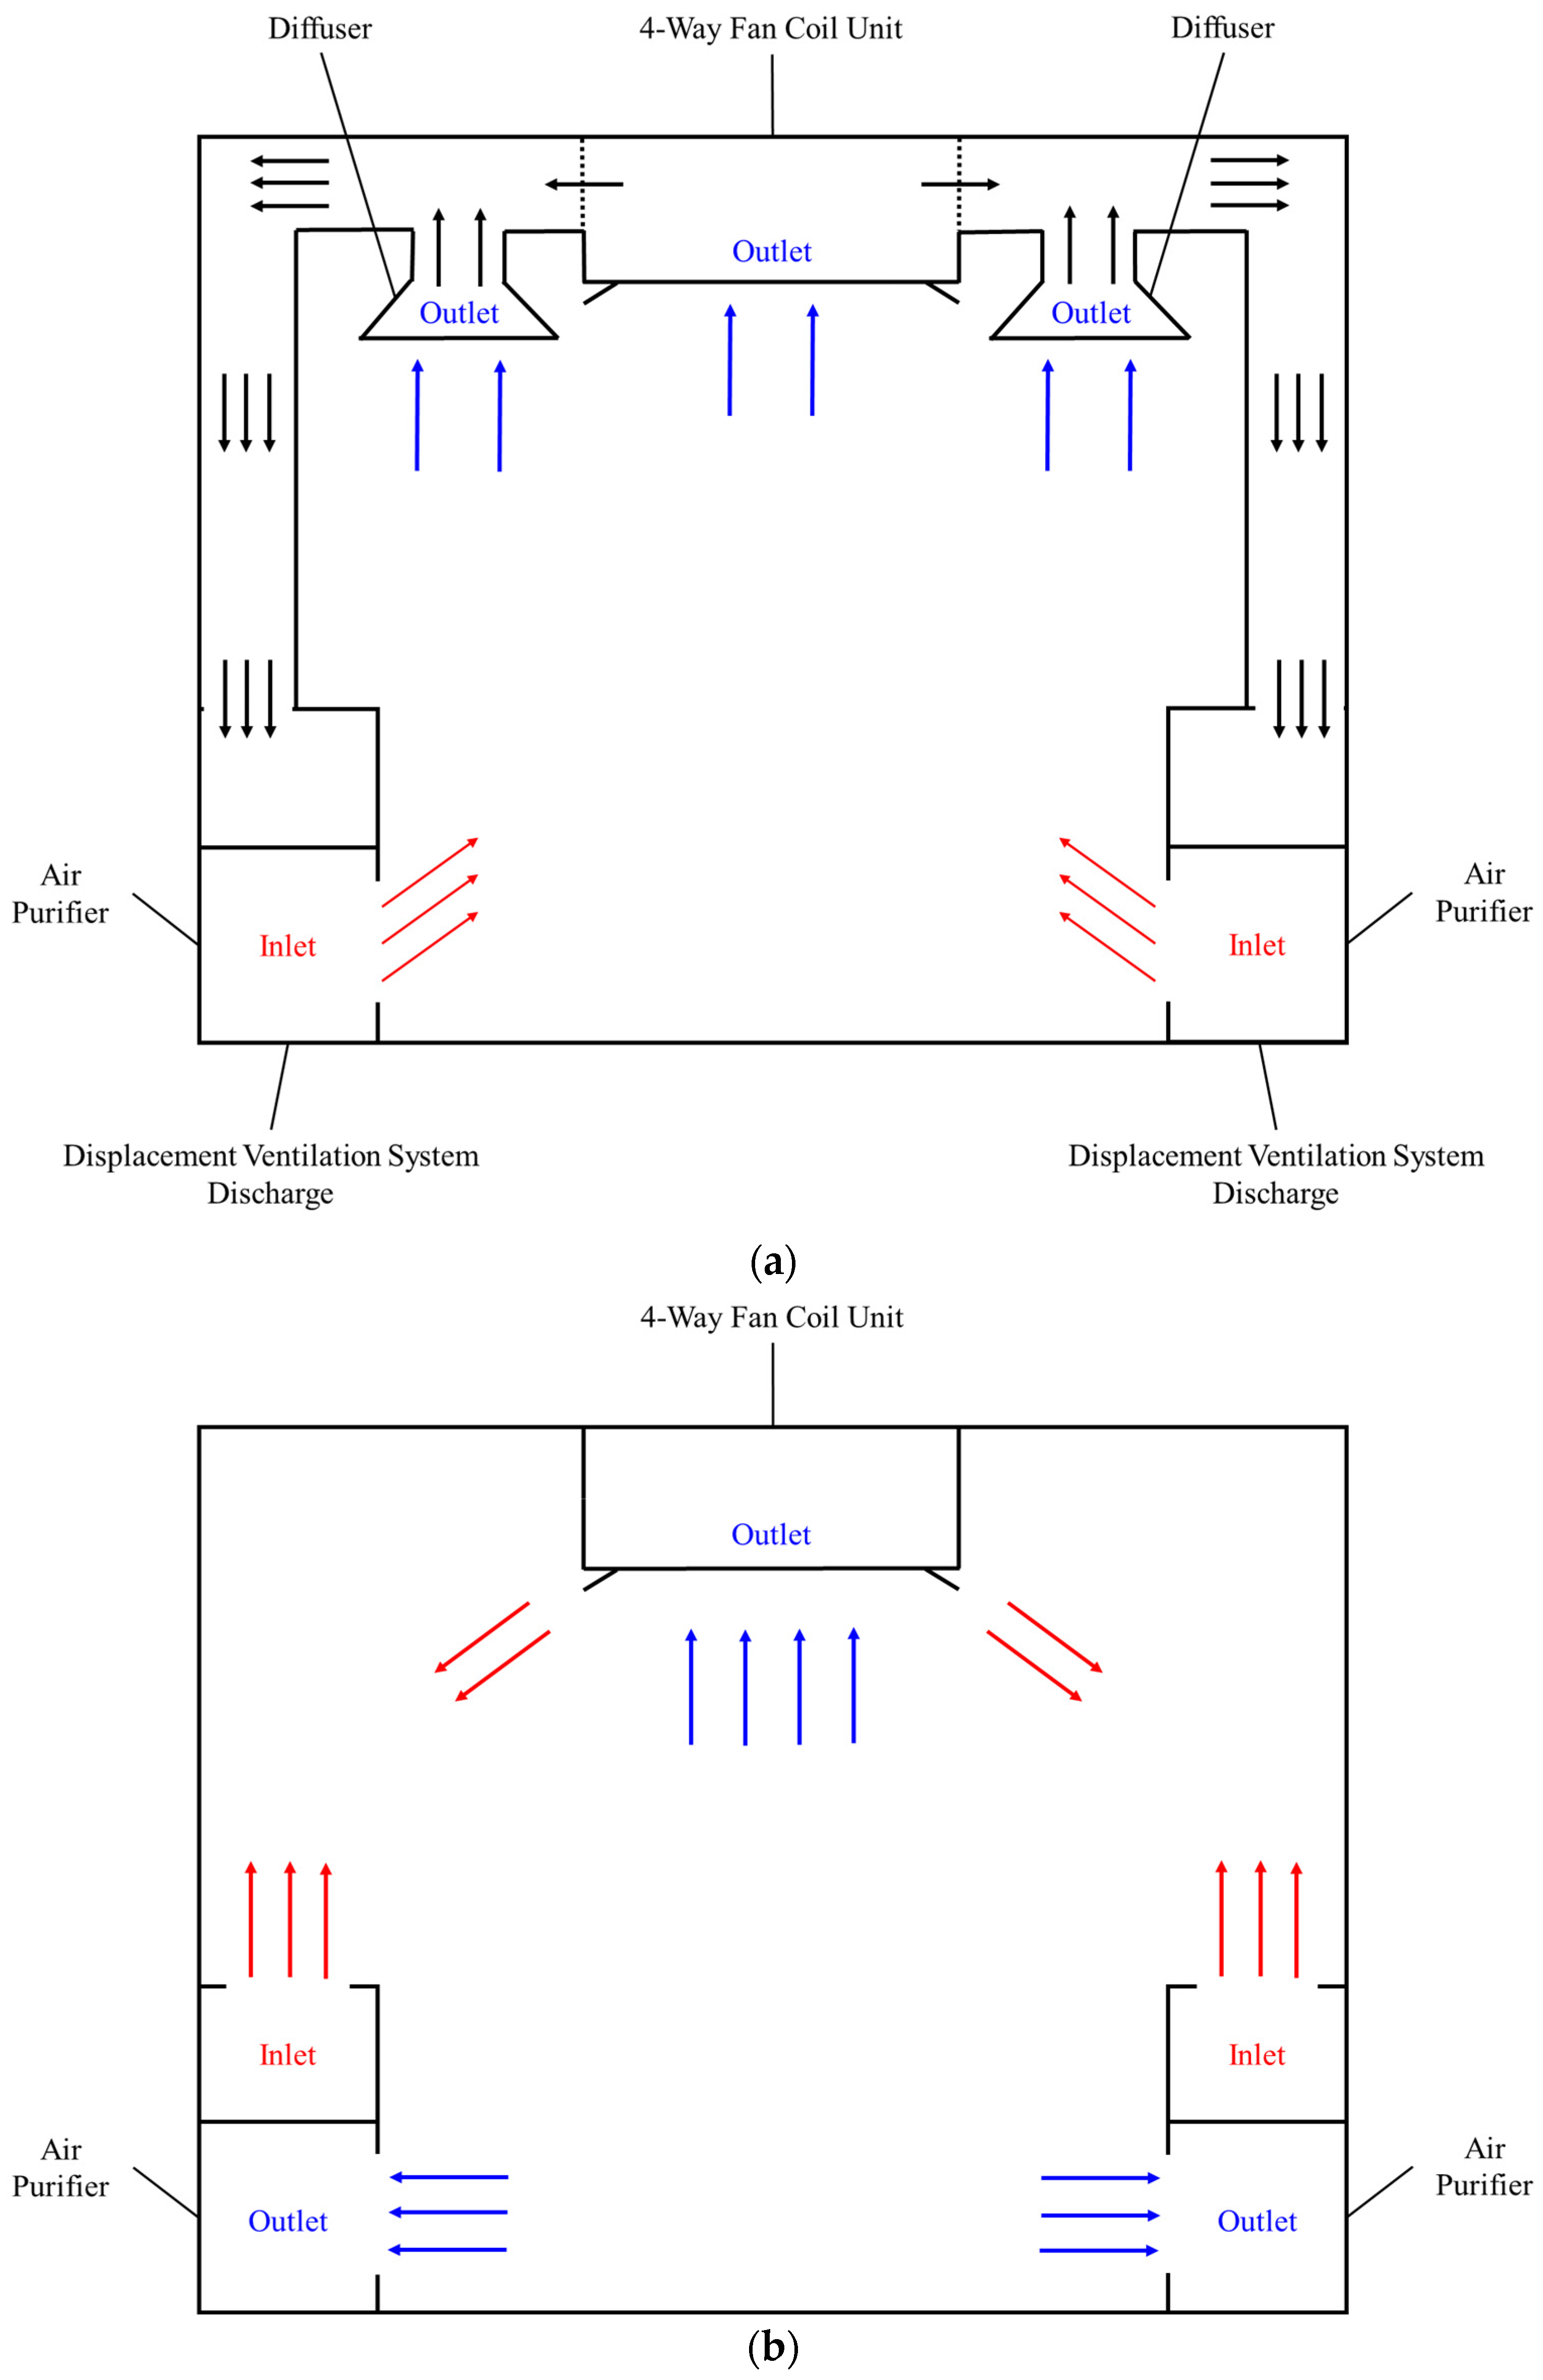
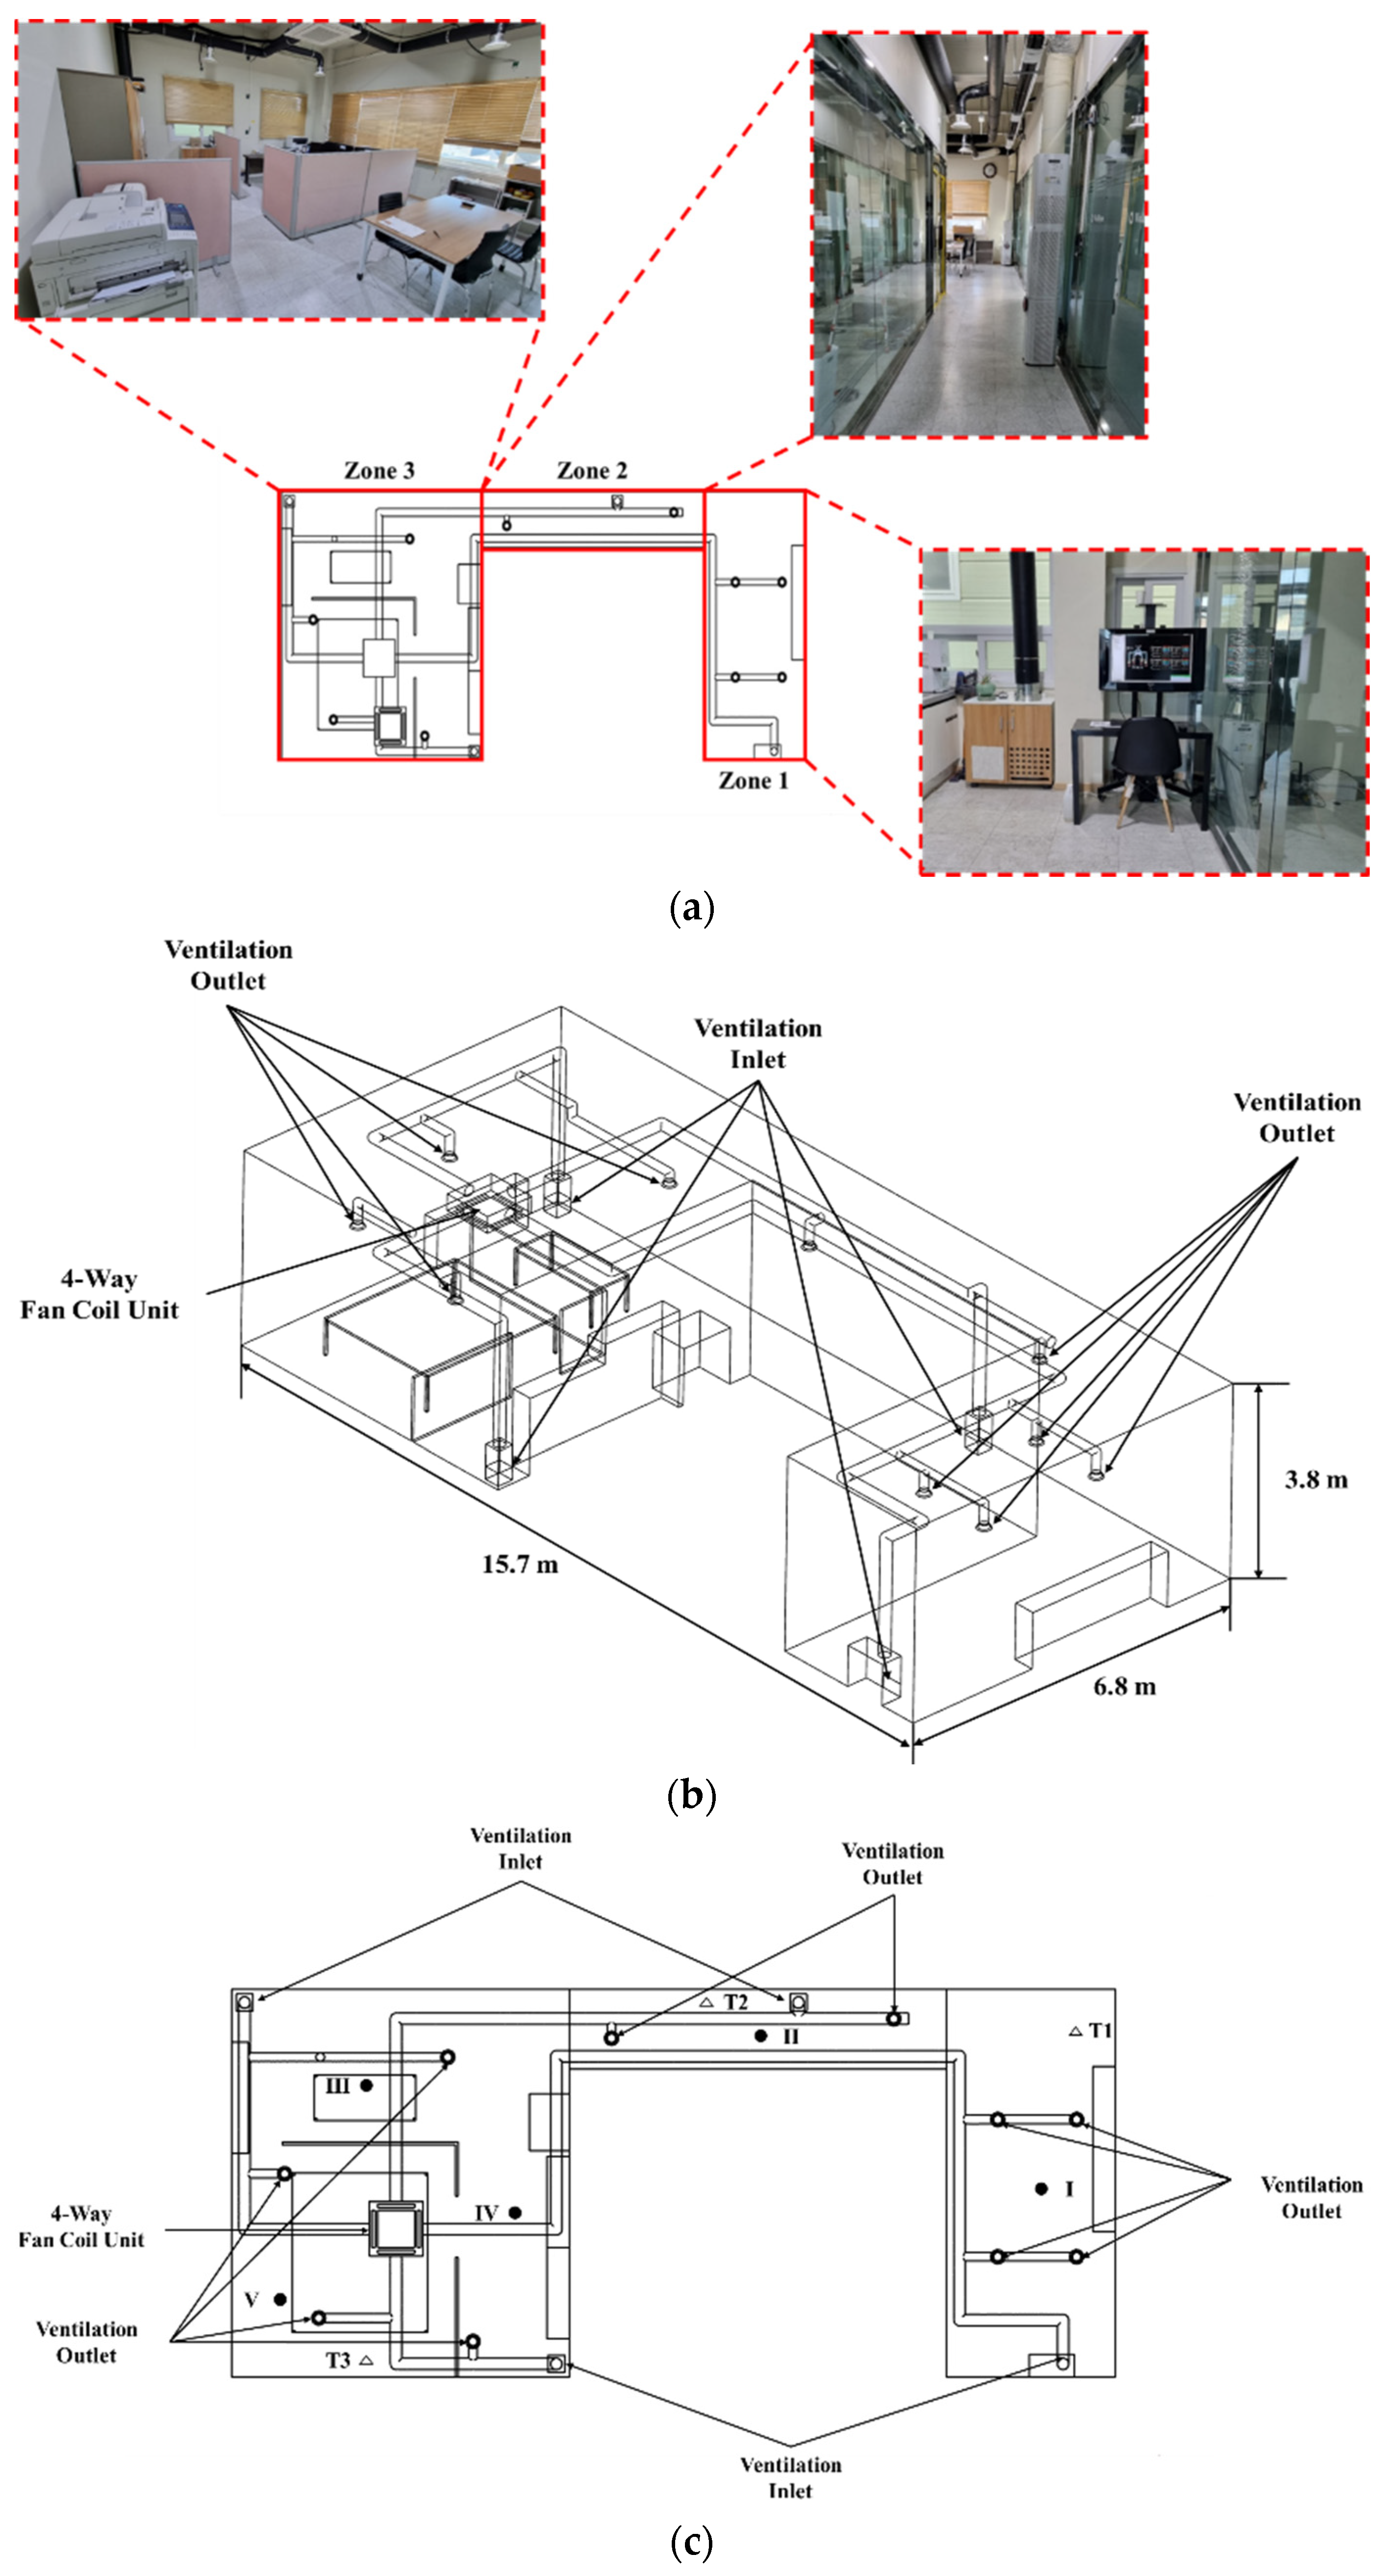
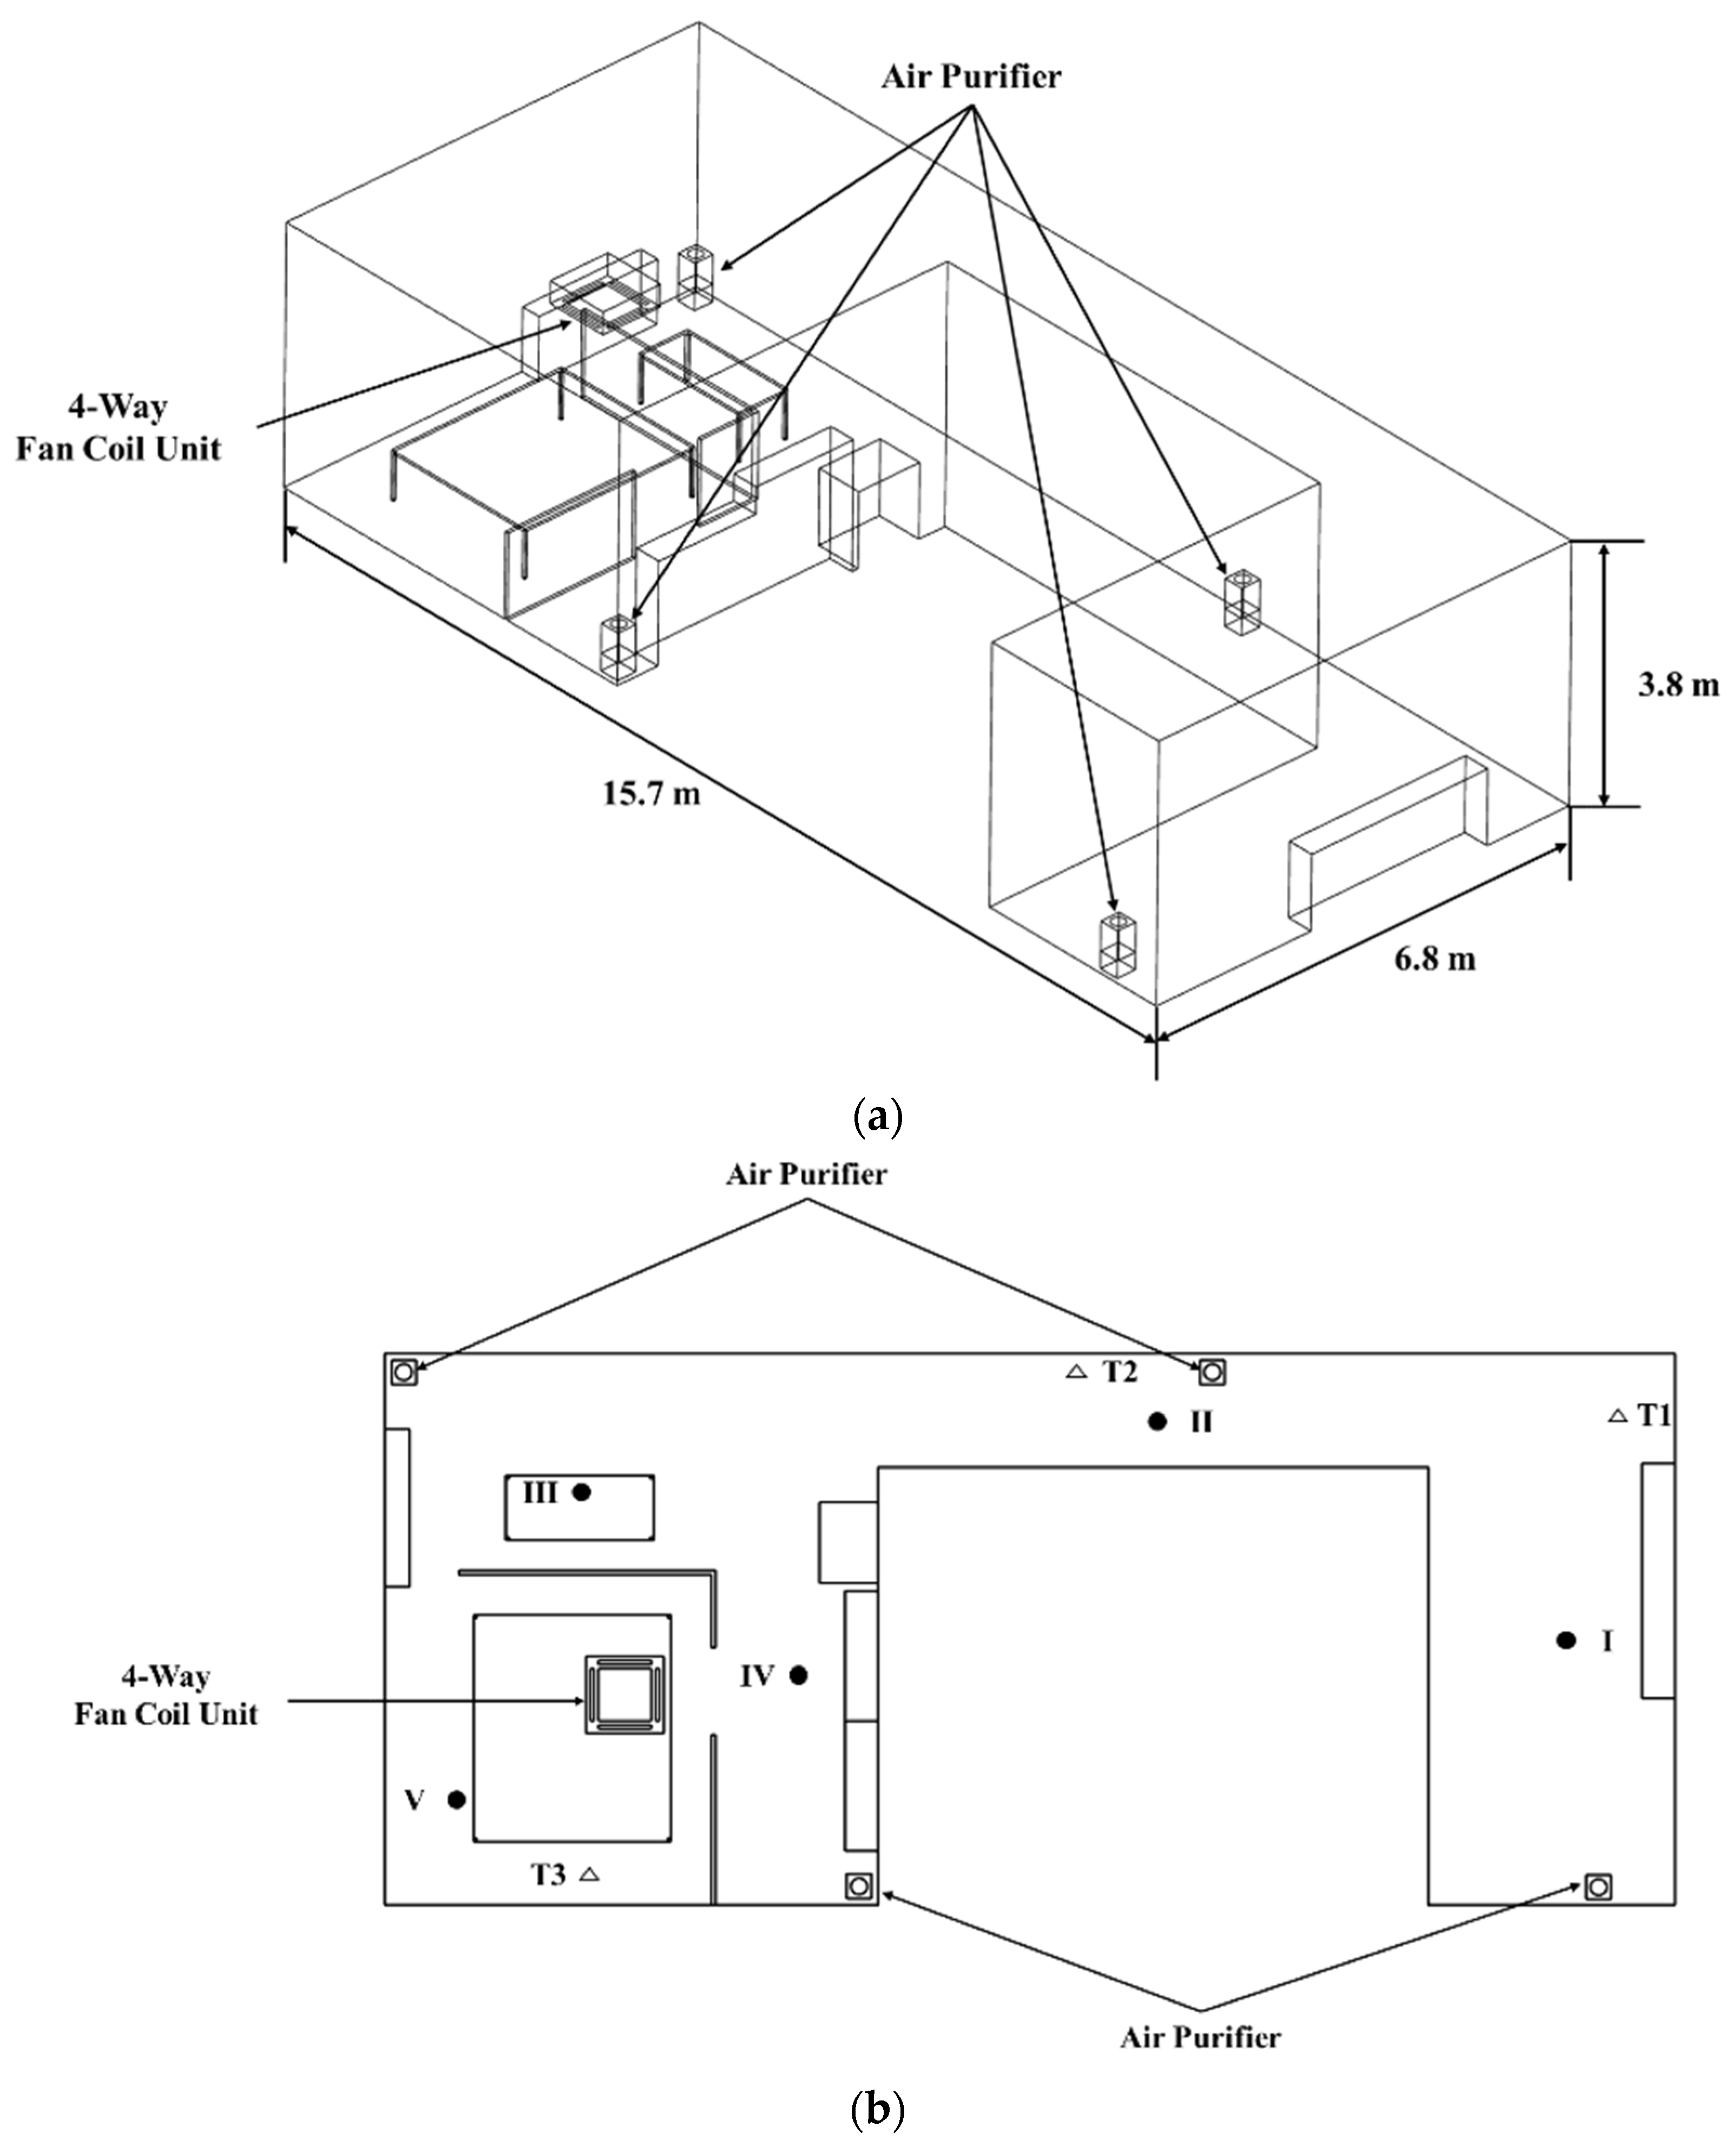
2.1. Description of Office

Figure 1a illustrates an overview of the newly designed DVS in this study. To control the indoor air temperature, a 4-way fan coil unit (4WFCU) was mounted on the ceiling. The central suction inlet of the 4WFCU and multiple diffusers installed on the ceiling served as ventilation outlets (VO). The air drawn in by the 4WFCU was mixed with the air drawn in through the diffusers after temperature control. The temperature of the mixed air, which was essentially the air reintroduced into the indoor space, was regulated by adjusting the ratio of the air intake between the 4WFCU and the diffusers using dampers. Multiple APs were placed near the walls on the floor and utilized as ventilation inlets (VI). Each AP was equipped with a HEPA filter. As a result, the air drawn from the office space through the 4WFCU and diffusers on the ceiling underwent temperature control and was reintroduced into the office space after passing through the APs positioned on the floor.
Figure 1b depicts the typical airflow when the 4WFCU and APs are used independently in an office space. It served as the control group for comparison with the DVS designed in this study. The 4WFCU installed on the ceiling drew in indoor air through its central section, regulated its temperature, and then expelled it back into the indoor space through four outlets around its perimeter. Each AP placed near the walls on the floor drew in air from the side, filtered it through a HEPA filter, and then released it into the indoor space through the top of the unit. It is worth noting that the APs shown in Figure 1a were placed upside down and modified in appearance to connect to ductwork, as compared to the conventional APs depicted in Figure 1b.
Figure 2a is a photograph showing the office space where the DVS was installed. Zone 1 is a tea-making room with minimal furniture. Zone 2 is a narrow corridor. Zone 3 is the office space containing desks, chairs, and partitions. Figure 2b,c illustrates the schematics of the office space with the newly designed DVS in this study. One 4WFCU was positioned in the center of the ceiling of Zone 3. Zone 1 featured four diffusers and one AP, Zone 2 had two diffusers and one AP, and Zone 3 utilized four diffusers and two APs. The air drawn from the office space using the 4WFCU and ten diffusers mounted on the ceiling was mixed in appropriate proportions, temperature-controlled, and then reintroduced into the office space from the outlets of four APs located on the floor. All the used ducts were well insulated.
Figure 3a,b illustrates the schematics of the office space considered as the control group. In this setup, one 4WFCU and four APs operated independently without any interconnection, and diffusers were not utilized. The configuration, dimensions, and furniture arrangement in the control group experiment room shown in Figure 3 were identical to those in the office space with the DVS depicted in Figure 2, except for the ventilation method applied differently. The ventilation rates applied to the office spaces in both Figure 2 and Figure 3 were set to a maximum of 2160 m3/h, which equates to 7.2 air changes per hour relative to the capacity of the empty office space. For reference, according to ASHRAE standards, the required ventilation rate for offices is 5 ft3/h per person [29]. In the case of 10 occupants in the experimental space, the required ventilation rate was approximately 100 m3/h per person. The minimum ventilation rate set in this study, which was 432 m3/h, satisfactorily met the ASHRAE criteria.

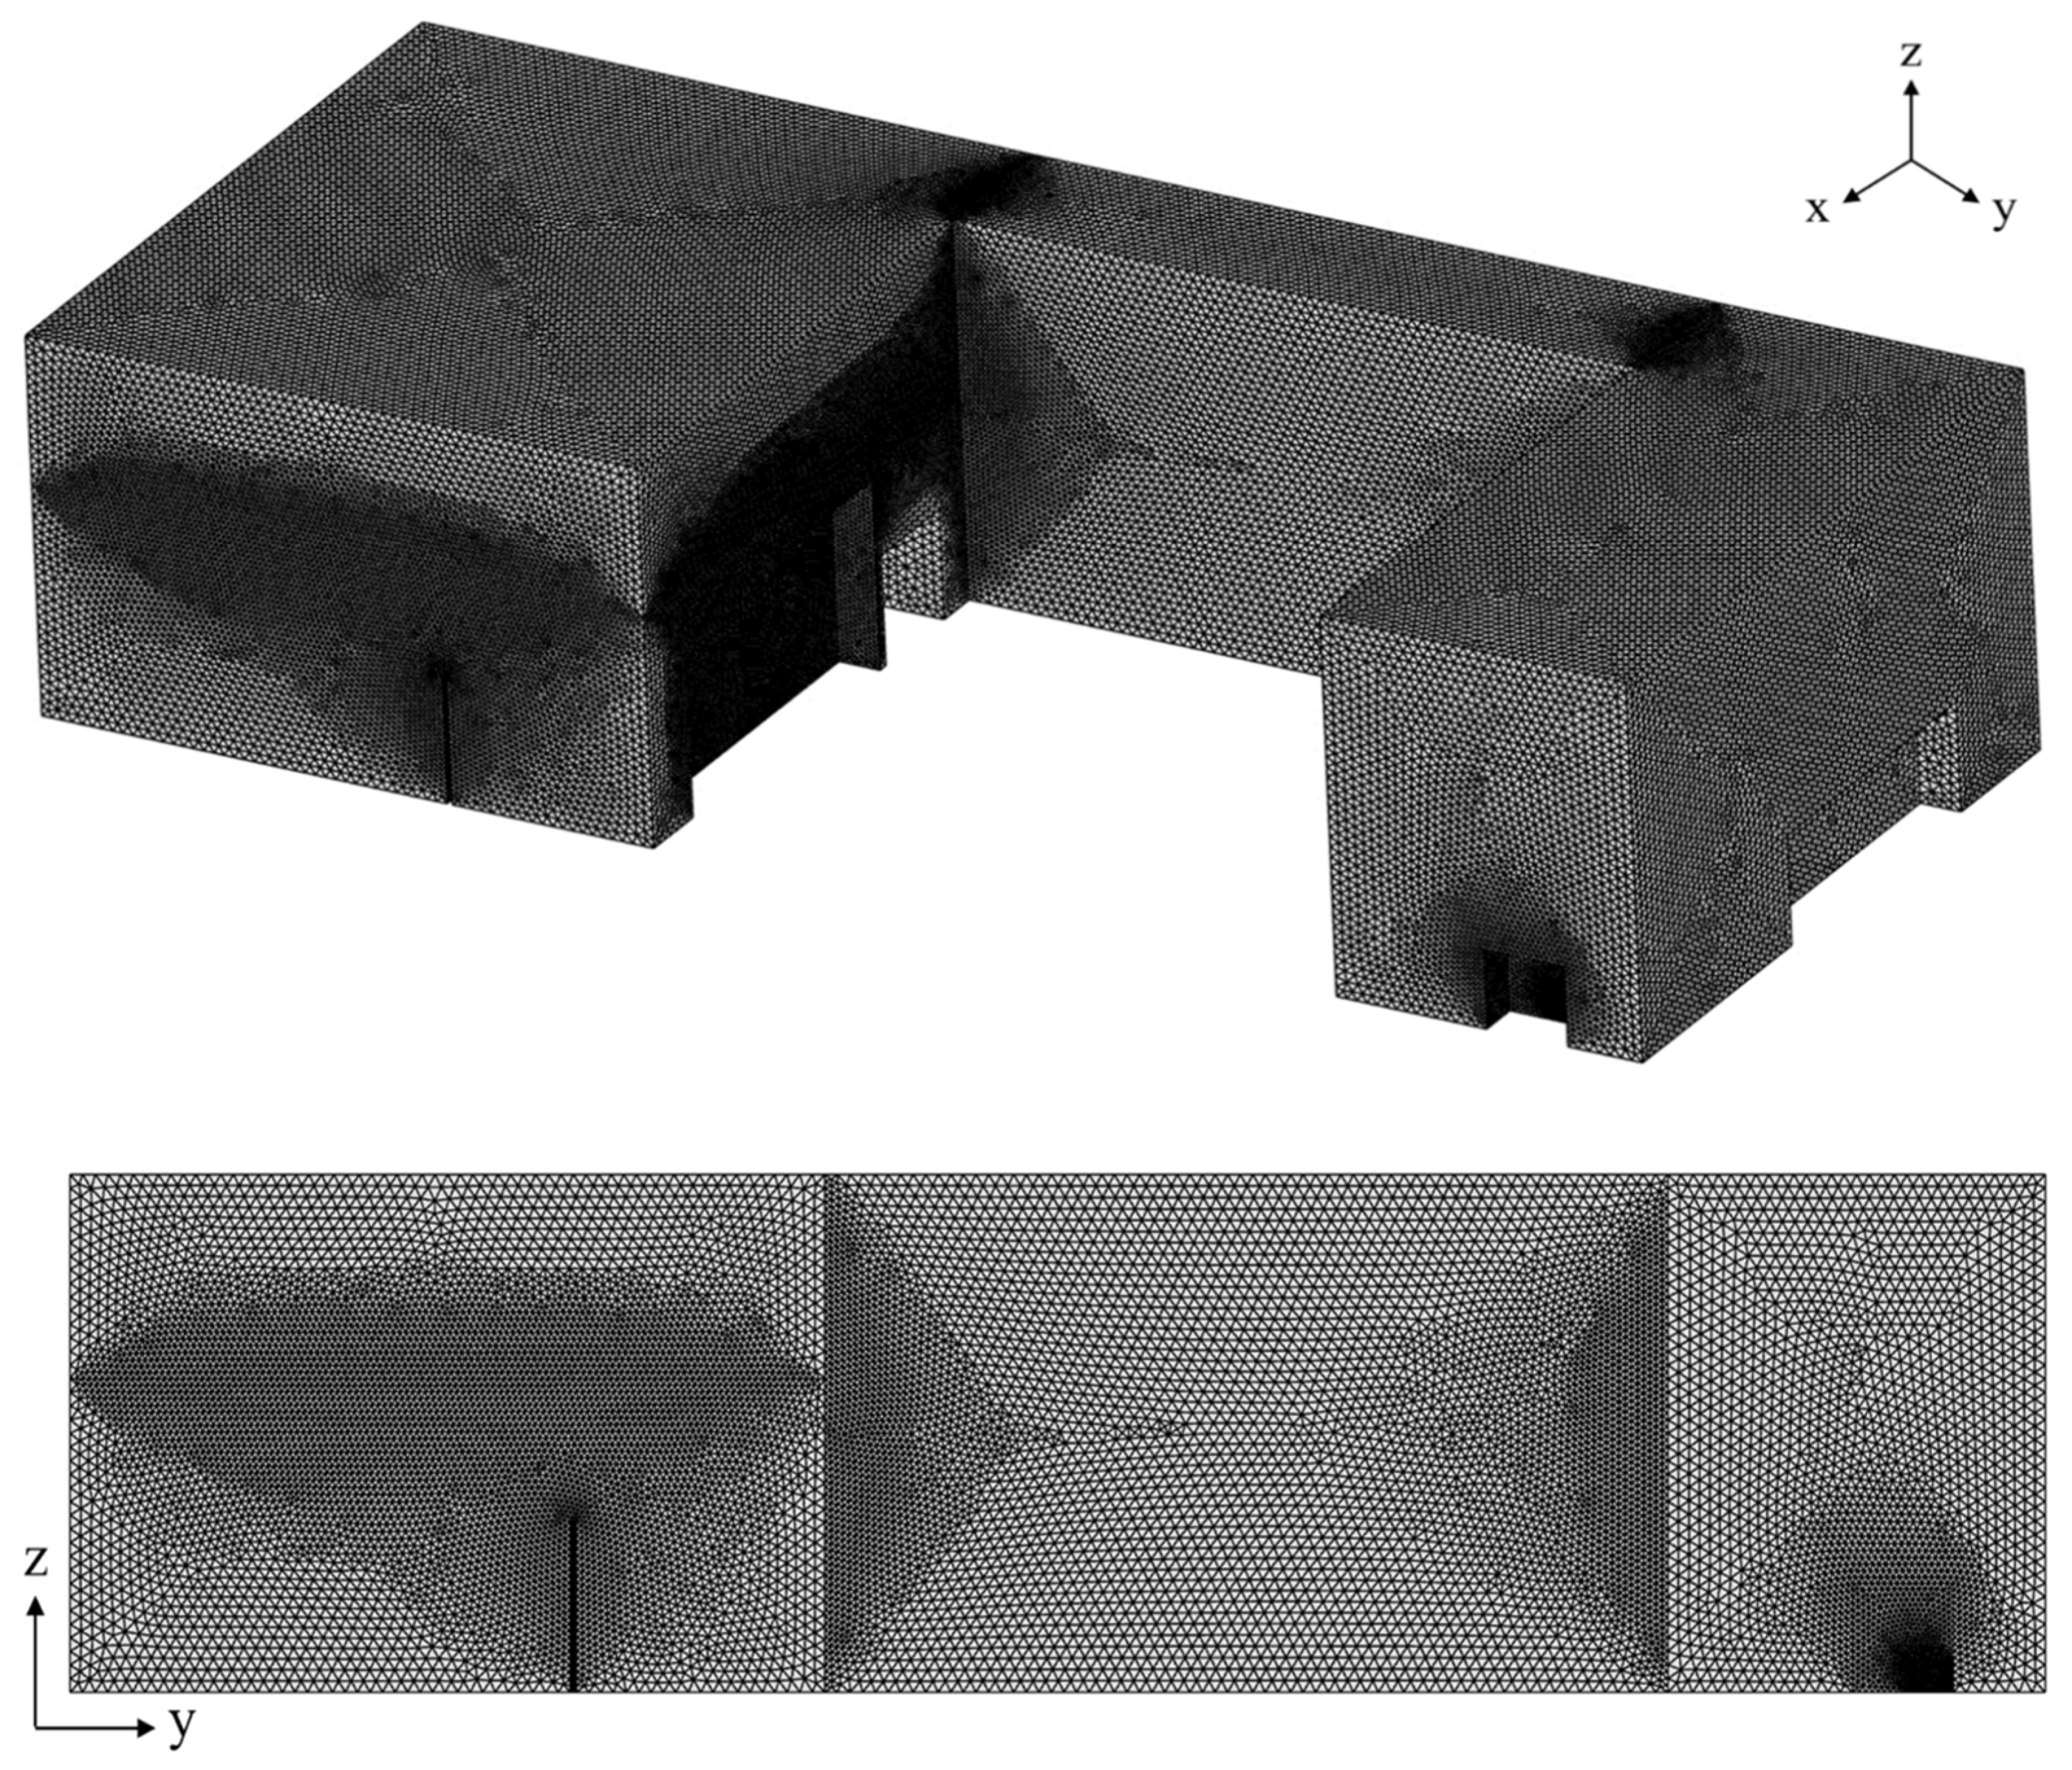
2.2. Numerical Method

To model the air flow and the age of air within the office space, the commercial CFD software, ANSYS FLUENT Release 18.0, was employed. The flow was assumed to be steady, turbulent, incompressible, and three-dimensional. For turbulence analysis, the standard k-ε turbulence model was utilized [30,31,32,33]. The governing equations for flow analysis are as follows [34].
Mass conservation equation:
ρ t + · ρ u = 0
Momentum conservation equation:
( ρ u ) t + · ρ u u = p + · μ u
Transport equation for k (standard k-ε model):
( ρ κ ) t + · ρ κ u = μ + μ t σ κ κ + G κ + G b ρ ε Y M
Transport equation for ε (standard k-ε model):
( ρ ε ) t + · ρ ε u = μ + μ t σ ε ε + C 1 ε ε κ G κ + C 3 ε G b C 2 ε ρ ε 2 κ
The equations governing the analysis of the age of air, when employing user defined scalar (UDS) in conjunction with flow analysis, are as outlined in references [35,36,37].
x i ρ u i Φ J ˙ Φ x i = ρ
J ˙ = ρ D m + ρ D t Φ x i
Here, ρ represents air density, ui denotes air velocity, and Φ represents the age of air. The diffusion term, j, is determined by both molecular diffusivity, Dm, and turbulent diffusivity, Dt. The total ventilation rate was set to the lowest value of 432 m3/h or the highest value of 2160 m3/h. The flow rates for each supply inlet or exhaust outlet were determined by dividing the total ventilation rate by the number of supply inlets or exhaust outlets. The indoor pressure was set to 101.3 kPa, and the office temperature was adjusted to 22 °C or 27 °C. For boundary conditions in flow simulation, a no-slip condition was applied to every indoor wall, a velocity inlet condition was set for every ventilation inlet, and a pressure outlet condition was applied to every ventilation outlet. Convergence was considered achieved when the residuals for all solved equations were below 10⁻4. Since brand-new HEPA filters were used in the experiments, the zero value for the age of air was applied to all outlets of the APs by assuming nearly 100% removal efficiency of the HEPA filters. Tetrahedral grids were used for the mesh system, with grids near the supply inlets and exhaust outlets being denser. A grid independence test was conducted by increasing the total number of grids from approximately 5 million to 23 million, resulting in approximately 10 million grids used, as shown in Figure 4, to observe the distribution of the age of air.

2.3. Experimental Method

The experiments were conducted in the respective offices, as shown in Figure 2 and Figure 3. The total ventilation rates were set to a minimum of 432 m3/h or a maximum of 2160 m3/h. The indoor temperature was set at 22 °C or 27 °C during the experiments. The cases in which the experiments were conducted are listed in Table 1.
Time-resolved particle concentrations in the air were measured at five locations (I, II, III, IV, V) indicated in Figure 2c and Figure 3b using a total of five optical particle counters (OPC; Model 1.108, GRIMM, Ainring, Bayern, Germany), which determine the number and size of the particles by detecting the intensity of light scattered by each particle passing through the optical system. The operating flow rate for each OPC was 1.2 L/min, and its impact on indoor airflow was considered negligible. To simulate the scenario of people sitting on chairs and breathing in the office, sampling probes for aerosol intake were vertically installed at a height of 1.1 m from the office floor.
To select the particles for the experiments, consideration was given to the increased public interest in virus transmission in indoor spaces following the recent COVID-19 pandemic and the fact that particles measuring 5 µm or smaller in size are known to have the potential for airborne transmission. In particular, particles generated during human respiration are known to peak in the range of 0.2 to 0.5 µm [38]. Therefore, in this study, particles were generated through incense burning because the particles generated by incense burning are known to be mostly smaller than 5 µm with a peak in the range of 0.09 to 0.2 µm [39,40]. Due to the generation of not only particles but also VOCs through incense burning, which could potentially affect the removal efficiency of HEPA filters, activated carbon filters were used in conjunction with HEPA filters to complement this problem [41,42].
The experimental procedure was as follows [35,36,37].
-
Keep all doors and windows open, enabling outdoor air to enter the office, while turning off the ventilation system (90 min).
-
Seal all doors and windows, initiate particle generation by burning incense, and activate fans for even distribution of particles throughout the indoor space (20 min).
-
Deactivate the fans and establish a stable indoor airflow (20 min).
-
Activate the ventilation system and establish a stable indoor airflow (10 min).
-
Maintain a constant ventilation rate for more than 60 min.
Figure 5 provides an example of the temporal variation of particle concentration measured utilizing OPCs. It shows the particle concentration variation at Point I while the ventilation system was operating under stable indoor airflow conditions after stabilizing the indoor airflow in Case 1 and Case 5 conditions, with a constant ventilation rate. Because of the ventilation system operation, indoor air was expelled and particle-free air was introduced, resulting in an exponential decay in particle number concentration. While variations existed in the rate of reduction depending on the experimental conditions and measurement locations, the particle concentration decreased exponentially in all cases. Therefore, the experimental method was used to compute the age of air utilizing the following equation [35,36,37].
C P t = A   e x p t τ + y 0
Here, A represents the initial particle concentration during the period when the ventilation system maintains a constant flow rate, t is time, y0 represents the asymptotic value of particle concentration after an extended period, and τ denotes the age of air determined through the curve fitting of the experimental data. In addition, at three locations labeled as T1, T2, and T3 in Figure 2 and Figure 3, the air temperatures were measured using T-type thermocouples suspended at different heights (3.0 m, 2.2 m, and 1.1 m above the floor). The ventilation rate was confirmed by measuring the velocity of air discharged from the exhaust of each air purifier and ventilation system using a velocimeter (Model AMI310, KIMO, Montpon, Dordogne, France).

3. Results and Discussion

Figure 6a and Figure 6b, respectively, show the age of air in the office with the DVS system designed in this study (refer to Figure 2) and the reference office with a conventional 4WFCU and APs operated independently (refer to Figure 3). These figures illustrate a comparison between simulation and experimental results regarding the age of air at various locations I–V. The age of air differed depending on the measurement location. A lower age of air indicates better air quality at the respective location. At the positions of I in Zone 1 and II in Zone 2, where there were no significant obstacles in the relatively empty spaces, the reference office exhibited a lower age of air compared to the office with the DVS. On the other hand, when there were factors such as desks or partitions obstructing the airflow in the central area (i.e., at positions III–V in Zone 3), it was observed that the office with the DVS generally exhibited a lower age of air compared to the reference office. These results are attributed to the fact that when the degree of airflow interference is minimal, indoor pollutants are expelled more rapidly, resulting in a lower age of air. Further analysis will be conducted in the following section through a more detailed examination of age of air contours and flow pathline comparisons. On the other hand, in the office with the DVS installed, differences in the age of air based on location appeared relatively small, while in the reference office, differences in the age of air based on location were relatively significant. Therefore, it is considered that the DVS designed in this study is more advantageous in achieving a more uniform spatial distribution of indoor air quality. For both Case 1 and Case 5, the age of air predicted by the simulation closely matched that determined through experimentation at all measurement points. The results for all cases (Cases 1–8) comparing the age of air at five locations (I–V) between experimentation and simulation, including those presented in Figure 6, are displayed in Figure 7, where the average values of the age of air, in the case of experimental results, were used for each location obtained from three measurements at each position. Overall, the deviation between the simulated and experimental age of air results is within ±10%, indicating high accuracy in the prediction of the age of air using the simulation method employed in this study. Furthermore, Figure 8 compares the air temperature profiles at three designated locations (T1, T2, and T3) between experiments and simulations, for each space in the office with the DVS system (Case 1) and the reference office (Case 5). In all cases, the air temperature gradually rose from the floor to the ceiling, similar to the results of previous studies [43,44,45]. This is attributed to the buoyancy effect, where relatively warmer air rises upward due to its lower density while relatively cooler air sinks downward due to its higher density. The measured values from experiments closely matched the predicted results from simulations. These comparisons of the age of air and temperature confirmed the validity of the data analysis conducted using the simulation method employed in this study.
Figure 9 shows the age of air contours at an elevation of 1.1 m from the office floor for a ventilation rate of 432 m3/h. In Figure 9a,b, the indoor temperature settings were 22 °C (Case 1) and 27 °C (Case 2), respectively, for the office with the DVS system, where 4WFCU, APs, and diffusers were connected by ducts. On the other hand, Figure 9c,d represent the age of air under the same conditions for the reference office with 4WFCU and APs operated independently, where the indoor temperature settings were 22 °C (Case 5) and 27 °C (Case 6), respectively. First, when comparing Case 1 and Case 2, the age of air distributions in the two cases were similar, but in Case 2, localized regions with a slightly higher age of air were formed. In Case 1, the indoor air temperature and the temperature of the air supplied from the VI were determined as 22 °C and 33 °C, respectively, whereas in Case 2, these temperatures were determined as 27 °C and 35 °C, respectively. In Case 1, the temperature difference (i.e., buoyancy difference) between the indoor air and the air supplied from the VI on the floor was greater than in Case 2. This resulted in the air supplied from the VI rising more rapidly due to the larger buoyancy difference, leading to a more active air circulation. Consequently, at the indoor temperature setting of 22 °C, the age of air was slightly lower in Case 1 than in Case 2. Next, when comparing Case 5 and Case 6, it is observed that the age of air distributions was similar, but Case 6 formed a slightly higher age of air than Case 5. In both cases, the office had a 4WFCU installed on the ceiling, from which warm air was discharged. In situations where the air discharged from the 4WFCU was at a higher temperature, due to a lower density, the discharged air did not effectively descend to the lower part of the office, resulting in a wider stagnant air zone. Therefore, Case 6, with an indoor temperature setting of 27 °C, exhibited a higher age of air compared to Case 5, with a setting of 22 °C. Consequently, even when the total ventilation rate increased to 2160 m3/h, as shown in Figure 10, the trend of the age of air with respect to indoor temperature settings remained the same. Therefore, within the considered range of ventilation rates, it was confirmed that both offices, whether equipped with the DVS system or the reference setup, showed improved indoor air quality with an indoor temperature setting of 22 °C rather than 27 °C. From these results, it can be concluded that setting the indoor temperature lower, to the extent that thermal comfort is not significantly compromised, can be helpful in improving indoor air quality to some extent. Lowering the indoor temperature setting is also considered a beneficial way to conserve energy.
On the other hand, when comparing the age of air based on the ventilation system (i.e., comparing Figure 9a,c; Figure 9b,d; Figure 10a,c; Figure 10b,d), two main features can be observed. Firstly, in Zone 1, the central space was mostly empty without any significant obstacles to hinder the airflow, and there was no 4WFCU installed on the ceiling. Therefore, in Cases 5, 6, 7, and 8, clean air supplied from a single AP could circulate freely and extensively in Zone 1, whereas in Cases 1, 2, 3, and 4, the air discharged from the APs on the floor was dispersed and sucked through four diffusers installed on the ceiling, resulting in a somewhat more complex flow pattern and a relatively wider distribution of stagnant air zones. This aligns with previous research findings of Oh [46] and Choi and Kang [47], indicating that the interference between air currents intensifies as air currents become more pronounced in a space, potentially causing particles to recirculate or linger in specific zones. For these reasons, it was determined that the age of air in Zone 1 was slightly lower in the reference office compared to the DVS-equipped office. Secondly, in the center of Zone 3, there were multiple office furniture items, such as two office desks and partitions, which constituted obstacles to the airflow, and there was a 4WFCU installed on the ceiling along with two APs on the floor. In contrast to Zone 1, Zone 3 showed a lower age of air in the DVS-equipped office compared to the reference office. In spaces where ventilation is taking place, it is crucial for the discharged air currents to be effectively drawn into exhaust outlets. However, when there are obstacles within the space, the air flow may not be smooth, potentially becoming a hindrance to improving air quality [48,49]. To more clearly explain this, the pathlines of the discharged air flows for both the DVS-equipped office and the reference office at a ventilation rate of 2160 m3/h are shown in Figure 11 and Figure 12, respectively. As shown in Figure 11, in the DVS-equipped office, the flows discharged from the two APs on the floor in Zone 3 did not significantly interfere with each other while being sucked through the 4WFCU and diffusers on the ceiling, resulting in smooth localized ventilation. Consequently, the stagnant air zones decreased, leading to a lower age of air. In contrast, as shown in Figure 12 for the reference office, significant interference was observed among the flows discharged from the two air purifiers on the floor and the 4WFCU on the ceiling. This interference disrupted the flow pattern, causing less efficient air circulation, larger stagnant air zones, and a higher age of air in the reference office. From these findings, it can be inferred that, instead of independently operating multiple APs on the floor and 4WFCU installed on the ceiling, connecting them through ductwork to convert them into the DVS designed in this study can significantly contribute to improving indoor air quality.

4. Conclusions

This study suggested a new-type of displacement ventilation system, where floor-level APs served as VI and a single 4WFCU installed in the ceiling, along with multiple diffusers, acted as VO. Indoor air quality was experimentally and numerically compared between the cases where the proposed DVS was implemented and the cases where the 4WFCU and APs operated independently as a reference. Both DVS and reference cases showed a slightly lower average age of air when the indoor temperature setting was 22 °C compared to 27 °C. Thus, it is concluded that decreasing indoor temperature settings within an appropriate range during the winter season could marginally enhance indoor air quality. In the meantime, in spaces where there were no significant obstacles disrupting the airflow, the reference case exhibited a lower age of air. In contrast, when obstacles such as desks or partitions disrupted the airflow in the central area, the DVS resulted in a lower age of air, and moreover, as the ventilation rate increased, the extent of indoor air quality improvement became more significant. In particular, when the ventilation rate was 2160 m3/h, the DVS case was found to lower the average age of air by approximately 35% compared to the reference case. Therefore, if there are many obstacles, such as desks, partitions, and other elements, obstructing the indoor airflow in a space and if the 4WFCU and APs are operating independently, it is anticipated that a straightforward modification to the newly devised DVS can greatly enhance the indoor air quality in that particular area. In this study, brand-new HEPA filters were used in the experiments and the same filters were applied to all experimental cases. Therefore, any error related to the filter removal efficiency is considered negligible in determining the age of air for each experimental case. However, considering the degradation in filter removal efficiency over time, further research will be needed to investigate the impact of filter removal efficiency changes on the performance of the suggested DVS system in improving indoor air quality. In the future, it is essential to investigate the impact of DVS on indoor air quality when the 4WFCU operates as an air conditioner for cooling during the summer season or a blower without temperature control. Considering various cases of indoor space structures and furniture arrangements, a study on the optimal placement of 4WFCU and APs is also deemed necessary. Furthermore, an economic analysis and energy efficiency evaluation of the proposed DVS, in comparison with the existing ventilation methods, are required in future studies.

Author Contributions

Conceptualization, S.-H.P., H.-W.L. and S.-J.Y.; methodology, S.-H.P., H.-W.L. and S.-J.Y.; software, S.-H.P., I.-H.A., Y.-H.L., C.-H.L., S.-B.S. and S.-H.C.; validation, S.-H.P. and S.-J.Y.; formal analysis, S.-H.P. and S.-J.Y.; investigation, S.-H.P., I.-H.A., Y.-H.L., C.-H.L., S.-B.S., S.-H.C. and S.-J.Y.; resources, H.-W.L. and S.-J.Y.; data curation, S.-H.P. and S.-J.Y.; writing—original draft preparation, S.-H.P.; writing—review and editing, S.-J.Y.; supervision, S.-J.Y.; funding acquisition, S.-J.Y. All authors have read and agreed to the published version of the manuscript.

Funding

This work was supported by the BK21 FOUR (Fostering Outstanding Universities for Research) program through the National Research Foundation (NRF) funded by the Ministry of Education of Korea.

Institutional Review Board Statement

Not applicable.

Informed Consent Statement

Not applicable.

Data Availability Statement

Data are contained within the article.

Conflicts of Interest

Author Hyun-Woo Lee was employed by EURUS. The remaining authors declare that the research was conducted in the absence of any commercial or financial relationships that could be construed as a potential conflict of interest.

References

  1. Stratigou, E.; Dusanter, S.; Brito, J.; Tison, E.; Riffault, V. Using real time measurements to derive the indoor and outdoor contributions of submicron particulate species and trace gases. Toxics 2022, 10, 161. [Google Scholar] [CrossRef] [PubMed]
  2. López, L.R.; Dessì, P.; Cabrera-Codony, A.; Rocha-Melogno, L.; Kraakman, B.; Naddeo, V.; Balaguer, M.D.; Puig, S. CO2 in indoor environments: From environmental and health risk to potential renewable carbon source. Sci. Total Environ. 2023, 856, 159088. [Google Scholar] [CrossRef] [PubMed]
  3. Nurhafizhah, T.; Susilowati, I.H.; Hasiholan, B.P.; Tulaeka, A.R. The chemical and physical parameters as indicator of office air quality at PT X coal mining company. Indian J. Forensic Med. Toxicol. 2021, 15, 1596–1599. [Google Scholar]
  4. Konduracka, E.; Rostoff, P. Links between chronic exposure to outdoor air pollution and cardiovascular diseases: A review. Environ. Chem. Lett. 2022, 20, 2971–2988. [Google Scholar] [CrossRef] [PubMed]
  5. Manisalidis, I.; Stavropoulou, E.; Stavropoulos, A.; Bezirtzoglou, E. Environmental and health impacts of air pollution: A review. Front. Public Health 2020, 8, 14. [Google Scholar] [CrossRef] [PubMed]
  6. Münzel, T.; Hahad, O.; Daiber, A.; Lelieveld, J. Air pollution and cardiovascular diseases. Herz 2021, 46, 120–128. [Google Scholar] [CrossRef] [PubMed]
  7. Martinez-Soto, A.; Jimenez-Gallardo, C.; Villarroel-Lopez, A.; Reyes-Riveros, A.; Höhl, J. Toward sustainable indoor environments: Assessing the impact of thermal insulation measures on air quality in buildings—A case study in Temuco, Chile. Sustainability 2024, 16, 547. [Google Scholar] [CrossRef]
  8. Kabirikopaei, A.; Lau, J.; Nord, J.; Bovaird, J. Identifying the K-12 classrooms’ indoor air quality factors that affect student academic performance. Sci. Total Environ. 2021, 786, 147498. [Google Scholar] [CrossRef]
  9. Aslanoğlu, R.; Ulusoy, B.; Kazak, J.K. Air quality of private interiors during the COVID-19 pandemic: A case study of dormitory interiors as shared spaces. Sustainability 2024, 16, 886. [Google Scholar] [CrossRef]
  10. Rizzo, K.; Camilleri, M.; Gatt, D.; Yousif, C. Optimising mechanical ventilation for indoor air quality and thermal comfort in a mediterranean school building. Sustainability 2024, 16, 766. [Google Scholar] [CrossRef]
  11. Abbaspour, A.; Bahadori-Jahromi, A.; Janbey, A.; Godfrey, P.B.; Amirkhani, S. Enhancing indoor air quality and regulatory compliance: An in-depth comparative study on ventilation strategies and their impact on SARS-CoV-2 transmission risk. Sustainability 2023, 16, 271. [Google Scholar] [CrossRef]
  12. Jeong, J.W.; Lim, H. International and domestic research trend for the building ventilation. In Proceeding of the SAREK Summer Annual Conference, Yongpyong, Republic of Korea, 26–28 June 2017; pp. 263–266. [Google Scholar]
  13. Sandberg, M.; Blomqvist, C.; Sjöberg, M. Efficiency of general ventilation systems in residential and office buildings-concepts and measurements. Ventilation 1986, 85, 323–332. [Google Scholar]
  14. Lee, H.; Awbi, H.B. Effect of internal partitioning on indoor air quality of rooms with mixing ventilation—Basic study. Build. Environ. 2004, 39, 127–141. [Google Scholar] [CrossRef]
  15. Kong, X.; Xi, C.; Li, H.; Lin, Z. A comparative experimental study on the performance of mixing ventilation and stratum ventilation for space heating. Build. Environ. 2019, 157, 34–46. [Google Scholar] [CrossRef]
  16. Krajčík, M.; Simone, A.; Olesen, B.W. Air distribution and ventilation effectiveness in an occupied room heated by warm air. Energy Build. 2012, 55, 94–101. [Google Scholar] [CrossRef]
  17. AIVC. Displacement Ventilaion. Available online: https://www.aivc.org/sites/default/files/members_area/medias/pdf/VIP/VIP05.Displacement_Vent.pdf (accessed on 17 March 2023).
  18. Awbi, H.B.; Gan, G. Evaluation of the overall performance of room air distribution. Proc. Indoor Air 1993, 3, 283e8. [Google Scholar]
  19. Lee, C.K.; Lam, H.N. Computer modeling of displacement ventilation systems based on plume rise in stratified environment. Energy Build. 2007, 39, 427–436. [Google Scholar] [CrossRef]
  20. Lee, K.; Zhang, T.; Jiang, Z.; Chen, Q. Comparison of airflow and contaminant distributions in rooms with traditional displacement ventilation and under-floor air distribution systems. ASHRAE Trans. 2009, 115, 306–321. [Google Scholar]
  21. Wei, G.; Chen, B.; Lai, D.; Chen, Q. An improved displacement ventilation system for a machining plant. Atmos. Environ. 2020, 228, 117419. [Google Scholar] [CrossRef]
  22. Wang, H.Q.; Huang, C.H.; Liu, D.; Zhao, F.Y.; Sun, H.B.; Wang, F.F.; Li, C.; Kou, G.X.; Ye, M.Q. Fume transports in a high rise industrial welding hall with displacement ventilation system and individual ventilation units. Build. Environ. 2012, 52, 119–128. [Google Scholar] [CrossRef]
  23. Liu, M.; Chang, D.; Liu, J.; Ji, S.; Lin, C.H.; Wei, D.; Long, A.; Zhang, T.; Shen, X.; Cao, Q.; et al. Experimental investigation of air distribution in an airliner cabin mockup with displacement ventilation. Build. Environ. 2021, 191, 107577. [Google Scholar] [CrossRef]
  24. Berlanga, F.A.; de Adana, M.R.; Olmedo, I.; Villafruela, J.M.; San Jose, J.F.; Castro, F. Experimental evaluation of thermal comfort, ventilation performance indices and exposure to airborne contaminant in an airborne infection isolation room equipped with a displacement air distribution system. Energy Build. 2018, 158, 209–221. [Google Scholar] [CrossRef]
  25. Qiu-Wang, W.; Zhen, Z. Performance comparison between mixing ventilation and displacement ventilation with and without cooled ceiling. Eng. Comput. 2006, 23, 218–237. [Google Scholar] [CrossRef]
  26. He, Q.; Niu, J.; Gao, N.; Zhu, T.; Wu, J. CFD study of exhaled droplet transmission between occupants under different ventilation strategies in a typical office room. Build. Environ. 2011, 46, 397–408. [Google Scholar] [CrossRef] [PubMed]
  27. Tian, X.; Li, B.; Ma, Y.; Liu, D.; Li, Y.; Cheng, Y. Experimental study of local thermal comfort and ventilation performance for mixing, displacement and stratum ventilation in an office. Sustain. Cities Soc. 2019, 50, 101630. [Google Scholar] [CrossRef]
  28. Liu, S.; Koupriyanov, M.; Paskaruk, D.; Fediuk, G.; Chen, Q. Investigation of airborne particle exposure in an office with mixing and displacement ventilation. Sustain. Cities Soc. 2022, 79, 103718. [Google Scholar] [CrossRef] [PubMed]
  29. ASHRAE 62.1-2013; Ventilation for Acceptable Indoor Air Quality. American Society of Heating. Refrigerating and Air-Conditioning Engineers, Inc.: Atlanta, GA, USA, 2013; p. 40.
  30. Launder, B.E.; Spalding, D.B. The numerical computation of turbulent flows. Comp. Methods Appl. Mech. Eng. 1974, 3, 269–289. [Google Scholar] [CrossRef]
  31. Chen, Q. Comparison of different κ–ε models for indoor air flow computations. Numer. Heat Transf. B Fundam. 1995, 28, 353–369. [Google Scholar] [CrossRef]
  32. Chen, Q. Ventilation performance prediction for buildings: A method overview and recent applications. Build. Environ. 2009, 44, 848–858. [Google Scholar] [CrossRef]
  33. Salmanzadeh, M.; Zahedi, G.; Ahmadi, G.; Marr, D.R.; Glauser, M. Computational modeling of effects of thermal plume adjacent to the body on the indoor airflow and particle transport. J. Aerosol Sci. 2012, 53, 29–39. [Google Scholar] [CrossRef]
  34. ANSYS FLUENT 12.0 User’s Guide. Available online: https://www.afs.enea.it/project/neptunius/docs/fluent/html/ug/main_pre.htm (accessed on 2 March 2023).
  35. Noh, J.H.; Lee, J.; Noh, K.C.; Kim, Y.W.; Yook, S.J. Effects of hospital ward curtains on ventilation in a four-bed hospital ward. Aerosol Air Qual. Res. 2018, 18, 2643–2653. [Google Scholar] [CrossRef]
  36. Lee, J.; Park, S.H.; An, I.H.; Kim, Y.W.; Yook, S.J. Investigation of the optimal operating position of an air cleaner in terms of indoor air quality in a four-bed hospital ward. Toxics 2022, 10, 360. [Google Scholar] [CrossRef] [PubMed]
  37. Lee, J.; Noh, J.H.; Noh, K.C.; Kim, Y.W.; Yook, S.J. Effect of a system air conditioner on local air quality in a four-bed ward. Aerosol Air Qual. Res. 2021, 21, 200533. [Google Scholar] [CrossRef]
  38. Holmgren, H.; Ljungström, E.; Almstrand, A.; Bake, B.; Olin, A. Size distribution of exhaled particles in the range from 0.01 to 2.0 μm. J. Aerosol Sci. 2010, 41, 439–446. [Google Scholar] [CrossRef]
  39. See, S.W.; Balasubramanian, R.; Joshi, U.M. Physical characteristics of nanoparticles emitted from incense smoke. Sci. Technol. Adv. Mater. 2007, 8, 25–32. [Google Scholar] [CrossRef]
  40. Ji, X.; Le Bihan, O.; Ramalho, O.; Mandin, C.; D’Anna, B.; Martinon, L.; Nicolas, M.; Bard, D.; Pairon, J.C. Characterization of particles emitted by incense burning in an experimental house. Indoor Air 2010, 20, 147–158. [Google Scholar] [CrossRef] [PubMed]
  41. Sidheswaran, M.A.; Destaillats, H.; Sullivan, D.P.; Cohn, S.; Fisk, W.J. Energy efficient indoor VOC air cleaning with activated carbon fiber (ACF) filters. Build. Environ. 2012, 47, 357–367. [Google Scholar] [CrossRef]
  42. Gallego, E.; Roca, F.J.; Perales, J.F.; Guardino, X. Experimental evaluation of VOC removal efficiency of a coconut shell activated carbon filter for indoor air quality enhancement. Build. Environ. 2013, 67, 14–25. [Google Scholar] [CrossRef]
  43. Liu, X.; Liu, X.; Zhang, T. Influence of air-conditioning systems on buoyancy driven air infiltration in large space buildings: A case study of a railway station. Energy Build. 2020, 210, 109781. [Google Scholar] [CrossRef]
  44. Cheng, F.; Wu, Y.; Gao, S.; Liao, C.; Cheng, Y. Experimental study of thermal comfort in a field environment chamber with stratum ventilation system in winter. Build. Environ. 2022, 207, 108445. [Google Scholar] [CrossRef]
  45. Zhang, S.; Lin, Z.; Ai, Z.; Wang, F.; Cheng, Y.; Huan, C. Effects of operation parameters on performances of stratum ventilation for heating mode. Build. Environ. 2019, 148, 55–66. [Google Scholar] [CrossRef]
  46. Oh, M.D. Control technology of contamination particles and air flow in clean room. Mag. Soc. Air-Cond. Refrig. Eng. Korea 1989, 18, 515–531. [Google Scholar]
  47. Choi, D.H.; Kang, D.H. Experimental and computational fluid dynamics (CFD) methods to analyze particle resuspension and dispersion in buildings. J. Archit. Inst. Korea Plan. Des. 2013, 29, 275–282. [Google Scholar]
  48. Cheong, K.W.D.; Phua, S.Y. Development of ventilation design strategy for effective removal of pollutant in the isolation room of a hospital. Build. Environ. 2006, 41, 1161–1170. [Google Scholar]
  49. Xue, K.; Cao, G.; Liu, M.; Zhang, Y.; Pedersen, C.; Mathisen, H.M.; Stenstad, L.I.; Skogås, J.G. Experimental study on the effect of exhaust airflows on the surgical environment in an operating room with mixing ventilation. J. Build. Eng. 2020, 32, 101837. [Google Scholar] [CrossRef]
Figure 1. Schematic of ventilation systems: (a) displacement ventilation system (DVS) devised in this study; (b) 4-way fan coil unit and air purifiers operated independently.
Sustainability 16 01740 g001
Figure 2. Office equipped with the DVS devised in this study (● age-of-air measurement location, Δ air temperature measurement location): (a) photo; (b) isometric view; (c) plane view.
Sustainability 16 01740 g002
Figure 3. Reference office having air purifiers and a 4-way fan coil unit (● age-of-air measurement location, Δ air temperature measurement location): (a) isometric view; (b) plane view.
Sustainability 16 01740 g003
Figure 4. Grid system used for simulation.
Sustainability 16 01740 g004
Figure 5. An illustration depicting the decay in particle number concentration over time.
Sustainability 16 01740 g005
Figure 6. Comparison of the age of air between experiment and simulation: (a) Case 1 for the office equipped with DVS; (b) Case 5 for the reference office equipped with 4WFCU and APs.
Sustainability 16 01740 g006
Figure 7. Error of the age of air between experimental data and numerical outcomes for all considered cases.
Sustainability 16 01740 g007
Figure 8. Comparison of temperature distribution between experiment and simulation: (a) Case 1, T1, (b) Case 1, T2, (c) Case 1, T3, (d) Case 5, T1, (e) Case 5, T2, (f) Case 5, T3.
Sustainability 16 01740 g008
Figure 9. Contour of the age of air at 1.1 m height (ventilation rate 432 m3/h): (a) Case 1—office with DVS with temperature setting of 22 °C; (b) Case 2—office with DVS with temperature setting of 27 °C; (c) Case 5—reference office with temperature setting of 22 °C; (d) Case 6—reference office with temperature setting of 27 °C.
Sustainability 16 01740 g009
Figure 10. Contour of the age of air at 1.1 m height (ventilation rate 2160 m3/h): (a) Case 3—office with DVS with temperature setting of 22 °C; (b) Case 4—office with DVS with temperature setting of 27 °C; (c) Case 7—reference office with temperature setting of 22 °C; (d) Case 8—reference office with temperature setting of 27 °C.
Sustainability 16 01740 g010
Figure 11. Flow pathlines of the air discharged from each air purifier placed in Zone 3 of the office equipped with DVS.
Sustainability 16 01740 g011
Figure 12. Flow pathlines of the air discharged from each air purifier and 4-way fan coil unit placed in Zone 3 of the reference office.
Sustainability 16 01740 g012
Table 1. Cases for experiment and simulation.
CaseType of Ventilation SystemTotal Ventilation Rate (m3/h)Temperature Setting (°C)
1Displacement ventilation system (shown in Figure 2)43222
243227
3216022
4216027
54-way fan coil unit and air purifiers operated independently (shown in Figure 3)43222
643227
7216022
8216027
Disclaimer/Publisher’s Note: The statements, opinions and data contained in all publications are solely those of the individual author(s) and contributor(s) and not of MDPI and/or the editor(s). MDPI and/or the editor(s) disclaim responsibility for any injury to people or property resulting from any ideas, methods, instructions or products referred to in the content.

