
Simulation of Development Strategies and Evaluation of Low-Carbon Development Level in Jiangsu Province under Carbon Peaking and Carbon Neutrality Goals

Abstract
:1. Introduction
2. Literature Review
2.1. Research on the Connotation of Low-Carbon Development
2.2. Research on Dimension Partitioning of the Evaluation Index System of Low-Carbon Development Level
2.3. Research on the Transformation Pathways of Low-Carbon Development
2.4. Summary
3. Study on the Evaluation of Low-Carbon Development Level in Jiangsu Province under the Carbon Peaking and Carbon Neutrality Goals
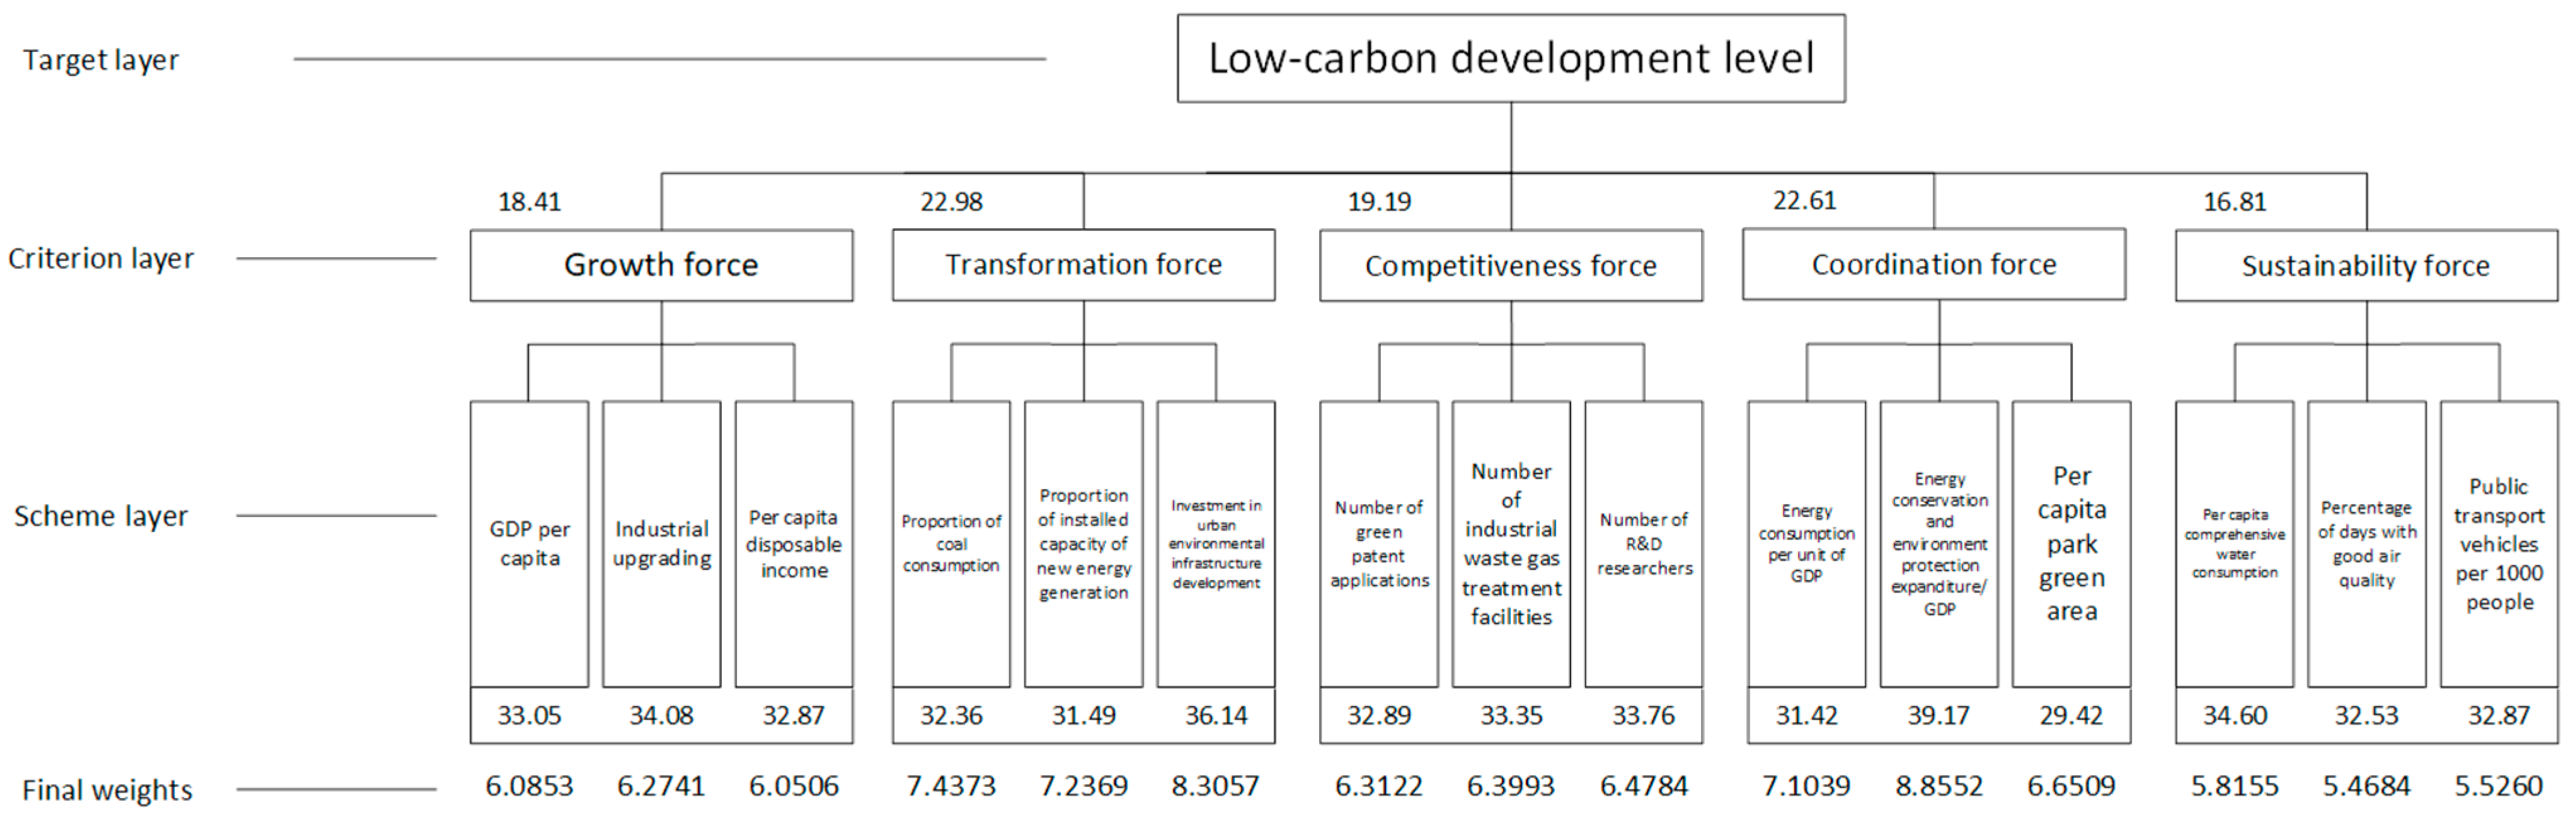
3.1. Construction of the Low-Carbon Development Level Evaluation Indicator System
3.1.1. Selection Principles of Indicators
- (1)
- Systematicness
- (2)
- Representativeness
- (3)
- Operability
3.1.2. Indicator System Construction
3.1.3. Data Sources and Processing
3.2. Research Methods
3.2.1. Improved Analytic Hierarchy Process
- (1)
- Standardization of indicators
- (2)
- Calculating the linear combination coefficient matrix
- (3)
- Calculating the composite score factor
- (4)
- Calculating the importance of each indicator
- (5)
- Constructing a hierarchical analysis judgment matrix and calculating the weights
3.2.2. Entropy Weighting Method
- (1)
- Calculating entropy values and their redundancy
- (2)
- Calculating weights
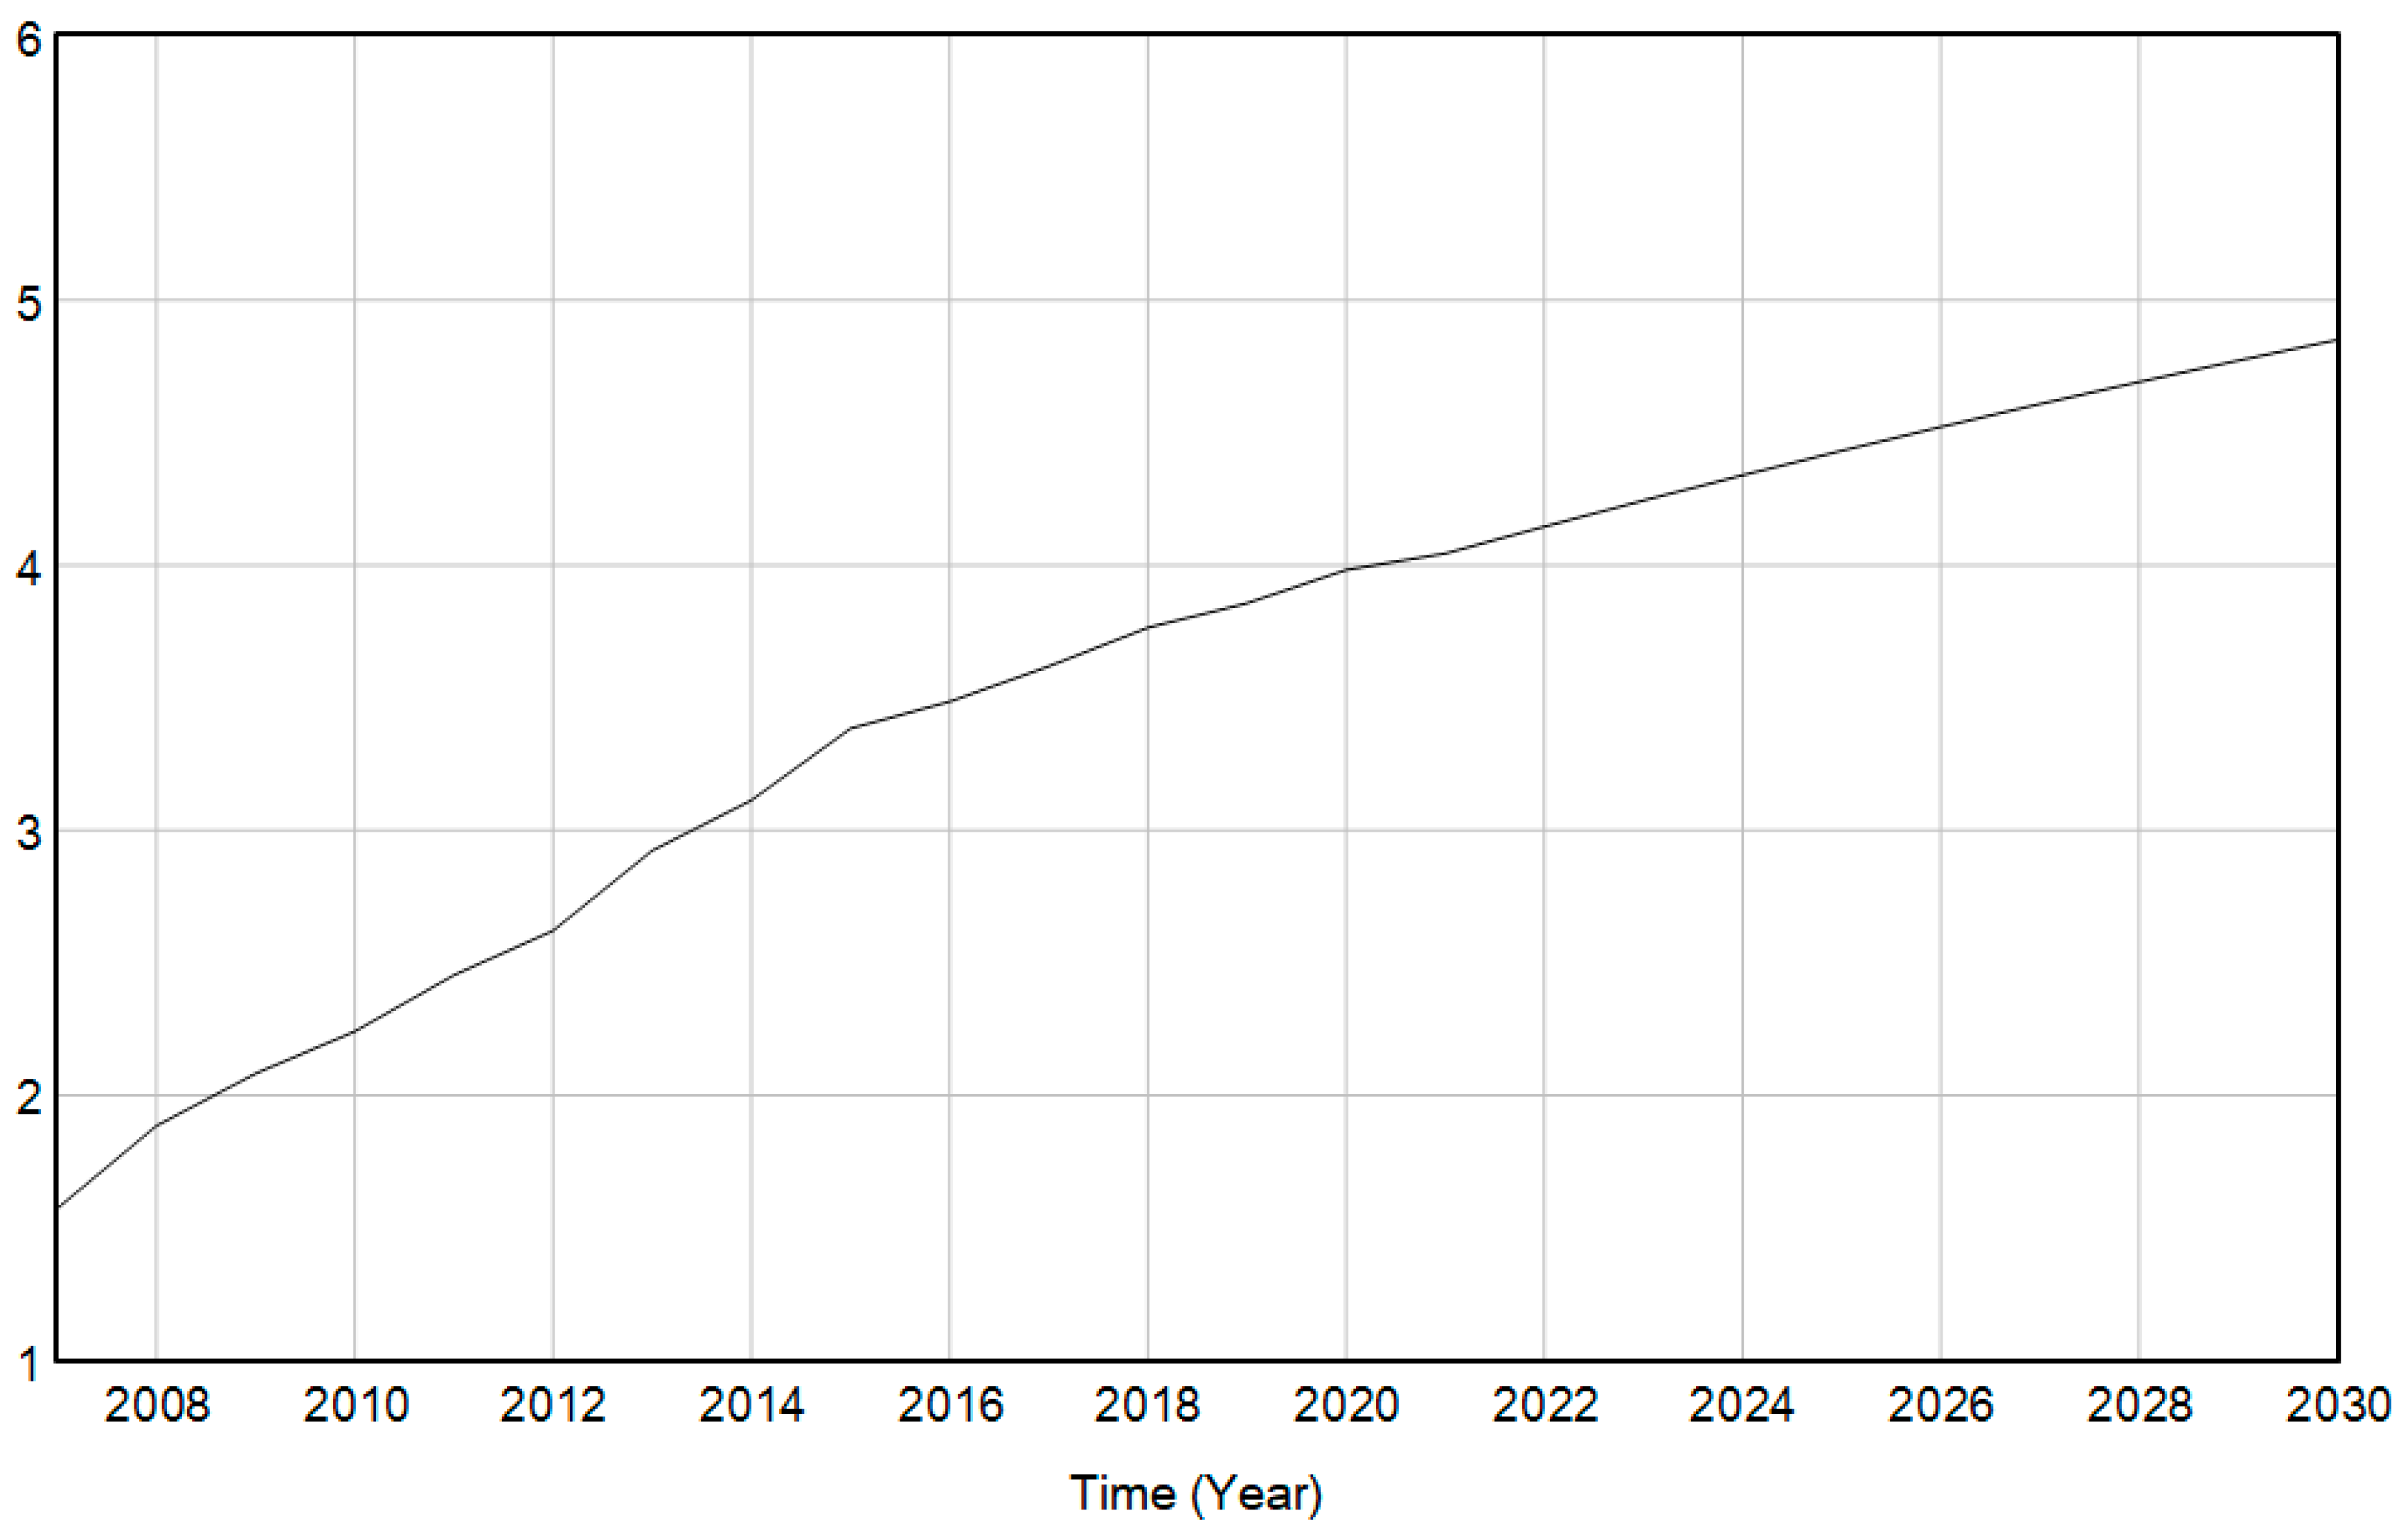
3.3. Calculating the Low-Carbon Development Level
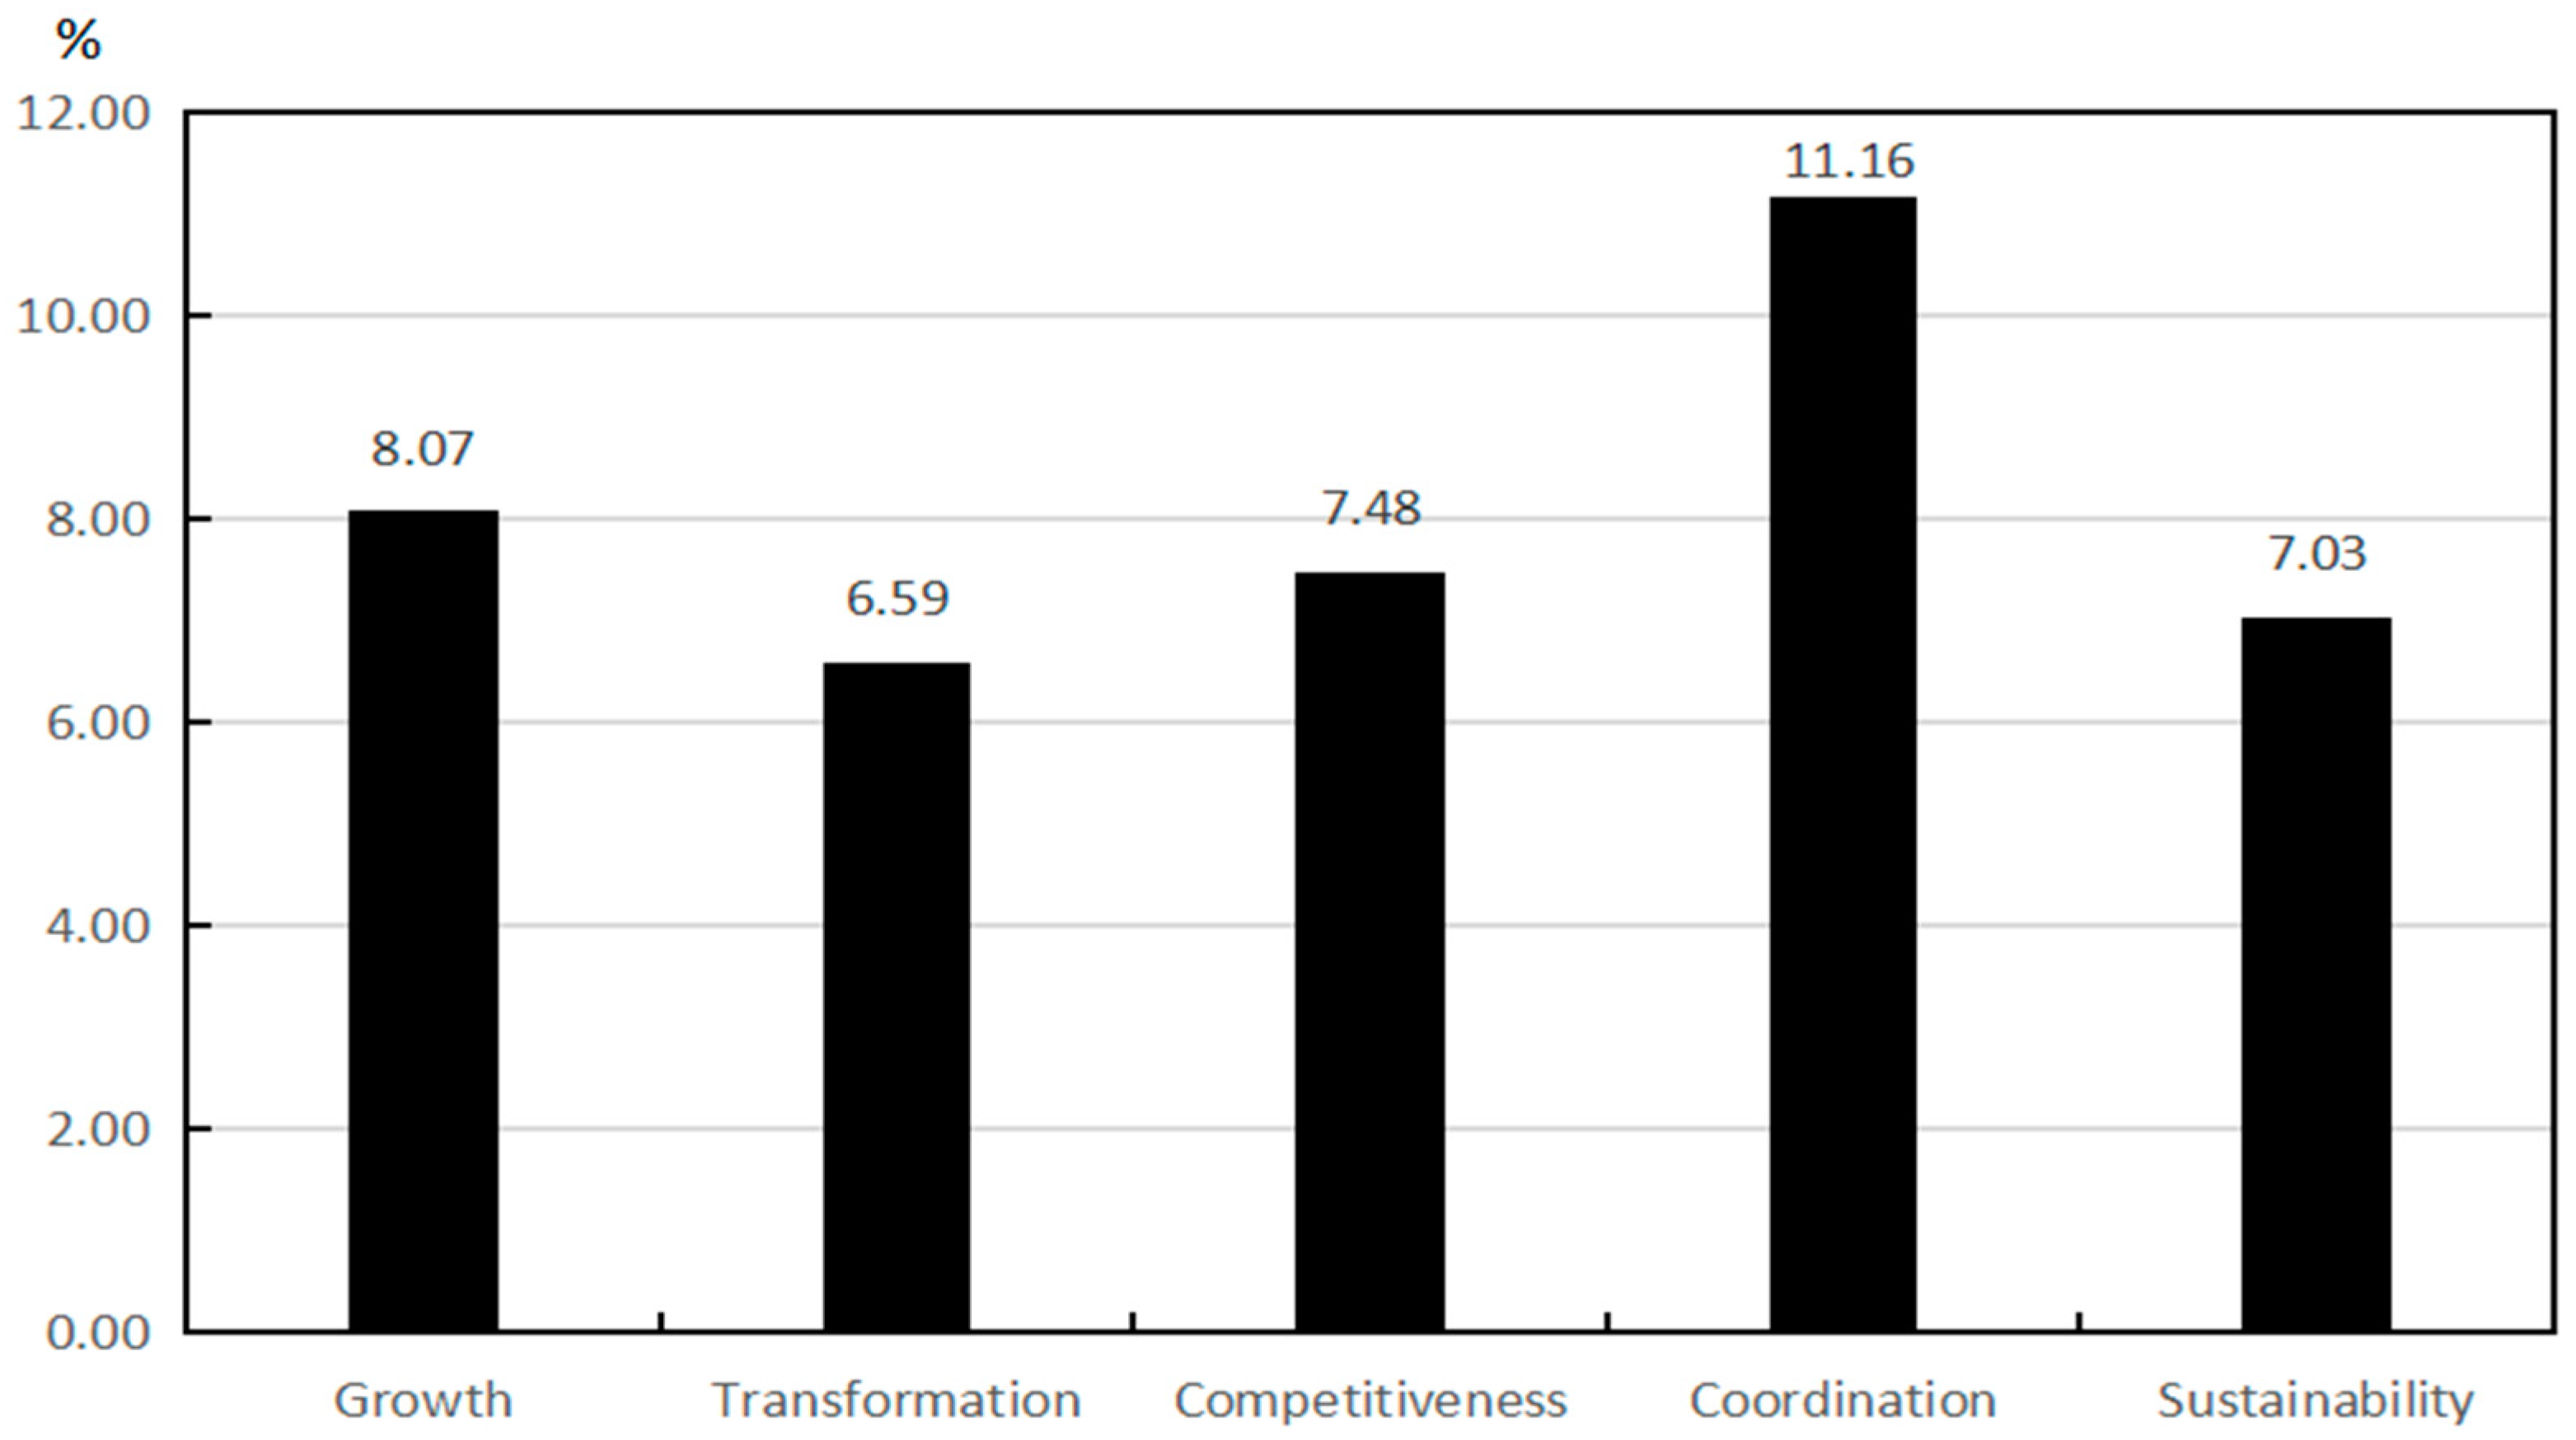
3.4. Results and Discussion of the Evaluation
4. Construction and Simulations of Low-Carbon Development System Dynamics Model for Jiangsu Province under “Double Carbon” Goals
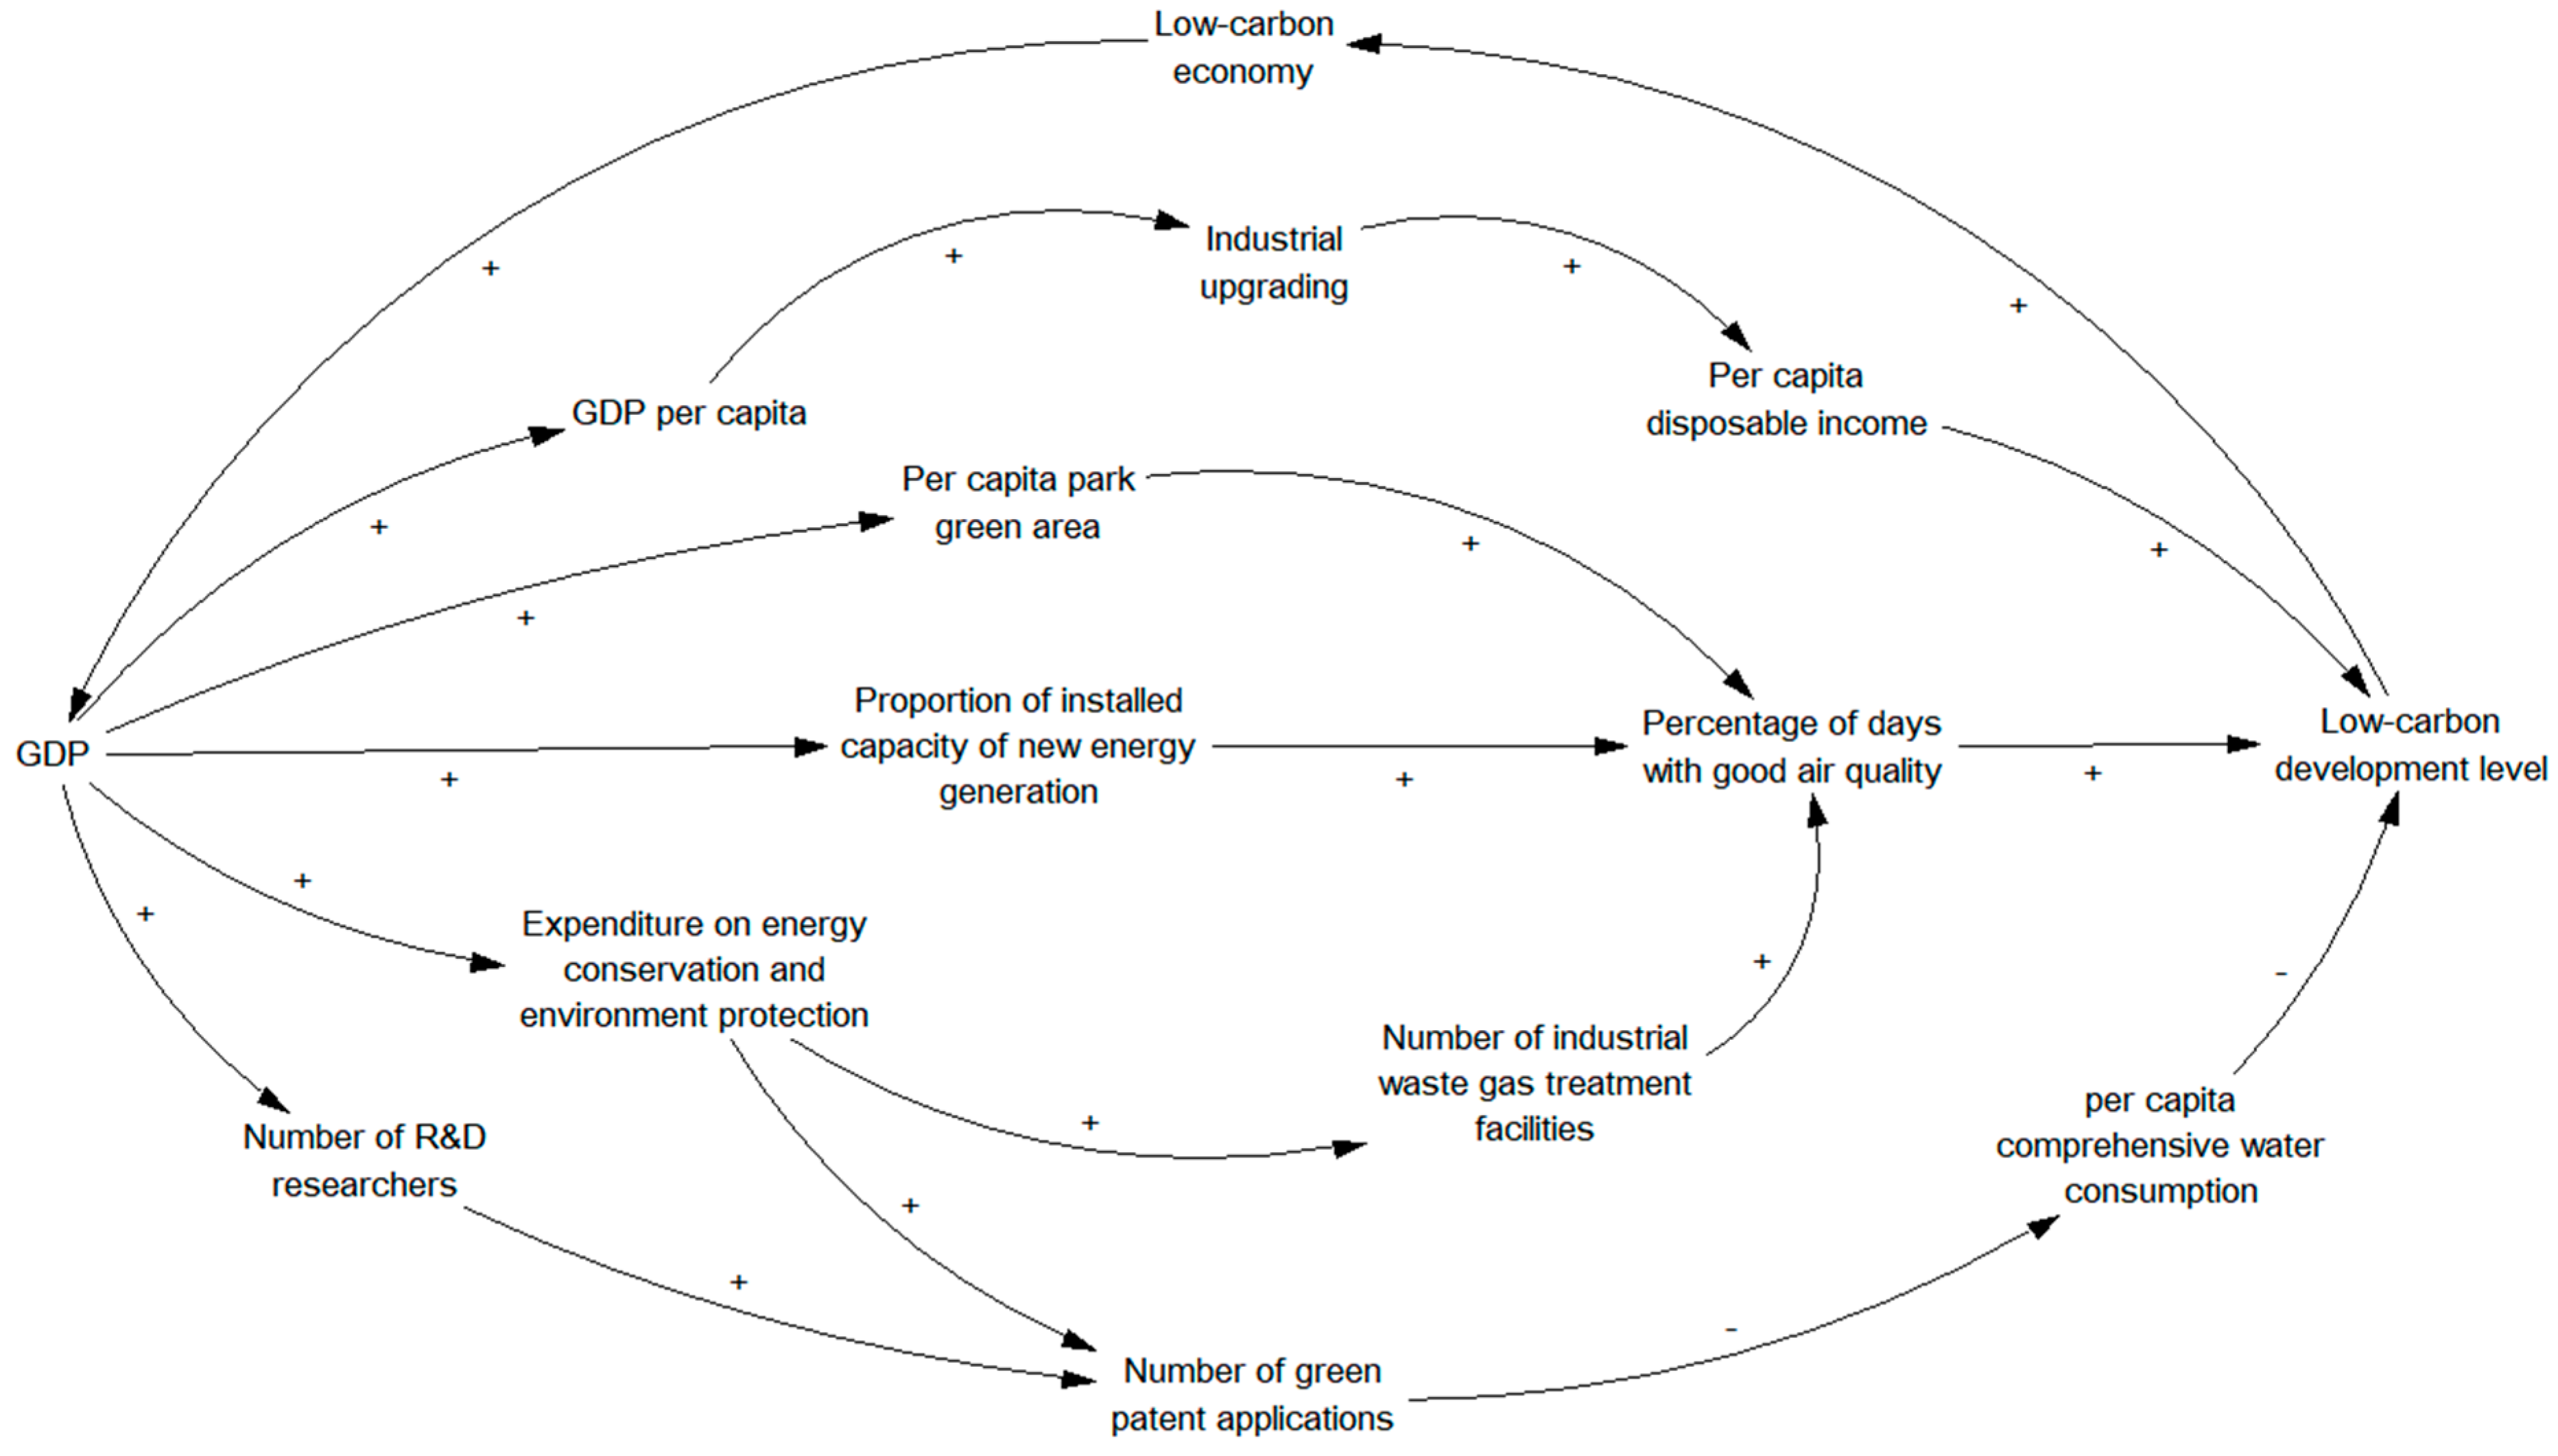
4.1. The Causality Diagram
- (1)
- From the perspective of growth force:
- (2)
- From the perspective of transformation force:
- (3)
- From the perspective of competitiveness force:
- (4)
- From the perspective of coordination force:
- (5)
- From the perspective of sustainability force:
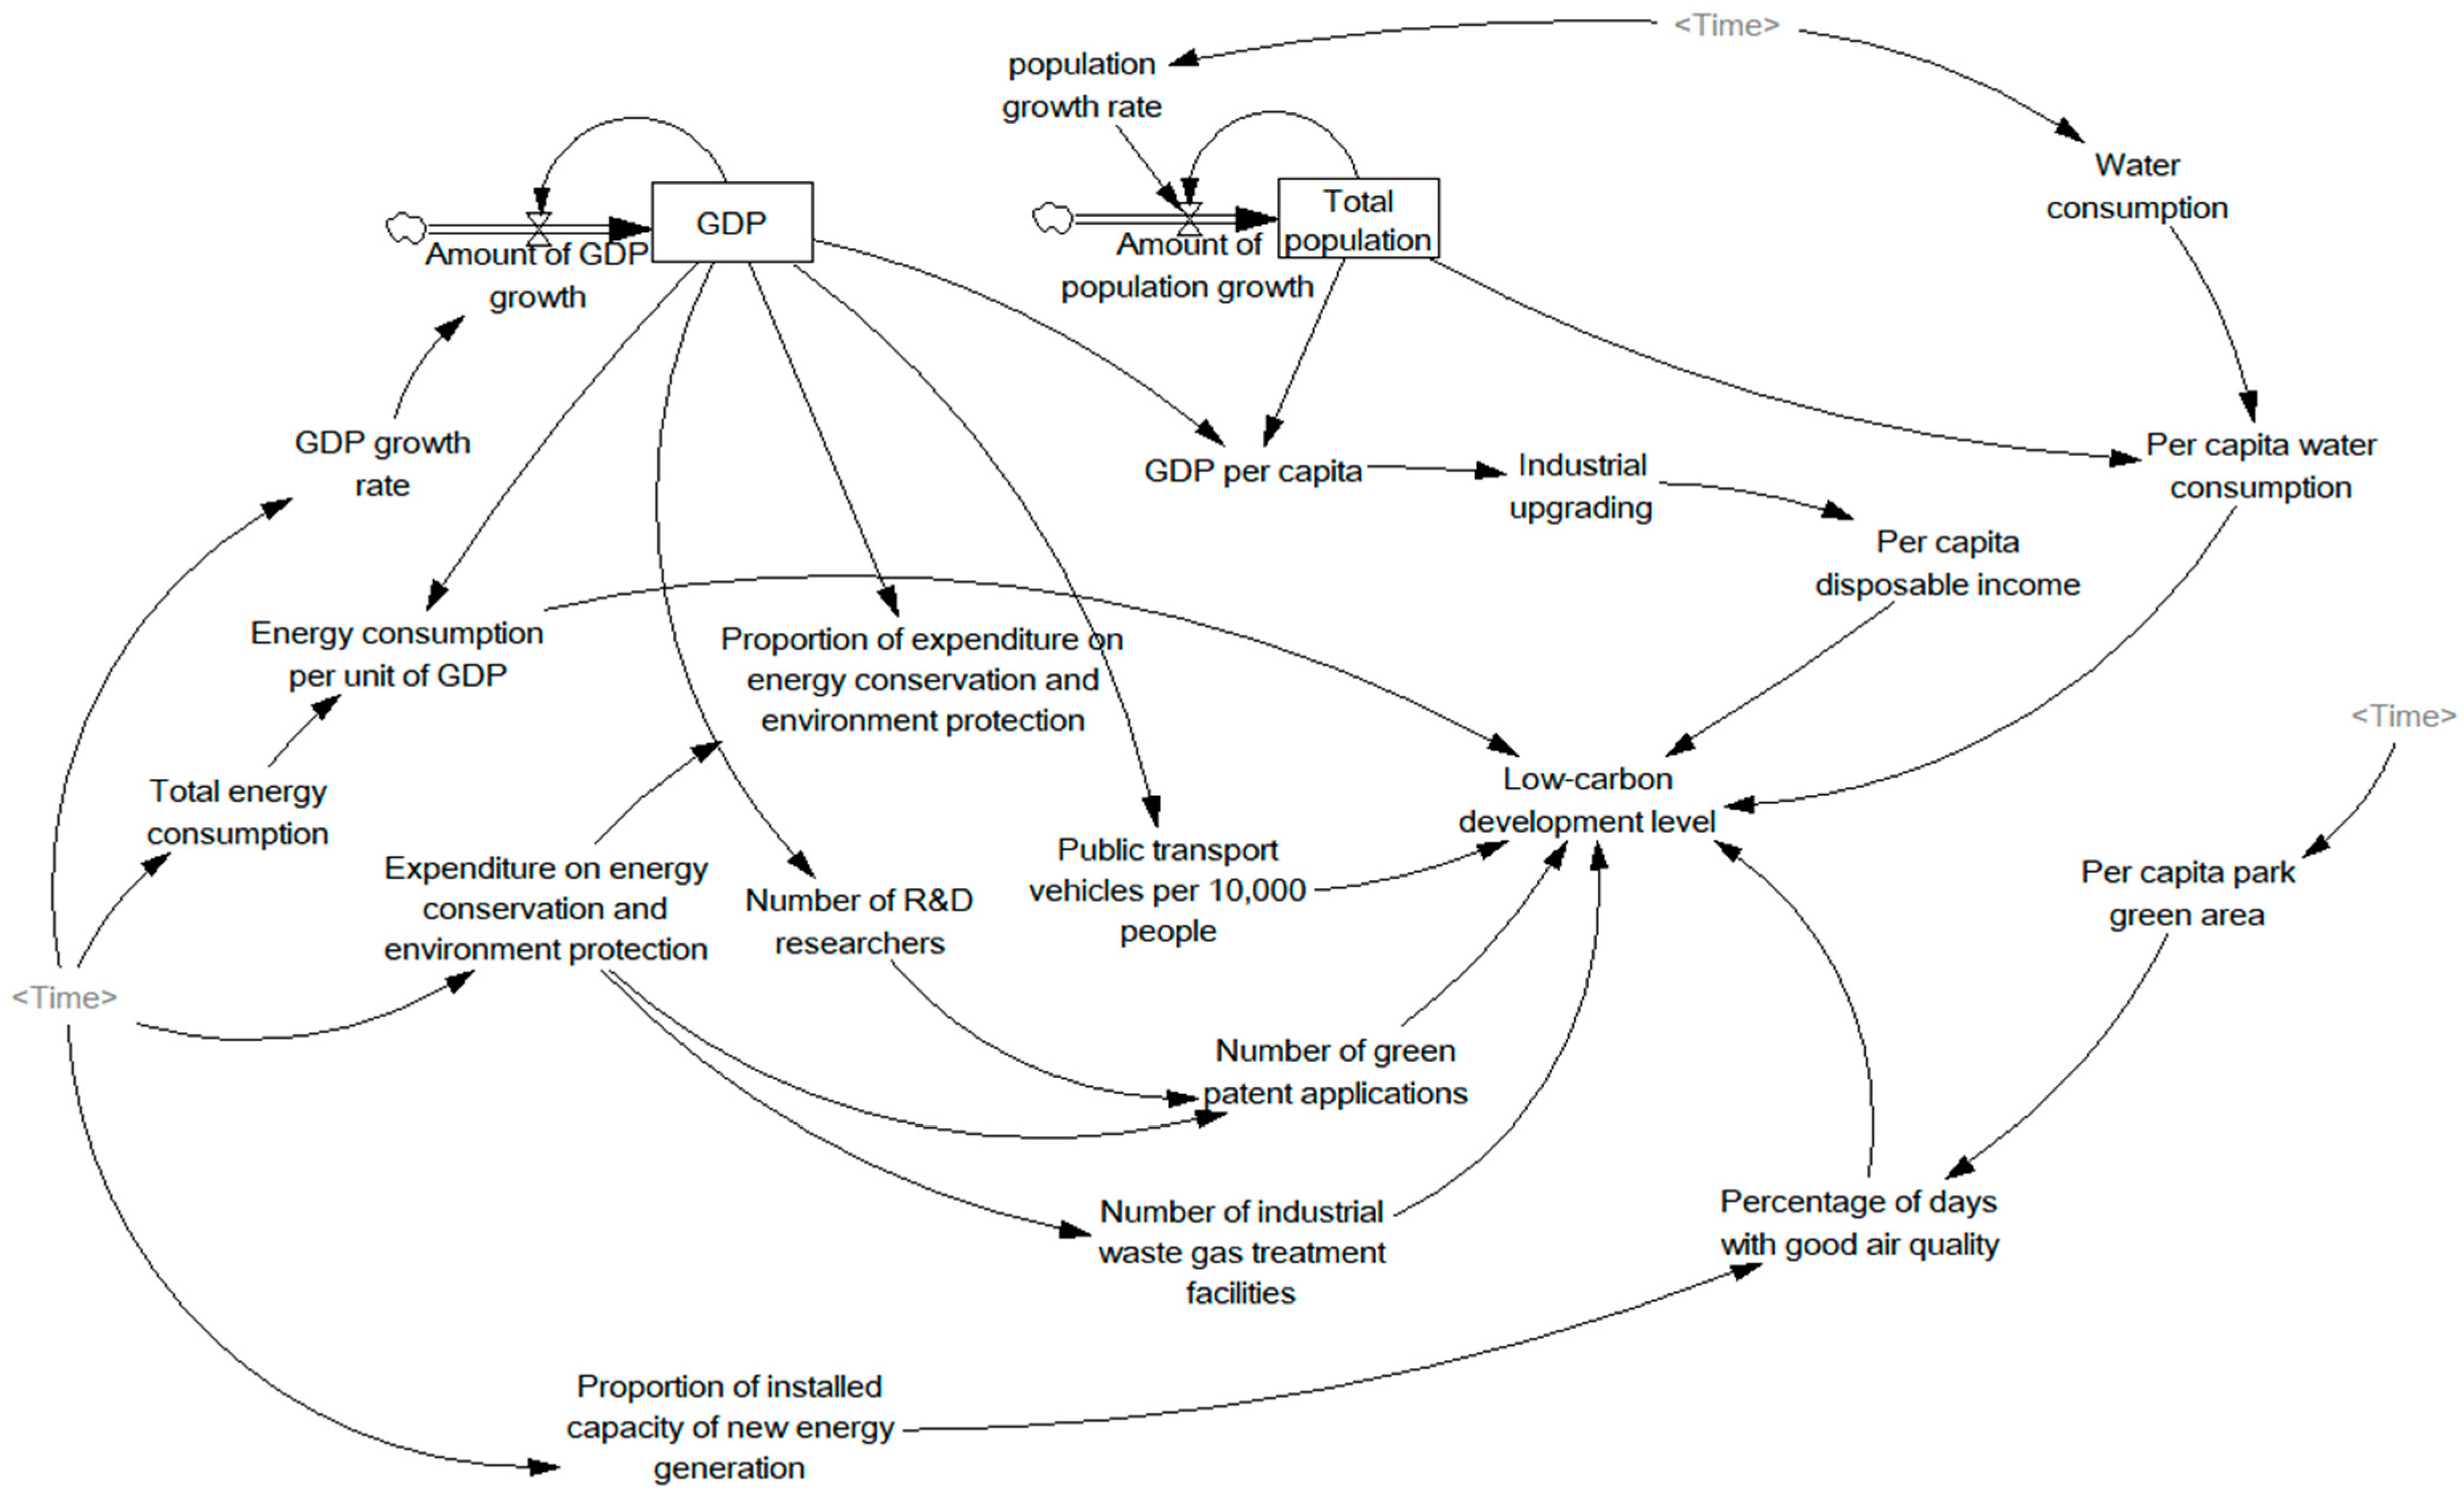
4.2. The System Dynamics Flow Diagram and Main Equations
4.2.1. System Boundaries
4.2.2. System Dynamics Flow Diagram
4.2.3. Model Equations
- (1)
- Level variables
- (2)
- Rate variables
- (3)
- Auxiliary variables
4.3. Model Testing
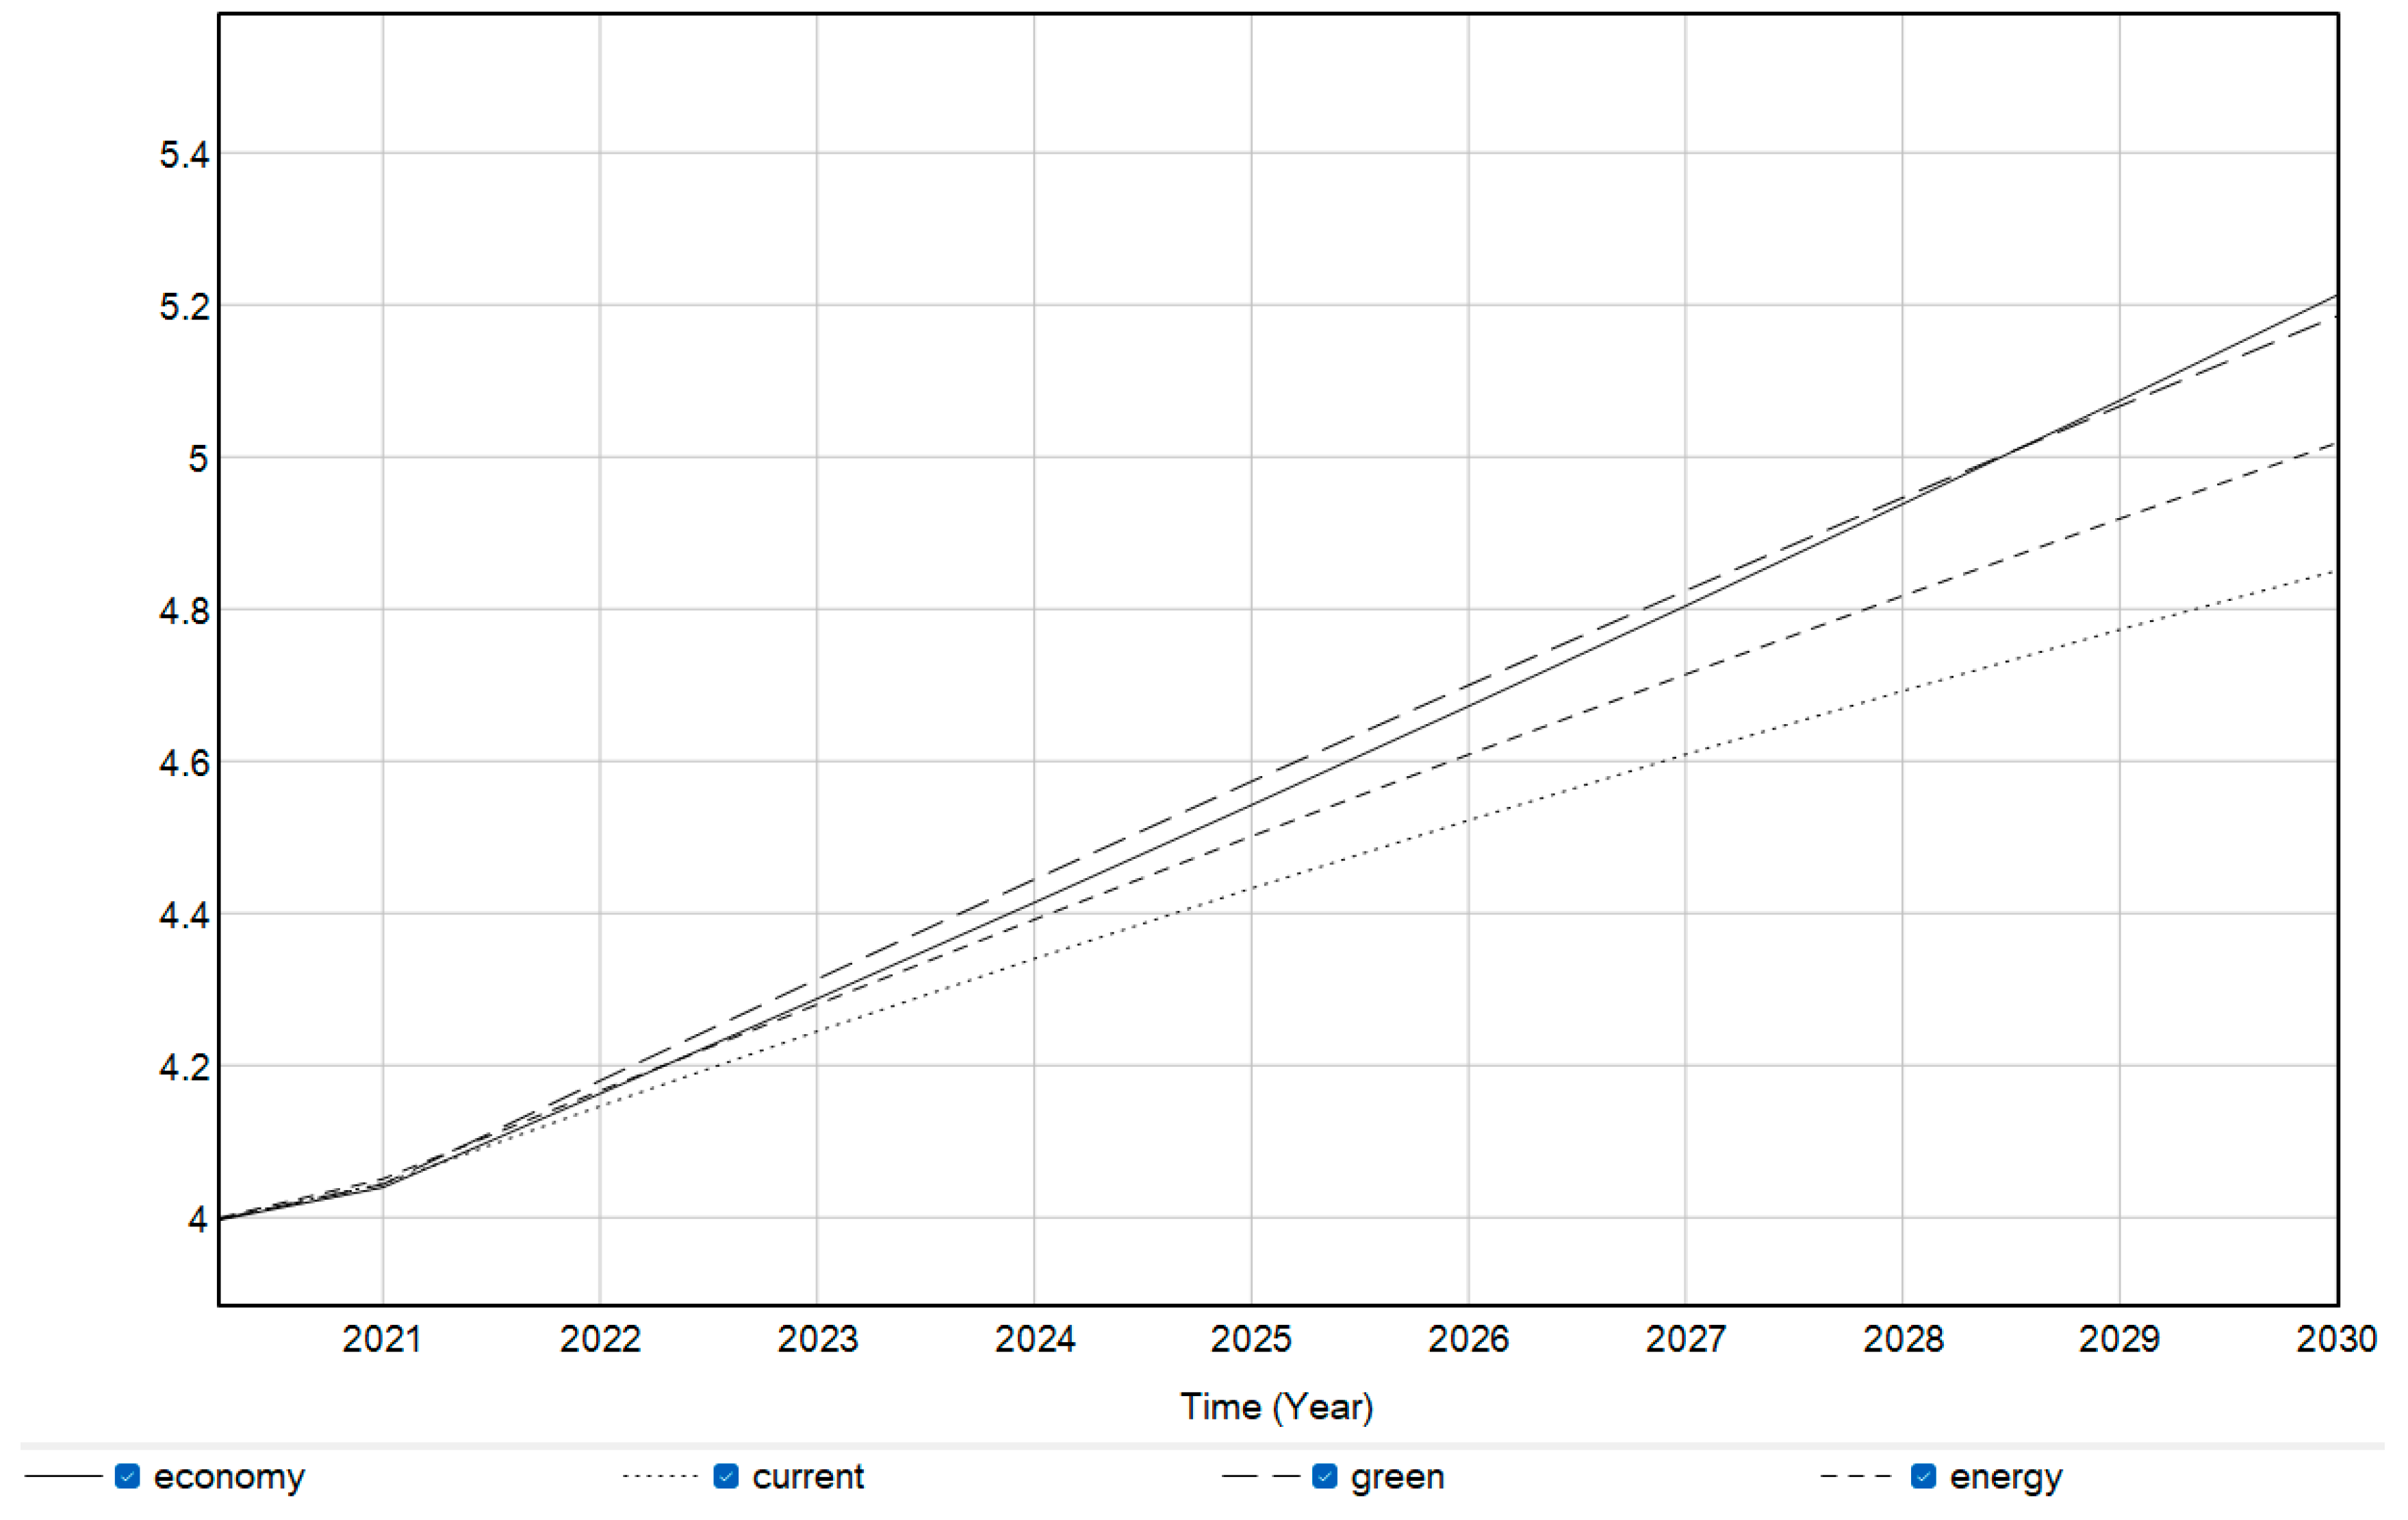
4.4. Scenario Analysis
4.4.1. Basic Scenario Simulation
4.4.2. Simulation of Scenarios
4.5. Results and Discussion of Simulations
5. Conclusions and Recommendations
5.1. Conclusions
5.2. Recommendations
- (1)
- Optimizing industrial structure and promoting low-carbon industries.
- (2)
- Accelerating the transformation of energy structure and promoting low-carbon and green energy.
- (3)
- Developing a green economy and promoting sustainable development.
5.3. Limitations
Author Contributions
Funding
Institutional Review Board Statement
Informed Consent Statement
Data Availability Statement
Conflicts of Interest
Appendix A

| Indicators | 2007 | 2008 | 2009 | 2010 | 2011 | 2012 | 2013 | 2014 | 2015 | 2016 | 2017 | 2018 | 2019 | 2020 | 2021 |
|---|---|---|---|---|---|---|---|---|---|---|---|---|---|---|---|
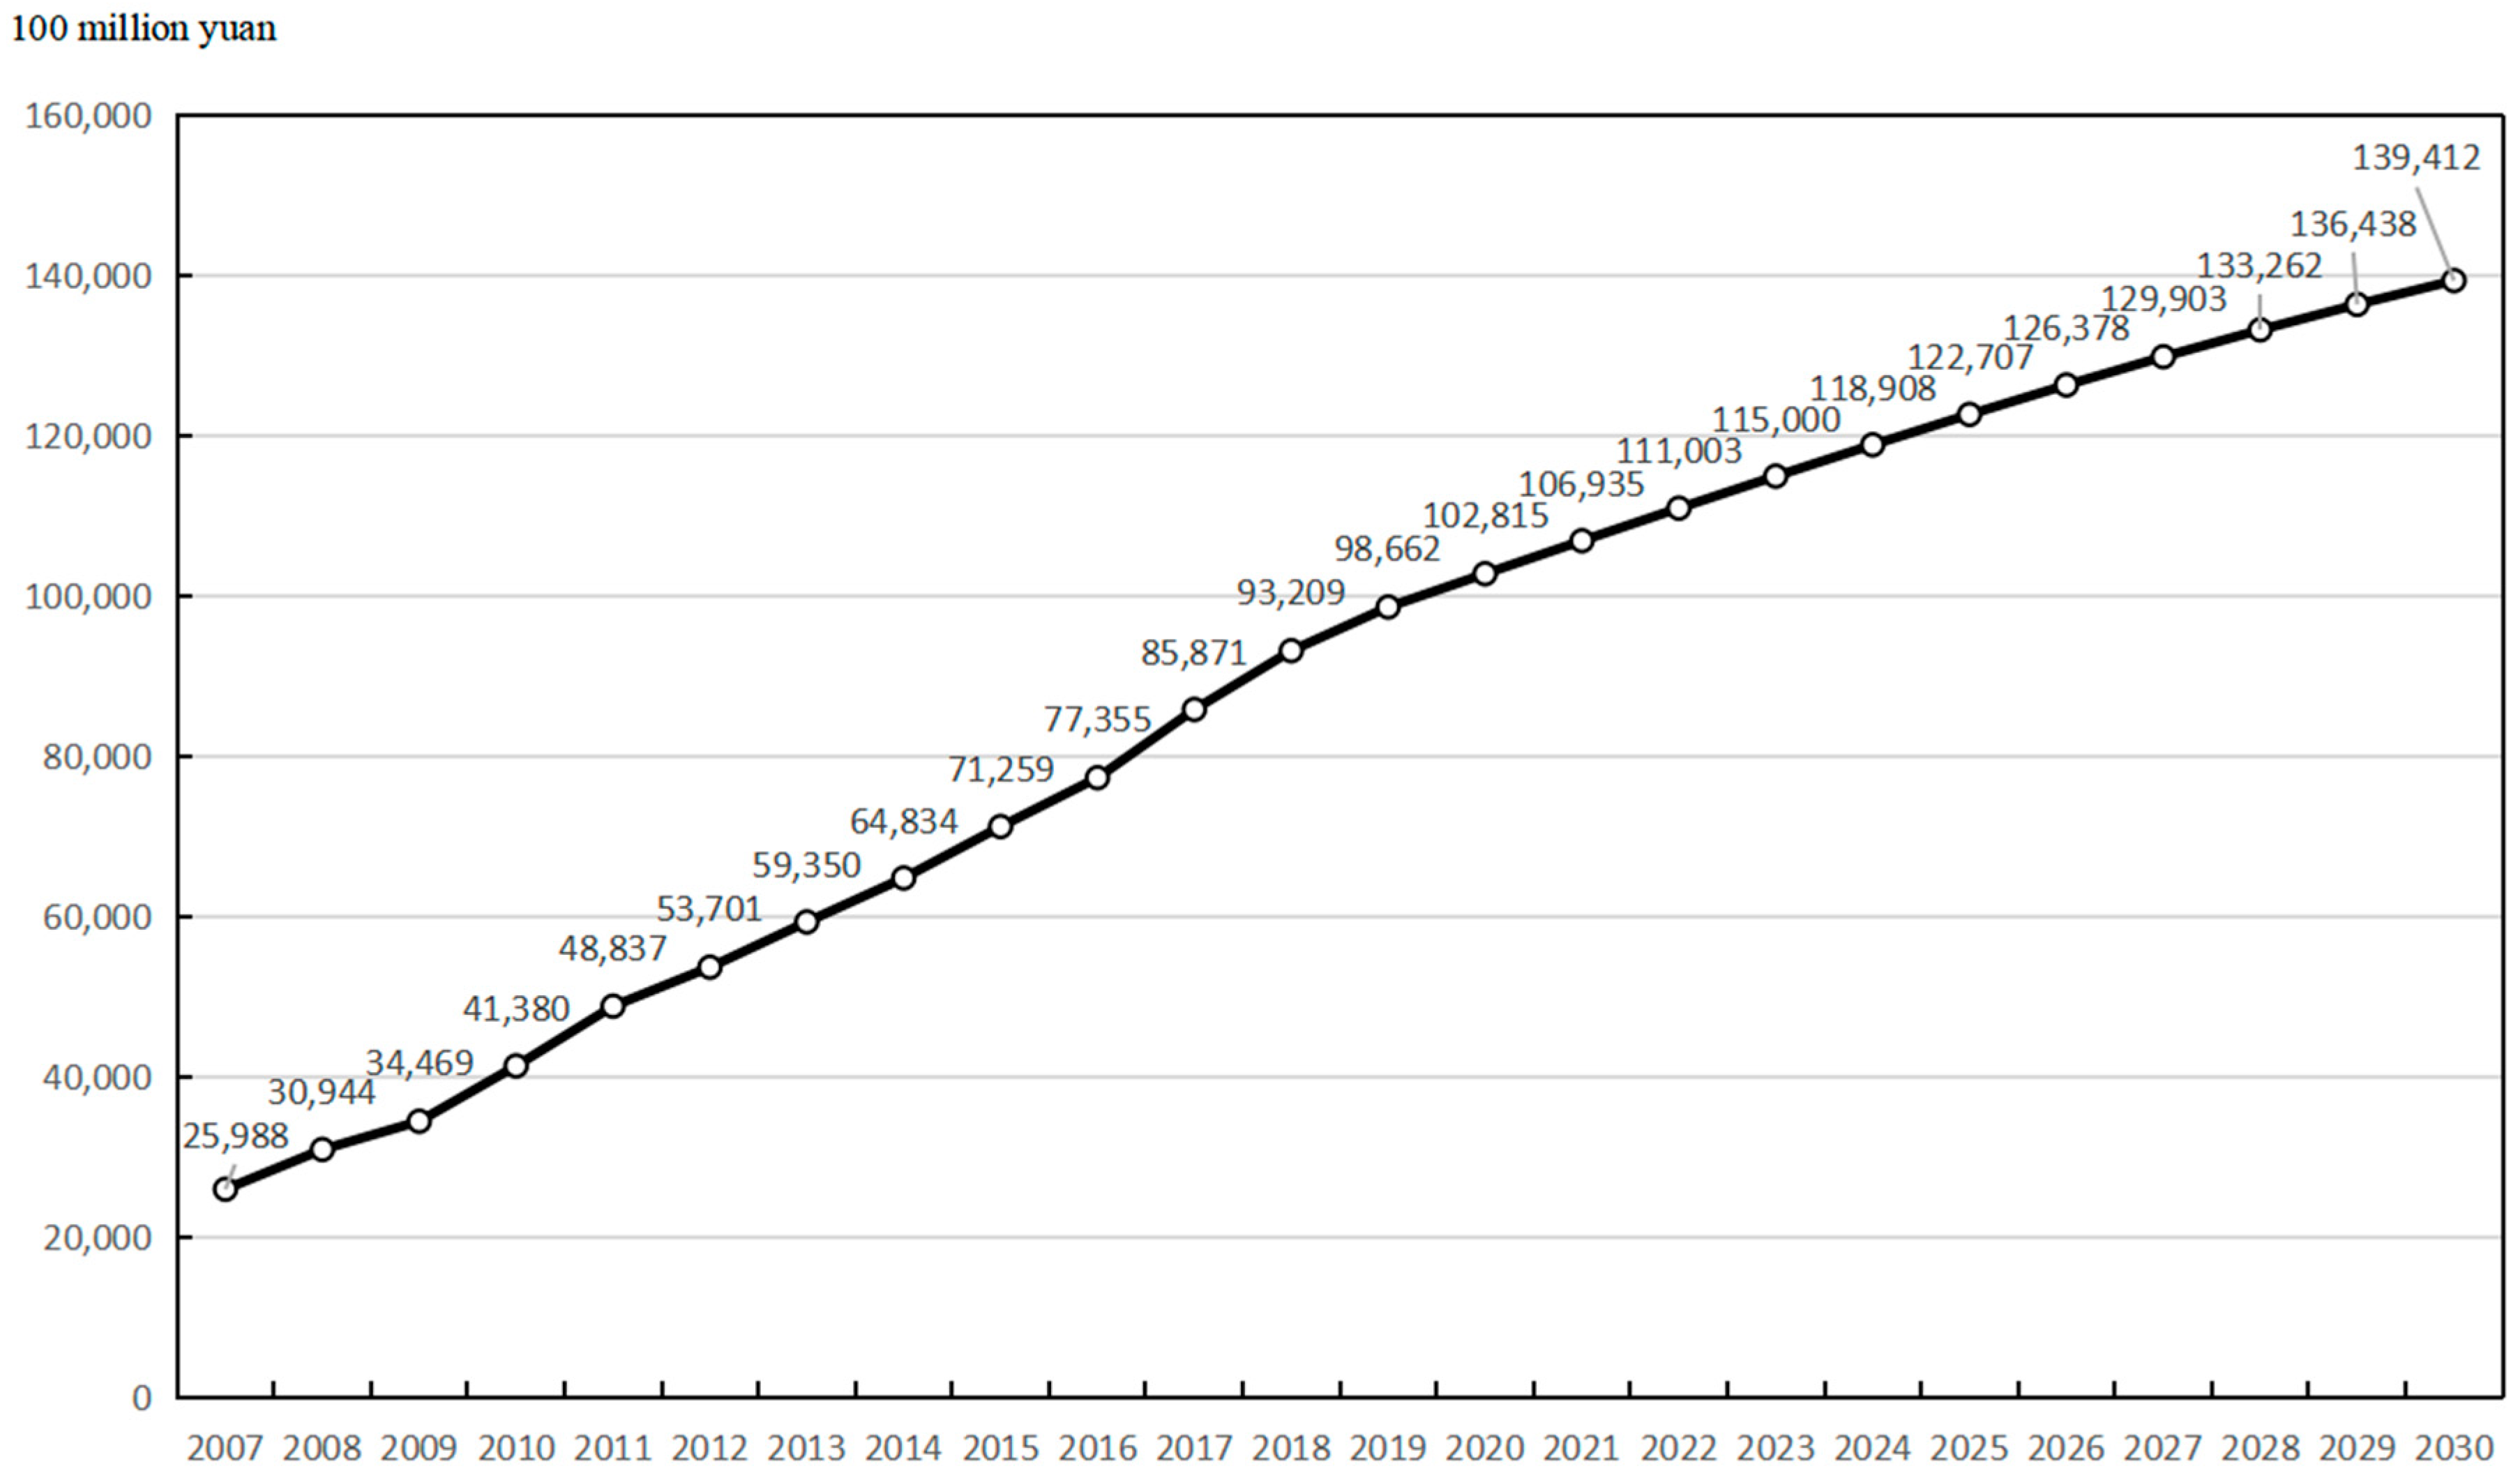
| GDP per capita (yuan) | 33,798 | 39,967 | 44,272 | 53,525 | 61,464 | 66,533 | 72,768 | 78,711 | 85,871 | 92,658 | 102,202 | 110,508 | 116,650 | 121,333 | 137,039 |
| Industrial upgrading (none) | 0.674 | 0.698 | 0.732 | 0.783 | 0.820 | 0.859 | 0.918 | 0.972 | 1.017 | 1.092 | 1.091 | 1.114 | 1.169 | 1.202 | 1.156 |
| Per capita disposable income (yuan) | 11,574 | 13,237 | 14,653 | 17,006 | 19,820 | 22,432 | 24,776 | 27,173 | 29,539 | 32,070 | 35,024 | 38,096 | 41,400 | 43,390 | 47,498 |
| Proportion of coal consumption (%) | 68 | 66.6 | 63.3 | 64 | 70.8 | 68.7 | 68.4 | 64.4 | 64.0 | 64.2 | 60.2 | 57.4 | 54.7 | 52.8 | 55.3 |
| Proportion of installed capacity of new energy generation (%) | 0.92 | 1.12 | 1.68 | 2.26 | 3.29 | 4.17 | 5.49 | 7.44 | 9.92 | 12.14 | 14.91 | 18.63 | 20.49 | 24.55 | 28.78 |
| Investment in urban environmental infrastructure development (+) 100 million yuan | 160.98 | 185.6 | 232.8 | 300 | 350.55 | 380.26 | 509.94 | 579.31 | 452.12 | 453.2 | 363.63 | 444.06 | 403.88 | 515.77 | 422.98 |
| Number of green patent applications (pieces) | 2561 | 4117 | 6433 | 9155 | 12,770 | 18,056 | 20,454 | 23,440 | 29,363 | 37,593 | 47,262 | 55,067 | 45,838 | 52,900 | 58,689 |
| Number of industrial waste gas treatment facilities (sets) | 10,431 | 11,365 | 11,508 | 11,631 | 16,065 | 17,641 | 17,964 | 19,179 | 22,037 | 25,652 | 31,500 | 32,530 | 30,622 | 27,627 | 27,438 |
| Number of R&D researchers (persons) | 259,177 | 315,461 | 369,403 | 406,231 | 455,135 | 549,159 | 626,882 | 676,526 | 699,614 | 761,046 | 754,228 | 794,123 | 897,701 | 914,510 | 1,088,300 |
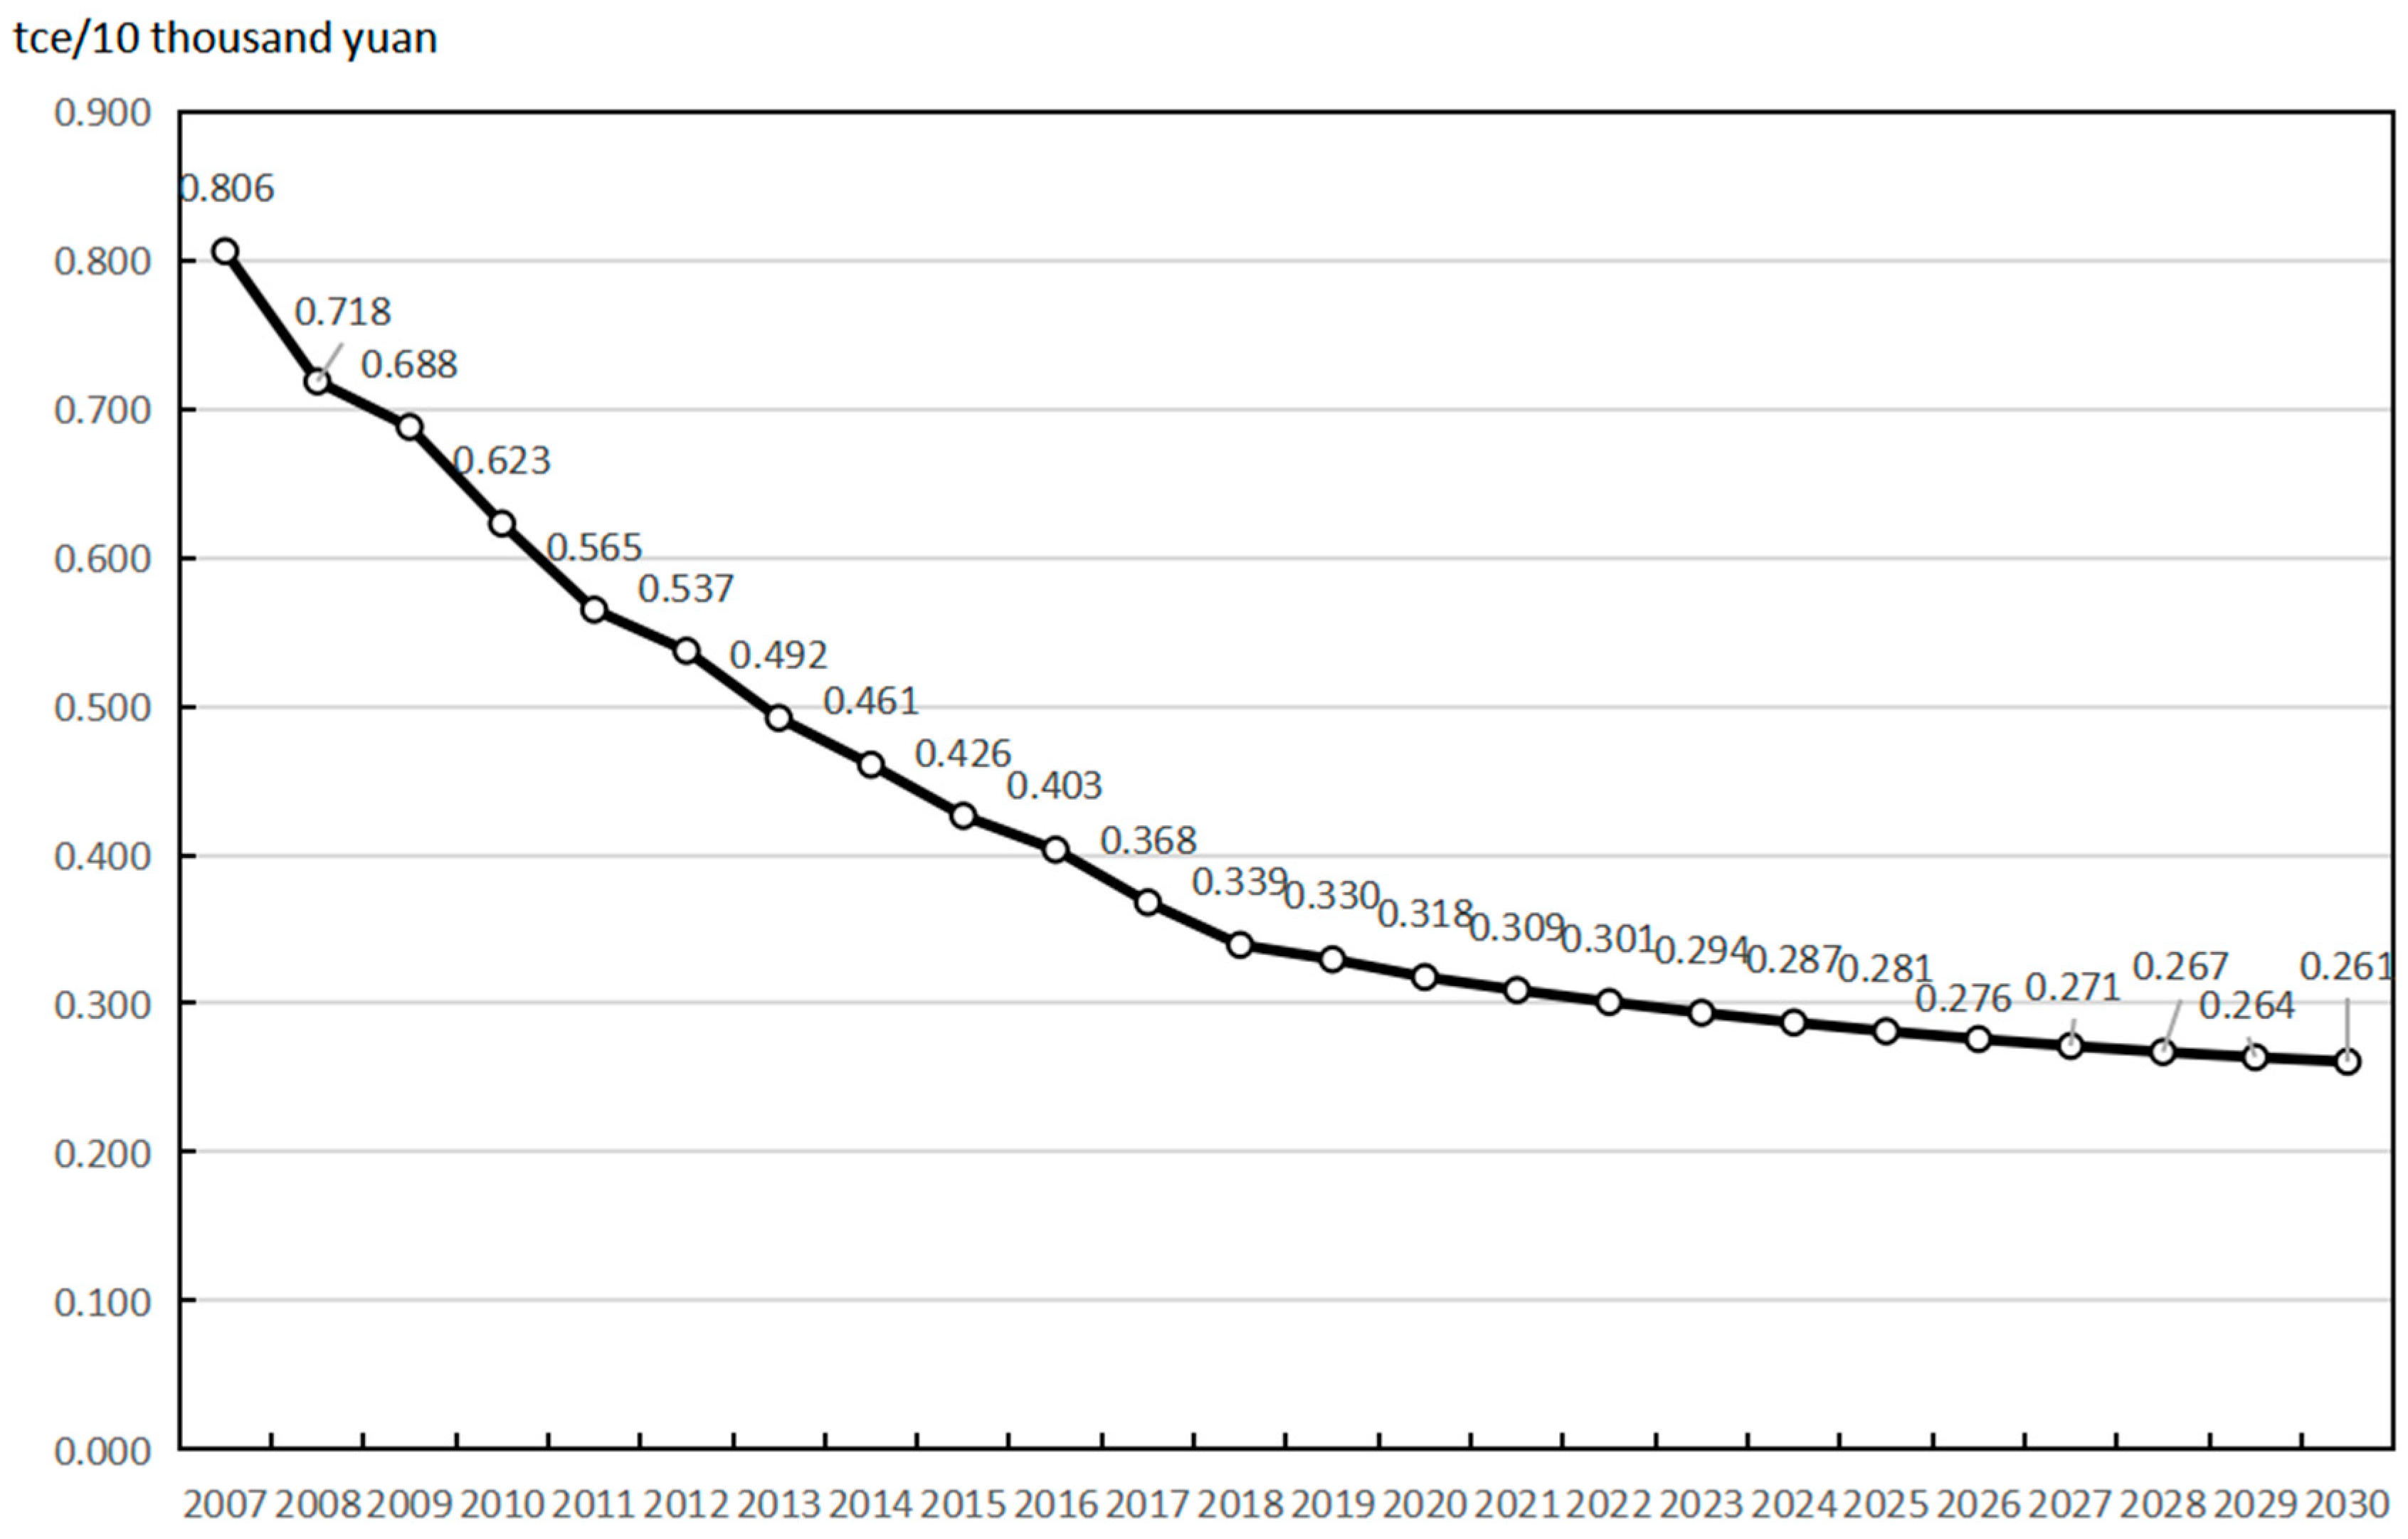
| Energy consumption per unit of GDP (tons of standard coal/10 thousand yuan) | 0.806 | 0.718 | 0.688 | 0.623 | 0.565 | 0.537 | 0.492 | 0.461 | 0.426 | 0.403 | 0.368 | 0.339 | 0.330 | 0.318 | 0.361 |
| Energy conservation and environmental protection expenditure/GDP (+) % | 0.174 | 0.317 | 0.428 | 0.338 | 0.349 | 0.361 | 0.386 | 0.367 | 0.433 | 0.369 | 0.340 | 0.341 | 0.378 | 0.328 | 0.289 |
| Per capita park green area (m2) | 12.59 | 13.13 | 13.21 | 13.29 | 13.3 | 13.6 | 14 | 14.4 | 14.6 | 14.8 | 15 | 14.7 | 15 | 15.3 | 15.6 |
| Per capita comprehensive water consumption (hundred million m3) | 722.91 | 719.27 | 703.20 | 701.74 | 693.26 | 680.07 | 608.98 | 580.48 | 553.93 | 540.72 | 553.10 | 544.86 | 582.59 | 534.02 | 544.35 |
| Percentage of days with good air quality (%) | 49.7 | 51.4 | 53.2 | 55.1 | 57.0 | 59.0 | 60.3 | 64.2 | 66.8 | 70.2 | 68 | 68 | 71.4 | 81 | 82.4 |
| Public transport vehicles per 10,000 people (sets) | 11.55 | 12.41 | 11.71 | 11.5 | 12 | 11.7 | 12.7 | 14.1 | 15.1 | 15.5 | 16 | 16.6 | 17.1 | 17.6 | 17.4 |
Appendix B
References
- Li, Y.L. Explore the path of transformation together to promote green, low-carbon and high-quality development. In Proceedings of the People’s Political Consultative Conference, Beijing, China, 5 July 2022. [Google Scholar]
- Xi, J.P. Hold high the great banner of socialism with Chinese characteristics and work together to build a modern socialist country in an all-round way. People’s Daily, 26 October 2022. [Google Scholar]
- Xie, F.Z.; Zhuang, G.T. Climate Change Green Book: Climate Change Response Report; Social Sciences Academic Press: Beijing, China, 2021. [Google Scholar]
- UK Department of Trade and Industry. Energy White Paper: Our Energy Future: Creating a Low Carbon Economy: Presented to Parliament by the Secretary of State for Trade and Industry by Command of Her Majesty; Stationery Office: Norwich, UK, 2003. [Google Scholar]
- Fujino, J. Aligning low-carbon society (LCS) and sustainable development. In IOP Conference Series: Earth and Environmental Science; IOP Publishing: Bristol, UK, 2009; Volume 6. [Google Scholar] [CrossRef]
- Strachan, N.; Foxon, T.; Fujino, J. Low-Carbon Society (LCS) modelling. Clim. Policy 2008, 8, S3–S4. [Google Scholar] [CrossRef]
- Urban, F.; Sumner, A. After 2015: Pro-poor low carbon development. Ids Focus Policy Brief. 2009, 9, 1–2. [Google Scholar]
- Mulugetta, Y.; Urban, F. Deliberating on low carbon development. Energy Policy 2010, 38, 7546–7549. [Google Scholar] [CrossRef]
- Lema, R.; Iizuka, M.; Walz, R. Introduction to low-carbon innovation and development: Insights and future challenges for research. Innov. Dev. 2015, 5, 173–187. [Google Scholar] [CrossRef]
- Chen, W.; Yin, X.; Zhang, H. Towards low carbon development in China: A comparison of national and global models. Clim. Chang. 2013, 136, 95–108. [Google Scholar] [CrossRef]
- Kibria, G.; Haroon, A.Y.; Nugegoda, D. Low-Carbon Development (LCD) Pathways in Australia, Bangladesh, China and India—A Review. J. Clim. Chang. 2018, 4, 49–61. [Google Scholar] [CrossRef]
- Kirchherr, J.; Urban, F. Technology transfer and cooperation for low carbon energy technology: Analysing 30 years of scholarship and proposing a research agenda. Energy Policy 2018, 119, 600–609. [Google Scholar] [CrossRef]
- Xing, Z.; Huang, J.; Wang, J. Unleashing the potential: Exploring the nexus between low-carbon digital economy and regional economic-social development in China. J. Clean. Prod. 2023, 413, 137552. [Google Scholar] [CrossRef]
- Hu, J.; Zhang, H.; Irfan, M. How does digital infrastructure construction affect low-carbon development? A multidimensional interpretation of evidence from China. J. Clean. Prod. 2023, 396, 136467. [Google Scholar] [CrossRef]
- Wang, Y.; Fang, X.; Yin, S.; Chen, W. Low-carbon development quality of cities in China: Evaluation and obstacle analysis. Sustain. Cities Soc. 2021, 64, 102553. [Google Scholar] [CrossRef]
- Shi, P.; Luo, M. The Construction of Evaluation Indicator System for Low-carbon Village and Practice Research in Yuanjiang County. Asian Agric. Res. 2013, 5, 36–44. [Google Scholar]
- Zhang, L.; Wu, J.; Xu, Y.; Yeh, C.-H.; Zhou, P.; Fang, J. A data-driven approach to objective evaluation of urban low carbon development performance. J. Clean. Prod. 2022, 368, 133238. [Google Scholar] [CrossRef]
- Tan, S.; Yang, J.; Yan, J.; Lee, C.; Hashim, H.; Chen, B. A holistic low carbon city indicator framework for sustainable development. Appl. Energy 2017, 185, 1919–1930. [Google Scholar] [CrossRef]
- Lou, Y.; Jayantha, W.M.; Shen, L.; Liu, Z.; Shu, T. The application of low-carbon city (LCC) indicators—A comparison between academia and practice. Sustain. Cities Soc. 2019, 51, 101677. [Google Scholar] [CrossRef]
- Zhang, W.; Zhang, M.; Wu, S.; Liu, F. A complex path model for low-carbon sustainable development of enterprise based on system dynamics. J. Clean. Prod. 2021, 321, 128934. [Google Scholar] [CrossRef]
- Wang, X.; Zhao, G.; He, C.; Wang, X.; Peng, W. Low-carbon neighborhood planning technology and indicator system. Renew. Sustain. Energy Rev. 2016, 57, 1066–1076. [Google Scholar] [CrossRef]
- Price, L.; Zhou, N.; Fridley, D.; Ohshita, S.; Lu, H.; Zheng, N.; Fino-Chen, C. Development of a low-carbon indicator system for China. Habitat Int. 2013, 37, 4–21. [Google Scholar] [CrossRef]
- Tanaka, Y.; Irie, K. Development of APEC Low-Carbon Town Indicator (LCT-I) System. J. Civ. Eng. Arch. 2017, 11, 979–992. [Google Scholar] [CrossRef]
- Zhang, S.; Li, H.; Zhang, Q.; Tian, X.; Shi, F. Uncovering the impacts of industrial transformation on low-carbon development in the Yangtze River Delta. Resour. Conserv. Recycl. 2019, 150, 104442. [Google Scholar] [CrossRef]
- Wu, H.; Peng, D.; Wang, L. Model for sustainable development based on system dynamics and energy–economy–environment coordination: A case study of Beijing, China. Energy Sci. Eng. 2021, 9, 828–842. [Google Scholar] [CrossRef]
- Chen, M. A study of low-carbon development, urban innovation and industrial structure upgrading in China. Int. J. Low-Carbon Technol. 2022, 17, 185–195. [Google Scholar] [CrossRef]
- Shi, X.; Wang, Q.; Yang, S.; Qian, Y. Low-Carbon Path of Geographically Matched Hybrid Energy Utilization: A Coal-To-Ethylene Glycol Process with Hydrogen from the Coupled Wind/Solar Power. ACS Sustain. Chem. Eng. 2021, 9, 4583–4599. [Google Scholar] [CrossRef]
- Di Lucia, L.; Ericsson, K. Low-carbon district heating in Sweden—Examining a successful energy transition. Energy Res. Soc. Sci. 2014, 4, 10–20. [Google Scholar] [CrossRef]
- Zhang, S.; Chen, W. Assessing the energy transition in China towards carbon neutrality with a probabilistic framework. Nat. Commun. 2022, 13, 87. [Google Scholar] [CrossRef]
- Bataille, C.; Åhman, M.; Neuhoff, K.; Nilsson, L.J.; Fischedick, M.; Lechtenböhmer, S.; Solano-Rodriquez, B.; Denis-Ryan, A.; Stiebert, S.; Waisman, H.; et al. A review of technology and policy deep decarbonization pathway options for making energy-intensive industry production consistent with the Paris Agreement. J. Clean. Prod. 2018, 187, 960–973. [Google Scholar] [CrossRef]
- Foxon, T.J. A coevolutionary framework for analysing a transition to a sustainable low carbon economy. Ecol. Econ. 2011, 70, 2258–2267. [Google Scholar] [CrossRef]
- Foxon, T.J. Transition pathways for a UK low carbon electricity future. Energy Policy 2013, 52, 10–24. [Google Scholar] [CrossRef]
- Wang, Y.; Guo, C.-H.; Du, C.; Chen, X.-J.; Jia, L.-Q.; Guo, X.-N.; Chen, R.-S.; Zhang, M.-S.; Chen, Z.-Y.; Wang, H.-D. Carbon peak and carbon neutrality in China: Goals, implementation path, and prospects. China Geol. 2021, 4, 720–746. [Google Scholar] [CrossRef]
- Cai, L.; Luo, J.; Wang, M.; Guo, J.; Duan, J.; Li, J.; Li, S.; Liu, L.; Ren, D. Pathways for municipalities to achieve carbon emission peak and carbon neutrality: A study based on the LEAP model. Energy 2022, 262, 125435. [Google Scholar] [CrossRef]
- Nader, S. Paths to a low-carbon economy—The Masdar example. Energy Procedia 2009, 1, 3951–3958. [Google Scholar] [CrossRef]
- Geels, F.W. Regime Resistance against Low-Carbon Transitions: Introducing Politics and Power into the Multi-Level Perspective. Theory Cult. Soc. 2014, 31, 21–40. [Google Scholar] [CrossRef]
- Geels, F.W.; Berkhout, F.; van Vuuren, D.P. Bridging analytical approaches for low-carbon transitions. Nat. Clim. Chang. 2016, 6, 576–583. [Google Scholar] [CrossRef]
- Rweyendela, A.G.; Pauline, N.M.; Lema, G.A. Strategic environmental assessment for low-carbon development: Developing an analysis framework. J. Environ. Plan. Manag. 2023, 66, 2223–2246. [Google Scholar] [CrossRef]
- Karagiannopoulos, G.; Georgopoulos, N.; Nikolopoulos, K. Fathoming Porter’s five forces model in the internet era. info 2005, 7, 66–76. [Google Scholar] [CrossRef]
- Feng, Z.J.; Zhou, R. Low carbon economy: The fundamental way to achieve green development in China. China Popul. Resour. Environ. 2010, 20, 1–7. [Google Scholar] [CrossRef]
- Li, P. Research on green transformation of China’s industry. China Ind. Econ. 2011, 4, 5–14. [Google Scholar]
- Ma, L.M.; Shi, D.; Pei, Q.B. Low-carbon energy transformation in China (2015–2050): Development and feasible path of re-newable energy. China Popul. Resour. Environ. 2018, 28, 8–18. [Google Scholar] [CrossRef]
- Owen, R.; Brennan, G.; Lyon, F. Enabling investment for the transition to a low carbon economy: Government policy to finance early stage green innovation. Curr. Opin. Environ. Sustain. 2018, 31, 137–145. [Google Scholar] [CrossRef]
- Fragkiadakis, K.; Fragkos, P.; Paroussos, L. Low-Carbon R&D Can Boost EU Growth and Competitiveness. Energies 2020, 13, 5236. [Google Scholar] [CrossRef]
- Xu, M.; Hu, W.-Q. A research on coordination between economy, society and environment in China: A case study of Jiangsu. J. Clean. Prod. 2020, 258, 120641. [Google Scholar] [CrossRef]
- Wu, W.; Zhang, T.; Xie, X.; Huang, Z. Regional low carbon development pathways for the Yangtze River Delta region in China. Energy Policy 2021, 151, 112172. [Google Scholar] [CrossRef]
- Lee, C.T.; Lim, J.S.; Van Fan, Y.; Liu, X.; Fujiwara, T.; Klemeš, J.J. Enabling low-carbon emissions for sustainable development in Asia and beyond. J. Clean. Prod. 2018, 176, 726–735. [Google Scholar] [CrossRef]
- GB/T 2589-2020; General Rules for Calculation of Comprehensive Energy Consumption. Energy Fundamentals and Management of China (SAC/TC 20): Beijing, China, 2020.
- Haseli, G.; Sheikh, R.; Sana, S.S. Base-criterion on multi-criteria decision-making method and its applications. Int. J. Manag. Sci. Eng. Manag. 2020, 15, 79–88. [Google Scholar] [CrossRef]
- Haseli, G.; Sheikh, R. Base Criterion Method (BCM). Mult. Criteria Decis. Mak. 2022, 407, 17–38. [Google Scholar] [CrossRef]
- Hubert, M.; Reynkens, T.; Schmitt, E.; Verdonck, T. Sparse PCA for High-Dimensional Data with Outliers. Technometrics 2016, 58, 424–434. [Google Scholar] [CrossRef]


| Authors | Economy | Society | Energy | Environment |
|---|---|---|---|---|
| Wang et al. [15] | Low-carbon economy | Low-carbon society; urban planning | Energy use | Low-carbon environment |
| Shi et al. [16] | Industrial structure | Lifestyle | Energy structure | Social environment |
| Zhang et al. [17] | Economy | Transport; urbanism | Energy | Atmospheric environment; water and land resources; pollution control; ecological protection |
| Tan et al. [18] | Economic aspects | Social life; urban mobility | Energy model | Carbon and the environment; solid waste; water |
| Lou et al. [19] | Economy-related | Social life; urban mobility | Energy use | Carbon and the environment; solid waste; water; land use |
| Zhang et al. [20] | Economy | Technology; human resources; markets; policy | Energy | Environment |
| Objectives | Primary (First Level) Indicators | Secondary (Second Level) Indicators | Unit | Indicators Number |
|---|---|---|---|---|
| Low-carbon development level | Gross domestic product (GDP) per capita (+) | yuan | X1 | |
| Growth force | Industrial upgrading (+) | none | X2 | |
| Per capita disposable income (+) | yuan | X3 | ||
| Proportion of coal consumption (−) | % | X4 | ||
| Transformation force | Proportion of installed capacity of new energy generation (+) | % | X5 | |
| Investment in urban environmental infrastructure development (+) | 100 million yuan | X6 | ||
| Number of green patent applications (+) | pieces | X7 | ||
| Competitiveness force | Number of industrial waste gas treatment facilities (+) | sets | X8 | |
| Number of R&D researchers (+) | persons | X9 | ||
| Energy consumption per unit of GDP (−) | tons of standard coal/10 thousand yuan | X10 | ||
| Coordination force | Energy conservation and environmental protection expenditure/GDP (+) | % | X11 | |
| Per capita park green area (+) | m2 | X12 | ||
| Per capita comprehensive water consumption (−) | hundred million m3 | X13 | ||
| Sustainability force | Percentage of days with good air quality (+) | % | X14 | |
| Public transport vehicles per 10,000 people (+) | sets | X15 |
| Year | Growth Force | Transformation Force | Competitiveness Force | Coordination Force | Sustainability Force | Low-Carbon Development Level |
|---|---|---|---|---|---|---|
| 2007 | 0.28 | 0.39 | 0.31 | 0.17 | 0.28 | 1.44 |
| 2008 | 0.31 | 0.43 | 0.34 | 0.46 | 0.32 | 1.85 |
| 2009 | 0.34 | 0.51 | 0.36 | 0.64 | 0.32 | 2.17 |
| 2010 | 0.38 | 0.55 | 0.38 | 0.54 | 0.33 | 2.19 |
| 2011 | 0.43 | 0.50 | 0.44 | 0.59 | 0.36 | 2.32 |
| 2012 | 0.46 | 0.56 | 0.49 | 0.64 | 0.37 | 2.53 |
| 2013 | 0.51 | 0.66 | 0.52 | 0.73 | 0.46 | 2.88 |
| 2014 | 0.55 | 0.78 | 0.56 | 0.74 | 0.53 | 3.16 |
| 2015 | 0.59 | 0.72 | 0.61 | 0.87 | 0.59 | 3.37 |
| 2016 | 0.64 | 0.73 | 0.68 | 0.80 | 0.63 | 3.48 |
| 2017 | 0.68 | 0.75 | 0.75 | 0.79 | 0.62 | 3.58 |
| 2018 | 0.72 | 0.87 | 0.80 | 0.78 | 0.64 | 3.80 |
| 2019 | 0.77 | 0.89 | 0.78 | 0.86 | 0.64 | 3.94 |
| 2020 | 0.80 | 1.03 | 0.78 | 0.81 | 0.74 | 4.16 |
| 2021 | 0.83 | 0.96 | 0.85 | 0.76 | 0.74 | 4.14 |
| Year | Number of R&D Researchers (Persons) | Year | Industrial Upgrading | ||||
| Actual Value | Simulation Values | Relative Error (%) | Actual Value | Simulation Values | Relative Error (%) | ||
| 2007 | 259,177 | 274,085 | 5.75 | 2007 | 0.674 | 0.648 | −3.85 |
| 2008 | 315,461 | 320,819 | 1.70 | 2008 | 0.698 | 0.701 | 0.33 |
| 2009 | 369,403 | 353,602 | −4.28 | 2009 | 0.732 | 0.734 | 0.28 |
| 2010 | 406,231 | 416,965 | 2.64 | 2010 | 0.783 | 0.795 | 1.49 |
| 2011 | 455,135 | 484,176 | 6.38 | 2011 | 0.820 | 0.850 | 3.62 |
| 2012 | 549,159 | 527,469 | −3.95 | 2012 | 0.859 | 0.883 | 2.84 |
| 2013 | 626,882 | 577,272 | −7.91 | 2013 | 0.918 | 0.920 | 0.29 |
| 2014 | 676,526 | 625,174 | −7.59 | 2014 | 0.972 | 0.954 | −1.87 |
| 2015 | 699,614 | 680,795 | −2.69 | 2015 | 1.017 | 0.994 | −2.25 |
| 2016 | 761,046 | 733,110 | −3.67 | 2016 | 1.092 | 1.028 | −5.86 |
| 2017 | 754,228 | 805,538 | 6.80 | 2017 | 1.091 | 1.076 | −1.42 |
| 2018 | 794,123 | 867,373 | 9.22 | 2018 | 1.114 | 1.116 | 0.14 |
| 2019 | 897,701 | 913,013 | 1.71 | 2019 | 1.169 | 1.144 | −2.16 |
| 2020 | 914,510 | 947,614 | 3.62 | 2020 | 1.202 | 1.165 | −3.09 |
| 2021 | 1,088,300 | 1,060,000 | −2.63 | 2021 | 1.156 | 1.231 | 6.48 |
| Year | Per Capita Disposable Income (yuan) | Year | Percentage of Days with Good Air Quality (%) | ||||
| Actual Value | Simulation Values | Relative Error (%) | Actual Value | Simulation Values | Relative Error (%) | ||
| 2007 | 11,574 | 11,147.9 | −3.68 | 2007 | 49.7 | 49.7 | 0.04 |
| 2008 | 13,237 | 13,270.5 | 0.25 | 2008 | 51.4 | 53.1 | 3.26 |
| 2009 | 14,653 | 14,733.5 | 0.55 | 2009 | 53.2 | 53.8 | 1.19 |
| 2010 | 17,006 | 17,642 | 3.74 | 2010 | 55.1 | 54.6 | −0.91 |
| 2011 | 19,820 | 20,506 | 3.46 | 2011 | 57.0 | 55.2 | −3.23 |
| 2012 | 22,432 | 22,331.9 | −0.45 | 2012 | 59.0 | 57.4 | −2.72 |
| 2013 | 24,776 | 24,525.4 | −1.01 | 2013 | 60.3 | 60.5 | 0.25 |
| 2014 | 27,173 | 26,562.9 | −2.25 | 2014 | 64.2 | 63.8 | −0.60 |
| 2015 | 29,539 | 29,150.2 | −1.32 | 2015 | 66.8 | 66.2 | −0.86 |
| 2016 | 32,070 | 31,459 | −1.91 | 2016 | 70.2 | 68.5 | −2.41 |
| 2017 | 35,024 | 34,846.1 | −0.51 | 2017 | 68.0 | 71.1 | 4.51 |
| 2018 | 38,096 | 37,806.7 | −0.76 | 2018 | 68.0 | 71.1 | 4.50 |
| 2019 | 41,400 | 39,971.3 | −3.45 | 2019 | 71.4 | 73.8 | 3.33 |
| 2020 | 43,390 | 41,661.3 | −3.98 | 2020 | 81.0 | 77.6 | −4.25 |
| 2021 | 47,498 | 47,163.1 | −0.71 | 2021 | 82.4 | 81.4 | −1.18 |
Disclaimer/Publisher’s Note: The statements, opinions and data contained in all publications are solely those of the individual author(s) and contributor(s) and not of MDPI and/or the editor(s). MDPI and/or the editor(s) disclaim responsibility for any injury to people or property resulting from any ideas, methods, instructions or products referred to in the content. |
© 2024 by the authors. Licensee MDPI, Basel, Switzerland. This article is an open access article distributed under the terms and conditions of the Creative Commons Attribution (CC BY) license (https://creativecommons.org/licenses/by/4.0/).
Share and Cite
Li, F.; Zhang, Y. Simulation of Development Strategies and Evaluation of Low-Carbon Development Level in Jiangsu Province under Carbon Peaking and Carbon Neutrality Goals. Sustainability 2024, 16, 1597. https://doi.org/10.3390/su16041597
Li F, Zhang Y. Simulation of Development Strategies and Evaluation of Low-Carbon Development Level in Jiangsu Province under Carbon Peaking and Carbon Neutrality Goals. Sustainability. 2024; 16(4):1597. https://doi.org/10.3390/su16041597
Chicago/Turabian StyleLi, Fanglin, and Yingjie Zhang. 2024. "Simulation of Development Strategies and Evaluation of Low-Carbon Development Level in Jiangsu Province under Carbon Peaking and Carbon Neutrality Goals" Sustainability 16, no. 4: 1597. https://doi.org/10.3390/su16041597