Article

Corn Grain Fatty Acid Contents in Response to Organic Fertilisers from Meat Industry Waste

by
Arkadiusz Stępień
1,*,
Katarzyna Wojtkowiak
2,
Ewelina Kolankowska
2 and
Renata Pietrzak-Fiećko
3
1
Department of Agroecosystems and Horticulture, Faculty of Agriculture and Forestry, University of Warmia and Mazury in Olsztyn, 10-718 Olsztyn, Poland
2
Department of Heavy Duty Machines and Research Methodology, Faculty of Technical Sciences, University of Warmia and Mazury in Olsztyn, 10-719 Olsztyn, Poland
3
Department of Commodities and Food Analysis, Faculty of Food Sciences, University of Warmia and Mazury in Olsztyn, Pl. Cieszyński 1, 10-719 Olsztyn, Poland
*
Author to whom correspondence should be addressed.
Sustainability 2024, 16(3), 952; https://doi.org/10.3390/su16030952
Submission received: 20 December 2023 / Revised: 17 January 2024 / Accepted: 19 January 2024 / Published: 23 January 2024
(This article belongs to the Special Issue Soil Fertility Maintenance and Restoration in Sustainable Agriculture)

Abstract

:
Organic waste can provide an alternative to synthetic fertilisers for maintaining productivity with limited environmental impact. Our research evaluates the potential use of processed animal waste in corn fertilisation, which may represent a partially closed nutrient cycle of importance in a sustainable agricultural system. The objective of this study was to evaluate the quantity and quality of fat obtained from corn grain fertilised with meat and bone meal (MBM) produced from animal waste. A static field experiment using MBM was conducted at the Experimental Station in Tomaszkowo (53°71′ N, 20°43′ E), Poland. The field experiment was conducted in 2014–2017 with continuous corn cultivation. The course of weather conditions in the years of this study influenced the fat content, with the lowest amount found in 2016. The application of fertilisers in the form of MBM and mineral fertilisation resulted in a slightly lower fat content compared to the variant without fertilisation. The application of mineral fertilisers and MBM influenced an increase in the content of the predominant C18:2 acid compared to the variant without fertilisation, while the opposite was shown for C18:1 cis-9 acid. The fertiliser variants are most correlated with fat yield and total polyunsaturated fatty acids. The fertiliser variants in their effects on fat yield, fat content, fatty acid profiles, and their ratios can be divided into three groups, which were related to the effects of organic fertilisers during the years of this study. The use of meat and bone meal as fertilisers cannot be regarded as a factor in increasing the fat content of corn grain. Meat and bone meal applied over several years to the same field in the quantities required to achieve optimum yield can be an element that shapes fatty acid profiles.

1. Introduction

Corn (Zea mays L.) is a widely cultivated species worldwide [1], and with the current direction of climate change and the stagnant acreage of other crops, corn may soon become the most widely grown crop. Corn is a crop with many uses. Corn grain is mainly used as feed (more than 50% of the harvest) and for food, industrial [2], and energy purposes [3]. According to Erenstein et al. [2], worldwide, corn grain accounts for 5% of total protein intake and fat (1.6% of daily intake) in the human diet. Unlike most edible vegetable oils, which are derived from fat-rich seeds, corn grain contains only 3–4% fat [4,5]. However, the fat contained in corn grain plays an important role in animal and human nutrition. Due to the fact that corn is the dominant feed ingredient in most animal rations, fat is a concentrated, easily digestible source of energy for animals and provides essential fatty acids [6,7]. The fatty acid composition of corn grain fat determines its nutritional properties and specific industrial uses [4,5,8]. On average, corn fat contains 85–87% unsaturated and 13–15% saturated fatty acids [9]. The good quality of the fat contained in corn grain depends on the high content of unsaturated fatty acids, including oleic and linoleic acids [8,10]. The most commonly used indicators for assessing the quality of fatty acids in fats from oilseeds and cereals are MUFA/SFA, PUFA/SFA, and UFA/SFA ratios [11]. The fat content and fatty acid composition of oilseeds and cereals depend on the type of cultivar and environmental and agronomic conditions [4,12,13,14,15]. The optimal sowing date and fertilisation of corn are considered to be agrotechnical factors that enable the production of high-quality oils from grain [16].
Biologically active compounds released by organic fertilisers have a positive effect on yield and quality indicators, such as fatty acids, vitamins, amino acids, and polypeptides [17]. Organic fertilisers can have an effect on oil content and composition through changes in the availability of nutrients to plants [18]. Agricultural fertiliser management changes the biochemical pathway of secondary metabolites in plants, which can affect the fatty acid profile [19].
The proportions of fatty acids in the generative organs of plants are strongly influenced by air temperature and nutrient management during oil synthesis [15,16,20]. Therefore, in order to produce good-quality seeds with high fat content, it is necessary to select the right variety and manage environmental parameters [5,21]. The fastest way to balance nutrients is to use mineral fertilisers, but these fertilisers can cause environmental pollution, increase the ecological costs of agricultural production, and deplete non-renewable resources [22,23]. The advantages of organic fertilisers produced on the farm are well known, but it is proposed to complete the nutrient cycle with nutrients from food industry waste [24,25]. To ensure a sustainable agricultural system, mineral components taken from crops should return to close the nutrient cycle in the agroecosystem. Safe agricultural waste can be an alternative to synthetic fertilisers for maintaining productivity with limited environmental impact [26,27]. Among agricultural wastes, meat and bone meal, a byproduct of the animal rendering industry, contains significant amounts of essential nutrients for plants, especially N, P, and Ca [28,29]. Several publications have presented the use of waste from the meat industry as a source of nutrients in crop fertilisation [30,31,32,33]. Our research evaluates the potential use of MBM in crop production, not only as a source of nutrients to improve soil nutrient abundance [34] but also to improve grain quality, elements often overlooked when evaluating applied organic fertilisers. The objective of this study was to evaluate the quality of fat obtained from corn grain fertilised with meat and bone meal produced from animal waste.

2. Materials and Methods

2.1. Field Experiment

A static field experiment using meat and bone meal (MBM) was conducted at the Experimental Station in Tomaszkowo (53°71′ N, 20°43′ E), Poland. The field experiment was conducted from 2014 to 2017 with continuous corn cultivation in a randomised block design in 4 replicates. The experiment was located on two soil types classified as Haplic Luvisol Arenic (HLA) and Haplic Luvisol Loamic (HLL) [35]. The results in the present study are from corn grown on Haplic Luvisol Arenic (HLA) soil. The experimental plots for sowing were 15.0 m−2 and for harvesting, 11.25 m−2. Tillage, protection, and harvesting agrotechnical treatments followed the recommendations for corn cultivation. Prior to the establishment of the 2013 experiment, the precrop was winter triticale. Spring tillage included cultivation and harrowing to mix fertiliser into the soil. After the corn harvest, discing, harrowing, and pre-winter ploughing were carried out. The variety chosen for sowing was MAS 15P (FAO 200, breeder—Maisadour Semences, Haut-Mauco, France), matched by its earliness class, allowing the cultivation of grain-type corn under the climatic conditions of the experimental field. Corn grain was sown at a density of 8 plants × m−2, in 4 rows every 0.75 m. Weed control was carried out using the herbicide Lumax 537.5 SE 4.0 L ha−1 (active substances: mesotrione 37.5 g L, s-metolachlor 312.5 g L, terbuthylazine 187.5 g L). For disease protection during the early development period, Mesurol seed dressing was applied at a rate of 1 L per 100 kg−1 of grain (active substance: methiocarb 500 g L). No pest control was carried out. Prior to the establishment of the experiment, the soil pH measured in 1 M KCl was 4.89. The organic matter content of the soil was 10.1 g kg−1; Ntotal—0.55 L g kg−1; P—0.33 g kg−1; K—1.33 g kg−1. Meteorological conditions were observed during the conduct of the experiment, and a detailed description is presented in the previous work by Stępień and Rejmer [3].

2.2. Fertiliser Treatments

The meat and bone meal used in this experiment was obtained from an animal by-product processing plant (SARIA Poland Ltd., Długi Borek, Poland). In the experiment, MBM was applied annually pre-sowing at rates of 1.0, 2.0, and 3.0 t ha−1. Fertiliser treatments and the content of nutrients brought in with the fertilisers are shown in Table 1. Meat and bone meal contained 90% dry matter, 66.9 g kg−1 C; 6.10 g kg−1 N; 3.10 g kg−1 P; 0.40 g kg−1 K; 8.85 g kg−1 Ca, 0.30 Mg g kg−1; 8.0 mg g−1 Cu, 1189 mg g−1 Fe, 86.5 mg g−1 Zn; and 29.0 mg g−1 Mn. In the experiment, the control variants were the no fertiliser and mineral fertiliser (NPK) variants. On the mineral fertilised variant, a pre-sowing nitrogen fertilisation of 133 kg N ha−1 (urea, 46% N) and a pre-sowing supplementary fertilisation with the phosphorus of 79.6 kg N ha−1 (superphosphate, 20.1% P) and potassium of 83.1 kg ha−1 (potassium salt, 49.8% K) were applied. On the MBM site, potassium fertilisation with potassium salt was applied to equalise the potassium dose applied on the sites fertilised with mineral fertilisers.

2.3. Process for the Determination of Fat and Fatty Acids

When the plot combined harvesting corn cobs by hand, the two outer rows of sown plants were discarded. The harvested cobs were threshed with a harvester (Wintersteiger Classic 1540, Ried im Innkreis, Austria). The harvested grain was used for further analysis. Fat extraction was performed using the “cold” method described by Cequier-Sánchez et al. [36]. The samples were ground into powder and extracted with a mixture of dichloromethane and methanol (2:1, v/v). Then, it was filtered and transferred to a new test tube, and an aqueous solution of KCl (0.88%) was added. The samples were then centrifuged at 1500 rpm, and the lower layer after separation was evaporated on a rotary evaporator. Sample preparation for fatty acid composition determination was carried out in accordance with the EN ISO 12966-1:2014/AC:2015 standard [37]. For this purpose, 0.1 g of lipids were transferred to a glass test tube, heated on a heating block, and the following reagents were added to the boiling mixture: 2 M NaOH, BF3 complex, isooctane, and 1% NaCl solution. At the end of the procedure, the upper isooctane layer was transferred to a vial and analysed. Fatty acid esters were subjected to chromatographic analysis using an Agilent Technologies 7890 A gas chromatograph (Agilent Technologies Inc., Santa Clara, CA, USA). The chromatograph was equipped with a flame ionisation detector (FID), a capillary column 30 m long, and an internal diameter of 0.32 mm (Supelcowax 10). The following temperatures were used during the analysis: column = 195 °C; dispenser = 230 °C; and detector = 250 °C. A mixture of 37 standards (Supelco™ 37 Component FAME Mix, Supelco, Bellefonte, PA, USA) was used to identify fatty acids. In the experiment, 15 h fatty acids were identified: lauric acid (C12:0), myristic acid (C14:0), pentadecanoic acid (C15:0), palmitic acid (C16:0), palmitoleic acid (C16:1), margaric acid (C17:0), heptadecenoic acid (C17:1), stearic acid (C18:0), oleic acid (C18:1 cis-9), vaccenic acid (C18:1cis-11), linoleic acid (C18:2), linolenic acid (C18:3), 8Z, 11Z-eicosadienoic acid (C20:2), gadoleic acid (C20:1), and behenic acid (C22:0).

2.4. Statistical Analysis

The results obtained from the experiment were statistically analysed using the Statistica v.13.3 program. Basic statistics and a two-factor analysis of variance were used. Homogeneous groups were determined using the Tukey test. The analyses of the effects of fertiliser variants and years of research on fat yields, fat content, fatty acid profiles, and their ratios in corn grain were complemented by the determination of correlations between the factors. For this purpose, the factor analysis method (PCA) was used, which allows the relationships (strength and direction of correlation) between variables to be determined. Calculations were performed at a significance level of α = 0.05.

3. Results

In years of study, fertiliser variants and their interactions significantly affected fat content, total saturated (SFA), monounsaturated (MUFA), polyunsaturated (PUFA) fatty acids, acid ratios (UFA/SFA, MUFA/SFA, PUFA/SFA), and most fatty acid profiles (Table 2). There was no significant effect of study years on the amount of acids: C14:0, C15:0, C17:0, C16:1, C17:1, treatments on the amount of acids: C14:0, C15:0, C17:0, C17:1, interaction: study years × treatments on the amount of acids: C14:0, C17:0, C17:1.
The statistically significantly lowest fat content in corn grain was obtained in 2016 (Figure 1). The highest fat content on the variant without fertilisation was obtained in 2017, on the variant fertilised with mineral fertilisers in 2014, 2015, and 2017, and fertilised with MBM in 2014. On average, in the 4 years of this study, the application of MBM and mineral fertilisation resulted in a slightly lower fat content compared to the variant without fertilisation. Considering the interaction of study years and fertilisation, the application of higher doses of MBM (2.0 and 3.0 t ha−1) from the second study year onwards resulted in lower fat content (differences were not always significant) (Table 3).
In corn grain, saturated fatty acid (SFA) profiles were dominated by C16:0 (Figure 2, Table 4) and C18:0 (Figure 3, Table 5), with C12:0, C14:0, C15:0, C17:0, and C22:0 determined in lower amounts (Supplementary Table S1).
The highest C16:0 acid contents (above 14%) were determined in 2015 and 2016 (Figure 2). Regardless of the years, the highest amount of C16:0 acid was found on the variant fertilised with MBM at 2.0 t ha−1 and the least after the application of 3.0 t ha−1. In most variants of the experiment, an increase in C16:0 acid content was found in the study years compared to the first study year (Table 4). Such a relationship was not observed after the application of 2.0 t ha−1 MBM in 2015.
On average, for the MBM-fertilised sites and the control sites (without ferilisation and mineral fertilisation), the highest C18:0 acid content was found in 2015 (Figure 3). On average for the years, the highest C18:0 acid densities were obtained on the without fertilisation and 1.0 t ha−1 MBM fertilised treatments, and significantly lower on the other fertilisation sites. When analysing the effect of MBM rates, the application of 2.0 and 3.0 t ha−1 resulted in a slight reduction (not always statistically significant) in C18:0 acid content compared to the variant fertilised with 1.0 t ha−1 and the control variants in all years of this study (Table 5).
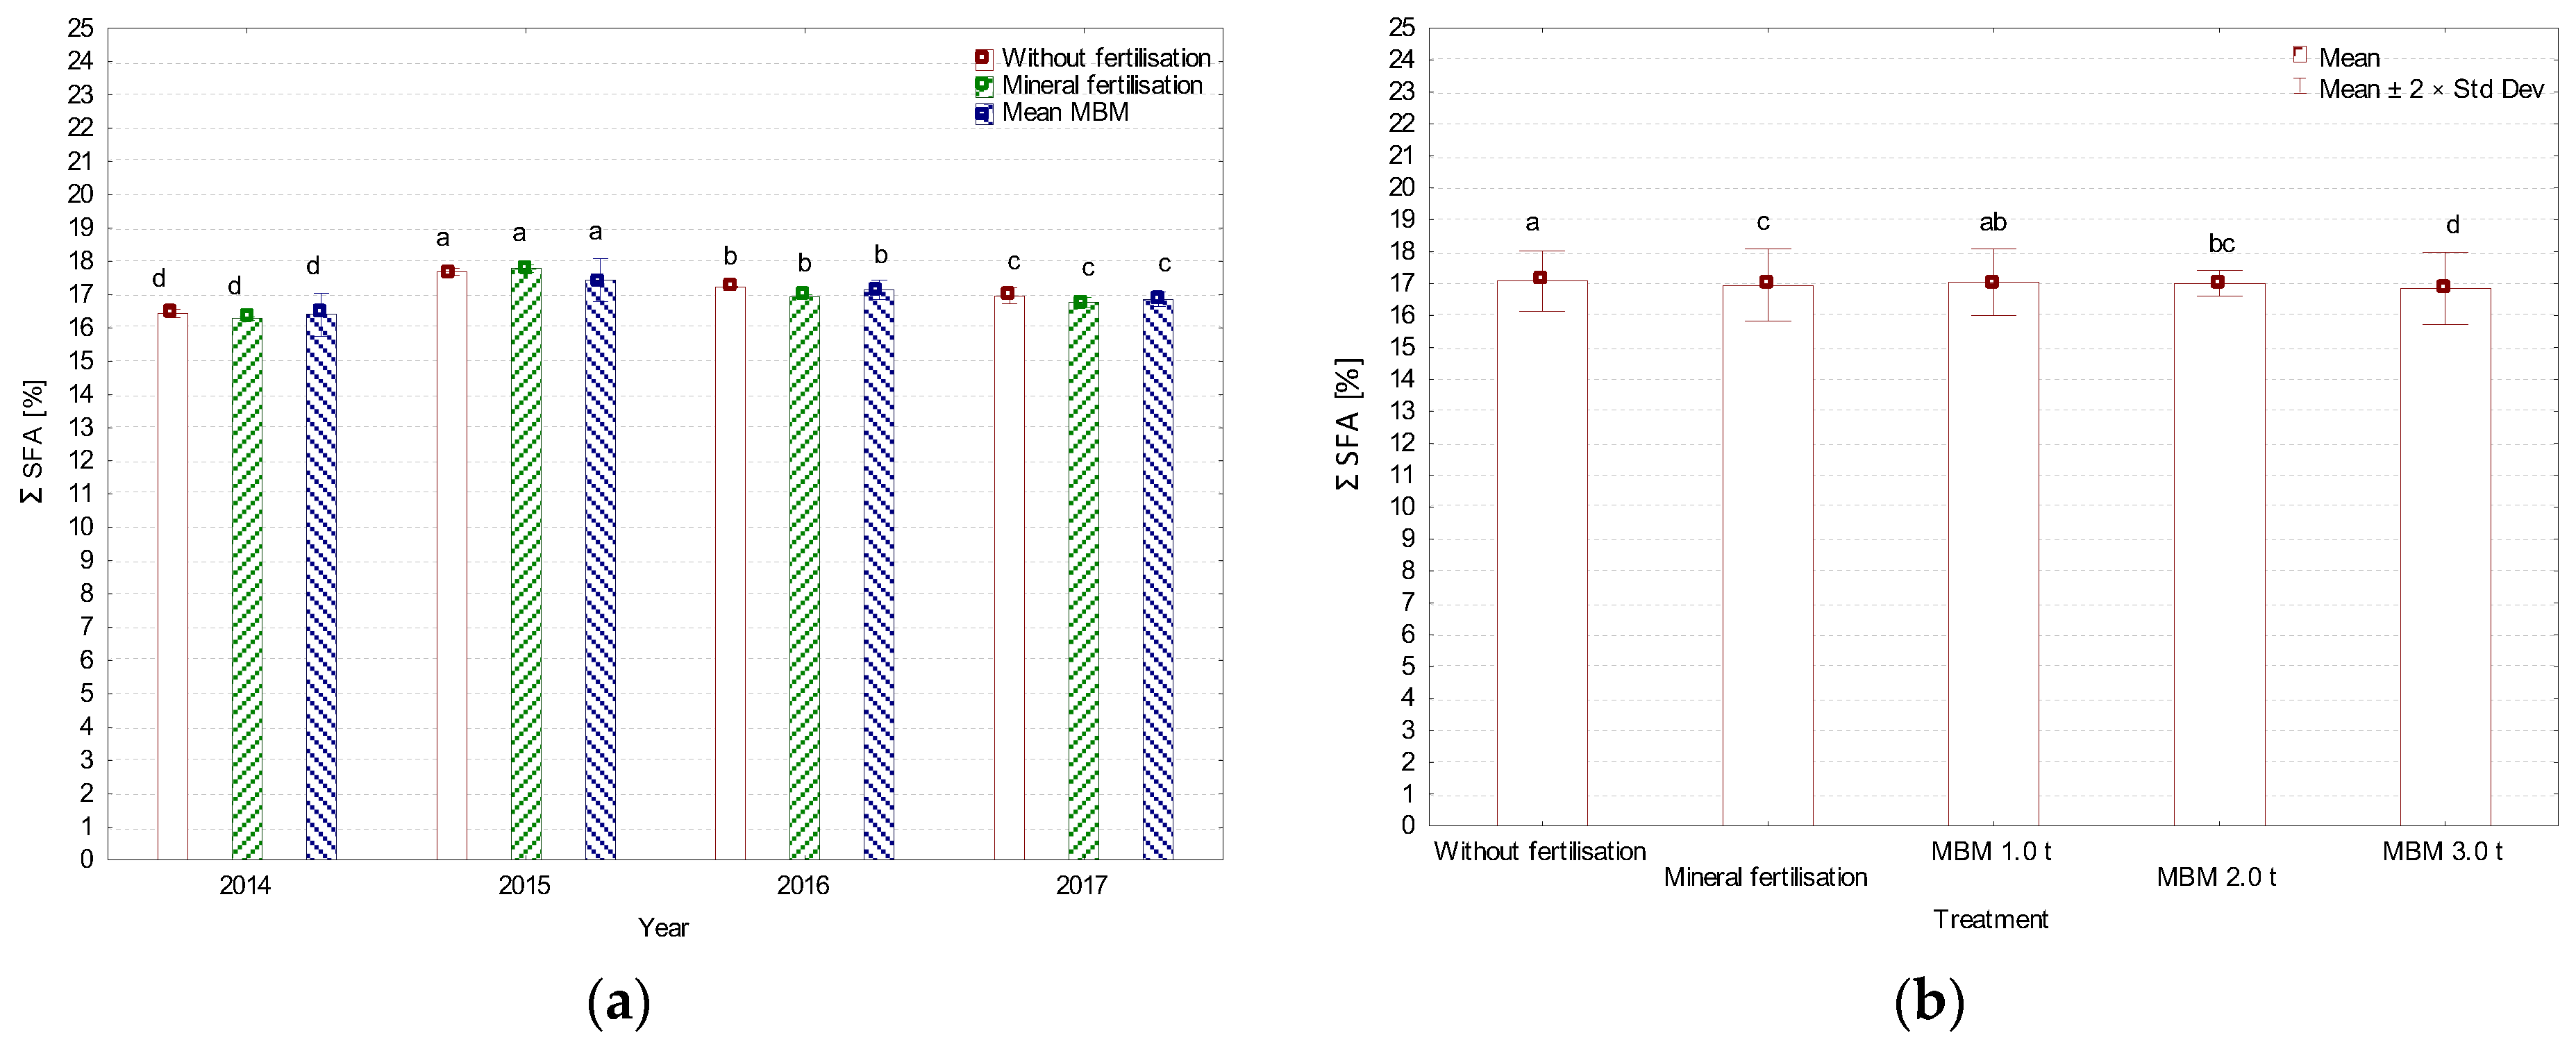
The SFA total was dominated by C16:0 acid, so the results obtained from the effect of the experimental factors on the SFA total are similar to those described for the C16:0 acid profile (Figure 4).
In corn grain, among the monounsaturated fatty acids (MUFA), C18:1 cis-9 was predominant (Figure 5, Table 6), while C16:1, C17:1, C18:1 cis-11, and C20:1 were determined in small amounts (Supplement Table S1). When analysing the effect of this study years on the content of the monounsaturated fatty acid, C18:1 cis-9, there was a decrease in its content in 2017, compared to the other study years (Figure 5). On average, a significantly lower content of C18:1 cis-9 acid was shown after the application of MBM and mineral fertilisation compared to the variant without fertilisation. Of the MBM rates applied, the highest C18:1 cis-9 acid content was found after an application of 1.0 ta ha−1. In each year of this study, the significantly highest C18:1 cis-9 acid content was found in the without fertilisation variant (Table 6). The lowest content of C18:1 cis-9 acid was found after application of 2.0 t ha−1 in 2014 and 2015 and 3.0 t ha−1 MBM in 2016 and 2017.
In the composition of MUFA, there was mainly C18:1 cis-9 acid; therefore, the results obtained from the influence of the experimental factors are similar to those found for this acid (Figure 6).
In the composition of polyunsaturated fatty acids (PUFA), two acids were determined: C18:2 (Figure 7, Table 7), C18:3, and C20:2 (Figure 8, Table 8). Among these acids, C18:2 was the most abundant (its share in the total fatty acid composition averaged 54.3%).
Regardless of the fertilisation variants, significantly lower contents of C18:2 acid were found in 2015 and 2016, compared to the other years of this study (Figure 7). On average for the fertilisation variants, MBM fertilisation, as well as mineral fertilisation, increased the C18:2 acid content compared to the unfertilised variant, and the highest amount was found after the application of 3.0 t ha−1. Analysing the interaction of study years and treatments showed that in all study years, a significantly higher C18:2 acid content was found after MBM fertilisation (all doses) and in the mineral variant compared to the unfertilised variant (Table 7). The application of 3.0 t ha−1 MBM in 2014, 2016, and 2017, and 2.0 t ha−1 in 2015, influenced the occurrence of the highest C18:2 acid content in corn grain.
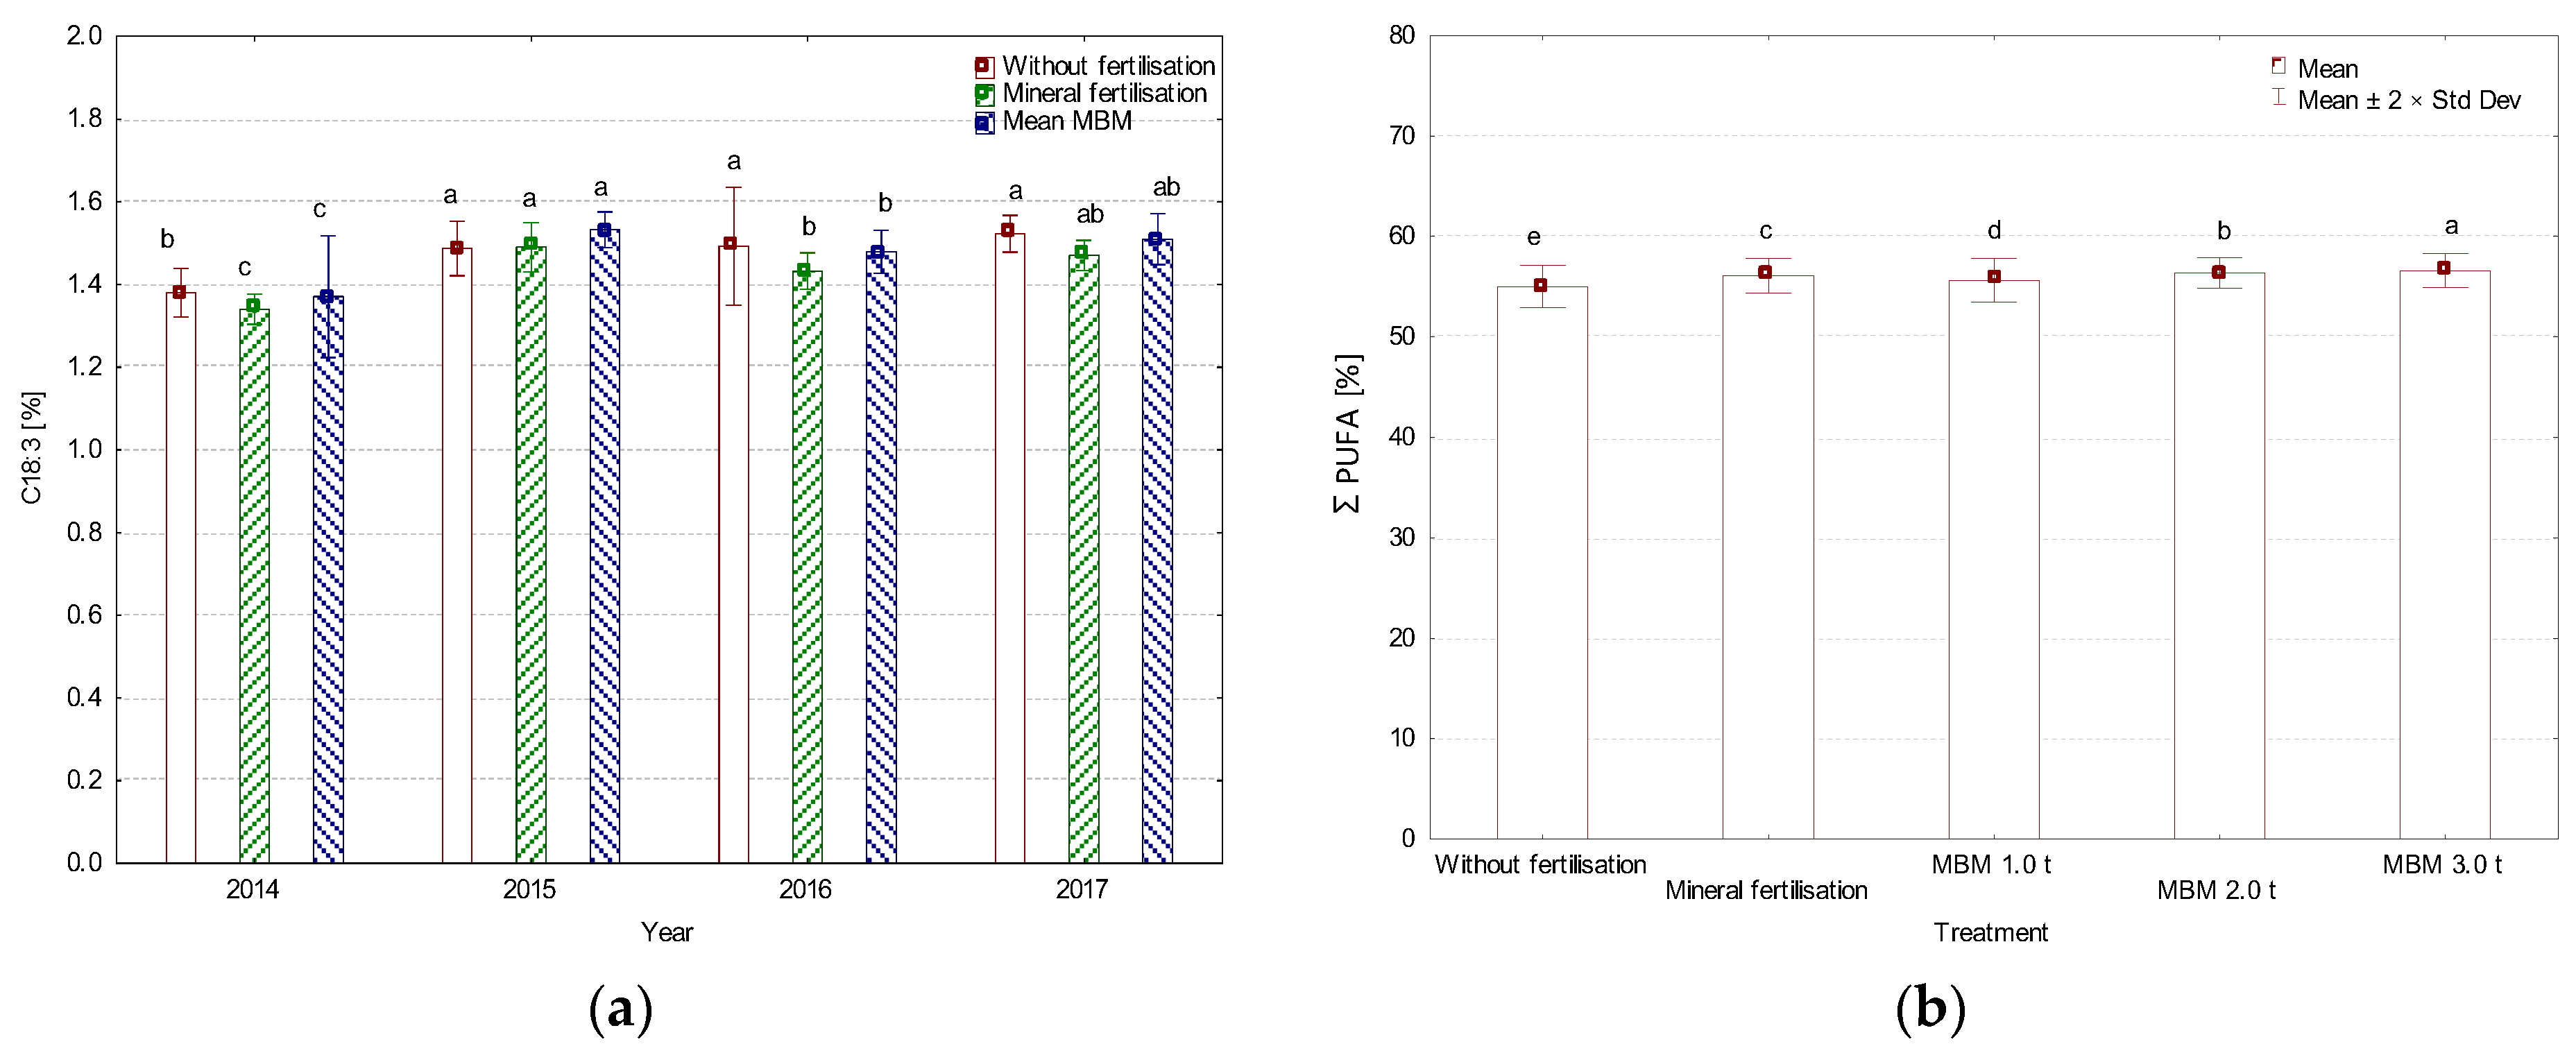
The years of study slightly modified the C18:3 acid content of corn grain (Figure 8). A slightly higher C18:3 acid content was found after application of 1.0 t ha−1 MBM compared to the other variants of the experiment. In all fertiliser treatments, higher C18:3 acid contents were found in 2015–2017 compared to the first year of this study (Table 8). No significant differences were found between the fertiliser variants during the study years.
The total PUFA acid content was modelled by the C18:2 acid content (Figure 9).
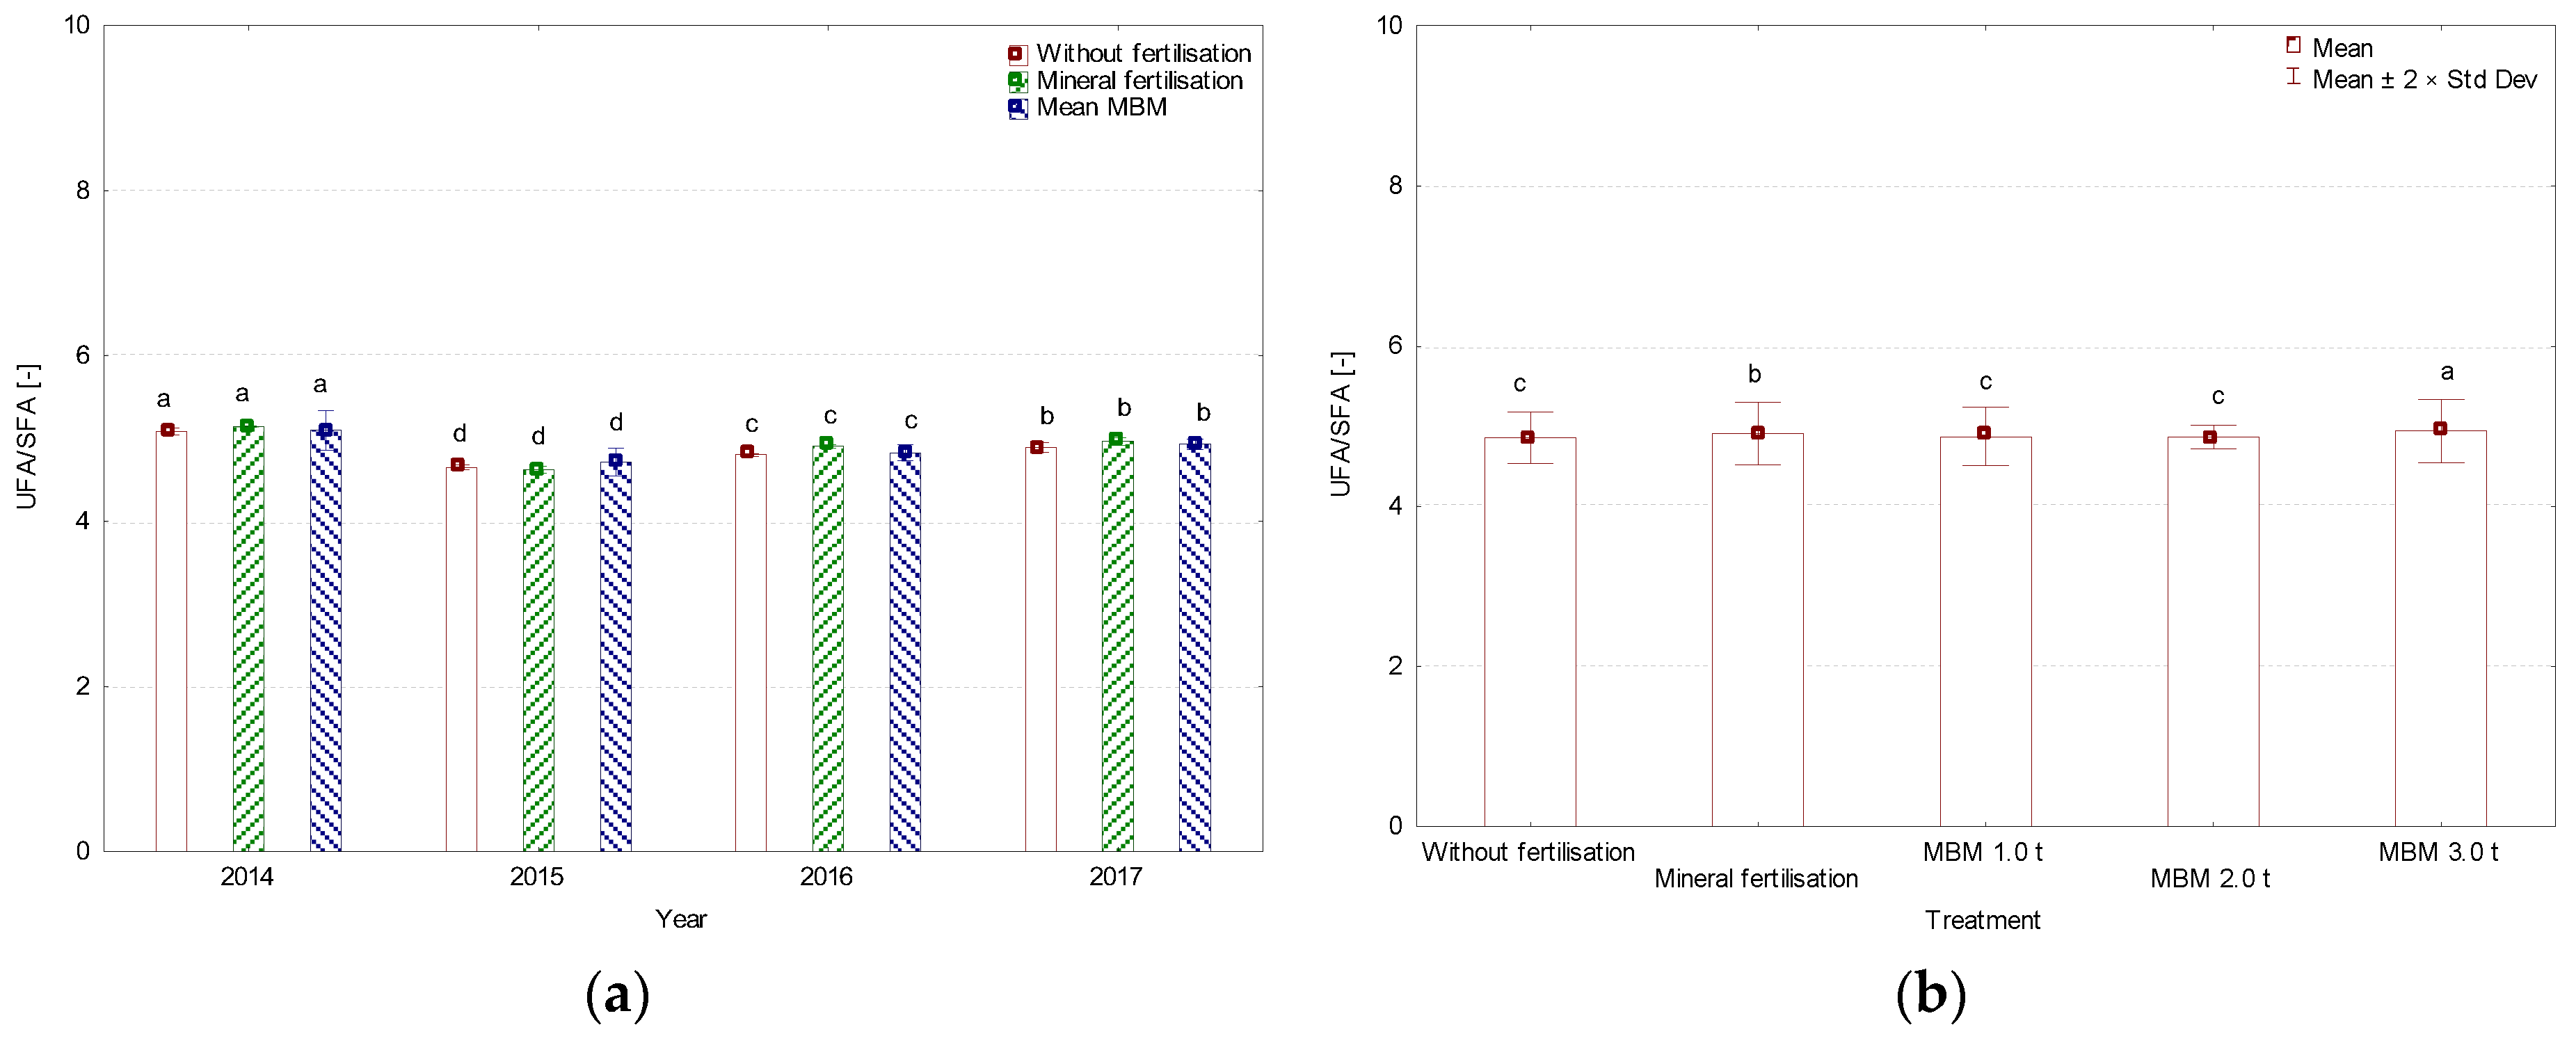
Based on the fatty acids analysed, the MUFA/SFA, PUFA/SFA, and UFA/SFA fatty acid sum ratios were calculated (Figure 10, Figure 11 and Figure 12). The highest values of the calculated fatty acid sum ratios were found in the first year of this study (2014), while the second year of this study (2015) showed a decrease in the values of these ratios. In the following years (2016 and 2017), there was an increase in the values of PUFA/SFA and UFA/SFA ratios, but these relationships were not found for the MUFA/SFA ratio. Regardless of this study years, the application of the 3.0 t ha−1 dose influenced the occurrence of significantly higher PUFA/SFA and UFA/SFA ratios compared to the other variants of the experiment. Slightly lower MUFA/SFA ratios were observed under the influence of applied fertilisation (mineral fertilisation and MBM) compared to the variant without fertilisation.
Principal component analysis (PCA) showed that the UFA/SFA ratio is most strongly (positively) correlated with PUFA/SFA (Figure 13). The least significant influence on UFA/SFA and PUFA/SFA ratios is the total SFA content (negative correlation). Fertilisation variants are most positively correlated with fat yield and total PUFA.
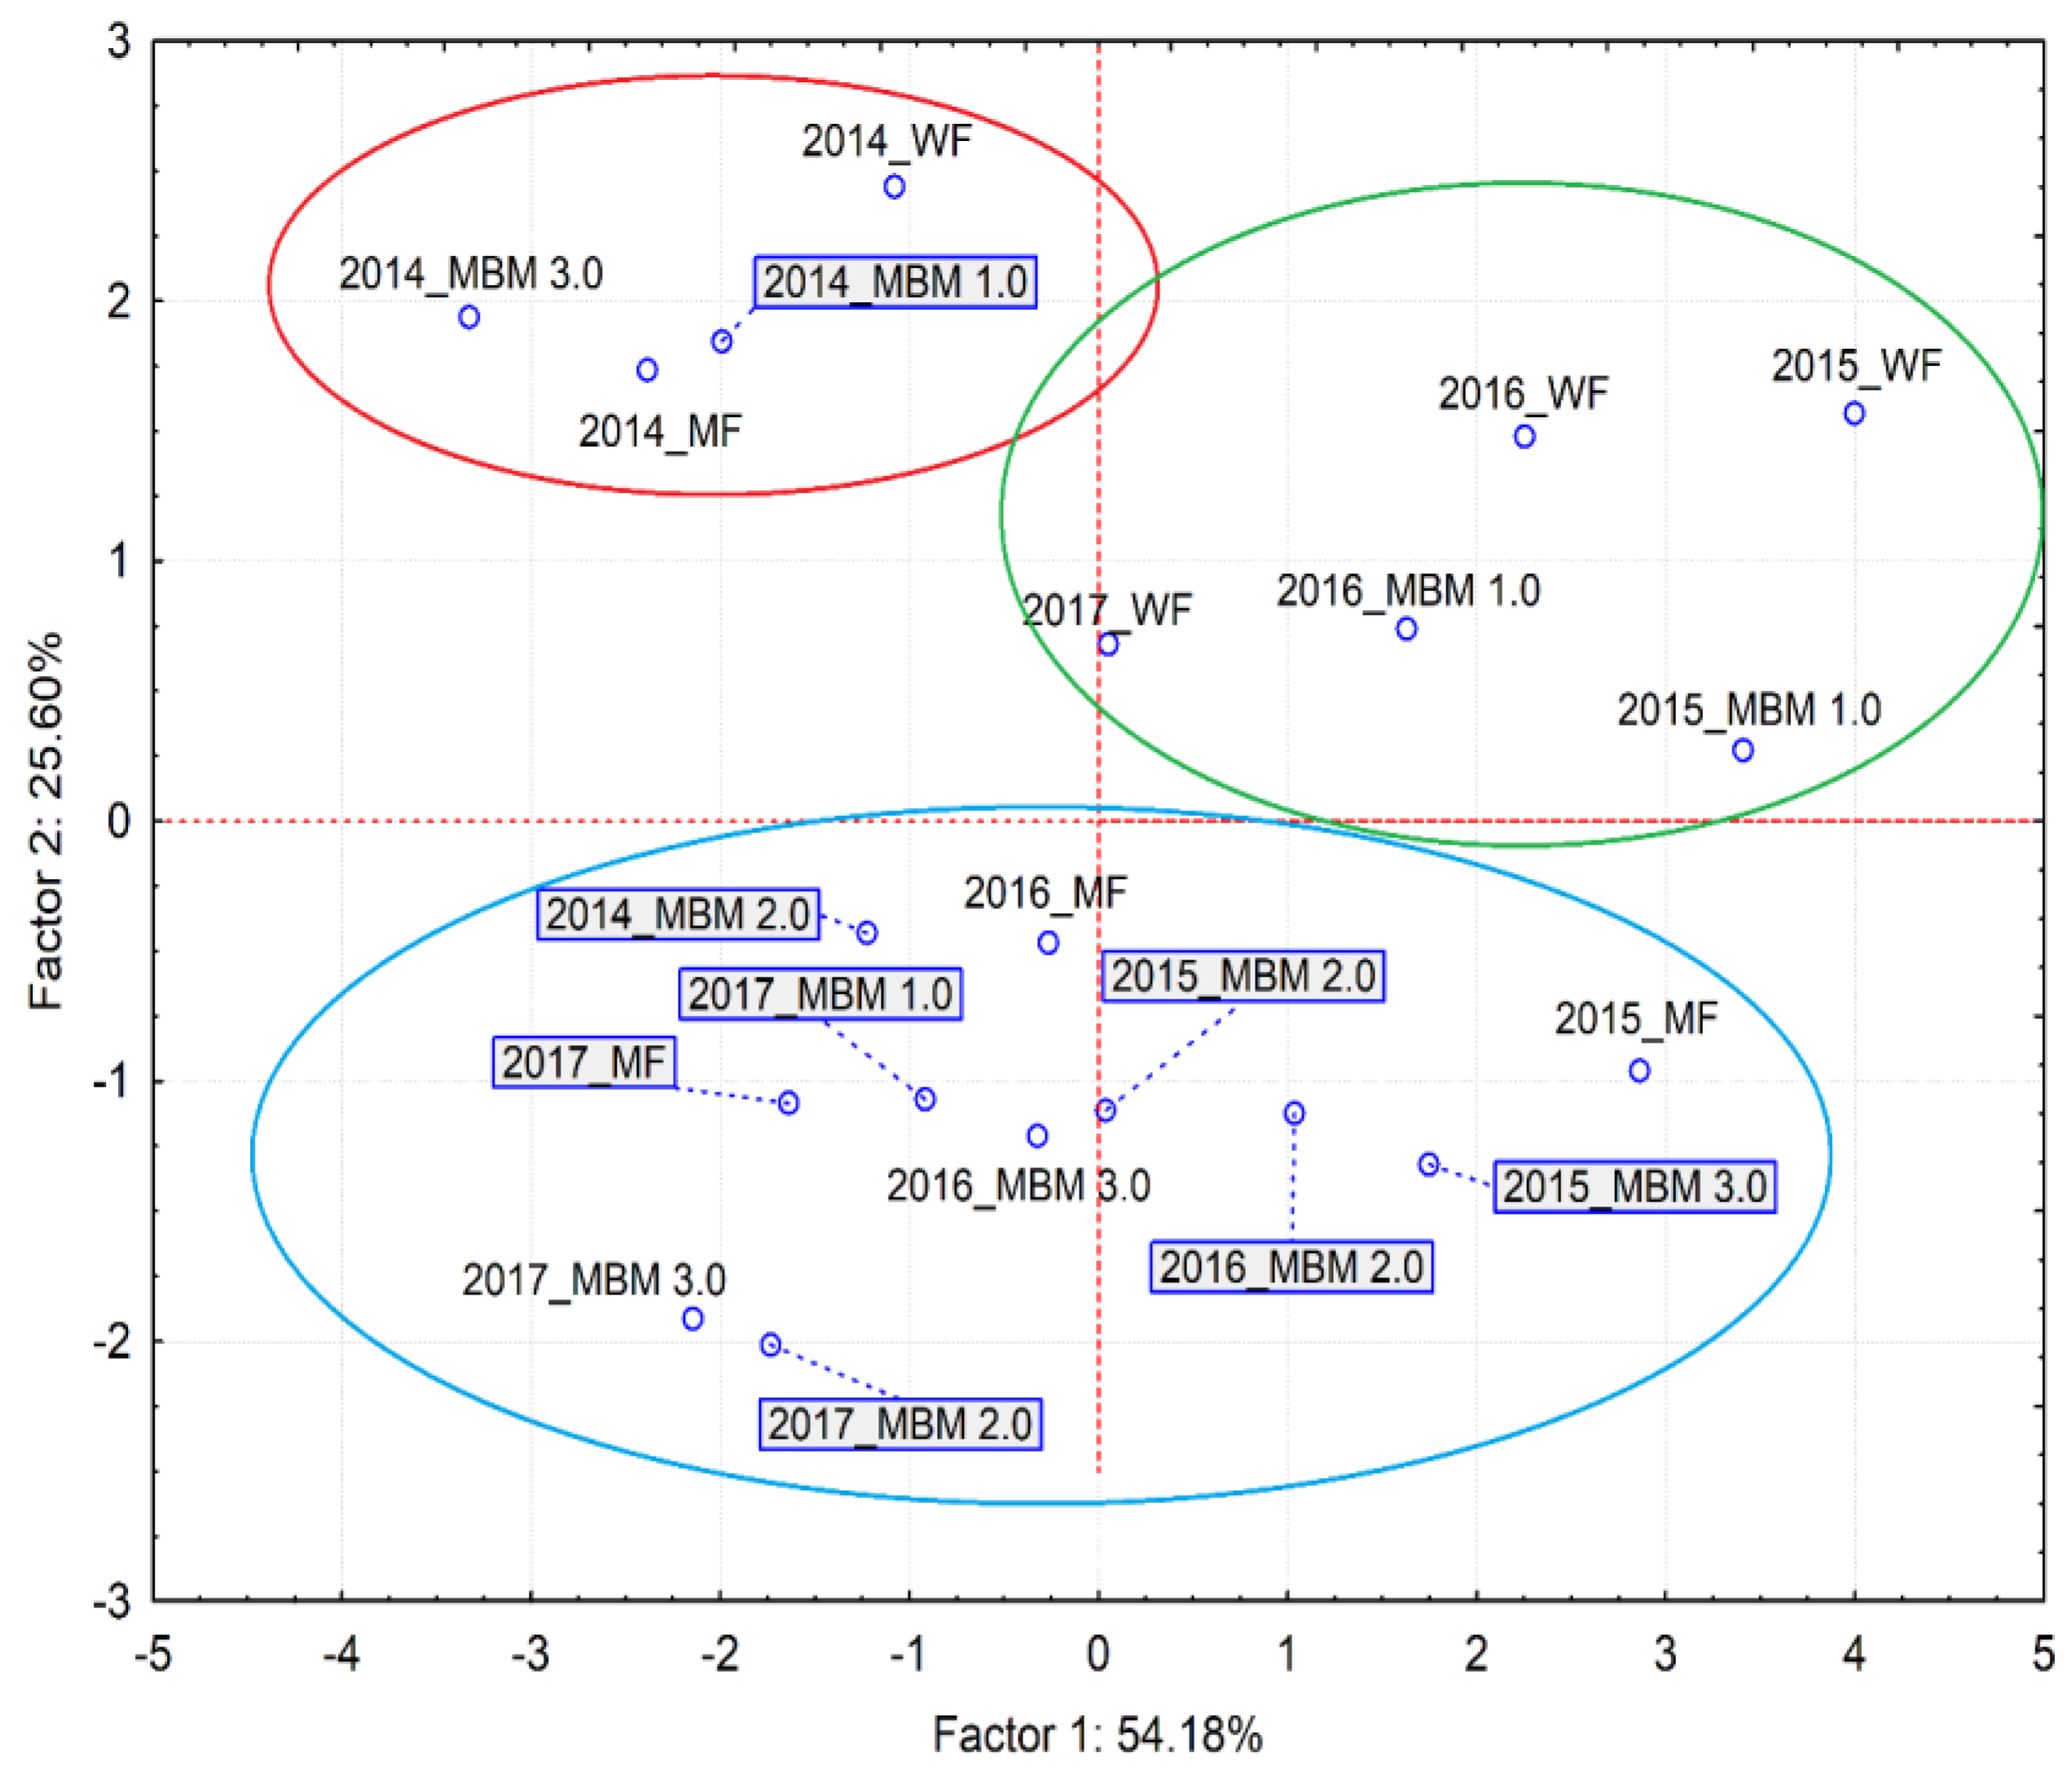
Data showing the projection of cases on the factor plane indicate that the fertiliser variants in this study years can be divided into three groups (Figure 14). The similar values of the evaluated variables (fat yield, fat content, fatty acid profiles, and their ratios) are mainly represented by the fertilisation variants in the first year of this study (2014). The second group is formed by variants without fertilisation, with corn cultivation in 3 consecutive years of this study (2015–2017) and fertilisation with the lowest dose of MBM (1.0 t ha−1) in two years of cultivation (2015 and 2016). Similar effects on the analysed parameters were mainly influenced by fertilisation variants at higher doses (mineral fertilisation, 2.0 and 3.0 t ha−1 MBM) and by variants where a follow-up effect was possible in successive years of fertilisation (2017_MBM ...).

4. Discussion

The quantity and quality of fat, along with starch, protein, and minerals, are among the components that determine the potential use of corn grain [38,39]. Compared to oilseeds, corn grain contains much less fat, but due to the increasing area planted to it, this parameter should be taken into account in the overall fat balance [40]. In our study, an average of 4.74% fat was extracted from corn grain. According to Susik [41], corn grain contains 3.1–5.7% fat, most of which is found in the germ of the seed. The fat content of corn grain depends on corn varieties [42] but is also modified by habitat factors and agronomic practises [20].
The fat content of corn grain largely depends on environmental factors, plant genetics, and agronomic practises [20,42,43,44,45,46,47]. In our study, the years of study influenced the fat content, and significantly the lowest was obtained in corn grain harvested in 2016. In an earlier study by Stępień et al. [34] with corn grown on Haplic Luvisol Arenic soil type, the highest grain yield was obtained in 2016 (average 6.61 t ha−1), indicating a negative correlation of grain yield with fat content. In 2016, the increased temperature and significant moisture during the corn growing season favoured high yields, with higher protein content at the expense of fat content than in other years. According to Ali and Ullah [48], the amount of rainfall (especially its deficiency) can be considered one of the most important factors affecting the chemical composition of corn kernels and their fat content.
For proper seed fat synthesis, it is important to supply the crop with a complex of nutrients throughout the growing season [14]. Organic fertilisers, through the slow release of nitrogen and its availability as and when required [49,50], rich micronutrient composition [51,52], and beneficial effects on the physical and biological properties of the soil [53,54], create optimal conditions for plant growth and development. The creation of optimal conditions for plant growth and development contributes to an increase in the oil content of the grain [16].
In our study, the application of MBM and mineral fertilisation resulted in a slightly lower fat content compared to the variant without fertilisation.
Traits contributing to yield and grain quality are usually antagonistic to each other, and when applying various modifications in agrotechnology, this should be taken into consideration. The forms and amounts of available mineral nutrients in the soil can cause significant changes in the growth character and biochemical composition of plants [55]. According to Gu et al. [56], the availability of N reduces oil concentration, while the application of K increases oil content. Ray et al. [14], on the other hand, argue that oil content decreases with significant soil P abundance. In our study, the MBM applied was N- and P-rich and potassium-poor (therefore, MBM was supplemented with K mineral fertiliser), but these were the amounts necessary only for yield production and did not modify the fat content. According to Ray et al. [14], the protein content of maize grain increases with increasing NPK fertiliser application rates, while the fat content decreases.
The results obtained in our study are not confirmed by the study of Sabourifard et al. [16], who obtained higher fat contents in corn grain after the application of MBM and mineral fertilisation than without fertilisation. Gholamhoseini et al. [57] showed that by applying organic fertilisers, the health of the plants is improved, thus extending the seed filling period and thus increasing the oil content. In a study by Stępień and Rejmer [3] with the application of the same fertiliser variants as in their study, but with cultivation on heavy soil, no differences were shown in the fat content of corn grain between the sites used. According to Hafez and Abdelaal [58] and Kaplan et al. [59], the application of nitrogen fertilisers had a positive effect on crude oil content, which increased with increasing levels of nitrogen fertilisation.
The fatty acid composition of oilseeds and cereals depends on the variety and environmental and agrotechnical conditions [4,13]. Yururdurmaz and Yildiz [60] found that the fatty acid composition of corn grain was dominated by linoleic acid (52%), oleic acid (32%), palmitic acid (14%), stearic acid (2.3%), linolenic acid (0.9%), and arachidic acid (0.5%). In our study, the predominant fatty acids in corn grain were linoleic—C18:2 (54.3%); oleic—C18:1 cis-9 (25.9%); and palmitic—C16:0 (13.9%). The highest contents of C16:0 and C18:1 cis-9 acids were determined in 2015 and 2016, and C18:2 acids in 2014 and 2017. Any environmental stress, such as cold, heat, and drought, can affect fatty acid composition, especially linolenic acid content [61]. Drought interferes with the normal functioning of plants because nutrients are less mobile in the plant under drought conditions [62]. However, mild water stress can increase unsaturated fatty acid content, and severe stress decreases its content [63].
According to Lambert [64], the activity of unsaturated fatty acids, especially linolenic acids, increases with decreasing temperature. This is due to the activation of an enzyme that is involved in the unsaturation of fatty acids at low temperatures and the inhibitory power of the enzyme at high temperatures. According to Kaplan et al. [59], the synthesis of linolenic acid—C18:2 is higher when it is cooler during the harvest season. By following the weather conditions during the experiment, no clear effect of temperature and precipitation on fatty acid content was confirmed. However, it showed the highest content of saturated fatty acid—C18:2 in 2017 (a non-significant difference compared to 2014); in which the harvest fell in the coolest September of the years evaluated.
The use of organic fertilisers can influence plant growth by increasing nitrogen uptake, especially at lower temperatures, which favour the synthesis of unsaturated fatty acids [16,65]. In our study, the highest amount of saturated acid—C16:0 was found on the variant fertilised with 2.0 t ha−1 MBM; unsaturated acids—C18:1 cis-9 on the unfertilised variant; and C18:2 acid on the variant fertilised with 3.0 t ha−1. The least amount of C16:0 acid was found after the application of 3.0 t ha−1, C18:1 cis-9 acid in the variant fertilised with 2.0 t ha−1 MBM, and C 18:2 acid in the control variant.
The amount of available nitrogen influences the fatty acid composition of the grains [66]. Our study has confirmation from studies by other authors that the application of nitrogen at higher doses increases the C18:2 acid content.
Organic fertilisers are available to the plant for longer than mineral fertilisers which can change the biochemical pathway of secondary metabolites in plants, which can affect lipid content and composition [67]. According to Pisulewska et al. [68], nitrogen fertilisation (30 and 60 kg ha−1), relative to unfertilised variants, resulted in a slight increase in the content of monounsaturated and a decrease in polyunsaturated fatty acids in soybean seeds. In a study by Kaplan et al. [59], a significant increase in C18:2 acid content was found with an increase in N application (from 200 to 300 kg N), but no change in its content was shown by increasing N fertilisation from 100 to 200 kg N. Sabourifard et al. [16] showed by sowing corn at the optimum date that the highest content of linoleic acid (C18:3) occurred after organic fertilisation (manure and vermicompost) compared to control (mineral nitrogen, no fertilisation). Kaplan et al. [59] and Wojtkowiak et al. [69] observed no significant changes in unsaturated fatty acid content following fertilisation with minerals compared to the control. In a study by Alipatra [70], the amount of saturated fatty acids in sunflower seeds decreased with increasing levels of nitrogen from organic sources. In our study, there was no clear correlation between the effect of introduced organic matter in the form of MBM on shaping the saturated acid content of C16:0. The results of Kaptan et al. [71] indicate that mineral fertilisation (NPK) influenced the content of saturated fatty acids; the content of lignoceric and arachidic acids increased, while the content of myristic and palmitic acids decreased in corn grain compared to the variant without fertilisation. On the other hand, according to Ray et al. [14], the content of saturated fatty acids (palmitic, stearic, and arachidic acids) decreased with increasing levels of NPK fertilisation, while the content of unsaturated fatty acids (oleic, linoleic, and linolenic acids) in corn grain increased. Fatty acid synthesis requires carbon components from the breakdown of carbohydrates. An increase in the uptake of nitrogen, which is used in the plant for protein production, results in increased competition with fatty acids for carbon, and this results in a reduction in the percentage fat content of the grain [72]. Thus, the negative correlation between protein and oil content may be due to the distribution of endosperm and germ weight in mature corn grain. Ray et al. [14].
The relationship between PUFA and SFA content is the most commonly used indicator to assess the effect of diet on cardiovascular health [11]. In our study, the application of 3.0 t ha−1 MBM influenced the occurrence of significantly higher PUFA/SFA and UFA/SFA ratios compared to the other variants of the experiment. Compared to the non-fertilised variant, slightly lower MUFA/SFA ratios were observed under the influence of applied fertilisation (mineral fertilisation and MBM). The addition of organic fertilisers may facilitate nutrient uptake and subsequently affect enzymes and genes involved in the biosynthesis of particular fatty acids, such as long-chain omega-3 PUFAs [73]. Ardali [74] reported that the decrease in oleic acid levels may be due to a decrease in the activity of the enzyme desaturase-9 as a precursor to the production of oleic acid by stearic acid.
Research by Ureta et al. [75] shows that in order to obtain grain with good fatty acid profiles, corn must gain optimal growth conditions, especially during the period of intensive yield accumulation. Möllers and Schierholt [76] showed a negative correlation between saturated and unsaturated acids in winter rapeseed. A study by Sabourifard et al. [16] showed a negative correlation between the percentage of stearic acid (saturated fatty acid) and linoleic, linolenic, and oleic acids (unsaturated fatty acids). Their study showed that the use of organic fertilisers significantly reduced the percentage of saturated fatty acids and increased the percentage of unsaturated fatty acids.
In the study of Zaluszniewska and Nogalska [77], C18:1 oleic acid, C18:2 linoleic acid, and C18:3 α-linolenic acid accounted for nearly 90% of the fatty acids in rapeseed, and their proportions did not change under the influence of mineral fertilisation and meat and bone meal. In their study, the ratio of linoleic acid (C18:2) to α-linolenic acid (C18:3) was 1.81:1, which they consider to be the optimal ratio.
Although the differences in the effect of fertilisation on the quantitative changes of saturated and unsaturated fatty acids in corn grain described in their study are too small to have an impact on human health, as reported by Lux et al. [46], fatty acid composition can have an impact on storage.

5. Conclusions

Weather conditions varied the fat content and ambiguously shaped the fatty acid profiles in corn grain. Fertilisation with meat and bone meal did not increase the fat content of corn grain. Fertilisation with the highest doses of meat and bone meal (2.0 and 3.0 t ha−1), in comparison with the variant without fertilisation, showed an increase in the content of the dominant polyunsaturated acid, linoleic acid (C18:2), and a decrease in the amount of monounsaturated fatty acid, oleic acid (C18:1 cis-9). The fertiliser variants and their effects on fat yield, fat content, fatty acid profiles, and ratios can be divided into three groups, which were related to the effects of organic fertilisers during the years of this study. The application of fertilisers in the form of meat and bone meal cannot be considered a factor in increasing the fat content of corn grain. Meat and bone meal applied over several years in the same field in the quantities necessary to build up an optimum yield can be an element that shapes fatty acid profiles.

Supplementary Materials

The following supporting information can be downloaded at: https://www.mdpi.com/article/10.3390/su16030952/s1, Table S1: Content of fatty acids C12:0 (lauric acid); C14:0 (myristic acid); C15:0 (pentadecanoic); C17:0 (margaric acid); C22:0 (behenic acid); C20:2 (8Z,11Z-eicosadienoic acid); C16:1 (palmitoleic acid); C17:1 (heptadecenoic acid); C18:1 cis-11 (vaccenic acid); C20:1 (gadoleic acid); average for year, treatments, interaction between the year and treatments, %.

Author Contributions

Conceptualization, A.S., K.W., E.K., and R.P.-F.; methodology, A.S., K.W., E.K., and R.P.-F.; validation, A.S., K.W., and E.K.; formal analysis, A.S., K.W., and E.K.; investigation, A.S. and R.P.-F.; resources, A.S. and R.P.-F.; writing—original draft preparation, A.S., K.W., and E.K.; writing—review and editing, A.S. and K.W.; visualization, A.S. and E.K.; supervision, A.S. and K.W.; project administration, A.S.; funding acquisition, A.S., K.W., E.K. and R.P.-F. All authors have read and agreed to the published version of the manuscript.

Funding

The results presented in this paper were obtained as part of a comprehensive study financed by the University of Warmia and Mazury in Olsztyn, Faculty of Agriculture and Forestry, Department of Agroecosystems and Horticulture (grant N 30.610.015–110).

Institutional Review Board Statement

Not applicable.

Informed Consent Statement

Not applicable.

Data Availability Statement

The data are available upon request.

Conflicts of Interest

The authors declare no conflicts of interest. The funders had no role in the design of the study, in the collection, analysis, or interpretation of data, in the writing of the manuscript, or in the decision to publish the results.

References

  1. Food and Agriculture Organization of the United Nations. Available online: https://www.fao.org/home/en/ (accessed on 19 December 2023).
  2. Erenstein, O.; Jaleta, M.; Sonder, K.; Mottaleb, K.; Prasanna, B.M. Global maize production, consumption and trade: Trends and R&D implications. Food Secur. 2022, 14, 1295–1319. [Google Scholar] [CrossRef]
  3. Stępień, A.; Rejmer, W. Effect of fertilization with meat and bone meal on the production of biofuel obtained from corn grain. Energies 2023, 16, 21. [Google Scholar] [CrossRef]
  4. Sanjeev, P.; Chaudhary, D.P.; Sreevastava, P.; Saha, S.; Rajenderan, A.; Sekhar, J.C.; Chikkappa, G.K. Comparison of fatty acid profile of specialty corn maize. J. Am. Oil Chem. Soc. 2014, 91, 1001–1005. [Google Scholar] [CrossRef]
  5. Ortíz-Islas, S.; García-Lara, S.; Preciado-Ortíz, R.E.; Serna-Saldívar, S.O. Fatty acid composition and proximate analysis of improved high-oil corn double haploid hybrids adapted to subtropical areas. Cereal Chem. 2019, 96, 182–192. [Google Scholar] [CrossRef]
  6. Saoussem, H.; Sadok, B.; Habib, K.; Mayer, P.M. Fatty acid accumulation in the different fractions of the developing corn kernel. Food Chem. 2009, 117, 432–437. [Google Scholar] [CrossRef]
  7. Klopfenstein, T.J.; Erickson, G.E.; Berger, L.L. Maize is a critically important source of food, feed, energy and forage in the USA. Field Crops Res. 2013, 153, 5–11. [Google Scholar] [CrossRef]
  8. Keshavarz, H. Study of water deficit conditions and beneficial microbes on the oil quality and agronomic traits of canola (Brassica napus L.). Grasas Aceites 2020, 71, e373. [Google Scholar] [CrossRef]
  9. Carrillo, W.; Cardenas, M.; Carpio, C.; Morales, D.; Álvarez, M.; Silva, M. Content of nutrients component and fatty acids in chia seeds (Salvia hispanica L.) cultivated in Ecuador. Asian J. Pharm. Clin. Res. 2018, 11, 387–390. [Google Scholar] [CrossRef]
  10. Dauqan, E.M.A.; Sani, H.A.; Abdullah, A.; Kasim, Z.M. Fatty acid composition of four different vegetable oils (red palm olein, palm olein, corn oil and coconut oil) by gas chromatography. In 2nd International Conference on Chemistry and Chemical Engineering; IACSIT Press: Singapore, 2011; Volume 14, pp. 31–34. Available online: https://www.scribd.com/doc/216724164/6-C016 (accessed on 19 December 2023).
  11. Chen, J.; Liu, H. Nutritional indices for assessing fatty acids: A mini-review. Int. J. Mol. Sci. 2020, 21, 5695. [Google Scholar] [CrossRef]
  12. Ahmed, Z.F.R.; Taha, E.; Abd-Elkarim, N.A.A. Floral Behavior, Fruit Characteristics and Oil Quality of Some Olive Cultivars. Egyptian J. Hort. 2019, 46, 155–168. [Google Scholar] [CrossRef]
  13. Stępień, A.; Wojtkowiak, K.; Pietrzak-Fiecko, R.; Zalewska, M.; Grzywińska-Rąpca, M. Effect of manganese and nitrogen fertilization on the content of some essential micronutrients and composition of fatty acids in winter wheat grain. Chil. J. Agric. Res. 2019, 79, 616–627. [Google Scholar] [CrossRef]
  14. Ray, K.; Banerjee, H.; Dutta, S.; Hazra, A.K.; Majumdar, K. Macronutrients influence yield and oil quality of hybrid maize (Zea mays L.). PLoS ONE 2019, 14, e0216939. [Google Scholar] [CrossRef] [PubMed]
  15. Zhao, X.; Wei, J.; He, L.; Zhang, Y.; Zhao, Y.; Xu, X.; Wei, Y.; Ge, S.; Ding, D.; Liu, M.; et al. Identification of fatty acid desaturases in maize and their differential responses to low and high temperature. Genes 2019, 10, 445. [Google Scholar] [CrossRef] [PubMed]
  16. Sabourifard, H.; Estakhr, A.; Bagheri, M.; Hosseini, S.J.; Keshavarz, H. The quality and quantity response of maize (Zea mays L.) yield to planting date and fertilizers management. Food Chem. Adv. 2023, 2, 100196. [Google Scholar] [CrossRef]
  17. Toishimanov, M.; Suleimenova, Z.; Myrzabayeva, N.; Dossimova, Z.; Shokan, A.; Kenenbayev, S.; Yessenbayeva, G.; Serikbayeva, A. Effects of Organic Fertilizers on the Quality, Yield, and Fatty Acids of Maize and Soybean in Southeast Kazakhstan. Sustainability 2024, 16, 162. [Google Scholar] [CrossRef]
  18. Merwad, A.R.M. Using humic substances and foliar spray with moringa leaf extract to alleviate salinity stress on wheat. In Sustainability of Agricultural Environment in Egypt; Part II; Springer: Cham, Switzerland, 2018; pp. 265–286. [Google Scholar] [CrossRef]
  19. Feizabadi, A.; Noormohammadi, G.; Fatehi, F. Changes in growth, physiology, and fatty acid profile of rapeseed cultivars treated with vermicompost under drought stress. J. Soil Sci. Plant Nut. 2020, 21, 200–208. [Google Scholar] [CrossRef]
  20. Jasemi, M.; Darabi, F.; Naseri, R.; Naserirad, H.; Bazdar, S. Effect of planting date and nitrogen fertilizer application on grain yield and yield components in maize (SC 704). Am. Eurasian J. Agric. Environ. Sci. 2013, 13, 914–919. [Google Scholar]
  21. Keshavarz-Mirzamohammadi, H.; Tohidi-Moghadam, H.R.; Hosseini, S.J. Is there any relationship between agronomic traits, soil properties and essential oil profile of peppermint (Mentha piperita L.) treated by fertiliser treatments and irrigation regimes? Ann. Appl. Biol. 2021, 179, 331–344. [Google Scholar] [CrossRef]
  22. Singh, B. Are nitrogen fertilizers deleterious to soil health? Agronomy 2018, 8, 48. [Google Scholar] [CrossRef]
  23. Bisht, N.; Chauhan, P.S. Excessive and Disproportionate Use of Chemicals Cause Soil Contamination and Nutritional Stress. In Soil Contamination—Threats and Sustainable Solutions; Larramendy, M.L., Soloneski, S., Eds.; IntechOpen: London, UK, 2020. [Google Scholar] [CrossRef]
  24. Chojnacka, K.; Moustakas, K.; Witek-Krowiak, A. Bio-based fertilisers: A practical approach towards circular economy. Bioresour. Technolol. 2020, 295, 122223. [Google Scholar] [CrossRef]
  25. Piash, M.I.; Uemura, K.; Itoh, T.; Iwabuchi, K. Meat and bone meal biochar can effectively reduce chemical fertilizer requirements for crop production and impart competitive advantages to soil. J. Environ. Manag. 2023, 336, 117612. [Google Scholar] [CrossRef] [PubMed]
  26. Anae, J.; Ahmad, N.; Kumar, V.; Thakur, V.K.; Gutierrez, T.; Yang, X.J.; Cai, C.; Yang, Z.; Coulon, F. Recent advances in biochar engineering for soil contaminated with complex chemical mixtures: Remediation strategies and future perspectives. Sci. Total Environ. 2021, 767, 144351. [Google Scholar] [CrossRef] [PubMed]
  27. Hidalgo, D.; Corona, F.; Martín-Marroquín, J.M. Nutrient recycling: From waste to crop. Biomass Convers. Biorefin. 2021, 11, 207–217. [Google Scholar] [CrossRef]
  28. Jeng, A.S.; Haraldsen, T.K.; Gronlund, A.; Pedersen, P.A. Meat and bone meal as nitrogen and phosphorus fertilizer to cereals and rye grass. Nutr. Cycl. Agroecosystems 2006, 76, 183–191. [Google Scholar] [CrossRef]
  29. Zwetsloot, M.J.; Lehmann, J.; Bauerle, T.; Vanek, S.; Hestrin, R.; Nigussie, A. Phosphorus availability from bone char in a P-fixing soil influenced by root-mycorrhizae-biochar interactions. Plant Soil 2016, 408, 95–105. [Google Scholar] [CrossRef]
  30. Jeng, A.S.; Vagstad, N. Potential nitrogen and phosphorus leaching from soils fertilized with meat and bone meal. Acta Agric. Scand. B Soil Plant Sci. 2009, 59, 238–245. [Google Scholar] [CrossRef]
  31. Nogalska, A. Meat and bone meal as fertilizer for spring barley. Plant Soil Environ. 2016, 62, 373–378. [Google Scholar] [CrossRef]
  32. Darch, T.; Dunn, R.M.; Guy, A.; Hawkins, J.M.B.; Ash, M.; Frimpong, K.A.; Blackwell, M.S.A. Fertiliser produced from abattoir waste can contribute to phosphorus sustainability, and biofortify crops with minerals. PLoS ONE 2019, 14, e0221647. [Google Scholar] [CrossRef]
  33. Eliseev, I.P.; Shashkarov, L.G.; Vasiliev, O.A.; Eliseeva, L.V.; Mitrofanov, E.L. Optimization of plant nutrition using non-traditional organic fertilizers and zeolite-containing tripoli. IOP Conf. Ser. Earth Environ. Sci. 2020, 433, 012017. [Google Scholar] [CrossRef]
  34. Stępień, A.; Wojtkowiak, K.; Kolankowska, E. Use of meat industry waste in the form of meat-and-bone meal in fertilising maize (Zea mays L.) for grain. Sustainability 2021, 13, 2857. [Google Scholar] [CrossRef]
  35. Stępień, A.; Wojtkowiak, K.; Grzywińska-Rąpca, M.; Pawluczuk, J. Meat processing waste as a source of nutrients and its effect on the physicochemical properties of soil. Sustainability 2022, 14, 1341. [Google Scholar] [CrossRef]
  36. Cequier-Sánchez, E.; Rodríguez, C.; Ravelo, A.G.; Zárate, R. Dichloromethane as a solvent for lipid extraction and assessment of lipid classes and fatty acids from samples of different natures. J. Agric. Food Chem. 2008, 56, 4297–4303. [Google Scholar] [CrossRef] [PubMed]
  37. EN ISO 12966-1:2014/AC:2015; Animal and Vegetable Fats and Oils-Gas Chromatography of Fatty Acid Methyl Esters. Part 1. Guidelines on Modern Gas Chromatography of Fatty Acid Methyl Esters. Polish Committee for Standardization: Warsaw, Poland, 2015.
  38. Loy, D.D.; Lundy, E.L. Chapter 23 – Nutritional properties and feeding value of corn and its coproducts. In Corn; Serna-Saldivar, S.O., Ed.; AACC International Press: Oxford, UK, 2019; pp. 633–659. [Google Scholar] [CrossRef]
  39. Revilla, P.; Alves, M.L.; Andelković, V.; Balconi, C.; Dinis, I.; Mendes-Moreira, P.; Redaelli, R.; de Galarreta, J.I.R.; Patto, M.C.V.; Malvar, R.A. Traditional foods from maize (Zea mays L.) in Europe. Front. Nutr 2022, 8, 683399. [Google Scholar] [CrossRef] [PubMed]
  40. Wang, T.; White, P.J. Chapter 13 – Lipids of the Kernel. In Corn; Serna-Saldivar, S.O., Ed.; AACC International Press: Oxford, UK, 2019; pp. 337–368. [Google Scholar] [CrossRef]
  41. Susik, J. Metody otrzymywania oleju kukurydzianego determinujące jego właściwości chemiczne. ŻYWNOŚĆ. Nauka. Technologia. Jakość 2021, 28, 47–56. (In Polish). Available online: https://wydawnictwo.pttz.org/wp-content/uploads/pelne_zeszyty/full_2021284129.pdf (accessed on 19 December 2023).
  42. Podkówka, L.; Kowaliszyn, B. Comparison of nutritive value of different varietes of maize grain defined by standard analytical method and using of near infrared reflectance spectroscopy (nirs) technique. Acta Scientiarum Polonorum. Zootechnica 2010, 9, 49. [Google Scholar]
  43. Ignjatovic-Micic, D.; Vancetovic, J.; Trbovic, D.; Dumanovic, Z.; Kostadinovic, M.; Bozinovic, S. Grain nutrient composition of maize (Zea mays L.) drought-tolerant populations. J. Agric. Food Chem. 2015, 63, 125–1260. [Google Scholar] [CrossRef] [PubMed]
  44. Tabatabai, S.M.R.; Madani, H.; Heidari Sharifabad, H.; Noormohammadi, G.; Darvish, F. Effect of chemical and compost fertilizers on yield and oil fatty composition of maize (Zea mays L.) in delay planting Date. Commun. Soil Sci. Plant Anal. 2020, 51, 2069–2084. [Google Scholar] [CrossRef]
  45. Wang, X.; Liu, S.; Yin, X.; Bellaloui, N.; Winings, J.H.; Agyin-Birikorang, S.; Singh, U.; Sanabria, J.; Mengistu, A. Maize grain composition with additions of NPK briquette and organically enhanced N fertilizer. Agronomy 2020, 10, 852. [Google Scholar] [CrossRef]
  46. Lux, P.E.; Schneider, J.; Müller, F.; Wiedmaier-Czerny, N.; Vetter, W.; Weiß, T.M.; Würschum, T.; Frank, J. Location and variety but not phosphate starter fertilization influence the profiles of fatty acids, carotenoids, and tocochromanols in kernels of modern corn (Zea mays L.) hybrids cultivated in Germany. J. Agric. Food Chem. 2021, 69, 2845–2854. [Google Scholar] [CrossRef]
  47. Shynkaruk, L.; Lykhochvor, V. Influence of fertilization and foliar feeding on maize grain qualitative indicators. Ukr. J. Ecol. 2022, 11, 113–116. [Google Scholar]
  48. Ali, A.; Ullah, S. Effect of nitrogen on achene protein, oil, fatty acid profile, and yield of sunflower hybrids. Chil. J. Agric. Res. 2012, 72, 564–567. [Google Scholar] [CrossRef]
  49. Geng, Y.; Cao, G.; Wang, L.; Wang, S. Effects of equal chemical fertilizer substitutions with organic manure on yield, dry matter, and nitrogen uptake of spring maize and soil nitrogen distribution. PLoS ONE 2019, 14, e0219512. [Google Scholar] [CrossRef] [PubMed]
  50. Yagüe, R.; Lobo, C.; García, P. Organic fertilisation induces changes in soil nitrogen mineralisation and enzyme activities. Plant Soil Environ. 2023, 69, 38–43. [Google Scholar] [CrossRef]
  51. Bandyopadhyay, K.K.; Misra, A.K.; Ghosh, P.K.; Hati, K.M. Effect of integrated use of farmyard manure and chemical fertilizers on soil physical properties and productivity of soybean. Soil Tillage Res. 2010, 110, 115–125. [Google Scholar] [CrossRef]
  52. Möller, K.; Schultheiß, U. Chemical characterization of commercial organic fertilizers. Arch. Agron. Soil Sci. 2015, 61, 989–1012. [Google Scholar] [CrossRef]
  53. Kobierski, M.; Bartkowiak, A.; Lemanowicz, J.; Piekarczyk, M. Impact of poultry manure fertilization on chemical and biochemical properties of soils. Plant Soil Environ. 2017, 63, 558–563. [Google Scholar] [CrossRef]
  54. Singh, T.B.; Ali, A.; Prasad, M.; Yadav, A.; Shrivastav, P.; Goyal, D.; Dantu, P.K. Role of Organic Fertilizers in Improving Soil Fertility. In Contaminants in Agriculture; Naeem, M., Ansari, A.A., Gill, S.S., Eds.; Springer: Berlin/Heidelberg, Germany, 2020; pp. 61–77. Available online: https://link.springer.com/chapter/10.1007/978-3-030-41552-5_3 (accessed on 19 December 2023).
  55. Sethi, M.; Saini, D.K.; Devi, V.; Kaur, C.; Singh, M.P.; Singh, J.; Pruthi, G.; Kaur, A.; Singh, A.; Chaudhary, D.P. Unravelling the genetic framework associated with grain quality and yield-related traits in maize (Zea mays L.). Front. Genet. 2023, 14, 1248697. [Google Scholar] [CrossRef]
  56. Gu, H.; Li, J.; Lu, Z.; Li, X.; Cong, R.; Ren, T.; Lu, J. Effects of combined application of nitrogen and potassium on oil concentration and fatty acid component of oilseed rape (Brassica napus L.). Field Crops Res. 2024, 306, 109229. [Google Scholar] [CrossRef]
  57. Gholamhoseini, M.; Ghalavand, A.; Khodaei-Joghan, A.; Dolatabadian, A.; Zakikhani, H.; Farmanbar, E. Zeolite-amended cattle manure effects on sunflower yield, seed quality, water use efficiency and nutrient leaching. Soil Tillage Res. 2013, 126, 193–202. [Google Scholar] [CrossRef]
  58. Hafez, E.M.; Abdelaal, K.A. Impact of nitrogen fertilization levels on morphophysiological characters and yield quality of some maize hybrids (Zea mays L.). Egypt. J. Agron. 2015, 37, 35–48. [Google Scholar] [CrossRef]
  59. Kaplan, M.; Kale, H.; Karaman, K.; Ünlükara, A.L.İ. Influence of different irrigation and nitrogen levels on crude oil and fatty acid composition of maize (Zea mays L.). Grasas Aceites 2017, 68, e207. [Google Scholar] [CrossRef]
  60. Yururdurmaz, C.; Yildiz, H. Fatty acid compositions of Zea mays L. varieties in Turkey. Prog Nutr. 2022, 24, e2022112. [Google Scholar] [CrossRef]
  61. Gunasekera, C.P.; Martin, L.D.; Siddique, K.H.M.; Walton, G.H. Genotype by environment interactions of Indian mustard (Brassica juncea L.) and canola (Brassica napus L.) in Mediterranean-type environments: II. Oil and protein concentrations in seed. Eur. J. Agron. 2006, 25, 13–21. [Google Scholar] [CrossRef]
  62. Rahdari, P.; Hoseini, S.M. Drought stress: A review. Int. J. Agron. Plant Prod. 2012, 3, 443–446. [Google Scholar]
  63. Aslam, M.N.; Nelson, M.N.; Kailis, S.G.; Bayliss, K.L.; Speijers, J.; Cowling, W.A. Canola oil increases in polyunsaturated fatty acids and decreases in oleic acid in drought-stressed Mediterranean-type environments. Plant Breed. 2009, 128, 348–355. [Google Scholar] [CrossRef]
  64. Lambert, R.J. High-oil corn hybrids. In Specialty Corns; CRC Press: Boca Raton, FL, USA, 2000; pp. 143–166. [Google Scholar] [CrossRef]
  65. Qiao, Y.; Miao, S.; Li, Q.; Jin, J.; Luo, X.; Tang, C. Elevated CO2 and temperature increase grain oil concentration but their impacts on grain yield differ between soybean and maize grown in a temperate region. Sci. Total Environ. 2019, 666, 405–413. [Google Scholar] [CrossRef] [PubMed]
  66. Nazeri, P.; Shirani Rad, A.H.; ValadAbadi, S.A.; Mirakhori, M.; Hadidi Masoule, E. Effect of sowing dates and late season water deficit stress on quantitative and qualitative traits of canola cultivars. Outlook Agric. 2018, 47, 291–297. [Google Scholar] [CrossRef]
  67. Verma, N.; Shukla, S. Impact of various factors responsible for fluctuation in plant secondary metabolites. J. Appl. Res. Med. Aromat. Plants 2015, 2, 105–113. [Google Scholar] [CrossRef]
  68. Pisulewska, E.; Lorenc-Kozik, A.; Borowiec, F. Wpływ zróżnicowanego nawożenia azotem na plon, zawartość oraz skład kwasów tłuszczowych w nasionach dwóch odmian soi. Rośliny Oleiste-Oilseed Crops 1999, 20, 511–520. (In Polish). Available online: https://bibliotekanauki.pl/articles/833415 (accessed on 19 December 2023).
  69. Wojtkowiak, K.; Stępień, A.; Pietrzak-Fiećko, R.; Warechowska, M. Effects of nitrogen fertilisation on the yield, micronutrient content and fatty acid profiles of winter wheat (Triticum aestivum L.) varieties. J Elem. 2018, 23, 483–495. [Google Scholar] [CrossRef]
  70. Alipatra, A. Response of Sunflower (Helianthus annuus L.) to Varied Levels of Fertilizer and Irrigation Management under New Alluvial Zone of West Bengal. Ph.D. Thesis, Bidhan Chandra Krishi Viswavidyalaya, West Bengal, India, 2017. [Google Scholar]
  71. Kaptan, M.A.; Koca, Y.O.; Canavar, Ö. Effect of NPK fertilization on mineral content and fatty acid compounds of corn seed. J. Adnan Menderes Univ. Agric. Fac. 2017, 14, 19–22. [Google Scholar] [CrossRef]
  72. Rathke, G.W.; Christen, O.; Diepenbrock, W. Effects of nitrogen source and rate on productivity and quality of winter oilseed rape (Brassica napus L.) grown in different crop rotations. Field Crops Res. 2005, 94, 103–113. [Google Scholar] [CrossRef]
  73. He, M.; Qin, C.X.; Wang, X.; Ding, N.Z. Plant unsaturated fatty acids: Biosynthesis and regulation. Front. Plant Sci. 2020, 11, 390. [Google Scholar] [CrossRef] [PubMed]
  74. Ardali, S.A. Effects of plant density and nitrogen rate on fatty acids profile of grain of amaranth (Amaranthus hypocondriacos L.). Int. J. Agric. Crop Sci. 2014, 7, 390–392. [Google Scholar]
  75. Ureta, C.; González, E.J.; Espinosa, A.; Trueba, A.; Piñeyro-Nelson, A.; Álvarez-Buylla, E.R. Maize yield in Mexico under climate change. Agric. Syst. 2020, 177, 102697. [Google Scholar] [CrossRef]
  76. Möllers, C.; Schierholt, A. Genetic variation of palmitate and oil content in a winter oilseed rape doubled haploid population segregating for oleate content. Crop Sci. 2002, 42, 379–384. [Google Scholar] [CrossRef]
  77. Załuszniewska, A.; Nogalska, A. The effect of meat and bone meal (MBM) on phosphorus (P) content and uptake by crops, and soil available p balance in a six-year field experiment. Sustainability 2022, 14, 2855. [Google Scholar] [CrossRef]
Figure 1. Content of fat, (a) average for year, (b) average for treatment, %. MBM—Meat and Bone Meal. Values followed by the same letters do not differ significantly in Tukey’s (HSD) test (p < 0.05).
Sustainability 16 00952 g001
Figure 2. Content of C16:0 (palmitic acid), (a) average for year, (b) average for treatment, %. MBM—Meat and Bone Meal. Values followed by the same letters do not differ significantly in Tukey’s (HSD) test (p < 0.05).
Sustainability 16 00952 g002
Figure 3. Content of C18:0 (stearic acid), (a) average for year, (b) average for treatment, %. MBM—Meat and Bone Meal. Values followed by the same letters do not differ significantly in Tukey’s (HSD) test (p < 0.05).
Sustainability 16 00952 g003
Figure 4. Sum of saturated fatty acids (SFA), (a) average for year, (b) average for treatment, %. MBM—Meat and Bone Meal. Values followed by the same letters do not differ significantly in Tukey’s (HSD) test (p < 0.05).
Sustainability 16 00952 g004
Figure 5. Content of C18:1 cis-9 (oleic acid), (a) average for year, (b) average for treatment, %. MBM—Meat and Bone Meal. Values followed by the same letters do not differ significantly in Tukey’s (HSD) test (p < 0.05).
Sustainability 16 00952 g005
Figure 6. Sum of monounsaturated fatty acids (∑ MUFA), (a) average for year, (b) average for treatment, %. * MBM—Meat and Bone Meal. Values followed by the same letters do not differ significantly in Tukey’s (HSD) test (p < 0.05).
Sustainability 16 00952 g006
Figure 7. Content of C18:2 (linoleic acid), (a) average for year, (b) average for treatment, %. MBM—Meat and Bone Meal. Values followed by the same letters do not differ significantly in Tukey’s (HSD) test (p < 0.05).
Sustainability 16 00952 g007
Figure 8. Content of C18:3 (linolenic acid), (a) average for year, (b) average for treatment, %. MBM—Meat and Bone Meal. Values followed by the same letters do not differ significantly in Tukey’s (HSD) test (p < 0.05).
Sustainability 16 00952 g008
Figure 9. Sum of polyunsaturated fatty acids (PUFA), (a) average for year, (b) average for treatment, %. MBM—Meat and Bone Meal. Values followed by the same letters do not differ significantly in Tukey’s (HSD) test (p < 0.05).
Sustainability 16 00952 g009
Figure 10. Ratio of monounsaturated (MUFA) and saturated (SFA) fatty acids (MUFA/SFA), (a) average for year, (b) average for treatment, %. MBM—Meat and Bone Meal. Values followed by the same letters do not differ significantly in Tukey’s (HSD) test (p < 0.05).
Sustainability 16 00952 g010
Figure 11. Ratio of polyunsaturated (PUFA) and saturated (SFA) fatty acids (PUFA/SFA), (a) average for year, (b) average for treatment, %. MBM—Meat and Bone Meal. Values followed by the same letters do not differ significantly in Tukey’s (HSD) test (p < 0.05).
Sustainability 16 00952 g011
Figure 12. Ratio of unsaturated (UFA) and saturated (SFA) fatty acids (UFA/SFA), (a) average for year, (b) average for treatment, %. MBM—Meat and Bone Meal. Values followed by the same letters do not differ significantly in Tukey’s (HSD) test (p < 0.05).
Sustainability 16 00952 g012
Figure 13. Correlation (Principal Component Analysis) of the treatment (fertilisation) and year on yield of fat, content of fat, saturated fatty acids (SFA), monounsaturated fatty acids (MUFA), polyunsaturated fatty acids (PUFA), and ratio of MUFA/SFA, PUFA/SFA, and UFA/SFA. The corn grain yields used to calculate the fat yield were taken from the authors’ earlier article, Stępień et al. [31].
Sustainability 16 00952 g013
Figure 14. Projection of variables and variants on the plane of the first two main components. WF—without fertilisation; MF—mineral fertilisation; MBM—Meat and Bone Meal.
Sustainability 16 00952 g014
Table 1. Design of the field experiment. The amount of macronutrients introduced to soil with fertilisers (mean of 2014–2017, kg ha−1).
TreatmentsCorganicNPK
MBM *Kmineral
Without fertilisation0.0----
Mineral fertilisation0.0133.079.6-83.1
MBM 1.0 t ha−1666.961.031.14.079.1
MBM 2.0 t ha−11333.8122.062.28.075.1
MBM 3.0 t ha−12000.7183.093.312.071.1
* MBM—Meat and Bone Meal.
Table 2. Analysis of variance (F values) for content of fat, saturated fatty acids (SFA), monounsaturated fatty acids (MUFA), polyunsaturated fatty acids (PUFA), and ratios of MUFA/SFA, PUFA/SFA, and UFA/SFA.
Source of VariationContent of Fat [%]Monounsaturated Fatty Acids (MUFA)
C16:1C17:1C18:1 cis-9C18:1 cis-11C20:1
Year105.58 *0.46 ns0.55 ns414.56 *11.54 *7.05 *363.72 *
Treatment3.29 *4.42 *0.15 ns316.32 *18.63 *9.82 *290.61 *
Year × Treatment3.85 *4.79 *1.42 ns19.90 *17.77 *2.78 *19.05 *
Saturated fatty acids (SFA)
Source of VariationC12:0C14:0C15:0C16:0C17:0C:18:0C22:0
Year73.30 *0.42 ns0.21 ns2253.19 *0.54 ns1170.36 *4.98 *1170.12 *
Treatment33.23 *0.62 ns2.41 ns71.55 *0.64 ns109.92 *13.90 *31.48 *
Year × Treatment3.16 *0.28 ns2.10 *174.21 *0.46 ns15.26 *13.33 *55.65 *
Polyunsaturated fatty acids (PUFA)Ratio
Source of VariationC18:2C18:3C20:2UFA/SFAMUFA/SFAPUFA/SFA
Year1374.04 *81.94 *16.35 *1073.04 *1775.14 *426.37 *1883.63 *
Treatment425.59 *6.76 *11.17 *341.77 *54.24 *143.50 *194.90 *
Year × Treatment20.65 *3.09 *6.28 *16.46 *61.48 *20.87 *58.29 *
* Significant at the 0.05 probability levels, ns not significant at the 0.05 probability level.
Table 3. Content of fat, interaction between the years and treatments, %.
YearWithout FertilisationMineral FertilisationMBM 1.0 t ha−1MBM 2.0 t ha−1MBM 3.0 t ha−1
20144.80 ± 0.082 b4.98 ± 0.050 ab4.90 ± 0.115 ab5.08 ± 0.050 ab5.10 ± 0.200 ab
20155.00 ± 0.163 ab4.73 ± 0.050 bc5.00 ± 0.141 ab4.93 ± 0.126 ab4.90 ± 0.115 ab
20164.33 ± 0.096 cd4.28 ± 0.171d4.10 ± 0.141d4.15 ± 0.208 d4.05 ± 0.129 d
20175.30 ± 0.200 a4.73 ± 0.206 bc4.83 ± 0.126 b4.93 ± 0.250 ab4.73 ± 0.330 bc
MBM—Meat and Bone Meal. Values followed by the same letters do not differ significantly in Tukey’s (HSD) test (p < 0.05).
Table 4. Content of C16:0 (palmitic acid), interaction between the years and treatments, %.
YearWithout FertilisationMineral FertilisationMBM 1.0 t ha−1MBM 2.0 t ha−1MBM 3.0 t ha−1
201413.42 ± 0.025 l13.22 ± 0.029 m13.31 ± 0.049 n13.91 ± 0.044 ij13.05 ± 0.039 o
201514.05 ± 0.026 gh14.39 ± 0.032 ab14.30 ± 0.036 bcd13.78 ± 0.029 k14.31 ± 0.035 bc
201614.21 ± 0.033 de14.07 ± 0.018 fg14.25 ± 0.026 cd14.45 ± 0.050 a14.14 ± 0.017 ef
201713.96 ± 0.072 hi13.83 ± 0.031 jk13.92 ± 0.034 i14.05 ± 0.019 gh13.89 ± 0.035 ij
MBM—Meat and Bone Meal. Values followed by the same letters do not differ significantly in Tukey’s (HSD) test (p < 0.05).
Table 5. Content of C18:0 (stearic acid), interaction between the years and treatments, %.
YearWithout FertilisationMineral FertilisationMBM 1.0 t ha−1MBM 2.0 t ha−1MBM 3.0 t ha−1
20142.68 ± 0.059 ef2.63 ± 0.033 fgh2.70 ± 0.022 e2.61 ± 0.024 ghi2.64 ± 0.022 efg
20153.16 ± 0.026a2.97 ± 0.034 c3.05 ± 0.018 b2.80 ± 0.022 d2.85 ± 0.037 d
20162.58 ± 0.022 ghij2.52 ± 0.015 jk2.58 ± 0.018 ghij2.48 ± 0.028 kl2.47 ± 0.026 kl
20172.58 ± 0.022 ghij2.54 ± 0.022 ijk2.56 ± 0.018 hij2.48 ± 0.015 kl2.45 ± 0.026 l
MBM—Meat and Bone Meal. Values followed by the same letters do not differ significantly in Tukey’s (HSD) test (p < 0.05).
Table 6. Content of C18:1 cis-9 (oleic acid), interaction between the years and treatments, %.
YearWithout FertilisationMineral FertilisationMBM 1.0 t ha−1MBM 2.0 t ha−1MBM 3.0 t ha−1
201426.67 ± 0.067 cd26.14 ± 0.550 ef26.24 ± 0.057 e25.24 ± 0.048 i25.80 ± 0.105 fgh
201527.56 ± 0.026 a26.35 ± 0.045 de26.89 ± 0.028 bc25.14 ± 0.044 i25.77 ± 0.049 gh
201627.07 ± 0.024 b26.18 ± 0.019 e26.71 ± 0.029 c26.11 ± 0.014 efg25.72 ± 0.022 h
201725.80 ± 0.034 fgh25.04 ± 0.120 ij25.14 ±0.073 i24.74 ± 0.045 jk24.58 ± 0.022 k
MBM—Meat and Bone Meal. Values followed by the same letters do not differ significantly in Tukey’s (HSD) test (p < 0.05).
Table 7. Content of C18:2 (linoleic acid), interaction between the years and treatments, %.
YearWithout FertilisationMineral FertilisationMBM 1.0 t ha−1MBM 2.0 t ha−1MBM 3.0 t ha−1
201454.27 ± 0.045 fg55.01 ± 0.514 cd54.80 ±0.041 de55.18 ±0.045 c55.65 ± 0.060 a
201551.91 ± 0.035 m53.28 ± 0.026 j52.50 ± 0.028 l54.13 ± 0.027 gh53.80 ± 0.042 i
201652.88 ± 0.022 k54.15 ± 0.028 g53.34 ± 0.057 j53.83 ± 0.035 hi54.49 ± 0.059 ef
201754.38 ± 0.066 fg55.30 ± 0.038 bc55.16 ± 0.018c55.57 ± 0.065ab55.87 ± 0.013a
MBM—Meat and Bone Meal. Values followed by the same letters do not differ significantly in Tukey’s (HSD) test (p < 0.05).
Table 8. Content of C18:3 (linolenic acid), interaction between the years and treatments, %.
YearWithout FertilisationMineral FertilisationMBM 1.0 t ha−1MBM 2.0 t ha−1MBM 3.0 t ha−1
20141.38 ± 0.029 def1.34 ± 0.018 f1.35 ± 0.048 ef1.45 ± 0.063 bcd1.32 ± 0.040 f
20151.49 ± 0.033 abc1.49 ± 0.029 abc1.51 ± 0.017 abc1.55 ± 0.001 a1.54 ± 0.022 a
20161.49 ± 0.071abc1.43 ± 0.022 cde1.50 ± 0.030 abc1.47 ± 0.018 abc1.47 ± 0.013 abcd
20171.52 ± 0.022 ab1.47 ± 0.018 abc1.53 ± 0.030 ab1.50 ± 0.018 abc1.50 ± 0.041 abc
MBM—Meat and Bone Meal. Values followed by the same letters do not differ significantly in Tukey’s (HSD) test (p < 0.05).
Disclaimer/Publisher’s Note: The statements, opinions and data contained in all publications are solely those of the individual author(s) and contributor(s) and not of MDPI and/or the editor(s). MDPI and/or the editor(s) disclaim responsibility for any injury to people or property resulting from any ideas, methods, instructions or products referred to in the content.

