1. Introduction
Modern Western societies have built gender relations into all aspects of everyday life, including urban infrastructure, impacting 82.7% of the US population and 56.2% of the global population who live in cities and metropolitan areas [
1]. Almost irrespective of geographic location and culture, women live in a world of infrastructure designed and constructed by men. By focusing its resources on supporting paid labor, public transportation provides an excellent example of how infrastructure ignores the gendered work of care and subsistence contributions provided chiefly by women. Infrastructure projects, therefore, yield their most significant benefits to men, who build and use them at higher rates than women.
While these gender biases are ubiquitous and cut across cultures and regions, this paper focuses on the US, one of the most urbanized countries in the world [
2]. Its infrastructure-related workforce also reflects persistent gender biases. For example, 95.8% of the US construction workforce and 91.9% of truck drivers are male [
3]. Social infrastructure projects, such as those related to housing, education, and childcare, tend to accrue benefits mainly for women and children, even though these projects enhance the quality of life of citizens and support the smooth functioning of the US economy. In contrast, women suffered disproportionate job losses during the COVID-19 pandemic, yet the social infrastructure portion of a US bill intended to strengthen both physical and social infrastructure failed to pass congressional approval, while the physical infrastructure portion passed in 2020.
These examples illustrate the value discrepancies between infrastructure projects supporting predominantly male professions and roles versus those supporting predominantly female ones. This gender-blind infrastructure funding and design present intersectional barriers to women’s access to education, healthcare, and better jobs. Policymakers fail to utilize the available tools to increase gender equity and inclusion through practical infrastructure improvements. The disproportionately large representation of women across supporting professions and roles, thus, broadly reflects the unequal support for social versus physical infrastructure projects.
Developing gender-responsive infrastructure is a strategy for closing the persistent gender gap in cities. In doing so, urban planners can improve and protect women’s livelihoods while also invigorating urban economies. Scholars have long recognized the benefits of strategies that support the livelihood and work of women. Over a century ago, the feminist institutional economics of Thorsten Veblen brought the implicit and explicit gender biases into focus that discriminated against women’s work and argued that economies perform sub-optimally if they fail to support the full participation of women in the labor force [
4]. Progress toward Veblen’s vision, however, has been disappointingly slow.
The concept of ‘sustaining production’, advanced more than two decades ago [
5,
6], proposes a model of economic production that includes care work as a regenerative “sink” service. Patterned after the sink services provided by nature, the model argues that all productive activity depends not only on the availability of resources but also on the availability of sinks as the essential basis for maintaining future productivity. The social equivalent of environmental sink services is the primarily unpaid care services necessary to process the waste and by-products of the production process through absorbing, assimilating, buffering, restoring, and reproducing. It is in this space that women’s unpaid care work lives. A sustainable economy requires bolstering care work and supporting it through physical infrastructure that recognizes its specific requirements. Transportation infrastructure is one example of physical infrastructure that has the potential to support or undermine care work.
This paper will first explore the gendered nature of care and review examples of how the hidden gendered biases of ‘hard’ infrastructure expenditures further disadvantage women and disproportionately benefit men. Using a case study approach, the researchers then analyze Washington, DC’s public transportation infrastructure, specifically the Washington Metropolitan Area Transit Authority’s (WMATA) Metrobus system. The researchers chose this example because of the system’s location in the national capital, where the researchers’ home institution also resides. The analysis of the case study materials illustrates the gender biases against care evident in the public transportation infrastructure of Washington, DC. By analyzing the hidden biases of physical infrastructure investments, the researchers lay bare their negative implications for women and children and identify potential intervention points. The paper concludes by identifying strategies that lend themselves to targeted improvements in the public transportation infrastructure of Washington, DC, and, by extension, of other cities.
2. Providing Care: A Review of the Gendered Nature of Care and Care Infrastructure
The social and economic benefits stemming from women’s economic empowerment are well documented across nations [
7,
8]. They include more stable economic conditions, lower birth rates, and increased quality of life. Nevertheless, the full participation of women in economic life continues to be a distant goal, even though the percentage of American women’s labor force participation has steadily increased from 36% in 1970 to 56.2% in 2020 [
9]. Notwithstanding consistent wage disparities, which have changed little over the past 20 years, a persistent barrier to attaining true gender equality is the gender bias innate in policies intended to support economic activity [
9].
Women made up 46.7% of the US civilian workforce in 2022 while shouldering most of the care work in their homes [
10]. The “time use survey” is a commonly used tool for studying how people spend their time. In the United States, the American Time Use Survey (ATUS) measures the amount of time people spend doing various activities, such as paid work, childcare, volunteering, and socializing. ATUS is sponsored by the Bureau of Labor Statistics and conducted by the US Census Bureau, which has fielded the survey annually since 2003. There are several findings from the 2022 survey [
11]. Women reported spending more hours per day caring for and helping household children than men (0.48 vs. 0.23). More specifically, women with children under 18 reported spending 1.74 h per day caring for children as a primary activity compared to 0.90 h for men. These tasks include physical care, education-related activities, reading, talking, playing, attending events, and care-related travel. When the youngest child in the household is between age 6 and 17 years old, women reported spending 1.06 h per day caregiving, while men reported spending 0.55 h. In homes with children under six years old, women reported spending 2.68 h per day on caregiving, while men reported spending 1.45 h. Regardless of the children’s age, women spent around two-times more time per day caring for household children. When no children under 18 years old are present in the home, women still spend more time than men performing household activities (2.89 vs. 2.13 h). Other studies corroborate these biases toward women who continue to provide the bulk of unpaid household and care services, regardless of their participation in the workforce [
12,
13,
14,
15,
16,
17]. There is ample evidence that the value of this unpaid labor, estimated at 16 billion hours daily, is enormous [
12]. Oxfam estimated the global value of this work to be at least USD 10.8 trillion annually or 11% of the USD 96.1 trillion global GDP in 2021 [
16,
18]. Using the replacement cost approach to estimating the value of care services in twenty-seven OECD countries, Elson [
15] reported that the monetary value of unpaid work in the US was 18% of national GDP. In 2021, that was the equivalent of USD 4.14 trillion [
18].
Gender inequality is an additional barrier to productivity and economic growth. Amartya Sen [
19], the Nobel Prize in Economics winner, wrote of the need to focus on women’s agency (rather than well-being) to empower women and improve economic output. The Grameen Bank’s microcredit programs for women in poor, rural Bangladeshi communities have allowed women to start small businesses by bypassing discriminatory creditors and lowering fertility rates and infant mortality [
19]. While reducing gender inequality is a noble goal, it is also better for a country’s economic growth. Klasen and Lamanna’s [
20] study of the Middle East, North Africa, East Asia, and South Asia concluded that gender gaps in education and labor force participation negatively impact economic growth.
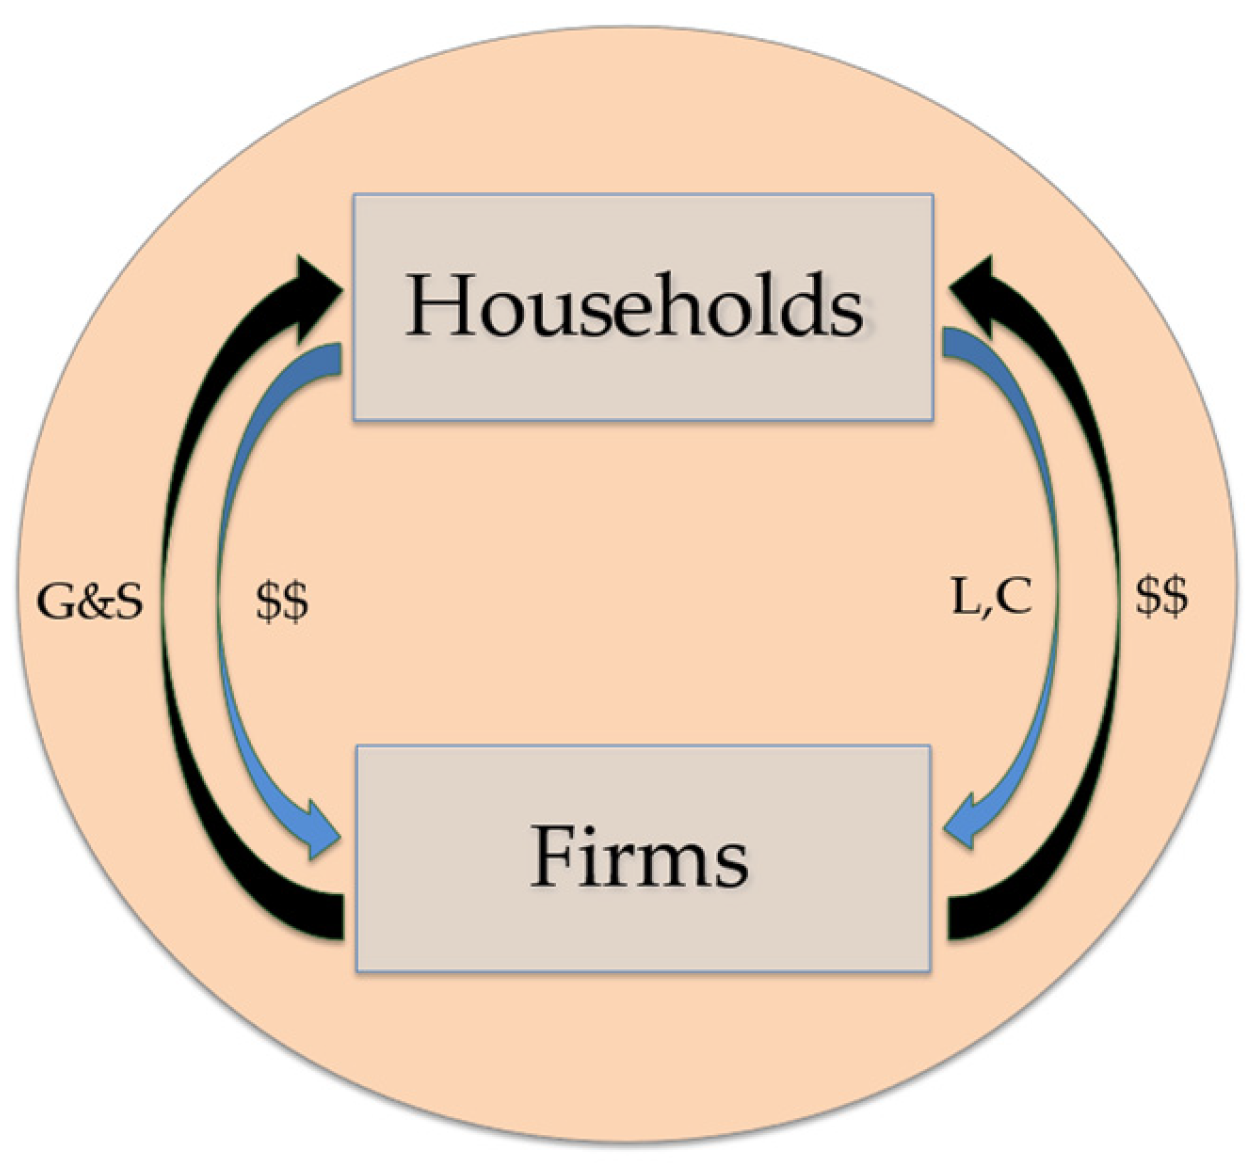
Neoclassical economic theory, the prevailing economic framework in the US, supports these persistent gender biases. It asserts that firms (“producers”) and households (“consumers”) engage with each other in a closed-loop circular flow. Households provide inputs (mostly labor) and money to the firms, who, in exchange, provide goods and wages to the households [
21] (see
Figure 1). While helpful in characterizing some rudimentary aspects of a market economy, this theory fails to account for several critical components, such as the environment and other aspects with limited or no market value [
21,
22].
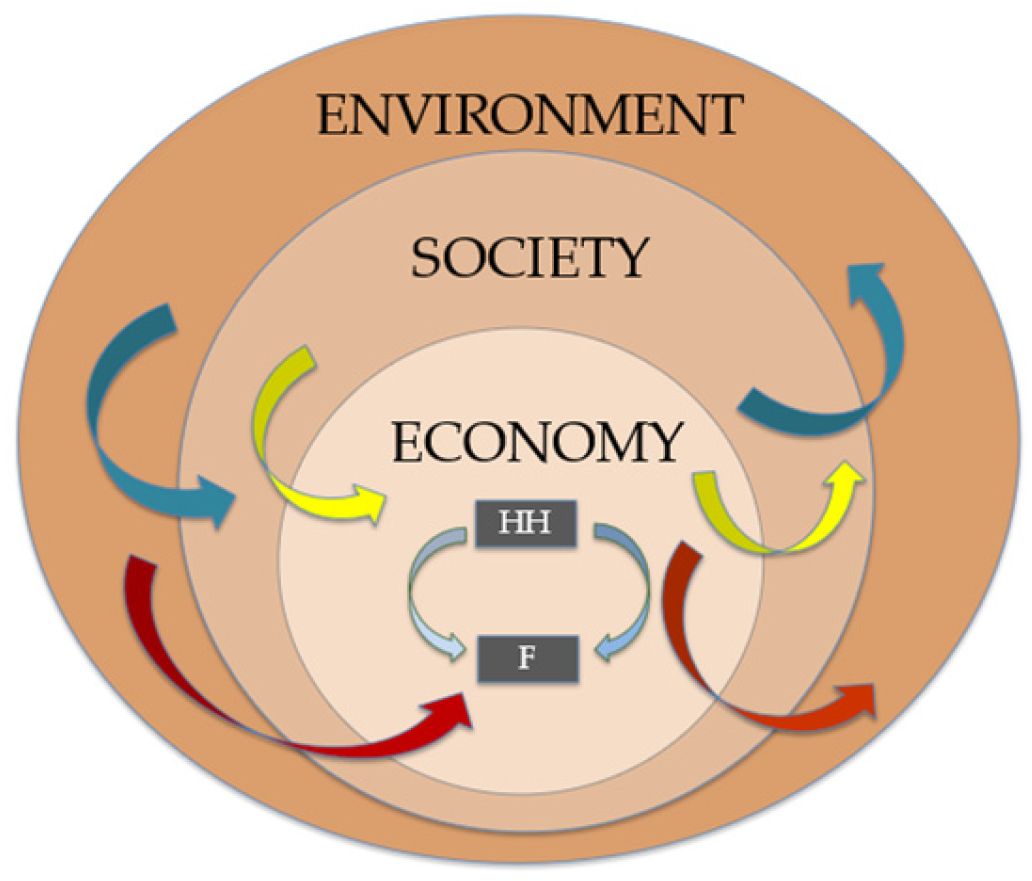
Ecological economics is a multidisciplinary field of study founded, in part, by Robert Costanza in the late 1980s that began to address the relationships between ecosystems and economic systems [
23]. Scholars have defined ecosystem services as the ecological characteristics, functions, or processes that directly or indirectly contribute to human well-being, including fresh water supply (provisioning), climate regulation (regulating), nutrient cycling (supporting), and recreation (cultural) [
6,
24]. Economists have developed multiple valuation methods to operationalize the concepts to account for ecosystem services, such as replacement cost and hedonistic pricing. While the ecosystem services concept is helpful, it does not emphasize the social reproduction and infrastructure needed to support human well-being, with the possible exception of cultural ecosystem services.
Feminist scholars, including feminist ecological economists, have added the missing social dimensions to the analysis to address the gap in economic theory further beyond its missing environmental considerations [
6,
25]. Care services include the web of services provided in households, communities, ecosystems, and physical/spatial contexts, summarized as rest, restoration, and recreation [
5]. In the sustaining production concept [
26], a quadrant is dedicated to “sink services”. Scholars can more readily understand these services as an integral part of environmental systems where they provide absorptive, buffering, and ameliorating capacities associated with supportive ecosystem services. However, sink services are equally important for social systems where mostly unpaid care services provide them, which process the end and by-products of the production process through absorbing, assimilating, buffering, and restoring physical, mental, and emotional health. In other words, like the oceans and the earth’s atmosphere, women process, absorb, buffer, and accumulate social waste and emissions from producing goods and services [
26]. The work of the sinks allows for the rejuvenation, regeneration, and reproduction of inputs (i.e., people and things) that turn back into goods and services. When sinks reach their limits, they can no longer perform this service to the same degree as before, negatively impacting the economy’s productivity. Therefore, scholars developing new sustainable economic models must consider all sinks, both social and environmental (see
Figure 2).
The critical nature of care services is vital to understanding who typically performs them in households and communities. Since care services are primarily unpaid, they do not have a standard market value. A ubiquitously popular measurement, Gross Domestic Product (GDP), estimates the value of final goods and services produced in an economy. GDP, however, does not quantify the value of care services in an economy, even though unpaid work heftily supports the work provided in visible markets.
To address the persistent biases against the invisible work of women, Folbre [
27] designed four categories to increase understanding of women’s work as it relates to the market: (1) unpaid services, (2) unpaid work that helps meet subsistence needs, (3) informal market work, and (4) paid employment. Elson [
15] proposed several ways to compensate women for the first and second categories to close the gender gap in those categories. They include (1) wages for housework, (2) inclusion in national accounting systems, (3) cash payments, and (4) pension credits. Elson concludes that the path to equity must include making men’s working lives more like women’s, not vice versa, which requires a fundamental redistribution of this work and corresponding changes to the structure of the US. That path must, by necessity, include infrastructure.
Outside of the home, our society values and remunerates “care work,” i.e., occupations that require a face-to-face service that develops the human capabilities of the recipient, at lower rates than other types of work held in greater esteem [
28]. This differential is called the “wage penalty.” England et al. found that men and women working in caring occupations received 5–6% less in net wages than those in non-caring occupations, regardless of education or training. Moreover, they found that most of those involved in care work were women, amplifying the wage penalty for women, particularly in childcare, where women experience a 41% wage penalty [
28].
The United Nations developed the Millennium Development Goals (MDGs) and the Sustainable Development Goals (SDGs) as alternate development measures [
29]. The SDGs, in particular, are intended to track sustainable progress in light of climate change and include a goal (SDG 3) for social sustainability, where countries shall promote the well-being of their citizenry, regardless of class, gender, ethnic origin, religion, or race [
30]. Waring [
31] and Folbre [
27] discuss other approaches for measuring care services and gender equity, including Genuine Progress Indicators (GPIs), the Gender-related Development Index (GDI), the Gender Empowerment Measure (GEM), and the Gender Equity Index (GEI), among others. Waring [
31] also argued that the United Nations System of National Accounts (UNSNA), an accounting system launched in 1953 to track member nation development, lacked information about significant work performed for household consumption or in the informal economy. This omission rendered unpaid care work invisible, thereby disadvantaging women.
On the other hand, GDP captures most of the work carried out by men. The OECD launched the Social Institutions and Gender Index (SIGI) in 2009 to measure discrimination against women in social institutions across countries. SIGI has four dimensions: (1) discrimination in the family, (2) restricted physical integrity, (3) restricted access to productive and financial resources, and (4) restricted civil liberties [
32].
Gender biases are not only evident in the value (or valuelessness) of the work provided by women. They are also visible in the infrastructure, which is essential to the functioning of any economy. Gender disparities in infrastructure investments mirror the biases evident in gender norms and expectations. These biases suggest that female attributes are emotionality, weakness, softness, and passivity, while male attributes include rationality, strength, hardness, and being active [
33]. These same biases are evident in the so-called ‘soft’ infrastructure portion of a bill first introduced in the US Congress to ameliorate the disruptions caused by the COVID-19 pandemic. The portion of the bill that focused on childcare, family leave, and other care-oriented infrastructure programs benefitting women and families failed to come up for a vote in the United States Senate. Examples include historic investments in childcare options for families, support for universal pre-kindergarten for all 3- and 4-year-old children, and permanent refundability of the US Child Tax Credit (up to USD 300 per month per child) [
34]. In contrast, the so-called ‘hard’ infrastructure bill, emphasizing physical projects, like roads, bridges, and other building trades-focused initiatives, quickly found bipartisan support.
While this dichotomy undoubtedly reflects entrenched gender biases, their less visible implications are more insidious. Such hidden biases are, for example, reflected in the ‘hard’ infrastructure bill itself and, more generally, in the physical infrastructure expenditures of municipalities and states.
3. Infrastructure and Care
Broadly defined, the term infrastructure refers to all primary inputs and requirements for the proper functioning of the economy [
35]. There is a widely held misconception that infrastructure is gender-neutral, but women and men do not benefit equally from these public investments because their social roles, economic status, and preferences shape their needs and infrastructure use [
36]. Gender-blind infrastructure fails to consider these different life circumstances and needs, limiting women and girls’ ability to access essential services, such as healthcare and education [
37]. Seen this way, gender bias in infrastructure limits women’s agency to improve their lives and is a barrier to productivity and economic growth [
19]. Women comprise only 18% of the American infrastructure workforce and 24.8% of the transportation and utilities workforce [
3,
38]. Because men almost exclusively plan, design, and implement infrastructure, women have little or no voice in investment decisions that affect their daily lives, economic opportunities, and future prosperity. Since the early 1990s, however, female city planners in Vienna, Austria, have designed and implemented projects that benefit men and women equally, including simple fixes such as extending crosswalk times to accommodate caregivers and others needing extra time to pass over city streets [
39]. They also helped to establish the Frauen-Werk-Stadt (Women-Work-City), an apartment complex that aimed to reduce caregiving burdens through thoughtful design elements, such as on-site kindergartens, pharmacies, and medical offices, all near public transportation. Increasing women’s participation in infrastructure policy and decision making is critical to expanding equity [
36,
37].
Infrastructure discussions usually refer to two commonly used categories: hard (or physical) and soft (or social). Hard infrastructure refers to the large physical networks needed to promote economic activity and maintain a functioning nation [
40]. Scholars and practitioners divide it into five sectors: telecommunications, transport, energy, water and sanitation, and solid waste [
40]. Physical infrastructure is sometimes also referred to as economic infrastructure due to a belief that it alone powers and sustains the economy. Soft infrastructure generally refers to services that support the supply of skilled and healthy personnel to manage and operate other resources [
41]. Accordingly, soft infrastructure is more expansive, including educational institutions, healthcare, childcare, social services, housing, and security. It can also include public amenities, such as libraries, parks, playgrounds, sidewalks, and civic organizations, where people can gather, play, pray, and hold markets, all of which build communities and hold them together [
42]. Moreover, social infrastructure enhances the populace’s economic, political, and social empowerment, resulting in positive effects on poverty alleviation and the efficient use of national resources [
40]. Though opposites by design, these categories are not mutually exclusive, contain overlapping notions, and have many dependencies, such as urban transport (hard) and care provision (soft).
In this misleading binary, policymakers and planners perceive hard infrastructure to support male-gendered work (or production). Conversely, we perceive soft infrastructure to support female-gendered care (or reproduction). Some scholars argue that, like Adam provided the means for Eve’s creation, hard infrastructure provides the means for social infrastructure services delivery [
43]. Others argue that care, a type of social infrastructure, is a prerequisite for production, here, sustaining the workers (and future workers) required to produce physical infrastructure [
26]. For these reasons, the hard/soft, physical/social binary obscures the reality that infrastructures of all types serve multiple functions in the economy.
If there is no care, there is no productivity. The persistence of gendered notions of care versus productivity is, therefore, surprising. At the same time, it reflects deeply gendered expectations of men joining the workforce and women providing care in households and communities, regardless of whether they join the workforce or not [
44,
45]. These gendered expectations were evident during the COVID-19 pandemic. The dual pressures of work and care contributed to a gendered exodus of women from the workforce during the pandemic [
46]. Examining how care services can be strengthened and more adequately supported, regardless of who provides them, will become necessary to reverse this persistent trend.
During the COVID-19 pandemic, there was much talk about “essential workers”, those who continued to provide paid labor in those sectors that were deemed critical to economic functioning (e.g., healthcare workers, educators, and grocery store clerks) [
47]. Approximately 50% of those essential workers who continued to work in face-to-face jobs during the pandemic were care workers, a mostly female workforce. Many of these care workers were at serious risk for COVID-19 infection while, at the same time, receiving less pay than other essential workers with comparable personal and work characteristics, such as those working in law enforcement, transportation, and retail jobs [
48].
Female job loss was another notable economic feature of the COVID-19 pandemic, hence the nickname “Shecession”. Heggeness [
46] found that mothers in early closure states were about 69% more likely than mothers in late closure states to have a job but not be working. For those who remained on the job, Heggeness found that women increased their hours. There was no difference for non-mothers and all men. Dias et al. [
49] described the “fatherhood premium”, where fathers experienced lower layoff rates than mothers, non-mothers, and non-fathers, even after controlling for race, age, education, and individual fixed effects. Black and Hispanic mothers are more likely than white women to be the primary or co-breadwinner in their families and work in care services [
50]. As a result, the impact of job loss in Black and Brown populations was especially devastating. In response to the pandemic, many women reduced their work hours to provide care services [
51]. Power [
52] argues that the COVID-19 pandemic increased the care burden, putting additional stress on families, exacerbating inequalities, and reducing female work productivity, negatively impacting many women’s lifetime-earnings potential. Sarrasanti et al. [
13] describe the increased burden of unpaid childcare on women as formal and informal childcare supplies became less available during the pandemic. Boesch and Hamm [
50] opined that the increased time spent in caregiving may force some women to reduce their work hours further or shift to multiple part-time jobs, thereby reducing their earning potential.
The COVID-19 pandemic exacerbated pre-existing gender inequities in the US. As Diane Elson [
53] so eloquently wrote, “In a crisis, gender norms may be reinforced; or they may decompose, with individual men taking on roles normally associated with women, and vice versa; or they may be transformed through deliberative collective action, by civil society groups, or by governments”. This concept is valid for the current moment as scholars, think tanks, and government bureaucrats generate different ideas for the American recovery [
54,
55,
56]. Elson’s analysis would suggest that the US government must make significant short-term and long-term investments in social infrastructure to succeed in this effort, especially in light of the persistent biases that became so starkly evident during the COVID pandemic.
One clear example is urban transit systems, where residents use buses and trains (hard infrastructure) to support employment, care, education, and leisure activities (soft infrastructure). Governments tend to invest more heavily in physical infrastructure than social infrastructure. Some global infrastructure reports do not distinguish between the two types, assuming only one is physical. For example, searching for “infrastructure” on the World Bank Open Data website yields only one analysis of indicators, all of which are measures of physical infrastructure services [
57]. They include air transport departures worldwide, electric power consumption (kWh per capita), and fixed telephone subscriptions (per 100 people). In 2019, the World Bank’s Office of the Chief Economist, Sustainable Development Practice Group, published a report titled “Hitting the Trillion Mark: A Look at How Much Countries Are Spending on Infrastructure” [
58]. They report that economists must rely partly on Gross Fixed Capital Formation (GFCF) to estimate country-level public spending on infrastructure. The authors lament its limited utility, however, since, as they say, “[it] includes sectors other than infrastructure (health, education, mining)” [
58].
Reporting country-level physical infrastructure spending as a percentage of GDP is common. The People’s Republic of China made the most significant relative investments at 5.8% of GDP (USD 85.2 B) in 2020. However, in the US News Best Countries Report [
59], China was ranked 11th for the most well-developed infrastructure. Sweden, highly regarded for its progressive social support, spent 1.06% of GDP (USD 5.74 B) on physical infrastructure in 2020 and was ranked ninth by US News. The US, ranked third by US News, spent 0.55% of GDP in 2019 (USD 11.5 B), 5.25% less than China and 4.74% less than Sweden as a percentage of GDP. Converted into USD, China spent USD 85.2 B (USD 60.4/per capita), Sweden spent USD 5.74 B (USD 483/per capita), and the US spent USD 11.5 B (USD 35/per capita) (see
Table 1). US spending on physical infrastructure declined precipitously in the early 1970s [
60]. America’s 20th-century investments, such as bridges, damns, roads, trains, and waterways, have not been well maintained, resulting in threats to human safety and losses in economic productivity [
61].
US investments in social infrastructure rank lower than those in physical infrastructure. In November 2021, the US House of Representatives narrowly passed the USD 1.85 trillion Build Back Better Act (BBBA), a 10-year budget reconciliation package serving as the cornerstone of the Biden Administration’s infrastructure policy. BBBA began as a USD 1 trillion bipartisan infrastructure bill in March 2021, a year after the 2020 COVID-19 lockdowns began. The House Act contained substantial funding for social infrastructure: universal, free preschool for all 3- and 4-year-old children, increased tax credits and paid leave for families, improved public home care coverage for the aging and people with disabilities, and health insurance subsidies [
62]. The historic act also contained funding for affordable housing, tax credits for low-wage workers, and investments in higher education, rural communities, and the environment. The bill also had much-anticipated funding to strengthen, diversify, and expand the healthcare workforce. Health Profession Opportunity Grants, one of the named priorities, support education and training for low-income individuals in high-demand areas of the healthcare field. Since women experience higher levels of poverty than men in the US, this legislation would likely have benefitted them and their families [
63].
The bill’s emphasis on social infrastructure and the family was no coincidence. Though the COVID-19 pandemic did not create gender inequities in the US, it did exacerbate existing ones. Sarrasanti et al. [
13] describe the increased burden of unpaid childcare on women as formal and informal childcare providers became less available during the pandemic. Many women who worked from home acted as homeschool teachers for their children while performing other care activities. Despite limited research on the topic, the authors concluded that women shouldered an increased burden of care work during other pandemics and outbreaks, including Ebola. Power [
52] agreed that the COVID-19 pandemic increased the unpaid care burden, putting additional stress on families, exacerbating inequalities, and reducing female work productivity, negatively impacting many women’s lifetime-earnings potential.
The Build Back Better Act never became law. After months of deliberation over the bill in the Senate, a conservative Democratic male senator from a formerly coal-rich state withheld his vote in late 2021. In his statement, Senator Joe Manchin [
64] expressed his dislike of the BBBA’s extraordinary price tag and its push for cleaner energy. Manchin explained he voted against the bill because his Washington colleagues were “determined to dramatically reshape our society in a way that leaves our country even more vulnerable to the threats we face”. He was not the only American lawmaker opposed to reducing women’s unpaid care burden. The Senate attempted to make the legislation more palatable by stripping out social provisions, such as universal preschool and the child tax credit, but ultimately failed to pass it.
Congress had more success finding common ground with the Infrastructure Investment and Jobs Act, which focused on physical infrastructure. Passed into law in November 2021 as BBBA negotiations continued, the bill allocated USD 550 billion over five years for roads, bridges, rails, airports, high-speed internet (“broadband”), water, clean energy, and power grids [
65]. The administration also boasted that it would create “good-paying, union jobs”. What went unsaid, however, was that those jobs would primarily be in construction and fabrication, overwhelmingly the domain of men [
66]. Finally, the bill included USD 89.9 billion for public transit modernization, the most significant federal investment in public transit in history. More and better public transit options would have been good for women and communities of color, who rely on urban transit more than other groups, but it did not come to pass.
5. Materials and Methods
Our study period began in December 2017, when two DC parents launched an online petition asking WMATA to allow open strollers on Metrobuses during off-peak hours if and when the ADA-required wheelchair space was vacant [
81]. In a television interview shortly after the petition went viral, one of the petitioners stated, “I attempted to get on the bus while my child was still in the stroller, and I was asked to fold up the stroller. So, this meant I had to bring out my child, get all the belongings I had underneath the stroller, fold up a stroller and carry a kid, a stroller and accessories” [
82]. When the television reporter contacted WMATA for comment, the agency stated that it was not considering changing the policy due to the bus configuration and claimed that open strollers would block the narrow aisles, posing a safety hazard and delaying bus onboarding and offboarding.
In 2018, a WMATA insider leaked an internal report to the Washington Post, “Stabilizing and Growing Metro Ridership” [
83]. In it, staff documented historical ridership trends within WMATA and sister transit agencies across the country, most of which also experienced reductions in ridership. The report’s core was the Metro Ridership Action Plan, which called for growing and stabilizing bus and rail ridership by improving service quality and providing a seamless customer experience through various objectives, goals, and actions. For the objective titled “Improve customer interaction through all steps on the journey”, WMATA staff set a goal to adopt customer-friendly policies for parents and bicyclists. Their first recommended action was to allow children in strollers on Metrobus since it was a cost-free way to encourage more families to travel by Metrobus. By then, the DC government-run Circulator bus system, which focuses on simplifying tourist travel through the city, had allowed open stroller boarding for 13 years, as had Chicago, Boston, Seattle, San Francisco, and Houston [
84]. WMATA piloted an unpublicized open stroller exception systemwide for three years between early 2020 and 2023.
WMATA’s open stroller policy evolved over five years in 2 distinct phases. The study period begins with the stroller petition published in December 2017 and ends with the final policy change in March 2023 [
81]. During the first phase (December 2017 to March 2020), WMATA identified, formulated, and implemented an open stroller pilot on Metrobuses. During the second phase (March 2020 to March 2023), WMATA continued running the pilot and then permanently changed the stroller policy. The study period ends in March 2023, when the recently hired General Manager, Randy Clarke, publicly announced a new open stroller policy on buses [
79]. Metrobus held a short kickoff event one day shy of International Women’s Day on 7 March 2023.
Using Ostrom’s [
85] framework for institutional analysis, this analysis examined the barriers and drivers present in WMATA’s identification, formulation, implementation, and evaluation of the open stroller policy pilot (action situation). The researchers collected and analyzed public files, including by-laws, meeting agendas, minutes, recordings, transcripts, and work products, from December 2017 to March 2023, to identify the discourse’s themes and individuals (actors). We also interviewed stakeholders mentioned in the public record to account for gaps and confirm themes in the public information.
Per WMATA by-laws, the Board, Riders Advisory Council (RAC), Accessibility Advisory Committee (AAC), and its two subcommittees must produce publicly available agendas before each monthly meeting and require they keep meeting minutes. The by-laws also require the RAC and AAC to develop and submit monthly reports and annual work plans to the Board. Finally, the groups must conduct all meetings per Robert’s Rules of Order and be open to the public with dedicated time for public comment. The five groups held 292 of 295 (98.9%) scheduled meetings during the study period. WMATA’s Board of Directors did not meet on 26 March 2020, and the Riders Advisory Council did not meet on April 1 or May 6, 2020, presumably due to the emerging COVID-19 pandemic.
Our analysis of documents from WMATA’s public-facing website, wmata.com, between December 2017 and March 2023 includes readily available meeting agendas and minutes. The researchers searched the documents using the terms stroller, baby carriage, baby buggy, and S.U.V. (i.e., sports utility vehicle, a nickname for large strollers used in pilot discussions). Where search terms appeared in either document, the researchers downloaded available meeting recordings and transcribed them using Otter.ai. Once again, the research team used our search terms to locate segments relevant to the pilot and coded them using Dedoose [
86] to identify themes. In our document review, they identified 20 key informants. Two (2) additional key informants were identified from those subjects interviewed. Thus, 19 key informants were known or assumed to be current (13) or former (6) WMATA employees and affiliates. Eight (40%) of the key informants the researchers contacted responded to the interview request, and six (30%) consented. We conducted interviews between March and April 2023.
7. Discussion
Sanchez de Madariaga’s mobility of care framework provided the impetus for a close examination of a local challenge facing caregivers who use or want to use buses [
70,
98]. Our case study used an innovative approach to support our hypothesis that physical/hard infrastructure is biased toward the needs of caregivers and the mobility of care. We did this by performing a secondary ethnographic analysis of meeting artifacts from the Washington Area Metropolitan Transit Authority’s main decision-making and advisory group monthly meetings in the US capital. Our methodology included identifying and analyzing the 292 scheduled meetings over 64 months. We also verified and developed our document analysis through key stakeholder interviews. The researchers believe that this study is applicable to other metropolitan regions throughout the world as it provides a replicable model for a qualitative policy analysis that can support stakeholder education and engagement. The authors expect that this could also form the basis for increasing the number of qualitative studies of other systems and the dedicated resources to accomplish those goals. These analyses can potentially extend the reach of future gender-responsive infrastructure projects that support caregiving and, by extension, the economies of urban geographies.
In examining the themes and patterns among select WMATA stakeholders, we identified considerable resistance to a staff-led effort to increase system ridership by allowing open strollers on Metrobuses. An initial review provided data on which meetings had relevant content regarding the open stroller pilot for a thematic analysis. To gain insights that may have been lacking from the public record, we requested interviews from relevant stakeholders inside and outside of WMATA. The six interviews provided invaluable context and nuance that were essential for gaining a well-rounded view of the open stroller policymaking process.
In recent years, several other American transit systems have taken steps to address gender biases and increase equity. WMATA’s most public effort in this regard was to update Metrobus’ stroller policy in 2023 to accommodate and increase ridership among families and caregivers. Per WMATA Metro General Manager and C.E.O. Randy Clarke, the policy change was a way “to make sure the bus is really working and working for everyone” [
99]. He added, “Metro is committed to making transit accessible and convenient for everyone, and that includes those traveling with young children. This family-friendly initiative relieves a hardship many parents told us they face when riding Metrobus, and we hope it encourages more families to choose Metro” [
100]. WMATA now has the opportunity to add informational signage on buses and develop educational materials so that the public, including over 20 million annual tourists, can take advantage of this new policy.
7.1. Resolutions and Recommendations to Address Gender Biases in Public Transportation
In the summer of 2023, WMATA announced a plan to implement courtesy (i.e., on-demand) stops on Metrobuses to increase customer and bus operator safety [
100]. In a press release, the agency stated that customers could request courtesy stops between 9:00 p.m. and 5 a.m. WMATA added that requests were subject to the bus operator’s assessment that the location was safe to stop. This change is part of WMATA’s Better Bus initiative, an overarching program to improve regional bus services in Washington, DC, and surrounding areas, because of recommendations from the Washington Area Bus Transformation Project [
101]. Many American transit systems have implemented similar initiatives, including those in New York City, Philadelphia, Chicago, and Los Angeles [
100]. While Metrobus has not explicitly promoted the change to increase feelings of safety among female passengers, other cities with similar programs (or intentions to start them) explicitly list gendered perceptions of safety as a motivation [
102,
103].
WMATA’s Office of Performance Improvement is engaged in ongoing projects with the Massachusetts Institute (MIT) of Technology’s Transit Lab in Boston. Their joint research uses natural language models on structured and unstructured data to leverage Metro’s travel data to improve the system [
104]. In early 2023, a Transit Lab researcher presented an initiative to help Metro increase transit equity at the Transportation Research Board’s annual meeting. The presentation, “Inferring mobility of care travel behavior from transit origin-destination data,” described how MIT and WMATA used data from 215,000 (7%) of over 3 million registered travel cards. The researchers used inferred gender-disaggregated data to map travel to and from care-related locations (daycare centers, grocery stores, and schools) [
105]. Their analysis showed that at bus stops near these selected locations, on average, more women than men got onto the bus during the morning and afternoon rush hours. These data do not capture where riders exit the bus since riders only swipe their cards at the beginning of each trip. Still, it is the only publicly available analysis of travel patterns by gender in the WMATA system.
In October 2023, an Office of Performance Improvement staffer shared agency updates at Fair-Shared Cities and Mobility, a public meeting at the National Building Museum in Washington, DC. At the event, they had the opportunity to discuss gender equity in urban planning with Dr. Ines Sanchez de Madariaga, who developed the “mobility of care” framework. During the conversation, the Metro representative revealed that the agency was developing a gender action plan. They also shared that they consulted with staff from Los Angeles Metro involved in their landmark Understanding How Women Travel Study [
106], an initiative of the Women and Girls Governing Council. The study was a robust exploration of the role that gender plays in how women navigate the L.A. Metro system, the first of its kind among any major transit system in the United States. National Capital Region residents would surely benefit from such an action plan.
Despite the many staff-led activities supporting gender equity at WMATA, senior leadership, including the General Manager, seems minimally engaged. For example, gender equity is not an explicit priority in any public WMATA communications or projects, including its Better Bus Network program and the WMATA Strategic Transformation Plan [
107], which excludes gender from its list of populations with disproportionate experiences of injustice despite its cross-sectional impacts on women of color and those with low incomes.
WMATA has many opportunities to address reducing gendered barriers to accessing its system. Metro leadership should incorporate gender into its other equity initiatives related to race, color, national origin, age, and disability status. By doing so, Metro would demonstrate support for gender equity at the highest levels of system leadership, allowing the agency to expand gender-responsive planning and operations. Metro should establish advisory groups responsive to the transit needs of women, girls, parents, and caregivers so they have a recognized forum to discuss relevant issues and update leadership on their priorities. For example, this could lead to full consideration of caregiver needs when designing buses, such as increased space to park strollers and shopping carts, hooks for hanging bags, and lower hand holds for standing passengers.
Concerning data collection and analysis, full gender equity support would mean collecting gender data in all surveys for later disaggregation and designing data collection tools sensitive to the mobility of care. The current Metro system presents the fewest barriers for suburban commuters and those with disabilities, as required by the ADA. By collecting more granular data, WMATA could better understand how riders use its system to accommodate their needs and increase ridership. It could also strengthen the foundation for a gender action plan.
7.2. Future Research
Feminism in the 20th century spurned scholarship in countless academic fields. For many decades, the discourse pivoted on the idea of women and men as polar opposites, in some ways replicating the divisions feminists sought, in part, to eliminate in the first place. More recent research, however, has widened its aperture to capture more than the gender binary. Today, we speak of the gender spectrum, one that includes those who identify as female and male but also transgender and non-binary gender. This social evolution underscores the importance of continued research into the myriad implications for equity studies in infrastructure, transportation, and mobility. Gaps exist in both qualitative and quantitative examination of our public transit systems. This investigation’s case study approach is a powerful tool for uncovering the drivers and barriers of gender equity so that policymakers and decision makers can increase access for all members of society. By doing so, we can better support caregiving and reduce urban carbon footprints resulting from privately owned vehicle emissions.
Quantitative and mixed methods research will also continue to expand the mobility of the care knowledge base. There is no shortage of publicly available data and information whose analysis could help to fill significant knowledge gaps in the field. It is also crucial for this scholarship to move beyond the frontiers of transportation studies to other domains, such as sociology, public administration, economics, history, and public health, preferably in concert with each other.
7.3. Methodological Limitations
The authors recognize several limitations to our methodology. Most importantly, this study is limited to the review of publicly available secondary materials posted on WMATA.com. There were many meetings for which documents (e.g., meeting agendas, minutes, and recordings) did not exist or were not posted. Concerning our analysis of meeting transcripts, there were varying degrees of clarity, making it difficult to understand the proceedings. The same applies to the nature of transcribing meetings where group members may speak simultaneously. Additionally, we only interviewed six stakeholders, which comprised only a fraction (18%) of the total identified in the record. As a result, we missed additional and contrasting viewpoints.
Regarding gender identity, the researchers based our assumptions on the gendered pronouns some stakeholders used to refer to others without knowledge of the stakeholder’s gender self-identification. In cases where the team found no mention of pronouns, we determined gender identity by the stakeholder’s first name. They categorized those with traditionally female names as female and those with traditionally male names as male. None of the gender identification strategies accounted for trans or non-binary stakeholders. This methodology may have skewed the outcomes of our study. Finally, the researchers coded disability status through stakeholder self-identification of a disability or their membership or appearance during any Accessibility Advisory Committee or subcommittee meetings. Our methodology is, therefore, subject to bias.
8. Conclusions
On 6 March 2023, WMATA announced its new policy to allow open strollers on city buses, 20 years after the Chicago Transit Authority and 8 years after Seattle’s King County. WMATA launched its pilot phase in early 2020 after at least two years of rigorous debate. Through document review, interviews, and analysis, the researchers discovered several parts of the WMATA organization, including its Accessibility Advisory Committee, generated significant pushback to a revised policy to improve caregiver access to public transportation and increase system ridership.
Washington, DC, and its transit system are not unique in this regard. Scholars have documented how women travel differently than men based on their traditional gender roles for decades. As far back as 1978, the US Department of Transportation sponsored a meeting titled the Conference on Women’s Travel Issues that served as a forum to discuss how to conduct the research that would improve the travel behavior predictions used by transport planners [
108].
The lack of attention to these issues is not a coincidence but illustrative of the hidden gender biases of “hard” infrastructure, including public transportation. Through the feminist economic lens, this is just one way that unpaid care services suffer neglect to the detriment of economic production. A sustainable economy requires that policymakers support the unpaid labor that absorbs, assimilates, buffers, restores, and reproduces the end and by-products of the production process through thoughtful, evidence-based planning of the infrastructure that everyone uses. The economy’s productivity is impaired without restoring the neglected services provided by unpaid labor.
Experts can restore these neglected restorative capacities, at least in part, through disaggregated data collection using tools sensitive to cross-cutting gender role differences to expose gaps and opportunities for bolstering care work and increasing equitable access to infrastructure services. They can also improve urban transit systems by increasing the participation of all transit system stakeholders, including women and girls. By doing so, urban transit agencies will increase ridership, bolster the economy, and reduce the use of privately owned vehicles. There are no downsides to improving transit access for all.


