Article

Influence of Snowy and Icy Weather on Vehicle Sideslip and Rollover: A Simulation Approach

1
School of Civil and Transportation Engineering, Hebei University of Technology, Tianjin 300401, China
2
School of Architectural Engineering, North China Institute of Aerospace Engineering, Langfang 065000, China
*
Author to whom correspondence should be addressed.
Sustainability 2024, 16(2), 888; https://doi.org/10.3390/su16020888
Submission received: 15 December 2023 / Revised: 13 January 2024 / Accepted: 15 January 2024 / Published: 20 January 2024

Abstract

:
Many northern hemisphere countries have experienced exceptionally heavy snow, blizzards, and cold snaps in recent years, causing considerable public concern about the high crash rate and safety issues in road traffic. This study used the CarSim dynamics simulation to recreate several vehicle driving scenarios in snow and ice conditions. To explore the influence of speed, curve radius, and road adhesion coefficient on vehicle sideslip and rollover, four lateral stability evaluation indicators, namely lateral offset, lateral acceleration, yaw rate, and roll angle, are chosen. Unfavorable combinations of these factors result in vehicle deviation from their intended trajectory and dramatically increase the likelihood of sideslip and rollover incidents. In particular, road adhesion coefficients ranging from 0.10 to 0.20 lead first to sideslip, while coefficients of 0.21 to 0.35 lead straight to rollover. Additionally, in the initial segment of the curve, cars are more susceptible to lateral instability. Curve radius has the greatest influence on sideslip when the three influencing factors are combined, while speed is the key component affecting rollover incidents. Smaller curve radii and higher speeds are major factors in such incidents. The results are helpful for proper road alignment parameter selection and dynamic speed-limit measures. This can provide a theoretical basis for traffic management departments to take targeted measures, which is of great significance to improving road traffic safety in snowy and icy weather.

1. Introduction

Adverse weather has long been a significant contributing factor to traffic crashes. It has persistently offered a serious challenge to road traffic safety as an environmental factor impacting driving conditions, resulting in a substantial increase in road traffic crash rates [1]. According to the NHTSA, adverse weather caused 12% of all crashes [2]. Adverse weather conditions include fog, rain, snow, wind, and other unfavorable weather conditions [3], with snow and ice being two of the most dangerous factors [4,5], affecting the driver’s vision, psychology, driving behavior decisions, and even the vehicle’s controllability and other aspects. According to statistics from the United States, around 24% of crashes occur on snowy, muddy, or icy roads, and 15% of crashes happen when it is snowing or sleeting each year. Furthermore, in a typical year, winter weather conditions involving snow and ice kill over 2200 people and injure over 192,800 others in highway crashes [6]. European countries are intensively researching the impact of weather on driving safety. The reports of road traffic crashes in the Czech Republic from 1979 to 2020 and in Germany from 2006 to 2017 show that snow has the greatest influence on crashes [7,8]. Based on an analysis of 10,646 traffic crashes on 43 major roads in Finland from 2014 to 2016, Malin et al. [9] discovered that the likelihood of crashes was more than three times higher during the winter. Likewise, Canada, the Korean Peninsula, and Japan concluded that snowfall increases crashes and their severity [10,11]. It is crucial to highlight that snowy and icy weather conditions are common in many locations around the world, affecting the ability to travel for a large proportion of the worldwide population. In the United States, 70% of the road network is in snowy areas, where approximately 70% of the population resides. Similarly, almost 80% of China’s roads, across all classifications, are in frigid regions. During the winter, Japan and the Korean Peninsula receive significant snowfall and blizzard conditions, and certain sections of Russia experience snow accumulation that lasts up to 11.5 months per year [12]. Countries with a cold and snowy winter are forced to invest substantial financial resources in snowy and icy road maintenance, resulting in notable positive outcomes [6,13,14]. However, vehicles will continue to operate on icy and snowy road surfaces for longer periods in places with prolonged winter durations due to factors such as significant precipitation, large distances, and delayed snow-clearing procedures. As a result, this situation presents a compelling reason to explore the safety of driving vehicles on such hazardous roads.
The research community has paid close attention to road traffic safety in snowy and icy conditions [15]. Based on crash data, many studies have found that the frequency of traffic crashes suddenly increases after snowfall in the winter, causing serious injuries to the occupants [16,17]. Researchers have constantly focused on studying the incidence rate of crashes in snowy weather and the severity of collisions using crash data [16]. According to crash statistics, road traffic crashes occur at a significantly higher rate and cause more extensive damage in wintry conditions than in normal weather conditions [18]. These incidents, in particular, cause injuries and property damage that are several times larger than those seen in normal weather. To reduce the impact of crashes, researchers have developed models and algorithms that use crash and weather data for analysis and prediction. These models and algorithms can be used to predict risk prior to the arrival of snow and ice or to implement various road maintenance strategies to ensure the safe operation of vehicles in wintry conditions [15,19], thereby reducing collision rates [20]. Although these research efforts have had a positive effect on crash occurrence rates, they are still some way from achieving the ultimate goal of lowering crashes to a greater extent. In order to successfully reduce the frequency of such incidents, there is an urgent need to examine the driving characteristics of vehicles on snow and ice, as well as the underlying mechanisms that contribute to crashes. Due to the minimal tire-to-road friction under such conditions, vehicles involved in collisions are prone to sideslips or rollovers. Such incidents occur when drivers lose control of their vehicle’s trajectory, and the resulting rapid shift in trajectory is the direct cause of crashes and rear-end crashes involving numerous vehicles. As a result, the destabilization of a vehicle’s lateral state on snowy and icy roads is an important consideration. Nonetheless, research on vehicle sideslips and rollovers in snowy and icy situations is severely lacking. Furthermore, the lack of appropriate driving practices and safety measures for such conditions makes it difficult for drivers to manage their vehicles on snow and ice. Given this, the focus of this research is on vehicles traveling in snowy and icy conditions. A road in Jiamusi City, Heilongjiang Province, China, known for its cold and snowy weather, served as the research backdrop using CarSim (2019.0) vehicle dynamics simulation software to establish a driver–vehicle–road model to reproduce various scenarios of vehicles driving in snowy and icy weather, and explore the restrictive factors and mechanisms that affect the lateral stability of vehicles, quantitatively analyze the relationship between sideslip and rollover and the influencing factors, explore the interaction mechanism of multiple factors during driving, and reveal the characteristics and laws of crashes to improve the safety of vehicles driving in snowy and icy weather. The aim of this study was to find ways to effectively reduce the traffic accident rate and improve the traffic safety status of extreme weather on the whole. The rest of the paper is organized as follows. Section 2 reviews previous related research. Section 3 introduces the simulation approach and strategy. Section 4 analyzes the simulation results. Section 5 discusses the importance of influencing factors and the focus of attention on improving driving safety. Finally, Section 6 summarizes and proposes future research directions. The research flow chart is shown in Figure 1.

2. Literature Review

In recent years, scholars have conducted substantial research on the safety of vehicles while traveling, with a special emphasis on the positive impact of investigating vehicle lateral stability. The lateral stability of a vehicle refers to its ability to resist rollover and sideslip, particularly when traveling on curved roads [21]. Insufficient lateral tire forces to overcome severe centrifugal forces reduce vehicle stability greatly [22]. Sideslip or rollover incidents, which are the most common type of single-vehicle crash, can occur in severe cases [21,23]. These incidents typically occur in adverse weather, particularly snow and ice. Because of the combination of a small quantity of precipitation and tire rolling, the melted snow alters the road surface from dry to wet during the commencement of snowfall. As a result, as snow accumulates on the road, the road adhesion coefficient drops [23]. More seriously, rising humidity and temperatures can transform snow into slush. If the temperature falls below freezing at night, the melted snow refreezes, leading to a significant decrease in the road adhesion coefficient [24] and reducing drivers’ ability to control their vehicles [25]. As a result, sideslip and rollover crashes occur [22,26].
Studies have demonstrated that sideslip and rollover incidents are common on curved roads [27], which has aroused researchers’ interest in learning more about how curves affect vehicle safety. According to Alrejjal and Ksaibati [28], vehicles traveling on curved roads have a higher requirement for side friction, which reduces the safety factor of sideslips. Furthermore, during emergency braking, sideslip and rollover safety margins are dramatically reduced. Furthermore, when the curve radius is small [29], particularly when it is less than 200m or when a small radius curve combines with a vertical curve, vehicles are highly susceptible to sideslip. Sideslip and rollover appear as the primary threats during vehicle travel in such situations [30,31]. Lateral acceleration is an important indicator of vehicle instability [32], and it increases dramatically when a vehicle travels on curved roads [25], resulting in increased driver discomfort. There is a risk of sideslip and rollover once the lateral acceleration exceeds a critical value [33,34]. At greater operating speeds, the impacts are more severe [1]. The load transfer ratio (LTR) is another classic indication that characterizes the occurrence of vehicle rollovers [35,36]. It is established using the vertical reaction force exerted by the tires. When one side of the wheel loses contact with the ground, the vertical reaction force on that side of the tire becomes zero [37]. Another often-used measure to assess lateral stability is lateral offset [38,39]. It provides an intuitive assessment of the possibility of a vehicle sideslip and accurately analyzes the driving situation. A lateral offset distance of more than 30 cm is usually suggestive of a vehicle sideslip. Roll angle, sideslip angle, side friction coefficient, and yaw angle are additional important indicators for assessing vehicle lateral stability [40,41,42,43].
In addition to weather and road factors, there are also driver factors that contribute to vehicle sideslips and rollovers [44,45]. Scholars largely agree that sideslips and rollovers are caused by a driver’s interaction with the vehicle, road, and environment [30]. Human negligence happens by chance among driver factors, making it difficult to foresee and guide in advance [11]. As a result, most research focuses on driver speed control in order to reduce the possibility of driving errors and the terrible consequences that occur due to driving errors by establishing limiting speeds. According to Deutermann [46], speed is a critical element leading to rollover events, with most rollovers occurring at speeds of 89 km/h or above. Cheng et al. [47] and Xin et al. [48] developed formulas for determining safe speeds in abrupt corners for vehicles and trucks, respectively, providing insights on strategies to reduce lateral destabilization incidents. Gallen et al. [49] established speed restrictions by using precipitation, visibility, vehicle characteristics, and driver reaction time, as well as emergency braking considerations. Yan et al. [26] calculated the suitable speed limit for trucks in curves by integrating turning and braking while considering the friction coefficient of wet roads and the principle of the friction ellipse. Their approach helps traffic managers make decisions and, to some extent, reduces the traffic impact caused by adverse weather. Although these methods produce more accurate safe speeds for road speed limits, the deceleration amplitude is frequently less than that implied by the signs when slowing down in curves, and lateral instability incidents can occur even at speeds lower than the speed limit [50]. Even in snowy and icy weather, vehicles may sideslip when traveling at speeds 8–16 km/h below the speed limit [28]. It is clear from this that previous studies did not sufficiently account for speed limit values into account and the model utilized has to be improved. As a result, defining an appropriate speed limit remains the focus of research efforts, which requires a combination of several factors.
Significant progress has been achieved in crash risk detection and prevention studies, as well as in simulation modeling of vehicle lateral instability. To estimate crash risks, Xu et al. [39] conducted on-road driving tests, translated the obtained driving trajectories into a coordinate system, and determined the lateral deviation rate (LDRT). Wang et al. [50] collected approximately 10,000 vehicle trajectories traveling on horizontal curves to investigate factors influencing speed on curves using generalized estimating equations. Zhang et al. [51] conducted a study on the identification and prediction of road crash hazards using real-time tire force data and developed both a negative binomial regression model (NBR) and a random-effects negative binomial regression model (RENBR). Pang et al. [15] used four years of snowfall crash data from New York State to develop a stochastic parametric model with mean and variance heterogeneity to investigate the effect of various factors on crashes. There is no doubt that these studies have produced irreplaceable positive results in this field. However, many of these methods are developed based on big data sets, which may pose challenges in data collection and acquisition in some cases. For instance, field tests may encounter challenges in managing environmental and traffic conditions, potentially leading to crashes [52]. Furthermore, the data collection process may take a long time and contain inaccuracies [53]. To overcome the challenges of data collection in this field of study, researchers developed several models that integrate vehicle performance for crash analysis and prevention. Sentouh et al. [54] developed a four-wheel-vehicle dynamics model for off-road collision avoidance and used the sideslip angle. You et al. [55] used a closed-loop dynamics model for conventional vehicles to develop a vehicle performance function for analyzing sideslip and rollover incidents. Dhahir and Hassan [56] proposed a probabilistic safety explicit method for horizontal curve design that uses performance functions to assess horizontal curve reliability based on four design criteria: vehicle performance, driver comfort, sight distance, and rollover. Furthermore, they predicted horizontal curve safety performance. Zolali et al. [57] used structural equation modeling (SEM) to investigate complex relationships between variables and the factors that influence speed fluctuations during vehicle travel.
Furthermore, simulation methodologies can be used to assess vehicle driving risk [58,59]. Scholars have recognized that these approaches not only help avoid crashes in field testing but also aid in lowering the high testing costs. Shin and Lee [22] analyzed vehicle driving behavior using TruckSim simulation software and determined that truck rollovers are particularly sensitive to vehicle speed, whereas sideslips are mostly impacted by the road adhesion coefficient. Abdollahzadeh Nasiri et al. [60] analyzed the real-time impacts of vehicle weight, size, longitudinal gradient, and speed variations on a spiral curve using a multibody dynamics simulation approach. Yildiz and Özel (2021) [43] chose an autonomous vehicle to subtract the consideration of driver mistakes and steering response delays in the vehicle, and they set the vehicle stability strategy by calculating the yaw rate and sideslip angle. Sharf Aldeen et al. [61] investigated dynamic changes and variations in maximum side friction coefficient, lateral acceleration, roll rate, and roll angle among different vehicle types while driving on simple and spiral horizontal curves using CarSim and TruckSim. The findings show that the vehicle dynamics simulation model can respond to the vehicle’s performance in real-time, capturing dynamic changes during the driving process and evaluating operational characteristics under specified situations. This makes it easier to summarize the laws influencing vehicle stability at different operating speeds and road alignments.
According to the reviewed literature, vehicle crash studies frequently use mathematical models or simulation approaches to examine hazardous scenarios that take into account road, environmental, driver, and vehicle factors. However, studies on vehicle travel stability that take into account the combined impacts of snowy and icy road conditions, road alignment (e.g., curve radius, superelevation), and speed are lacking. In this work, we focus on the factors that influence crashes and use a CarSim dynamics simulation approach to analyze the lateral stability of the vehicle, investigating the mechanisms of sideslip and rollover under poor weather conditions such as snow and ice. These findings provide important information for the development of crash prevention and management strategies.

3. Methodology

3.1. Mechanical Analysis of Vehicle Lateral Instability

This study focuses on the driving environment and uses CarSim dynamics simulation software to investigate the impact of road geometry, pavement conditions, speed, and other variables on vehicle lateral stability while traveling. The approach assumes the vehicle has a rigid body and ignores the influence of the suspension and tires. The force study of the vehicle on curved roads was performed using the approaches of Dhahir and Hassan [56], as well as Qu et al. [35], with the lateral instability analysis shown in Table 1. Equations (6) and (9) must be met to prevent the vehicle from sideslipping and rolling. The geometric parameters of the vehicle, road curve radius, superelevation, friction force, coefficient of adhesion, speed, acceleration, and other parameters all have an impact on vehicle stability. The study investigates the effects of curve radius, road adhesion coefficient, and vehicle speed on sideslip and rollover through simulation, based on force analysis, to clarify the generation mechanism of sideslip and rollover phenomena in vehicles traveling in snowy and icy weather conditions.

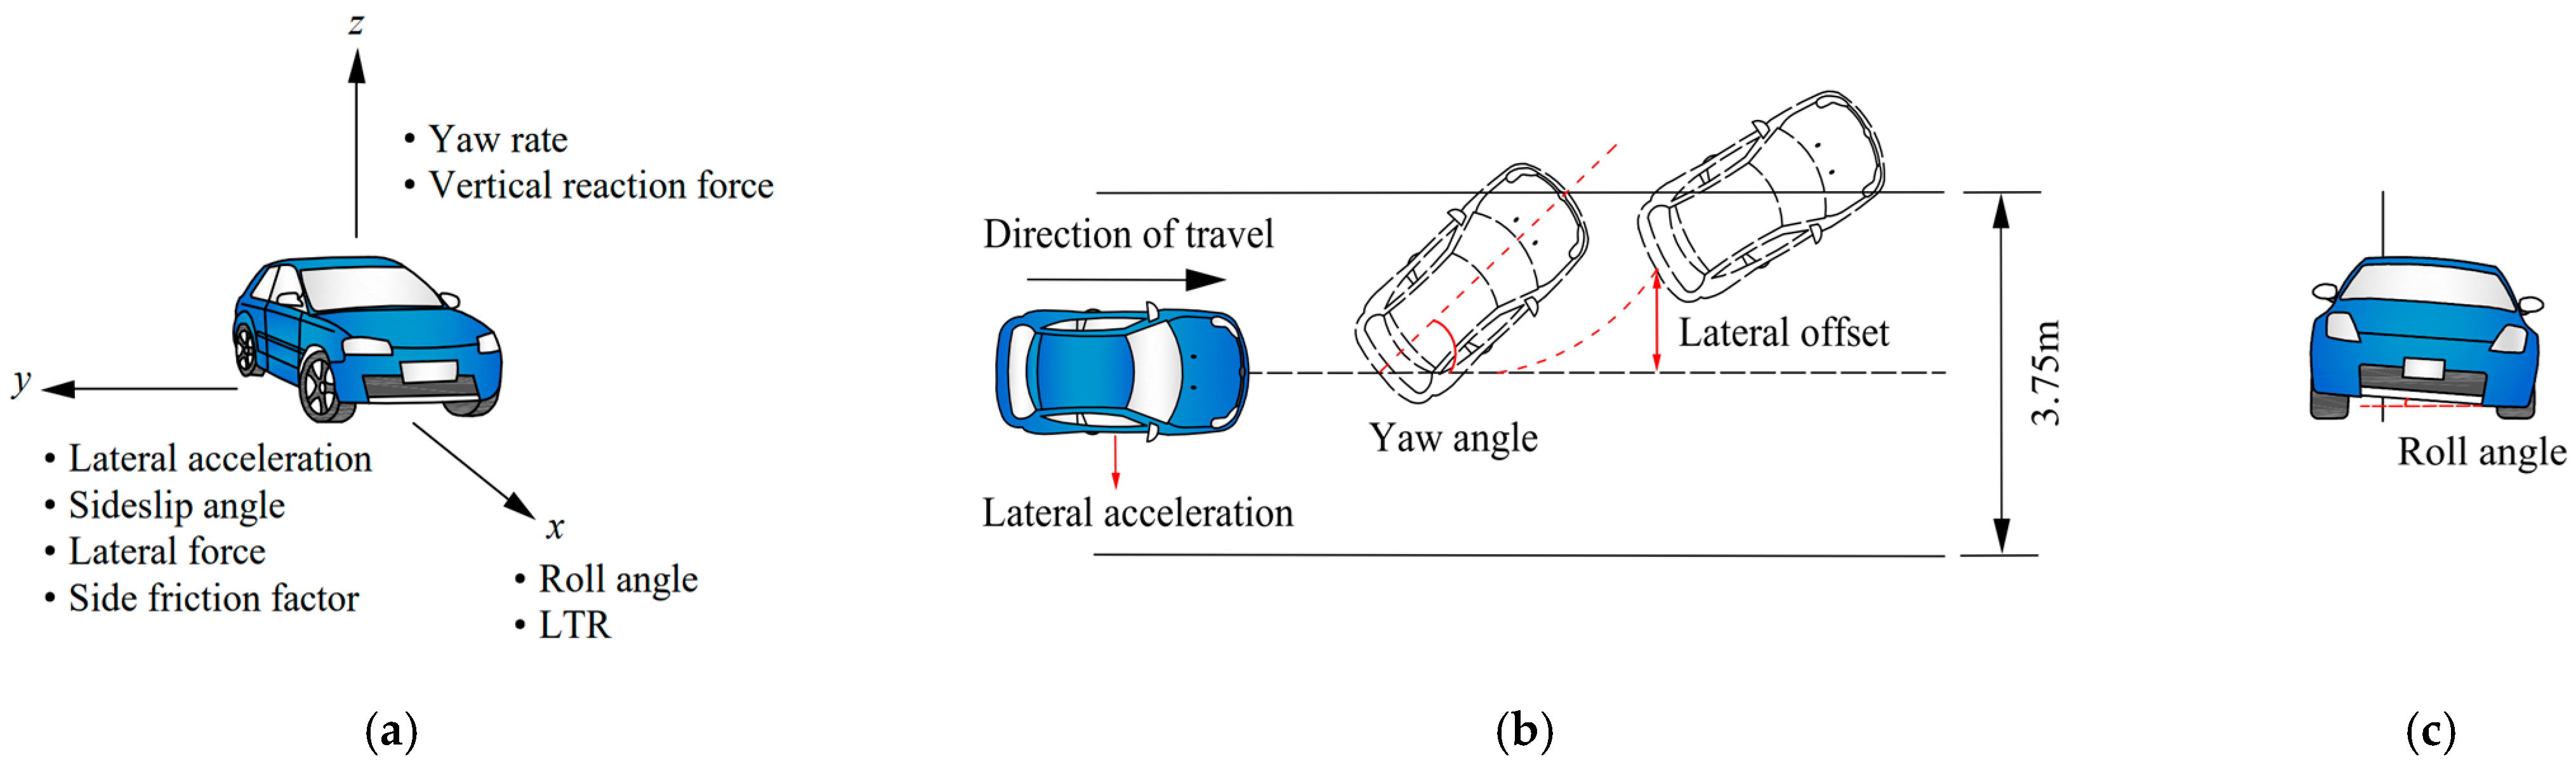
3.2. Evaluation Indicators

Numerous evaluation indicators are employed in the simulation and field test to measure the lateral stability state of the vehicle while traveling. Table 2 summarizes the evaluation indicators used in current literature to provide a summary of historical research. In the studies cited, the most commonly used indicator is lateral acceleration, followed by yaw angle, roll angle, sideslip angle, lateral force, load transfer ratio (LTR), lateral offset, and tire vertical reaction force. These indicators are distributed in a three-dimensional dynamic coordinate system to assess the vehicle’s operating state from multiple directions, effectively defining the sideslip and rollover tendency. The coordinate system is centered on the driver, with the X-axis indicating front and rear vehicle movement, the Y-axis representing left and right lateral directions perpendicular to the vehicle’s motion, and the Z-axis representing the vertical direction of the vehicle’s plane. As shown in Figure 2a, this forms a three-dimensional coordinate system to characterize the vehicle’s movements. To characterize the vehicle’s state, the roll angle and LTR are used as motion indicators along the X-axis direction. The roll angle indicates the vehicle’s inclination toward the ground as it travels around a curve. Rollover is possible if the roll angle is high enough because there is an increase in load on one side of the front and rear axles’ wheels during vehicle roll and a decrease in load on the other side. Therefore, LTR can also be used to reflect the load transfer caused by rollover and evaluate the rollover risk. The Y-axis indicators of lateral acceleration, sideslip angle, lateral force, and side friction factor characterize the vehicle’s motion state. When traveling around a curve, the vehicle generates a lateral force perpendicular to its motion, and the side friction given by the road may be insufficient to resist this lateral force. As a result, there is a large lateral acceleration and sideslip angle, which can lead to vehicle sideslip. As a result, these indications accurately describe the vehicle’s likelihood of sideslip. Yaw rate and tire vertical reaction force are Z-axis evaluation indicators. The magnitude of the yaw angle represents the vehicle’s rotational deflection angle around the vertical axis. An uneven distribution of vertical reaction force between the front and rear axles, as well as the left and right tires, might increase the likelihood of a rollover. These indications can also be categorized based on the two types of lateral crash states that occur while driving a vehicle. Sideslip can be indicated by lateral acceleration, sideslip angle, lateral force, and side friction factor, whereas roll angle, load transfer ratio, yaw rate, and vertical reaction force describe the vehicle’s rollover state. Some indicators, such as lateral acceleration and side friction factor, are relatively complete, defining both vehicle states at the same time. Based on research findings in the relevant literature and the functions of each evaluation indicator, we selected some representative and most frequently used evaluation indicators indicating the vehicle’s motion state in each direction for our investigation. Roll angle, lateral acceleration, and yaw rate are the indications in the X-, Y-, and Z-axis directions, respectively. Furthermore, in addition to real-time vehicle dynamics, we should also consider the cumulative risk indicators of the vehicle. We chose the lateral offset [62], which reflects the vehicle’s trajectory deviation and intuitively depicts the vehicle’s sideslip tendency. These four indicators will be used in future studies. Figure 2b,c illustrate the chosen indicators.
In addition to evaluating the selected vehicle’s motion state during the traveling process in each direction, it is critical to determine the threshold values for these indicators when the motion state changes. These thresholds serve as warning indicators that the vehicle has deviated from its regular traveling state and is at risk of a sideslip or rollover incident. These threshold values were determined using China’s “Limit Values and Evaluation Methods of Automobile Maneuvering Stability Indicators” (QC/T480-1999 [71]), which included steady-state slewing and serpentine tests, among other procedures. This study refers to ISO 3888-2:2011 [72], EU Regulation 661/2009 [73], and prior studies by scholars when considering the influence of vehicle parameter fluctuation on evaluation indicator thresholds [26,35,48,74,75,76]. The determined thresholds are: for lateral offset, 0.3 m, for lateral acceleration, 0.4 g, for yaw rate thresholds, 25 deg/s (60 km/h), 17.5 deg/s (80 km/h), and 10 deg/s (100 km/h), and roll angle thresholds, 1.2 deg (60 km/h), 0.95 deg (80 km/h), and 0.7 deg (100 km/h). These evaluation indicator thresholds will help in identifying changes in the operational state of the vehicle during the simulation analysis.

3.3. Simulation Modelling

3.3.1. Model Parameters Setting

CarSim software is a simulation tool designed for vehicle dynamics and is used in this work to model and simulate the vehicle’s motion. It offers flexibility and convenience, catering to various vehicle types such as sedans, light-duty trucks, and SUVs, supported by an extensive database of vehicle models. Vehicle, driver, road, and environment parameters are modified to reflect real-world situations, ensuring the vehicle drives appropriately under the given simulation conditions and match actual driving scenarios. Figure 3 illustrates the scenario and the parameter setting process for vehicle travel simulations. The chosen road model represents a highway in Heilongjiang Province that runs north to south for 157.85 km. The primary road specifications are an 80 km/h design speed, a 3.75 m road width with four lanes in both directions, and a 0.75 m shoulder width. The simulation study focuses on a specific road that includes a straight, a transition curve, a curve, a transition curve, and a straight. Appendix A contains the detailed parameters of the road simulation. Validations are performed using double lane change tests to check the adequacy of the simulation model’s parameters.

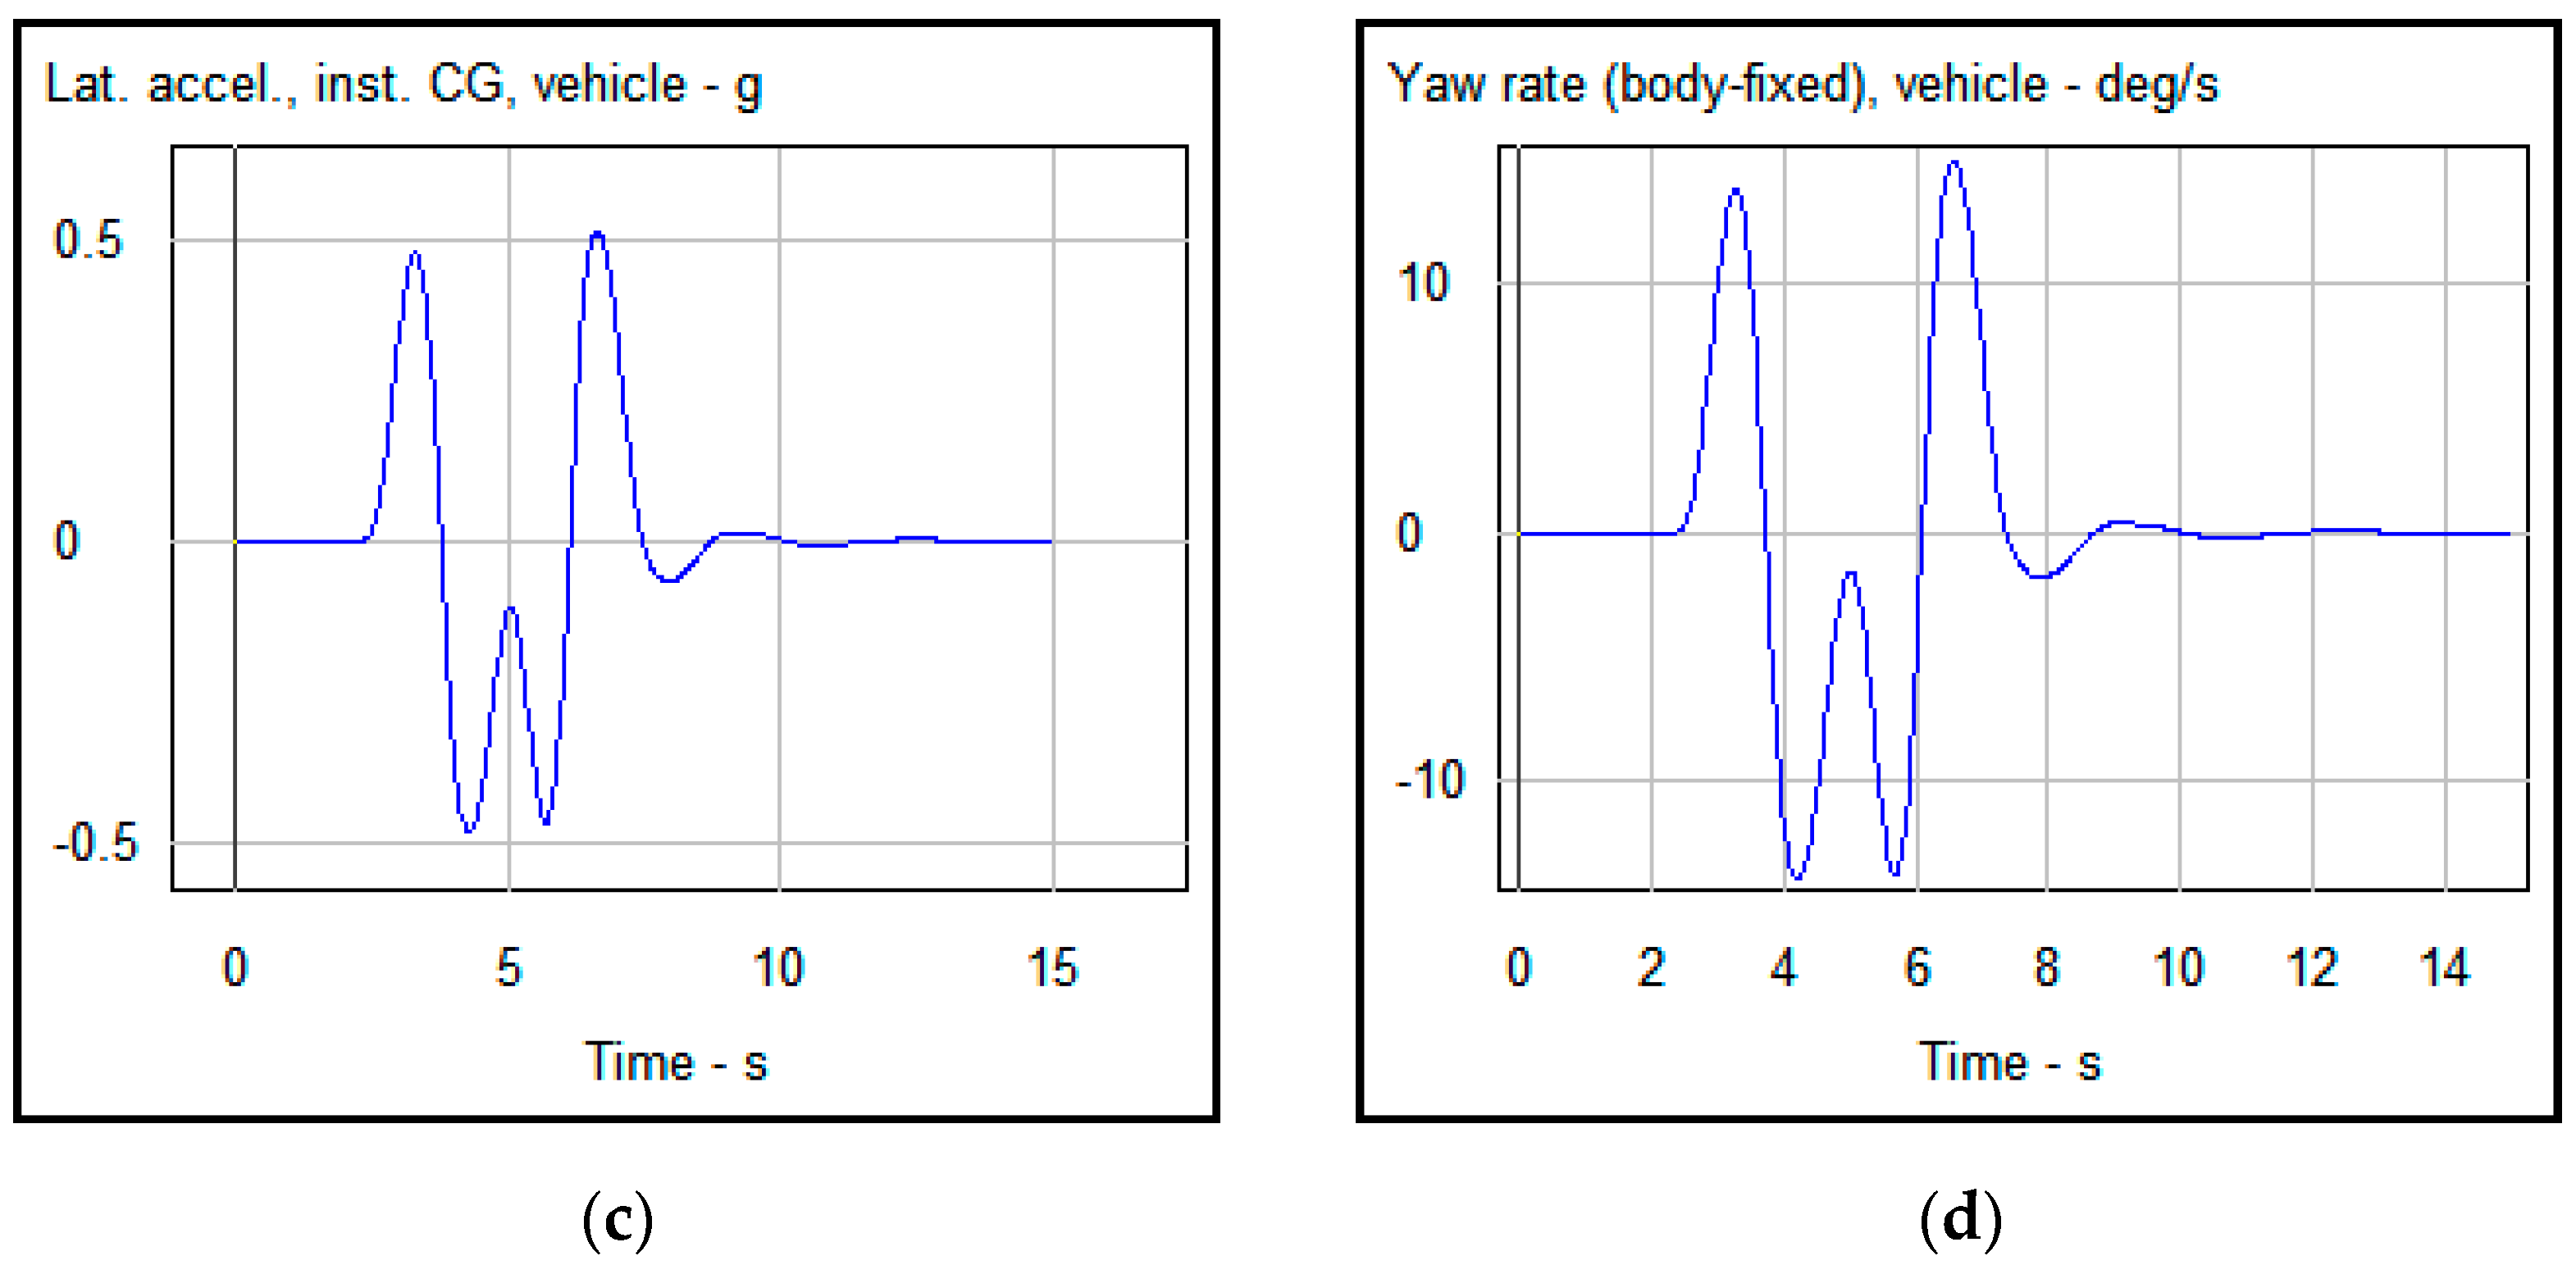
3.3.2. Double Lane Change Test

The double lane change test is a standard vehicle handling evaluation method used to analyze vehicle stability performance and trajectory variations during lane changes. In this test, the vehicle enters a designated lane at a constant speed and performs steering operations while maintaining its position inside the lane borders. An optimal preview control model is used to perform the double lane change test, and essential parameters such as preview time, time lag, and maximum steering wheel angle rate are correctly selected depending on actual driver behavior and road conditions. The vehicle’s steering is properly regulated by minimizing mistakes in the calculation of steering angle and taking into account road and vehicle parameters, offering a more accurate representation of the vehicle’s behavior during regular driving. For these reasons, we use the double lane change test to determine the validity of the CarSim simulation model settings. The successful completion of the lane shift, followed by the vehicle returning to the original lane, validates the rationality of the driver model, vehicle model, and road model configurations to some extent. Because of this accomplishment, the test is now useful as a tool for studying the vehicle’s driving behavior in real-world circumstances. Figure 4 illustrates the process of a double lane change performed on a human–vehicle–road simulation model based on actual road parameters.
For the recommended double lane change test, an initial maximum desired speed of 80 km/h is set in accordance with the international standard ISO 4138:2004 [77] 1996. The double lane change test is performed under both road models and real-world situations. The output primarily describes the lateral offset, which represents the vehicle’s trajectory characteristics and indicates the vehicle’s stability through parameters like yaw rate and lateral acceleration, as well as its motion characteristics through longitudinal speed. Figure 5 and Figure 6 demonstrate the corresponding response curves.
The results shown in Figure 5 demonstrate that there is a great agreement between the vehicle lateral offset and the target offset curve both before and after the vehicle changes lanes—there is basically no offset. The longitudinal speed, lateral acceleration, and yaw rate demonstrate slight fluctuations within 200 m (8 s) of the lane change, eventually stabilizing and maintaining uniform speed while moving along the predetermined route. These results show that the driver model, which is based on preview control theory, effectively manages the vehicle’s operation during the double lane change test. Furthermore, the vehicle model, which is based on closed-loop steering and braking control, ensures smooth lane changes, proving the simulation model’s reasonability and feasibility.
The vehicle exhibits smooth lane shifts and successfully follows the designated route during the test after substituting the double lane change road model with the actual road model. Each dynamic indicator’s response is also observed to be stable. Figure 6 displays the evaluation indicator parameter values obtained from the actual road condition test. It is found that there is great consistency between the driving characteristics observed under actual road conditions and those observed in the double lane change test road model. This finding verifies the effective performance of the actual road model in the test, proving the actual road model’s reliability and the simulation model’s operability.
Additionally, an extensive literature review shows that many scholars utilize CarSim for various research purposes. This includes not only the analysis of vehicle driving safety but also investigations into the performance of vehicle intrinsic parameters and as a simulator in autonomous driving research [78,79,80]. CarSim is widely recognized for its high accuracy and applicability in simulation, establishing itself as one of the most extensively used software products across multiple domains.

3.3.3. Simulation Strategies

Through simulation, this study investigates the influence of three factors on the vehicle’s traveling state: speed, curve radius, and road adhesion coefficient. The emphasis is on vehicle speed, which is widely recognized as the most significant factor determining road traffic safety. Six different vehicle operating speeds are examined, ranging from 30 km/h to 80 km/h in 10 km increments. According to the “Road Speed Limit Provisions and Speeding Penalty Standards”, a speed of 80 km/h corresponds to the speed limit set for first-class highways in China. Road alignment has a considerable impact on vehicle trajectory, especially when approaching road curves, forcing the vehicle to deviate from its straight path and becoming an important cause of vehicle sideslip and rollover incidents in snowy and icy weather. The study references China’s “Highway Route Design Code” (JTG D20-2017), which specifies a minimum curve radius of 400 m for a design speed of 80 km/h, the most challenging working condition. The curve radius of the road alignment runs from 400 to 1000 m with a step length of 100 m, resulting in seven operating condition situations. Icy and snowy weather give rise to diverse traffic safety challenges, such as their impact on road anti-slip ability, visibility, and driver psychological pressure. Among these issues, the alteration of road anti-slip ability is a crucial component contributing to traffic crashes, and such changes can be gauged in real-world settings by examining the road adhesion coefficient. According to Ghandour et al.’s estimates of the adhesion coefficient for icy and snowy road surfaces [81], icy and snowy road conditions can be categorized into four categories: The worst result under bad weather is an icy road with a road adhesion coefficient ranging from 0.10 to 0.15, followed by a compacted snow road with a road adhesion coefficient ranging from 0.10 to 0.20, a snow slushy road with a road adhesion coefficient ranging from 0.15 to 0.25, and, finally, a loose snow road with a road adhesion coefficient ranging from 0.25 to 0.35. In this study, the road adhesion coefficient was varied from 0.10 to 0.35 at 0.05 intervals to refine the relationship between road adhesion coefficient changes and vehicle driving characteristics under icy and snowy weather conditions, resulting in a total of six working conditions. The adhesion coefficient of a dry asphalt road was set at 0.75 for comparative purposes, serving as a control experiment for icy and snowy roads. In this study, we established 20 different simulation scenarios to investigate the influence of various factors on vehicle driving stability. We specifically set the values of other factors to be constant at the most unfavorable levels for single-factor analyses and the impact of vehicle driving conditions. We analyze the individual effects of speed, curve radius, and road adhesion coefficient on the vehicle’s motion by studying the vehicle under various parameter combinations. Table 3 shows the entire simulation strategy.

4. Results

4.1. Influence of Speed on Vehicle Lateral Stability

Figure 7 displays the real-time change curves of lateral offset, lateral acceleration, yaw rate, and roll angle while the vehicle travels along the specified path at various speeds. According to the findings, vehicle speed has a strong and positive correlation with the evaluation indicators of vehicle lateral stability. As speed increases, so does the value of these evaluation indications, resulting in a decline in driving safety.
As shown in Figure 7a, at lower speeds, the total force on the vehicle remains balanced, and the lateral offset approaches 0, indicating a stable operational state. When the speed approaches 80 km/h, the vehicle encounters a substantial sideslip, resulting in instability. A localized magnification figure for speeds ranging from 30 to 70 km/h is given to provide an extensive overview of the lateral offset fluctuation with speed. Within this range, the vehicle enters the curve in the road with a slight right offset, then a slight left offset, and eventually remains stable. The lateral offset gradually increases with vehicle speed, although only by a small amount, and the curves remain essentially consistent. At 70 km/h, the maximum lateral offset is 0.090 m, which is much less than the threshold value of 0.3 m. This result indicates that the vehicle will not encounter sideslip and will be capable of maintaining safe driving conditions. At 80 km/h on a straight road, the lateral offset is virtually 0. This phenomenon may be caused by the vehicle’s balance of gravity and support force, resulting in no change in direction and ensuring that the vehicle remains centered within the controlled range. However, as soon as the vehicle enters the curve, it constantly modifies its driving trajectory for safety. Despite these efforts, the lateral force on the wheels is inadequate to resist the greater centrifugal force, resulting in considerable deflection on both the left and right sides, loss of vehicle control, and sideslip.
As seen in Figure 7b,d, the trends in each curve are nearly the same. When the vehicle speed is between 30 and 70 km/h, it will not produce a centrifugal force on a straight road, and the lateral acceleration, yaw rate, and roll angle will be close to 0 with little variation, allowing the vehicle to travel stably. When the vehicle entered the curve, its operating status changed, with the lateral acceleration, yaw rate, and roll angle increasing linearly until each indicator stabilized, while maintaining constant lateral acceleration, yaw rate, and roll angle [82]. Subsequently, when the vehicle exited the curve, the indicators began to decrease linearly until the vehicle re-entered the straight, at which point the indicators recovered to roughly 0. It is worth noting that, on a curved road, the vehicle speed positively correlates with the rate increase in each indicator over the same section length due to the presence of centrifugal force. Furthermore, faster speeds result in higher peak values and shorter curve durations. At speeds ranging from 30 to 70 km/h, the maximum values of lateral acceleration are 0.018 g, 0.032 g, 0.050 g, 0.071 g, and 0.098 g, respectively. Similarly, the maximum values of the yaw rate are 1.194 deg/s, 1.594 deg/s, 1.997 deg/s, 2.046 deg/s, and 2.844 deg/s, respectively. Additionally, the maximum values of roll angle are 0.096 deg, 0.133 deg, 0.180 deg, 0.238 deg, and 0.309 deg, respectively. None of these values exceed the sideslip and rollover thresholds, indicating the vehicle can properly complete the set simulation working conditions. As a result, the vehicle can pass through the curve at speeds ranging from 30 to 70 km/h on an icy road with a road adhesion value of 0.10. These conclusions, however, are based primarily on one aspect of the simulation result. Notably, at 70 km/h, indicators show a significant increase, indicating a significant tendency toward higher hazards. This is an important consideration.
At 80 km/h, the vehicle drives normally on the straight; however, as it approaches the curve, the lateral acceleration, yaw rate, and roll angle rapidly rise, resulting in an unstable vehicle operating state. To ensure driving safety, constant modifications are required, resulting in frequent fluctuations in the lateral acceleration, yaw rate, and roll angle curves. The greatest values are 0.110 g, 5.325 deg/s, and 0.593 deg, respectively, all of which are lower than the safety threshold for rollover. Nonetheless, the vehicle tends to rush out of the curve at this moment and cannot be driven properly due to the occurrence of a sideslip. Importantly, while non-tripping rollover may not occur in this state, tripping rollover may occur as a result of sideslipping collisions with obstacles, curbs, guardrails, and so on [34,67]. This discrepancy arises because the simulation modeling assumes an ideal state for the road slope during the sideslipping process, ignoring the impacts of collisions with barriers, potentially resulting in minor discrepancies between the simulation result and the actual situation. To summarize, the chance of instability on curves is always greater than on straight roads during snowy and icy weather, regardless of the vehicle’s operating speed. When driving on roads with poor road adhesion coefficients and small radius curves, it is essential to apply proper braking before entering the curve and maintain an appropriate speed throughout the curve to ensure driver safety.

4.2. Influence of Curve Radius on Vehicle Lateral Stability

Figure 8 shows the real-time change curves of lateral offset, lateral acceleration, yaw rate, and roll angle as the vehicle travels on the designated road at various curve radii. The simulation results show that the curve radius has a more significant and negative link with the influence of the indicators. As the curve radius decreases, the values of the indicators increase, resulting in poorer vehicle driving safety. This contrasts with the effect of speed on the indicators.
According to the observations in Figure 8a, the vehicle has about 0 lateral offset and maintains stable driving on a straight road. However, as the vehicle enters the curve, it experiences a rightward and then leftward offset until it completes the curved trajectory. The radius of the curve ranges between 500 m and 1000 m and has a low lateral offset along the whole road. A closer examination of the localized magnification figure demonstrates that gentler curves subject the vehicle to smaller centrifugal forces, allowing the lateral force to be efficiently counteracted, resulting in a shorter offset distance and increased safety. At the beginning of the 500 m radius curve, the vehicle has a maximum lateral offset of 0.185 m, which is lower than the threshold value of 0.3 m, indicating that no sideslip occurs. The simulation animation also shows that there is no risk of vehicle sideslip instability. However, with a curve radius of 400 m, the vehicle encounters extreme sideslip instability, resulting in a significant offset exceeding 100 m, preventing it from passing the designated route.
Figure 8b–d illustrate lateral acceleration, yaw rate, and roll angle plots with comparable change patterns. On the straight, the indicators remain near 0 within the curve radius range of 500–1000 m. When the indicators enter the curve, they show a linear increase, with a quicker rate of growth observed for lower curve radii. Following that, the indicators undergo a tiny decline and remain stable until departing the curve, at which point they gradually revert to 0. Furthermore, the evaluation indicators peak immediately after the vehicle enters the curve. The bigger the peak value, the smaller the curve radius, suggesting that the entrance to the curve represents the most essential section of lateral instability during vehicle travel, necessitating drivers’ attention. These findings are consistent with Molan, Alrejjal, and Ksaibati’s research [33,83]. The possible reason is that when the vehicle passes through the section with an abrupt curve radius, the driver lacks sufficient time to adjust the steering wheel, resulting in lateral instability. As a result, it can be concluded that the establishment of a transition curve is required. It allows for a gradual change in the radius of the curve, which is beneficial to driving safety, especially in adverse weather conditions, and plays an important role in ensuring safe driving. Furthermore, the straight road is safer in snowy and icy weather, whereas the curve’s stability is significantly reduced due to the driver’s challenges adapting to the road alignment and executing directional changes, which can easily result in vehicle sideslipping and rollover incidents. Slow steering is an important measure to maintain driving safety in snowy and icy situations.
It is noteworthy that the decreasing points of lateral acceleration, yaw rate, and roll angle vary with the curve radius. Because of the higher curve radius and longer curve, the plots in the figure have a step-like pattern, resulting in a more backward-descending position. Clearly, each indicator remains below the safety threshold within this range, suggesting no risk of a sideslip or rollover. Furthermore, the simulation results demonstrate that the vehicle can navigate the designated road properly. The vehicle may be driven properly on the straight with a curve radius of 400 m. However, after entering the curve, the plots in the figure demonstrate frequent fluctuations and the maximum values of each indicator reach 0.126 g, 5.458 deg/s, and 0.596 deg. As a result, even though it does not approach the rollover threshold, the vehicle loses control and cannot handle the curve properly. Figure 9 demonstrates the longitudinal speed and tire vertical reaction force of a vehicle with a 400 m radius in CarSim. Figure 9a shows that the vehicle’s longitudinal speed fluctuates and deviates from the set speed at the curve, whereas Figure 9b shows that the wheels on both sides of the same suspension reach a balanced state and the tire vertical reaction force remains greater than 0, indicating no risk of rollover and consistent with the above analysis. To ensure that the vehicle passes safely, drivers should decelerate and slow down when passing through small radius curves and hold the steering wheel tightly and slowly, especially at the entrance to the curves.

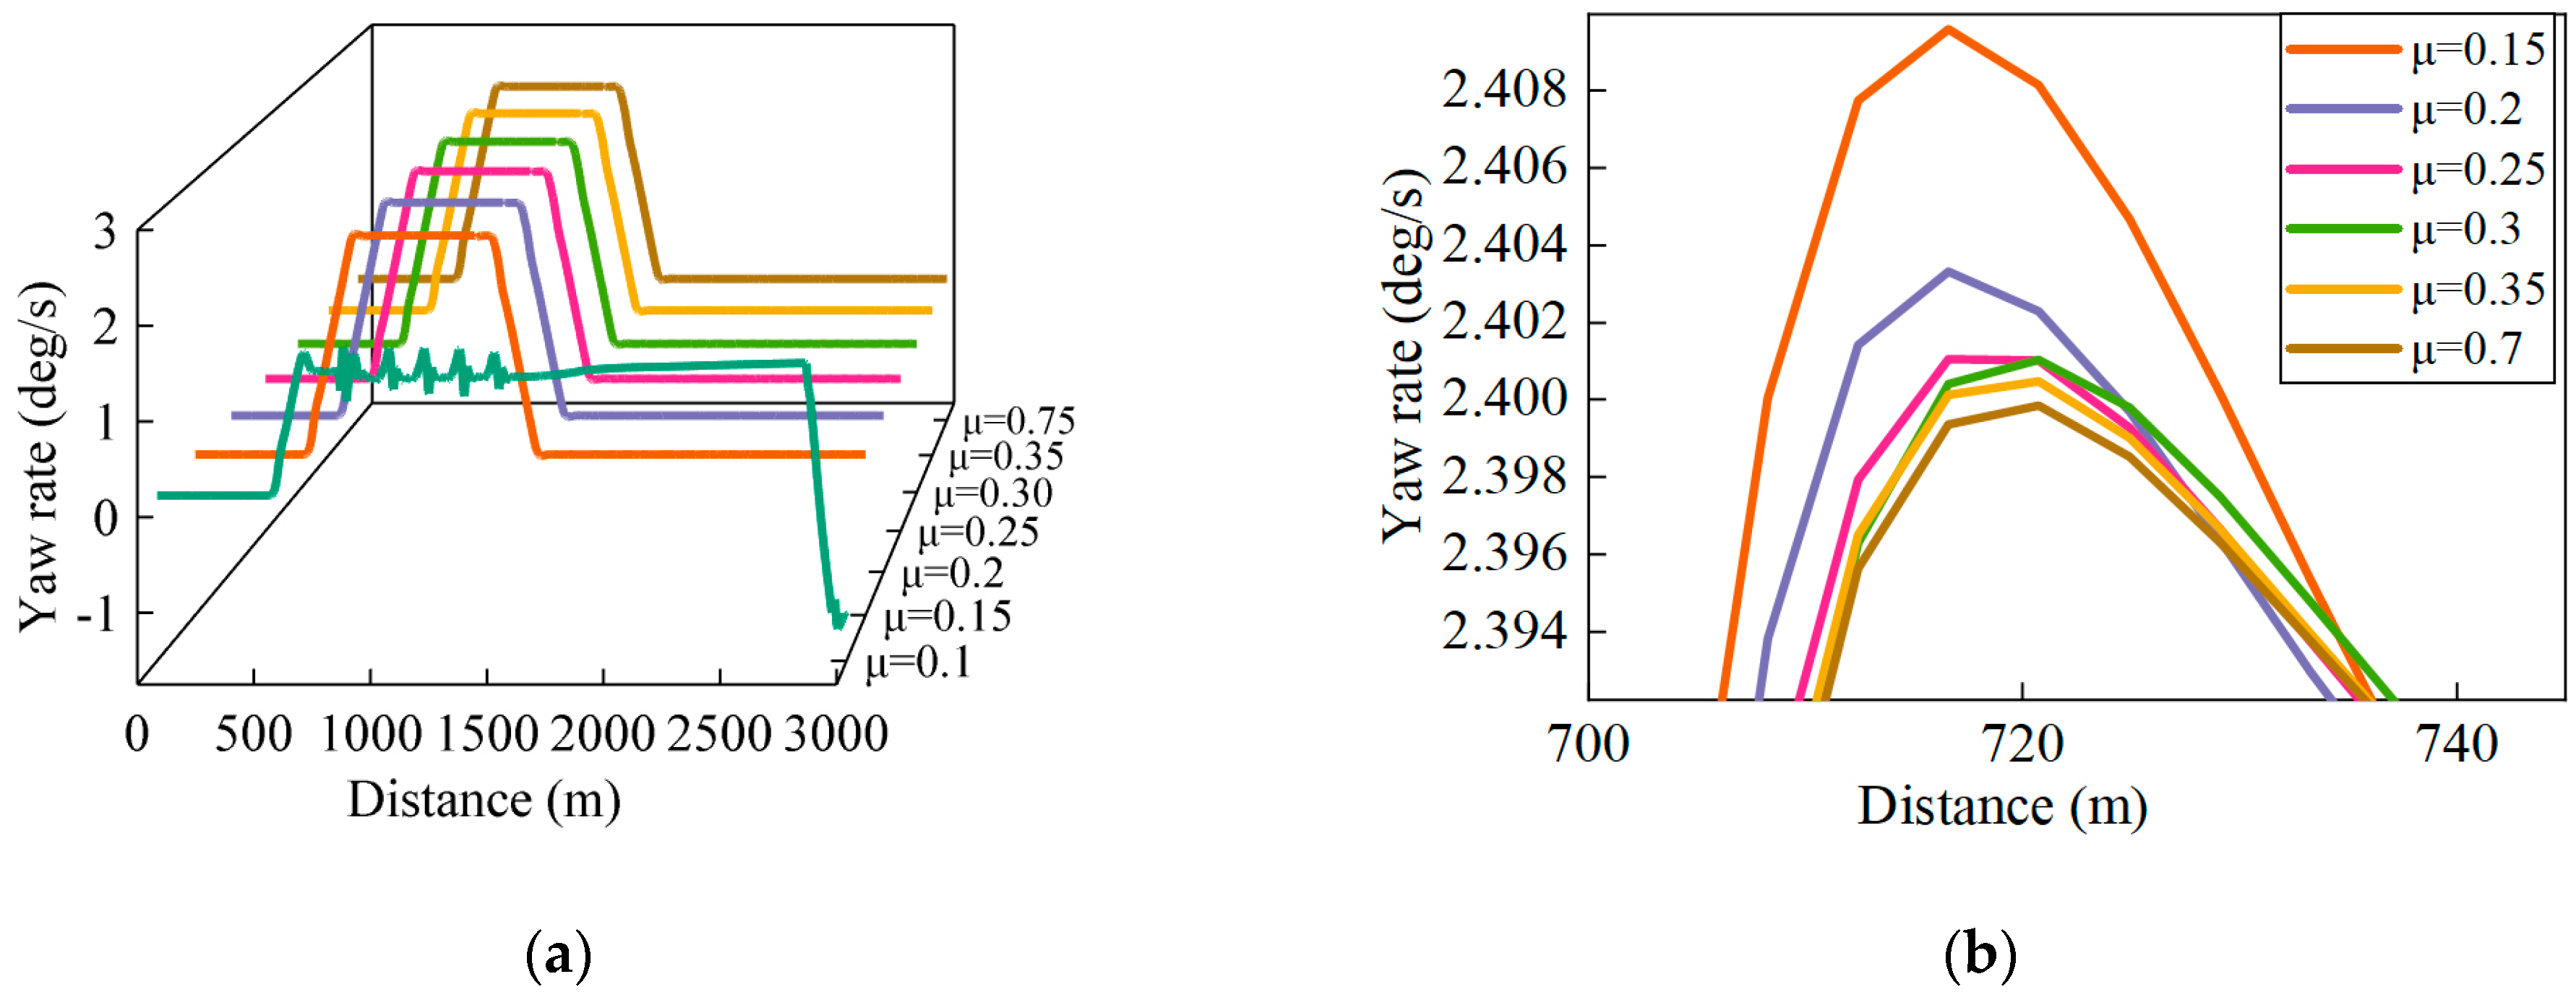
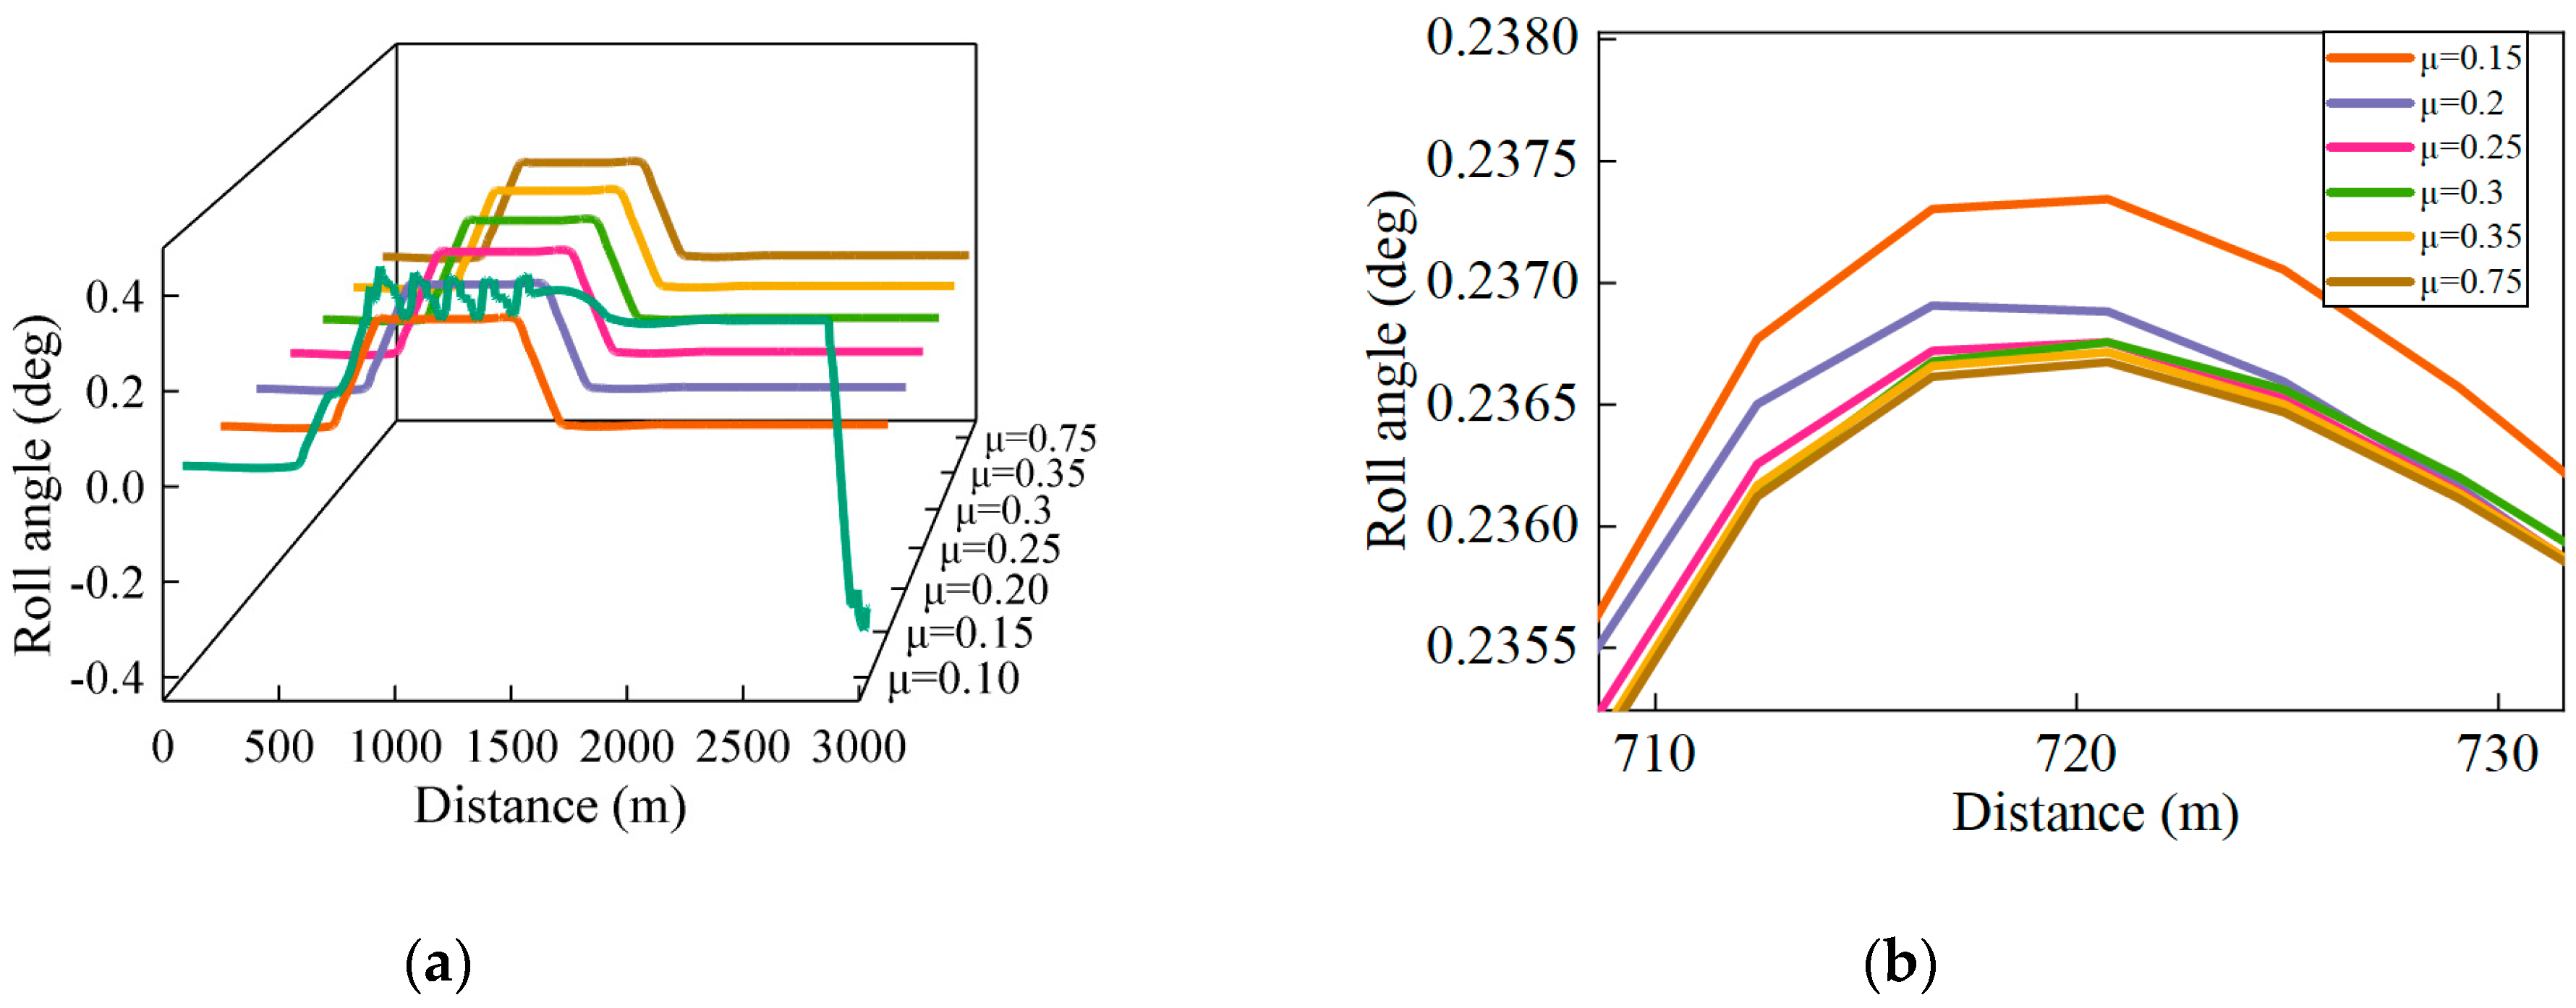
4.3. Influence of Road Adhesion Coefficient on Vehicle Lateral Stability

Figure 10, Figure 11, Figure 12 and Figure 13 show the relationships between lateral offset, lateral acceleration, yaw rate, roll angle, and changes in the adhesion coefficient while driving on various types of snowy and icy roads. The simulation results demonstrate that the road adhesion coefficient has an insignificant influence on each indicator. The plots in the figures show similar trends, with each indicator having a negative correlation. Furthermore, a lower road adhesion coefficient results in higher indicator values, resulting in decreased driving safety.
As seen in Figure 10, the lateral offset of the vehicle increases dramatically when the road adhesion coefficient decreases. When the road adhesion coefficient is 0.1, the adhesion between the road and the tires is limited, and the tires are unable to effectively counteract the centrifugal force on the curve. As a result, the vehicle suffers from severe sideslip and loses lateral stability. On the entire road, the offset of snow and ice with road adhesion coefficients ranging from 0.15 to 0.35 is nearly 0. The maximum offsets, as shown in the localized magnification figure, are 0.0289 m, 0.0244 m, 0.0228 m, 0.0212 m, and 0.0208 m, which do not reach the critical point of affecting vehicle safety and even differ very little from that of the dry asphalt road, which is 0.020 m. The slight offsets may just be typical offsets caused by the driver making slight adjustments to the steering wheel to ensure normal passage through the curve and are significantly lower than the lateral offset threshold value of 0.3 m.
Figure 11, Figure 12 and Figure 13 show that within the 0.15–0.35 road adhesion coefficient range, variations in lateral acceleration, yaw rate, and roll angle are minimal, resulting in essentially overlapping plots. Each indicator remains close to 0 throughout the straight. After the vehicle enters the curve, every indicator gradually rises to its maximum value and remains constant, finally returning to near 0 once the vehicle exits the curve. The local zoom-in diagram also reveals that the difference in indicator values between the snowy and icy road and the dry asphalt road is negligible and far below the safety threshold, ensuring safe vehicle operation. However, when the road adhesion coefficient is 0.1, the road surface resistance decreases, resulting in frequent fluctuations in the plots shown in the figure and vehicle sideslip instability.
We also performed a multi-case simulation, altering the road adhesion coefficients from 0.10 to 0.35 at intervals of 0.1, to establish the speed threshold when the vehicle negotiates a curve with a minimum radius of 400 m under varied snowy and icy road conditions. The goal of this part of the study was to determine the lowest speed at which the vehicle encounters lateral instability. Table 4 summarizes the critical speed corresponding to the lateral instability of the vehicle under the snowy and icy road conditions by extracting the tire vertical reaction force curves from the CarSim simulation results and combining them with the 3D animation in CarSim to visually judge the real operating state of the vehicle. The results show that when the road adhesion coefficient decreases, so does the critical speed. A lower road adhesion coefficient also increases the risk of vehicle sideslips. Road adhesion coefficients in the 0.10–0.20 range caused sideslip first, while those in the 0.21–0.35 range caused rollover first, which is consistent with the findings of Shin and Lee et al. [22,23]. One possible explanation is that with increasing road adhesion coefficients, speed, rather than the road adhesion coefficient, becomes the primary element determining crashes. When the critical speed of the sideslip exceeds the critical speed of rollover, the vehicle is less prone to sideslipping. Higher speeds cause rollover [63,70], making rollover the most common cause of crashes in this speed range and on dry roads [84]. The lower the road coefficient of adhesion, the less tire adhesion there is, and the critical speed for sideslip is less than the critical speed for rollover, so the smoother the road surface, the more likely it is that a vehicle with a low center of gravity will tend to sideslip first [1]. In reality, both situations are possible on icy roads, which are extremely smooth, such as a sideslip followed by a collision with a guardrail or meeting a barrier and tripping a rollover [34].

5. Discussion

5.1. Sensitivity Analysis of Lateral Instability Factors

The study’s findings establish that decreasing vehicle speed, increasing road adhesion coefficient, or increasing curve radius can effectively decrease the vehicle’s lateral offset, lateral acceleration, yaw rate, and roll angle, which has a positive effect on preventing sideslip or rollover. The impact of influencing factors is not independent [62]. Vehicle rollover or sideslip is frequently influenced by multiple factors, resulting in a highly complex interaction mechanism. We used a three-factor, three-level orthogonal test to identify the most important impact factors. Curve radii of 400 m, 600 m, and 1000 m were used in the experiment, with road adhesion coefficients of 0.10, 0.25, and 0.35 representing ice road, snow slurry road, and loose snow road conditions, respectively. The speeds tested were 60, 70, and 80 km/h. The simulation made use of the previously specified road and vehicle models. Figure 14 illustrates the combined factor test findings obtained from the analysis of range and the analysis of variance (ANOVA).
According to the results of both the analysis of range and the analysis of variance, the factors influencing vehicle sideslip are in the following sensitivity order: curve radius > road adhesion coefficient > speed. First of all, the curve radius has the greatest influence on vehicle sideslip, owing to the forces involved at the curve, such as increased centrifugal force and poorer road adhesion in snowy and icy conditions. Furthermore, because the vehicle needs to adjust its trajectory while traveling through the curve, the combined effect of these multiple factors increases the likelihood of sideslips. A lower curve radius, in particular, results in a greater centrifugal force at the curve, reducing the lateral force on the snowy and icy road and making it challenging for the vehicle to overcome the centrifugal force. It also results in a higher lateral deviation in the vehicle’s path after the sideslip. The road adhesion coefficient is second only to the curve radius. The lower the adhesion coefficient, the more likely a vehicle is to sideslip. This is due to the vehicle’s sideslip-critical situation, in which the lateral force is less than or equal to the lateral adhesion between the tire and the road. As a result, differences in road adhesion coefficient across different types of icy and snowy roads have a significant influence on vehicle sideslip. Finally, the influence of speed on vehicle sideslip is relatively slight, especially on straight highways where it has little effect on lateral stability. Even at the top speed restriction of 80 km/h, the vehicle can continue to drive properly because gravity keeps the vehicle balanced and unaffected by centrifugal force. On curved roads, however, vehicle stability must account for both lateral and centrifugal forces, with the latter being proportional. If the centrifugal force increases and the adhesion decreases, the vehicle is more likely to sideslip. At this point, the speed for the severity of the crash has a considerable influence. As a result, enforcing acceptable speed limits remains critical. Furthermore, when it comes to snow and ice, the curve radius remains unchanged. To prevent the vehicle from sideslipping, salt must be scattered on the road surface, sand must be laid, a snow melting agent must be sprayed, or mechanical deicing must be performed to improve the road adhesion coefficient. At the same time, drivers should be reminded to slow down and avoid risky behaviors such as sudden braking and sharp turns.
The sensitivity order of factors influencing vehicle rollover in snowy and icy road conditions is speed > curve radius > road adhesion coefficient. In contrast to sideslip, speed has the greatest influence on rollover. The probable reason for this is that the critical speed for a sideslip on a curved road is lower than the critical speed for a rollover. When the speed becomes too high, the lateral force generates an overturning moment that exceeds the stabilizing moment, making it difficult for the driver to manage the vehicle properly. As a result, this factor has the greatest influence on rollover occurrences. This is followed by curve radius, and because of the inverse relationship between centrifugal force and radius as well as its direct proportionality to speed, centrifugal force becomes more significant at greater speeds, magnifying the influence of speed compared to curve radius. Although the road adhesion coefficient has a smaller effect on rollovers, it is still considerable and has a strong association with rollover crashes. Therefore, to improve driving safety in areas prone to snow and ice, road design should prioritize the use of bigger curve radii. Furthermore, the use of changeable speed limit signs and dynamic speed limit systems can successfully remind drivers to maintain lower speeds and employ safe driving strategies. At the same time, timely melting and other snow removal measures are critical to improving road adhesion during snowfall. Thereby reducing road traffic crashes in snowy and icy weather conditions.

5.2. Prevention of Lateral Instability Crashes

It is extremely useful to develop appropriate prevention and control measures based on the influencing factors connected to lateral instability incidents discussed in the preceding sections. In road alignment parameters, the radius and position of the curve should be emphasized. In regions prone to snow and ice, particular consideration must be given to reducing lateral instability during road design. Curved roads include, for example, mountainous highways and highways with frequent hairpin curves. The probability of traffic crashes on such roads increases in snowy and icy conditions. As a result, road design should prioritize vehicle driving characteristics in adverse weather conditions. Avoiding sharp curves and long downhill slopes is part of this. Tunnels, if necessary, can be used to alleviate poor linear road parameters. These methods, however, are primarily applicable to new roads and are not feasible for existing roads.
Implementing suitable speed restrictions on constructed and operational highways is a beneficial safety measure [85]. Given the large alterations in road adhesion coefficients, environmental conditions, and field of view during adverse weather, stricter speed limits for roads are required. The existing standards’ design speeds do not account for adverse weather conditions such as snow and ice. Furthermore, restricted speeds in good weather conditions may not ensure vehicle safety. This is due to the theory’s reduction of the vehicle to a point-mass model, which fails to account for the distribution of forces on the wheels [86]. Furthermore, vehicles will inevitably encounter unforeseen situations, necessitating actions such as emergency braking and sharp turns [48]. As a result, reducing the speed limit even more on smooth roads during snowy and icy weather is critical to ensure driving safety [18]. On primary roads, a dynamic speed limit system is used to dynamically adjust speed limit values based on real-time changes in snowy and icy roads. This information is then conveyed to drivers by signs, displays, broadcasts, etc. Providing accurate road information is an important line of defense for ensuring driving safety in snowy and icy conditions.
v = f ( R , μ ) = 0.2092 R 71.24 μ 0.7986 R μ 0.0001235 R 2 + 99.03 μ 2 0.001666 ( μ R ) 2 + 0.0007382 μ R 2 + 1.67 μ 2 R + 1
We conducted the following experiments to determine the dynamic speed limit values for various roads: For curve roads with a radius of 100–1000 m, 1000 sets of random numbers representing road adhesion coefficients were generated. The critical speeds at which vehicles failed to pass through the established working conditions for the first time under various snowy and icy road conditions were then determined using simulation tests. Table 5 summarizes the results. Based on the findings in Table 5, we developed a model for calculating the dynamic speed threshold under various conditions (Equation (10)), with curve radius and road adhesion coefficient as independent variables.
Where μ 0.1 , 0.35 . The curve fitting produces a fit of 0.9899, suggesting that the curve is well-fitted. Figure 15 shows the graphs for the speed threshold fitting and residual analysis. We compared the computational accuracy of the speed threshold model to models proposed by Lusetti et al. [87] and Lee et al. [88] in related studies. The error was roughly 10%, indicating that the model established in this study was reasonable. Based on changing snowy and icy road conditions, The road traffic management department can apply Equation (10) to anticipate speed thresholds. The estimated speed limit figure can then be shown on variable information signs along different roads by dynamic scrolling screens. They can also assign grades to different road sections and periods based on factors such as road alignment, road adhesion coefficient, and traffic volume. The classified strategy is input into the real-time dynamic speed limit system, and different speed limit measures are implemented based on different road conditions to provide accurate road information to drivers while avoiding increasing the risk of sideslip and rollover due to an excessively high-speed limit or causing congestion due to an insufficiently low-speed limit. Roads in areas with heavy snow and ice should be closed as needed.
Driver behavior, on the other hand, is an important aspect that should not be disregarded. According to research, many experienced drivers demonstrate overconfidence and disregard changes in the speed limit while driving, occasionally turning to higher speeds or even overtaking behaviors to save time [89,90]. Although unfamiliar drivers may be more aware, they face higher challenges in reacting to and adapting to their surroundings due to poorer road conditions in adverse weather [91]. This challenge is particularly acute for older drivers, who struggle to adjust their driving strategies in time when confronted with risks [92]. Furthermore, a driver’s age might have a substantial impact on driving safety. Inexperienced drivers conducting risk assessments on snowy and icy roads may struggle to appropriately judge the smoothness of the road surface based solely on eye observation. Visually determining whether the road surface is moist or covered with black ice, particularly at temperatures around 0 °C [93], could be challenging. These challenges have a significant impact on the driver’s vehicle handling. Physical device installation is an efficient way to combat these factors. By improving the material of the anti-skid chain, the friction between the tire and the road surface is enhanced, resulting in the development of a new type of snow chain system. Using an automation device on the vehicle, automatic installation can be realized anytime and anywhere. When combined with deep learning algorithms, sensors and other equipment can be used to feed back and collect road conditions and input them into the speed limit system. This can then be combined with intelligent transportation systems such as safety speed controllers and in-vehicle curve speed warning systems to prompt drivers for appropriate speed adjustments and prevent unsafe driving practices. Drivers use braking strategies to avoid sideslips or rollovers in curves and appropriate braking minimizes the risk of driving in curves, whereas emergency braking increases the likelihood of lateral instability. When braking deceleration approaches −4.0 m/s2 on dry roads, safety suffers dramatically [94], and the chance of sideslip and rollover increases when driving on icy roads with the same braking force. As a result, stricter braking requirements are required in snowy and icy conditions. Given the varying risk levels of different icy roads and drivers’ diverse reactions, the key focus of our future research will be to determine the specific braking force required, as well as the appropriate time and location, to achieve a similar braking effect as on dry roads, ensuring safe vehicle passage through curves. Furthermore, substantial safety education and publicity should be conducted, and drivers should receive rigorous training to improve their risk awareness and reduce crash occurrences.

6. Conclusions

This study focuses on focusing on the influencing factors, considering the characteristics of vehicles, drivers, roads, and environment based on an actual road, and establishing a CarSim vehicle dynamics simulation model to simulate driving scenarios with 20 different factors in icy and snowy weather conditions. Using four lateral instability evaluation indicators (lateral offset, lateral acceleration, yaw rate, and roll angle), this study analyzes the influence laws of three influencing factors (vehicle speed, curve radius, and snowy and icy road type) on sideslip and rollover in single-vehicle crashes. A sensitivity analysis of the influencing factors of lateral instability crashes is then performed using the three-factor and three-level orthogonal test, and the interaction mechanism of the influencing factors in sideslip and rollover crashes is explored, as well as the calculation model of the dynamic speed threshold of a vehicle driving in snowy and icy weather conditions. The main findings can be summarized as follows:
(1)
The lateral offset, representing the cumulative risk, and the roll angle, lateral acceleration, and yaw rate in the X-, Y-, and Z-axis directions of the vehicle’s three-dimensional kinematic coordinate system were selected as the indicators to represent the lateral instability of the vehicle in motion. The study also determined the thresholds for these indicators to identify occurrences of lateral instability. According to the study, speed and curve radius have a substantial influence on each evaluation indicator. However, snowy and icy roads have a relatively lower influence on vehicle driving. The higher their unfavorable values, the faster the evaluation indicators reach the dangerous state of lateral instability. As a result, the driver has less time to react and adjust their maneuvers, increasing the risk of a vehicle sideslip and rollover.
(2)
Curved roads are susceptible to sideslips and rollovers, especially at the entrance to the curve, where lateral instability is most likely to occur. Furthermore, lower curve radii increase the risk of lateral instability crashes. On straight roads, however, speed and snowy or icy conditions have minimal influence on the vehicle’s lateral stability. As such, vehicles may still drive on snowy roads safely at speeds up to 80 km/h. Sideslip incidents occur on icy and compacted-snow roads, while rollover incidents are more likely on slushy and loose-snow roads. Multiple factors contribute to vehicle lateral instability incidents in snowy and icy weather, with a smaller curve radius and greater speed posing the greatest risk. In particular, the curve radius has the largest influence on sideslip, whereas speed has the biggest influence on rollover.
(3)
In adverse circumstances, establishing a reasonable speed limit is an important approach to enhancing road traffic safety. To prevent lateral instability, a calculation model for the dynamic speed threshold of vehicles is developed, taking into account the road adhesion coefficient and curve radius. This model is applicable to a variety of snowy and icy weather conditions.
v = f ( R , μ ) = 0.2092 R 71.24 μ 0.7986 R μ 0.0001235 R 2 + 99.03 μ 2 0.001666 ( μ R ) 2 + 0.0007382 μ R 2 + 1.67 μ 2 R + 1
The road traffic management department might determine the appropriate speed limit value by considering the curve radius of various road sections and the change in snowy and icy road conditions. Through dynamic variable information signs, accurate road information is provided for drivers. Combined with intelligent and connected technology, the driver’s behavior is modified.
(4)
This study deeply analyzes the influencing factors and mechanisms of driving safety in snowy and icy weather. It provides potential theoretical insights and practical measures for the road traffic management departments with the goal of improving overall traffic safety in extreme snowy and icy weather conditions. However, there are some limitations. On the one hand, only the influence factors on driving safety are discussed. In the follow-up study, we can explore the interactions between different influencing factors and go further into the rules to take more targeted measures. Furthermore, we plan to test the driving safety of low-grade roads in snowy and icy weather conditions, particularly those with poor alignment characteristics such as a small radius and a steep slope in mountainous and rural areas. At the same time, we will also consider testing the worst-case scenario of a snowstorm, which will make the research results more applicable. In addition, it is necessary to further improve the sensitivity analysis method of influencing factors so that it can solve more complicated risky driving environments, which can then be applied to more driving conditions, and provide more accurate prevention and control schemes.

Author Contributions

The authors confirm their contributions to this paper as follows: Conceptualization, Q.W. and W.S.; methodology, Q.W., Y.Z., L.L., L.K. and W.S.; software, Y.Z., L.L. and L.K.; writing—original draft preparation, Q.W., Y.Z., L.L. and L.K.; writing—review and editing, Q.W., Y.Z., L.L., L.K. and W.S.; supervision, Q.W. and W.S. All authors have read and agreed to the published version of the manuscript.

Funding

This research did not receive any specific grant from funding agencies in the public, commercial, or not-for-profit sectors.

Institutional Review Board Statement

Not applicable.

Informed Consent Statement

Not applicable.

Data Availability Statement

The data presented in this study are available in the article.

Conflicts of Interest

The authors declare no conflict of interest.

Appendix A

Table A1. The main parameters of the model vehicle.
ParametersValue
Sprung mass1165 (kg)
Height of center of mass 520 (mm)
Front overhang1110 (mm)
Rear overhang1756 (mm)
Roll inertia671.3 (kg/m2)
Pitch inertia1972.8 (kg/m2)
Yaw inertia2315.3 (kg/m2)
Front tire180/65 R15
Rear tire180/65 R15
Front wheelbase1550 (mm)
Rear wheelbase1550 (mm)
ABS
Front wheel torque500 (N * m/Mpa)
Rear wheel braking torque250 (N * m/Mpa)
Table A2. Column-by-column coordinates and elevation of real roads.
NumberCoordinateElevation
XY
K6+0003,138,271.952419,012.98770.794
K6+0203,138,252.846419,018.72070.594
K6+0323,138,240.070419,019.82570.415
K6+0403,138,232.908419,019.86670.247
K6+0603,138,212.908419,019.88869.659
K6+0623,138,210.070419,019.87069.464
K6+0803,138,192.910419,019.60568.603
K6+1203,138,152.945419,017.97166.672
K6+1303,138,142.822419,017.39566.275
K6+1403,138,132.979419,016.80465.882
K6+1553,138,117.893419,015.54565.463
K6+1603,138,113.066419,014.97765.367
K6+1803,138,093.349419,011.65664.733
K6+2003,138,073.961419,006.77064.146
K6+2203,138,055.025419,000.35163.621
K6+2213,138,053.702418,999.83863.518
K6+2403,138,036.395418,993.07562.972
K6+2583,138,018.907418,986.24162.421
K6+2603,138,017.767418,985.79662.348
K6+2803,137,999.058418,978.72661.798
K6+2993,137,980.501418,972.13161.220
K6+3003,137,980.212418,972.03261.135
K6+3203,137,961.302418,965.52160.624
K6+3403,137,942.392418,959.00960.038
K6+3603,137,923.481418,952.49859.426
K6+3753,137,908.435418,947.31758.865
K6+3803,137,904.573418,945.98158.653
K6+4003,137,885.223418,940.98157.882
K6+4603,137,825.628418,941.80555.342
K6+4643,137,820.861418,942.92254.901
K6+4803,137,806.089418,946.05154.206
K6+5003,137,786.243418,948.46353.233
K6+5033,137,783.082418,948.66353.140
K6+5203,137,766.296418,949.90852.365
K6+5403,137,746.431418,952.21151.445
K6+5603,137,726.689418,955.40450.524
K6+5803,137,707.111418,959.48149.604
K6+6003,137,687.736418,964.43348.683
K6+6203,137,668.602418,970.25147.762
K6+6403,137,649.750418,976.92247.221
K6+6443,137,645.453418,978.57846.630

References

  1. Alrejjal, A.; Farid, A.; Ksaibati, K. A correlated random parameters approach to investigate large truck rollover crashes on mountainous interstates. Accid. Anal. Prev. 2021, 159, 106233. [Google Scholar] [CrossRef]
  2. National Center for Statistics and Analysis. 2020: A Compilation of Motor Vehicle Crash Data (Report No. DOT HS 813 375). National Highway Traffic Safety Administration. Available online: https://www.safetylit.org/citations/index.php?fuseaction=citations.viewdetails&citationIds%5B%5D=citreport_525_12 (accessed on 15 November 2022).
  3. Mergia, W.Y.; Eustace, D.; Chimba, D.; Qumsiyeh, M. Exploring factors contributing to injury severity at freeway merging and diverging locations in Ohio. Accid. Anal. Prev. 2013, 55, 202–210. [Google Scholar] [CrossRef]
  4. Black, A.W.; Mote, T.L. Effects of winter precipitation on automobile collisions, injuries, and fatalities in the United States. J. Transp. Geo. 2015, 48, 165–175. [Google Scholar] [CrossRef]
  5. Yu, H.; Yuan, R.; Li, Z.; Zhang, G.; Ma, D.T. Identifying heterogeneous factors for driver injury severity variations in snow-related rural single-vehicle crashes. Accid. Anal. Prev. 2020, 144, 105587. [Google Scholar] [CrossRef]
  6. FHWA Road Weather Management, Snow and Ice. Available online: https://ops.fhwa.dot.gov/weather/weather_events/snow_ice.htm (accessed on 23 December 2021).
  7. Brázdil, R.; Chromá, K.; Zahradníček, P. Weather and traffic accidents in the Czech Republic, 1979–2020. Theor. Appl. Climatol. 2022, 149, 153–167. [Google Scholar] [CrossRef]
  8. Becker, N.; Rust, H.W.; Ulbrich, U. Weather impacts on various types of road crashes: A quantitative analysis using generalized additive models. Eur. Transp. Res. Rev. 2022, 14, 37. [Google Scholar] [CrossRef]
  9. Malin, F.; Norros, I.; Innamaa, S. Accident risk of road and weather conditions on different road types. Accid. Anal. Prev. 2019, 122, 181–188. [Google Scholar] [CrossRef]
  10. City of Edmonton. “Motor Vehicle Collisions”. Available online: https://www.edmonton.ca/transportation/traffic_safety/motor-vehicle-collisions.aspx (accessed on 17 December 2022).
  11. Kim, D.; Jung, S.; Yoon, S. Risk Prediction for Winter Road Accidents on Expressways. Appl. Sci. 2021, 11, 9534. [Google Scholar] [CrossRef]
  12. Snow Cover. Available online: https://ru.wikipedia.org/wiki/ (accessed on 25 March 2023).
  13. FHWA Road Weather Management—Winter Maintenance Virtual Clearinghouse: Technical Briefs. Available online: https://ops.fhwa.dot.gov/weather/resources/publications/tech_briefs/tech_briefs.htm (accessed on 13 March 2022).
  14. Salt Smart Transportation Association of Canada. Available online: https://www.yumpu.com/en/document/view/11245246/salt-smart-transportation-association-of-canada (accessed on 25 March 2023).
  15. Pang, J.; Krathaus, A.; Benedyk, I.; Ahmed, S.S.; Anastasopoulos, P.C. A temporal instability analysis of environmental factors affecting accident occurrences during snow events: The random parameters hazard-based duration model with means and variances heterogeneity. Anal. Methods Accid. Res. 2022, 34, 100215. [Google Scholar] [CrossRef]
  16. Shaheed, M.S.; Gkritza, K.; Carriquiry, A.L.; Hallmark, S.L. Analysis of Occupant Injury Severity in Winter Weather Crashes: A Fully Bayesian Multivariate Approach. Anal. Methods Accid. Res. 2016, 11, 33–47. [Google Scholar] [CrossRef]
  17. Maze, T.H.; Agarwal, M.; Burchett, G. Whether Weather Matters to Traffic Demand, Traffic Safety, and Traffic Operations and Flow. Transp. Res. Rec. 2006, 1948, 170–176. [Google Scholar] [CrossRef]
  18. Wang, Y.; Liang, L.; Evans, L. Fatal crashes involving large numbers of vehicles and weather. J. Safety Res. 2017, 63, 1–7. [Google Scholar] [CrossRef]
  19. Abohassan, A.; El-Basyouny, K.; Kwon, T.J. Exploring the associations between winter maintenance operations, weather variables, surface condition, and road safety: A path analysis approach. Accid. Anal. Prev. 2021, 163, 106448. [Google Scholar] [CrossRef]
  20. Hallmark, B.; Dong, J. Developing Roadway Safety Models for Winter Weather Conditions Using a Feature Selection Algorithm. J. Adv. Transp. 2020, 2020, 8824943. [Google Scholar] [CrossRef]
  21. Zhu, Y.; Li, H.; Wang, K.; Bao, Y.; Zeng, P. A Simulation Study for Lateral Stability Control of Vehicles on Icy Asphalt Pavement. J. Adv. Transp. 2022, 6, 7361881. [Google Scholar] [CrossRef]
  22. Shin, J.; Lee, I. Reliability analysis and reliability-based design optimization of roadway horizontal curves using a first-order reliability method. Eng. Optim. 2015, 47, 622–641. [Google Scholar] [CrossRef]
  23. Tian, L.; Li, Y.; Li, J.; Lv, W. A simulation based large bus side slip and rollover threshold study in slope-curve section under adverse weathers. PLoS ONE 2021, 16, e0256354. [Google Scholar] [CrossRef]
  24. Juga, I.; Nurmi, P.; Hippi, M. Statistical modelling of wintertime road surface friction. Met. Apps. 2013, 20, 318–329. [Google Scholar] [CrossRef]
  25. Peters, S.C.; Iagnemma, K. Stability measurement of high-speed vehicles. Veh. Syst. Dyn. 2009, 47, 701–720. [Google Scholar] [CrossRef]
  26. Yan, M.; Xu, J.; Han, S.; Xin, T.; Wang, O.; Yi, Z.; Liu, Z. Permitted speed decision of single-unit trucks with emergency braking maneuver on horizontal curves under rainy weather. PLoS ONE 2021, 16, e0261975. [Google Scholar] [CrossRef]
  27. Alrejjal, A.; Ksaibati, K. Impact of combined alignments and different weather conditions on vehicle rollovers. KSCE J. Civ. Eng. 2022, 26, 893–906. [Google Scholar] [CrossRef]
  28. Alrejjal, A.; Ksaibati, K. Impact of combined alignments and adverse weather conditions on vehicle skidding. J. Traffic. Transp. Eng. 2023, 10, 116–131. [Google Scholar] [CrossRef]
  29. Xu, J.; Lv, W.; Gao, C.; Bi, Y.; Mu, M.; E, G. Why Do Drivers’ Collision Avoidance Maneuvers Tend to Cause SUVs to Sideslip or Rollover on Horizontal Curve and Grade Combinations?—An Analysis of the Causes Based on a Modified Multibody Dynamics Model. Int. J. Environ. Res. Public Health 2022, 19, 15877. [Google Scholar] [CrossRef]
  30. Aram, A. Effective safety factors on horizontal curves of two-lane highways. J. Appl. Sci. 2010, 10, 2814–2822. [Google Scholar] [CrossRef]
  31. Abdi Kordani, A.; Tavassoli, B.; Sabbaghian, M.H. Analyzing the Influence of Coinciding Horizontal Curves and Vertical Sag Curves on Side Friction Factor and Lateral Acceleration Using Simulation Modeling; International Symposium on Highway Geometric Design (ISHGD): Vancouver, BC, Canada, 2015. [Google Scholar]
  32. Wang, X.; Wang, T.; Tarko, A.P.; Tremont, P. The influence of combined alignments on lateral acceleration on mountainous freeways: A driving simulator study. Accid. Anal. Prev. 2015, 76, 110–117. [Google Scholar] [CrossRef]
  33. Alrejjal, A.; Ksaibati, K. Impact of mountainous interstate alignments and truck configurations on rollover propensity. J. Safety Res. 2022, 80, 160–174. [Google Scholar] [CrossRef]
  34. Yin, Y.; Wen, H.; Sun, L.; Hou, W. The Influence of Road Geometry on Vehicle Rollover and Skidding. Int. J. Environ. Res. Public Health 2020, 17, 1648. [Google Scholar] [CrossRef]
  35. Qu, G.; He, Y.; Sun, X.; Tian, J. Modeling of Lateral Stability of Tractor-Semitrailer on Combined Alignments of Freeway. Discrete Dyn. Nat. Soc. 2018, 2018, 8438921. [Google Scholar] [CrossRef]
  36. Jin, Z.; Li, J.; Huang, Y.; Khajepour, A. Study on Rollover Index and Stability for a Triaxle Bus. Chin. J. Mech. Eng. 2019, 32, 64. [Google Scholar] [CrossRef]
  37. Larish, C.; Piyabongkarn, D.; Tsourapas, V.; Rajamani, R. A new predictive lateral load transfer ratio for rollover prevention systems. IEEE Trans. Veh. Technol. 2013, 62, 2928–2936. [Google Scholar] [CrossRef]
  38. Mauriello, F.; Montella, A.; Pernetti, M.; Galante, F. An Exploratory Analysis of Curve Trajectories on Two-Lane Rural Highways. Sustainability 2018, 10, 4248. [Google Scholar] [CrossRef]
  39. Xu, J.; Luo, X.; Shao, Y. Vehicle trajectory at curved sections of two-lane mountain roads: A field study under natural driving conditions. Eur. Transp. Res. Rev. 2018, 10, 12. [Google Scholar] [CrossRef]
  40. Han, I.; Rho, K. Characteristic analysis of vehicle rollover accidents: Rollover scenarios and prediction/warning. Int. J. Automot. Technol. 2017, 18, 451–461. [Google Scholar] [CrossRef]
  41. Bae, J.; Kim, T.; Lee, W.; Shim, I. Curriculum Learning for Vehicle Lateral Stability Estimations. IEEE Acc. 2021, 9, 89249–89262. [Google Scholar] [CrossRef]
  42. Guo, L.; Zhao, Y.; Li, L.; Ge, P.; Huang, X. Antisideslip and Antirollover Safety Speed Controller Design for Vehicle on Curved Road. Math. Probl. Eng. 2014, 2014, 253176. [Google Scholar]
  43. Yildiz, A.; Özel, M.A. A Comparative Study of Energy Consumption and Recovery of Autonomous Fuel-Cell Hydrogen–Electric Vehicles Using Different Powertrains Based on Regenerative Braking and Electronic Stability Control System. Appl. Sci. 2021, 11, 2515. [Google Scholar] [CrossRef]
  44. Abdi Kordani, A.; Javadi, S.; Fallah, A. The Effect of Shoulder on Safety of Highways in Horizontal Curves: With Focus on Roll Angle. KSCE J. Civ. Eng. 2018, 22, 3153–3161. [Google Scholar] [CrossRef]
  45. Behnood, A.; Al-Bdairi, N. Determinant of injury severities in large truck crashes: A weekly instability analysis. Saf. Sci. 2020, 131, 104911. [Google Scholar] [CrossRef]
  46. Deutermann, W. Characteristics of Fatal Rollover Crashes; National Center for Statistics and Analysis: Washington, DC, USA, 2002. [Google Scholar]
  47. Cheng, G.; Cheng, R.; Xu, L. Research on speed limit of highway horizontal curve based on roadside accident discrimination. J. Transp. Syst. Eng. Inf. Technol. 2020, 20, 223–227. [Google Scholar]
  48. Xin, T.; Xu, J.; Gao, C.; Sun, Z. Research on the speed thresholds of trucks in a sharp turn based on dynamic rollover risk levels. PLoS ONE 2021, 16, e0256301. [Google Scholar] [CrossRef]
  49. Gallen, R.; Hautière, N.; Cord, A.; Glaser, S. Supporting Drivers in Keeping Safe Speed in Adverse Weather Conditions by Mitigating the Risk Level. IEEE Trans. Intell. Transp. Syst. 2013, 14, 1558–1571. [Google Scholar] [CrossRef]
  50. Wang, B.; Hallmark, S.L.; Savolainen, P.T.; Dong, J. Examining vehicle operating speeds on rural two-lane curves using naturalistic driving data. Accid. Anal. Prev. 2018, 118, 236–243. [Google Scholar] [CrossRef] [PubMed]
  51. Zhang, M.; Hua, G.; Zhang, C.; Ogle, J. Research on the Horizontal Curve’s Radius under Coupling Effects of Uneven Adhesion Coefficient and Crosswind. J. Traffic. Transp. Eng. 2015, 2, 346–352. [Google Scholar] [CrossRef]
  52. Hansen, R.; Chang, K. Horizontal and Vertical Curvature and its Effects on Driver Passing Choice. Transp. Res. Rec. 2019, 2673, 734–742. [Google Scholar] [CrossRef]
  53. Wang, H.; Zhou, J.; Hu, C.; Chen, W. Vehicle Lateral Stability Control Based on Stability Category Recognition with Improved Brain Emotional Learning Network. IEEE Trans. Veh. Technol. 2022, 71, 5930–5943. [Google Scholar] [CrossRef]
  54. Sentouh, C.; Glaser, S.; Mammar, S. Advanced vehicle–infrastructure–driver speed profile for road departure accident prevention. Veh. Syst. Dyn. 2006, 44, 612–623. [Google Scholar] [CrossRef]
  55. You, K.; Sun, L.; Gu, W. Reliability-based risk analysis of roadway horizontal curves. J. Transp. Eng. 2012, 138, 1071–1081. [Google Scholar] [CrossRef]
  56. Dhahir, B.; Hassan, Y. Probabilistic, safety-explicit design of horizontal curves on two-lane rural highways based on reliability analysis of naturalistic driving data. Accid. Anal. Prev. 2019, 123, 200–210. [Google Scholar] [CrossRef]
  57. Zolali, M.; Mirbaha, B.; Layegh, M.; Behnood, H.R. A Behavioral Model of Drivers’ Mean Speed Influenced by Weather Conditions, Road Geometry, and Driver Characteristics Using a Driving Simulator Study. Adv. Civ. Eng. 2021, 3, 5542905. [Google Scholar] [CrossRef]
  58. Sivaramakrishnan, P.; Madhava Prakash, A.K.; Sekulić, D.M.; Jacobson, B.; Selvi, C.; Johannesen, S.M. Methods to introduce floating bridge motion and wind excitation on a model for the investigation of heavy vehicle dynamics. Appl. Math. Modell. 2022, 117, 118–141. [Google Scholar] [CrossRef]
  59. Jang, M.; Hwang, S.; Kim, J.; Nam, J. Overturning and rollover characteristics of a tractor through dynamic simulations: Effect of slope angle and obstacles on a hard surface. Biosyst. Eng. 2022, 219, 11–24. [Google Scholar] [CrossRef]
  60. Abdollahzadeh Nasiri, A.S.; Rahmani, O.; Abdi Kordani, A.; Karballaeezadeh, N.; Mosavi, A. Evaluation of Safety in Horizontal Curves of Roads Using a Multi-Body Dynamic Simulation Process. Int. J. Environ. Res. Public Health 2020, 17, 5975. [Google Scholar] [CrossRef]
  61. Sharf Aldeen, A.; Abdi Kordani, A.; Hosseinian, S.M.; Mehdi Nazar, M. Evaluation of the Application of Maximum Radius in Horizontal Curves Using Vehicle Dynamic Simulation. Adv. Civ. Eng. 2022, 18, 5237541. [Google Scholar] [CrossRef]
  62. Wang, L.; Li, S.; Hui, B. Simulation Analysis of the Distance between Tunnels at the Bridge-Tunnel Junction of Mountainous Expressway on Driving Safety Under Crosswinds. IEEE Acc. 2021, 9, 28514–28524. [Google Scholar] [CrossRef]
  63. Chu, D.; Li, Z.; Wang, J.; Wu, C.; Hu, Z. Rollover speed prediction on curves for heavy vehicles using mobile smartphone. Measurement 2018, 130, 404–411. [Google Scholar] [CrossRef]
  64. Ataei, M.; Khajepour, A.; Jeon, S. Model predictive rollover prevention for steer-by-wire vehicles with a new rollover index. Int. J. Control 2018, 93, 140–155. [Google Scholar] [CrossRef]
  65. Cheng, S.; Li, L.; Yan, B.; Liu, C.; Wang, X.; Fang, J. Simultaneous estimation of tire side-slip angle and lateral tire force for vehicle lateral stability control. Mech. Syst. Signal Process. 2019, 132, 168–182. [Google Scholar] [CrossRef]
  66. Prieto González, L.; Sanz Sánchez, S.; Garcia-Guzman, J.L.; Boada, M.J.L.; Boada, B. Simultaneous Estimation of Vehicle Roll and Sideslip Angles through a Deep Learning Approach. Sensors 2020, 20, 3679. [Google Scholar] [CrossRef]
  67. Yin, Y.; Wen, H.; Sun, L.; Hou, W. Study on the Influence of Road Geometry on Vehicle Lateral Instability. J. Adv. Transp. 2020, 6, 7943739. [Google Scholar] [CrossRef]
  68. Li, P.; Lam, J.; Lu, R.; Li, H. Variable-Parameter-Dependent Saturated Robust Control for Vehicle Lateral Stability. IEEE Trans. Control Syst. Technol. 2022, 30, 1711–1722. [Google Scholar] [CrossRef]
  69. Ikhsan, N.; Saifizul, A.; Ramli, R. The effect of vehicle and road conditions on rollover of commercial heavy vehicles during cornering: A simulation approach. Sustainability 2021, 13, 6337. [Google Scholar] [CrossRef]
  70. Xu, J.; Li, H.; Zhang, X.; Ma, F.; Sun, Z. The influence of freeway curve characteristics on drivers’ speed perception accuracy. PLoS ONE 2022, 17, e0267250. [Google Scholar] [CrossRef]
  71. QC/T480-1999; Criterion Thresholds and Evaluation of Controllability and Stability for Automobiles. State Machinery Industry Bureau: Beijing, China, 1999.
  72. ISO 3888-2:2011; Passenger Cars—Test Track for a Severe Lane-Change Maneuver. ISO: Geneva, Switzerland, 2011.
  73. EU Regulation 661/2009; Concerning Type-Approval Requirements for the General Safety of Motor Vehicles, Their Trailers and Systems, Components and Separate Technical Units Intended Therefor. European Parliament: Strasbourg, France; The Council of the European Union: Brussels, Belgium, 2009.
  74. Fan, L.; Lu, L.; Deng, W.; Lu, J.J. Role of vehicle trajectory and lateral acceleration in designing horizontal curve radius of off-ramp: A driving simulator based study. Adv. Transp. Stud. 2015, 36, 119–132. [Google Scholar]
  75. ISO 3888-2:2011. Available online: https://www.iso.org/standard/57253.html (accessed on 16 April 2023).
  76. EU Regulation No. 661/2009. Available online: https://eur-lex.europa.eu/legal-content/EN/TXT/PDF/?uri=CELEX:32009R0661 (accessed on 16 April 2023).
  77. ISO 4138:2004; Passenger Cars-Steady-State Circular Driving Behaviour-Open-Loop Test Methods. ISO: Geneva, Switzerland, 2004.
  78. Marino, R.; Scalzi, S.; Netto, M. Nested PID steering control for lane keeping in autonomous vehicles. Control Eng. Process. 2011, 19, 1459–1467. [Google Scholar] [CrossRef]
  79. Rafatnia, S.; Mirzaei, M. Estimation of reliable vehicle dynamic model using IMU/GNSS data fusion for stability controller design. Mech. Syst. Signal Process. 2022, 168, 108593. [Google Scholar] [CrossRef]
  80. Wang, Z.; Wang, J. Ultra-local model predictive control: A model-free approach and its application on automated vehicle trajectory tracking. Control Eng. Process. 2020, 101, 104482. [Google Scholar] [CrossRef]
  81. Ghandour, R.; Victorino, A.; Doumiati, M.; Charara, A. Tire/road friction coefficient estimation applied to road safety. In Proceedings of the 18th Mediterranean Conference on Control and Automation, MED’10, Marrakech, Morocco, 23–25 June 2010; pp. 1485–1490. [Google Scholar]
  82. Molan, A.M.; Kordani, A.A. Multi-Body Simulation Modeling of Vehicle Skidding and Roll over for Horizontal Curves on Longitudinal Grades. In Proceedings of the TRB 2014 Annual Meeting, Washington, DC, USA, 12–16 January 2014. [Google Scholar]
  83. Alrejjal, A.; Ksaibati, K. Impact of crosswinds and truck weight on rollover propensity when negotiating combined curves. Int. J. Transp. Sci. Technol. 2022, 12, 86–102. [Google Scholar] [CrossRef]
  84. Hou, G.; Chen, S.; Chen, F. Framework of simulation-based vehicle safety performance assessment of highway system under hazardous driving conditions. Transp. Res. Part C Emerg. Technol. 2019, 105, 23–36. [Google Scholar] [CrossRef]
  85. Yue, L.; Wang, H. An Optimization Design Method of Combination of Steep Slope and Sharp Curve Sections for Mountain Highways. Math. Probl. Eng. 2019, 4, 2416342. [Google Scholar] [CrossRef]
  86. Hassan, Y.; Easa, S.M.; Abd El Halim, A.O. State-of-the-art of three-dimensional highway geometric design. Can. J. Civ. Eng. 1998, 25, 500–511. [Google Scholar] [CrossRef]
  87. Lusetti, B.; Nouvelière, L.; Glaser, S.; Mammar, S. Experimental strategy for a system based curve warning system for a safe governed speed of a vehicle. In Proceedings of the 2008 IEEE Intelligent Vehicles Symposium, Eindhoven, The Netherlands, 4–6 June 2008; pp. 660–665. [Google Scholar]
  88. Lee, Y.H.; Deng, W. Speed Control Method for Vehicle Approaching and Traveling on a Curve. U.S. Patent 0740,096,3B2, 15 July 2008. [Google Scholar]
  89. Harms, I.M.; Brookhuis, K.A. Dynamic traffic management on a familiar road: Failing to detect changes in variable speed limits. Transp. Res. Part F Traffic Psychol. Behav. 2016, 38, 37–46. [Google Scholar] [CrossRef]
  90. Wen, H.Y.; Xue, G. Exploring the relationships between single-vehicle traffic accident and driver’s route familiarity on the mountainous highways. Cogn. Technol. Work. 2019, 21, 815–824. [Google Scholar] [CrossRef]
  91. Elvik, R. To what extent can theory account for the findings of road safety evaluation studies? Accid. Anal. Prev. 2004, 36, 841–849. [Google Scholar] [CrossRef] [PubMed]
  92. Sun, Q.; Xia, J.; He, J.; Foster, J.; Falkmer, T.; Lee, H. Towards unpacking older drivers’ visual-motor coordination: A gaze-based integrated driving assessment. Accid. Anal. Prev. 2018, 113, 85–96. [Google Scholar] [CrossRef]
  93. Hjelkrem, O.A.; Ryeng, E.O. Chosen risk level during car-following in adverse weather conditions. Accid. Anal. Prev. 2016, 95, 227–235. [Google Scholar] [CrossRef]
  94. Kim, K.; Guan, H.; Wang, B.; Guo, R.; Liang, F. Active Steering Control Strategy for Articulated Vehicles. Front. Inf. Technol. Electron. Eng. 2016, 17, 576–586. [Google Scholar] [CrossRef]
Figure 1. The research flow chart.
Sustainability 16 00888 g001
Figure 2. Vehicle motion. (a) Coordinate system; (b) Top view; (c) Front view.
Sustainability 16 00888 g002
Figure 3. Simulation process and parameter settings in CarSim.
Sustainability 16 00888 g003
Figure 4. Schematic diagram of the simulated working condition of the double lane change test. (A: The width of the road. B: The width of the road after changing lanes).
Sustainability 16 00888 g004
Figure 5. Validation results of the double lane change road model. (a) Lateral offset; (b) Operating speed; (c) Lateral acceleration; (d) Yaw rate.
Sustainability 16 00888 g005aSustainability 16 00888 g005b
Figure 6. Validation results of the actual road conditions. (a) Lateral offset; (b) Operating speed; (c) Lateral acceleration; (d) Yaw rate.
Sustainability 16 00888 g006aSustainability 16 00888 g006b
Figure 7. Simulation results at different speeds. (a) Lateral offset; (b) Lateral acceleration; (c) Yaw rate; (d) Roll angle.
Sustainability 16 00888 g007aSustainability 16 00888 g007b
Figure 8. Simulation results under different curve radii. (a) Lateral offset; (b) Lateral acceleration; (c) Yaw rate; (d) Roll angle.
Sustainability 16 00888 g008
Figure 9. The output simulation results. (a) Longitudinal speed at R = 400 m; (b) Tire vertical reaction force at R = 400 m.
Sustainability 16 00888 g009
Figure 10. Lateral offset under different road adhesion coefficients.
Sustainability 16 00888 g010
Figure 11. Lateral acceleration under different road adhesion coefficients. (a) Overall; (b) Localized magnification.
Sustainability 16 00888 g011
Figure 12. Yaw rate under different road adhesion coefficients. (a) Overall; (b) Localized magnification.
Sustainability 16 00888 g012
Figure 13. Roll angle under different road adhesion coefficients. (a) Overall; (b) Localized magnification.
Sustainability 16 00888 g013
Figure 14. Combined test results. (a) Analysis of range for sideslip; (b) Analysis of range for rollover; (c) ANOVA for sideslip; (d) ANOVA for rollover.
Sustainability 16 00888 g014
Figure 15. Fitting results. (a) Speed threshold fitting; (b) Residual analysis.
Sustainability 16 00888 g015
Table 1. Mechanical analysis of vehicle lateral instability.
SideslipRolloverNote
SchematicSustainability 16 00888 i001 N 1 , N 2 : Reaction force of road on tires
F: Centrifugal force
G: Vehicle gravity
R: Curve radius
i h : Superelevation
v : Speed (m/s)
V : Speed (km/h)
g : Gravitational acceleration (9.8 m/ s 2 )
F x : Lateral force parallel to the road
F y : Vertical force perpendicular to the road
φ h : Lateral friction coefficient,
φ h = 0.6 ~ 0.7 φ
φ : Road adhesion coefficient
h g : Vehicle center height
b : Wheelbase
Mechanical analysis F = G v 2 g R (1)
F x = F cos α G sin α (2)
F y = F sin α G cos α (3)
The lateral inclination α of the road surface is generally small, sin α tan α = i h , cos α 1 , so that:
F x = F G i h = G ( v 2 g R i h ) (4)
For a car not to sideslip, the lateral force should be less than or equal to the lateral frictional resistance between the tire and the road, i.e.,: F x F y φ h (5)
Finally, we get: R V 2 127 φ h + i h (6)
For the vehicle not to roll over, the overturning moment should be less than or equal to the stabilizing moment, i.e.,: F x h g F y b 2 = F i h + G b 2 (7)
Since F i h is much smaller than G , then: F x G b 2 h g (8)
Finally, we get: R V 2 127 b 2 h g + i h (9)
Table 2. Main evaluation indicators of lateral stability of the vehicle.
ReferencesLateral
Acceleration
Yaw
Angle
Roll
Angle
Sideslip AngleLTRLateral ForceLateral
Offset
Vertical Reaction ForceSide Friction Factor
Shin and Lee, 2015 [22]
Kordan et al., 2018 [44]
Chu et al., 2018 [63]
Qu et al., 2018 [35]
Dhahir and Hassan, 2018 [56]
Ataei et al. 2018 [64]
Mauriello et al. 2018 [38]
Cheng et al., 2019 [65]
Jin et al., 2019 [36]
Nasiri, 2020 [60]
González et al., 2020 [66]
Yin et al., 2020 [67]
Li et al., 2022 [68]
Wang et al., 2021 [62]
Tian et al., 2021 [23]
Xin et al., 2021 [48]
Ikhsan et al. 2021 [69]
Wang et al. 2022 [53]
Xu et al., 2022 [70]
Zhu et al., 2022 [21]
Table 3. Simulation strategy.
NumberSpeed (km/h)Curve Radius (m)Road Adhesion CoefficientSimulation Strategy
1304000.10Speed acting independently
240
350
460
570
680
7804000.10Curve radius acting independently
8500
9600
10700
11800
12900
131000
14804000.10Road adhesion coefficient acting independently
150.15
160.20
170.25
180.30
190.35
200.75 (contrast)
Table 4. The critical state of vehicle operation on snowy and icy roads.
Snowy and Icy Road TypeCritical State
Icy roadRoad adhesion coefficient 0.100.110.120.130.140.15
Critical speed (km/h) 54.655.355.756.356.657.3
Critical state SideslipSideslipSideslipSideslipSideslipSideslip
Compacted snow roadRoad adhesion coefficient 0.160.170.180.190.20
Critical speed (km/h) 58.258.658.859.259.8
Critical state SideslipSideslipSideslipSideslipSideslip
Snow slushy roadRoad adhesion coefficient 0.210.220.230.240.25
Critical speed (km/h) 60.260.561.061.261.4
Critical state RolloverRolloverRolloverRolloverRollover
Loose snow roadRoad adhesion coefficient0.260.270.280.290.300.310.320.330.340.35
Critical speed (km/h)62.062.662.963.163.763.964.164.664.665.0
Critical stateRolloverRolloverRolloverRolloverRolloverRolloverRolloverRolloverRolloverRollover
Table 5. Vehicle speed thresholds for different snowy and icy roads.
Curve Radius (m)Speed Threshold (km/h)
Icy Road
(0.10~0.15)
Compacted Snow Road
(0.10~0.20)
Snow Slushy Road (0.15~0.25)Loose Snow Road (0.25~0.35)
10019.820.322.524.3
20031.232.238.440.6
30043.845.650.757.7
40050.452.357.361.4
50055.556.965.868.4
60062.363.871.375.4
70066.968.576.079.3
80073.475.481.185.2
90075.380.687.590.1
100078.285.392.596.8
Disclaimer/Publisher’s Note: The statements, opinions and data contained in all publications are solely those of the individual author(s) and contributor(s) and not of MDPI and/or the editor(s). MDPI and/or the editor(s) disclaim responsibility for any injury to people or property resulting from any ideas, methods, instructions or products referred to in the content.

