Article

Effects of Straw Return Duration on Soil Carbon Fractions and Wheat Yield in Rice–Wheat Cropping System

1
Nanjing Institute of Agricultural Mechanization, Ministry of Agriculture and Rural Affairs, Nanjing 210014, China
2
Jiangsu Key Laboratory of Crop Genetics and Physiology, Yangzhou University, Yangzhou 225009, China
*
Author to whom correspondence should be addressed.
Sustainability 2024, 16(2), 754; https://doi.org/10.3390/su16020754
Submission received: 28 November 2023 / Revised: 25 December 2023 / Accepted: 29 December 2023 / Published: 16 January 2024
(This article belongs to the Special Issue The Sustainability of Agricultural Soils)

Abstract

:
In China’s subtropical rice–wheat cropping system, the changes in the soil organic carbon (SOC) pool due to long-term straw return and its connection with crop yield remain unclear. This study aims to provide insights into establishing a sensible straw return system by evaluating the differences in the distribution and variation rates of SOC, light fraction organic carbon (LFOC), heavy fraction organic carbon (HFOC), particulate organic carbon (POC), and mineral-associated organic carbon (MOC) in the 0–20 cm soil layer under different durations of straw return. Additionally, the study analyzes the relationship between the changes in SOC and its fractions and wheat yield. The experiment was conducted in 2019 in a rice–wheat rotation field with ten years of straw return treatments: no straw return (NR) or 1, 2, 3, 4, 5, 6, 7, 8, 9 year(s) of straw return (SR1–9), and an additional treatment in 2020 (10 years of straw return, SR10). The results revealed that with an increase in the duration of straw return, the contents of SOC, LFOC, HFOC, and POC gradually increased, showing the highest increments of 45.88%, 187.22%, 41.55%, 97.89%, and 28.21%, respectively, compared to the NR treatment. However, after eight years of straw return, the compound annual increase in soil organic carbon and its components was lower than in years 1–8, indicating a trend of diminishing increments. The SOC content and its variation were significantly correlated with the content and variation of LFOC, HFOC, POC, and MOC, with the highest sensitivity observed for the variation in LFOC, indicating the strong influence of the duration of straw return. The SOC and its fraction contents showed significant positive correlations with wheat yield, with the highest contribution to wheat yield increase attributed to an increase in LFOC content. In summary, straw return enhances the 0–20 cm deep soil carbon pool, with LFOC being the most sensitive indicator, reflecting the influence of the duration of straw return on soil carbon pools.

1. Introduction

As one of the essential factors in the sustainability of agricultural soils, soil organic carbon (SOC) is closely associated with stable soil structure, crop productivity, and yield stability [1]. When the SOC content falls below 2%, the soil structural stability diminishes, constraining high and stable crop yields [1]. Alarmingly, over 80% of cultivated land in China has SOC levels below this critical threshold. Pan et al. [2], based on data from China’s second soil survey, analyzed the correlation between organic matter content and crop yields, revealing that a 1% increase in organic matter content could lead to a 430 kg hm−2 increase in crop yield and a 3.5% improvement in yield stability. Different SOC components exhibit varying reactivity levels and contribute differently to crop growth; they are influenced by changes in the external environment. Typically, SOC contains a significant amount of stable carbon, making it less sensitive to short-term changes in soil quality under different soil or crop management practices [3,4]. Therefore, categorizing organic carbon into components with different reactivity using specific methods is conducive to a deeper understanding and scientific management of organic carbon turnover.
Physical fractionation methods are less disruptive to SOC and better reflect its structure and functionality [5]. Standard physical fractionation methods include density fractionation and particle size fractionation. Density fractionation divides SOC into light fraction organic carbon (LFOC) and heavy fraction organic carbon (HFOC). In contrast, particle size fractionation separates it into particulate organic carbon (POC) and mineral-associated organic carbon (MOC). These four organic carbon fractions exhibit varying levels of reactivity. LFOC and POC are considered active components of SOC, susceptible to agricultural management practices, and capable of rapidly reflecting changes in the SOC content. In contrast, soil HFOC and MOC have lower reactivity and are less susceptible to management practices, making them better indicators of soil carbon sequestration efficiency [6]. Scholars have already researched organic carbon fractions by using active organic carbon components like LFOC, POC, microbial biomass carbon (MBC), and permanganate-oxidizable carbon (POXC) in rotation to reflect the impact of environmental changes and agricultural management practices on organic carbon [7].
Straw return, a significant approach to straw resource utilization in China [8], introduces additional carbon sources, such as humus, into the soil after straw degradation, improving the soil carbon pool and sustainable agriculture. This practice profoundly impacts the content of SOC, labile organic carbon, LFOC, POC, MBC, and other active SOC fractions [9,10]. Furthermore, it affects the fate of other SOC components. Studies in China’s northeastern paddy fields by Yan et al. [10] demonstrated that straw return significantly influences the content of active organic carbon in the soil. With increasing amounts of straw return, the soil POC, dissolved organic carbon, and MBC contents markedly increase. Remarkably, even a relatively low level of straw return (6250 kg hm−2) can significantly boost the soil POC and other active carbon fractions. Research by Zhang et al. [11] in China’s southern double-cropping rice fields indicated that straw return impacts organic carbon components in different soil aggregate fractions. It enhances the soil-free light organic carbon (fLOC) and intra-aggregate particulate organic carbon (iPOC) content in various aggregate classes, promotes organic carbon transfer from fLOC to iPOC, and reduces the MOC content. Studies in rice–wheat rotation fields in eastern and central China also showed that straw return helps increase soil DOC, POC, and HFOC content [12,13].
However, some studies have suggested that the impact of straw return on SOC and its components is highly dependent on factors such as the specific amount of straw returned, soil depth, and experimental locations. Chen et al. [9] conducted experiments in Anhui and Jiangsu provinces and found that the straw return in double rice–wheat cropping increased the soil LFOC and POC content by 28–52%, while in Hubei province, there was no significant increase in either component. Mi et al. [14] conducted research in Zhejiang province on rice–winter fallow fields and observed that the effects of straw management on different soil layers’ POC content were inconsistent, with the 0–10 cm depth being the most influenced. The application of straw cover increased the POC content by 13.0%, but there was no significant effect in the 10–20 cm layer. Zhao et al. [15] investigated the impact of four different straw return amounts (0 kg hm−2 (S0), 2250 kg hm−2 (S1), 4500 kg hm−2 (S2), and 9000 kg hm−2 (S3)) on SOC components. They found, that compared to S0, S1 did not affect the light fraction soil and LFOC content, while S2 increased them by 14.7% and 33.9%, and S3 increased them by 48.0% and 81.3%. Additionally, S2 and S3 increased the HFOC content by 39.2–43.1%.
Different components of SOC exhibit varying activity levels, imparting different functionalities to them. Xu et al. [16] researched the double rice-cropping area of southern China and demonstrated that rice straw return increased the LFOC content. LFOC and SOC exhibited similar trends, positively correlating with each other. Furthermore, LFOC was more sensitive to agricultural management practices and could better indicate SOC changes. Zhang et al. [17] studied purple paddy soils in southwest China and found that HFOC was the primary component of SOC. However, fLOC was the most responsive to changes in farming practices and served as a good indicator of SOC variations.
Multiple cropping systems enhance land utilization efficiency and ensure high and stable crop yields. Intensive double cropping in China’s rice–wheat rotation system ensures sustained, stable crop yields. However, the extensive use of chemical fertilizers is costly and may lead to soil degradation [18]. Generating a sensible straw management system is significant for enhancing soil carbon quality, enhancing soil carbon sequestration capacity, and achieving sustainable rice–wheat rotation production. Currently, most research on the impact of straw return on soil LFOC and HFOC in China focuses on paddy fields. There is insufficient research on the effects of straw return years on the SOC components in rice–wheat rotation field systems, as well as their relationship with crop yield; thus, their effect remains unclear. This study aims to deliver a theoretical foundation for the establishment of a practical straw return system for rice–wheat rotation areas by analyzing the distribution and variations of SOC, LFOC, HFOC, POC, and MOC under different straw return durations, as well as the correlation between the contents of the SOC and its components with wheat yield.

2. Materials and Methods

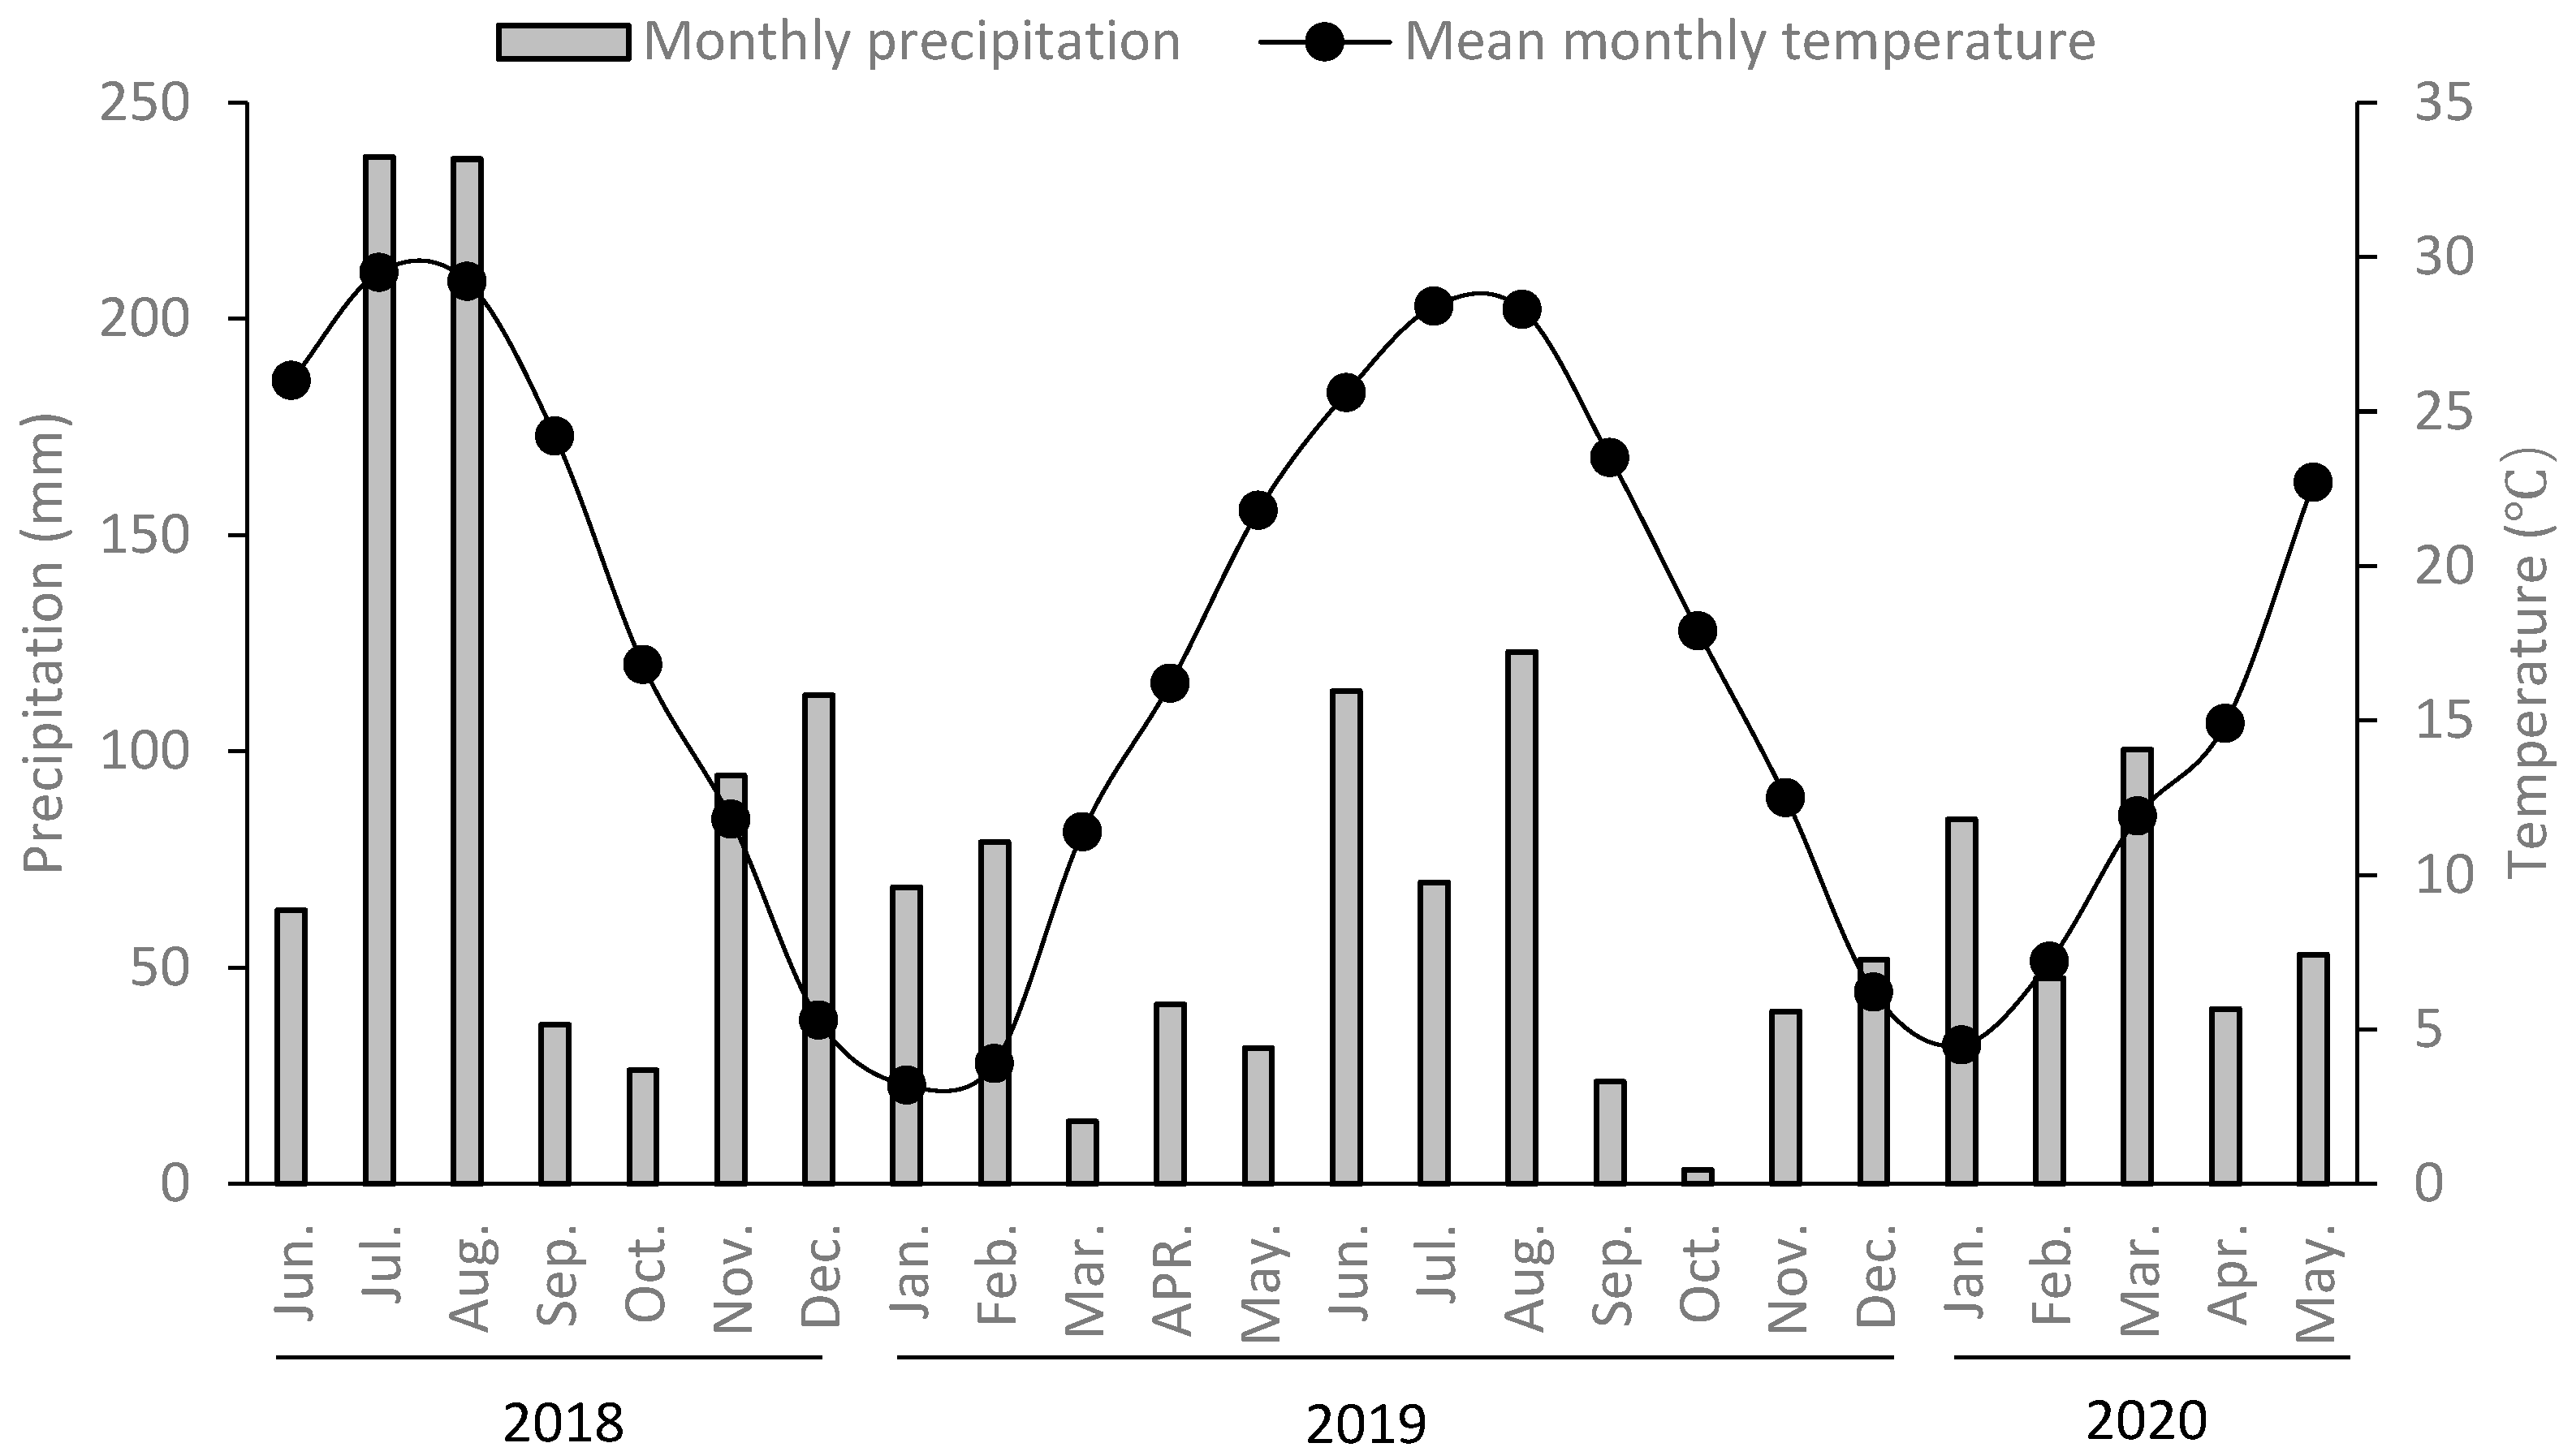
2.1. Experimental Site

Field experiments were performed in Yangzhou, China (32°23′ N, 119°25′ E) beginning in 2010. The region is defined by a subtropical climate with plenty of rain. The weather conditions during the experimental period are outlined in Figure 1. The predominant soil was classified as a Stagnic Anthrosol [19]. Before the experiment, the 0–20 cm soil layer had the following properties: soil bulk density of 1.45 g cm−3, organic carbon content of 15.73 g kg−1, total nitrogen content of 1.24 g kg−1, available phosphorus content of 16.32 mg kg−1, and available potassium content of 146.12 mg kg−1. This region represents one of China’s major double-cropping areas for rice and wheat.

2.2. Experimental Design

In 2019, a completely randomized block approach with ten treatments was employed encompassing the following: no straw return (NR), and one (SR1), two (SR2), three (SR3), four (SR4), five (SR5), six (SR6), seven (SR7), eight (SR8), and nine (SR9) consecutive years of rice straw returning. In 2020, an additional treatment of straw return for ten years (SR10) was added compared to 2019. Each treatment was replicated three times, and each plot measured 4 m × 3 m.
After the rice harvest, a yearly amount of 9000 kg/hm2 of residual rice straw was mechanically chopped into approximately 10 cm lengths and evenly spread within each plot. A rotary tiller incorporated the rice straw into the soil at a 0–15 cm depth. Wheat straw was not retained after the wheat harvest.
The wheat used in this experiment was Yangfumai 4. The total nitrogen (N) application rate during the growth period was 240 kg hm−2, with the ratio of base fertilizer: tillering fertilizer: jointing fertilizer: heading fertilizer established at 5:1:2:2. Phosphorus (P2O5) and potassium (K2O) fertilizers were applied at rates of 90 and 150 kg hm−2, respectively, with a base fertilizer: jointing fertilizer ratio of 1:1. Fertilization of rice was carried out similarly to wheat, with the exception that 150 kg/hm2 of urea was introduced at the tiller and booting stages.

2.3. Sample Collection and Analytical Methods

Soil samples were collected following the wheat harvest in May 2019 and May 2020 using a five-point sampling method. Samples were collected at three depths: 0–5 cm, 5–10 cm, and 10–20 cm, with four replicates for each depth within each plot. Samples collected from the same depth within each plot were mixed to create one composite sample. These composite samples were brought back to the laboratory and naturally air-dried. They were then sieved through a 0.25 mm mesh to remove gravel and crop residues, and used to determine soil SOC, LFOC, HFOC, POC, and MOC content.
Specific measurement methods were as follows:
SOC content was determined using an external heating method with potassium dichromate (K2Cr2O7) oxidation [20].
POC content was determined using a dispersion method with a 5 g L−1 solution of sodium hexametaphosphate [21].
MOC was calculated as the difference between the SOC and POC content.
The grain yield of wheat was determined with a moisture content of 12% following the manual harvest of the three central regions from each plot across 1.2 m2.
The variation rate (VR) was computed as follows [22]:
V R = C i C i , N R C i , N R × 100 %
where VR is the variation rate of the contents of the SOC or its components to a certain depth; Ci is the concentration of the SOC or its component at layer “i” (i = 1, 2, and 3, represent 0–5 cm, 5–10 cm, and 10–20 cm, respectively); and Ci,NR is the concentration of the SOC or its component in NR at layer “i”.

2.4. Data Analysis

Statistical analysis was conducted using SPSS 17.0. The differences in the SOC, LFOC, HFOC, POC, and MOC levels in response to various treatments at the same soil layer and different depths receiving identical treatments, and wheat yield between treatments were examined using a one-way analysis of variance (ANOVA) with a least-significant difference (LSD) (p < 0.05). The Pearson coefficient (p < 0.05 and p < 0.01) was employed for correlation assessment between the levels of SOC, LFOC, HFOC, POC, and MOC, as well as between wheat yield and the levels of SOC, LFOC, HFOC, POC, and MOC. Linear regression analysis was employed to determine the relationship between wheat yield and the levels of SOC, LFOC, HFOC, POC, and MOC.

3. Results and Analysis

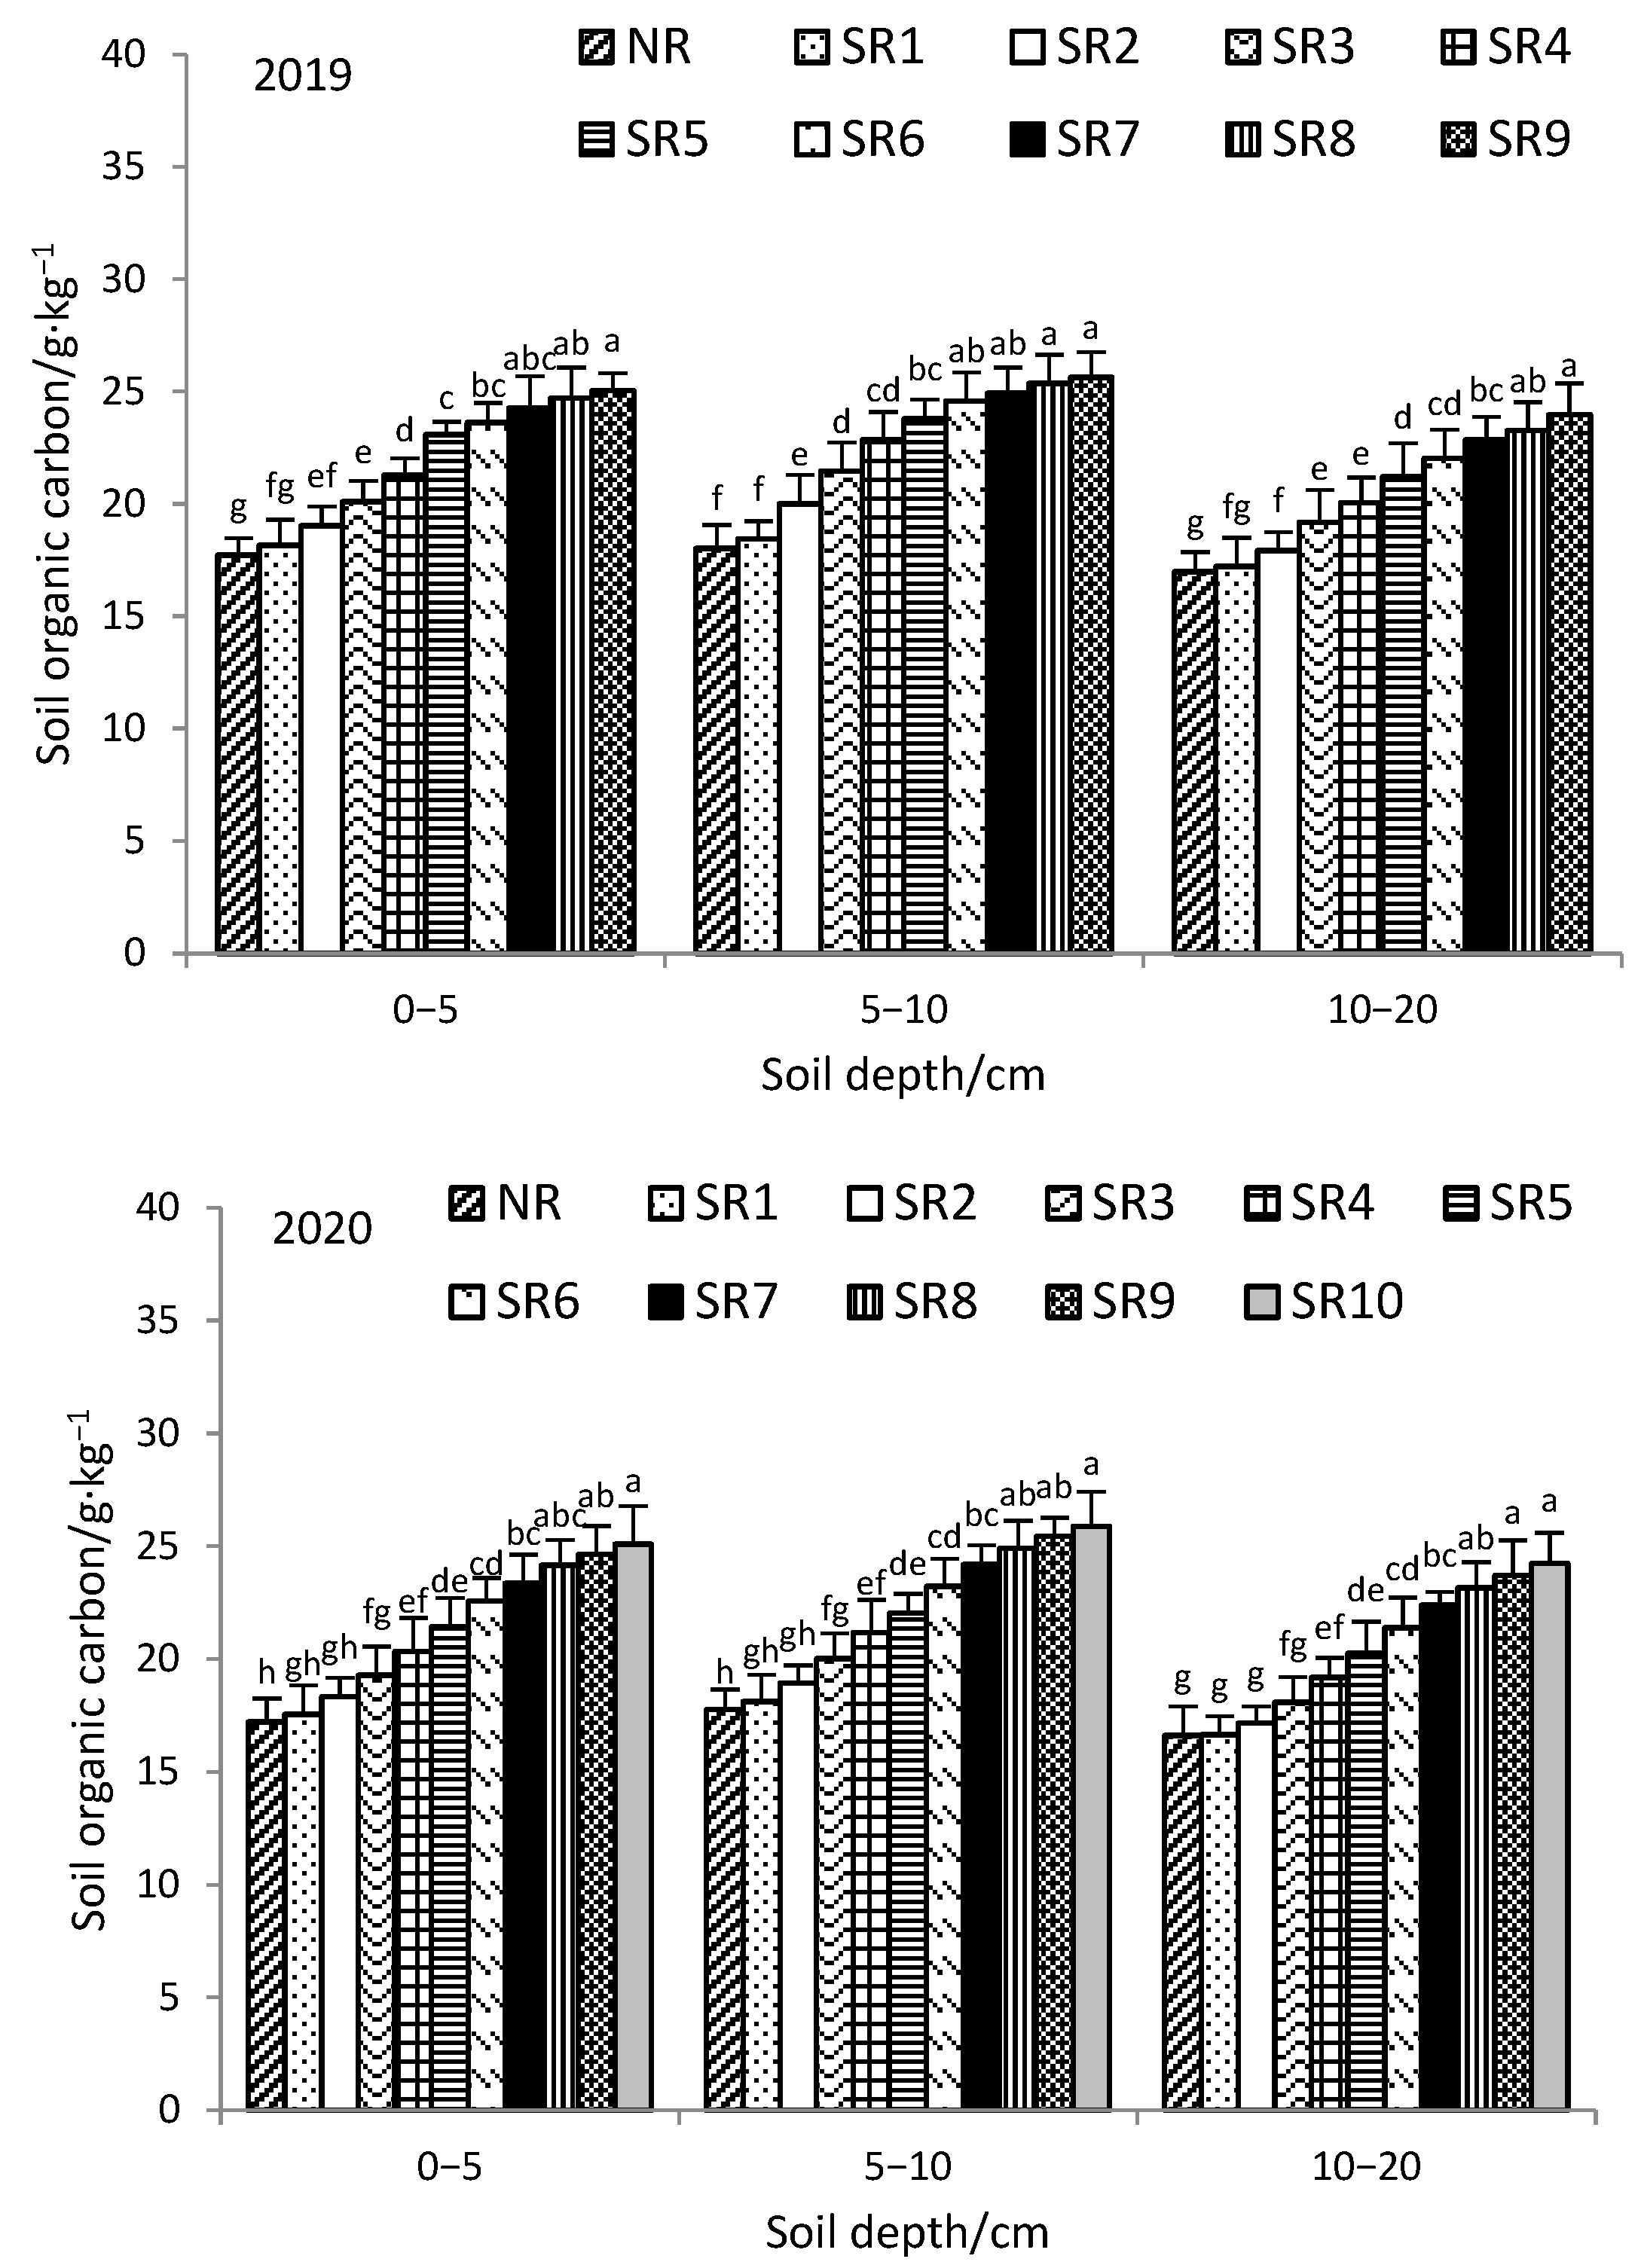
3.1. Soil Organic Carbon

The SOC content in each treatment exhibited an initial increase followed by a decrease with increasing soil depth (Figure 2). This trend was attributed to the uniform distribution of straw tillage in the 0–15 cm soil layer. However, the 0–5 cm soil layer was directly exposed to the air, resulting in a higher SOC decomposition rate than the 5–10 cm soil layer. Consequently, the SOC content in the 0–5 cm soil layer was lower than that in the 5–10 cm soil layer. Additionally, the 10–20 cm soil layer had a lower distribution of soil straw and residual wheat root residues compared to the upper soil layer, leading to a lower SOC content in this layer.
With the increase in the number of years of straw return, the SOC content in each soil layer gradually increased in 2019 and 2020. The changes in the SOC content for each soil layer with increasing years of straw return, compared to the NR treatment, were observed as follows: In 2019, the SOC content increased by 3.67–41.45% in the 0–5 cm layer, 2.33–42.23% in the 5–10 cm layer, and 1.41–41.17% at the 10–20 cm depth. In 2020, the SOC content increased by 1.98–45.79% in the 0–5 cm layer, 1.97–45.66% in the 5–10 cm layer, and 0.18–45.88% in the 10–20 cm layer.

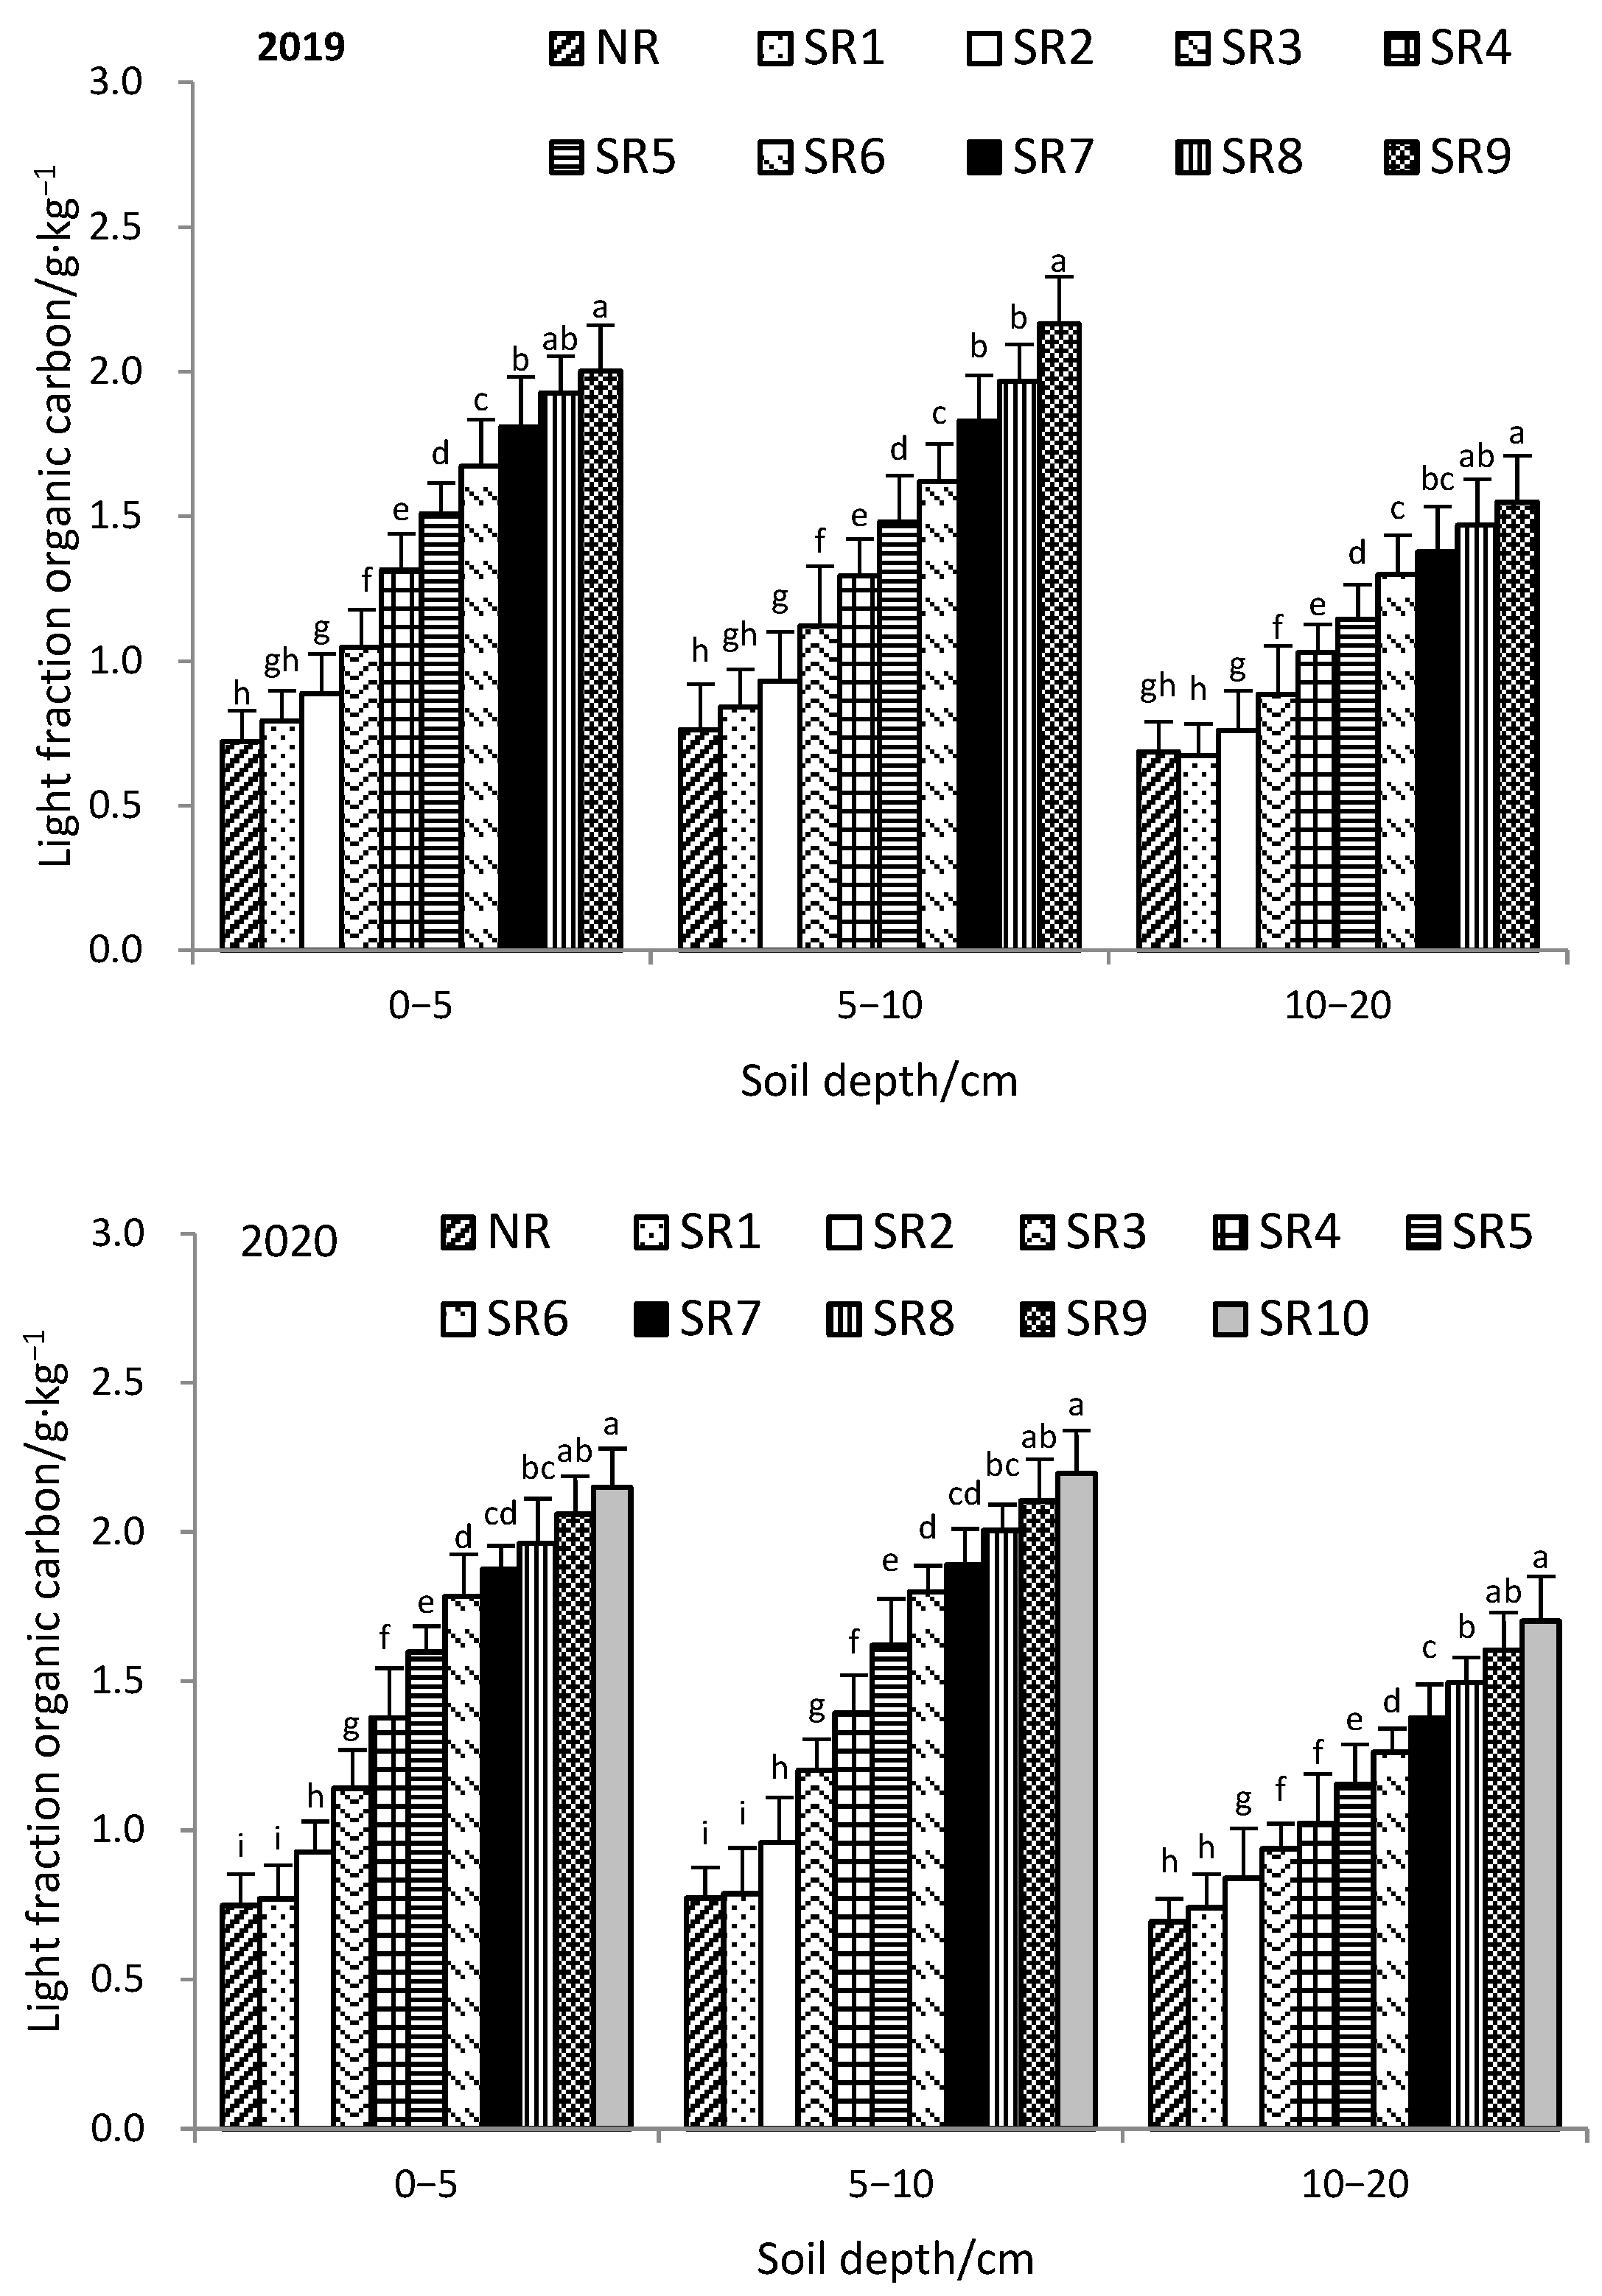
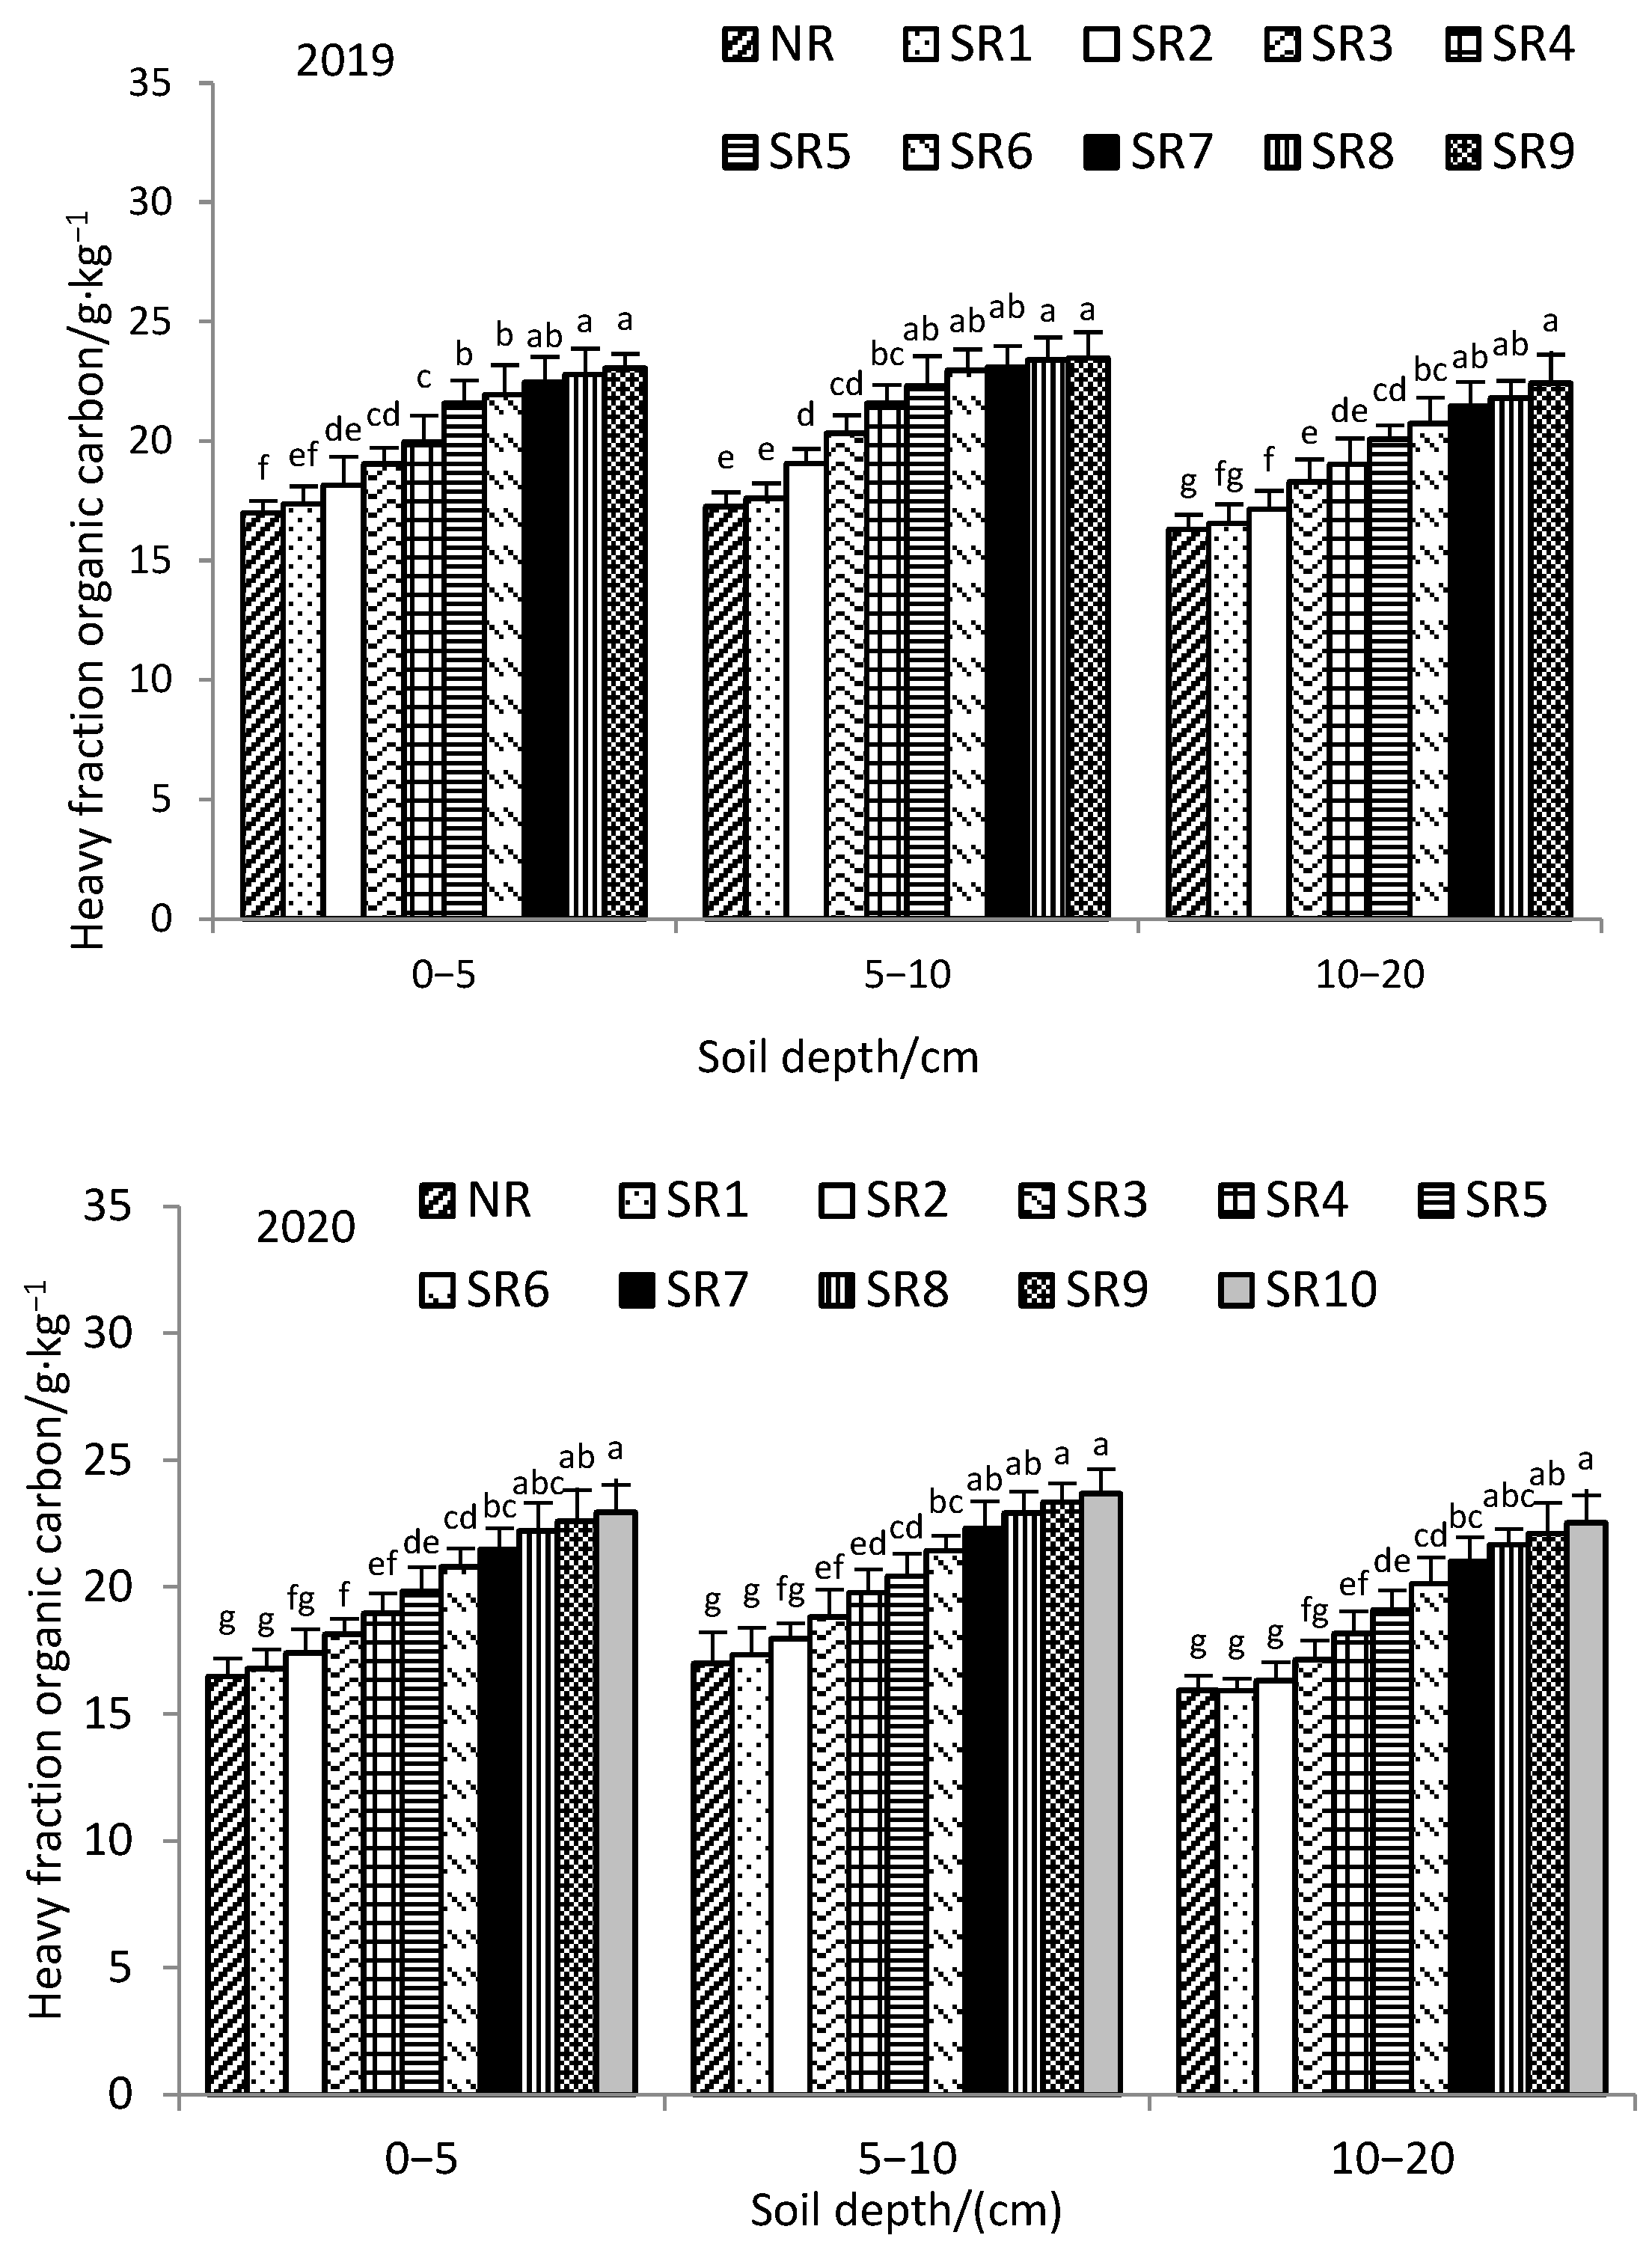
3.2. Light and Heavy Fraction Organic Carbon

With increased soil depth, the content of LFOC and HFOC exhibited a trend of initial increase followed by a subsequent decrease (Figure 3). In 2019, the various treatments showed different increases in LFOC content compared to the NR treatment: In the 0–5 cm soil layer, the increase ranged from 10.09% in SR1 to 177.74% in SR9. In the 5–10 cm soil layer, LFOC content increased by 10.23% in SR1 and 184.06% in SR9. In the 10–20 cm soil depth, the increase ranged from −1.87% in SR1 to 125.81% in SR9.
Similarly, in 2020, the LFOC content in all soil layers gradually increased with the number of years of straw return, with increases compared to the NR treatment observed as follows: In the 0–5 cm soil layer, the increase ranged from 2.96% in SR1 to 187.22% in SR9. In the 5–10 cm soil layer, the LFOC content increased by 1.92% in SR1 and 184.53% in SR9. The 10–20 cm soil layer increase ranged from 6.75% in SR1 to 145.25% in SR9. The large increase in LFOC content was mainly due to the active organic carbon in the humus produced after the decomposition of the returned straw. Notably, the LFOC content in the 0–5 cm and 5–10 cm soil profiles surpassed the NR treatment from SR2 onwards.
Regarding the HFOC content, in 2019, it gradually increased with the number of years of straw return across all soil layers: The 0–5 cm soil depth increase ranged from 2.22% in SR1 to 35.66% in SR9. In the 5–10 cm soil layer, the HFOC content increased by 1.98% in SR1 and 35.97% in SR9. The 10–20 cm soil layer increase ranged from 1.55% in SR1 to 37.60% in SR9.
In 2020, the HFOC content in the 0–5 cm and 5–10 cm soil profiles continued to increase with the number of years of straw return, with increases that ranged from 1.93% to 39.36%, while in the 10–20 cm soil layer, the changes ranged from −0.11% to 41.55% compared to the NR treatment.

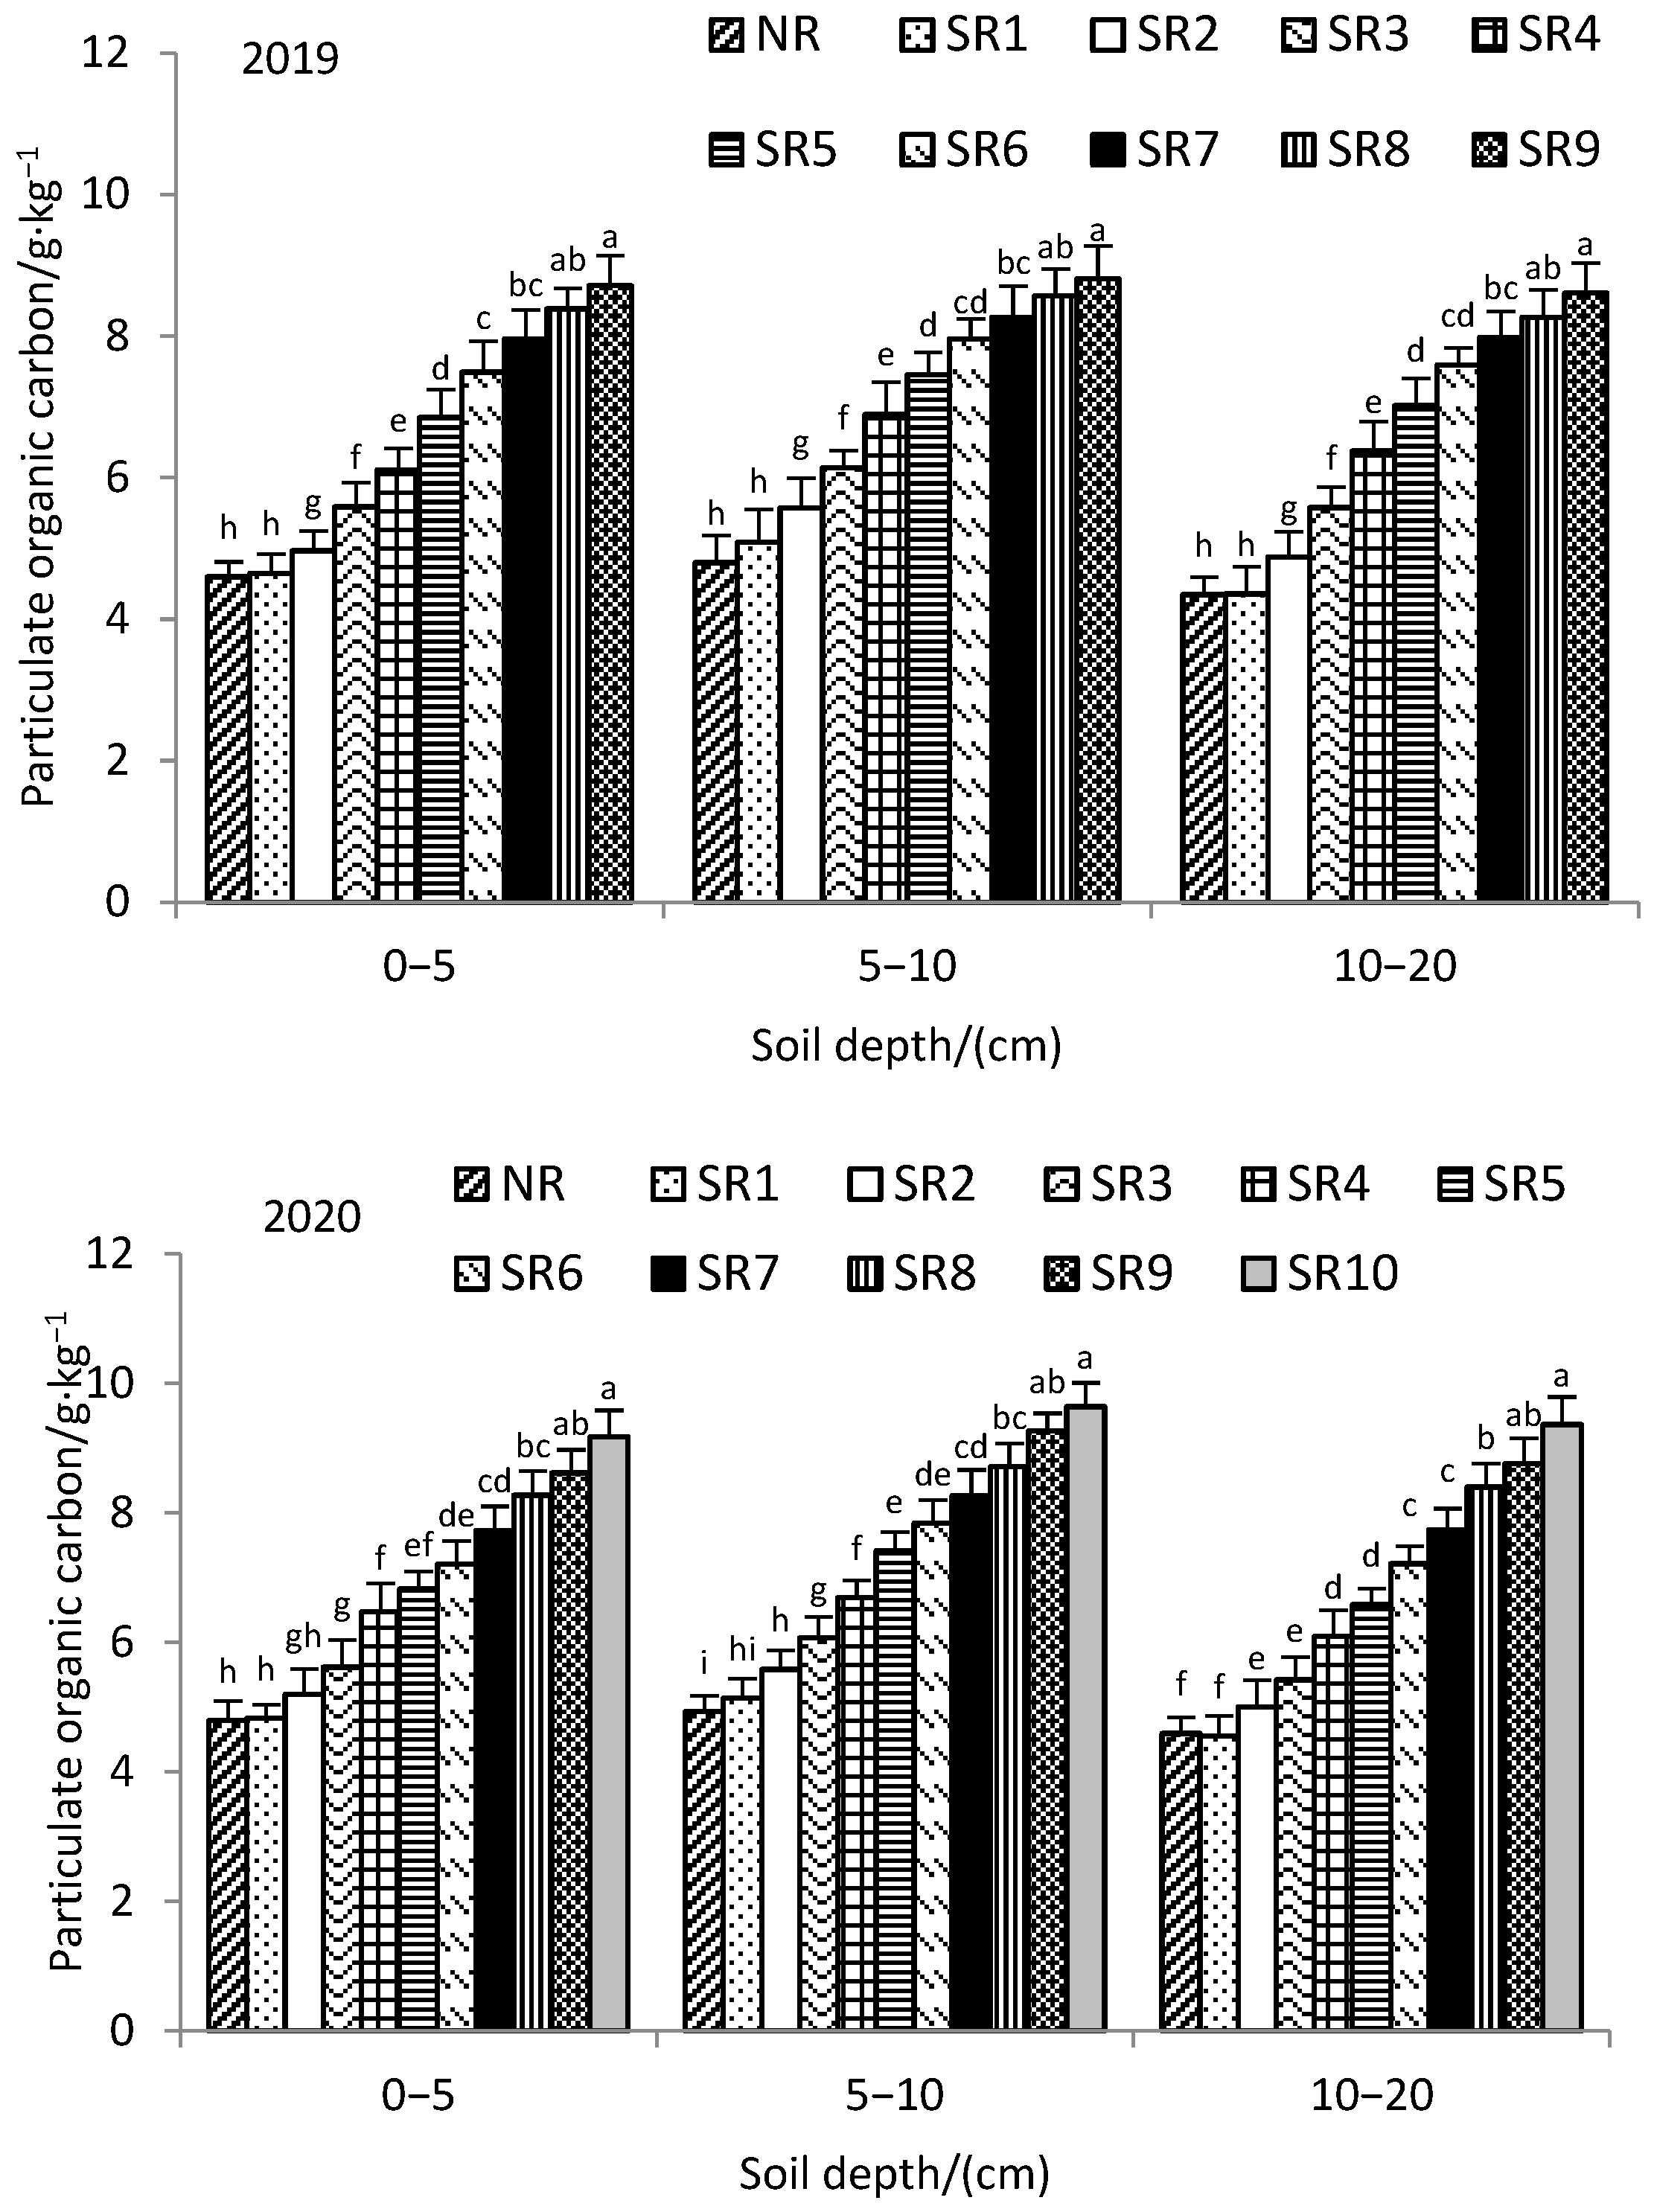
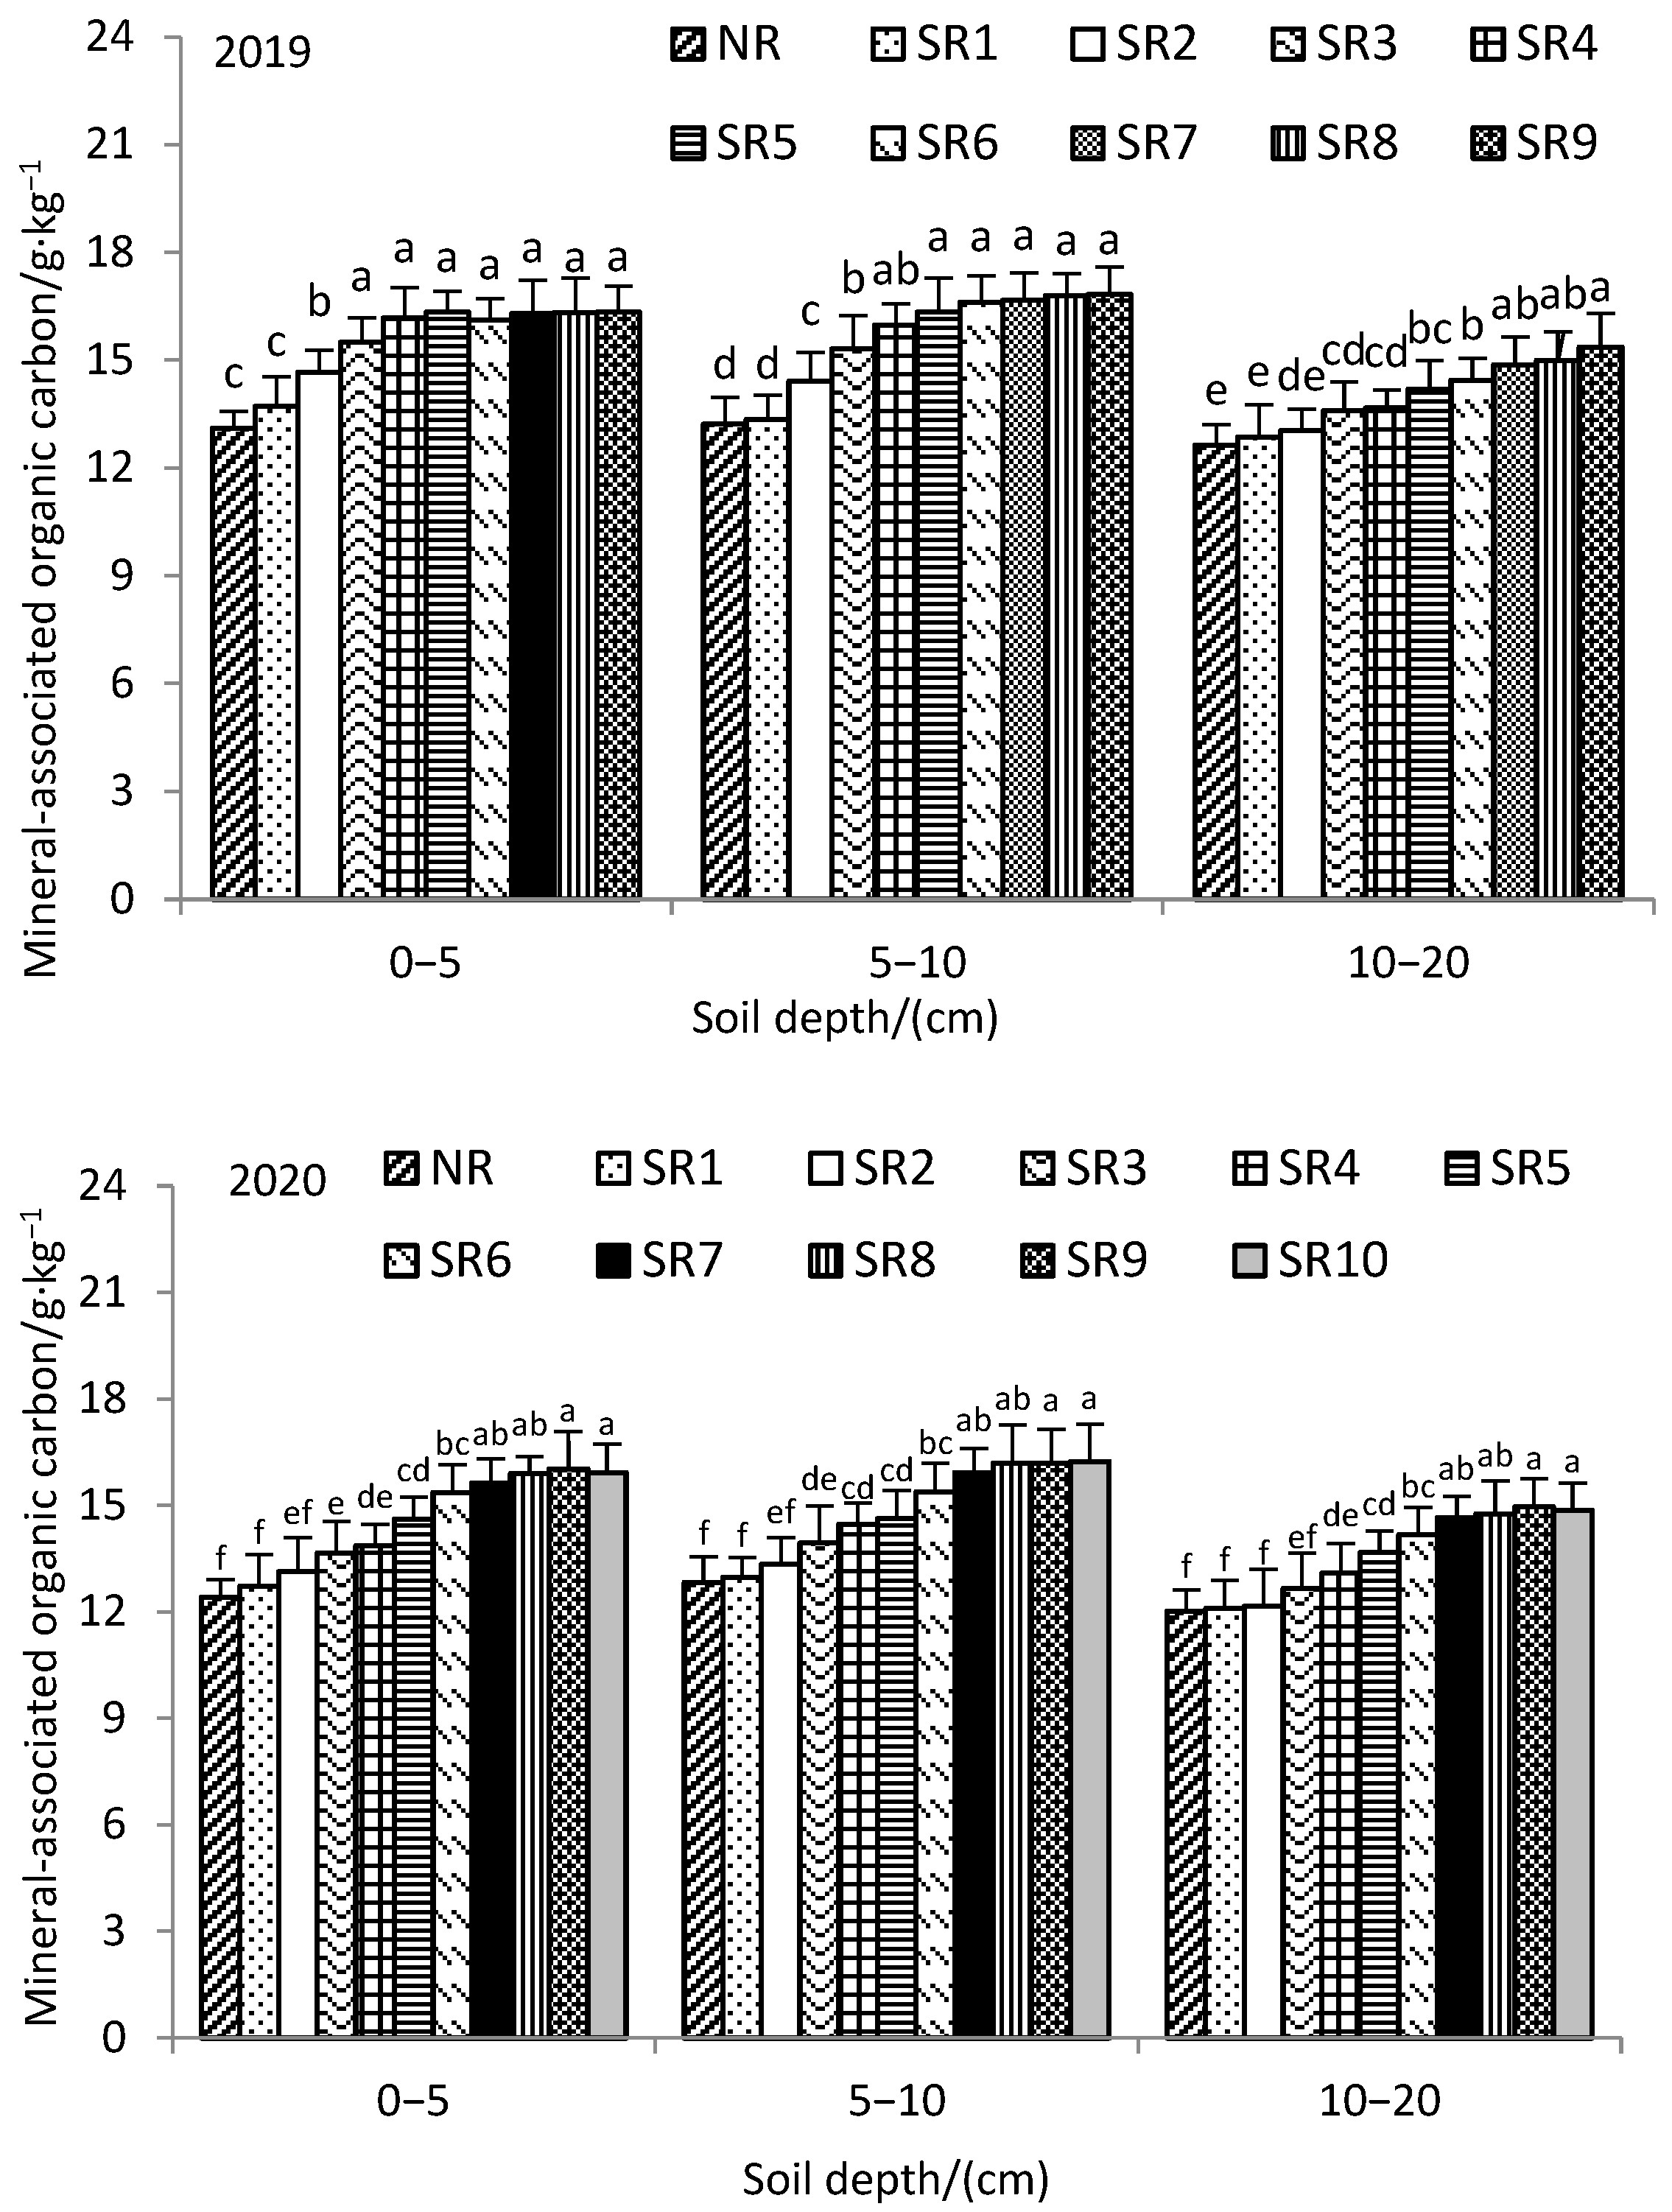
3.3. Particulate Organic Carbon and Mineral-Associated Organic Carbon

Figure 4 outlines the trend of POC content, initially increasing, followed by a subsequent decrease as soil depth increased. In 2019, the POC content increased gradually across all soil layers as the number of years of straw return increased. When comparing the SR1 to SR9 treatments with the NR treatment, the changes in the POC content were as follows: In the 0–5 cm soil profile, the POC content increased by 1.00–89.47%. In the 5–10 cm soil depth, increases ranged from 6.02% to 83.49%. In the 10–20 cm soil layer, increases ranged from 0.24% to 97.89%.
In 2020, the POC content in the 0–5 cm and 5–10 cm soil profiles continued to increase with the number of years of straw return. Comparing the SR1 to SR10 treatments with the NR treatment, the changes in the POC content were observed as follows: In the 0–5 cm soil layer, the POC content increased by 0.74–91.32%. In the 5–10 cm soil profiles, increases ranged from 4.14% to 95.45%. Changes in the 10–20 cm soil layer ranged from −0.90% to 95.46%. The significant rise in the POC was mainly due to the aggregation of soil particles promoted by the adhesive substances produced after straw decomposition.
In contrast, the MOC content did not exhibit a clear pattern with increasing soil depth. In 2019, the MOC content in the 5–10 cm and 10–20 cm soil layers gradually increased with the number of years of straw return. When the SR1 to SR9 treatments were compared with the NR treatment, the changes in the MOC content were as follows: In the 0–5 cm soil layer, the MOC content increased by 4.61–24.60%. In the 5–10 cm soil depth, increases ranged from 0.99% to 27.26%. In the 10–20 cm soil layer, increases ranged from 1.82% to 21.64%.
For 2020, the MOC content in the 0–5 cm and 10–20 cm soil depths had an initial increase followed by a decrease as the number of years of straw return increased. Comparing the SR1 to SR10 treatments with the NR treatment, the changes in the MOC content were as follows: In the 0–5 cm soil layer, the MOC content increased by 2.45–29.04%. In the 5–10 cm soil layer, the increase ranged from 1.14% to 26.53%. In the 10–20 cm soil layer, the increase ranged from 0.59% to 24.43%.

3.4. Changes in the Compound Annual Growth Rate of Organic Carbon and Its Components

From Table 1, it is observed that the compound annual growth rate (CAGR) of organic carbon and its components in various soil layers adhered to the order from highest to lowest as follows: LFOC > POC > SOC > HFOC > MOC. After eight years of straw return, the CAGR of SOC and its components in all soil layers were lower than those in years one to eight of straw return. This indicated that after eight years of straw return, the increase in the SOC, and its components, in each soil depth lowered. Notably, the reduction in growth rates was more pronounced in the 0–5 cm and 5–10 cm soil depths compared to the 10–20 cm soil layer. This was primarily due to the lower density of straw return in the 10–20 cm soil layer compared to the upper layers, which caused lower SOC contents, and its components’ contents, in the 10–20 cm soil layer. Consequently, the decomposition rate was also lower in the 10–20 cm soil depth relative to the upper layers. In 2020, the CAGR of the MOC in the 10–20 cm soil layer after eight years of straw return was significantly lower than in 2019. This was mainly attributed to the fact that the MOC content in the SR10 treatment in this soil depth was reduced compared to the SR9 treatment, possibly due to the transfer of organic carbon from MOC to POC.

3.5. Variability in SOC and Its Components
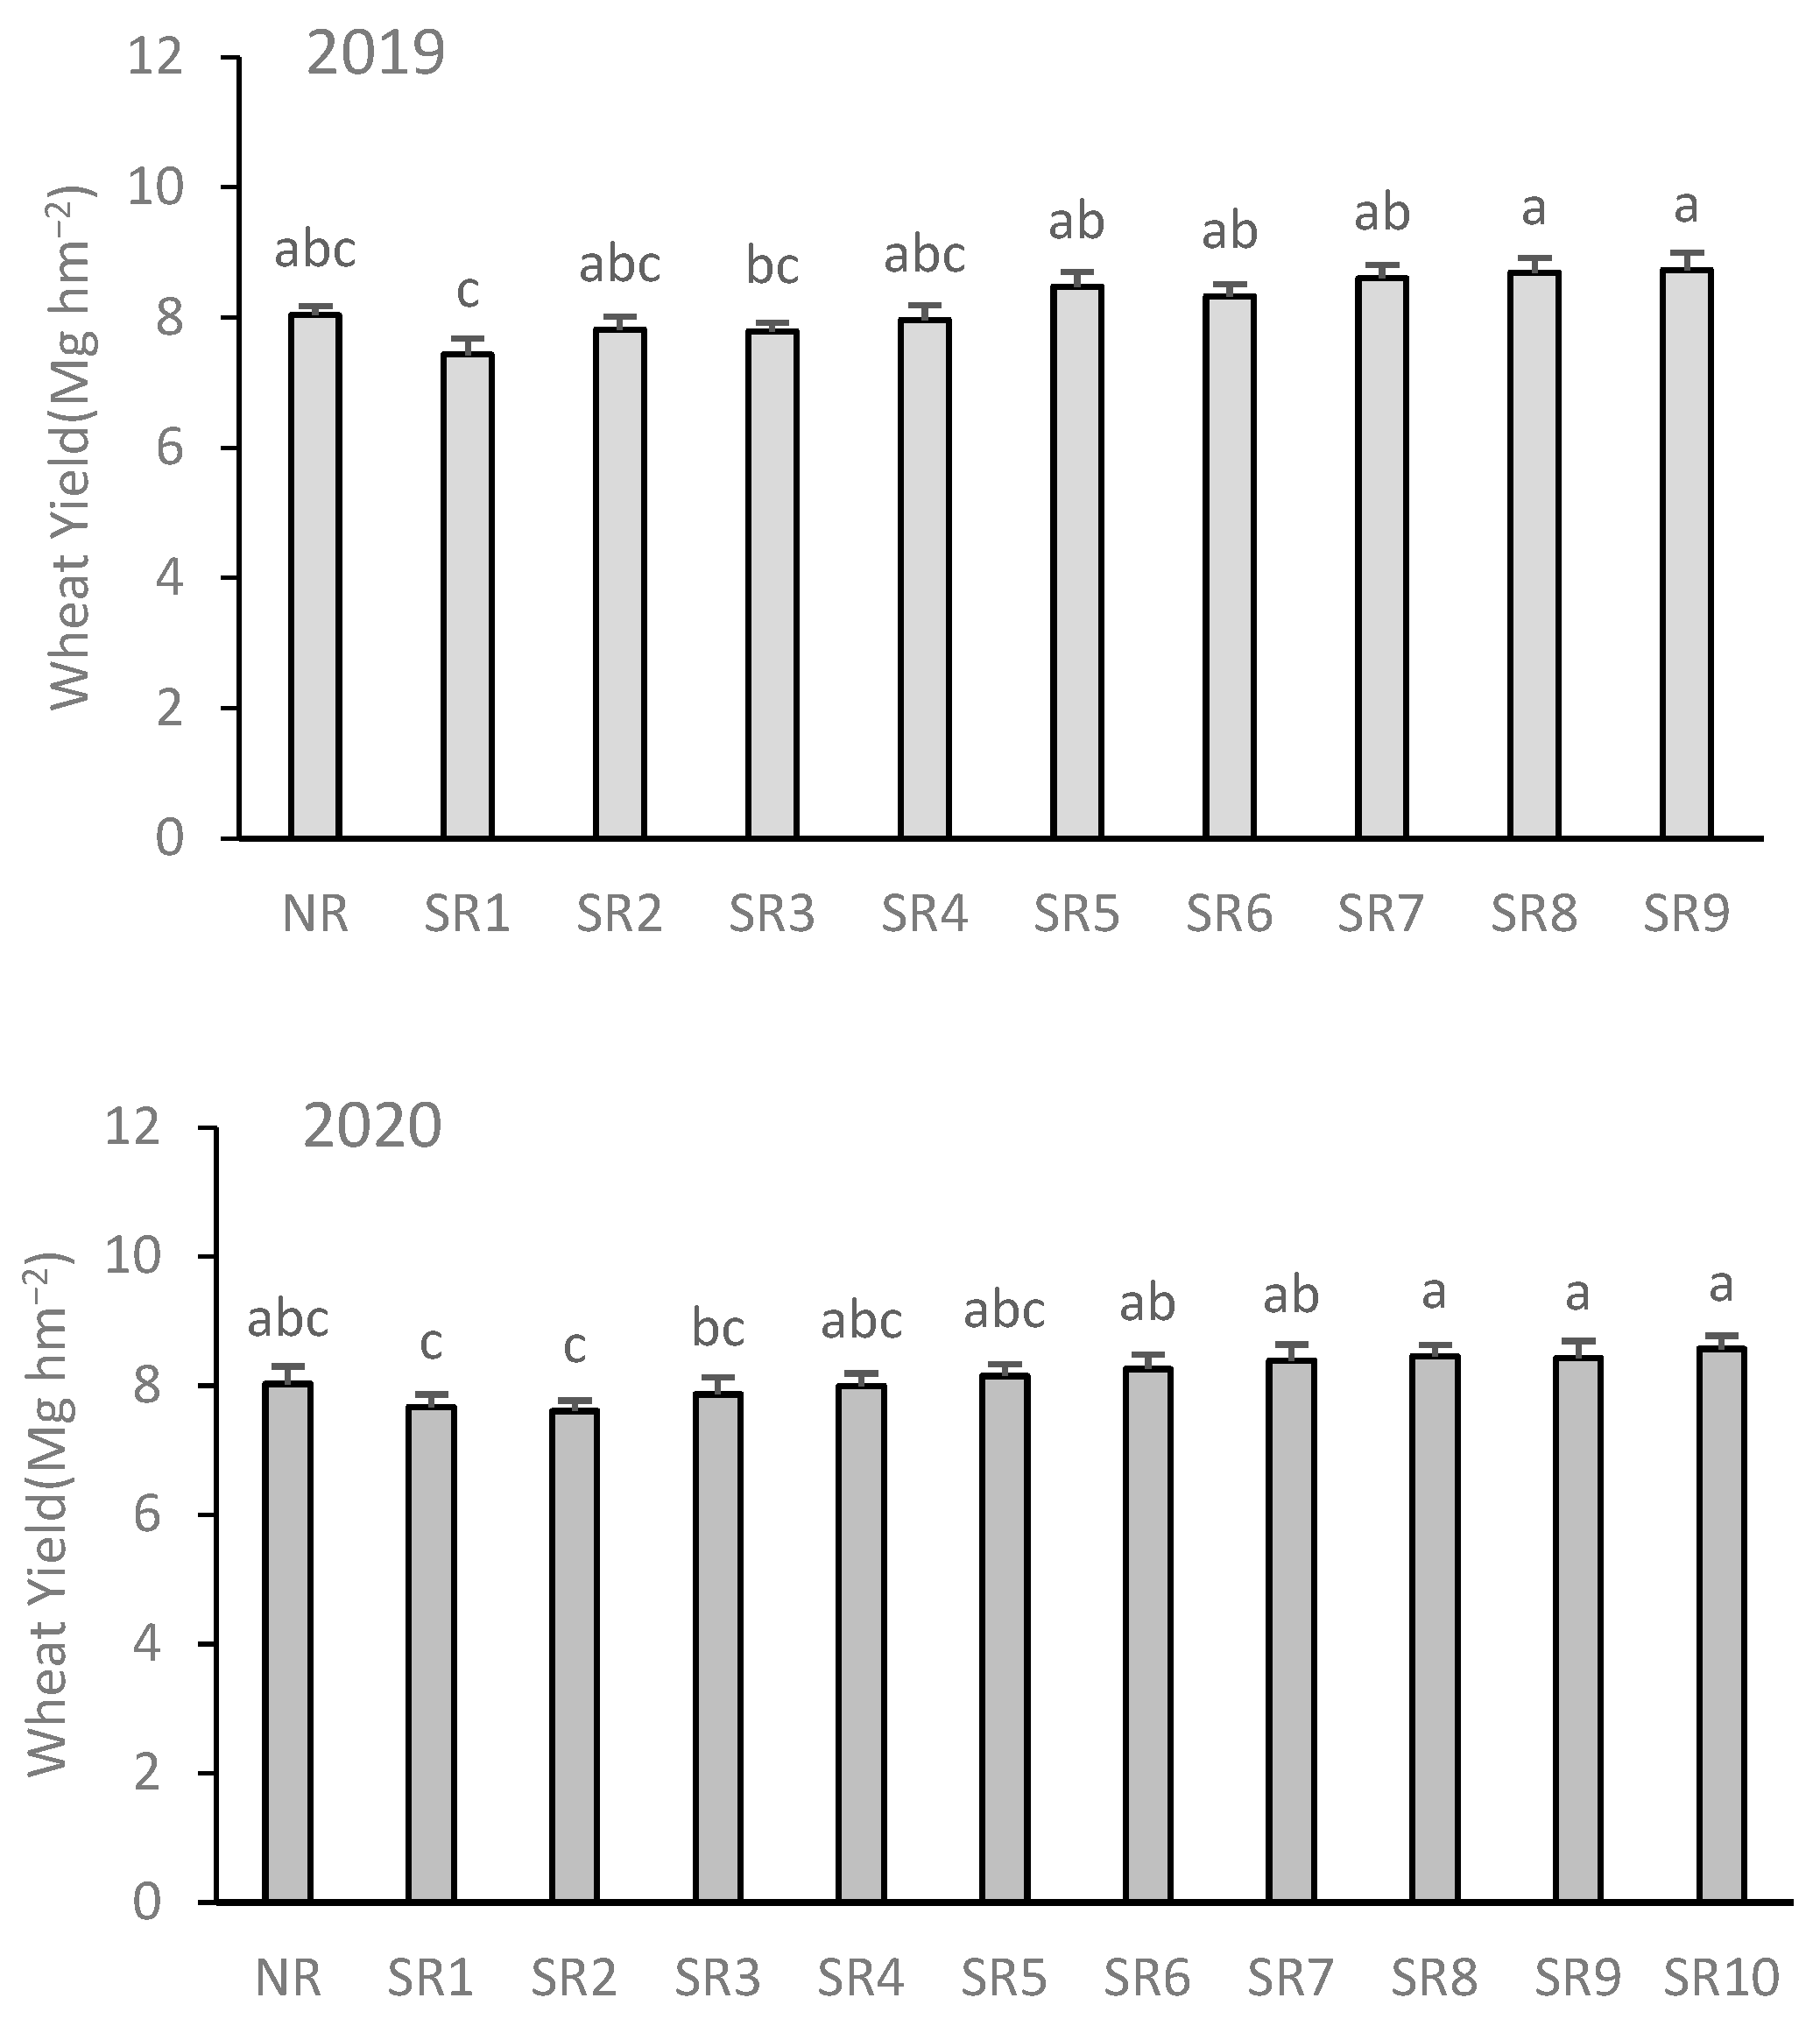
Correlation analysis results showed that the LFOC, HFOC, POC, and MOC contents were significantly correlated (p < 0.01) with the SOC content (Table 2), indicating that all of these could be used as indicators of the SOC change. The variation of SOC and its constituents varied across all soil depths (Table 3). In the 0–5 cm and 5–10 cm soil layers, all treatments exhibited positive values for SOC and its component variation, whereas in the 10–20 cm soil layer, except for the SR1 treatment (LFOC in 2019, HFOC in 2020, and POC in 2020), the values were positive. The variation in SOC ranged from 1.41% to 45.88%, LFOC from −1.87% to 187.22%, HFOC from −0.11% to 41.55%, POC from −0.90% to 97.89%, and MOC from −0.59% to 28.21%.
These results indicated that among the 0–20 cm soil layers, the soil LFOC exhibited the highest variation, with the highest sensitivity to the years of straw return, followed by POC, with MOC being the least sensitive. Overall, the variation of SOC and its components increased as the years of straw return increased in various soil layers. However, in 2020, the variation of MOC decreased after eight years of straw return. Correlation analysis revealed a highly significant relationship (p < 0.01) between the variation in LFOC, HFOC, POC, and MOC and the variation in SOC. HFOC exhibited the highest correlation among these, with Pearson coefficients of 0.990 (2019) and 0.998 (2020). Although HFOC showed the highest correlation with SOC variation, its variation was relatively low, which indicates a lower sensitivity to management measures. In contrast, LFOC exhibited the highest variation and was considered the optimal indicator for reflecting the influence of straw return on SOC levels.

3.6. Wheat Yield

As the years of straw return increased, the wheat yield initially decreased, followed by an increase (Figure 5). This phenomenon might be due to the observation that when the duration of straw return was short, the straw did not decompose and convert into organic matter promptly. This resulted in residual coarse fibers in the soil, adversely affecting seedling development and reducing yields. As the duration of the straw return extended, the straw gradually decomposed and entered the soil, improving the soil fertility and elevating the wheat yield. The findings of the correlation assessment (Table 4) indicated significant correlations between the contents of SOC, LFOC, HFOC, POC, MOC, and wheat yield. The linear regression results suggested that the increase in LFOC content contributed the most to the enhanced wheat yield, possibly due to its higher activity.

4. Discussion

4.1. Impact of Straw Return Duration on Soil Organic Carbon Content

Numerous studies have indicated that under straw return conditions, the content of SOC gradually decreases with increasing soil depth [23,24,25]. In this experiment, it was observed that the SOC content in the 10–20 cm depth decreased compared to the 0–5 cm and 5–10 cm depths. This finding aligns with previous research by Dai et al. [26] conducted in northern China. However, in the 5–10 cm soil depth, the SOC content in all treatments increased compared to the 0–5 cm, which is consistent with the trends observed in the study by Wu et al. [27] on wheat straw return. This discrepancy may be attributed to the even distribution of wheat straw in the 0–15 cm soil layer in this experiment. The 0–5 cm soil layer is in direct contact with the atmosphere and has a lower bulk density and higher porosity, facilitating better soil aeration and promoting SOC decomposition [28].
After 2–3 years of straw return (SR2-SR3), the SOC content in all soil layers was significantly higher than in the NR treatment (p < 0.05). This result indicates that straw return can significantly enhance the SOC content [29,30]. However, when the duration of straw return exceeded eight years, the CAGR of the SOC in all soil layers sharply declined, which is consistent with the findings of Li et al. [31] in southern rice fields. This decline may be related to increased soil organic carbon decomposition intensity [32].

4.2. Influence of Straw Return Duration on Soil Organic Carbon Components

LFOC, which is less protected and highly active, is sensitive to external factors such as agricultural management practices, making it quick to respond to changes in farming methods. In contrast, HFOC is a relatively stable carbon component in the soil, and its response to farming practices is less pronounced [16]. The results of this study indicate that LFOC exhibits the highest variation, underscoring its susceptibility to the impact of straw return. In all treatments, the LFOC content initially increased and subsequently decreased at deeper soil depths. This trend can be attributed primarily to the fact that the 0–5 cm soil layer is in direct contact with the atmosphere, enhancing the decomposition intensity of LFOC, a highly active organic carbon component [33].
Additionally, wheat root residues were lower in the 10–20 cm soil profiles than in the 5–10 cm soil profiles, resulting in lower additional organic carbon input in the 10–20 cm soil layer. As the duration of straw return was lengthened, the LFOC and HFOC levels across all soil layers gradually rose. However, when the straw return duration exceeded eight years, the CAGR of both the LFOC and HFOC decreased. This decline is primarily because of the increase in soil organic matter content influenced by straw return, leading to a rise in soil microbiota biomass and activity and accelerating the decomposition and usage rates of LFOC and HFOC in the soil [34].
POC primarily consists of partially decomposed plant residues. It is sensitive to agricultural management practices, while MOC represents a more stable carbon fraction [35,36]. This study revealed that the POC content in all treatments initially increased, followed by a decrease, alongside soil depth. Furthermore, with the increasing duration of straw return, the POC content gradually rose in all soil layers. However, the CAGR of the POC content in all soil layers declined after eight years of straw return. This decrease is primarily attributed to enhanced soil microbial activity [37]. As the straw return duration increased, the 2019 0–5 cm soil layer, 2020 0–5 cm soil layer, and 10–20 cm soil layer possessed correspondingly elevated MOC levels, followed by a subsequent decrease. This phenomenon is mainly due to the production of humic substances and polysaccharides which have adhesive properties during straw decomposition. They promote the accumulation of soil particles into granules and the conglomeration of small granules into larger ones, facilitating the transfer of soil organic carbon into the particle composition. Simultaneously, the stability of POC is enhanced [15]. With the increasing duration of straw return, more humic substances are generated from straw decomposition, further strengthening their role in forming and maintaining soil particle composition and promoting the transfer of SOC from MOC to POC. The findings outlined in our study also confirm that following eight years of straw return, the CAGR of MOC in the 10–20 cm soil profiles in 2020 was significantly reduced compared to 2019, substantiating this observation.

4.3. Relationships among Soil Organic Carbon and Its Components and Their Impact on Wheat Yield

Under different straw return durations, there were highly significant positive correlations (p < 0.01) among the LFOC, HFOC, POC, MOC, and SOC content. The Pearson correlation coefficients for 2019 were 0.972, 0.999, 0.969, and 0.922, respectively, while for 2020, they were 0.974, 0.999, 0.986, and 0.980, respectively. These findings indicate that all four components can indicate SOC variations. Within each soil layer in the 0–20 cm range, the variation in SOC components was significantly correlated with the variation in SOC. Furthermore, LFOC showed the highest rate of change, demonstrating the highest sensitivity to the years of straw return. This suggests that LFOC is the most reliable indicator of SOC content influenced by the duration of straw return [38].
Crop residues like straw contain carbon, nitrogen, phosphorus, and potassium nutrients, enriching soil fertility and enhancing wheat yield [39,40]. The results of this experiment reveal that as the duration of straw return increases, wheat yield initially decreases and then increases, except for a decrease in the SR6 treatment in 2019 and the SR9 treatment in 2020. When the straw return duration is short, and straw does not decompose into humic substances promptly, residual coarse fibers in the soil can hinder seedling development and potentially lead to reduced yields. Conversely, excessive straw return can trigger pest and root diseases, also affecting wheat growth [41]. The correlation assessment indicated that organic carbon components within the 0–20 cm soil layers are significantly positively correlated with wheat yield. While organic carbon is not a direct nutrient element for wheat growth, it is a vital part of soil organic matter. Increased organic carbon content signifies an increase in soil organic matter content, subsequently enhancing the content of essential nutrients like nitrogen, phosphorus, and potassium in the soil, promoting increased wheat yields. Research by Li et al. [42] also demonstrated a significant relationship between wheat yield and soil organic carbon and total nitrogen content. The highest influence on increased wheat yield comes from an increased LFOC content, possibly due to enhanced soil organic matter activity. This can provide the soil with more active nutrient elements, thus favoring increased wheat yield.

5. Conclusions

As the duration of straw return was lengthened, the SOC levels within the 0–20 cm soil layers progressively increased to a corresponding degree, with the SR1-SR10 treatments showing an increase ranging from 0.18% to 45.88% compared to the NR treatment. Furthermore, the contents of LFOC, HFOC, and POC also increased with the duration of straw return, with LFOC exhibiting the highest compound annual growth rate (CAGR), followed by POC. After eight years of straw return, the CAGR of SOC and its components in the 10–20 cm soil layer experienced a significant decline too. But its reduction was smaller than the 0–5 cm and 5–10 cm soil layers. Therefore, reducing the amount of straw retention and developing other means of utilizing straw to improve the comprehensive benefit could be considered.
LFOC displayed the maximum sensitivity to the duration of straw return and serves as the optimal gauge for the impact of straw return on soil carbon pools. With an increase in the duration of straw return, the wheat yield exhibited a trend of initial decrease followed by an increase. The wheat yield was significantly correlated with the content of SOC, LFOC, HFOC, POC, and MOC, with the rise in LFOC content contributing the most to increased wheat yield. Therefore, LFOC played an essential role in reflecting soil carbon pool changes and increasing wheat yield.

Author Contributions

Data curation, S.C.; formal analysis, S.C.; resources, X.Z.; writing—original draft, S.C.; writing—review and editing, G.C. All authors have read and agreed to the published version of the manuscript.

Funding

This research was partially funded by the Natural Science Foundation of Jiangsu Province (Grant No. BK20220203), the Fundamental Research Funds for the Central Public Research Institutes (Grant No. S202320), and the Science and Technology Innovation Project of the Chinese Academy of Agricultural Sciences (Agricultural Academy Office (2014) No. 216).

Institutional Review Board Statement

Not applicable.

Informed Consent Statement

Not applicable.

Data Availability Statement

The data in this study are available upon reasonable request from the corresponding author.

Acknowledgments

We thank the editors and three anonymous reviewers for their comments on the manuscript.

Conflicts of Interest

The authors declare no conflicts of interest.

References

  1. Loveland, P.; Webb, J. Is there a critical level of organic matter in the agricultural soils of temperate regions: A review. Soil Tillage Res. 2003, 70, 1–18. [Google Scholar] [CrossRef]
  2. Pan, G.X.; Smith, P.; Pan, W.N. The role of soil organic matter in maintaining the productivity and yield stability of cereals in China. Agric. Ecosyst. Environ. 2009, 129, 344–348. [Google Scholar] [CrossRef]
  3. Haynes, R.J. Labile organic matter as an indicator of organic matter quality in arable and pastoral soils in New Zealand. Soil Biol. Biochem. 2000, 32, 211–219. [Google Scholar] [CrossRef]
  4. Liu, E.K.; Teclemariam, S.G.; Yan, C.R.; Yu, J.M.; Gu, R.S.; Liu, S.; He, W.Q.; Liu, Q. Long-term effects of no-tillage management practice on soil organic carbon and its fractions in the northern China. Geoderma 2014, 213, 379–384. [Google Scholar] [CrossRef]
  5. Xue, J.F. Effects of Tillage on Soil Carbon and Nitrogen in Double Paddy Cropping System of Southern China. Ph.D. Thesis, China Agriculture University, Beijing, China, 2015. (In Chinese with English Abstract). [Google Scholar]
  6. Chan, K.Y.; Heenan, D.P.; Oates, A. Soil carbon fractions and relationship to soil quality under different tillage and stubble management. Soil Tillage Res. 2002, 63, 133–139. [Google Scholar] [CrossRef]
  7. Tan, Z.; Lal, R.; Owens, L.; Izaurralde, R.C. Distribution of light and heavy fractions of soil organic carbon as related to land use and tillage practice. Soil Tillage Res. 2007, 92, 53–59. [Google Scholar] [CrossRef]
  8. Yang, Y.H.; Su, C.; He, Z.C.; Yu, M.; Chen, X.J.; Shen, A.L. Transformation and distribution of straw-derived carbon in soil and the effects on soil organic carbon pool: A review. Chin. J. Appl. Ecol. 2019, 30, 668–676, (In Chinese with English Abstract). [Google Scholar]
  9. Chen, Z.M.; Wang, H.Y.; Liu, X.W.; Zhao, X.L.; Lu, D.J.; Zhou, J.M.; Li, C.Z. Changes in soil microbial community and organic carbon fractions under short-term straw return in a rice–wheat cropping system. Soil Tillage Res. 2017, 165, 121–127. [Google Scholar] [CrossRef]
  10. Yan, S.S.; Song, J.M.; Fan, J.S.; Yan, C.; Dong, S.K.; Ma, C.M.; Gong, Z.P. Changes in soil organic carbon fractions and microbial community under rice straw return in Northeast China. Glob. Ecol. Conserv. 2020, 22, e962. [Google Scholar] [CrossRef]
  11. Zhang, Z.H.; Nie, J.; Liang, H.; Wei, C.L.; Wang, Y.; Liao, Y.L.; Lu, Y.H.; Zhou, G.P.; Gao, S.J.; Cao, W.D. The effects of co-utilizing green manure and rice straw on soil aggregates and soil carbon stability in a paddy soil in southern China. J. Integr. Agric. 2023, 22, 1529–1545. [Google Scholar] [CrossRef]
  12. Dong, L.L.; Wang, H.H.; Shen, Y.; Wang, L.Q.; Zhang, H.D.; Shi, L.L.; Lu, C.Y.; Shen, M.X. Straw type and returning amount affects SOC fractions and Fe/Al oxides in a rice-wheat rotation system. Appl. Soil Ecol. 2023, 183, 104736. [Google Scholar] [CrossRef]
  13. Liu, B.; Xia, H.; Jiang, C.C.; Riaz, M.; Yang, L.; Chen, Y.F.; Fan, X.P.; Xia, X.G. 14 year applications of chemical fertilizers and crop straw effects on soil labile organic carbon fractions, enzyme activities and microbial community in rice-wheat rotation of middle China. Sci. Total Environ. 2022, 841, 156608. [Google Scholar] [CrossRef] [PubMed]
  14. Mi, W.H.; Sun, Y.; Zhao, C.; Wu, L.H. Soil organic carbon and its labile fractions in paddy soil as influenced by water regimes and straw management. Agric. Water Manag. 2019, 224, 105752. [Google Scholar] [CrossRef]
  15. Mitchell, E.; Scheer, C.; David, R.; Conant, R.T.; Cotrufo, M.F.; Grace, P. Amount and incorporation of plant residue inputs modify residue stabilisation dynamics in soil organic matter fractions. Agric. Ecosyst. Environ. 2018, 256, 82–91. [Google Scholar] [CrossRef]
  16. Xu, S.Q.; Cui, S.Y.; Chen, F.; Xiao, X.P.; Zhang, H.L. Effect of Tillage on Content of Density Fractions of Paddy Soil Organic Carbon and Its Spatial Distribution. J. Agro-Environ. Sci. 2011, 30, 127–132, (In Chinese with English Abstract). [Google Scholar]
  17. Zhang, J.K.; Jiang, Z.S.; Hao, Q.J.; Wu, Y.; Xie, D.T. Effect of tillage systems on light fraction carbon in a purple paddy soil. Acta Ecol. Sin. 2012, 32, 4379–4387, (In Chinese with English Abstract). [Google Scholar] [CrossRef]
  18. Hu, N.J.; Chen, Q.; Zhu, L.Q. Life Cycle Environmental Impact Assessment on Rice-Winter Wheat Rotation System in the Middle and Lower Reaches of Yangtze River: A Case Study of Nanjing, Jiangsu Province. Resour. Environ. Yangtze Basin 2019, 28, 1111–1120, (In Chinese with English Abstract). [Google Scholar]
  19. Gong, Z.T.; Zhang, G.L.; Chen, Z.C. Pedogenesis and Soil Taxonomy; Sciences Press: Beijing, China, 2007. (In Chinese) [Google Scholar]
  20. Bao, S.D. Soil Agro-Chemistrical Analysis, 3rd ed.; China Agriculture Press: Beijing, China, 2000; (In Chinese with English Abstract). [Google Scholar]
  21. Lee, J.H. An overview of phytoremediation as a potentially promising technology for environmental pollution control. Biotechnol. Bioprocess Eng. 2013, 18, 431–439. [Google Scholar] [CrossRef]
  22. Daniel, P.B.; Jorge, Á.F.; Carlos, C.M. Identifying soil organic carbon fractions sensitive to agricultural management practices. Soil Tillage Res. 2014, 139, 19–22. [Google Scholar]
  23. Li, S.; Li, Y.B.; Wang, S.J.; Shi, J.L.; Tian, X.H. Effects of different straw-returning regimes on soil organic carbon and carbon pool management index in Guanzhong Plain, Northwest China. Chin. J. Appl. Ecol. 2015, 26, 1215–1222, (In Chinese with English Abstract). [Google Scholar]
  24. Wang, H.H.; Jin, M.J.; Lu, Z.Y.; Shi, L.L.; Zhou, X.W.; Shen, M.X.; Ji, G.J.; Zhang, Y.C. Effects of Patterns of Returning Straw to Field on Soil Carbon Pool and Yield in Rice-wheat Double Cropping Systems. J. Nat. Resour. 2017, 32, 755–764, (In Chinese with English Abstract). [Google Scholar]
  25. Zhang, P.; Li, H.; Jia, Z.K.; Wang, W.; Lu, W.T.; Zhang, H.; Yang, B.P. Effects of Straw Returning on Soil Organic Carbon and Carbon Mineralization in Semi-arid Areas of Southern Ningxia, China. J. Agro-Environ. Sci. 2011, 30, 2518–2525, (In Chinese with English Abstract). [Google Scholar]
  26. Dai, H.C.; Chen, Y.Q.; Zhao, Y.X.; Cui, J.X.; Yang, X.L.; Xiao, H.; Sui, P. Effects and causes of different organic materials amendment on soil organic carbon in North China Plain. Trans. Chin. Soc. Agric. Eng. 2016, 32, 103–110, (In Chinese with English Abstract). [Google Scholar]
  27. Wu, Y.H.; Hao, X.S.; Tian, X.H.; Chen, Y.L.; Zhang, C.H.; Chen, H.; Li, H.H.; Qin, Y.H.; Huang, Z. Effect of Straw Returning on the Contents of Soil Organic Carbon Fractions, Carbon Storage and Crop Yields of Paddy Field in Hanzhong Basin. J. Soil Water Conserv. 2017, 31, 325–331, (In Chinese with English Abstract). [Google Scholar]
  28. Ussiri, D.A.N.; Lal, R. Long-term tillage effects on soil carbon storage and carbon dioxide emissions in continuous corn cropping system from an alfisol in Ohio. Soil Tillage Res. 2009, 104, 39–47. [Google Scholar] [CrossRef]
  29. Poeplau, C.; Kätterer, T.; Bolinder, M.A.; Börjesson, G.; Berti, A.; Lugato, E. Low stabilization of aboveground crop residue carbon in sandy soils of Swedish long-term experiments. Geoderma 2015, 237–238, 246–255. [Google Scholar] [CrossRef]
  30. Zhao, H.L.; Shar, A.G.; Li, S.; Chen, Y.L.; Shi, J.L.; Zhang, X.Y.; Tian, X.H. Effect of straw return mode on soil aggregation and aggregate carbon content in an annual maize-wheat double cropping system. Soil Tillage Res. 2018, 175, 178–186. [Google Scholar] [CrossRef]
  31. Li, J.; Tao, B.R.; Jiao, M.L.; Yin, S.H.; Zhu, L.Q. Assessment on topsoil carbon sequestration potential under straw return modes in paddy fields in South China—Based on a Meta-analysis. J. Nanjing Agric. Univ. 2015, 38, 351–359, (In Chinese with English Abstract). [Google Scholar]
  32. Guttières, R.; Nunan, N.; Raynaud, X.; Lacroix, G.; Barot, S.; Barré, P.; Girardin, C.; Guenet, B.; Lata, J.C.; Abbadie, L. Temperature and soil management effects on carbon fluxes and priming effect intensity. Soil Biol. Biochem. 2021, 153, 108103. [Google Scholar] [CrossRef]
  33. Jiao, L.N.; Li, Z.H.; Yin, C.C.; Wang, X.F.; Xin, S.Y.; Yu, L. Effect of incorporation of crop straw on composition of soil organic matter and enzyme activity in black soil relative to depth and rate of the incorporation. Acta Pedol. Sin. 2015, 52, 665–672, (In Chinese with English Abstract). [Google Scholar]
  34. Dong, S.S.; Dou, S.; Lin, C.M.; Li, L.B.; Tan, C. Decomposition Rate of Corn Straw in Soil and Its Effects on Soil Humus Composition. J. Jilin Agric. Univ. 2016, 38, 579–586, (In Chinese with English Abstract). [Google Scholar]
  35. Desrochers, J.; Brye, K.R.; Gbur, E.; Pollock, E.D.; Savin, M.C. Long-term residue and water management practice effects on particulate organic matter in a loessial soil in eastern Arkansas, USA. Geoderma 2019, 337, 792–804. [Google Scholar] [CrossRef]
  36. Domínguez, G.F.; Diovisalvi, N.V.; Studdert, G.A.; Monterubbianesi, M.G. Soil organic C and N fractions under continuous cropping with contrasting tillage systems on mollisols of the southeastern Pampas. Soil Tillage Res. 2009, 102, 93–100. [Google Scholar] [CrossRef]
  37. Duan, Y.; Chen, L.; Li, Y.M.; Wang, Q.Y.; Zhang, C.Z.; Ma, D.H.; Li, J.Y.; Zhang, J.B. N, P and straw return influence the accrual of organic carbon fractions and microbial traits in a Mollisol. Geoderma 2021, 403, 115373. [Google Scholar] [CrossRef]
  38. Liu, J.; Li, L.L.; Xie, J.H.; Deng, C.C.; Peng, Z.K.; Yeboah, S.; Lamptey, S. Soil total organic carbon and its light fractions in response to 14 years of conservation tillage. Agric. Res. Arid. Areas 2017, 35, 8–13, (In Chinese with English Abstract). [Google Scholar]
  39. Islam, M.U.; Guo, Z.C.; Jiang, F.H.; Peng, X.H. Does straw return increase crop yield in the wheat-maize cropping system in China? A meta-analysis. Field Crops Res. 2022, 279, 108447. [Google Scholar] [CrossRef]
  40. Guo, L.J.; Li, Z.; Liu, L.; Sheng, F.; Cao, C.G.; Li, C.F. Effects of long-term no tillage and straw return on greenhouse gas emissions and crop yields from a rice-wheat system in central China. Agric. Ecosyst. Environ. 2021, 322, 107650. [Google Scholar] [CrossRef]
  41. Xu, J.L.; Hu, N.J.; Zhu, L.Q. Effect of Amount of Annual Straw Returning on Soil Nutrients and Yield in Winter Wheat Field. J. Triticeae Crops 2016, 36, 215–222, (In Chinese with English Abstract). [Google Scholar]
  42. Li, Y.; Feng, H.; Dong, Q.G.; Xia, L.L.; Li, J.C.; Li, C.; Zang, H.D.; Andersen, M.N.; Olesen, J.E.; Jørgensen, U.; et al. Ammoniated straw incorporation increases wheat yield, yield stability, soil organic carbon and soil total nitrogen content. Field Crops Res. 2022, 284, 108558. [Google Scholar] [CrossRef]
Figure 1. Mean monthly air temperature and monthly precipitation during the research period at Yangzhou station (Jiangsu, China).
Sustainability 16 00754 g001
Figure 2. Depth division of soil organic carbon levels upon varied durations of straw return. NR represents no straw return; SR1–SR10 represents the straw return treatment for 1–10 years. Various letters over the bars denote a significant alteration between tillage treatments at identical soil depths at p < 0.05.
Sustainability 16 00754 g002
Figure 3. Depth division of soil LFOC and HFOC levels based on varied durations of straw return. Various letters over the bars denote a significant alteration between tillage treatments at identical soil depths at p < 0.05.
Sustainability 16 00754 g003aSustainability 16 00754 g003b
Figure 4. Depth division of soil POC and MOC levels based on varied durations of straw return. Various letters over the bars denote a significant alteration between tillage treatments at identical soil depths at p < 0.05.
Sustainability 16 00754 g004aSustainability 16 00754 g004b
Figure 5. Wheat yield after exposure to various durations of straw return. Various letters over the bars denote a significant alteration between tillage treatments at identical soil depths at p < 0.05.
Sustainability 16 00754 g005
Table 1. The compound annual growth rate of the SOC, LFOC, HFOC, POC, and MOC contents.
Soil Depth/cmYearSOCLFOCHFOCPOCMOC
Before SR8After SR8Before SR8After SR8Before SR8After SR8Before SR8After SR8Before SR8After SR8
0–520194.251.3813.083.913.741.167.803.902.780.08
20204.331.9112.804.693.811.667.065.283.130.10
5–1020194.361.0612.5710.143.880.307.512.783.030.19
20204.321.9112.674.683.811.667.385.162.960.12
10–2020194.012.059.985.513.702.898.354.152.172.45
20204.242.3110.086.673.922.007.835.612.600.38
Table 2. Pearson correlation coefficients among SOC contents and soil organic carbon components.
20192020
LFOCHOCPOCMOCLFOCHFOCPOCMOC
SOC0.972 **0.999 **0.969 **0.922 **0.974 **0.999 **0.986 **0.980 **
Note: ** indicates a significant correlation at p < 0.01.
Table 3. Variation in SOC, LFOC, HFOC, POC, and MOC due to exposure to varied straw return durations.
Soil Depth (cm)Treatments20192020
SOC/%LFOC/%HFOC/%POC/%MOC/%SOC/%LFOC/%HFOC/%POC/%MOC/%
0–5NR0.000.000.000.000.000.000.000.000.000.00
SR13.6710.092.221.004.611.982.961.930.742.45
SR210.8423.156.797.9911.846.5123.825.728.395.78
SR319.0945.4312.0821.5618.2212.0352.4610.1917.1510.05
SR425.8082.4917.5132.8523.3318.1383.9115.1434.9611.63
SR530.89109.2526.9748.9224.5624.52113.3820.4842.2717.67
SR633.31132.1229.1262.9722.9131.14138.4126.2750.3123.75
SR736.98151.1032.1473.0624.3335.68150.4130.4661.1325.85
SR839.53167.2934.1182.3624.5040.38162.0834.8572.6027.95
SR941.45177.7435.6689.4724.6043.17175.1037.1779.7929.04
SR10/////45.79187.2239.3691.3228.21
5–10NR0.000.000.000.000.000.000.000.000.000.00
SR12.3310.231.986.020.991.971.921.974.141.14
SR210.9322.0810.4416.089.066.5324.185.7313.163.98
SR319.0346.9217.8027.9615.7912.6755.5310.7223.108.66
SR426.9169.8125.0243.6220.8519.1480.3616.3635.6712.79
SR532.0294.3529.2755.3823.5424.10109.7820.2150.3414.01
SR636.40112.5133.0465.9425.6930.74132.9726.1059.0219.88
SR738.35140.0033.8672.2026.0636.20144.8431.2767.6324.13
SR840.73157.9035.5678.5327.0240.26159.6534.8376.7426.24
SR942.23184.0635.9783.4927.2643.24 172.46 37.37 87.83 26.11
SR10/////45.66184.53 39.35 95.45 26.53
10–20NR0.000.000.000.000.000.000.000.000.000.00
SR11.41−1.871.550.241.820.186.75−0.11−0.900.59
SR25.4810.705.2612.173.173.2520.952.488.841.12
SR312.9028.8612.2328.277.618.7935.197.6418.025.26
SR418.0849.8116.7446.618.2615.4747.5114.0832.628.92
SR524.9166.7423.1561.4312.3421.9166.3219.9843.2313.77
SR629.7489.2827.2374.6114.2928.7281.9626.4057.0317.90
SR734.57100.6531.7983.5317.7234.8098.3732.0368.4021.96
SR836.98114.0333.7490.0118.7339.98115.5836.6882.8123.61
SR941.17125.8137.6097.8921.6442.75 131.17 38.89 90.69 24.43
SR10/////45.88 145.25 41.55 95.46 23.70
Pearson correlation coefficients
Variation of SOC0.958 **0.990 **0.949 **0.922 **/0.959 **0.998 **0.991 **0.982 **
Note: ** indicates a significant correlation at p < 0.01.
Table 4. Correlation and regression assessment of wheat yield and SOC, LFOC, HFOC, POC, and MOC levels.
Soil Depth (cm)Carbon ComponentsPearson’s Correlation Coefficients with Wheat YieldLinear Regression Equation
2019202020192020
0–5SOC0.901 **0.919 **y = 0.1424x + 5.0953 R2 = 0.8118y = 0.103x + 5.9387 R2 = 0.8445
LFOC0.903 **0.918 **y = 0.8275x + 7.0535 R2 = 0.816y = 0.5696x + 7.2799 R2 = 0.8432
HFOC0.899 **0.918 **y = 0.1716x + 4.6967 R2 = 0.809y = 0.1254x + 5.6479 R2 = 0.843
POC0.914 **0.925 **y = 0.2587x + 6.4962 R2 = 0.8358y = 0.1937x + 6.8133 R2 = 0.8558
MOC0.706 *0.898 **y = 0.2593x + 4.1777 R2 = 0.4988y = 0.2131x + 5.0443 R2 = 0.8058
5–10SOC0.860 **0.917 **y = 0.1329x + 5.1938 R2 = 0.7395y = 0.1001x + 5.9308 R2 = 0.8415
LFOC0.899 **0.917 **y = 0.8107x + 7.0502 R2 = 0.8087y = 0.5647x + 7.27 R2 = 0.8415
HFOC0.844 **0.917 **y = 0.1559x + 4.8963 R2 = 0.7115y = 0.1214x + 5.6466 R2 = 0.84
POC0.887 **0.915 **y = 0.2657x + 6.3383 R2 = 0.7874y = 0.1789x + 6.8347 R2 = 0.8377
MOC0.816 **0.912 **y = 0.256x + 4.204 R2 = 0.6654y = 0.2229x + 4.8446 R2 = 0.831
10–20SOC0.902 **0.936 **y = 0.1551x + 5.0124 R2 = 0.814y = 0.1047x + 6.0068 R2 = 0.8767
LFOC0.914 **0.911 **y = 1.2298x + 6.8488 R2 = 0.8348y = 0.8463x + 7.1417 R2 = 0.8294
HFOC0.900 **0.939 **y = 0.1773x + 4.7511 R2 = 0.8102y = 0.1193x + 5.8507 R2 = 0.8818
POC0.907 **0.929 **y = 0.2466x + 6.5832 R2 = 0.8223y = 0.1758x + 6.951 R2 = 0.8631
MOC0.889 **0.935 **y = 0.4125x + 2.4259 R2 = 0.7897y = 0.2525x + 4.7044 R2 = 0.874
Note: * indicates a significant correlation at p < 0.05. ** indicates a significant correlation at p < 0.01.
Disclaimer/Publisher’s Note: The statements, opinions and data contained in all publications are solely those of the individual author(s) and contributor(s) and not of MDPI and/or the editor(s). MDPI and/or the editor(s) disclaim responsibility for any injury to people or property resulting from any ideas, methods, instructions or products referred to in the content.

