
Does Firm Size Matter for ESG Risk? Cross-Sectional Evidence from the Banking Industry

Department of Economic Policy and Banking, The John Paul II Catholic University of Lublin, Al. Racławickie 14, 20-950 Lublin, Poland
Sustainability 2024, 16(2), 679; https://doi.org/10.3390/su16020679
Submission received: 16 November 2023
/
Revised: 5 January 2024
/
Accepted: 10 January 2024
/
Published: 12 January 2024
(This article belongs to the Special Issue Theory and Practice of Sustainable Economic Development)
Abstract
:The ambiguous evidence regarding the linkages between firm size and ESG risk in the relevant literature justifies the need for their further scientific investigation. A particularly interesting context for this task is offered by the banking industry, where financial institutions face both strong incentives to expand the scale of their activities and high reputational risk sensitivity. Given the above, this paper aims to systematize and enhance the theoretical underpinnings of the relationship between firm size and ESG risk in banks, highlighting its likely non-linear character, and to investigate it empirically in the cross-section of the international banking industry. This research employs uni- and multivariate, and linear and non-linear regression analyses applied to a sample of 668 banks that were assigned the Morningstar Sustainalytics ESG Risk Rating for the year 2021. The results demonstrate that, although, on average, size seems to be associated negatively with ESG risk in the cross-section, the relationship is in fact non-linear and follows a U-shaped pattern. The findings are robust regarding the impact of both country-specific contextual factors and outliers. This study emphasizes the importance of diseconomies of scale in ESG risk management, thus offering some important lessons and recommendations for bank executives and equity investors.
1. Introduction
With increasing global awareness of the importance of sustainability and social responsibility in business practices, companies around the world are continuously pressured to recognize and properly manage the relevant environmental, social, and governance (ESG) dimensions of their everyday actions and decisions. In fact, this pressure comes from every major stakeholder group, including customers, suppliers, employees, regulators, and, ultimately, investors.
As more and more professional asset managers representing the world’s largest investment institutions integrate sustainability issues into their investment criteria [1,2] it seems that, after half a century, the classic Milton Friedman doctrine reducing the social responsibility of companies in profit maximization [3] is becoming outdated. The global interest in responsible investing is constantly gaining pace, as only in the last decade, the number of signatories to the UN-backed Principles for Responsible Investment, and the volume of assets under their management, more than tripled, reaching 3800 and USD 121.3 trillion, respectively [4]. Furthermore, benefits arising from ESG-based investing may extend to global financial stability frameworks, as they likely contribute to reductions in systemic risk [5]. Not surprisingly, therefore, the above tendencies stimulate the demand for both high-quality information disclosures regarding ESG risk exposures and the independent, comprehensive evaluation of companies’ performance in the area of managing those risks. Over the last few decades, many leading rating and news agencies worldwide have developed unique methodologies designed to assess the overall ESG performance of business entities, with the purpose of providing market participants with comprehensive and easily interpretable measures in the form of dedicated ratings and scores [6].
Given the multitude of potential investment opportunities and the complexity of factors driving corporate ESG risk exposures, the vast majority of investors seem unable to efficiently analyse and evaluate the sustainability performance of companies on their own, and hence, may be forced to rely on the ready products of professional rating agencies [7].
The issues of social responsibility, sustainability, and ESG performance are also becoming increasingly important for firms operating in the financial industry, especially for banks, whose very existence and core business activities are crucially dependent on reputability and public trust. Not surprisingly, therefore, a dynamically growing amount of evidence in the relevant literature documents the increasing awareness of the need to incorporate ESG dimensions into banks’ strategies, processes, and even specific products to meet stakeholders’ expectations and promote value creation [8].
In fact, a substantially higher reputational risk exposure and vulnerability of banks to criticism from key stakeholder groups [9] should naturally give them even stronger motivation to engage in socially responsible activities and mitigate ESG risks than in the case of other industries. Moreover, banks’ ESG risk is gaining additional importance from the perspective of their pivotal functions in the global financial system. The responsibility of banks as the world’s leading financial intermediaries extends far beyond the individual interests of their owners, and in fact, may be perceived even from the standpoint of society as a whole due to their participation in the processes of the accumulation and allocation of capital, as well as their crucial role in the global financial stability framework [10]. The proper identification, management, and mitigation of ESG risks is vital, not only from the standpoint of individual banks’ responsibility for the security of collected deposits, but also, given the typically large size and interconnectedness of their business activity, for the stability of the entire financial system they are part of.
Banks appear, however, to be slower in responding to ESG-related challenges than non-financial enterprises [11]. Furthermore, it seems that the principles of corporate social responsibility were not actually followed in the everyday business practices of many banks until the outbreak of the global financial crisis in 2008, and the resulting shift in their strategies and business models towards a broader and deeper incorporation of ESG concerns might be, to a large extent, an attempt to restore the sector’s damaged reputation [10]. With the passing of time, however, banks seem to increasingly appreciate the benefits of ESG frameworks as a useful tool for the mitigation of operational [12,13] and credit [14] risk, reductions in the cost of equity [15,16] and liabilities [17,18], and ultimately, an important driver of their overall financial performance [19,20,21].
On the other hand, however, as highlighted by Finger et al. [22], the implementation of socially responsible practices by banks operating in different economic settings may serve completely different purposes. They report that, in developed countries, the adoption of the Equator Principles (EPs) [23] by banks results in increased funding activity and the growing share of interest income, whereas in developing ones, the effects are exactly the opposite. Hence, it appears that, for banks operating in developing countries, the adoption of EPs leads to profound changes in their realised market strategies, while for their counterparts from developed countries, it may merely be a form of “greenwashing”.
Although ESG risk is likely determined by a wide array of economic, social, and environmental factors in the case of banks, one of them—i.e., the company size—seems particularly interesting and worth being investigated. Overall, the specificity of the banking industry creates strong incentives for increasing the size of business activity, resulting not only from substantial economies of scale and scope, but also from additional competitive advantages and economic benefits arising from the “too big to fail” (TBTF) status assigned to the largest, systemically important institutions. On the one hand, larger banks may be expected to outperform smaller ones in the area of ESG challenges, as they are usually able to engage more resources and sophisticated knowledge-based management tools to address related concerns. They are also typically under more pressure from equity investors, regulators, and other major stakeholder groups to comply with ESG principles in order to legitimize their strategies and business decisions. On the other hand, however, as banks grow larger, their overall ESG risk exposure also builds up due to more numerous and more complex interactions with their external and internal stakeholders. Moreover, they also become more exposed to various inefficiencies and diseconomies of scale that likely impede their ability to properly identify, manage, and mitigate ESG risks.
The apparent two-way impact of size on bank ESG risk makes the relationship between them ambiguous and, therefore, worthy of scientific exploration. Perhaps surprisingly, to the best of the author’s knowledge, no prior study has directly examined the above issue empirically. The related studies in the banking industry typically focus on the linkages between ESG performance and other dimensions of banking activity, including financial performance and risk or their mutual associations, and employ bank size merely as a control variable. Additionally, their findings with respect to the impact of size on bank ESG performance seem quite ambiguous. Also, the existing evidence for non-financial enterprises appears relatively modest and equally mixed. Given the above, the present study intends to fill the identified gap in the relevant literature.
The aim of the present paper is twofold. First, it attempts to systematize and enhance the theoretical underpinnings of the relationship between firm size and ESG risk in the specific context of the banking industry, highlighting the likely non-linear character of the association. Second, this study intends to empirically investigate the size–ESG risk nexus in the cross-section of the international banking industry. Using both uni- and multivariate, and linear and non-linear regression analyses applied to a sample of 668 banking companies that were assigned the Morningstar Sustainalytics ESG Risk Rating for the year 2021, this research demonstrates that, although size is, on average, associated negatively with ESG risk in the cross-section, the relationship is, in fact, non-linear, and follows a U-shaped pattern. The above findings hold after controlling for the impact of both country-specific contextual factors and outliers.
On the one hand, the findings of this paper appear to be in line with the slack resources hypothesis [24], as well as the stakeholder [25] and corporate legitimacy theories [26], and are largely consistent with the results of prior studies exploring the linkages between company size and ESG performance in both non-financial and financial sectors [7,18,24,26,27,28,29,30,31,32,33,34,35,36,37]. On the other hand, however, the convexity of the investigated relationship demonstrated in this study suggests the presence of non-negligible diseconomies of scale and efficiency challenges capable of partially offsetting the benefits of a greater availability of resources and higher-quality ESG risk reporting in larger banks [24,38]. Given the above, the present paper also contributes to the strand of literature highlighting the complexity and vagueness of the linkages between size, risk exposure, and ESG performance in the banking sector [39,40,41,42,43,44,45]. In addition, by emphasizing the importance of diseconomies of scale in ESG risk management, this manuscript offers some important lessons and recommendations for bank executives and equity investors.
The remainder of the paper is structured as follows: The next section provides a review of the relevant literature on the linkages between firm size, ESG performance, and risk in the contexts of both non-financial sectors and the banking industry. Section 3 outlines the details of the adopted research design, including hypothesis development, the methodological framework, and data collection procedures. The empirical results of this research are presented in Section 4, whereas Section 5 discusses them in the context of prior evidence in the relevant literature. The paper is closed with conclusions summarizing its main findings, key contributions, and their practical relevance.
2. Literature Review
2.1. ESG Performance, Risk, and Firm Size–Evidence from the Non-Financial Sector
Despite the initial scepticism from both practitioners and academics [3], over the last few decades, the ideas of corporate social responsibility (CSR) and socially responsible investing (SRI) have become increasingly important determinants of the capital allocation decisions of equity investors and asset managers around the world. Simultaneously, the perception of CSR has gradually evolved from its original, largely ethical, focus [46] towards a recognition of its substantial economic potential as a tool supporting the management of environmental, social, and governance (ESG) risks, long-term financial performance, and, ultimately, value creation. The assessment of listed companies’ exposures to ESG risks and their ability to manage those risks is therefore continuously attracting ever more attention from various internal and external stakeholders, including investors, managers, employees, business partners, and regulatory authorities [10]. In fact, since the beginning of the 21st century, the increased focus on the issues of corporate governance and sustainability has led to a gradual reorientation of the entire SRI concept towards ESG investing [47].
The evaluation of corporate ESG risk is crucially dependent on the availability and quality of relevant information. According to the organisational legitimacy theory, companies may be motivated to voluntarily disclose ESG-related information to comply with the expectations of their major stakeholders, and thus obtain a sort of “licence to operate” [26]. Many studies in the relevant literature demonstrate that the disclosure of ESG-related information may also be driven by expectations of economic benefits. Under this view, the provision of such information becomes a strategic investment aimed at the improvement of a company’s reputation, perceived as a specific intangible asset [48,49,50,51,52]. In fact, as demonstrated by Pérez [53], the rapidly growing popularity of sustainability reports may directly reflect their application as tools for improving corporate reputation. The ultimate effects of such reporting activities are, however, conditional on the quantity and quality of obtainable data and the overall management of corporate transparency.
Good reputation creates a “cushion” against unfavourable market developments and allows firms to gain a sustained competitive advantage over less-reputable competitors [51]. Additionally, it may allow firms to improve their financial performance [51,54], reduce cost of debt [55], mitigate risk [15,16,56], and ultimately, increase their market value [50,57,58]. Not surprisingly, therefore, over the last few decades, the vast majority of empirical evidence documents a positive relationship between corporate ESG and financial performance [59]. Interestingly, recent evidence from the Chinese market provided by Pu [60] reveals a positive, yet curvilinear association between firm financial performance and ESG activities. The findings indicate that the relationship takes a form of an inverted U-shaped curve, suggesting that an excessive allocation of companies’ resources and organizational efforts to ESG activities might be detrimental to their financial performance.
Apart from voluntary disclosures, the rapid expansion of ESG reporting is also stimulated by the requirements imposed by regulators worldwide [61,62,63]. Hence, contemporary corporate communication of ESG information often takes the form of comprehensive sustainability reports containing both voluntary and mandatory disclosures [64].
Given the countless different investment opportunities, as well as the time-consuming and operationally demanding nature of ESG risk evaluation processes, the above tendencies have also stimulated the demand for comprehensive, standardised methodologies for the assessment of companies’ ESG performance. Consequently, numerous rating and news agencies around the world have developed dedicated scoring procedures to provide equity investors and other corporate stakeholders with comprehensive and easily interpretable measures of ESG performance and risk exposure [6]. Moreover, as the growing awareness of the climate change risk has increased the demand for ESG data and research even further, the world-leading providers of decision support tools for equity investors, including Dow Jones, Goldman Sachs, or MSCI, also began offering their own solutions, aiming to satisfy the growing demand from their largest clients [47].
Although there appears to be some progress in the standardisation of ESG performance and risk assessment in recent years, especially when compared with early approaches to CSP evaluation [65], the overall correlation between corporate ESG scores issued by different providers remains relatively low [66,67]. On the other hand, however, as pointed out by Cohen [68], firms are becoming increasingly aware of sustainability issues and continuously allocate their resources to mitigate the related risks, which leads to an overall improvement in their ESG scores.
Among many factors that shape a company’s exposure to ESG-related risks, as well as its ability to mitigate them, a key role is undoubtedly played by its size. On the one hand, the scale of a company’s operations drives the extent and complexity of its direct and indirect interactions with stakeholders and the environment. On the other hand, size largely determines the availability of the human, capital, and organizational resources needed to manage and report ESG risks. Larger firms are also more visible and scrutinised by various stakeholders, which encourages them to improve their sustainability performance, ESG risk management, and the quality of the related information disclosures.
The linkages between a company’s size and ESG risk can be explored from the perspective of the slack resources hypothesis [24]. Under it, investments in initiatives with potentially delayed pay-offs [69] or of a lower priority [70], such as CSR, are strongly conditional on the availability of financial and human capital and the overall financial position of a company. From this point of view, larger and financially sounder firms are typically more capable of employing additional resources and formal instruments to analyse and disclose information on the ESG-related aspects of their activities. Given the substantial costs involved in ESG reporting [71], it comes as no surprise that the proneness to disclose voluntary ESG information usually increases with size [33]. Accordingly, ESG-related expenditure also tends to be positively related to both the size and profitability of companies [30]. As demonstrated by Orlitzky [72], however, firm size does not confound a usually positive relationship between social and financial performance reported in many studies.
Other studies explore the impact of firms’ size on the associations between their ESG performance and risk. For instance, He et al. [73] report that better ESG performance enables firms to reduce risk by alleviating their financial constraints. The relative magnitude of the inhibitory impact of sustainability performance on firm risk may, however, vary with size. In turn, Cohen [68] examines the data for S&P 500 companies over the period of 2019–2021 to find that corporate financial stability, as proxied by the Altman Z-score, is likely weakened by high environmental and social risks. Additionally, he reports a particularly high sensitivity of the score to social risks in the subsample of smaller companies.
Although larger firms seem naturally more capable and prone to engage in ESG-related initiatives, empirical evidence provided by Baumann-Pauly et al. [29] demonstrates that they actually tend to focus primarily on communication and reporting socially responsible activities without implementing them substantially in their business practices.
Large firms are also more likely to take advantage of economies of scale with respect to the ESG challenges they face [74]. They often possess superior knowledge about sustainability management tools and more formalised ESR reporting structures compared to smaller firms [31]. In turn, smaller entities, usually being subject to greater competitive pressures, are less inclined to follow similar patterns [75].
Given the above, the ability to designate more resources to ESG activities and the disclosure of related information, combined with knowledge-based competitive advantages, render larger firms more legitimate to obtain higher marks from ESG rating agencies [7].
Furthermore, from the standpoint of the stakeholder theory [25], larger firms usually function under higher public pressure, given the more numerous and diversified stakeholder groups involved in their operations. Since they interact with a greater number and variety of stakeholders, their sustainability policies and related instruments are often more complex and multidimensional than in the case of smaller businesses [76]. Larger companies may therefore be motivated to disclose more relevant, comprehensive, and transparent ESG information in order to justify the legitimacy of their actions and business decisions [24,26,27]. Some studies, however, do not find any clear link between company size and their quality of sustainability reporting [77]. Empirical evidence supporting the stakeholder theory can be found in the recent research by Bissoondoyal-Bheenick et al. [78]. Using a sample of all companies with ESG scores from G20 countries over the period of 2007–2020, they investigate the impact of size on the relationship between three ESG pillars and firms’ stock market performance to conclude that larger firms engage in ESG activities to benefit from the economies of scale and meet the demands and expectations of their major stakeholder groups.
In turn, under the overinvestment hypothesis, engagement in ESG activities diverts scarce resources from the maximisation of shareholders’ wealth which, over time, may harm a firm’s market value. In fact, the ESG-related expenditures may directly become an agency cost if managers use them to achieve their own benefits at the expense of shareholders [79]. Moreover, if some ESG activities serve merely for the purposes of “greenwashing”, they may not only directly damage firms’ market values, but more importantly have a prolonged negative impact on their reputation and financial performance, thus paradoxically leading to an increase in their ESG risk exposures.
The fact that large organizations are more exposed to various diseconomies of scale and efficiency challenges than smaller entities is well documented on both theoretical and empirical grounds [38]. Therefore, as the firm size increases, the identification, management, and mitigation of relevant ESG risks may become more challenging. In particular, large firms are typically more prone to employ bureaucratic control mechanisms involving written regulations, codes of conduct, or cultural norms in their efforts to control ESG risks [24]. While bureaucratisation may offer effective solutions to standard and recurring problems, when combined with the typical inertia that is inherent to large organizations, it can considerably impede their ability to cope with complex and often dynamically changing challenges of sustainability.
The direct empirical evidence on the impact of size on ESG performance in non-financial enterprises is relatively modest and mixed. According to Udayasankar [80], the relationship between firm size and CSR participation is likely to be U-shaped due to diverse motivational bases reflecting the disparities in visibility, access to resources, and the scale of operations among firms of different sizes. Under this view, both small and large enterprises tend to be the most motivated to engage in CSR-related activities, whereas medium-sized ones may face fewer incentives and be less pressured to follow a similar pattern.
The results of a study by Aouadi and Marsat [81], examining a sample of 4000 companies from 58 countries over the period of 2002–2011, indicate that firms’ size is positively correlated with both their CSP scores and number of reported ESG controversies. These findings seem to corroborate the view that even if larger firms may often perform better in terms of CSR, the scale of their operations also renders them more exposed to various ESG risks. Moreover, Aouadi and Marsat [81] demonstrate that a positive impact of corporate social performance on market values appears to be limited to larger and high-attention firms.
The results of a study by Drempetic et al. [7], using the cross-sectional data from the Thomson Reuters ASSET4 ESG database for more than 3800 companies over the period of 2004–2015, suggest that, since ESG ratings are essentially dependent on both the availability of relevant data and the resources needed to process and provide them, ESG scores are driven by organisational legitimacy and tend to be biased in favour of larger companies. According to Drempetic et al. [7], however, better ratings need not imply a more efficient management of ESG risks, as larger firms may simply devote more resources to acquire, process, and report ESG-related information, regardless of their actual performance in that area. Such an effect would in turn mean that, instead of actual sustainability performance, ESG ratings are more likely capturing related data processing and reporting capabilities [74].
The findings of Drempetic et al. [7] are corroborated in a recent study by Dobrick et al. [37], who examine a sample covering more than 12,000 companies with LSE Refinitiv ESG scores over the period of 2003–2021, and report the presence of a strong size-bias, not only on the aggregate level, but also in terms of each of the three investigated sustainability pillars.
Akgun et al. [47] examine the sample of all companies included in the Russel 3000 Index over the period from 31 January 2015 to 30 October 2020, finding a positive, yet practically negligible correlation between firm size (as measured based on market capitalisation) and ESG scores based on MSCI data. They report a cross-sectional pairwise correlation between the examined variables of only 0.15 for large-capitalisation companies (included in the Russel 1000 Index), and almost zero (0.08) for the remainder of the examined firms (members of the Russel 2000 Index). These results suggest that the “large cap bias” in corporate social performance reported in earlier studies might be fading in recent years.
A study by Gregory [74] demonstrates that, even though, in the cross-section of industries, ESG ratings seem to be generally positively related to firm size (as measured based on market capitalisation), after controlling for the sector, rating agency, and the presence of outliers, the effect disappears or even becomes negative. As regards the financial industry, the reported results are also mixed: for four out of five examined datasets on ESG ratings from different agencies, the results of OLS indicate a positive relationship with market capitalisation; however, for two of them, the associations become insignificant when quantile regression is applied, thus suggesting an evident sensitivity of outcomes to outliers in the sample. Finally, in the case of one rating agency, the relationship between ESG performance and firm size remains insignificant regardless of the estimation method.
2.2. The Impact of Size on Financial Performance, Risk, and ESG Performance in the Banking Industry
The empirical findings on the role of size in the banking industry seem equally diversified as in the case of non-financial sectors. In turn, direct evidence on its relationship with ESG performance and risk is even more scarce.
Similarly to other industries, banking also offers potential benefits related to economies of scale and scope. Larger banks usually profit from more diversified business models [82] and easier access to human and capital resources. In particular, they may offer artificially higher wages to attract highly skilled specialists [83] and take advantage of a wider range of sources of funds, often available at lower costs than in the case of smaller banks [84]. Additionally, the more diversified sources of revenue in larger banks usually result in a markedly higher share of noninterest income than in smaller counterparts. In turn, the differences in the perception of the persistence of individual noninterest income components may affect bank valuation and risk assessment by equity investors [85].
The existing evidence suggests the presence of increasing returns to scale in banking activity [86,87], which partially justifies the growth in the average size of banks and in the concentration of the industry. Some studies, however, argue that such benefits may be attributable primarily to the reduced funding costs resulting from investor expectations of government support in the case of financial distress under the “too big to fail” (TBTF) framework [88].
According to Minton et al. [42], the TBTF status grants the largest banks a unique “asset” in the form of a claim on public resources, which, in turn, may become an important source of their competitive advantage over smaller counterparts [89]. In fact, the benefits associated with the TBTF status may sometimes motivate banks to increase the size and riskiness of their operations beyond the levels justified by economies of scale and scope [84]. On the other hand, however, larger banks are also often exposed to higher costs resulting from greater regulatory requirements and scrutiny or political risk. A larger scale of operations may also impede the ability of shareholders to efficiently monitor bank management actions, which in turn increases the overall agency costs [42].
Although the positive impact of size on profitability in the banking industry seems to be relatively well documented in the relevant literature (see, e.g., [90,91,92,93]), some studies report an insignificant relationship [94] or suggest that the positive effect fades if banks become too large [95].
The findings of studies exploring the relationship between bank size and market value are also ambiguous. While some authors report a positive association [96,97], others argue that increases in size may be detrimental to bank stock prices [42,43,98,99] or that the investigated relationship is statistically insignificant [100]. Furthermore, Avramidis et al. [101] argue that the relationship between the market-to-book values of assets and the size of banks is inversely U-shaped due to the fact that, beyond a certain level, the benefits achieved from economies of scale start to be offset by increases in costs related to monitoring borrowers and transactions, as well as the costs of the supervision of bank management by shareholders.
As banks become larger, managing them naturally becomes more challenging due to problems with efficient supervision and coordination of actions, internal communication, or ensuring the proper employee motivation. Not surprisingly, therefore, larger banks are often more exposed to diseconomies of scale [97] than their smaller peers. Additionally, with an increase in the size of their operations, larger banks are more exposed to various risks, in particular those of a systemic and non-diversifiable nature [102]. Greater size also tends to coincide with higher levels of tail risk, including its non-systematic component [103]. Lastly, larger banks are typically more exposed to sovereign risk, as they tend to keep relatively bigger holdings of government bonds than smaller institutions [104,105].
Even though it would seem that larger banks should benefit from more diversified capital allocation opportunities, empirical evidence suggests that an increase in size may lead to growth in both the leverage ratios and the share of risky assets in banks’ portfolios [39], as well as their overall appetite for risk (as measured based on the risk ratings of originated loans) [41]. Other studies, however, do not find statistically significant differences in risk taking between larger and smaller banks [40]. Additionally, Minton et al. [42] demonstrate that the relationship between the scale of bank activities and risk may be non-linear, since the probability of distress increases with size for smaller banks, but tends to decrease again for larger ones. When leverage is used as a proxy of risk, though, it tends to increase with size for larger banks, but for smaller ones, the relationship turns out to be insignificant. In turn, Di Tomasso and Thornton [43] report that, on the one hand, size is negatively related to bank z-scores (suggesting that bigger banks are more risky), but on the other, it also exhibits a significant negative relationship with CDS spreads and ratios of non-performing loans (which would imply that larger size contributes to a reduction in bank risk). The above findings suggest a largely complex and multifaceted nature of the relationship between size and risk in the banking sector. It seems that size affects various areas of bank risk in different ways, and that the direction of the relationship may be conditional on the relevant contextual and bank-specific factors.
Given the ambiguous results of studies exploring the impact of size on various dimensions of banking activity, it comes as no surprise that an analogous vagueness is present in the evidence exploring its interaction with ESG performance and risk. In general, the very existence and viability of banks are almost entirely dependent on reputation and public trust. Banks are therefore both highly exposed and sensitive to ESG-related concerns, which directly affects the riskiness [12] and profitability [11] of their activities. Given the above, banks, even more than other industries, should be motivated to follow the principles of CSR and efficiently manage ESG risk [10]. Also, the empirical evidence on the impact of banks’ engagement in ESG activities on their financial performance is generally mixed. While some studies suggest that an incorporation of ESG-related criteria in decision-making processes has a negligible impact [28,32,78] or even impedes banks’ financial performance [106,107], others argue exactly the opposite [108,109].
As regards the relationship between ESG performance and risk, a study by Di Tomasso and Thornton [43] demonstrates that high ESG scores tend to be associated with a modest reduction in bank risk taking, which seems to be consistent with the “stakeholder” view of ESG activities. On the other hand, however, better ESG performance appears to coincide with relatively lower market values, thus supporting the “overinvestment” hypothesis, under which ESG-related activities divert scare resources from more value-enhancing uses. Moreover, several investigations report that individual dimensions of ESG frameworks may exert different impact on banks’ performance [36,110].
As regards the evidence investigating the impact of banks’ size, prior studies usually employ it merely as a control variable in analyses of the mutual interactions between ESG orientation, financial performance, and risk in the financial sector. Somewhat surprisingly, therefore, the direct empirical evidence on the impact of size on banks’ ESG performance and risk is nearly absent. For instance, Chih et al. [28] investigate over 500 financial entities from 34 countries over the period of 2003–2005 in search of the linkages between CSR and financial performance, and report a positive link between firm size and CSR orientation. Shen et al. [32] use a sample covering the data for 18 countries over the period of 2000–2009, and find that more socially responsible banks usually have a larger size, as measured based on their total assets, loans, and deposits. According to Shen et al. [32], engagement in socially responsible activities not only increases the realised ROA, ROE, and net interest income ratios, but also contributes to an improvement in credit risk management, as indicated by lower ratios of non-performing loans. Interestingly, however, the positive effect of CSR on financial performance appears to fade as bank size increases. In turn, Neitzert and Petras [111] provide evidence on the capability of ESG orientation to reduce bank risk. Having examined a sample of 582 banks worldwide over the period of 2002–2008, they conclude that the above effect is attributable primarily to environmental activities. In contrast to Shen et al. [32], however, they report that bank size does not significantly affect the examined relationship.
The results of a research study by Chiaramonte et al. [34], investigating a sample of European banks from 21 countries over the period of 2005–2017, suggest that banks with higher ESG scores tend to be less prone to insolvency in times of financial distress, which implies that following ESG principles may reduce bank fragility. A more detailed investigation, however, leads them to the conclusion that the above effect is statistically significant only in the subsample of the largest banks (being subject to EBA stress testing) and in countries with bank-oriented financial systems. Additionally, the effect appears to be stronger in richer countries (with a per capita GDP above the mean).
Menicucci and Paolucci [110] investigate the relationship between ESG and financial performance using a sample of 105 Italian banks in 2016–2020 and report different results for individual sustainability dimensions. As regards the impact of bank size, they find that it also tends to vary in terms of both direction and statistical significance depending on the choice of performance measure.
According to the Roland Berger GmbH report authored by Van Gysegem and Blaser [35], investigating a sample of more than a hundred European banks over the period of 2002–2020, banks’ size reveals a strong positive correlation with their ESG scores. Unfortunately, besides that claim, the report does not disclose any quantitative details supporting that conclusion. The authors of the report argue that the above result can be justified not only on the grounds of the slack resources hypothesis (as larger banks are able to allocate more funds to internal social initiatives and improved governance structures or dedicated sustainability teams), but it also may reflect the fact that larger banking groups are likely more aware of their structural societal impact.
Having examined the data for 473 banks from 75 countries over the period of 2007–2016, Albdiwy et al. [44] report that bank size moderates the impact of ESG engagement on bank financial stability. Their findings indicate that ESG positively affects financial stability in larger banks, whereas in the case of smaller entities, the impact appears to be negative. In turn, a study by Quang Trinh et al. [45] demonstrates that even though larger banks generally tend to have a higher tail risk than their smaller counterparts, they also exhibit a significantly stronger mitigating impact of environmental and social performance on that risk.
Evidence by Andries and Sprincean [18] based on an investigation of 493 banks from 39 advanced and emerging economies over the period of 2003–2020 suggests that, although the incorporation of ESG practices into banks’ business decisions enables them, on average, to reduce their funding costs, the effect is more pronounced for larger banks.
Finally, in a recent study on the relationship between ESG-related activities and financial performance, Gutiérrez-Ponce and Wibowo [36] examine a sample of five Indonesian banks over the period of 2010–2020 and report a relatively strong and statistically significant positive correlation between their Thomson Reuters Refinitiv ESG scores and bank size, as proxied by the logarithm of total assets. However, when the individual sustainability pillars are concerned, the relationship with size seems to hold only for environmental and social components, whereas for the governance dimension, it turns out to be insignificant.
This review of the relevant literature suggests that the direct empirical evidence on the relationship between size and ESG performance in the banking sector is very scarce and largely mixed. Most of the relevant studies employ size merely as a control variable when examining the impact of ESG performance on bank financial performance or risk. In addition, it seems that, to date, no study has attempted to thoroughly explore the relationship between bank size and ESG risk from both theoretical and empirical perspectives. Given the above, the present study aims at filling this gap in the relevant literature.
3. Research Design
3.1. Hypothesis Development
The review of the relevant literature presented in the previous section suggests that banks’ size exerts a two-way impact on their ESG risk (Figure 1).
On the one hand, as the size of a company grows, more human, capital, and knowledge-based resources may be allocated to the identification and mitigation of ESG risk [24,30,31,34], allowing firms to benefit from economies of scale [74]. Additionally, the higher availability and often quality of the allocated resources, combined with greater stakeholder pressure in larger firms [25,78], contribute to the larger supply and informativeness of their ESG-related disclosures [24,26,27,29,33] that lead to a positive association between company size and ESG performance scores [7,37]. Substantial economies of scale and scope in the banking industry [86,87] and a positive association between size and ESG performance scores reported in prior studies [28,32,35,36] allow us to expect similar effects to the ones reported for non-financial enterprises. The above considerations lead to the formulation of the baseline hypothesis of the present study:
H1.
Firm size is negatively associated with ESG risk in the cross-section of the international banking industry.
On the other hand, however, following the evidence provided in the relevant literature [24,38,42,81,97], larger size causes, ceteris paribus, a build-up of various “diseconomies of scale”, resulting from inefficiencies caused by bureaucratic inertia, more numerous and complex business interactions, a larger overall environmental and social impact, agency problems, and other corporate governance-related issues. Following the overinvestment hypothesis, an excessive and unfounded allocation of resources to ESG risk management [79] may, paradoxically, lead to an additional build-up of the diseconomies of scale and the amplification of their adverse impact. In particular, as demonstrated by Aouadi and Marsat [81], even though larger size generally involves better ESG performance, at the same time, it also leads to a greater number of related controversies. Furthermore, in the specific context of the banking industry, the benefits expected from obtaining TBTF status may incline banks to increase their sizes beyond the levels justified by economies of scale and scope [84]. This notion is further corroborated by the empirical evidence in other studies reporting a positive association between size and various dimensions of bank risk [38,41,45,102,103,104,105].In fact, the trade-off between available resources and diseconomies of scale may also be partially responsible for the low statistical significance of the impact of company size on both ESG performance [47,74] and its relationship with financial performance [95] or bank risk [111] reported in prior studies.
The diseconomies of scale and various risks building up as a consequence of increases in size partially offset the mitigating impact of resource allocation capability, which renders the ultimate impact of size on banks’ ESG risk ambiguous and likely varying with the size itself. The non-linearities reported in the prior studies investigating the relationships between company size and ESG performance [80,95,101], risk [42], or their mutual linkages [32,44] allow us to expect that the relationship between bank size and ESG risk may also be non-linear. Under the assumptions that (1) both resources allocated to the mitigation of ESG risk and diseconomies of scale (DoS) increase with size, (2) ESG risk is inversely related to the amount of resources allocated to its mitigation, and (3) rising diseconomies of scale cause a more than proportionate increase in ESG risk, the relationship between bank size and ESG risk becomes U-shaped (Figure 2).
Initially, as the size of banking activity increases, the benefits arising from the allocation of additional human, capital, and knowledge-based resources to the mitigation and reporting of ESG risk prevail over the offsetting impact of diseconomies of scale, thus leading to a decrease in the overall level of ESG risk. Beyond a certain threshold, however, the relationship reverses, as the mounting diseconomies of scale start to outweigh the beneficial effects of resource allocation and drive the ESG risk up again. Hence, the above deliberations allow us to formulate the second hypothesis of the present study:
H2.
The relationship between firm size and ESG risk in the cross-section of the international banking industry is U-shaped.
Therefore, in the light of both formulated hypotheses, although ESG risk is expected to generally decrease with size in the cross-section of banks, as suggested by the majority of prior studies, the relationship is likely non-linear and characterised by convexity due to the adverse impact of various inefficiencies and diseconomies of scale. In fact, it is also plausible that, when a bank exceeds a certain size, the above impact may cause their ESG risk to increase, thus forming a U-shaped relationship between the examined variables.
3.2. Data and Methods
The assessment of banks’ ESG risk exposures is based on the ESG Risk Ratings by Morningstar Sustainalytics [112]. The ratings are designed to measure the magnitude of companies’ unmanaged ESG risks, which represents the degree to which their economic value is at risk, driven by ESG factors. The ratings are measured on an open-ended scale starting at 0 (i.e., no unmanaged risk) and, for 95% of cases, a maximum score below 50 [113]. Depending on their individual quantitative score, companies are assigned to one of five risk categories: negligible [0–10), low [10–20), medium [20–30), high [30–40), and severe (equal to or above 40).
Following the theoretical considerations presented in the literature review (Section 2) and in the development of the hypotheses (Section 3.1), as well as taking into account the fact that the focus of the present study is set on investigating the relationship between size and ESG risk in the banking industry, the measures used to proxy for company size should reflect both the availability of resources required to manage ESG risk and the specificity of banking activities. Therefore, the assessment of bank size for the purposes of the present study is based on the two most fundamental resource-related dimensions of bank size, i.e., the book value of their total assets (TA), which is by far the most frequently employed measure of firm size with respect to capital resources in empirical corporate finance [114], and the total number of employees (E) which proxies for human resources (other measures of company size often used in the relevant literature include market capitalisation and total revenue; however, as highlighted by Dang et al. [114], the former is focused primarily on firm growth opportunities and equity market conditions, whereas the latter largely reflects product market competition. Moreover, in the case of the banking industry, the incremental informativeness of total revenue seems limited, as the vast majority of revenue comes from interest and fee incomes, and thus, it is strongly dependent on the volumes of total assets).
Moreover, as pointed out by Dang et al. [114], different measures of firm size exhibit their own advantages and disadvantages, and no single measure can capture all characteristics of “firm size”; therefore, given the above deliberations, the present study attempts to gauge the size of the investigated banking companies using a composite indicator encompassing two aforementioned dimensions within a single measure.
First, the data for each dimension are normalised using the min–max procedure:
Next, the composite size index (CSI) is calculated as the arithmetic mean of the normalised scores:
In order to investigate the general relationship between size and ESG risk in the examined sample, and to test the first hypothesis of the present study (H1), the following baseline linear regression model is employed (Model 1):
where
- —the value of ESG risk rating for a company (i) in year t;
- —the value of the composite size index for a company (i) in year t;
- —structural parameters;
- —error term.
As ESG risk is hypothesized to decrease with size in the cross-section of banks, the estimated value of the coefficient is expected to be negative.
In the next step, to test the second hypothesis of this study (H2) regarding the presence of non-linearities in the form of a U-shaped relationship between the investigated variables, the model is extended by introducing the squared value of the CSI (Model 2):
where
- —structural parameters;
- —error term.
Following the second hypothesis of the present study (H2), the coefficient is expected to be positive, while the first one (H1) allows us to anticipate a negative estimate of the coefficient . As pointed out by Lind and Mehlum [115], however, in some circumstances, the statistical significance of the estimated regression parameters alone may not be enough to demonstrate the existence of a U-shaped relationship. Given the above, they recommend using an additional testing procedure designed specifically to verify whether the investigated relationship decreases at low values and increases at high values within a given data interval. Therefore, to improve the overall strength of the formulated statistical inferences on the shape of the relationship between size and ESG risk in the cross-section of the international banking industry, the present study also employs the Lind–Mehlum appropriate test for U-shaped relationships [115].
The final stage of this research involves testing the robustness of the results. First, to check whether the findings also hold for individual size dimensions, the variable CSI in Models 1 and 2 is substituted with TA and TE, yielding the following regressions:
- Model 1A:
- Model 1E:
- Model 2A:
- Model 2E:
Next, the regression models are extended to control for the presence of country-specific contextual factors that may affect bank ESG risk [116]. For simplicity, it is assumed that, for each company in the examined sample, the above effect is limited only to its headquarter country. The impact of contextual factors is proxied by means of a composite index constructed on the basis of the following country-level measures related to ESG risk:
The fact that, for each of the above indices, higher values reflect more favourable conditions for ESG risk management has enabled us to merge them into a single measure, capturing the contextual risk factors at the country level. Therefore, after normalising the data using the min–max procedure, the composite contextual factors index (CCFI) is calculated for each bank’s headquarter country as the unweighted average of the normalised scores. Next, the index is introduced in the models given in Equations (4) and (5), yielding their following extended versions (Model 3 and Model 4, respectively):
where
- —the value of the composite contextual factors index for a bank’s (i) headquarter country in year t;
- and —structural parameters;
- and —error terms.
Analogously, as in the preceding specifications of the models, under H1, the estimated values of the parameters and are expected to be negative, while H2 allows us to anticipate a positive estimate of the parameter . Finally, since higher values of CCFIit should generally indicate more favourable conditions for ESG risk management, the estimated value of the parameter is expected to be negative.
Initially, each of the constructed linear and non-linear models is estimated using ordinary least squares (OLS) with robust standard errors to control for the heteroskedasticity of error terms. Following the evidence provided by R. P. Gregory [74], however, the robustness of the results is further tested by re-estimating the models using quantile regression to investigate the impact of outliers on the obtained outcomes. All the estimations in this study was obtained using the Stata/SE 14.0 software.
The initial sample of firms for the purposes of the present study was extracted from the Morningstar Sustainalytics database and covered all (696) publicly traded companies classified as “banks” which were assigned an ESG Risk Rating for the year 2021. The choice of this time frame was a compromise between the aspiration to use the most recent data available on the one hand, and the need to avoid potential distortions resultant from the recent global adverse shocks caused by the COVID-19 pandemic or the full-scale war in Ukraine on the other.
In the next step, the sample was revised in order to identify firms that prepare their financial statements in the form typical for non-financial enterprises, and in which the actual extent of their banking activities is negligible. In effect, 28 companies were dropped, yielding a final sample of 668 banking companies. The composition of the sample based on headquarter countries is given in Table 1.
Data on the value of total assets and the total number of employees for the end of the fourth quarter of 2021 were extracted from the online databases of the “Financial Times” [120], “The Wall Street Journal” [121], and MarketWatch [122]. The remaining data gaps were filled on the basis of the respective companies’ annual and sustainability reports.
Table 2 presents the key descriptive statistics of the investigated variables.
The data in Table 2 show that the distribution of the CSI is strongly leptokurtic and right-skewed, which indicates that the examined sample is characterised by both a significant predominance of relatively smaller-sized banking institutions and the presence of extremely large outliers. In the case of the remaining variables, the departures from normal distribution seem much less pronounced; however, both are slightly leptokurtic and left-skewed.
4. Results
4.1. Regression Analysis
The results of the estimation of Model 1 are reported in Table 3.
In line with expectations, the estimate of the coefficient is negative, suggesting that a larger size is generally associated with lower ESG risk in the cross-section of the examined banking companies. The above finding therefore provides some initial support for the first hypothesis of the present study (H1). Although the regression is significant at the 0.05 level, the near-zero value of the coefficient of determination and significantly positive intercept clearly indicate that the variation in size alone is not able to explain the cross-sectional variability of banks’ ESG risk.
The next step of this research involved the estimation of Model 2 to test the hypothesised U-shaped relationship between size and ESG risk in the banking industry (Table 4).
The entire model and each of the regression coefficients are statistically significant at all conventional levels. A negative value of the estimate of the coefficient along with a positive one for , suggest a U-shaped relationship between size and ESG risk in the cross-section of the examined banks, thus supporting the second hypothesis of this study (H2). In addition, the results of the estimation allow us to determine the CSI threshold beyond which the relationship between bank size and ESG risk starts to reverse; using the formula for the abscissa of the vertex of a parabola, the value of this threshold is 0.381.
The above findings are further corroborated by the results of the Lind–Mehlum test for a U-shaped relationship (Table 5).
As indicated by the data in Table 5, the results of the Lind–Mehlum test confirm the presence of a U-shaped relationship between size and ESG risk in the cross-section of the international banking industry at all conventional levels of significance, thus providing additional support for the second hypothesis of the present study.
Despite some improvement in the explanatory power of Model 2 in comparison to Model 1, the results of the estimation still suggest that the variation in bank size is able to explain only a very small fraction of the general variability of ESG risk in the banking industry, even if the non-linear nature of the relationship is taken into account.
4.2. Robustness Tests
The second stage of this research involved testing the robustness of the obtained results. First, Models 1A, 1E, 2A, and 2E were estimated to check whether the results of the baseline estimations hold when the individual size dimensions, i.e., the book value of total assets and the total number of employees, are used as regressors instead of the constructed composite size index (Table 6).
As demonstrated by the data in Table 6, the general properties of Models 1 and 2 seem to hold when individual size dimensions (i.e., TA or E) are also employed in estimations instead of the composite index (CSI). All estimated regression coefficients, except for in Model 1E, have turned out to be statistically significant at all conventional levels. The negative estimates of the coefficients and suggest that size remains negatively related to ESG risk in the cross-section of the examined banks when the book value of total assets or the total number of employees are also used as single explanatory variables, although in the latter case, the association appears to be insignificant. In turn, the estimations of Models 2A and 2E (i.e., the negative estimates of parameters and along with the positive ones for and , respectively) demonstrate clearly that the U-shaped pattern in the investigated relationship holds and is statistically significant for each of the individual variables proxying for bank size.
Similarly, as in the case of the original Model 2, the Lind–Mehlum test for a U-shaped relationship was applied to Models 2A and 2E (Table 7).
As indicated by the data in Table 7, the results of the Lind–Mehlum test confirm the presence of a U-shaped relationship with bank ESG risk for each of the examined single explanatory variables (i.e., the book value of total assets and the total number of employees) at all conventional levels of significance.
In the second stage of the robustness tests, each of the baseline models were enhanced by the introduction of additional explanatory variables designed to capture the impact of country-specific contextual factors (CCFI) that may likely affect both banks’ overall exposure to ESG risk and their ability to manage it.
The results of the estimation of Model 3, being an enhanced version of Model 1, are given in Table 8.
The data in Table 8 indicate that the estimated regression is significant at all conventional levels. After introducing an additional explanatory variable (CCFIit), the negative relationship between size and ESG risk still holds; however, the significance of the corresponding regression coefficient () decreases. In line with expectations, the estimate of the coefficient , reflecting the impact of country-specific contextual factors, has turned out to be negative and statistically significant, implying that better overall sustainability performance, higher-quality human capital, and a lower risk of corruption in a given bank’s headquarter country contribute to a reduction in the company’s ESG risk. Despite some marginal improvement, the explanatory power of the model remains very low, suggesting that a bank’s overall ESG risk is driven primarily by factors other than size and broad contextual variables.
The results of the estimation of Model 4 (an enhanced version of Model 2) are presented in Table 9.
The regression and each of the coefficient estimates have turned out to be significant at all conventional levels. The signs of the individual coefficient estimates are consistent with expectations, implying that the U-shaped relationship between size and ESG risk still holds in the cross-section of the examined banking companies after controlling for the impact of country-specific contextual factors. Once again, despite the fact that the inclusion of the variable CCFIit slightly improves the overall explanatory power of the model, the variability of the regressors is able to explain only less than 10% of the total variability in banks’ ESG risk.
The third stage of the robustness analysis involved an investigation of the impact of outliers on the estimation results, following the evidence provided by R. P. Gregory [74]. To address this issue, Models 1–4 were re-estimated using quantile regression at the median values (Table 10).
The results of the estimations given in Table 10 indicate that the general properties of each model also hold under the quantile (median) regression. Compared to the OLS estimations, the signs of all regression coefficients remain unchanged, and their estimates are statistically significant at all conventional levels. In particular, the significantly negative coefficients (Model 1) and (Model 3) demonstrate that, in the case of the banking industry, the overall negative association between company size and ESG risk is not caused merely by the presence of outliers, but may instead reflect a broader cross-sectional regularity, which also remains valid after controlling for the impact of country-specific contextual factors. The above findings therefore provide additional support for the first hypothesis of the present study. In turn, the results for Models 2 and 4, namely the significantly negative estimates for and together with significantly positive ones for and , corroborate the second hypothesis, which assumes that the relationship between size and ESG risk is non-linear and follows a U-shaped pattern.
5. Discussion
The results of the conducted analyses seem to support both research hypotheses formulated in the present study. First, the empirical evidence suggests that, on average, ESG risk tends to decrease with firm size in the cross-section of the international banking industry. On the one hand, this finding seems to corroborate the slack resources hypothesis [24], under which a larger size enables firms to assign more human, capital, and knowledge-based resources to ESG risk management, and suggests the presence of non-negligible economies of scale in that field [74,78]. The above conclusion is therefore largely consistent with the results of prior studies exploring the relationship between company size and ESG performance in both non-financial and financial sectors [18,28,30,31,32,34,35,36]. On the other hand, the negative association between bank size and ESG risk may also be explained on the grounds of the stakeholder [25] and organisational legitimacy [26] theories. Being more visible and scrutinized by their stakeholders, larger companies are likely both more externally pressured and internally motivated to provide the public with more informative and higher-quality ESG-related disclosures [24,26,27,29,33]. This, in turn, improves their transparency for the purposes of ESG risk assessment by external rating agencies, which may ultimately lead to better scores, as demonstrated by Drempetic et al. [7] or Dobrick et al. [37].
The results of the conducted robustness tests indicate that the key findings of the present study generally also hold when individual size dimensions, i.e., the book value of total assets or the total number of employees, are used as regressors instead of the constructed composite size index (CSI). First, each individual variable proxying for size exhibits an overall negative relationship with ESG risk in the cross-section of the examined banking companies; however, only in the case of the former one it is statistically significant. And second, analogously to the CSI, both variables reveal a statistically significant U-shaped relationship with ESG risk.
A further robustness analysis has demonstrated that, contrary to the findings of R. P. Gregory [74], the negative association between size and ESG risk in the cross-section of the international banking industry cannot be attributed merely to the presence of outliers in the examined sample, as the relationship also remains statistically significant under quantile (median) regression. Moreover, the empirical evidence indicates that the relationship also holds after controlling for the impact of country-specific contextual factors that likely affect firms’ ESG risk at the aggregate level.
The obtained results indicate, however, that the variation in firm size alone is not sufficient to explain a meaningful fraction of the cross-sectional variability in bank ESG risk. Moreover, the descriptive power of the related regression models does not improve considerably after including the index of country-specific contextual factors as an additional explanatory variable. The above evidence suggests that the level of ESG risk in banks is driven primarily by their idiosyncratic features other than the size itself.
The findings of this study also suggest that, in the case of the banking industry, the relationship between size and ESG risk is non-linear and follows a U-shaped pattern, as indicated by the signs and statistical significance of the respective parameters of the constructed non-linear regression models, as well as the results of the Lind–Mehlum [115] test. Therefore, even though under the linear regression framework, the investigated association appears to be generally negative; a more detailed analysis reveals the presence of a statistically significant convexity, which may be attributed to the existence of the various diseconomies of scale and efficiency challenges faced by larger banks, as previously documented in the relevant literature (see, e.g., [24,38]), likely capable of partially offsetting the benefits related to a greater availability of resources and more informative ESG risk reporting. Additionally, the apparent non-linear nature of the size–ESG risk relationship may also be a reflection of the complex and often equivocal linkages between size, risk exposure, and ESG performance in the banking sector explored in prior studies (see, e.g., [39,40,41,42,43,44,45]).
The findings of this study offer some important lessons and recommendations for bank executives and equity investors. On the one hand, the results suggest that, on average, larger banking companies perform better in terms of ESG risk management, which, at a first glance, may be perceived as yet another incentive for banks to increase the scale of their business activities. On the other hand, however, the empirical evidence indicates that the relationship between size and ESG risk in the banking industry is in fact non-linear and demonstrates a statistically significant convexity, which likely reflects the presence of non-negligible diseconomies of scale. Hence, bank executives should be aware that, as the size of their company increases, the related benefits in the area of ESG risk management may be gradually offset by the accruing diseconomies of scale and the growing number and complexity of related ESG concerns. Neglecting this issue and failing to apply properly tailored countermeasures may ultimately lead to a reversal of the relationship between bank size and ESG risk when further growth begins to drive the overall level of ESG risk up.
The awareness of the U-shaped relationship between size and ESG risk in the cross-section of the international banking industry may also prove relevant for equity investors and asset managers who wish to construct their portfolios in accordance with the principles of sustainable investing. Bearing in mind the in-built systemic incentives for banks to increase their size, ESG-aware investors may therefore attempt to adjust their portfolios in advance to avoid the undesirable build-up of related risk.
The main limitations of this study arise from the fact that the empirical evidence is based on international cross-sectional data observed at a single point in time. Hence, future research might try to validate the findings and conclusions of the present paper using panel data over longer time horizons, controlling for the likely individual heterogeneity in the sample. Another area worth scientific exploration is whether the patterns in the size–ESG risk relationship identified on the basis of international data hold also at the individual country level. Furthermore, future studies might attempt to identify the contextual or bank-specific variables affecting the strength and shape of the above association at the country level. Finally, it would also be worthwhile to examine if the size–ESG risk relationship differs between subsamples of Islamic and conventional banks.
Given the fact that the present study was designed specifically to investigate the relationship between company size and ESG risk in the cross-section of the international banking industry, it is worthwhile to point out that its findings should be interpreted solely within that context. Therefore, the obtained results do not allow the formulation of any general conclusions about the direction or shape of the examined relationship in other industries.
6. Conclusions
The present study was aimed at an empirical investigation of the linkages between size and ESG risk in the cross-section of the international banking industry, with a particular focus on the identification of non-linearities in the examined relationship. To the best of the author’s knowledge, this issue has not been yet thoroughly explored in the relevant literature, which renders the present paper largely original and pioneering in the field.
The results of the uni- and multivariate linear and non-linear regression analyses applied to a broad international sample of banking companies demonstrate that, although size is, on average, negatively associated with ESG risk in the cross-section, the relationship is in fact non-linear and follows a U-shaped pattern. The findings generally hold when individual size dimensions (i.e., the book value of total assets or the total number of employees) are used as regressors instead of the composite size index. The obtained results are also robust regarding the impact of both country-specific contextual factors and the outliers in the sample. On the one hand, the findings of this study are therefore consistent with the stakeholder and organisational legitimacy theories, as well as the slack resources hypothesis, under which bigger firms are likely to perform better in the area of ESG risk management due to the larger availability of the required resources and more informative sustainability reporting. On the other hand, however, the revealed convexity of the relationship indicates the presence of non-negligible diseconomies of scale and/or the rising number and complexity of the ESG-related concerns that tend to accrue with size.
The main contributions of the present paper are threefold. First, this study enhances the relevant literature by systematising the existing theoretical and empirical evidence on the impact of size on ESG risk, with a particular focus on the specific context of the banking sector. Second, this paper provides a thorough theoretical underpinning and empirical examination of the linkages between size and ESG risk in the cross-section of the international banking industry, highlighting the non-linear nature of the relationship. Third, the findings of this study emphasize the importance of diseconomies of scale in the area of ESG risk management, thus offering some important practical lessons and recommendations for bank executives, as well as for ESG-oriented equity investors and asset managers.
Given the innate tendency of banks to expand the scale of their businesses on the one hand, and the constantly growing global awareness of the importance of ESG-related concerns on the other, the in-depth exploration of the impact of size on ESG risk in the banking industry seems vital, not only from the standpoint of the decision-making processes of bank executives, but also those of equity investors and asset managers who construct their investment portfolios by taking into account the magnitude of ESG risk exposure. This, in turn, gives rise to a continuation of the research efforts in the above area, as suggested in the discussion section (Section 5).
Funding
This research received no external funding.
Institutional Review Board Statement
Not applicable.
Informed Consent Statement
Not applicable.
Data Availability Statement
Data supporting the reported results can be found at https://www.sustainalytics.com/esg-ratings; https://markets.ft.com/data/equities; https://www.wsj.com/market-data/quotes/company-list; https://www.marketwatch.com/investing (accessed on 23 January 2023); https://hdr.undp.org/sites/default/files/2021-22_HDR/HDR21-22_Statistical_Annex_HDI_Table.xlsx; https://solability.com/global-sustainable-competitiveness-index/the-global-sustainable-competitiveness-index-2021; and https://www.transparency.org/en/cpi/2021 (accessed on 31 January 2023).
Acknowledgments
The author would like to thank the anonymous reviewers for their insightful and constructive comments and suggestions that helped to improve the composition and overall scientific soundness of this paper.
Conflicts of Interest
The author declares no conflicts of interest.
References
- Eccles, R.G.; Klimenko, S. Harvard Business Review; Harvard Business Publishing: Brighton, MA, USA, 2019; pp. 106–116. [Google Scholar]
- Nasdaq Clarity, Not Size Important in ESG Market|Nasdaq. 2022. Available online: https://www.nasdaq.com/articles/clarity-not-size-important-in-esg-market (accessed on 10 January 2023).
- Friedman, M. A Friedman Doctrine—The Social Responsibility Of Business Is to Increase Its Profits. The New York Times, 13 September 1970. [Google Scholar]
- Principles for Responsible Investment, About the PRI. Available online: https://www.unpri.org/about-us/about-the-pri (accessed on 12 January 2023).
- Cerqueti, R.; Ciciretti, R.; Dalò, A.; Nicolosi, M. ESG Investing: A Chance to Reduce Systemic Risk. J. Financ. Stab. 2021, 54, 100887. [Google Scholar] [CrossRef]
- Armanino LLP ESG Scores & Rating Agencies. Available online: https://www.armanino.com/articles/esg-scores/ (accessed on 12 January 2023).
- Drempetic, S.; Klein, C.; Zwergel, B. The Influence of Firm Size on the ESG Score: Corporate Sustainability Ratings Under Review. J. Bus. Ethics 2020, 167, 333–360. [Google Scholar] [CrossRef]
- Galletta, S.; Mazzù, S.; Naciti, V. A Bibliometric Analysis of ESG Performance in the Banking Industry: From the Current Status to Future Directions. Res. Int. Bus. Financ. 2022, 62, 101684. [Google Scholar] [CrossRef]
- Thompson, P.; Cowton, C.J. Bringing the Environment into Bank Lending: Implications for Environmental Reporting. Br. Account. Rev. 2004, 36, 197–218. [Google Scholar] [CrossRef]
- Bolibok, P. The Impact of Social Responsibility Performance on the Value Relevance of Financial Data in the Banking Sector: Evidence from Poland. Sustainability 2021, 13, 12006. [Google Scholar] [CrossRef]
- Zioło, M. Business Models of Banks Toward Sustainability and ESG Risk. In Sustainability in Bank and Corporate Business Models. The Link between ESG Risk Assessment and Corporate Sustinability; Palgrave Macmillan: Cham, Switzerland, 2021; pp. 185–209. [Google Scholar]
- Koleśnik, J. Operational Risk in Banks—Revolution or Regulatory Evolution. Res. Pap. Wrocław Univ. Econ. 2018, 509, 168–178. [Google Scholar] [CrossRef]
- Galletta, S.; Goodell, J.W.; Mazzù, S.; Paltrinieri, A. Bank Reputation and Operational Risk: The Impact of ESG. Financ. Res. Lett. 2023, 51, 103494. [Google Scholar] [CrossRef]
- Liu, S.; Jin, J.; Nainar, K. Does ESG Perform. Reduce Banks’ Nonperforming Loans? Financ. Res. Lett. 2023, 55, 103859. [Google Scholar] [CrossRef]
- Dhaliwal, D.S.; Li, O.Z.; Tsang, A.; Yang, Y.G. Voluntary Nonfinancial Disclosure and the Cost of Equity Capital: The Initiation of Corporate Social Responsibility Reporting. Account. Rev. 2011, 86, 59–100. [Google Scholar] [CrossRef]
- Gregory, A.; Tharyan, R.; Whittaker, J. Corporate Social Responsibility and Firm Value: Disaggregating the Effects on Cash Flow, Risk and Growth. J. Bus. Ethics 2014, 124, 633–657. [Google Scholar] [CrossRef]
- Agnese, P.; Giacomini, E. Bank’s Funding Costs: Do ESG Factors Really Matter? Financ. Res. Lett. 2023, 51, 103437. [Google Scholar] [CrossRef]
- Andrieș, A.M.; Sprincean, N. ESG Performance and Banks’ Funding Costs. Financ. Res. Lett. 2023, 54, 103811. [Google Scholar] [CrossRef]
- Simpson, W.G.; Kohers, T. The Link between Corporate Social and Financial Performance: Evidence from the Banking Industry. J. Bus. Ethics 2002, 35, 97–109. [Google Scholar] [CrossRef]
- Wu, M.-W.; Shen, C.-H. Corporate Social Responsibility in the Banking Industry: Motives and Financial Performance. J. Bank. Financ. 2013, 37, 3529–3547. [Google Scholar] [CrossRef]
- Gangi, F.; Mustilli, M.; Varrone, N.; Daniele, L. Corporate Social Responsibility and Banks’ Financial Performance. Int. Bus. Res. 2018, 11, 42–58. [Google Scholar] [CrossRef]
- Finger, M.; Gavious, I.; Manos, R. Environmental Risk Management and Financial Performance in the Banking Industry: A Cross-Country Comparison. J. Int. Financ. Mark. Inst. Money 2018, 52, 240–261. [Google Scholar] [CrossRef]
- Equator Principles Association the Equator Principles. Available online: https://equator-principles.com/about-the-equator-principles/ (accessed on 8 November 2023).
- Gallo, P.J.; Christensen, L.J. Firm Size Matters: An Empirical Investigation of Organizational Size and Ownership on Sustainability-Related Behaviors. Bus. Soc. 2011, 50, 315–349. [Google Scholar] [CrossRef]
- Freeman, R.E.; Wicks, A.C.; Parmar, B. Stakeholder Theory as a Basis for Capitalism. In Corporate Social Responsibility and Corporate Governance; Palgrave Macmillan: London, UK, 2011; pp. 52–72. [Google Scholar] [CrossRef]
- Deegan, C. Introduction: The Legitimising Effect of Social and Environmental Disclosures—A Theoretical Foundation. Account. Audit. Account. J. 2002, 15, 282–311. [Google Scholar] [CrossRef]
- Adams, C.A.; Hill, W.-Y.; Roberts, C.B. Corportate Social Reporting Practices in Western Europe: Legitimating Corporate Behaviour? Br. Account. Rev. 1998, 30, 1–21. [Google Scholar] [CrossRef]
- Chih, H.-L.; Chih, H.-H.; Chen, T.-Y. On the Determinants of Corporate Social Responsibility: International Evidence on the Financial Industry. J. Bus. Ethics 2010, 93, 115–135. [Google Scholar] [CrossRef]
- Baumann-Pauly, D.; Wickert, C.; Spence, L.J.; Scherer, A.G. Organizing Corporate Social Responsibility in Small and Large Firms: Size Matters. J. Bus. Ethics 2013, 115, 693–705. [Google Scholar] [CrossRef]
- Chauhan, S. A Relational Study of Firm’s Characteristics and CSR Expenditure. Procedia Econ. Financ. 2014, 11, 23–32. [Google Scholar] [CrossRef]
- Hörisch, J.; Johnson, M.P.; Schaltegger, S. Implementation of Sustainability Management and Company Size: A Knowledge-Based View. Bus. Strategy Environ. 2015, 24, 765–779. [Google Scholar] [CrossRef]
- Shen, C.-H.; Wu, M.-W.; Chen, T.-H.; Fang, H. To Engage or Not to Engage in Corporate Social Responsibility: Empirical Evidence from Global Banking Sector. Econ. Model. 2016, 55, 207–225. [Google Scholar] [CrossRef]
- Granville, M.; Gez, M.; Gottlieb, D. A Survey of Sustainability Disclosures by Small and Mid-Cap Companies; Harvard Law School Forum on Corporate Governance; White & Case LPP: New York, NY, USA, 2021. [Google Scholar]
- Chiaramonte, L.; Dreassi, A.; Girardone, C.; Piserà, S. Do ESG Strategies Enhance Bank Stability during Financial Turmoil? Evidence from Europe. Eur. J. Financ. 2022, 28, 1173–1211. [Google Scholar] [CrossRef]
- Van Gysegem, F.; Blaser, P. Banking Goes ESG. How to Combine Sustainability with Profitability; Roland Berger GmbH: Munich, Germany, 2022. [Google Scholar]
- Gutiérrez-Ponce, H.; Wibowo, S.A. Do Sustainability Activities Affect the Financial Performance of Banks? The Case of Indonesian Banks. Sustainability 2023, 15, 6892. [Google Scholar] [CrossRef]
- Dobrick, J.; Klein, C.; Zwergel, B. Size Bias in Refinitiv ESG Data. Financ. Res. Lett. 2023, 55, 104014. [Google Scholar] [CrossRef]
- Canback, S.; Samouel, P.; Price, D. Do Diseconomies of Scale Impact Firm Size and Performance? A Theoretical and Empirical Overview. ICFAI J. Manag. Econ. 2006, 4, 27–70. [Google Scholar]
- Demsetz, R.S.; Strahan, P.E. Diversification, Size, and Risk at Bank Holding Companies. J. Money Credit Bank. 1997, 29, 300–313. [Google Scholar] [CrossRef]
- Soussa, F. Too Big to Fail: Moral Hazard and Unfair Competition. In Financial Stability and Central Banks, Selected Issues for Financial Safety Nets and Market Discipline; Halme, L., Hawkesby, C., Healey, J., Saapar, I., Soussa, F., Eds.; Centre for Central Banking Studies, Bank of England: London, UK, 2000; pp. 5–31. [Google Scholar]
- Dell’Ariccia, G.; Laeven, L.; Suarez, G.A. Bank Leverage and Monetary Policy’s Risk-Taking Channel: Evidence from the United States. J. Financ. 2017, 72, 613–654. [Google Scholar] [CrossRef]
- Minton, B.A.; Stulz, R.M.; Taboada, A.G. Are the Largest Banks Valued More Highly? Rev. Financ. Stud. 2019, 32, 4604–4652. [Google Scholar] [CrossRef]
- Di Tommaso, C.; Thornton, J. Do ESG Scores Effect Bank Risk Taking and Value? Evidence from European Banks. Corp. Soc. Responsib. Environ. Manag. 2020, 27, 2286–2298. [Google Scholar] [CrossRef]
- Albdiwy, F.; Ahmad, W.M.W.; Sukor, M.E.A. Does Bank Size Affect the Relationship between ESG Framework and Bank Stability? Evidence from the Global Banking Industry. J. Hunan Univ. 2022, 49, 396–411. [Google Scholar]
- Quang Trinh, V.; Duong Cao, N.; Li, T.; Elnahass, M. Social Capital, Trust, and Bank Tail Risk: The Value of ESG Rating and the Effects of Crisis Shocks. J. Int. Financ. Mark. Inst. Money 2023, 83, 101740. [Google Scholar] [CrossRef]
- Soppe, A. Sustainable Corporate Finance. J. Bus. Ethics 2004, 53, 213–224. [Google Scholar] [CrossRef]
- Akgun, O.T.; Mudge, T.J.; Townsend, B. How Company Size Bias in ESG Scores Impacts the Small Cap Investor. J. Impact ESG Invest. Summer JESG 2021, 1, 31–44. [Google Scholar] [CrossRef]
- Lewis, S. Reputation and Corporate Responsibility. J. Commun. Manag. 2003, 7, 356–366. [Google Scholar] [CrossRef]
- Parguel, B.; Benoît-Moreau, F.; Larceneux, F. How Sustainability Ratings Might Deter ‘Greenwashing’: A Closer Look at Ethical Corporate Communication. J. Bus. Ethics 2011, 102, 15–28. [Google Scholar] [CrossRef]
- Robinson, M.; Kleffner, A.; Bertels, S. Signaling Sustainability Leadership: Empirical Evidence of the Value of DJSI Membership. J. Bus. Ethics 2011, 101, 493–505. [Google Scholar] [CrossRef]
- Cabral, L. Living Up to Expectations: Corporate Reputation and Persistence of Firm Performance. Strategy Sci. 2016, 1, 2–11. [Google Scholar] [CrossRef]
- Chen, R.C.Y.; Hung, S.-W.; Lee, C.-H. Does Corporate Value Affect the Relationship between Corporate Social Responsibility and Stock Returns? J. Sustain. Financ. Invest. 2017, 7, 188–196. [Google Scholar] [CrossRef]
- Pérez, A. Corporate Reputation and CSR Reporting to Stakeholders: Gaps in the Literature and Future Lines of Research. Corp. Commun. Int. J. 2015, 20, 11–29. [Google Scholar] [CrossRef]
- Mahoney, L.; Roberts, R.W. Corporate Social Performance, Financial Performance and Institutional Ownership in Canadian Firms. Account. Forum 2007, 31, 233–253. [Google Scholar] [CrossRef]
- Apergis, N.; Poufinas, T.; Antonopoulos, A. ESG Scores and Cost of Debt. Energy Econ. 2022, 112, 106186. [Google Scholar] [CrossRef]
- Brogi, M.; Lagasio, V.; Porretta, P. Be Good to Be Wise: Environmental, Social, and Governance Awareness as a Potential Credit Risk Mitigation Factor. J. Int. Financ. Manag. Account. 2022, 33, 522–547. [Google Scholar] [CrossRef]
- Schadewitz, H.; Niskala, M. Communication via Responsibility Reporting and Its Effect on Firm Value in Finland. Corp. Soc. Responsib. Environ. Manag. 2010, 17, 96–106. [Google Scholar] [CrossRef]
- Flammer, C. Corporate Social Responsibility and Shareholder Reaction: The Environmental Awareness of Investors. Acad. Manag. J. AMJ 2013, 56, 758–781. [Google Scholar] [CrossRef]
- Friede, G.; Busch, T.; Bassen, A. ESG and Financial Performance: Aggregated Evidence from More than 2000 Empirical Studies. J. Sustain. Financ. Invest. 2015, 5, 210–233. [Google Scholar] [CrossRef]
- Pu, G. A Non-Linear Assessment of ESG and Firm Performance Relationship: Evidence from China. Econ. Res.-Ekon. Istraž. 2022, 36, 2113336. [Google Scholar] [CrossRef]
- European Parliament and Council. Directive 2014/95/EU of the European Parliament and of the Council of 22 October 2014 Amending Directive 2013/34/EU as Regards Disclosure of Non-Financial and Diversity Information by Certain Large Undertakings and Groups Text with EEA Relevance; European Parliament and Council: Strasbourg, France, 2014; Volume 330. [Google Scholar]
- European Parliament and Council. Directive (EU) 2022/2464 of the European Parliament and of the Council of 14 December 2022 Amending Regulation (EU) No 537/2014, Directive 2004/109/EC, Directive 2006/43/EC and Directive 2013/34/EU, as Regards Corporate Sustainability Reporting (Text with EEA Relevance); European Parliament and Council: Strasbourg, France, 2022; Volume 322. [Google Scholar]
- Securities and Exchange Commission. The Enhancement and Standardization of Climate-Related Disclosures for Investors; U.S. Securities and Exchange Commission: Washington, DC, USA, 2022; Volume S7-10–22.
- KPMG International. Big Shifts, Small Steps. Survey of Sustainability Reporting 2022; KPMG: Amstelveen, The Netherlands, 2022. [Google Scholar]
- Margolis, J.D.; Elfenbein, H.A.; Walsh, J.P. Does It Pay to Be Good…And Does It Matter? A Meta-Analysis of the Relationship between Corporate Social and Financial Performance. SSRN J. 2009. [Google Scholar] [CrossRef]
- Gibson Brandon, R.; Krueger, P.; Schmidt, P.S. ESG Rating Disagreement and Stock Returns. Financ. Anal. J. 2021, 77, 104–127. [Google Scholar] [CrossRef]
- Berg, F.; Kölbel, J.F.; Rigobon, R. Aggregate Confusion: The Divergence of ESG Ratings. Rev. Financ. 2022, 26, 1315–1344. [Google Scholar] [CrossRef]
- Cohen, G. ESG Risks and Corporate Survival. Environ. Syst. Decis. 2023, 43, 16–21. [Google Scholar] [CrossRef] [PubMed]
- Bansal, P. Evolving Sustainably: A Longitudinal Study of Corporate Sustainable Development. Strateg. Manag. J. 2005, 26, 197–218. [Google Scholar] [CrossRef]
- Melo, T. Slack-resources Hypothesis: A Critical Analysis under a Multidimensional Approach to Corporate Social Performance. Soc. Responsib. J. 2012, 8, 257–269. [Google Scholar] [CrossRef]
- Eccles, R.G. The Benefits and Costs of Climate-Related Disclosure Activities for Companies and Investors. Available online: https://www.forbes.com/sites/bobeccles/2022/05/18/the-benefits-and-costs-of-climate-related-disclosure-activities-for-companies-and-investors/ (accessed on 16 January 2023).
- Orlitzky, M. Does Firm Size Confound the Relationship Between Corporate Social Performance and Firm Financial Performance? J. Bus. Ethics 2001, 33, 167–180. [Google Scholar] [CrossRef]
- He, G.; Liu, Y.; Chen, F. Research on the Impact of Environment, Society, and Governance (ESG) on Firm Risk: An Explanation from a Financing Constraints Perspective. Financ. Res. Lett. 2023, 58, 104038. [Google Scholar] [CrossRef]
- Gregory, R.P. The Influence of Firm Size on ESG Score Controlling for Ratings Agency and Industrial Sector. J. Sustain. Financ. Invest. 2022, 14, 86–99. [Google Scholar] [CrossRef]
- Graafland, J.; van de Ven, B.; Stoffele, N. Strategies and Instruments for Organising CSR by Small and Large Businesses in the Netherlands. J. Bus. Ethics 2003, 47, 45–60. [Google Scholar] [CrossRef]
- Hart, S.L.; Sharma, S. Engaging Fringe Stakeholders for Competitive Imagination. Acad. Manag. Perspect. AMP 2004, 18, 7–18. [Google Scholar] [CrossRef]
- Vormedal, I.; Ruud, A. Sustainability Reporting in Norway—An Assessment of Performance in the Context of Legal Demands and Socio-Political Drivers. Bus. Strategy Environ. 2009, 18, 207–222. [Google Scholar] [CrossRef]
- Bissoondoyal-Bheenick, E.; Brooks, R.; Do, H.X. ESG and Firm Performance: The Role of Size and Media Channels. Econ. Model. 2023, 121, 106203. [Google Scholar] [CrossRef]
- Barnea, A.; Rubin, A. Corporate Social Responsibility as a Conflict Between Shareholders. J. Bus. Ethics 2010, 97, 71–86. [Google Scholar] [CrossRef]
- Udayasankar, K. Corporate Social Responsibility and Firm Size. J. Bus. Ethics 2008, 83, 167–175. [Google Scholar] [CrossRef]
- Aouadi, A.; Marsat, S. Do ESG Controversies Matter for Firm Value? Evidence from International Data. J. Bus. Ethics 2018, 151, 1027–1047. [Google Scholar] [CrossRef]
- Penas, M.F.; Unal, H. Gains in Bank Mergers: Evidence from the Bond Markets. J. Financ. Econ. 2004, 74, 149–179. [Google Scholar] [CrossRef]
- Philippon, T.; Reshef, A. Wages and Human Capital in the U.S. Finance Industry: 1909–2006. Q. J. Econ. 2012, 127, 1551–1609. [Google Scholar] [CrossRef]
- International Monetary Fund. Global Financial Stability Report. Moving from Liquidity- to Growth-Driven Markets; World Economic and Financial Surveys; International Monetary Fund: Washington, DC, USA, 2014. [Google Scholar]
- Calomiris, C.W.; Nissim, D. Crisis-Related Shifts in the Market Valuation of Banking Activities. J. Financ. Intermediation 2014, 23, 400–435. [Google Scholar] [CrossRef]
- Wheelock, D.C.; Wilson, P.W. Do Large Banks Have Lower Costs? New Estimates of Returns to Scale for U. S. Banks. J. Money Credit Bank. 2012, 44, 171–199. [Google Scholar] [CrossRef]
- Hughes, J.P.; Mester, L.J. Who Said Large Banks Don’t Experience Scale Economies? Evidence from a Risk-Return-Driven Cost Function. J. Financ. Intermediation 2013, 22, 559–585. [Google Scholar] [CrossRef]
- Davies, R.; Tracey, B. Too Big to Be Efficient? The Impact of Implicit Subsidies on Estimates of Scale Economies for Banks. J. Money Credit Bank. 2014, 46, 219–253. [Google Scholar] [CrossRef]
- Santos, J.A.C. Evidence from the Bond Market on Banks’ “Too Big to Fail” Subsidy. SSRN J. 2014, 20, 29–39. [Google Scholar] [CrossRef]
- Smirlock, M. Evidence on the (Non) Relationship between Concentration and Profitability in Banking. J. Money Credit Bank. 1985, 17, 69–83. [Google Scholar] [CrossRef]
- Bikker, J.A.; Hu, H. Cyclical Patterns in Profits, Provisioning and Lending of Banks; DNB Staff Reports; De Nederlansche Bank: Amsterdam, The Netherlands, 2002. [Google Scholar]
- Goddard, J.; Molyneux, P.; Wilson, J.O.S. The Profitability of European Banks: A Cross-Sectional and Dynamic Panel Analysis. Manch. Sch. 2004, 72, 363–381. [Google Scholar] [CrossRef]
- Platonova, E.; Asutay, M.; Dixon, R.; Mohammad, S. The Impact of Corporate Social Responsibility Disclosure on Financial Performance: Evidence from the GCC Islamic Banking Sector. J. Bus. Ethics 2018, 151, 451–471. [Google Scholar] [CrossRef]
- Athanasoglou, P.P.; Brissimis, S.N.; Delis, M.D. Bank-Specific, Industry-Specific and Macroeconomic Determinants of Bank Profitability. J. Int. Financ. Mark. Inst. Money 2008, 18, 121–136. [Google Scholar] [CrossRef]
- Nizam, E.; Ng, A.; Dewandaru, G.; Nagayev, R.; Nkoba, M.A. The Impact of Social and Environmental Sustainability on Financial Performance: A Global Analysis of the Banking Sector. J. Multinatl. Financ. Manag. 2019, 49, 35–53. [Google Scholar] [CrossRef]
- Tui, S.; Nurnajamuddin, M.; Sufri, M.; Nirwana, A. Determinants of Profitability and Firm Value: Evidence from Indonesian Banks. IRA-Int. J. Manag. Soc. Sci. 2017, 7, 84–95. [Google Scholar] [CrossRef]
- Ersoy, E.; Swiecka, B.; Grima, S.; Özen, E.; Romanova, I. The Impact of ESG Scores on Bank Market Value? Evidence from the U.S. Banking Industry. Sustainability 2022, 14, 9527. [Google Scholar] [CrossRef]
- Ferretti, R.; Gallo, G.; Landi, A.; Venturelli, V. Market-Book Ratios of European Banks: What Does Explain the Structural Fall? CEFIN Working Papers; CEFIN: Modena, Italy, 2018; No. 65. [Google Scholar]
- Miralles-Quirós, M.M.; Miralles-Quirós, J.L.; Redondo Hernández, J. ESG Performance and Shareholder Value Creation in the Banking Industry: International Differences. Sustainability 2019, 11, 1404. [Google Scholar] [CrossRef]
- Kuzucu, N.; Kuzucu, S. Does Efficiency Contribute to Market Valuation of Banks Evidence from Turkish Banking System. Pressacademia 2019, 9, 9–13. [Google Scholar] [CrossRef]
- Avramidis, P.; Cabolis, C.; Serfes, K. Bank Size and Market Value: The Role of Direct Monitoring and Delegation Costs. J. Bank. Financ. 2018, 93, 127–138. [Google Scholar] [CrossRef]
- Acharya, V.V.; Pedersen, L.H.; Philippon, T.; Richardson, M. Measuring Systemic Risk. Rev. Financ. Stud. 2017, 30, 2–47. [Google Scholar] [CrossRef]
- Hagendorff, J.; Keasey, K.; Vallascas, F. When Banks Grow Too Big for Their National Economies: Tail Risks, Risk Channels, and Government Guarantees. J. Financ. Quant. Anal. 2018, 53, 2041–2066. [Google Scholar] [CrossRef]
- Acharya, V.V.; Steffen, S. The “Greatest” Carry Trade Ever? Understanding Eurozone Bank Risks. J. Financ. Econ. 2015, 115, 215–236. [Google Scholar] [CrossRef]
- Gennaioli, N.; Martin, A.; Rossi, S. Banks, Government Bonds, and Default: What Do the Data Say? J. Monet. Econ. 2018, 98, 98–113. [Google Scholar] [CrossRef]
- Scholtens, B.; Dam, L. Banking on the Equator. Are Banks That Adopted the Equator Principles Different from Non-Adopters? World Dev. 2007, 35, 1307–1328. [Google Scholar] [CrossRef]
- Mathuva, D.M.; Kiweu, J.M. Cooperative Social and Environmental Disclosure and Financial Performance of Savings and Credit Cooperatives in Kenya. Adv. Account. 2016, 35, 197–206. [Google Scholar] [CrossRef]
- Lian, Y.; Gao, J.; Ye, T. How Does Green Credit Affect the Financial Performance of Commercial Banks? Evidence from China. J. Clean. Prod. 2022, 344, 131069. [Google Scholar] [CrossRef]
- Ge, L.; Zhao, H.; Yang, J.; Yu, J.; He, T. Green Finance, Technological Progress, and Ecological Performance—Evidence from 30 Provinces in China. Environ. Sci. Pollut. Res. 2022, 29, 66295–66314. [Google Scholar] [CrossRef]
- Menicucci, E.; Paolucci, G. ESG Dimensions and Bank Performance: An Empirical Investigation in Italy. Corp. Gov. Int. J. Bus. Soc. 2022, 23, 563–586. [Google Scholar] [CrossRef]
- Neitzert, F.; Petras, M. Corporate Social Responsibility and Bank Risk. J. Bus. Econ. 2022, 92, 397–428. [Google Scholar] [CrossRef]
- Sustainalytics Company. ESG Risk Ratings and Scores—Sustainalytics. Available online: https://www.sustainalytics.com/esg-ratings (accessed on 23 January 2023).
- Sustainalytics. ESG Risk Ratings—Methodology Abstract. Version 2.1; Sustainalytics: Amsterdam, The Netherlands, 2021. [Google Scholar]
- Dang, C.; Li, Z.; Yang, C. Measuring Firm Size in Empirical Corporate Finance. J. Bank. Financ. 2018, 86, 159–176. [Google Scholar] [CrossRef]
- Lind, J.T.; Mehlum, H. With or Without U? The Appropriate Test for a U-Shaped Relationship. Oxf. Bull. Econ. Stat. 2010, 72, 109–118. [Google Scholar] [CrossRef]
- Hoang, T.H.V.; Pham, L.; Nguyen, T.T.P. Does Country Sustainability Improve Firm ESG Reporting Transparency? The Moderating Role of Firm Industry and CSR Engagement. Econ. Model. 2023, 125, 106351. [Google Scholar] [CrossRef]
- Solability the Global Sustainable Competitiveness Index. 2021. Available online: https://solability.com/global-sustainable-competitiveness-index/the-global-sustainable-competitiveness-index-2021 (accessed on 31 January 2023).
- The United Nations Development Programme Human Development Index. Available online: https://hdr.undp.org/sites/default/files/2021-22_HDR/HDR21-22_Statistical_Annex_HDI_Table.xlsx (accessed on 31 January 2023).
- Transparency International 2021 Corruption Perceptions Index—Explore the Results. Available online: https://www.transparency.org/en/cpi/2021 (accessed on 31 January 2023).
- Financial Times Equities, ETF and Funds Prices, Indices and Stock Quotes—FT.Com. Available online: https://markets.ft.com/data/equities (accessed on 23 January 2023).
- The Wall Street Journal Company List—WSJ. Available online: https://www.wsj.com/market-data/quotes/company-list (accessed on 23 January 2023).
- MarketWatch.com. Investing. Available online: https://www.marketwatch.com/investing (accessed on 23 January 2023).
Figure 1.
The relationship between bank size and ESG risk.

Figure 2.
Non-linearities in the relationship between bank size and ESG risk.


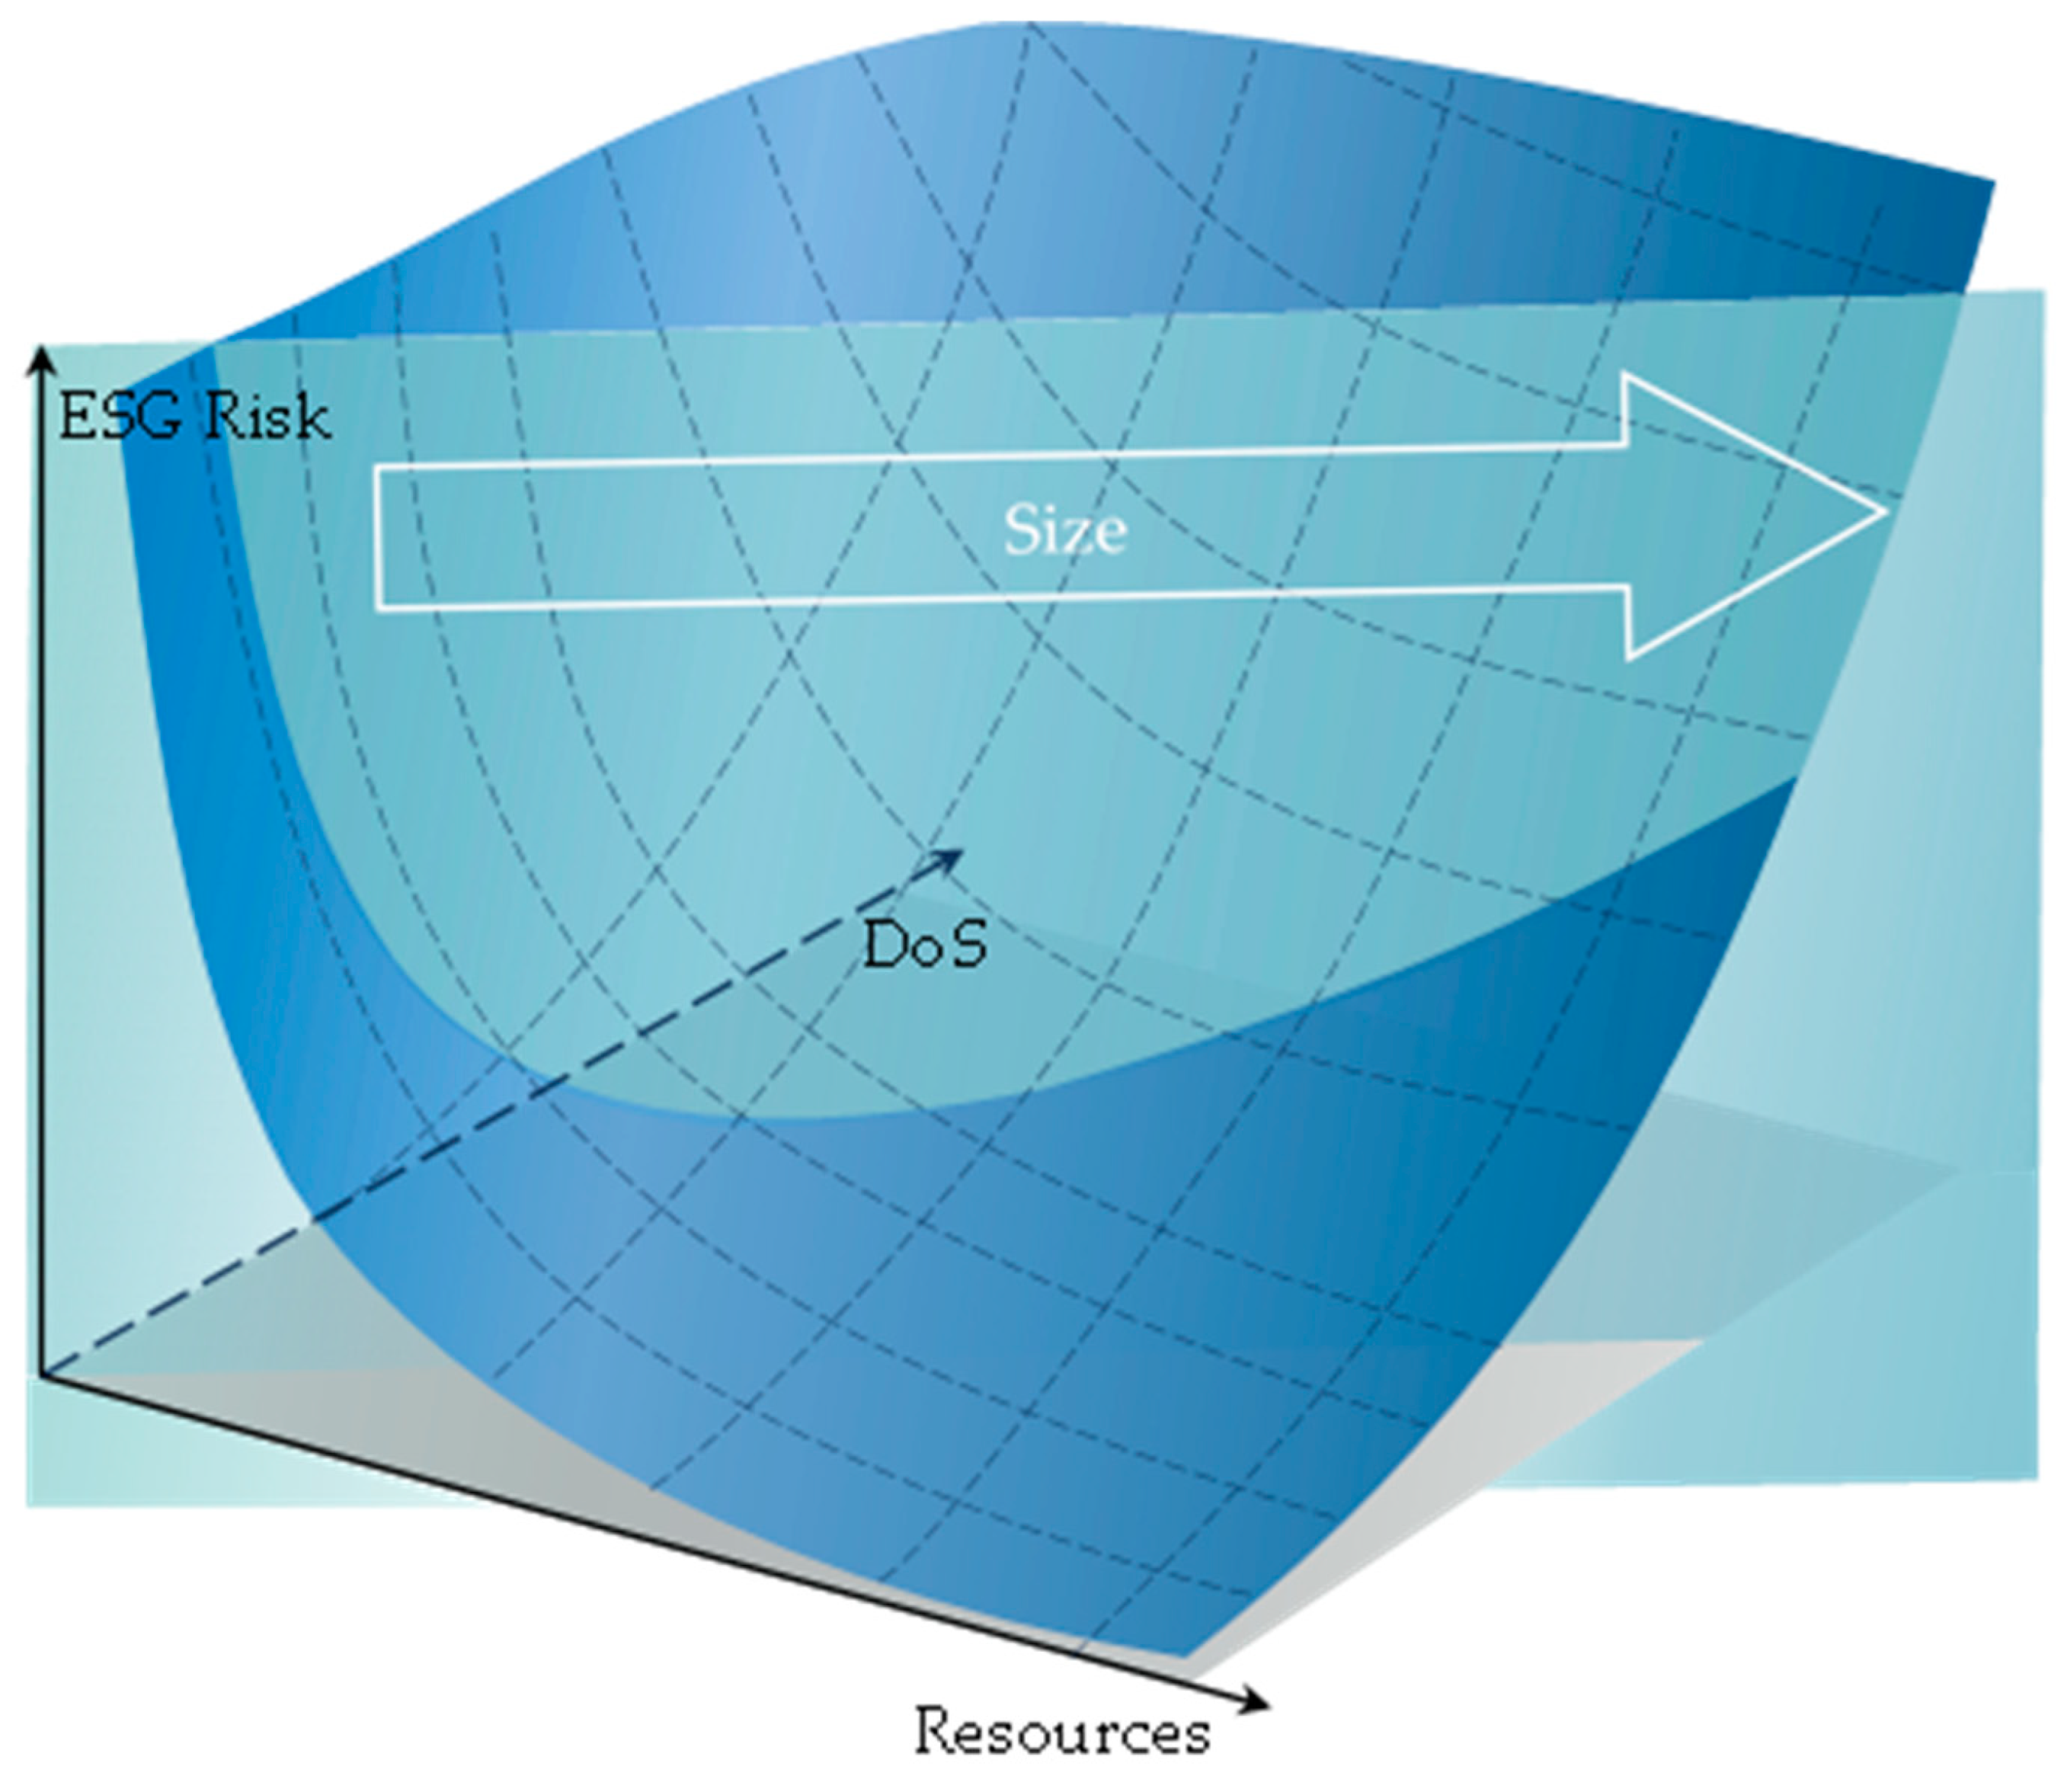
Table 1.
Composition of the examined sample by country of headquarters.
| Country | Number of Companies | Country | Number of Companies |
|---|---|---|---|
| Argentina | 1 | Nigeria | 5 |
| Australia | 9 | Norway | 9 |
| Austria | 4 | Oman | 3 |
| Bahrain | 2 | Pakistan | 7 |
| Belgium | 2 | Panama | 1 |
| Brazil | 8 | Peru | 5 |
| Canada | 12 | Philippines | 7 |
| Chile | 3 | Poland | 10 |
| China | 40 | Portugal | 1 |
| Colombia | 7 | Qatar | 7 |
| Czechia | 2 | Romania | 1 |
| Denmark | 5 | Saudi Arabia | 10 |
| Egypt | 4 | Singapore | 2 |
| Finland | 2 | Slovakia | 2 |
| France | 4 | Slovenia | 1 |
| Georgia | 1 | South Africa | 6 |
| Germany | 5 | South Korea | 9 |
| Greece | 4 | Spain | 5 |
| Iceland | 2 | Sweden | 6 |
| India | 31 | Switzerland | 6 |
| Indonesia | 18 | Taiwan | 17 |
| Ireland | 2 | Thailand | 11 |
| Israel | 6 | The Netherlands | 2 |
| Italy | 12 | Türkiye | 11 |
| Japan | 59 | UAE | 12 |
| Kuwait | 9 | UK | 12 |
| Malaysia | 11 | US | 229 |
| Mexico | 4 | Vietnam | 1 |
| New Zealand | 1 |
Table 2.
Summary statistics.
| Variable | N | Mean | Median | Min | Max | SD | Kurtosis | Skewness |
|---|---|---|---|---|---|---|---|---|
| ESG_riskit | 668 | 28.0534 | 28.50000 | 7.90000 | 51.10000 | 6.53135 | 3.62870 | −0.12971 |
| CSIit | 668 | 0.03601 | 0.00701 | 0.00018 | 0.96685 | 0.09568 | 42.53835 | 5.66221 |
| CCFIit | 668 | 0.64412 | 0.73300 | 0.02800 | 0.97600 | 0.20374 | 3.33236 | −1.01438 |
Table 3.
Estimation of Model 1.
| Parameter/ Statistic | Estimate/ Value | Robust Standard Error | t | p-Value | 95% Confidence Interval | |
|---|---|---|---|---|---|---|
| 28.27394 | 0.26519 | 106.619 | 0.0000 | 27.75324 | 28.79465 | |
| −6.12313 | 2.84622 | −2.151 | 0.0318 | −11.71179 | −0.53448 | |
| F R2 Adj. R2 N | 4.63 0.0080 0.0065 668 | 0.0318 | ||||
Table 4.
Estimation of Model 2.
| Parameter/ Statistic | Estimate/ Value | Robust Standard Error | t | p-Value | 95% Confidence Interval | |
|---|---|---|---|---|---|---|
| 28.75424 | 0.26909 | 106.856 | 0.0000 | 28.22587 | 29.28262 | |
| −31.40918 | 5.86380 | −5.356 | 0.0000 | −42.92297 | −19.89538 | |
| 41.22467 | 8.08443 | 5.099 | 0.0000 | 25.35059 | 57.09874 | |
| F R2 Adj. R2 N | 14.37 0.0396 0.0367 668 | 0.0000 | ||||
Table 5.
The Lind–Mehlum test for a U-shaped relationship for Model 2.
| Parameter/ Statistic | Lower Bound | Upper Bound |
|---|---|---|
| Interval | 0.00018 | 0.96685 |
| Slope | −31.39401 | 48.30679 |
| t-value | −5.238 | 4.052 |
| p-value | 0.0000 | 0.0000 |
| 95% Fieller interval for extreme point | 0.31896 | 0.47472 |
| Extreme point | 0.38095 | |
| Overall test for presence of a U-shape: | ||
| t-value | 4.052 | |
| p-value | 0.0000 | |
Table 6.
Estimations of Models 1A, 1E, 2A, and 2E.
| Model | Parameter/ Statistic | Estimate/ Value | Robust Standard Error | t | p-Value | 95% Confidence Interval | |
|---|---|---|---|---|---|---|---|
| 1A | F R2 Adj. R2 | 28.30983 −1.32564 7.67 0.0138 0.0123 | 0.26542 0.47878 | 106.66 −2.769 | 0.0000 0.0058 0.0058 | 27.78867 −2.26575 | 28.83100 −0.38554 |
| 1E | F R2 Adj. R2 | 28.18218 −0.00761 1.95 0.0026 0.0011 | 0.26047 0.00545 | 108.199 −1.398 | 0.0000 0.1627 0.1627 | 27.67075 −0.01831 | 28.69361 0.00308 |
| 2A | F R2 Adj. R2 | 28.77206 −6.57645 1.48990 19.21 0.0517 0.0488 | 0.27123 1.07082 0.27194 | 106.082 −6.142 5.479 0.0000 | 0.0000 0.0000 0.0000 | 28.23949 −8.67904 0.95594 | 29.30462 −4.47387 2.02387 |
| 2E | F R2 Adj. R2 | 28.55870 −0.04880 0.00015 5.54 0.0209 0.0179 | 0.27208 0.01484 0.00004 | 104.963 −3.288 3.273 0.0041 | 0.0000 0.0011 0.0011 | 28.02446 −0.07794 0.00006 | 29.09294 −0.01966 0.00023 |
| N | 668 | ||||||
Table 7.
The Lind–Mehlum test for a U-shaped relationship for Models 2A and 2E.
| Parameter/ Statistic | Model 2A | Model 2E | ||
|---|---|---|---|---|
| Lower Bound | Upper Bound | Lower Bound | Upper Bound | |
| Interval | 0.01 | 5518.14 | 83 | 455,174 |
| Slope | −0.00658 | 0.00987 | −0.00005 | 0.00008 |
| t-value | −5.954 | 4.458 | −3.746 | 3.158 |
| p-value | 0.0000 | 0.0000 | 0.0001 | 0.0008 |
| 95% Fieller interval for extreme point | 1919.64 | 2645.46 | 127,166 | 228,959 |
| Extreme point | 2207.01 | 166,378 | ||
| Overall test for presence of a U-shape: | ||||
| t-value | 4.458 | 3.158 | ||
| p-value | 0.0000 | 0.0008 | ||
Table 8.
Estimation of Model 3.
| Parameter/ Statistic | Estimate/ Value | Robust Standard Error | t | p-Value | 95% Confidence Interval | |
|---|---|---|---|---|---|---|
| 32.99575 | 0.95722 | 34.470 | 0.0000 | 31.11622 | 34.87529 | |
| −5.20987 | 2.89335 | −1.801 | 0.0722 | −10.89106 | 0.47132 | |
| −7.38166 | 1.38027 | −5.348 | 0.0000 | −10.09188 | −4.67144 | |
| F R2 Adj. R2 N | 16.71 0.0609 0.0581 668 | 0.0000 | ||||
Table 9.
Estimation of Model 4.
| Parameter/ Statistic | Estimate/ Value | Robust Standard Error | t | p-Value | 95% Confidence Interval | |
|---|---|---|---|---|---|---|
| 33.79035 | 0.96079 | 35.170 | 0.0000 | 31.90381 | 35.67690 | |
| −32.78269 | 5.72044 | −5.731 | 0.0000 | −44.01503 | −21.55036 | |
| 45.03797 | 8.23089 | 5.472 | 0.0000 | 28.87626 | 61.19969 | |
| −7.80356 | 1.38186 | −5.647 | 0.0000 | −10.51690 | −5.09023 | |
| F R2 Adj. R2 N | 23.20 0.0984 0.09436 668 | 0.0000 | ||||
Table 10.
Results of quantile regression for Models 1–4.
| Model | Parameter/ Statistic | Estimate/Value | Standard Error | t | p-Value | 95% Confidence Interval | |
|---|---|---|---|---|---|---|---|
| 1 | Pseudo R2 | 28.73088 −12.92368 0.0062 | 0.26910 2.63402 | 106.77 −4.91 | 0.000 0.000 | 28.20248 −18.09566 | 29.25927 −7.75170 |
| 2 | Pseudo R2 | 29.13927 −43.90972 54.34324 0.0387 | 0.27025 5.70136 8.38019 | 107.82 −7.70 6.48 | 0.000 0.000 0.000 | 28.60862 −55.10455 37.88842 | 29.66992 −32.71489 70.79807 |
| 3 | Pseudo R2 | 31.83050 −12.02803 −4.66321 0.0148 | 0.92967 2.93054 1.37620 | 34.24 −4.10 −3.39 | 0.000 0.000 0.001 | 30.00506 −17.78224 −7.36542 | 33.65593 −6.27381 −1.96099 |
| 4 | Pseudo R2 | 33.10194 −48.73958 61.26484 −5.78178 0.0549 | 0.79879 5.71286 8.41097 1.16455 | 41.44 −8.53 7.28 −4.96 | 0.000 0.000 0.000 0.000 | 31.53348 −59.95702 44.74955 −8.06842 | 34.67040 −37.52214 77.78013 −3.49515 |
| N | 668 | ||||||
Disclaimer/Publisher’s Note: The statements, opinions and data contained in all publications are solely those of the individual author(s) and contributor(s) and not of MDPI and/or the editor(s). MDPI and/or the editor(s) disclaim responsibility for any injury to people or property resulting from any ideas, methods, instructions or products referred to in the content. |
© 2024 by the author. Licensee MDPI, Basel, Switzerland. This article is an open access article distributed under the terms and conditions of the Creative Commons Attribution (CC BY) license (https://creativecommons.org/licenses/by/4.0/).
Share and Cite
MDPI and ACS Style
Bolibok, P.M. Does Firm Size Matter for ESG Risk? Cross-Sectional Evidence from the Banking Industry. Sustainability 2024, 16, 679. https://doi.org/10.3390/su16020679
AMA Style
Bolibok PM. Does Firm Size Matter for ESG Risk? Cross-Sectional Evidence from the Banking Industry. Sustainability. 2024; 16(2):679. https://doi.org/10.3390/su16020679
Chicago/Turabian StyleBolibok, Piotr M. 2024. "Does Firm Size Matter for ESG Risk? Cross-Sectional Evidence from the Banking Industry" Sustainability 16, no. 2: 679. https://doi.org/10.3390/su16020679
Note that from the first issue of 2016, this journal uses article numbers instead of page numbers. See further details here.