Article

The High-Resolution Calibration of the Topographic Wetness Index Using PAZ Satellite Radar Data to Determine the Optimal Positions for the Placement of Smart Sustainable Drainage Systems (SuDS) in Urban Environments

by
Cristina Allende-Prieto
1,2,*,
Jorge Roces-García
1,3 and
Luis Ángel Sañudo-Fontaneda
1,3
1
Civil, Environmental and Geomatics Engineering Research Unit (CEGE), Polytechnic School of Mieres, University of Oviedo, 33003 Oviedo, Spain
2
Department of Mining Exploitation and Prospecting, Polytechnic School of Mieres, University of Oviedo, 33003 Oviedo, Spain
3
Department of Construction and Manufacturing Engineering, Polytechnic School of Mieres, University of Oviedo, 33003 Oviedo, Spain
*
Author to whom correspondence should be addressed.
Sustainability 2024, 16(2), 598; https://doi.org/10.3390/su16020598
Submission received: 7 December 2023 / Revised: 28 December 2023 / Accepted: 4 January 2024 / Published: 10 January 2024

Abstract

:
This study addresses the growing interest in utilizing remote sensing tools for locating sustainable drainage systems (SuDS) in urban environments. SuDS, recognized as Nature-based Solutions (NbS), play a crucial role in enhancing urban resilience against climate change. This study focuses on the calibration process required to establish a correlation between the Topographic Wetness Index (TWI), derived from high-precision digital elevation models (DEMs), and soil moisture (SM) data obtained from satellite imaging. This calibration serves as a method to optimize the placement of sustainable urban drainage system vegetated techniques in urban areas. This study leveraged the exceptional resolution of PAZ satellite radar data to effectively detect variations in SM, particularly in grass-type vegetated land. The sensitivity of the X-band radar signal to moisture levels and changes in ground roughness proved valuable in tracking SM dynamics. The core of the study involved deriving the TWI from a high-resolution digital terrain model (DTM). The correlation between the TWI and SM values demonstrates robustness, with an R2 value of 0.77. These findings significantly advance the calibration of TWI values with SM measurements, enhancing their practicality in identifying areas prone to water accumulation. The study’s outcomes provide valuable insights for guiding the strategic placement of SuDS in urban environments, contributing to the effective management of water-related challenges in the face of urbanization and climate change.

1. Introduction

Sustainable drainage systems (SuDS) have been adopted as the main Green Stormwater Infrastructure (GSI) when considering the Nature-based Solutions (NbS) at the core of urban regenerative development [1]. Strategic urban planning is key to incorporating green urban approaches for resilient city designs where GSIs are core [2]. Thus, there is a growing interest in optimizing the location of these techniques to increase their synergetic impact on the holistic water cycle and the creation of better living spaces in urban environments. Previous studies, such as [3,4,5], have paved the way for further research in this area, focusing on the development of multicriteria frameworks and optimal locations. Additionally, satellite imagery has been successfully utilized in the past to help identify potential locations to implement SuDS. Its combination with geographical information systems (GISs) has been explored with green roofs [6].
Satellite imagery has also been used to identify land use, aiding in the parametrization of SuDS in the U.S. Environmental Protection Agency’s Storm Water Management Model (SWMM) [7,8]. Moreover, remote sensing techniques have been pinpointed by recent studies as key drivers for future SuDS monitoring [9], opening a new field of application for further research in exploratory methods based on high-resolution satellite techniques.
It is necessary to consider holistic approaches, including cost–benefit analyses through evaluation, classification, and selection studies of the most suitable infrastructures to be implemented in the cities of the future [10,11]. With this aim, the development and optimization of design and implementation decisions and strategies related to water management infrastructures such as SuDS is fundamental, helping in adapting cities to climate change. In this context, multicriteria schemes are used as tools for planning and decision making, and are utilized to select the most appropriate strategies and effective solutions [12,13,14].
The selection of criteria involves evaluating the terrain’s suitability through a set of analyses that allow for the modeling of the hydrological characteristics of the study area, identifying zones most prone to flooding, as well as other drainage problems [15]. GISs are used for collecting, storing, manipulating, analyzing, and presenting geographic data [16]. The integration of GIS and terrain modeling and analysis, coupled with multicriteria decision analysis (MCDA), has garnered significant interest in recent years [17,18,19,20]. It can offer valuable insights for decision making in urban planning by identifying areas that require special attention due to natural hazards such as flooding. GISs can also determine the efficiency factors of urban drainage systems and the size of each sub-catchment, aiding in calculating the volumes of runoff to be managed by constructed urban drainage systems [21,22]. Generally, when mapping the susceptibility of urban areas to flooding, the most common factors considered in terrain analysis are elevation, slope, land use, distance from the river, or distance from the channel, among others [23,24]. However, there are several challenges related to the use of terrain analysis for urban planning decision making, with one of them being the uncertainty associated with the data used in terrain analysis. The accuracy of these data can be affected by various factors, such as the quality of the data source or the resolution of the technique utilized to register and gather the data [25].
The Topographic Wetness Index (TWI), derived from high-resolution digital elevation models (DEMs) [26,27], is another parameter from terrain analysis used to identify areas prone to saturated land surfaces and urban flooding [28]. The TWI assesses relative terrain wetness based on slope and upstream contributing drainage area per width unit, making it a useful parameter for comprehending topographical impacts on hydrological processes and flood-risk-based land use planning [29]. This role is instrumental in strategically implementing sustainable urban drainage systems (SuDS), especially in urban areas with soil impermeability issues that could lead to an increased flood risk. The information derived from the TWI significantly influences decision making in the implementation of SuDS, guiding their strategic placement and design optimization to address specific drainage challenges and mitigate risks associated with floods and water accumulation [30].
A high-resolution DEM can be derived from LiDAR point-cloud data by removing surface features and sampling ground elevation in uniform increments to generate a bare earth model [31]. LiDAR data are applicable for creating DEMs in hydrological applications at a basin scale [32,33,34]. Collected from airborne devices, LiDAR data are employed to detect reflections of a pulsed laser beam, recording reflections as millions of individual points that represent the 3D positions of surface objects, including buildings, vegetation, and the ground [35].
Understanding soil moisture redistribution and infiltration dynamics is crucial for comprehending the hydrological behavior of urban drainage systems [36]. Soil moisture estimations based on remote sensing can analyze spatio-temporal dynamics and distribution across various scales [37,38,39], with microwave remote sensing offering higher accuracy [40]. Recent and comprehensive reviews on the application of optical and thermal remote sensing for SM estimation emphasize the importance of these methods in addressing the limitations of low-resolution large-scale remote sensing products [41]. This approach provides a unique opportunity for the direct observation of soil moisture, making it an essential method for monitoring soil moisture over large areas [42].
The PAZ is a next-generation X-band Synthetic Aperture Radar (SAR) satellite sensor launched in February 2018 by Hisdesat [43], Spain. It is equipped to capture high-resolution images (1.25 m) and offers short revisit periods of 11 days. The PAZ mission is part of the Spanish National Earth Observation Satellite Program (PNOTS) and is a joint effort between the Spanish Ministries of Defense and Industry [44]. PAZ satellite radar data have been employed to detect SM, due to the excellent resolution of these data. The X-band radar signal is sensitive enough to detect changes in SM and monitor it across grass plots [9].
The primary objective of this study was to enhance the identification of optimal locations for vegetated sustainable urban drainage system techniques in urban areas utilizing the Topographic Wetness Index (TWI) derived from high-precision digital elevation models (DEMs). The TWI helps identify areas susceptible to water accumulation, guiding the strategic placement of SuDS in urban environments. To establish the reliability of the TWI, we calibrated it with soil moisture (SM) measurements obtained through high-resolution satellite radar data from the PAZ satellite. This approach effectively captures variations in SM, particularly in grassy areas. Our study presents a methodological foundation, setting the stage for future developments in design and implementation strategies for SuDS. We present a case study in the city of Gijón, located in northwestern Spain, where the use of grass-vegetated surfaces aligns with the prevalent practice in various green implementations involving SuDS.
Through the calibration of TWI values with soil moisture measurements, this study offers a valuable tool for optimizing the placement of sustainable drainage systems [45]. This contributes significantly to mitigating the impact of climate change in urban areas [46,47,48,49]. The innovative integration of high-resolution digital terrain models and radar-based soil moisture values ensures the accuracy of the TWI, even though the calibration is currently limited to a specific study area. In future, the development of distinct linear models tailored to various areas could enhance the coverage and effectiveness of implementation strategies involving SuDS.
We acknowledge certain limitations in this study that should be considered when interpreting our results. These limitations include the sensitivity of the X-band radar signal and its limited depth of penetration (approximately 3 cm into the surface) [50,51,52,53]. This shallow penetration capability primarily captures moisture information from the uppermost layer of the soil. Additionally, factors such as terrain characteristics and surface roughness can influence the accuracy of results [54]. While the calibration of the Topographic Wetness Index (TWI) with soil moisture measurements shows promise, it is vital to recognize the inherent limitations of the data sources and technology employed. These limitations, particularly the shallow penetration depth of the radar signal, may affect the accuracy of soil moisture assessments, especially in areas with varying soil properties and moisture distributions at greater depths.

2. Materials and Methods
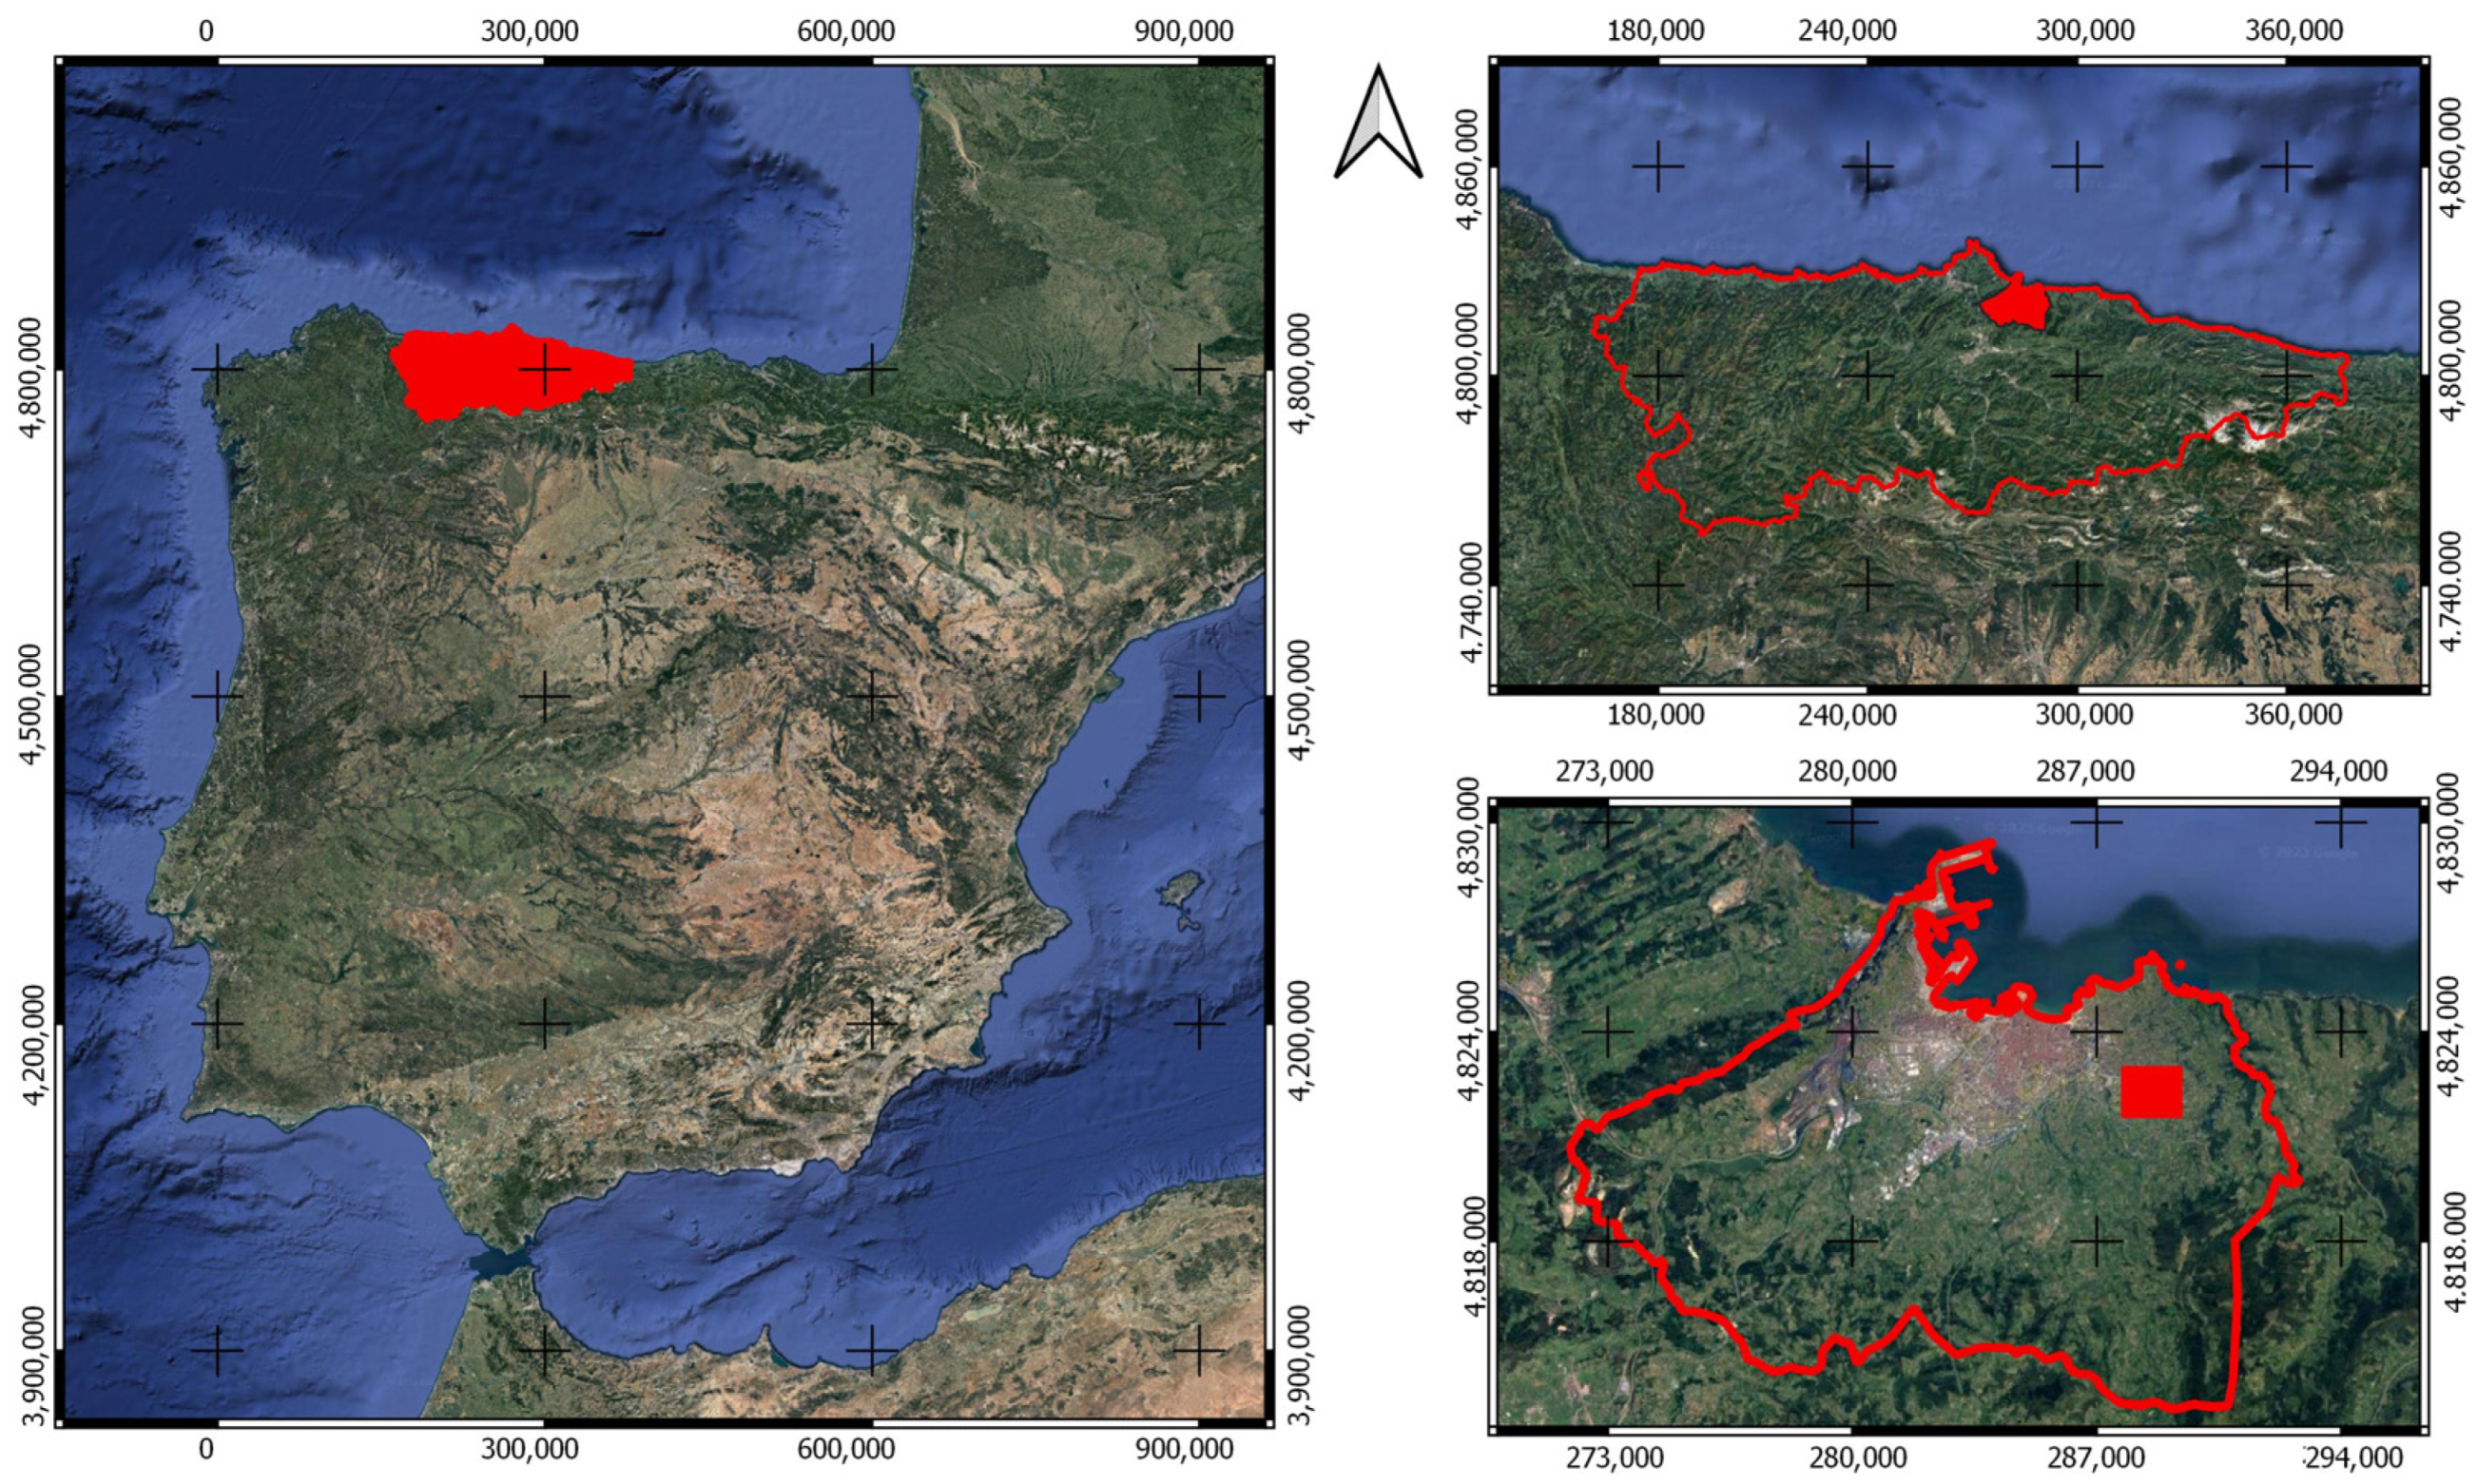
2.1. Study Area

Gijón, the largest city and a prominent urban feature within the Central Metropolitan Area of the northwestern region of the Principality of Asturias, Spain, boasts a coastal setting and holds a Cfb climate classification per the Köppen–Geiger system [55]. Marked by warm temperatures, high humidity, and a balmy summer season, the city maintains an average temperature of 14 °C and receives an annual rainfall volume of approximately 1000 mm.
The selection of this specific location as our study area was based on its alignment with a referenced article which served as the foundation for choosing the empirical model. The cited study focused on the eastern side of the city council, which aligns with our study area, ensuring geographical consistency. Figure 1 illustrates this consistency, enabling a meaningful comparison between soil moisture field measurements and backscatter values from PAZ satellite SAR images.

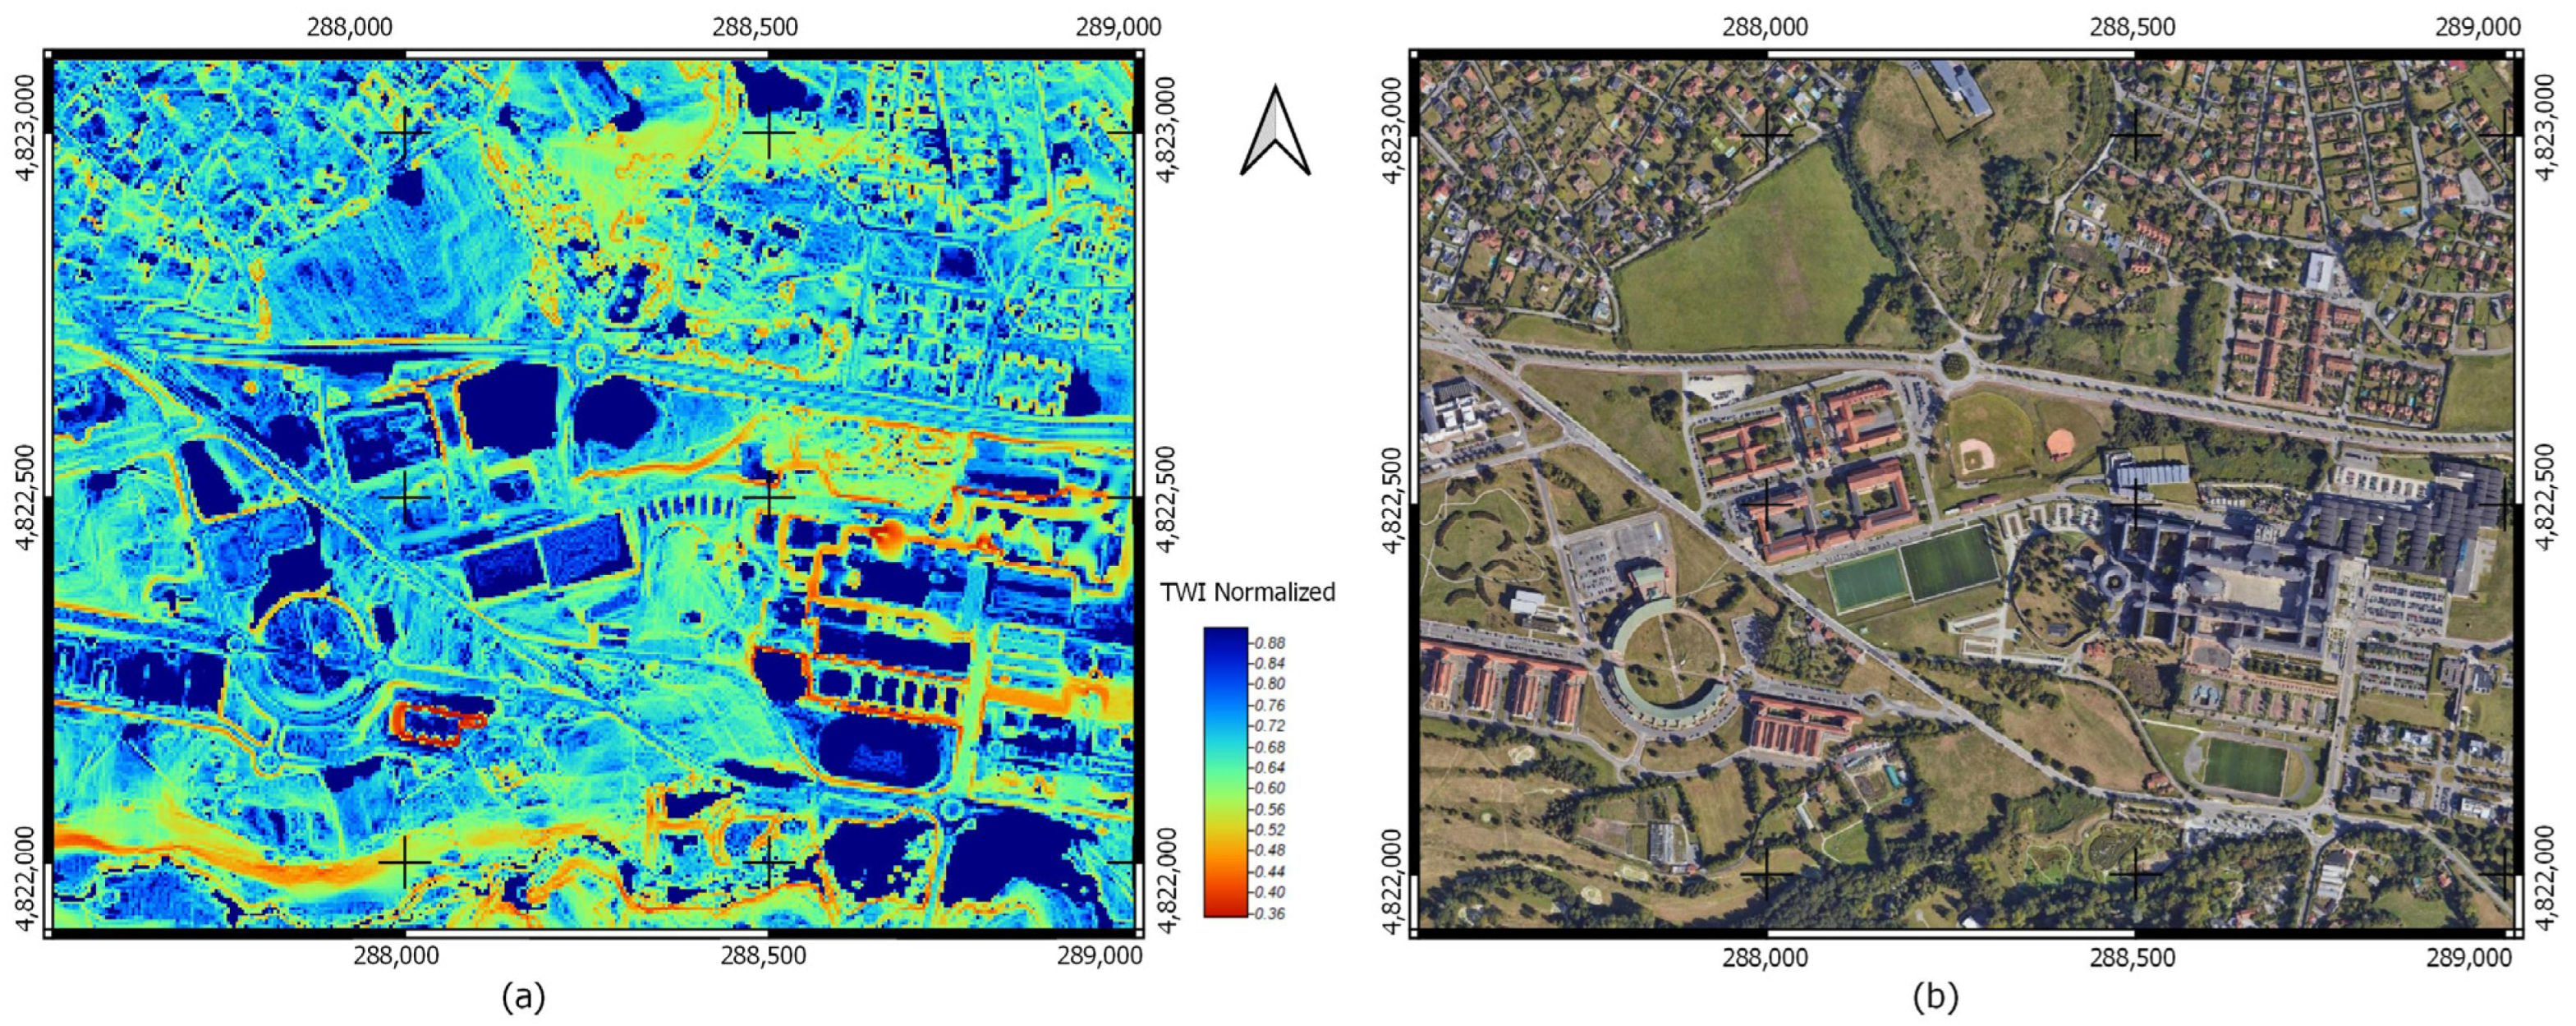
2.2. Topographic Wetness Index (TWI)

The Topographic Wetness Index (TWI), a dimensionless parameter representing the local upslope area draining through a specific point-per-contour unit length divided by the local slope in radians, was computed using various flow-routing, slope, and contributing area algorithms. The calculations were performed on a Terrain Digital Model with a 2 m resolution, generated by the National Geographic Institute (IGN) from LiDAR data, providing a high-resolution representation of the terrain. To ensure accuracy, a digital terrain model (DTM) with a 2 m resolution, also generated by IGN from LiDAR data, was utilized. This LiDAR data facilitated a detailed representation of the terrain, with the removal of land depressions and flat pixels for precise calculations.
The Topographic Wetness Index (TWI) serves as an indicator of the relative wetness or moisture content of the terrain and is dependent on essential topographic parameters such as slope and contributing area. It was computed using the System for Automated Geoscientific Analysis (SAGA) GIS software 7.9.1 Version [56], an open-source tool with a diverse set of tools for geospatial data analysis and processing. Parameters such as Total Catchment Area (TCA), Flow Width (FW), and Slope (S) were calculated for each pixel using the following equation (Equation (1)):
T W I = l n T C A F W tan ( S )
When working with the Topographic Wetness Index (TWI), it is common to normalize the TWI values to a specific range for easier interpretation and comparison. Normalization helps to standardize the TWI values across different datasets or study areas. The formula generally involves subtracting the minimum TWI value and dividing by the range of TWI values, as shown in Equation (2):
T W I n = T W I min ( T W I ) max T W I min ( T W I )
The normalized TWI values ranged from 0 to −1, as shown in Figure 2. This normalization facilitates the analysis, visualization, and identification of areas with higher or lower wetness levels based on the standardized range.

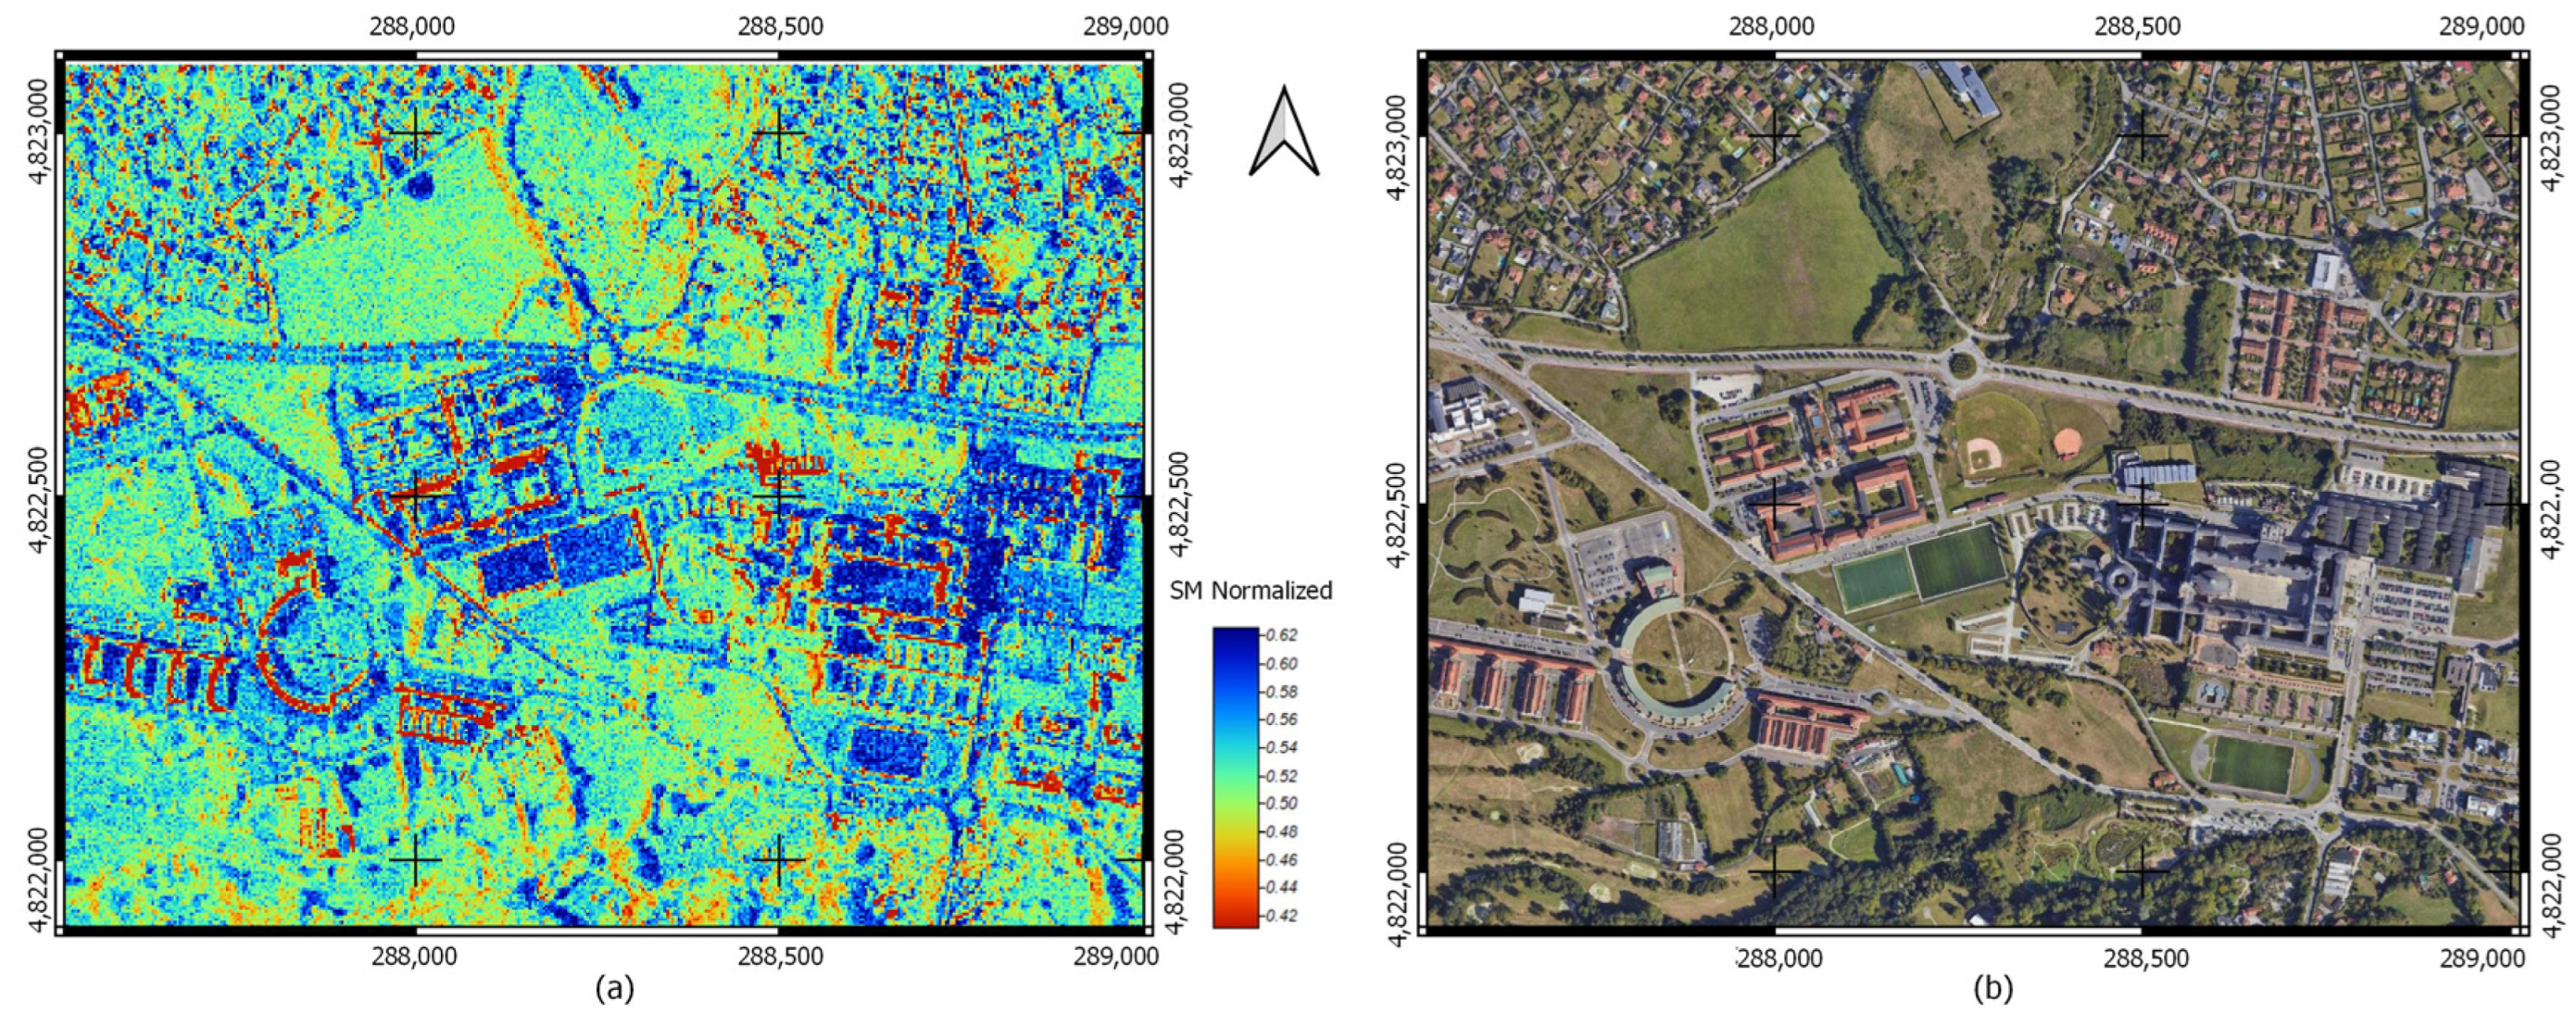
2.3. Soil Moisture (SM) from Satellite Data

Measuring SM from satellite data is an important remote sensing technique that provides valuable information about the moisture content in the top layer of the soil. Several missions have been specifically designed to measure SM using satellites, and they utilize different microwave frequencies to capture the SM signal.
Microwave radiation is sensitive to the dielectric properties of materials, including those that form the soil. When microwaves interact with the Earth’s surface, they penetrate the top layer of the soil. Thus, the amount of energy absorbed and reflected is affected by the soil moisture content.
The use of PAZ satellite radar data, due to their high-resolution capacity, allows for the application of remote sensing techniques to be carried out at a project scale in order to measure soil moisture. The X-band radar signal is sensitive at a level where variations in soil moisture can be detected, and it can be used to monitor grass-vegetated surfaces from a zone with homogeneous surface roughness and soil characteristics [9].
The pre-processing steps involved in the analysis included the sequential utilization of radiometric calibration and filtering techniques using open-source Sentinel Application Platform (SNAP) 9.0 Version [57] software. Radiometric calibration was chosen as the main method for this investigation to convert the image’s amplitude values into reflectivity values, enabling further analysis and interpretations. Subsequently, the radar-backscattering coefficient (σ0) was calculated as the conventional metric representing the intensity of radar signals reflected from the surface. The σ0 value exhibits notable variations depending on factors such as the incidence angle, wavelength, polarization, and the scattering properties of the surface itself. The pixel backscatter coefficient was transformed into sigma naught in decibel units (dB) using Equation (3).
σ dB = 10 · l o g 10 · σ 0
The acquisition of data with a temporal resolution of 11 days from the PAZ satellite spanned from 21 September 2020, to 26 July 2021. The data were registered using single polarization VV (vertical transmit, vertical receive) and had nearly constant incidence angles ranging from 53.8° to 53.95° in an ascending orbit. The acquired data were projected onto the WGS84 reference ellipsoid using the UTM projection. To account for terrain-induced distortions, an external DEM was used to correct the images. As a result, the geocoded products (ECC) achieved a high level of accuracy, with a 1.25 m pixel size.
The backscattering coefficient values of each pixel in the image were converted into SM values by means of the statistical model that endorsed the highest correlation in the study [9]. This model included the variables σdB and temperature (T0) for an adjusted R2 of 0.66 and a correlation coefficient of 0.81. The specific equation representing this model is provided below (Equation (4)).
S M = 145.178 + 3.5196 · σ d B 0 3.2474 · T 0
The normalized SM values ranged from 0 to −1, as shown in Figure 3:

2.4. Meteorological Data
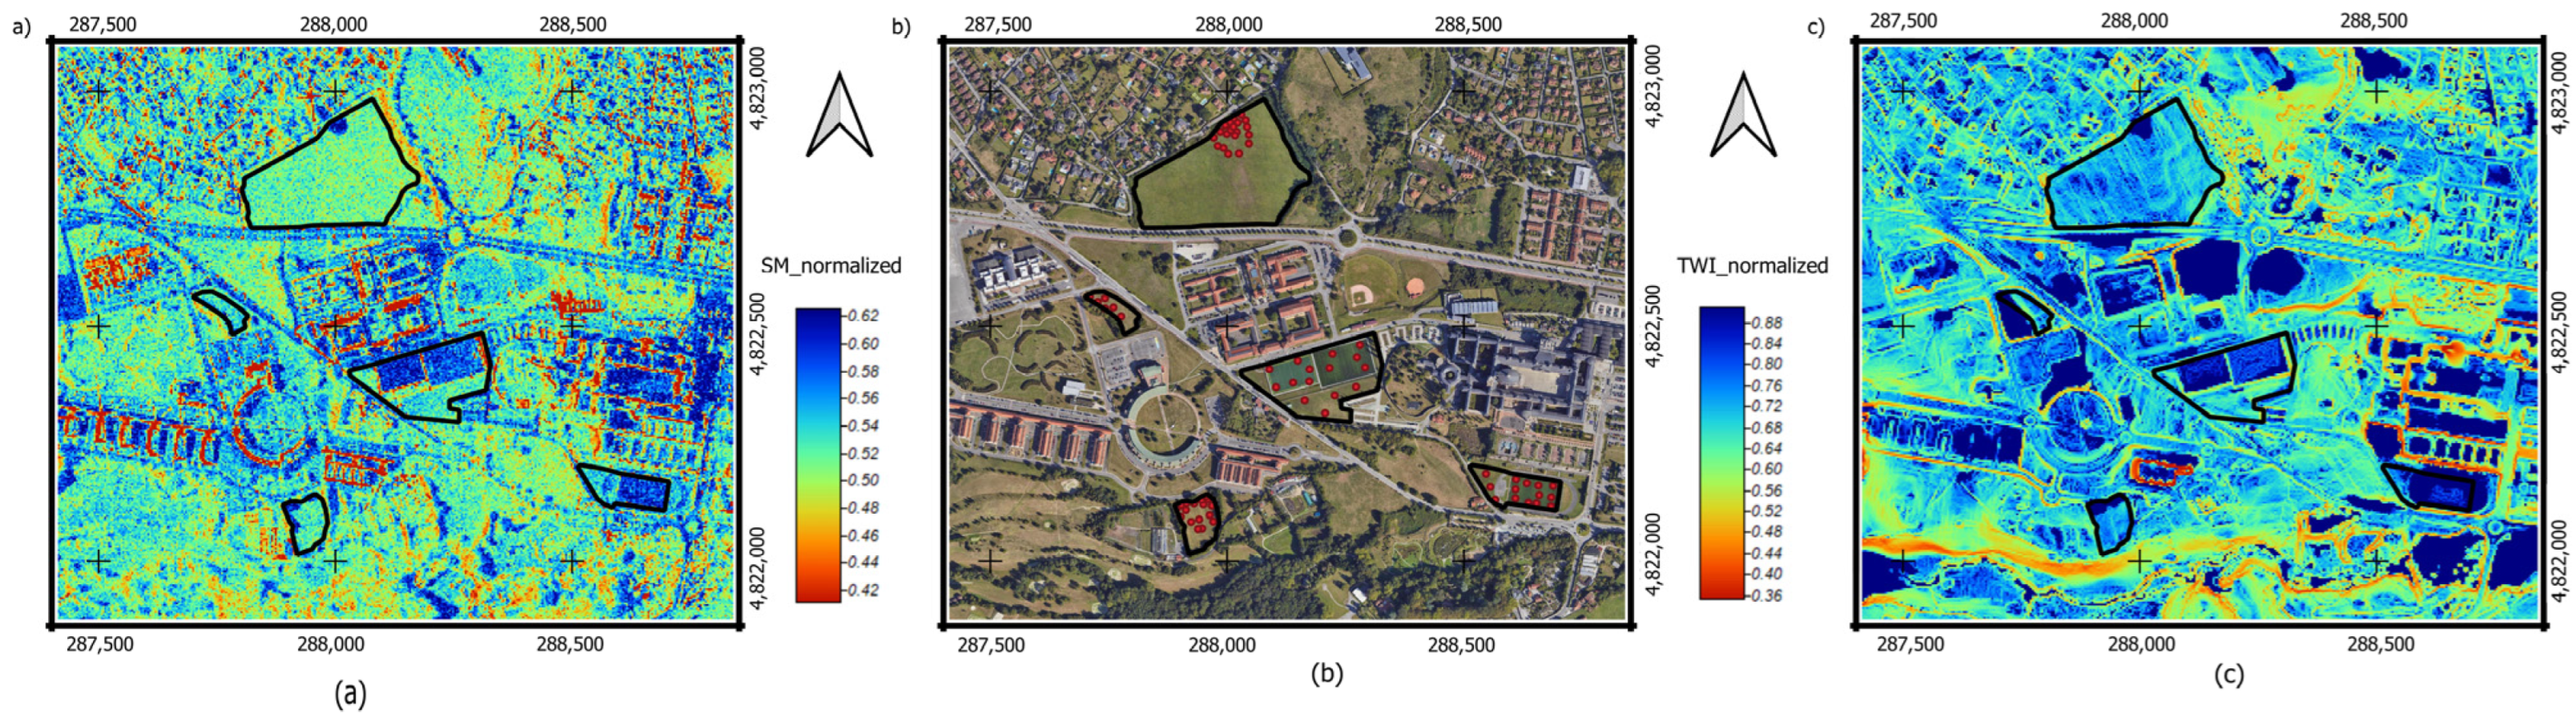
In order to calibrate the TWI values obtained from the previous process, the rainfall and temperature measurements from the nearest meteorological station included in the Spanish Meteorological Agency (AEMET) network and located at the Polytechnic School of Engineering of Gijón (AEMET’s code number 1207U) were utilized. These values are graphically depicted in the referenced article from which the empirical model used in this study is derived.
An image captured on 7 December 2020 was the image chosen for this study. The choice of this specific image, displaying the highest soil moisture values, was based on considerations of preceding meteorological conditions. Following a six-day consecutive rainfall event with an average recorded precipitation of 26 mm, this specific date serves as a critical moment to capture the soil’s response to intense rainfall.

2.5. Study Plots

The study was conducted in a set of 5 plots within the same study area in which the statistical model described in Equation (4) was derived. These plots have similar surface roughness and homogeneous characteristics. Figure 4 illustrates the normalized Soil Moisture (SM), the latest orthophoto available from the National Aerial Orthophotography Plan of the National Geographic Institute of Spain, and the Topographic Wetness Index (TWI) values for two of these plots.
The selection of 72 points from within these plots was conducted through random sampling. These points were used to determine the normalized SM and TWI values.

3. Results and Analysis

Table 1 shows the descriptive statistical parameters from the sampled points: mean, standard deviation, and percentiles (0, 25, 50, 75, and 100).
The resultant linear model correlating the TWI and SM presented an R2 value of 0.77 and a Root Mean Squared Error (RMSE) of 0.37. Figure 5 shows a scatter plot representation of this model.
In the context of linear regression, ensuring the accuracy and dependability of analysis results hinges upon the adherence to two pivotal assumptions: homoscedasticity and the normal distribution of residuals. Normality evaluation refers to the assumption that the errors are distributed according to a Gaussian distribution, and homoscedasticity refers to the assumption that the variance of the errors is constant. These assumptions were subjected to validation through the Kolmogorov–Smirnov and Breusch–Pagan tests, respectively. The linear model demonstrated conformity to both assumptions, as evidenced by p-values exceeding 0.05. The results of the normality test are graphically depicted in Figure 6, along with a scatter plot of residuals and predicted values.
In the context of our analysis, focusing on soil moisture (SM) and the Topographic Wetness Index (TWI), our regression model demonstrates robustness, as evidenced by both the scatter plot of residuals and the Quantile-Quantile (Q-Q) plot.
The scatter plot of residuals reveals a favorable pattern, showcasing random dispersion around zero. This pattern indicates the proficiency of our model in capturing the intricate relationship between soil moisture and the Topographic Wetness Index. The uniform scattering of residuals, without discernible trends or curvatures, reaffirms the model’s adherence to key assumptions, including linearity and constant variance. The absence of pronounced patterns within the residuals further substantiates the model’s suitability for our dataset, assuring alignment with our analytical objectives and the absence of unaccounted variables or nonlinear relationships.
Similarly, the Q-Q plot illustrates the notable alignment of data distribution with the theoretical normal distribution. The points closely follow the diagonal reference line, signifying a remarkable conformity to normality. This alignment supports a fundamental assumption in linear regression, enabling the application of parametric statistical tests and confidence intervals in our analysis. The consistent adherence to a normal distribution enhances the reliability and interpretability of our statistical inferences, reinforcing the overall validity and trustworthiness of our regression analysis.
In summary, the alignment of both the scatter plot of residuals and the Q-Q plot with their respective reference lines underscores the robustness of our model, assuring adherence to fundamental statistical assumptions. This contributed to the sound statistical inferences in our analysis of SM and the TWI.

4. Discussion

The X-band radar image’s backscatter coefficient experiences the combined influence of moisture and ground roughness. Given its shallow penetration capability (approximately 3 cm), it exhibits remarkable sensitivity to the presence of vegetation. The TWI is derived from a high-resolution DTM previously subjected to a filtering process that eliminates buildings, media, and tall vegetation. Consequently, a valid comparison between TWI and SM values can only be drawn within areas or plots without buildings and similar vegetation types. For this study, sample points were selected from plots free of medium and high vegetation and characterized by a comparable surface roughness, akin to those investigated in [9], which established the linear relationship between the backscatter coefficient and SM with a correlation of 0.88 within the study area, which implies that SM values are indirect values. The correlation between TWI and SM values can be considered high, with an R2 value of 0.77, exhibiting a strong relationship despite these limitations.
The results indicate that the lowest and highest TWI values correspondingly signify regions at the greatest and lowest risk of flooding. The minimum and maximum TWI values align with the calculated minimum and maximum SM values. Conversely, the intermediary SM values are notably impacted by the radar signal’s high sensitivity stemming from its configuration and terrain characteristics. Consequently, these intermediary SM values exhibit a comparatively diminished correlation with the computed TWI values.
This study provides a baseline model, based upon the TWI, to monitor and analyze SM content using remote sensing tools in grassed surfaces under a Cfb climate and with the rainfall and temperature patterns of Gijón, though the model is applicable to other cities in the European Atlantic Arc. SM is a key driver for the design and operation of SuDS, affecting physical processes such as evapotranspiration [36] and filtration in vegetated-based SuDS, as well as infiltration to the subjacent ground when designed for that purpose. SM also influences water volume retention and wider hydrological modeling [58] and also has an impact on the growth and maintenance of plant species.
This study is expected to greatly influence implementation strategies for SuDS, offering the possibility to study large areas of an urban environment where green SuDS could be incorporated and informing decision makers and designers about the SM characteristics of the study area.
The results of this study demonstrate innovation in identifying optimal locations for sustainable urban drainage systems (SuDS) in urban environments using the Topographic Wetness Index (TWI) and its calibration with soil moisture (SM) measurements through high-resolution satellite technology. This novel approach represents significant advancements in sustainable urban drainage system planning and holds crucial implications for water management in flood-prone urban areas.

5. Conclusions

Crucial to our study, our robust linear regression analysis played a pivotal role in calibrating the Topographic Wetness Index (TWI), assigning significant weight to the TWI in planning and decision making processes for the optimal placement of sustainable drainage systems (SuDS). This calibration process consolidates the usefulness and efficacy of the TWI, enabling the identification of zones prone to water accumulation. Consequently, it becomes a decisive criterion for the strategic placement of sustainable drainage systems—indispensable tools in mitigating the repercussions of climate change in urban areas. The TWI values are derived from a high-resolution digital terrain model generated through LiDAR technology. Simultaneously, soil moisture values are computed from the backscatter values of high-resolution radar images. This calculation employs a linear model to establish correlations between these values and various field measurements, including temperature.
The calibration process is confined to a particular study area, preventing its extrapolation to different regions. To establish comparable SM values, the formulation of distinct models tailored to each area would be imperative. Future research could encompass the calculation of distinct linear models for various areas, facilitating the strategic implementation of SuDS. By establishing interrelations among these models, a broader scope of calculations can be achieved to enhance coverage and effectiveness.
The boundaries of the outreach of this study are mainly associated with the revisit periodicity of the satellite, which provides images every 11 days, which is a shorter time frame than that of other satellites but still a limitation for the short-term SM monitoring of sustainable urban drainage system techniques and its coupling with storm events. However, the proposed method could be of great interest for its application in MCDA, incorporating remote sensing techniques at a central position to develop accurate decision-making tools using design variables such as SM.
The determination of the Topographic Wetness Index (TWI) in urban environments poses unique challenges, necessitating precise data for high-resolution digital surface models that account for influential urban elements. Our approach underscores the TWI’s substantial contribution as an additional parameter in multicriteria analyses, guiding the optimal placement of vegetative sustainable drainage systems in urban settings. The inclusion of critical factors such as permeability, land use, pavement type, and the urban drainage network is crucial for enhancing the accuracy of calculations in highly urbanized areas and allows for adaptability to diverse urban conditions.
Given the scope of our investigation and the findings gleaned from it, it would be desirable to continue this line of research in the near future by studying dry and bioretention swales using grassed surfaces or low-growing vegetation, as well as extensive green roofs using a homogeneous planting scheme, which are the closest sustainable urban drainage system techniques in which this methodology could be satisfactorily applied.

Author Contributions

Conceptualization, C.A.-P.; Methodology, C.A.-P.; Validation, C.A.-P.; Formal analysis, C.A.-P.; Investigation, C.A.-P.; Resources, C.A.-P., J.R.-G. and L.Á.S.-F.; Data curation, C.A.-P.; Writing—original draft, C.A.-P., J.R.-G. and L.Á.S.-F.; Writing—review & editing, C.A.-P., J.R.-G. and L.Á.S.-F.; Visualization, C.A.-P. and J.R.-G.; Supervision, L.Á.S.-F. All authors have read and agreed to the published version of the manuscript.

Funding

This research was funded by The University of Oviedo project with reference PAPI-23-GR-COM-05.

Institutional Review Board Statement

Not applicable.

Informed Consent Statement

Not applicable.

Data Availability Statement

Data are contained within the article.

Acknowledgments

The authors would like to thank the INTA-PAZ Science Team for providing the PAZ data in the framework of the research project with reference AO-001-055.

Conflicts of Interest

The authors declare no conflict of interest.

References

  1. Sañudo-Fontaneda, L.A.; Roces-García, J.; Coupe, S.J.; Barrios-Crespo, E.; Rey-Mahía, C.; Álvarez-Rabanal, F.P.; Lashford, C. Descriptive Analysis of the Performance of a Vegetated Swale through Long-Term Hydrological Monitoring: A Case Study from Coventry, UK. Water 2020, 12, 2781. [Google Scholar] [CrossRef]
  2. Sañudo Fontaneda, L.Á.; Anderson, A.R.; Hunt, W.F. Green Streets: The Opportunity to Design Resilient Stormwater Management in the Cities of the Future. In Stormwater: Sources, Monitoring and Management; Nova Science Publishers, Inc.: Hauppauge, NY, USA, 2019; pp. 77–116. [Google Scholar]
  3. Ariza, S.L.J.; Martínez, J.A.; Muñoz, A.F.; Quijano, J.P.; Rodríguez, J.P.; Camacho, L.A.; Díaz-Granados, M. A Multicriteria Planning Framework to Locate and Select Sustainable Urban Drainage Systems (SUDS) in Consolidated Urban Areas. Sustainability 2019, 11, 2312. [Google Scholar] [CrossRef]
  4. Suárez-Inclán, A.M.; Allende-Prieto, C.; Roces-García, J.; Rodríguez-Sánchez, J.P.; Sañudo-Fontaneda, L.A.; Rey-Mahía, C.; Álvarez-Rabanal, F.P. Development of a Multicriteria Scheme for the Identification of Strategic Areas for SUDS Implementation: A Case Study from Gijón, Spain. Sustainability 2022, 14, 2877. [Google Scholar] [CrossRef]
  5. Ferrans, P.; Reyes-Silva, J.D.; Krebs, P.; Temprano, J. Flood Management with SUDS: A Simulation–Optimization Framework. Water 2023, 15, 426. [Google Scholar] [CrossRef]
  6. Miller, K.; Krivtsov, V.; Cohen, L. Inventory of Green Roofs within Edinburgh, Scotland. In Proceedings of the CIGOS 2021, Emerging Technologies and Applications for Green Infrastructure; Ha-Minh, C., Tang, A.M., Bui, T.Q., Vu, X.H., Huynh, D.V.K., Eds.; Springer Nature: Singapore, 2022; pp. 1345–1353. [Google Scholar]
  7. Randall, M.; Sun, F.; Zhang, Y.; Jensen, M.B. Evaluating Sponge City Volume Capture Ratio at the Catchment Scale Using SWMM. J. Environ. Manag. 2019, 246, 745–757. [Google Scholar] [CrossRef]
  8. Khin, M.M.L.; Shaker, A.; Joksimovic, D.; Yan, W.Y. The Use of WorldView-2 Satellite Imagery to Model Urban Drainage System with Low Impact Development (LID) Techniques. Geocarto Int. 2016, 31, 92–108. [Google Scholar] [CrossRef]
  9. Allende-Prieto, C.; Roces-García, J.; Recondo, C.; Sañudo-Fontaneda, L.A.; González-Moradas, M.R. An Exploratory Methodology Based on High Resolution Remote Sensing Techniques for Soil Moisture Determination with Prospective Applications in Vegetative SuDS. Urban Water J. 2023, 20, 1006–1020. [Google Scholar] [CrossRef]
  10. Cantelmi, R.; Di Gravio, G.; Patriarca, R. Reviewing Qualitative Research Approaches in the Context of Critical Infrastructure Resilience. Environ. Syst. Decis. 2021, 41, 341–376. [Google Scholar] [CrossRef]
  11. Bibri, S.E.; Krogstie, J.; Kärrholm, M. Compact City Planning and Development: Emerging Practices and Strategies for Achieving the Goals of Sustainability. Dev. Built Environ. 2020, 4, 100021. [Google Scholar] [CrossRef]
  12. Scholes, L.; Ellis, B.; Revitt, M. The Development of Multi-Criteria Analysis for the Evaluation of Urban Surface Drainage Options. 2004. Available online: https://www.researchgate.net/publication/265819596 (accessed on 9 November 2023).
  13. Chow, J.-f.; Savić, D.; Fortune, D.; Kapelan, Z.; Mebrate, N. Using a Systematic, Multi-Criteria Decision Support Framework to Evaluate Sustainable Drainage Designs. Procedia Eng. 2014, 70, 343–352. [Google Scholar] [CrossRef]
  14. Ruangpan, L.; Vojinovic, Z.; Plavšić, J.; Doong, D.-J.; Bahlmann, T.; Alves, A.; Tseng, L.-H.; Randelović, A.; Todorović, A.; Kocic, Z.; et al. Incorporating Stakeholders’ Preferences into a Multi-Criteria Framework for Planning Large-Scale Nature-Based Solutions. Ambio 2021, 50, 1514–1531. [Google Scholar] [CrossRef]
  15. Abdelkarim, A.; Al-Alola, S.S.; Alogayell, H.M.; Mohamed, S.A.; Alkadi, I.I.; Ismail, I.Y. Integration of GIS-Based Multicriteria Decision Analysis and Analytic Hierarchy Process to Assess Flood Hazard on the Al-Shamal Train Pathway in Al-Qurayyat Region, Kingdom of Saudi Arabia. Water 2020, 12, 1702. [Google Scholar] [CrossRef]
  16. Chen, C.; Liang, J.; Yang, G.; Sun, W. Spatio-Temporal Distribution of Harmful Algal Blooms and Their Correlations with Marine Hydrological Elements in Offshore Areas, China. Ocean. Coast. Manag. 2023, 238, 106554. [Google Scholar] [CrossRef]
  17. Malczewski, J. GIS-based Multicriteria Decision Analysis: A Survey of the Literature. Int. J. Geogr. Inf. Sci. 2006, 20, 703–726. [Google Scholar] [CrossRef]
  18. Munn, K.; Dragićević, S.; Feick, R. Spatial Decision-Making for Dense Built Environments: The Logic Scoring of Preference Method for 3D Suitability Analysis. Land 2022, 11, 443. [Google Scholar] [CrossRef]
  19. Chukwuocha, A.; Ngozi, A.C. Geographic Information Systems Based Urban Drainage Efficiency Factors. In Proceedings of the FIG Working Week 2015—From the Wisdom of the Ages to the Challenges of the Modern World, Sofia, Bulgaria, 17–21 May 2015. [Google Scholar]
  20. Hagos, Y.G.; Andualem, T.G.; Yibeltal, M.; Mengie, M.A. Flood Hazard Assessment and Mapping Using GIS Integrated with Multi-Criteria Decision Analysis in Upper Awash River Basin, Ethiopia. Appl. Water Sci. 2022, 12, 148. [Google Scholar] [CrossRef]
  21. Muthanna, T.M.; Sivertsen, E.; Kliewer, D.; Jotta, L. Coupling Field Observations and Geographical Information System (GIS)-Based Analysis for Improved Sustainable Urban Drainage Systems (SUDS) Performance. Sustainability 2018, 10, 4683. [Google Scholar] [CrossRef]
  22. Sokolovskaya, N.; Vaughn, C.; Jahangiri, H.; Smith, V.; Wadzuk, B.; Ebrahimian, A.; Nyquist, J. Variability of Urban Drainage Area Delineation and Runoff Calculation with Topographic Resolution and Rainfall Volume. Water Sci. Technol. 2023, 87, 1349–1366. [Google Scholar] [CrossRef]
  23. Rahmati, O.; Darabi, H.; Panahi, M.; Kalantari, Z.; Naghibi, S.A. Development of Novel Hybridized Models for Urban Flood Susceptibility Mapping. Sci. Rep. 2020, 10, 12937. [Google Scholar] [CrossRef]
  24. Wang, Y.; Li, C.; Liu, M.; Cui, Q.; Wang, H.; Lv, J.; Li, B.; Xiong, Z.; Hu, Y. Spatial Characteristics and Driving Factors of Urban Flooding in Chinese Megacities. J. Hydrol. 2022, 613, 128464. [Google Scholar] [CrossRef]
  25. Puppo, E. Multi-Resolution Terrain Modeling. In Encyclopedia of Database Systems; Liu, L., Özsu, M.T., Eds.; Springer: Boston, MA, USA, 2009; pp. 1853–1857. ISBN 978-0-387-39940-9. [Google Scholar]
  26. Hojati, M.; Mokarram, M. Determination of a Topographic Wetness Index Using High Resolution Digital Elevation Models. Eur. J. Geogr. 2016, 7, 41–52. [Google Scholar]
  27. Ma, J.; Lin, G.; Chen, J.; Yang, L. An Improved Topographic Wetness Index Considering Topographic Position. In Proceedings of the 2010 18th International Conference on Geoinformatics, Beijing, China, 18–20 June 2010; pp. 1–4. [Google Scholar]
  28. Ballerine, C. Topographic Wetness Index Urban Flooding Awareness Act Action Support, Will & DuPage Counties, Illinois; ISWS Contract Report; No. CR-2017-02; Illinois State Water Survey: Champaign, IL, USA, 2017; p. 22. [Google Scholar]
  29. Pourali, S.H.; Arrowsmith, C.; Chrisman, N.; Matkan, A.A.; Mitchell, D. Topography Wetness Index Application in Flood-Risk-Based Land Use Planning. Appl. Spat. Anal. Policy 2016, 9, 39–54. [Google Scholar] [CrossRef]
  30. Kopecký, M.; Macek, M.; Wild, J. Topographic Wetness Index Calculation Guidelines Based on Measured Soil Moisture and Plant Species Composition. Sci. Total Environ. 2021, 757, 143785. [Google Scholar] [CrossRef]
  31. Aguilar, F.J.; Conference, A.; Sensing, R.; Society, P. Accuracy Assessment of Lidar-Derived Digital. Photogramm. Rec. 2008, 23, 148–169. [Google Scholar] [CrossRef]
  32. Petroselli, A. LIDAR Data and Hydrological Applications at the Basin Scale. GIsci Remote Sens. 2012, 49, 139–162. [Google Scholar] [CrossRef]
  33. Muhadi, N.A.; Abdullah, A.F.; Bejo, S.K.; Mahadi, M.R.; Mijic, A. The Use of LiDAR-Derived DEM in Flood Applications: A Review. Remote Sens. 2020, 12, 2308. [Google Scholar] [CrossRef]
  34. Poppenga, S.; Worstell, B.B.; Danielson, J.J.; Brock, J.C.; Evans, G.A.; Heidemann, H.K. Hydrologic Enforcement of Lidar DEMs; U.S. Geological Survey: Reston, VA, USA, 2014. [CrossRef]
  35. The Basics of LiDAR—Light Detection and Ranging—Remote Sensing. NSF NEON—Open Data to Understand Our Ecosystems. Available online: https://www.neonscience.org/resources/learning-hub/tutorials/lidar-basics (accessed on 9 November 2023).
  36. Sage, J.; Berthier, E.; Gromaire, M.-C. Modeling Soil Moisture Redistribution and Infiltration Dynamics in Urban Drainage Systems. J. Hydrol. Eng. 2020, 25, 04020041. [Google Scholar] [CrossRef]
  37. Kumar, A.K.; Setia, R.; Kumar, D.; Putrevu, D.; Misra, A. Soil Moisture Retrieval Techniques Using Satellite Remote Sensing. In Geospatial Technologies for Crops and Soils; Springer: Singapore, 2020; pp. 357–385. ISBN 9789811568640. [Google Scholar]
  38. Li, Z.; Leng, P.; Zhou, C.; Chen, K.; Zhou, F. Earth-Science Reviews Soil Moisture Retrieval from Remote Sensing Measurements: Current Knowledge and Directions for the Future. Earth Sci. Rev. 2021, 218, 103673. [Google Scholar] [CrossRef]
  39. Kerle, N.; Janssen, L.L.; Huurneman, G.C. Principles of Remote Sensing; ITC Educational Textbook Series; International Institute for Geo-Information Science and Earth Observation (ITC): Enschede, The Netherlands, 2004; p. 250. [Google Scholar]
  40. Engman, E.T. Applications of Microwave Remote Sensing of Soil Moisture for Water Resources and Agriculture. Remote Sens. Environ. 1991, 35, 213–226. [Google Scholar] [CrossRef]
  41. Zhang, D.; Zhou, G. Estimation of Soil Moisture from Optical and Thermal Remote Sensing: A Review. Sensors 2016, 16, 1308. [Google Scholar] [CrossRef]
  42. Dente, L. Microwave Remote Sensing for Soil Moisture Monitoring: Synergy of Active and Passive Observations and Validation of Retrieved Products; International Institute for Geo-Information Science and Earth Observation (ITC): Enschede, The Netherlands, 2016. [Google Scholar]
  43. PAZ • HisdeSAT. Available online: https://www.hisdesat.es/en/paz/ (accessed on 3 October 2023).
  44. Abdikan, S.; Bayik, C.; Ustuner, M.; Sanli, F.B. Repeat-Pass Interferometric and Backscatter Analysis of X-Band PAZ Satellite—First Results. Int. Arch. Photogramm. Remote Sens. Spat. Inf. Sci. 2020, 43, 253–258. [Google Scholar] [CrossRef]
  45. Fuchs, K.; Fuchs, L.; Lepot, M.; Lipeme Kouyi, G. Soil Moisture Measurement in a Swale for SUDS Modelling Improvement. In Proceedings of the Novatech 2023, Lyon, France, 3–7 July 2023. [Google Scholar]
  46. Zhou, Q. A Review of Sustainable Urban Drainage Systems Considering the Climate Change and Urbanization Impacts. Water 2014, 6, 976–992. [Google Scholar] [CrossRef]
  47. Ratan Ganguly, A.; Jato-Espino, D. Editorial: Urban Drainage in a Context of Climate and Land Cover Changes. Front. Water 2023, 4, 1118338. [Google Scholar]
  48. Rosenberger, L.; Leandro, J.; Pauleit, S.; Erlwein, S. Sustainable Stormwater Management under the Impact of Climate Change and Urban Densification. J. Hydrol. 2021, 596, 126137. [Google Scholar] [CrossRef]
  49. Ma, Y.; Xia, X.; Liang, Q.; Wan, H. Investigating the Impact of Spatial Distribution of Sustainable Drainage System (SuDS) Components on Their Flood Mitigation Performance in Communities with High Groundwater Levels. Water 2022, 14, 1367. [Google Scholar] [CrossRef]
  50. Oh, Y.; Kwon, S.-G.; Hwang, J.-H. Soil Moisture Detection Algorithm at X-Band. In Proceedings of the 2011 3rd International Asia-Pacific Conference on Synthetic Aperture Radar (APSAR), Seoul, Republic of Korea, 26–30 September 2011. [Google Scholar]
  51. Oh, Y.; Kwon, S.-G.; Hwang, J.-H. Soil Moisture Measurement of Bare and Vegetated Surfaces by X-Band Radars. J. Korean Inst. Electromagn. Sci. 2010, 10, 212–218. [Google Scholar] [CrossRef]
  52. Serafino, F.; Bianco, A. Use of X-Band Radars to Monitor Small Garbage Islands. Remote Sens. 2021, 13, 3558. [Google Scholar] [CrossRef]
  53. Jackson, T.J.; Schmugge, T.J. Vegetation Effects on the Microwave Emission of Soils. Remote Sens. Environ. 1991, 36, 203–212. [Google Scholar] [CrossRef]
  54. Verhoest, N.E.C.; Lievens, H.; Wagner, W.; Álvarez-Mozos, J.; Moran, M.S.; Mattia, F. On the Soil Roughness Parameterization Problem in Soil Moisture Retrieval of Bare Surfaces from Synthetic Aperture Radar. Sensors 2008, 8, 4213–4248. [Google Scholar] [CrossRef]
  55. Ninyerola, M.; Pons, X.; Roure, J.M. MIRA ON ® GIS & RS ATLAS CLIMÁTICO DIGITAL DE LA PENÍNSULA IBÉRICA. Available online: https://opengis.grumets.cat/wms/iberia/espanol/ES_MODEL.HTM (accessed on 9 November 2023).
  56. Conrad, O.; Bechtel, B.; Bock, M.; Dietrich, H.; Fischer, E.; Gerlitz, L.; Wehberg, J.; Wichmann, V.; Böhner, J. System for Automated Geoscientific Analyses (SAGA) v. 2.1.4. Geosci. Model Dev. 2015, 8, 1991–2007. [Google Scholar] [CrossRef]
  57. SNAP Download—STEP. Available online: https://step.esa.int/main/download/snap-download/ (accessed on 13 October 2023).
  58. Askari, S.H.; De-Ville, S.; Hathway, E.A.; Stovin, V. Estimating Evapotranspiration from Commonly Occurring Urban Plant Species Using Porometry and Canopy Stomatal Conductance. Water 2021, 13, 2262. [Google Scholar] [CrossRef]
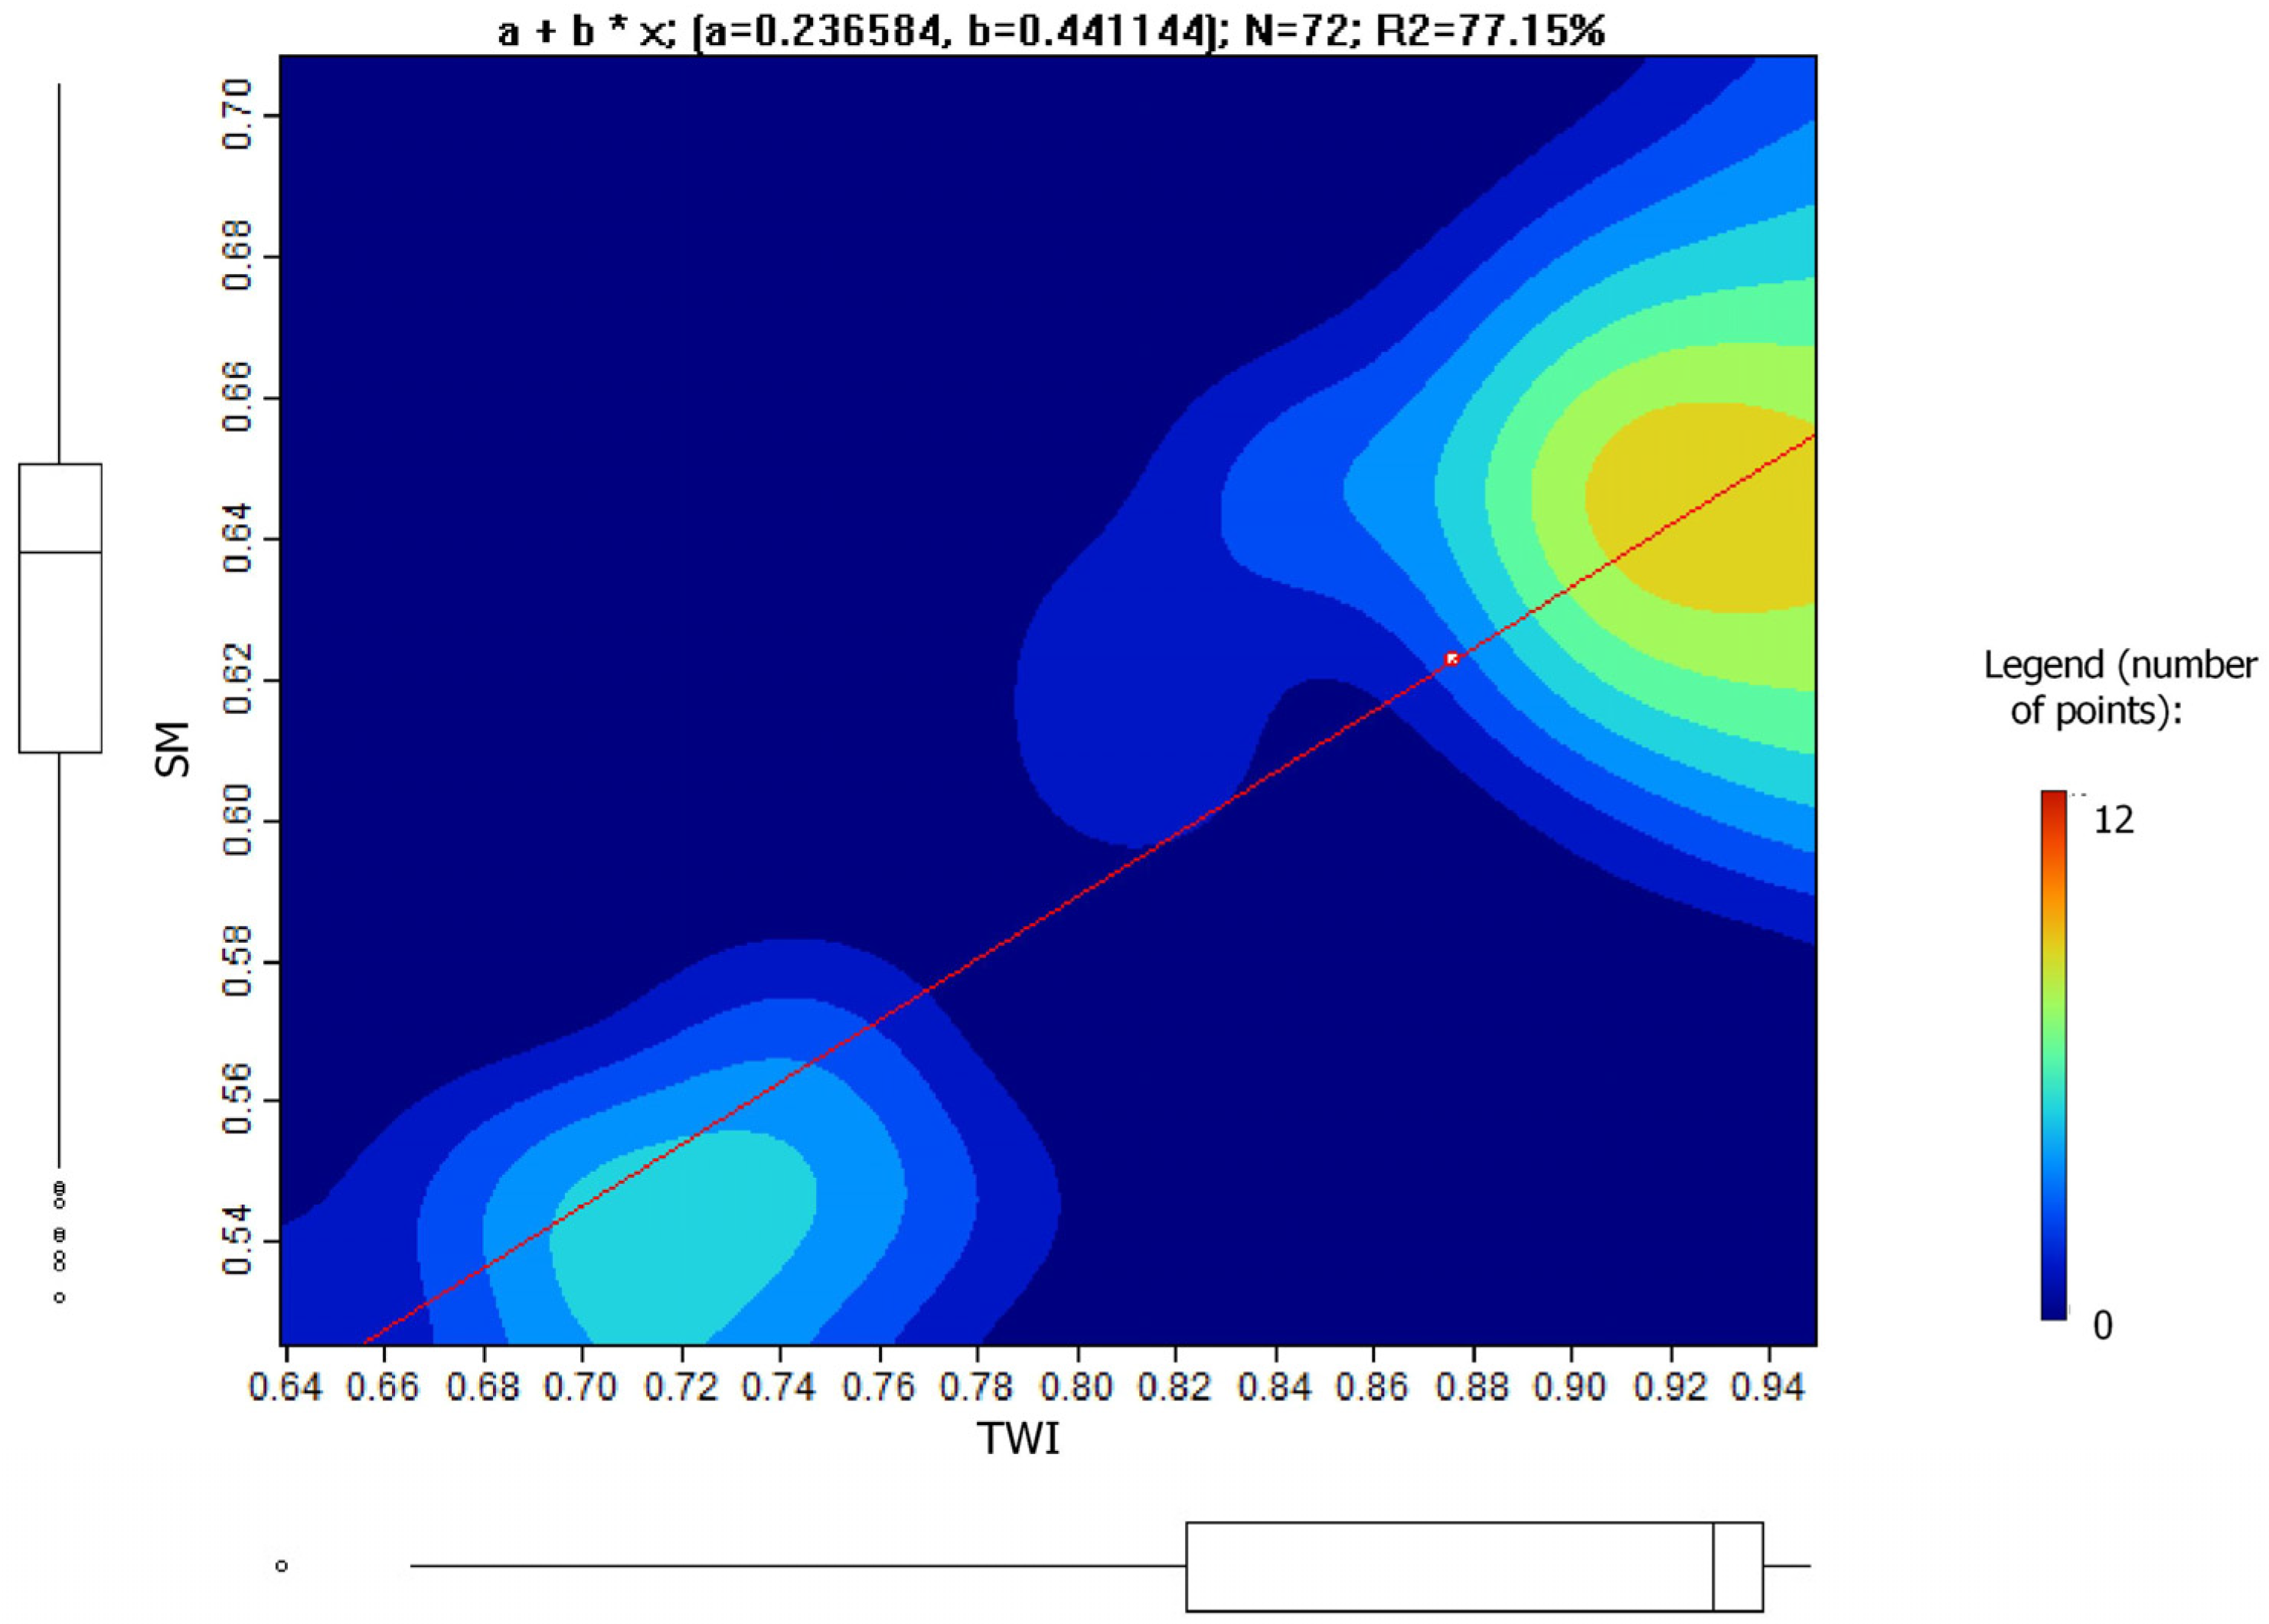
Figure 1. Location of the study area in the city of Gijón (Principality of Asturias), NW Spain.
Sustainability 16 00598 g001
Figure 2. (a) Normalized TWI values for the case study; (b) the most recent orthophoto available from the National Aerial Orthophotography Plan of the National Geographic Institute of Spain.
Sustainability 16 00598 g002
Figure 3. (a) The normalized SM values for the case study; (b) the most recent orthophoto available from the National Aerial Orthophotography Plan of the National Geographic Institute of Spain.
Sustainability 16 00598 g003
Figure 4. (a) Normalized SM values for the study plots; (b) latest orthophoto; (c) normalized TWI values for the study plots. The selection of 72 points from within these plots was made through random sampling, and these points were used to determine the normalized values of SM and TWI.
Sustainability 16 00598 g004
Figure 5. Scatter plot depicting the linear model relationship between SM and the TWI.
Sustainability 16 00598 g005
Figure 6. (a) Q-Q plot for the standardized residuals; (b) scatter plot of residuals and predicted values.
Sustainability 16 00598 g006
Table 1. Descriptive statistical parameters.
Variable (Units)MeanStd. Dev.Percentiles (%)
0255075100
Soil Moisture0.6230.0460.5250.6060.6380.6510.709
Topographic Wetness Index0.8760.0920.6390.8290.9300.9400.950
Disclaimer/Publisher’s Note: The statements, opinions and data contained in all publications are solely those of the individual author(s) and contributor(s) and not of MDPI and/or the editor(s). MDPI and/or the editor(s) disclaim responsibility for any injury to people or property resulting from any ideas, methods, instructions or products referred to in the content.

