Article

Long-Term Anaerobic Digestion of Seasonal Fruit and Vegetable Waste Using a Leach-Bed Reactor Coupled to an Upflow Anaerobic Sludge Bed Reactor

by
Achilleas Kalogiannis
,
Vasileios Diamantis
,
Alexandros Eftaxias
and
Katerina Stamatelatou
*
Department of Environmental Engineering, Democritus University of Thrace, Vas. Sofias 12, GR 67132 Xanthi, Greece
*
Author to whom correspondence should be addressed.
Sustainability 2024, 16(1), 50; https://doi.org/10.3390/su16010050
Submission received: 3 November 2023 / Revised: 14 December 2023 / Accepted: 15 December 2023 / Published: 20 December 2023

Abstract

:
Fruit and vegetable waste (FVW) generated locally in open (public or wholesale) markets is a valuable resource and should not be considered as waste. The anaerobic digestion (AD) of FVW can minimize landfill disposal and generate renewable energy, thus decreasing greenhouse gas emissions. Moreover, the digestate after the AD of FVW, devoid of antibiotics and animal fats in manure and food waste, may have a high fertilizing value. In this study, FVW mixtures were composed to mimic the real FVW generated in Mediterranean open markets annually. The first goal was to evaluate the biochemical methane potential (BMP) of different size fractions resulting from FVW grinding. Indeed, the FVW was ground and separated into two size fractions, 0–4 mm and 4–10 mm, respectively. The 0–4 mm fraction exhibited a lower BMP but a higher rate constant than the 4–10 mm fraction. The second goal was to first evaluate the BMP of the lumped fraction of FVW after grinding (0–10 mm) via BMP assays and then feed it to a mesophilic two-stage leaching-bed reactor (LBR)-upflow anaerobic sludge bed (UASB) system for almost one year. The BMP of the FVW ranged between 406 and 429 L kg−1 of volatile solids (VS) independently of the FVW production season. The system received an average organic loading rate (OLR) of 3.1 ± 0.7 g VS L−1 d−1. During operation, the LBR gradually transited from acidogenic to methanogenic, and the overall methane yield of the system increased from 265–278 to 360–375 L kg−1 VS, respectively. The proposed technology does not require water addition or liquid digestate removal. Compared to the continuous stirred tank reactor (CSTR) digester technology, the LBR/UASB system is suitable for the anaerobic digestion of FVW. The results of this study can be further used to upscale the proposed technology and contribute to the societal need for affordable and clean energy included in the Sustainable Development Goals (SDGs).

1. Introduction

FVW contributes most of the organic fraction of municipal solid waste [1,2]. Large quantities of FVW such as leaves, peels, seeds, whole vegetables, and fruits (unused, spoiled or rotten) are generated locally in open (public or wholesale) markets [3,4,5]. In densely populated countries such as India, FVW from a wholesale market complex may account for up to 150–200 ton d−1. The latter, often stored in heaps outside the market buildings, is transported to the city landfills [6]. Focusing on the FVW generated in the Mediterranean area, the green waste generated by municipal and open markets in Tunisia was estimated at 18,000 ton yr−1. In Sfax city, the FVW generated from wholesale markets was 1400 ton yr−1 [7]. Proper management of FVW is a prerequisite to avoid landfill disposal, since landfilling accounts for more than three ton CO2-equivalent ton−1 FVW [8]. Furthermore, the anaerobic digestion of fruit and vegetable waste can generate renewable energy, thus decreasing the overall greenhouse gas (GHG) footprint between −40 and −230 kg CO2-eq ton−1 FVW [3,8,9].
FVW is characterized by high moisture (870–930 g kg−1 FVW), a high organic content (64–120 g kg−1 FVW) consisting mainly of sugars and hemicellulose (62–78 g kg−1 FVW), cellulose (9–15 g kg−1 FVW), and a low lignin content (4.5–5.6 g kg−1 FVW) [3,7]. As a result, FVW is highly biodegradable and suitable for biogas production in anaerobic digestion facilities. However, it is prone to quick acidification, which may cause process inhibition due to a pH drop [1]. A strategy to overcome this inhibition from rapid acidification is to co-digest FVW with other waste such as meat residues [10], slaughterhouse waste [6], sewage sludge [11], and municipal solid waste [12]. Co-digestion, although leading to a higher methane yield, results in a low-quality digestate since the other wastes are often sources of pathogens, and the latter may survive in the digestate [13].
The mono-digestion of FVW has been extensively studied, focusing mainly on determining the BMP of whole fruits and vegetables as well as their fragments (peels, seeds, etc.). BMP provides a measure of the maximum methane yield that can be recovered from waste and can be used to assess the efficiency of a continuous fed process. The BMP values of vegetable leaves (e.g., beets, carrots, turnips, cabbage, and cauliflowers) and seeds/peels from tomatoes and potatoes ranged from 200 to 300 L kg−1 VS. In contrast, the BMP values of pulps, whole vegetables, and fruits were higher, even up to 500 L kg−1 VS [1,3]. Generally, vegetable waste yields less methane (207–346 L kg−1 VS) [14] than fruit waste. Fruit waste has been studied per component and has been found to yield methane in the order of seed (500–650 L kg−1 VS) > pulp (288–469 L kg−1 VS) > peel (up to 203 L kg−1 VS) [15]. Ta and Babel [16] found that the BMP of vegetable waste mixtures collected in Thailand was 306 L kg−1 VS on average.
Other studies focused on the annual variation in the composition and BMP of FVW mixtures such as those generated in open markets. It is worth noting that although FVW mixtures vary in composition annually, they exhibit a similar BMP depending on the fruit-to-vegetable ratio (FVR) in the FVW. For example, Edwiges et al. and Papirio et al. [7,17], who studied the seasonal variation effect on the FVW generated in Brazil and Mediterranean countries, respectively, identified higher FVR in the FVW mixtures (0.74–2) than Mozhiarasi et al. [6] found in FVW in Indian markets (FVR: 0.27). Interestingly, the average BMP values determined from multiple samples of FVW were higher in Brazil and Tunisia–Jordan (377 ± 67 and 399 ± 65 L kg−1 VS, respectively) than in India (253.7 ± 27 L kg−1 VS). In either case, the standard deviation was slight, indicating that FVW mixtures can provide anaerobic digesters with a relatively stable organic feedstock.
The anaerobic mono-digestion of FVW in continuously operated bioreactors has been previously studied. Using conventional CSTR, a methane yield within the range of the expected BMP values was achieved under low OLR. Edwidges et al. [4] operated a CSTR under an OLR of 3 g VS L−1 d−1, adding water to maintain the hydraulic residence time (HRT) equal to 20 d and recorded a methane yield of 285 NL kg−1 VS. On the other hand, Trujillo-Reyes et al. [18], who did not report adding water, achieved a similar yield of 229 and 254 L kg−1 VS under an OLR of 1 g VS L−1 d−1. They attributed the instability of the reactors under an OLR of 3 g VS L−1 d−1 to the accumulation of the antimicrobial monoterpenes present in fruits, vegetables, etc. Improvement in the anaerobic digestion process was possible with plug-flow (tubular) reactors (PFR), in other words, at a similar HRT of 20 d and an estimated OLR between 3 and 4 g VS L−1 d−1, the methane yield increased within 360 to 450 L kg−1 VS [19,20]; however, the experiments from these studies lasted one month, which is a relatively short time to evaluate the bioreactor’s performance operated at an HRT of 20 d. Moreover, PFR should be designed with biomass retention to avoid biomass washout in the long-term.
An alternative to improve the anaerobic digestion of FVW is to apply a two-stage process to separate the acidogenesis and methanogenesis. Indeed, continuous two-stage systems (thermophilic hydrolytic reactor coupled to a mesophilic anaerobic filter) achieved a methane yield of 420 L kg−1 VS under an OLR of 5.65 g VS L−1 d−1 [21]. Another two-stage configuration involves an LBR as the first stage to allow the leaching of the aqueous phase of FVW. The generated leachate can be digested in the second stage, consisting of a high-rate system (e.g., UASB reactor). At the same time, the remaining solid fraction is stabilized inside the LBR. The supernatant from the second stage can be further recirculated to the LBR to enhance the leaching process [22,23]. Mtz-Viturtia et al. [23] operated a solid-bed reactor of the LBR type coupled to a UASB to treat shredded FVW. The OLR of the system gradually increased from 3.1 to 6.3, 9.4, and 12.6 g VS L−1 d−1, yielding methane at 400, 290, 190, and 100 L kg−1 VS, respectively [23]. Considering that the maximum methane yield was achieved at an OLR between 3.1 and 6.3 g VS L−1 d−1, the minimum HRT of the solid-bed/UASB reactor system was 9 d, significantly lower than the conventional CSTR or PFR design. However, their study used a limited mixture of fruits and vegetables (tomato, lettuce, cucumber, cauliflower, orange, and melon). At the same time, they presented steady state and not dynamic results for their LBR-UASB system. Moreover, to our knowledge, no data exist concerning the long-term dynamic performance of a two-stage system (LBR/UASB) operated on realistic, seasonally variable FVW mixtures while increasing the loading rate.
Therefore, this study aimed to operate a two-stage LBR-UASB system using seasonally generated FVW mixtures for almost one year. The composition of the FVW mixture typically generated in Mediterranean open markets and varied in time was adapted by Papirio et al. [7]. Process efficiency was evaluated in terms of biogas production and composition in both stages, methane yield, removal of VS, and the accumulation of volatile fatty acids. Methane yield from the two-stage system was finally compared to short-term experiments using the BMP assays of the FVW mixtures. Moreover, although particle size has been extensively studied as a parameter affecting the rate and BMP of the FVW, there was no consideration of the characteristics of different size fractions obtained after shredding. To fill this gap, the BMP and the methane production rate constant of two different size fractions (0–4 mm and 4–10 mm) resulting after shredding were evaluated and correlated with the lumped fraction (0–10 mm).

2. Materials and Methods

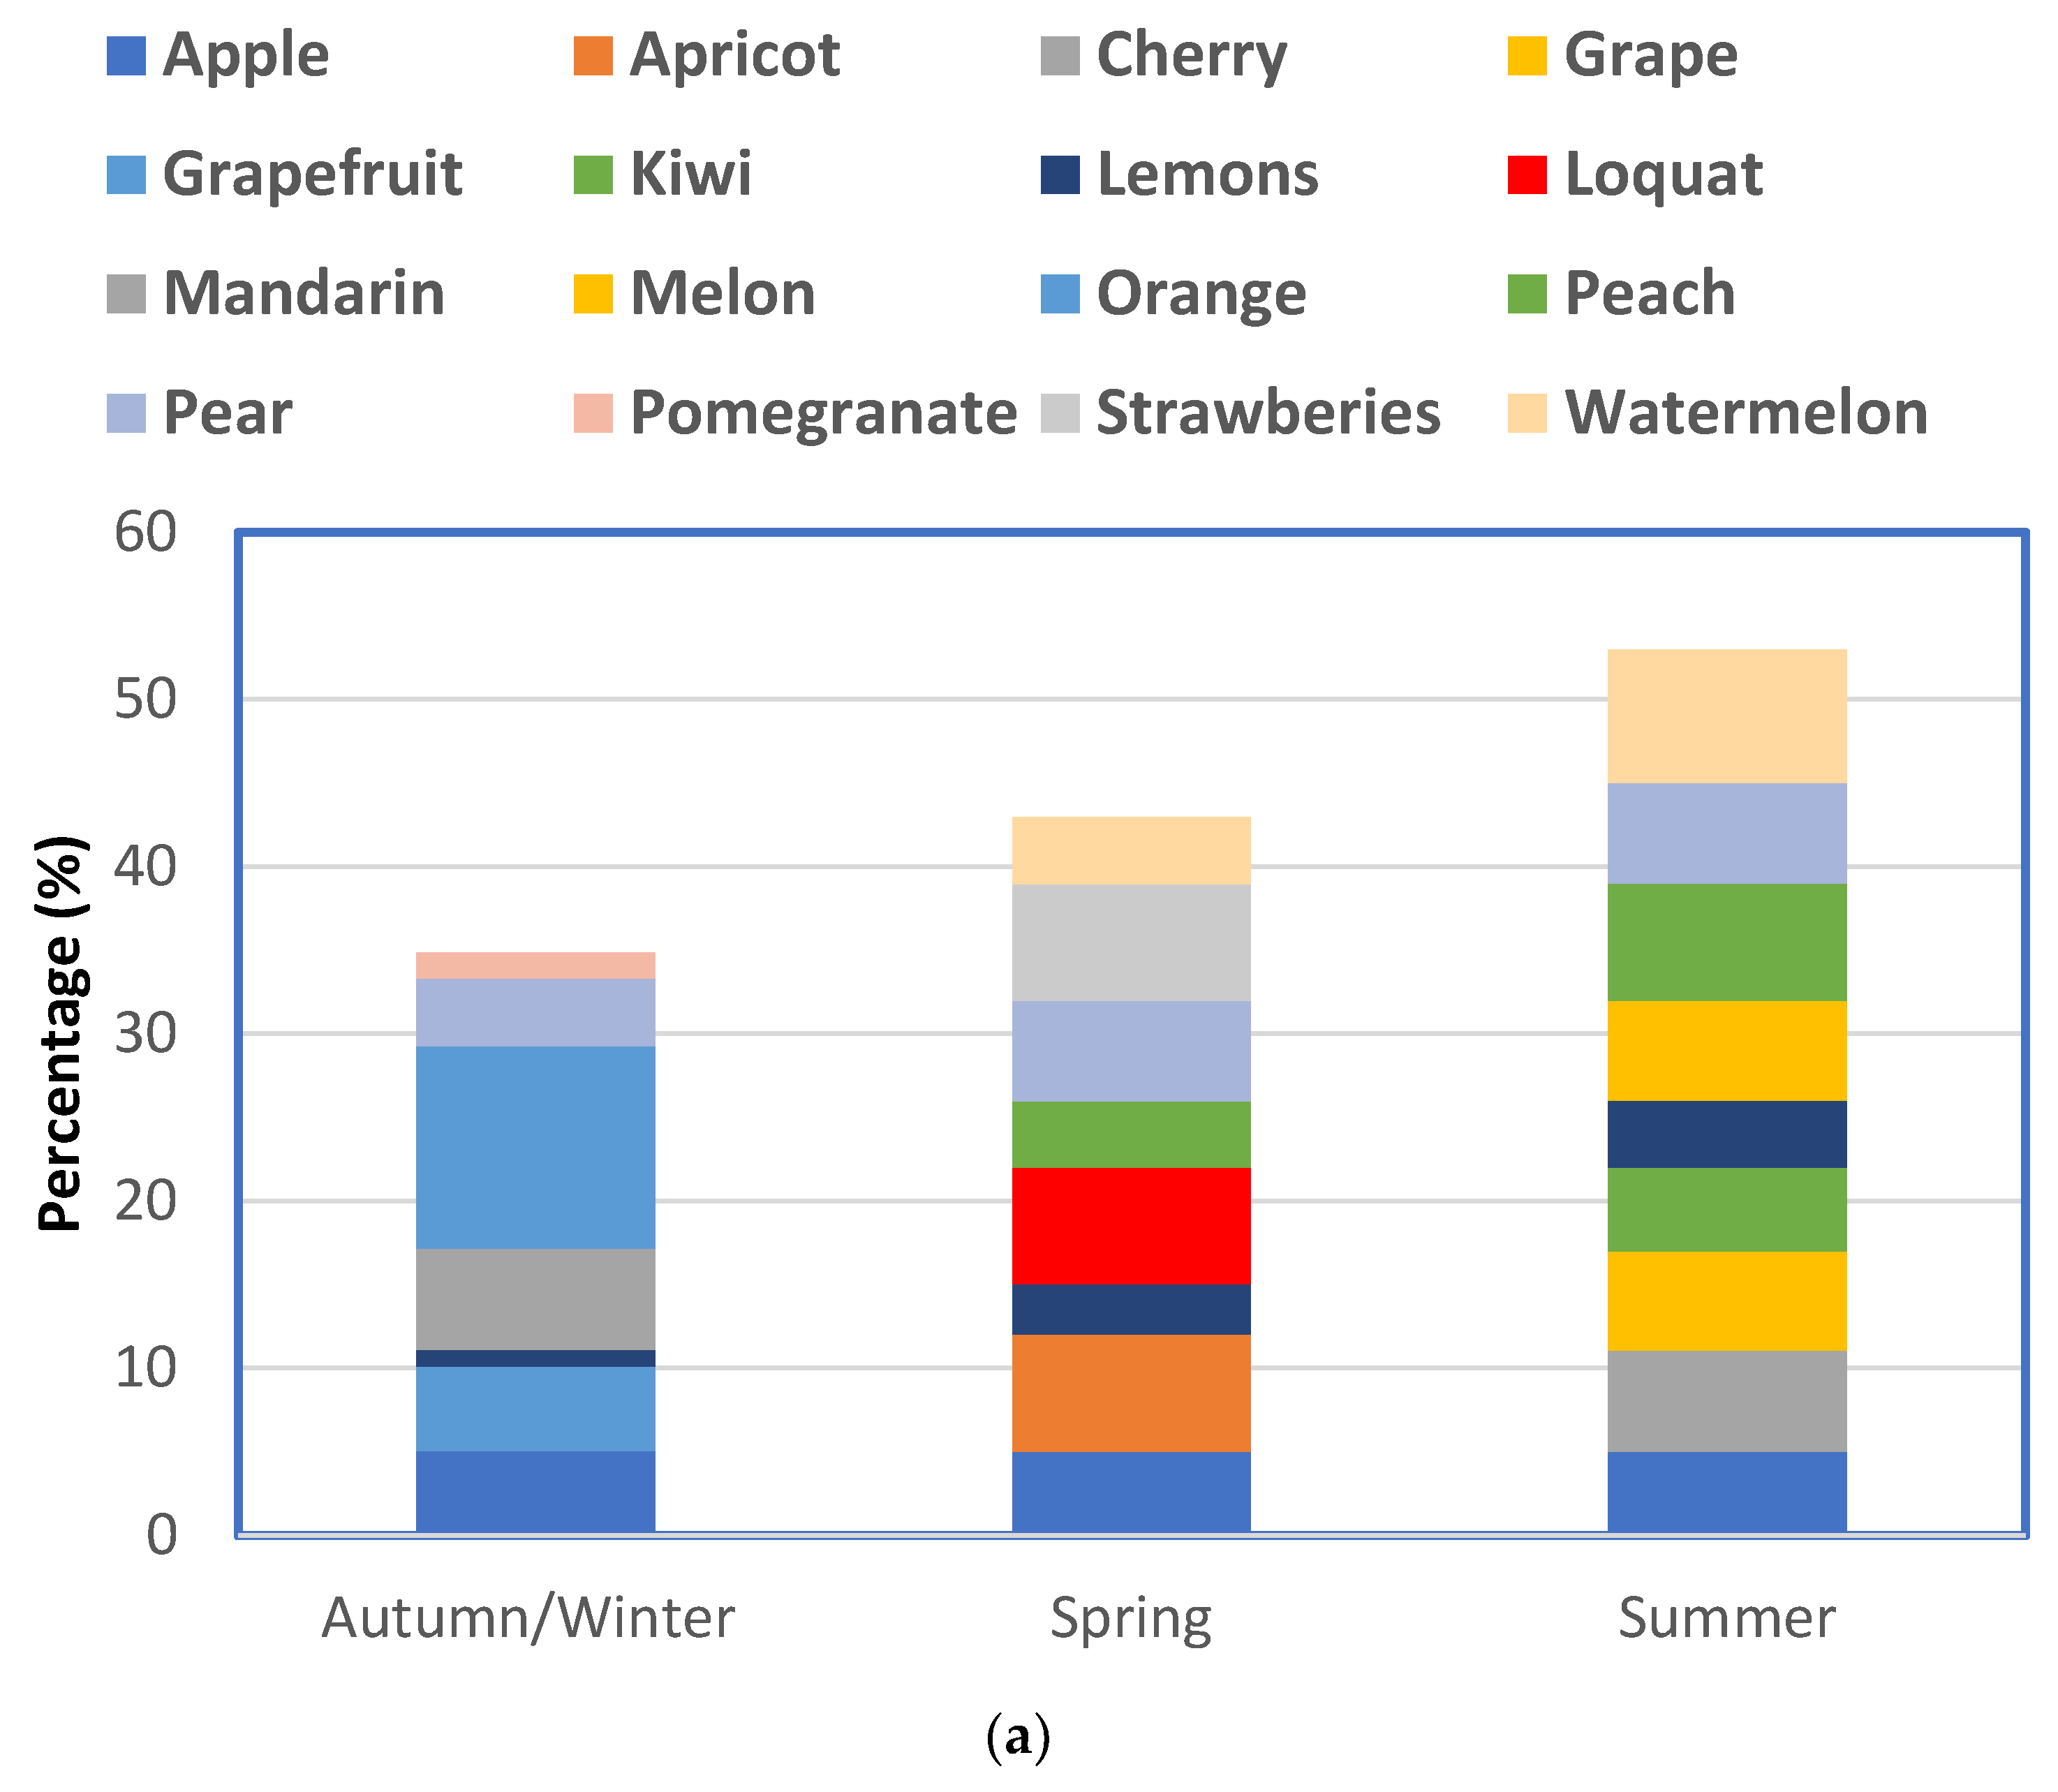
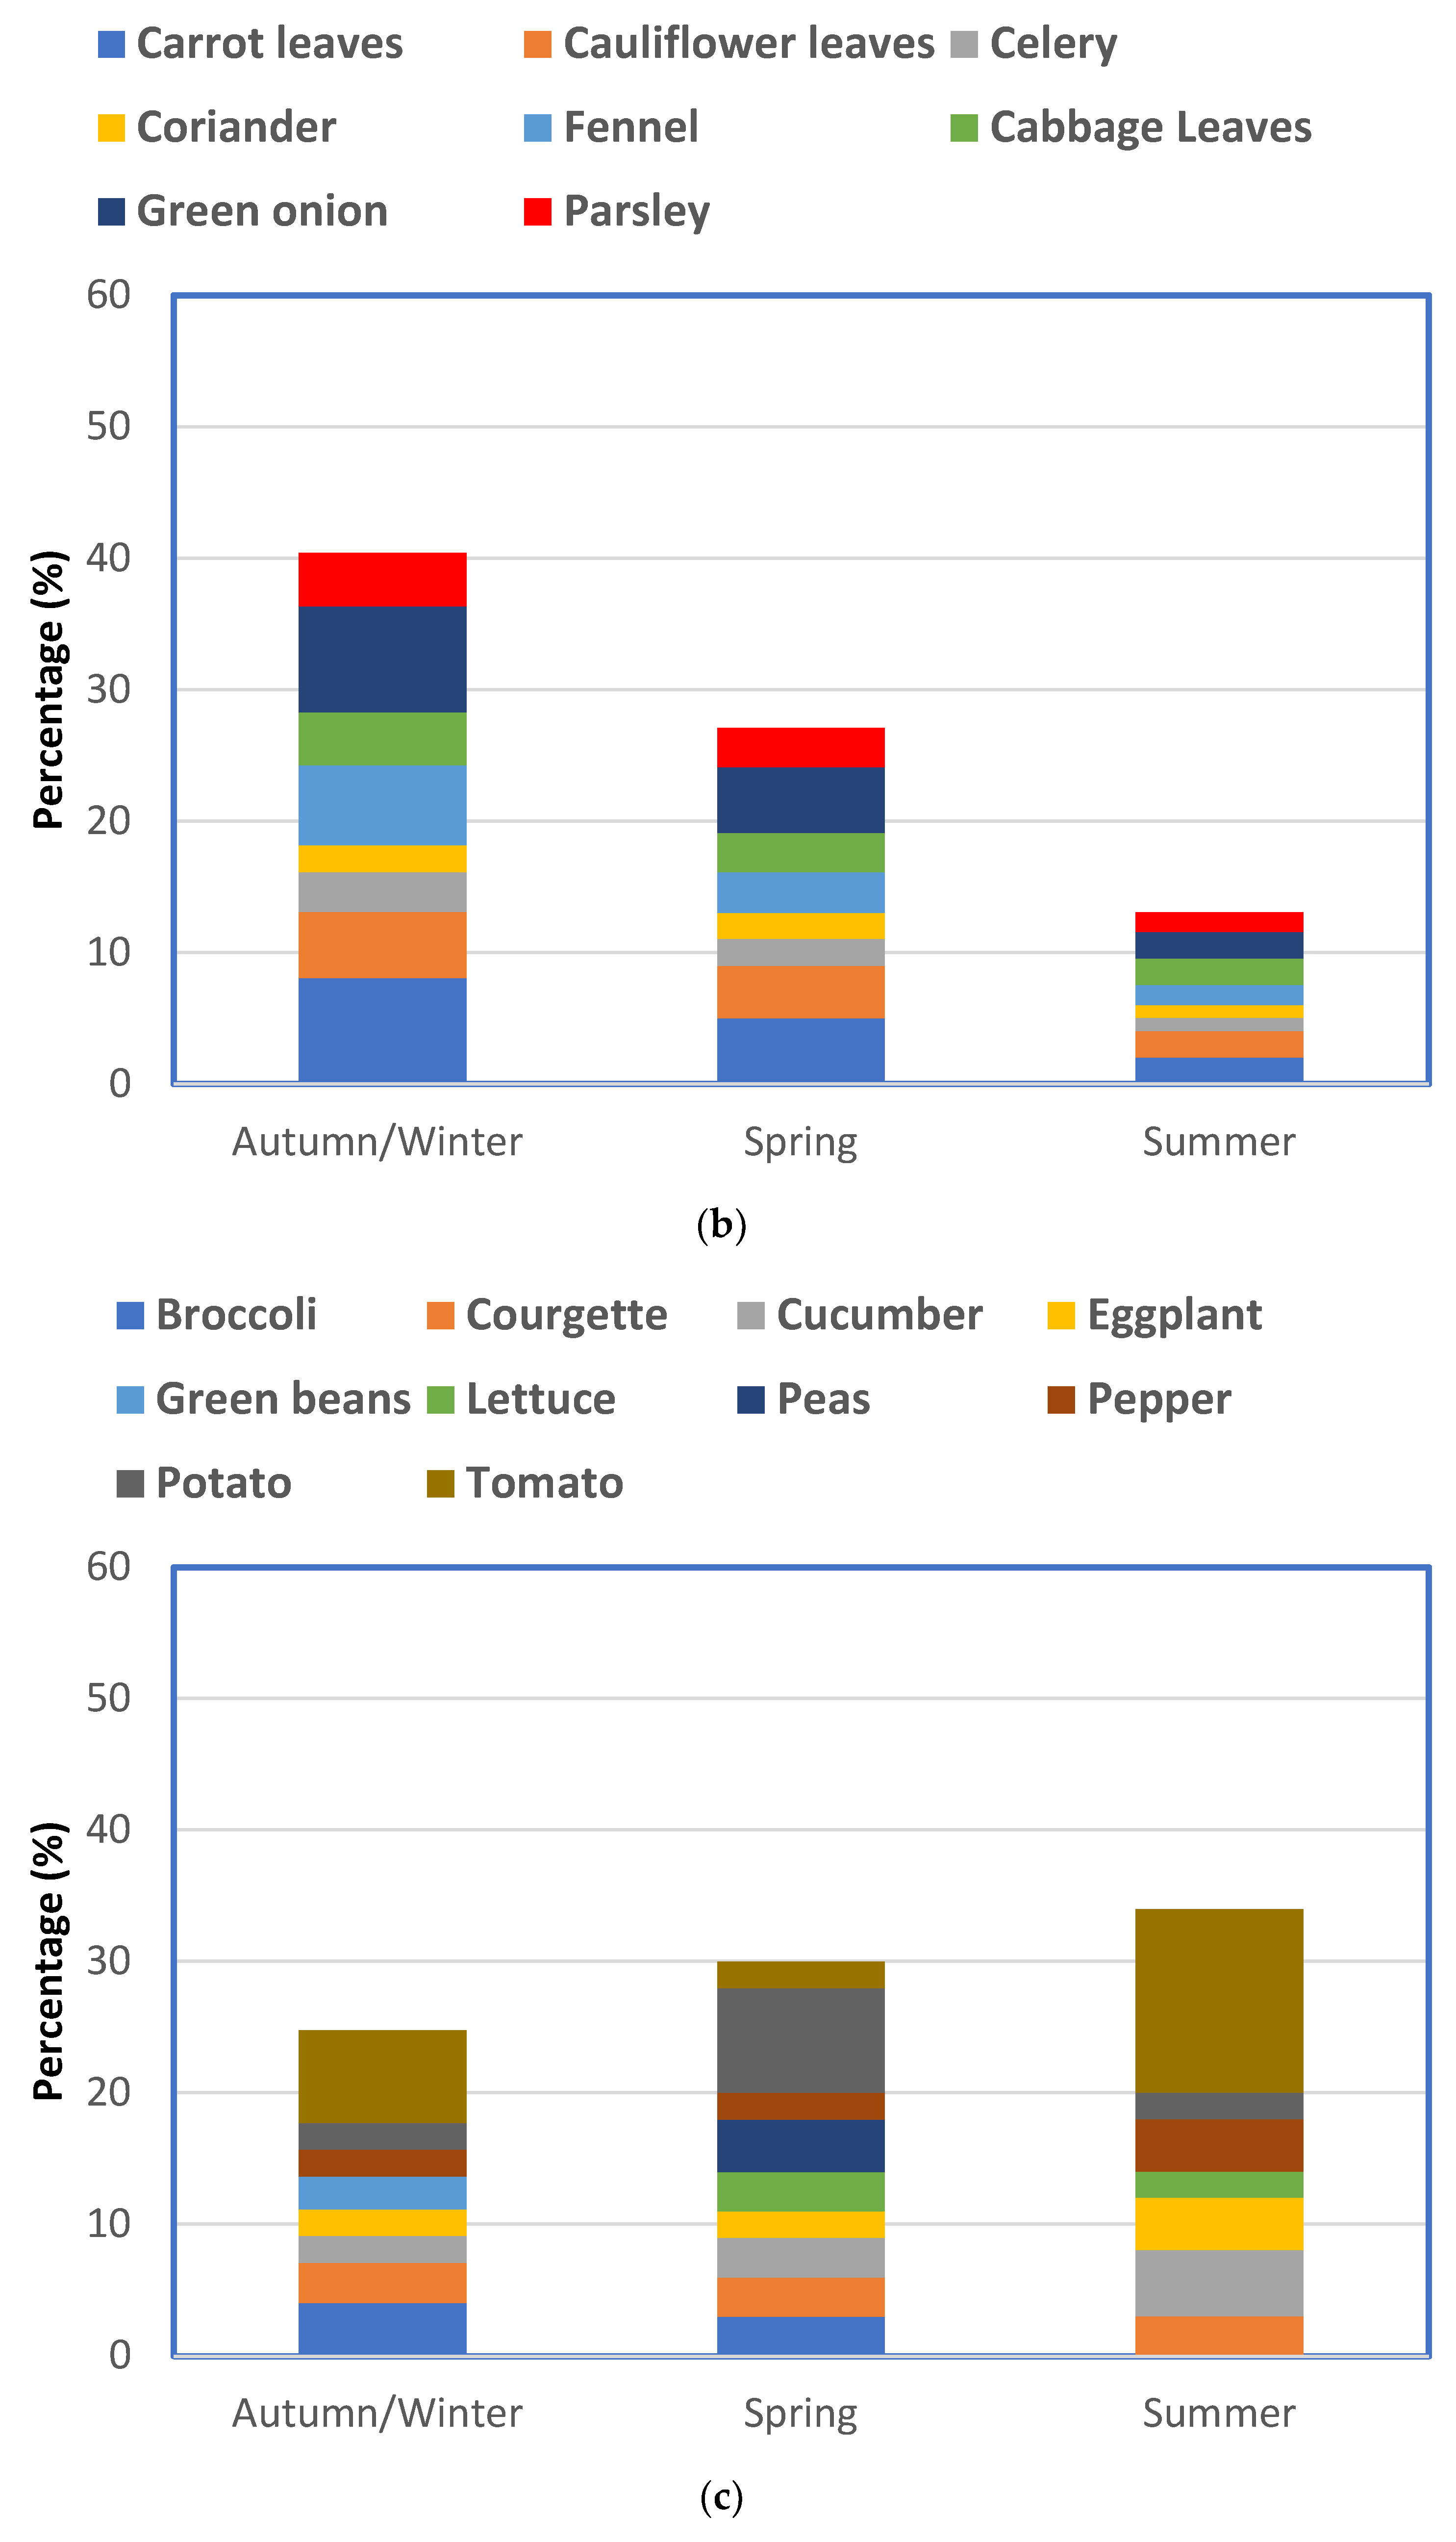
2.1. Waste Mixtures and Composition

Mixtures of seasonally generated FVW were prepared to simulate the FVW composition of Mediterranean open markets for autumn/winter (Season 1; S1), spring (Season 2; S2), and summer (Season 3; S3), respectively, according to Papirio et al. [7]. Papirio et al. [7] determined the typical composition of FVW throughout the year in two Mediterranean countries (Tunisia and Jordan), merging the similarities and differences in the three periods/seasons. The fruits and vegetables used for the mixture preparation were purchased from local Greek markets. Table S1 (Supplementary Materials) shows the exact composition thereof.

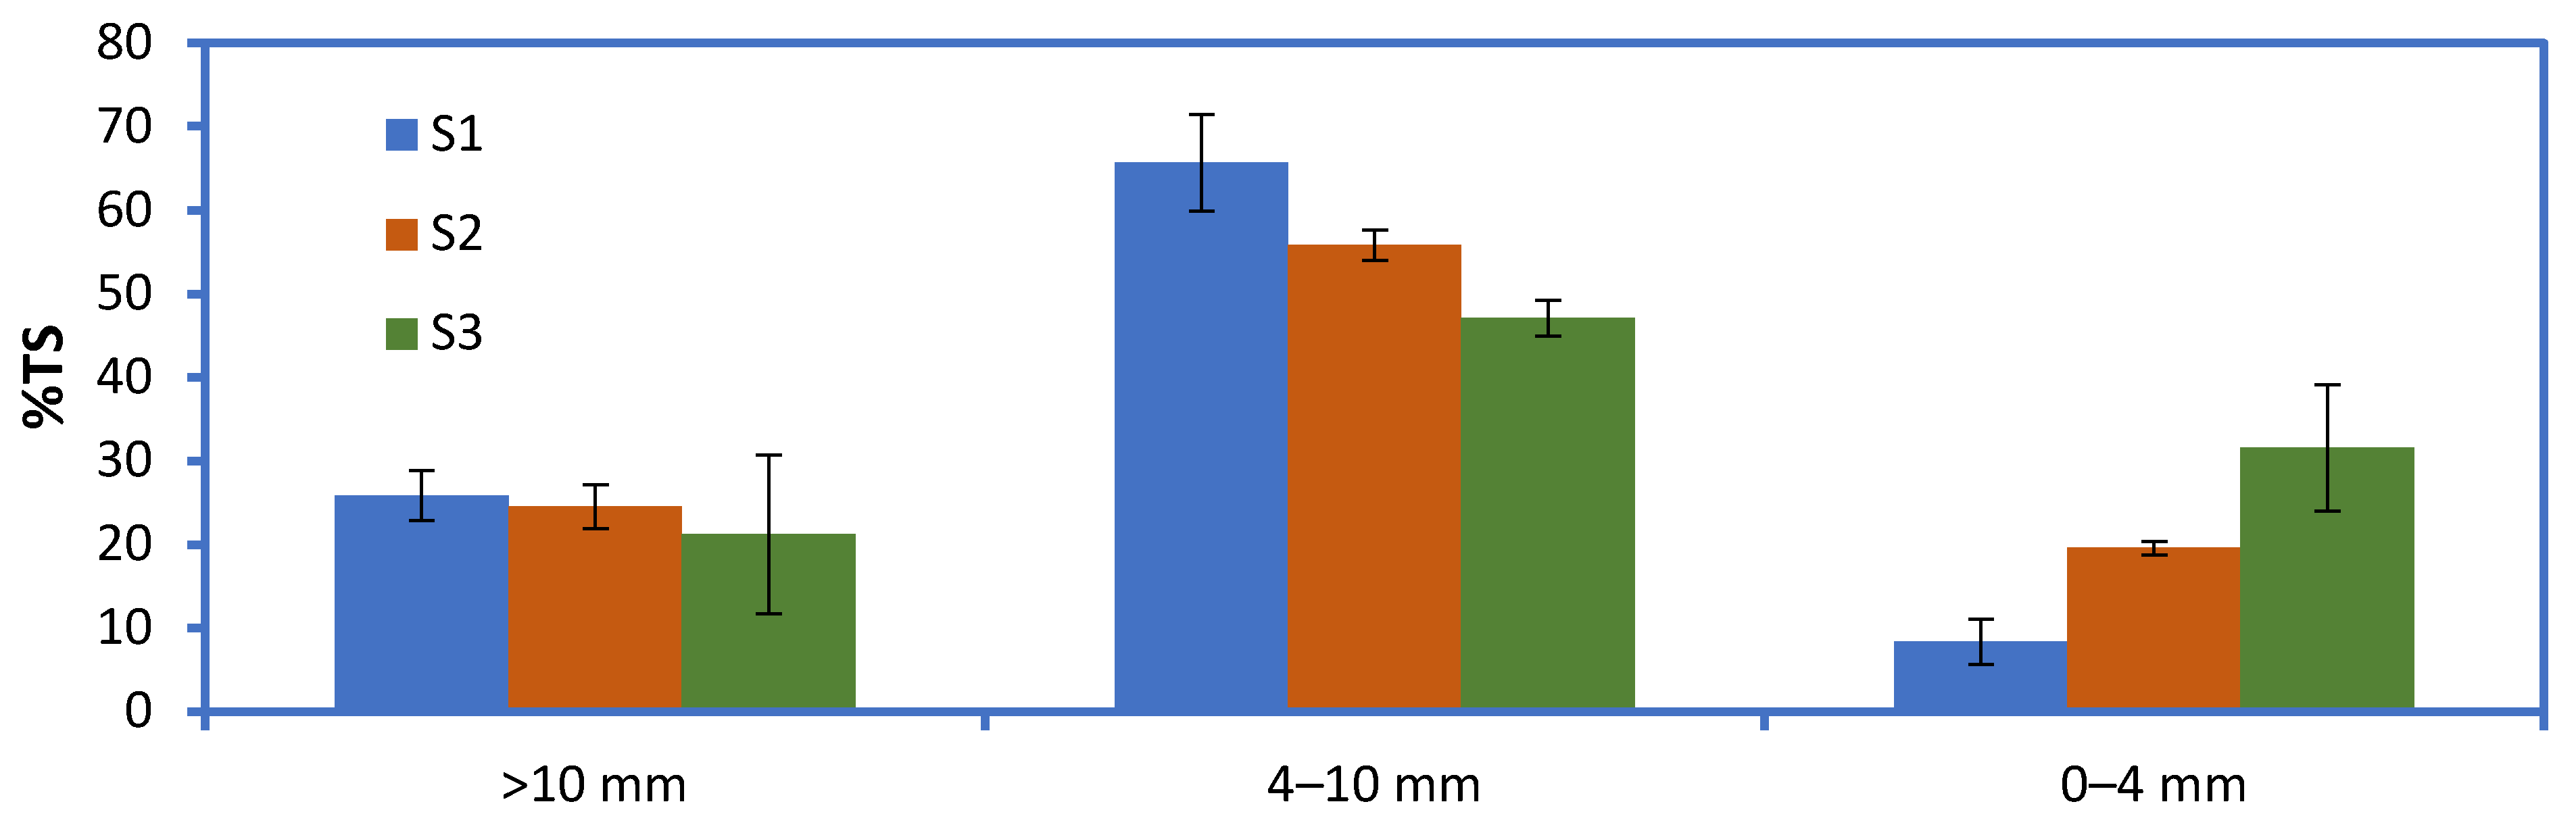
2.2. Mechanical FVW Pretreatment and Fractionation

The FVW was shredded using a kitchen grinder equipped with a cutting disk with 10 mm holes. The shredded mixture was sieved, and the fraction larger than 10 mm was rejected for use in BMP assays so that the particle size remained below 10 mm.
For each FVW mixture, fractionation of the shredded material was studied using a series of 10 and 4 mm sieves. Tap water (0.4 L per kg FVW) was added to facilitate sieving. First, the 10 mm sieve was used, and a fraction of 0–10 mm was obtained. Then, the mechanical shredding was repeated on fresh FVW mixture, and using two sieves in series, two fractions (0–4 mm and 4–10 mm) were obtained. In this way, the fraction 0–10 and its two sub-fractions (0–4 mm and 4–10 mm) could be studied separately (see Figure S1). All fractions were characterized in terms of physicochemical composition and BMP.

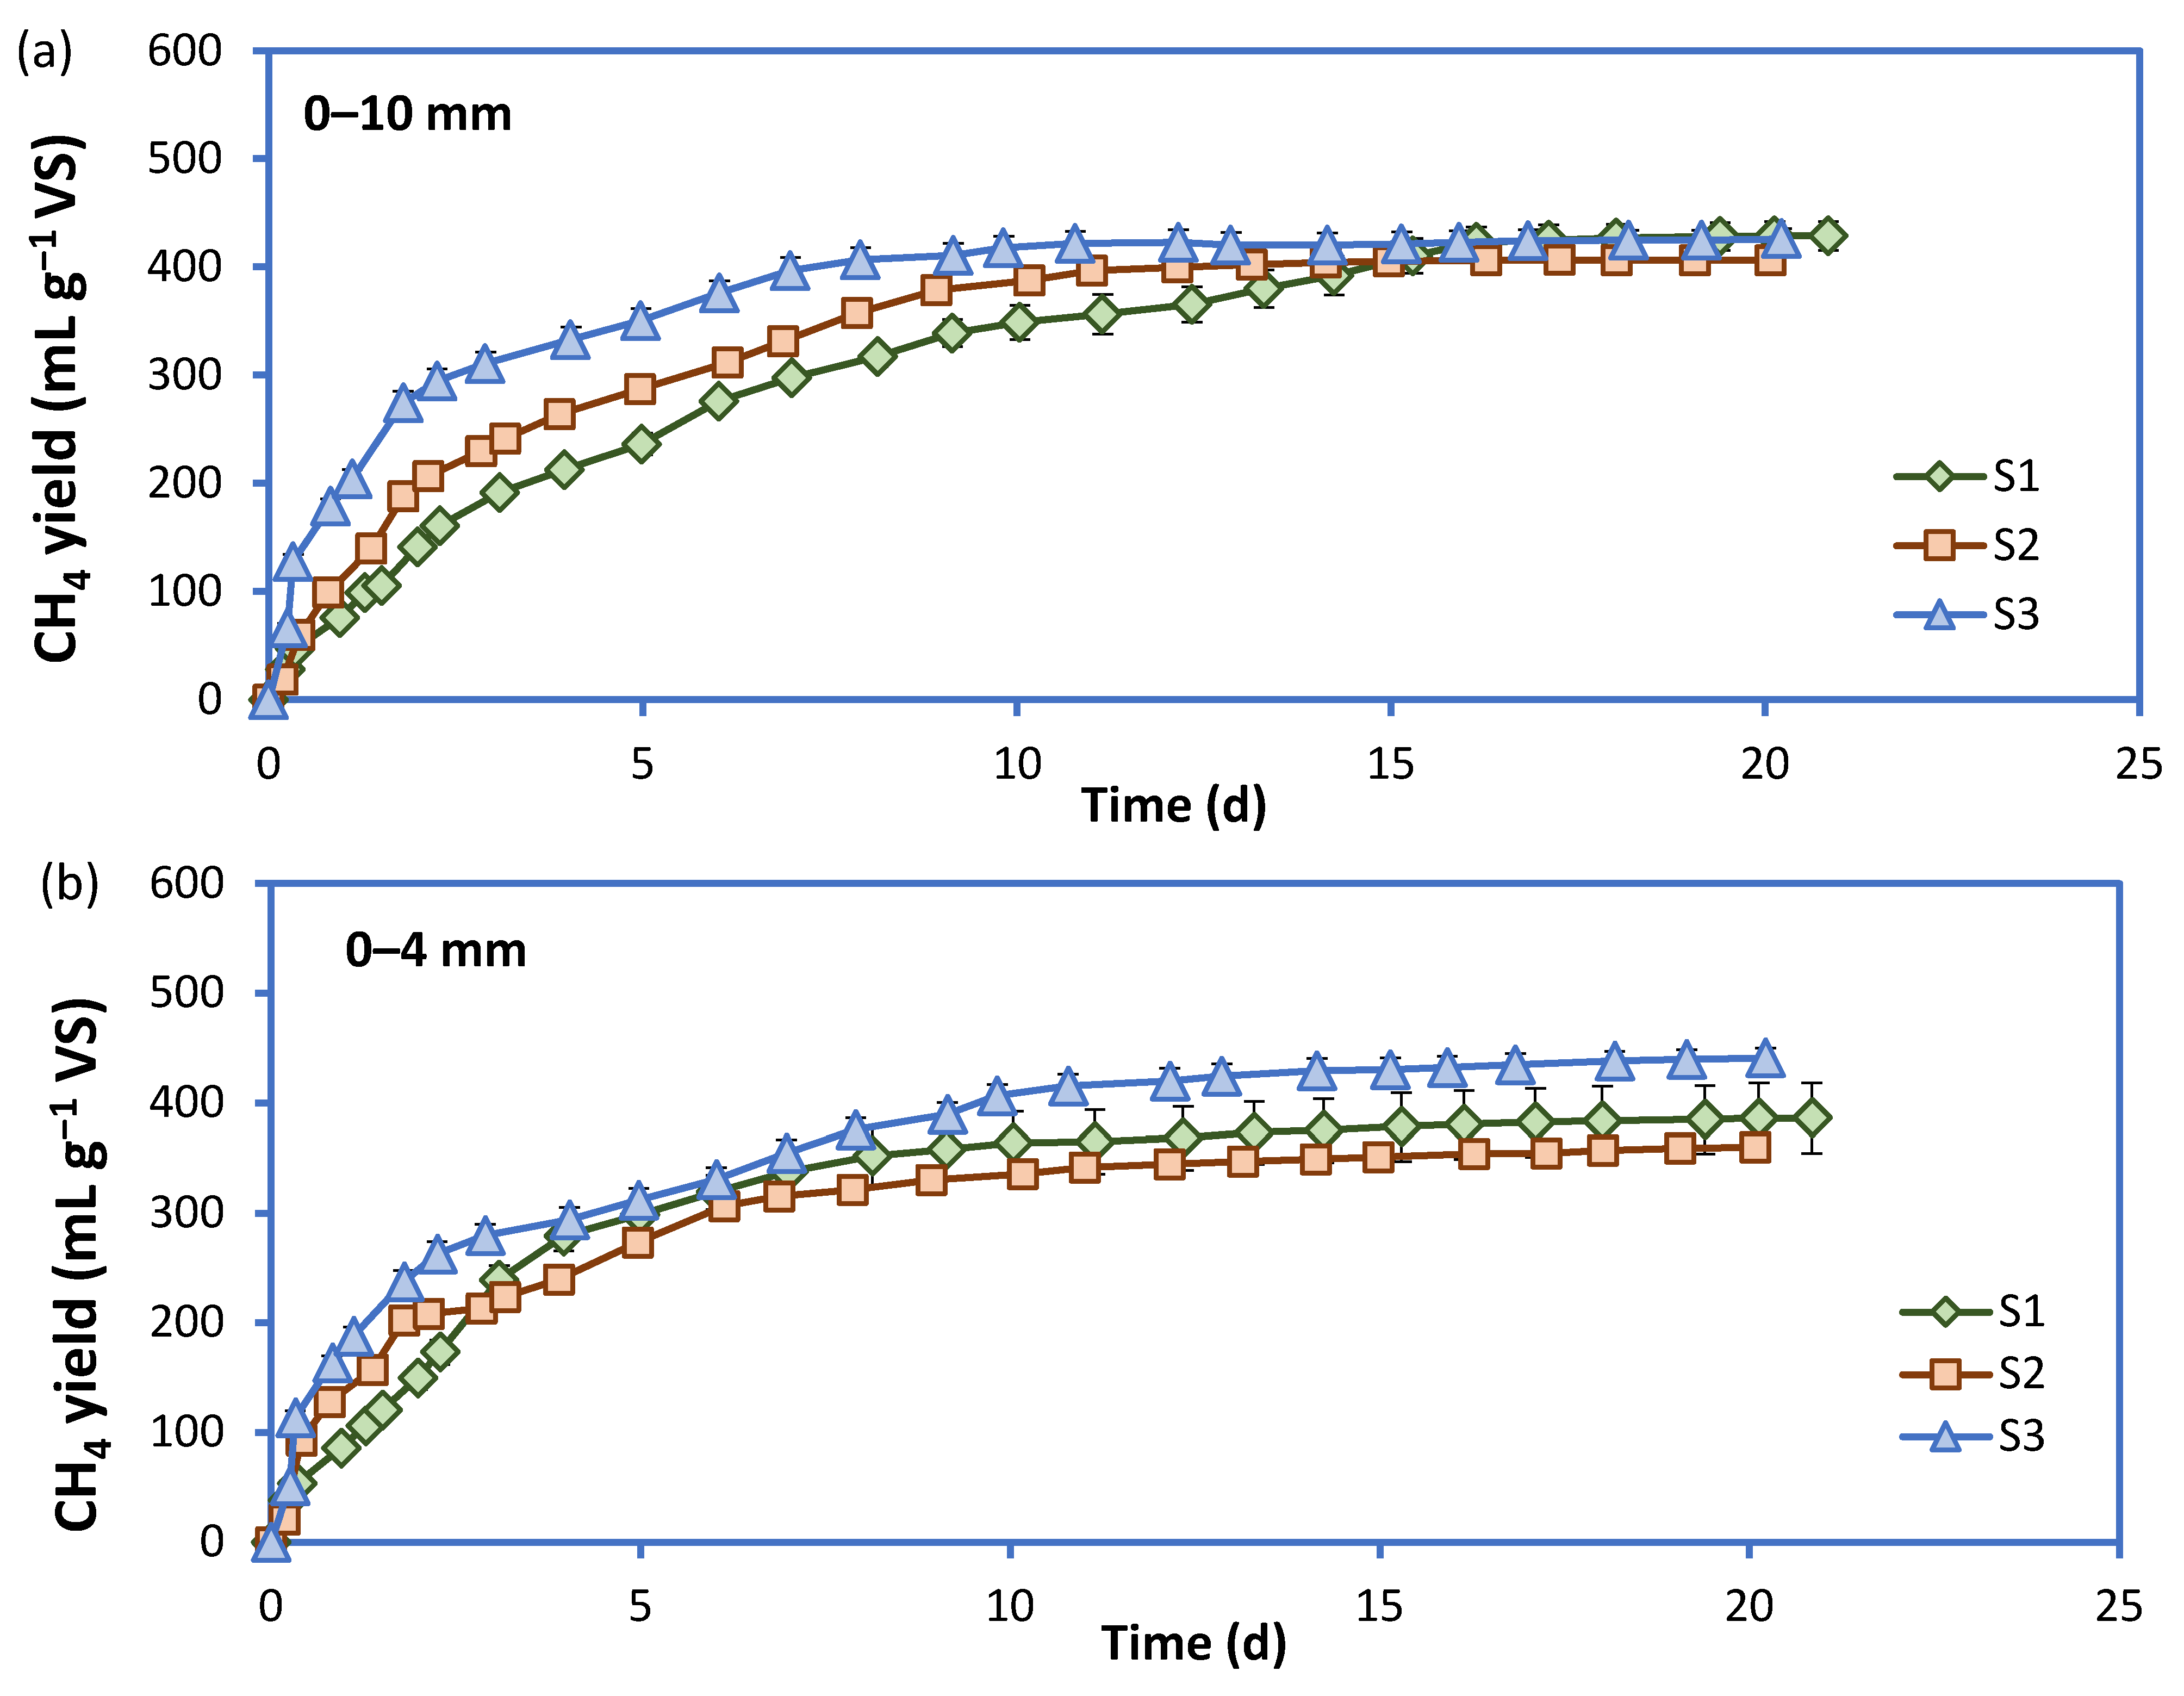
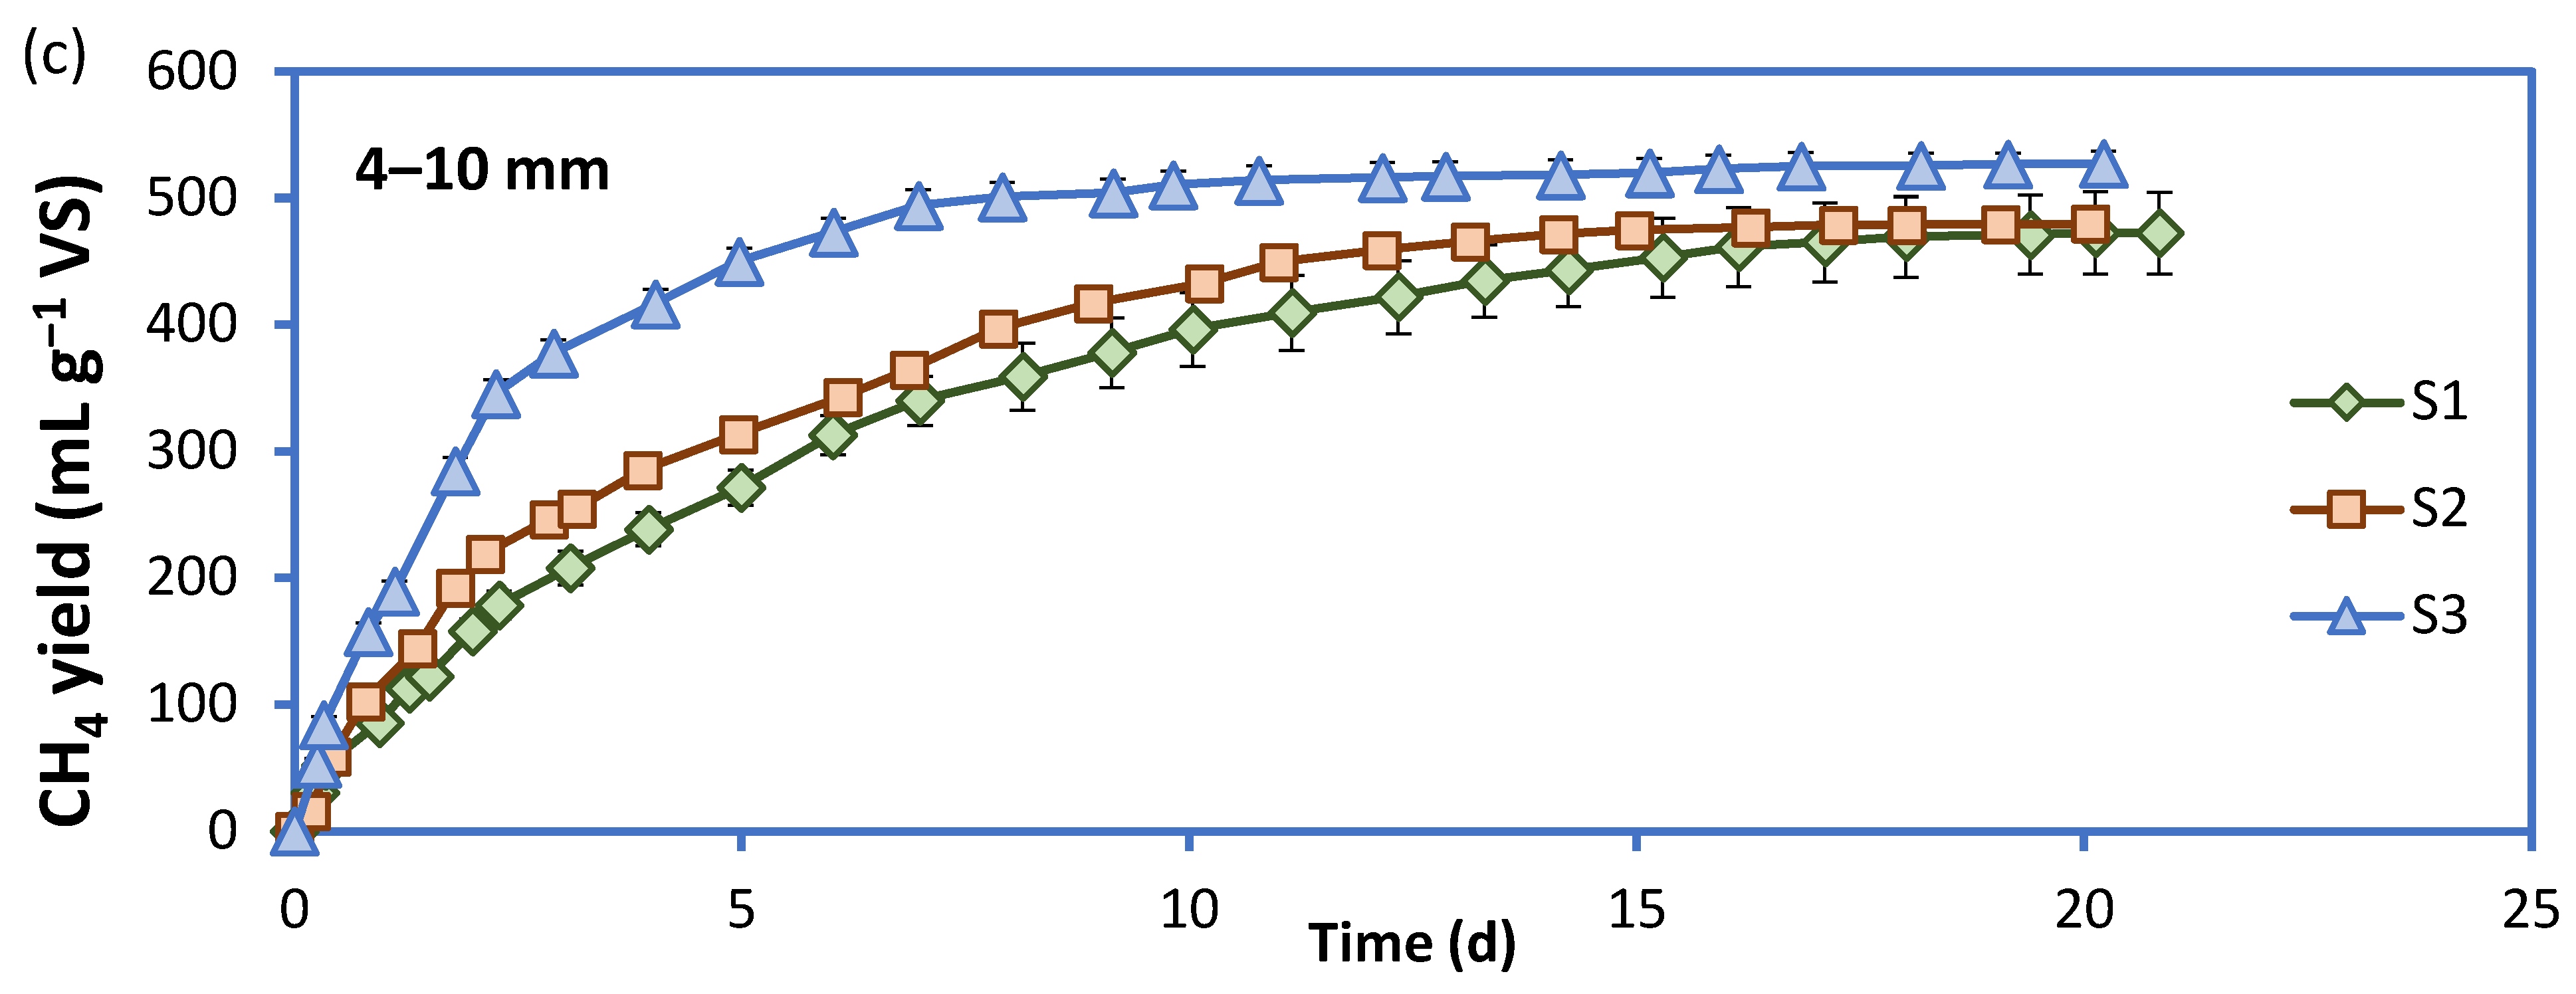
2.3. Batch Anaerobic Digestion Assays

The FVW samples were digested in 500 mL glass bottles with a 420 mL working volume, in triplicate, under mesophilic conditions (37 °C). The inoculum consisted of 400 mL of anaerobic sludge (pH = 7.22, Total Solids; TS = 0.95–1.15 g L−1, Volatile Solids; VS = 75–76% TS) from a municipal wastewater treatment plant. Before inoculation, anaerobic sludge was left at 37 °C for five (5) days to degasify. The ratio of substrate VS over inoculum VS was set at 0.5. NaHCO3 (1.68 g) was added to increase the alkalinity from 1400 to 3100 mg CaCO3 L−1. Blank tests were also prepared using the inoculum only and tap water instead of the substrate. There was no addition of macro or trace elements. Oxygen from the headspace of the batch reactors was removed by N2/CO2 (80/20) flushing for 1 min, followed by sealing the reactors with rubber stoppers. After sealing, the batch reactors were placed on magnetic stirrers at 360 rpm inside the incubator. The headspace of each reactor was connected to a NaOH (6 N) trap to remove biogas CO2. The methane volume produced was measured in mL through the displacement method. Any gas volume was estimated at standard temperature and pressure (0 °C, 1 atm) conditions (STP). In all cases, the methane from the blank assays was subtracted. Data from the BMP tests were kinetically analyzed as per the first-order kinetics model (Equation (1)):
B M P m o d e l = B M P m a x · 1 e k · t
where BMPmax (L kg−1 VS) is the ultimate methane yield, k is the first-order kinetic constant (d−1), e is Euler’s number, and t is the time (d). The model’s parameters were determined through the solver Microcal Origin 6.0, which allows multiple curve fitting with shared parameters and estimates the confidence and prediction bands at a 95% confidence level. The goodness-of-fit was assessed via the determination coefficient (R2) and chi-squared (χ2) as calculated by Microcal Origin.

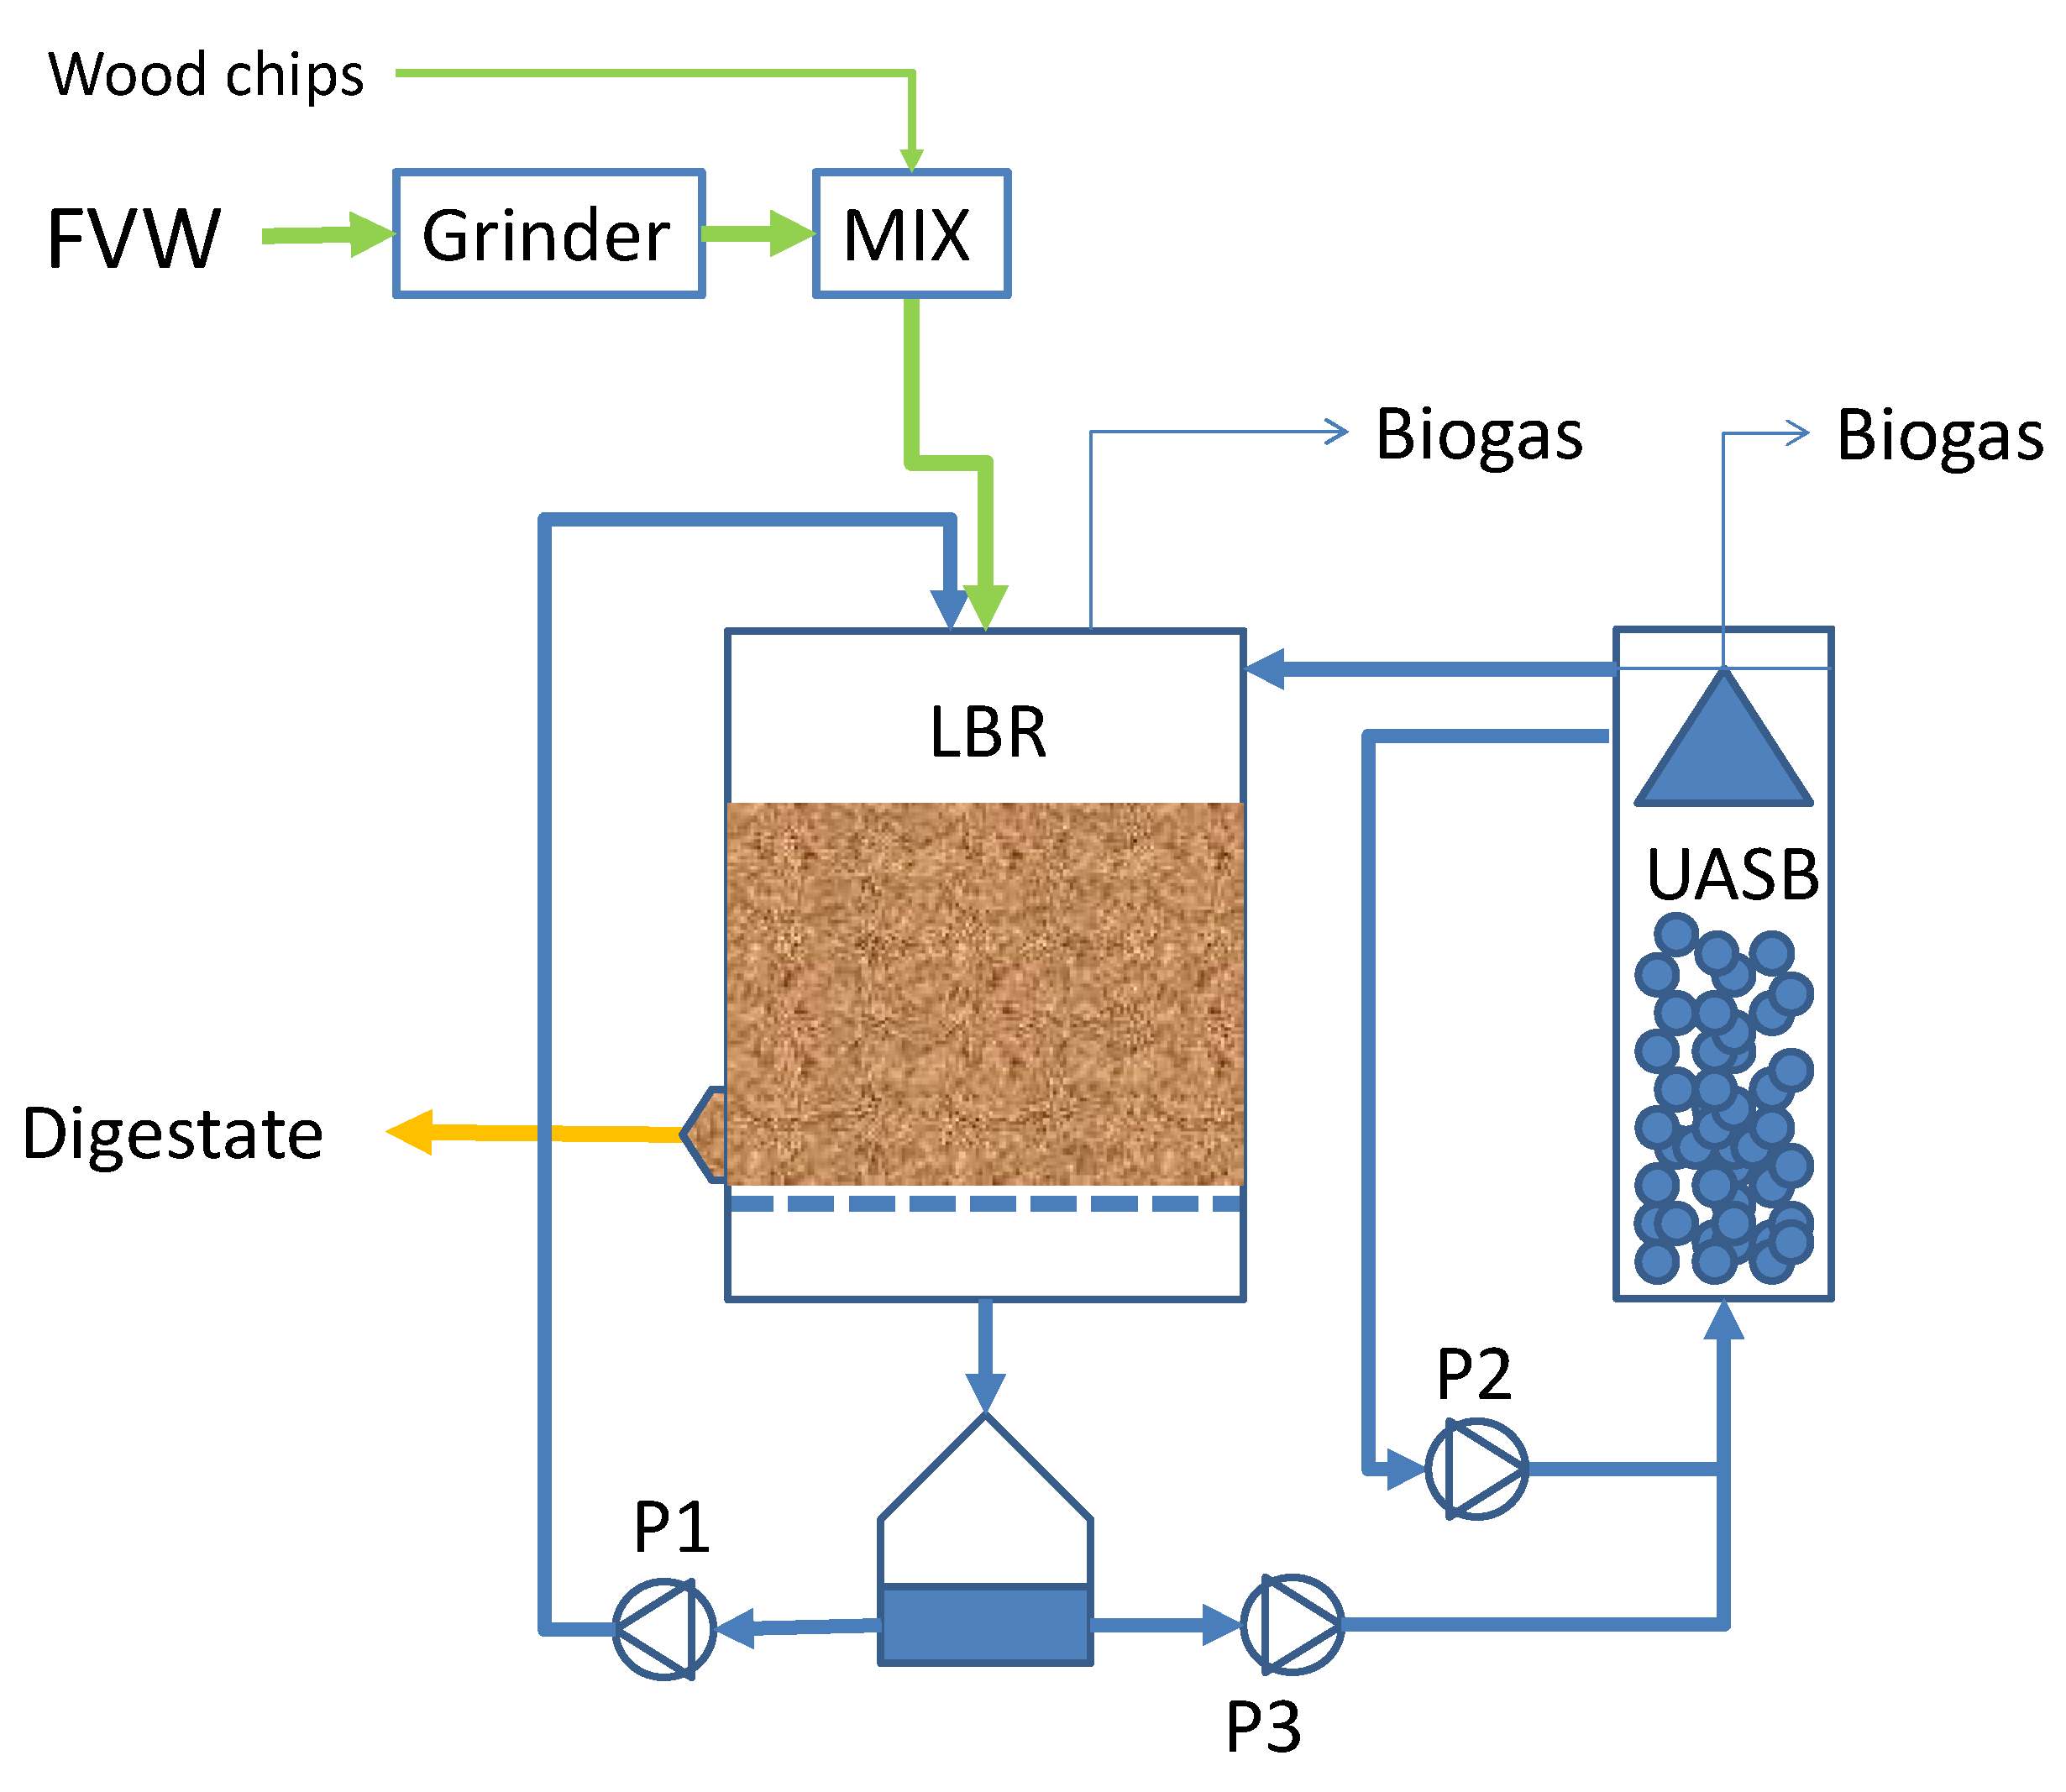
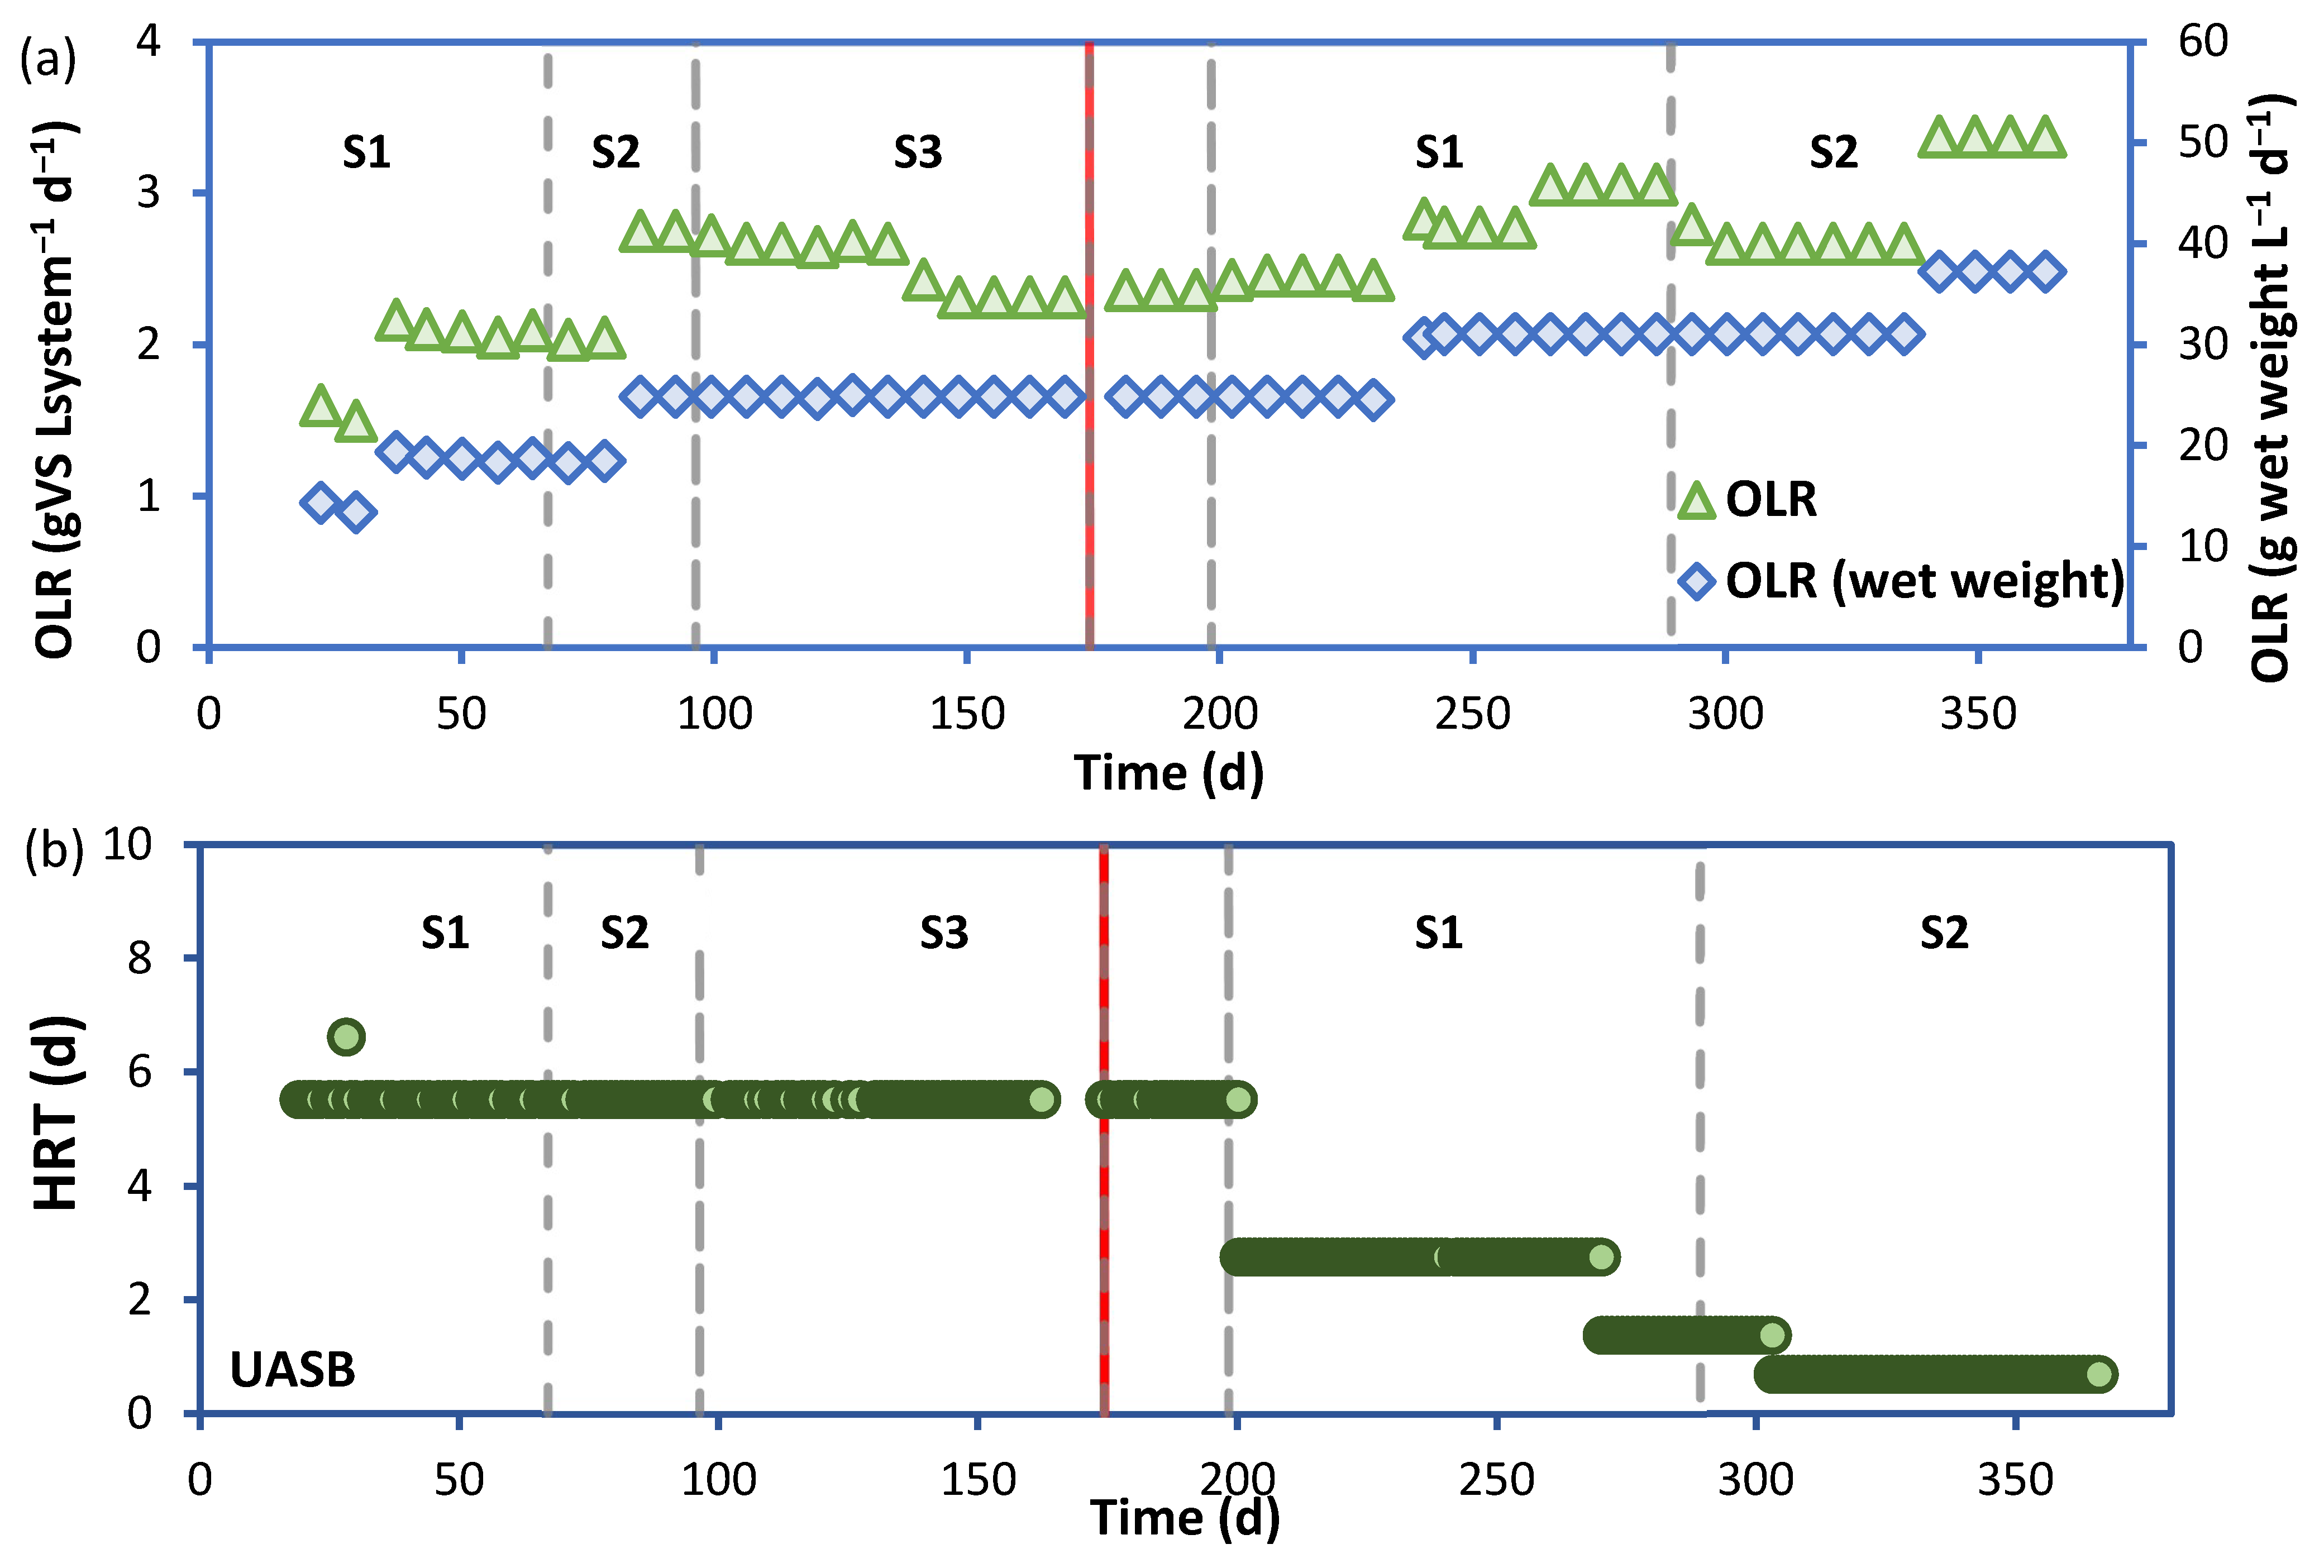
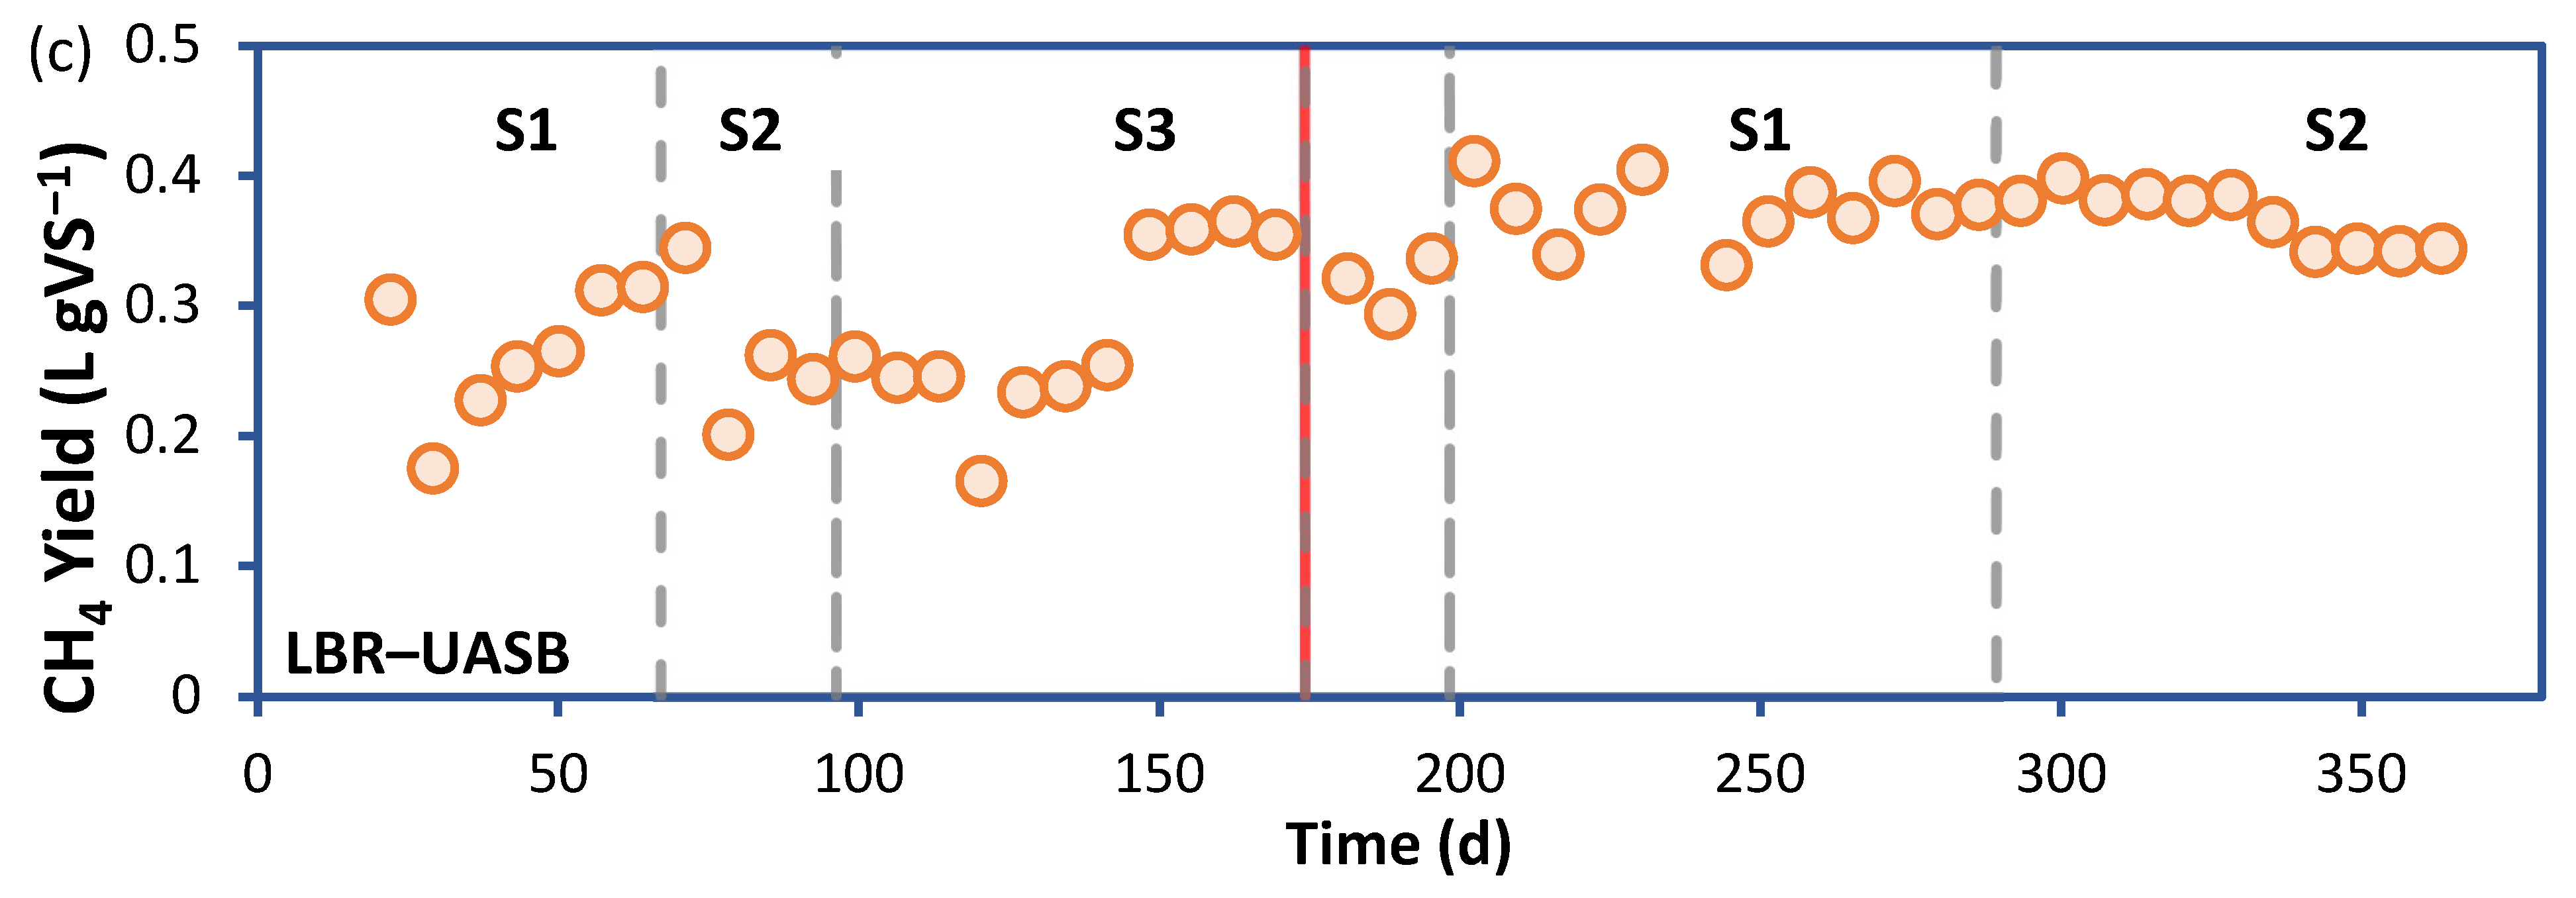
2.4. Bench-Scale Reactor Design and Operation

The bench-scale reactor consisted of an LBR and UASB reactor. The LBR was made of glass (7 cm internal diameter and 21 cm bed depth, with a total volume of 1.9 L and a working volume of 1.3 L). The UASB reactor was also made of glass (8 cm internal diameter and 60 cm total height, with a total volume of 3 L and a working volume of 2.15 L). A 4 mm screen was placed at the bottom of the LBR to facilitate leachate separation and its collection in a tank (working volume 1 L) underneath (Figure 1). The leachate was recirculated continuously to the top of the LBR at a constant flowrate of 13.8 L LLBR−1 d−1 and fed to the UASB reactor at gradually increasing flowrates of 0.18, 0.36, 0.72, and 1.45 L LUASB−1 d−1. The UASB effluent was recirculated continuously to the bottom of the UASB reactor at a constant flowrate of 37.2 L LUASB−1 d−1. Peristaltic pumps (Injecta NK.LP180, Italy and Watson Marlow 530S UK) were used to control the flows between the bioreactors.
The LBR was fed three times per week (Monday, Wednesday, and Friday, respectively), adding 150 to 250 g (corresponding to 16 to 27 g VS) FVW of the 0–10 mm fraction, previously mixed with 0.39 ± 0.03 gTS wood chips per gTS of FVW mixture (Plospan Classic Wood shavings) to improve the water leaching/drainage. Before feeding, a portion of the LBR bed was removed from an opening at the bottom of the column to ensure that the bed volume would remain constant after feeding. The removed solids were characterized as per their VS, and the retention time (RT) was determined as the reactor volume per volume of FVW fed to the LBR. The RT was 6 d considering the LBR volume and 15.8 d considering the total system volume. Following FVW feeding, the LBR was flushed with N2/CO2 (80/20) to ensure anaerobic conditions. Then, the leachate was removed again under anaerobic conditions. The BMP of wood chips (Figure S3 in the Supplementary Materials) was 14 ± 2 L kg−1 VS and considered negligible.
The UASB reactor was inoculated with 500 mL granular sludge from an external circulation sludge bed (ECSB) reactor treating cheese industry wastewater. The main characteristics of the inoculum were: pH = 7.15, electrical conductivity (EC) = 10 mS cm−1, total suspended solids (TSSs) = 60.7 g L−1, volatile suspended solids (VSSs) = 52.87 g L−1. Trace elements were added in the leachate tank at start-up and re-start-up of LBR at the following concentrations (in g L−1): FeCl2·4H2O, 0.0987; CaCl2·2H2O, 0.0673; MgCl2·6H2O, 0.4847; KCl, 0.35; MnCl2·4H2O, 0.0053; CoCl2·6H2O, 0.008; H3BO3, 0.0015; CuCl2·2H2O, 0.000721; Na2MoO4·2H2O, 0.00069; ZnCl2, 0.00057; NiCl2·6H2O, 0.00121; Na2WO4, 0.000063; Na2SeO3, 0.00003. A total of 0.1416 g L−1 K2HPO4·3H2O was also added [24,25]. The biogas generated from the LBR and UASB reactors was collected in separate aluminum foil bags and characterized in terms of the CH4, CO2, H2, and N2 gas content. Both reactors and the leachate tank were wrapped with heating tapes (Chromalox isopad 500W, USA) that maintained the temperature at 37 °C.
The bench-scale reactor was fed by first using the S1 mixture. The operation continued with the S2 and S3 mixtures, respectively. Due to season changes during the operation, the S1 and S2 mixtures were used once more toward the end of the experiment.

2.5. Analytical Methods

The FVW samples and different fractions were dried (105 °C) and ground. The chemical characterization included the TS, VS, total Chemical Oxygen Demand (COD), and Total Kjeldahl Nitrogen (TKN), and was performed according to standard methods [26]. All analyses were performed in triplicate using pro-analysis grade reagents. Concentrations of volatile fatty acids (VFA) were determined in the leachate collection tank and the UASB reactor effluent using a gas chromatography (GC)-flame ionization detector (FID) system (Shimadzu, GC-2014). A capillary FFAP column was used. The temperatures set in the injector and detector were 230 and 260 °C, respectively. The oven temperature program started at 50 °C and was ramped to 200 °C at 10 °C min−1 [27]. The biogas composition obtained from the LBR and UASB reactors was determined using a GC-thermal conductivity detector (TCD) system (Shimadzu, GC-2014). The detector, injector, and oven temperatures were constant at 120, 110, and 100 °C, respectively. Argon was used as the carrier gas. The biogas and methane volume in L were expressed at STP conditions [27].

3. Results

3.1. Fractionation of Seasonally Generated FVW

The composition of FVW varies throughout the year. The proportion of fruits in the FVW mixture increased from autumn/winter to summer (Figure 2a), while the leafy vegetables decreased from autumn/winter to summer (Figure 2b). The non-leafy vegetables followed the trend observed in the case of fruits (Figure 2c).
Mechanical FVW pretreatment (shredding) was applied in the present work to reduce the size of feedstocks. The shredding procedure was repeated to check whether reproducible TS fractions were obtained (Figure 3). It was found that the 4–10 mm fractions contained the highest TS in all mixtures. Within the 4–10 mm fractions, the autumn/winter mixture was in the highest percentage among all mixtures (65.7 ± 5.7%), while within the 0–4 mm fractions, the summer mixture was in the highest percentage (31.6 ± 7.6%).
The overall fractions (0–10 mm) were highly biodegradable with BMP values of all season mixtures averaging 420 ± 9 L kg−1 VS with low standard deviation (Figure 4a). However, several differences were observed in the subfractions regarding the ultimate methane yields and methane production rate constants; the fraction 0–4 mm of all seasonal mixtures yielded methane at lower values (396 ± 41 L kg−1 VS) compared to the 4–10 mm fraction (493 ± 30 L kg−1 VS) (Figure 4b,c and Table 1). The latter mainly consisted of fruit and vegetable pieces (i.e., most FVW solids) (Figure 3 and Table 1). The former included water, small chopped leaves–stalks, tiny fruit seeds, and FVW juices. Regarding TKN, no significant differences were observed among the two fractions for each mixture (Table 1). The S1 mixture contained higher TKN followed by S2 and S3, which is compatible with leafy vegetables at a higher percentage in the S1 mixture than S2 and S3 (Figure 2). Regarding COD, it was evident that the 4–10 mm fractions of the S1 and S2 mixtures contained higher COD than the 0–4 mm fractions, which could explain the higher ultimate BMP value (Table 1). However, this was not the case for the S3 mixture, which contained a higher COD in the 0–4 mm fraction but yielded a lower BMP than the 4–10 mm fraction.
First-order kinetics (Equation (1)) was used to determine the kinetic constant and the maximum BMP in each case, fitting all replicate experiments. This simple kinetics is adequate to simulate the methane production from particulate feedstocks since particulate organic matter hydrolysis is slow and usually determines the rate of the whole process. The chi-squared (χ2) and the coefficient of determination (R2) were used to evaluate the goodness-of-fit (Table 2). It seems that Equation (1) was adequate to simulate the accumulated methane yield in most cases. In particular, in the case of fractions 0–10 mm and 4–10 mm, which mainly consisted of particulate matter, the goodness-of-fit was much better than the smaller fractions (0–4 mm). However, first-order kinetics was applied in all cases to make the comparison of the kinetic constants feasible.
Moreover, the confidence and prediction bands were estimated as depicted in Figures S3–S5 (Supplementary Materials). The kinetic constant, k, is proportional to the methane production rate. There was a significant increase in the rate constant from 0.169 ± 0.005 to 0.286 ± 0.006, and finally to 0.557 ± 0.022 d−1 for the autumn, spring, and summer mixtures, respectively. Fruits and vegetables dominated the S3 mixture, while leafy vegetables prevailed in the S1 mixture (fruit comprised 36%, 43%, and 53% of the S1, S2, and S3 mixtures, respectively) (Figure 2). The S1 mixture was prepared with more citrus fruits (oranges, mandarins, lemons, and grapefruits) compared to the S3 mixture, where fruits with high water and soluble carbohydrate content were included. Fruits rich in carbohydrates were also present in the S2 mixture but in lower quantities than the S3 mixture.
The 0–10 mm fractions produced methane at intermediate rates and final yields, averaging the BMP profiles of the 0–4 and 4–10 mm FVW fractions. In most cases, the methane production rate constant of the 0–4 mm fractions was higher than the 4–10 mm fractions (Table 2). On the other hand, the BMPmax values showed the opposite trend, with the BMPmax of the 0–4 mm fractions being lower than the 4–10 fractions (Table 2). The shredding of FVW not only resulted in a size reduction, but also released water (and water-soluble organics) and small (shredded) leaves, stalks, and seeds from the solid matrix. This fraction exhibited a higher rate constant but lower ultimate yield, possibly due to low biodegradability or inhibitory compounds.

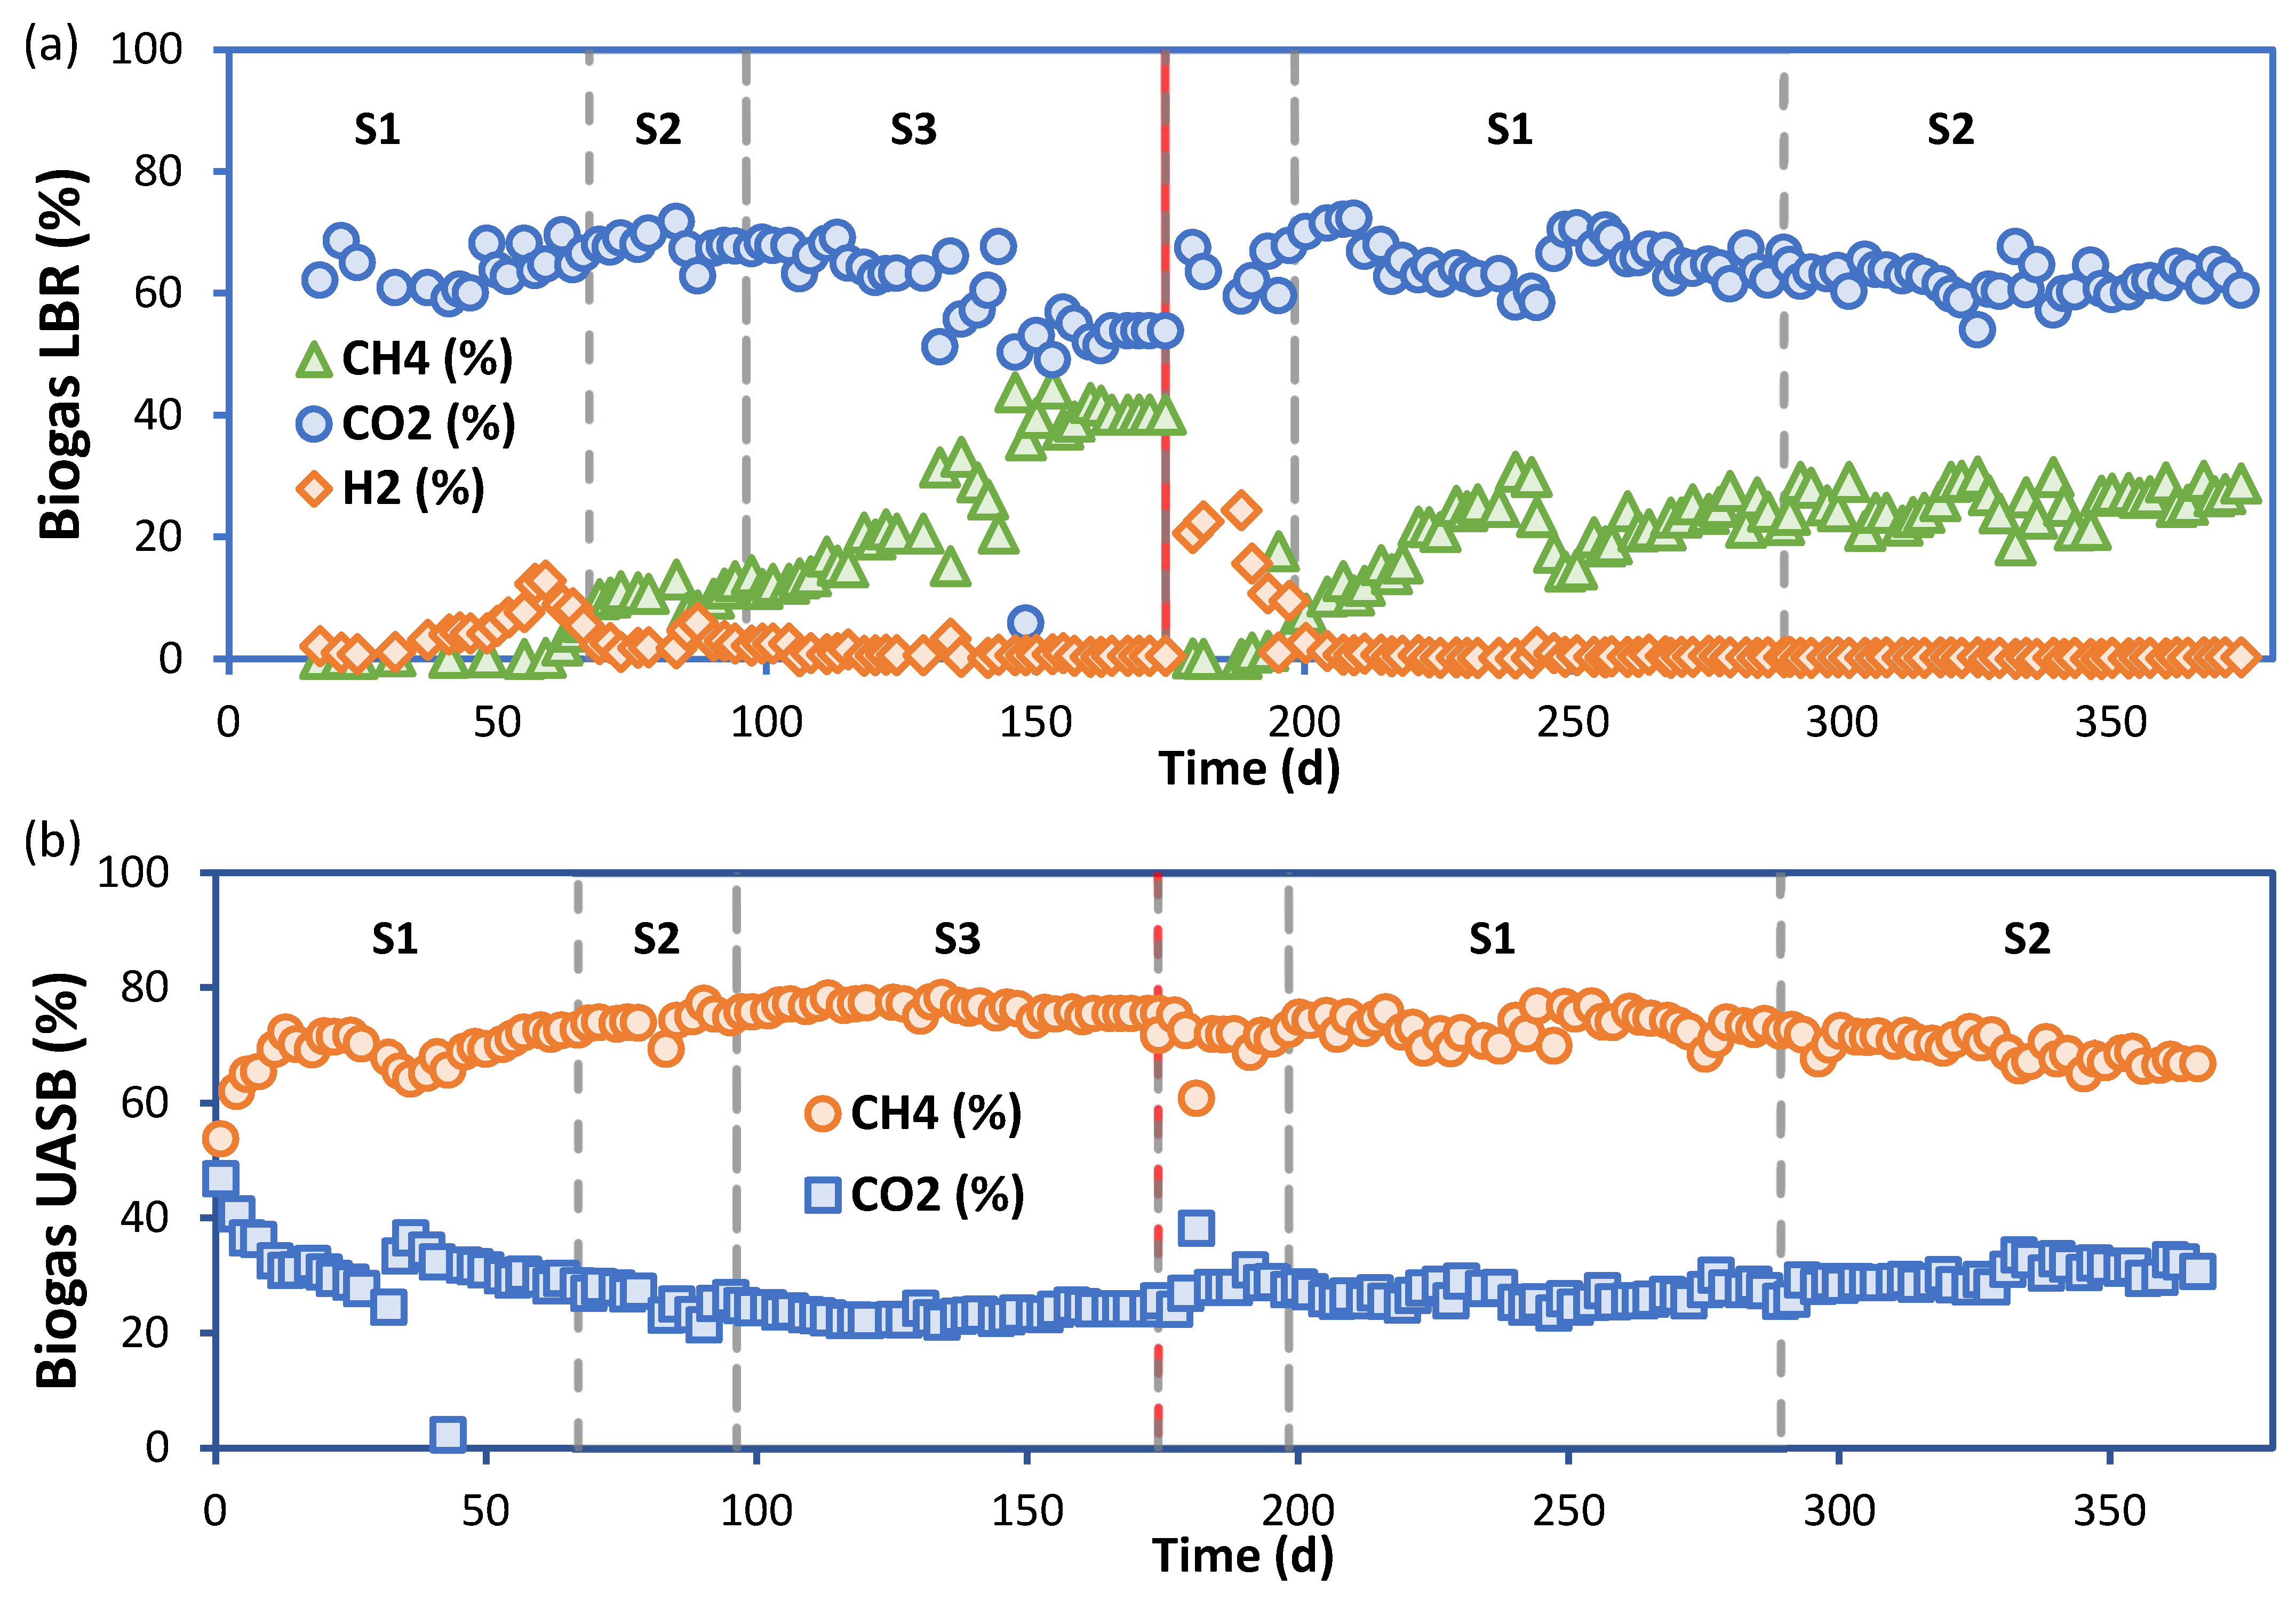
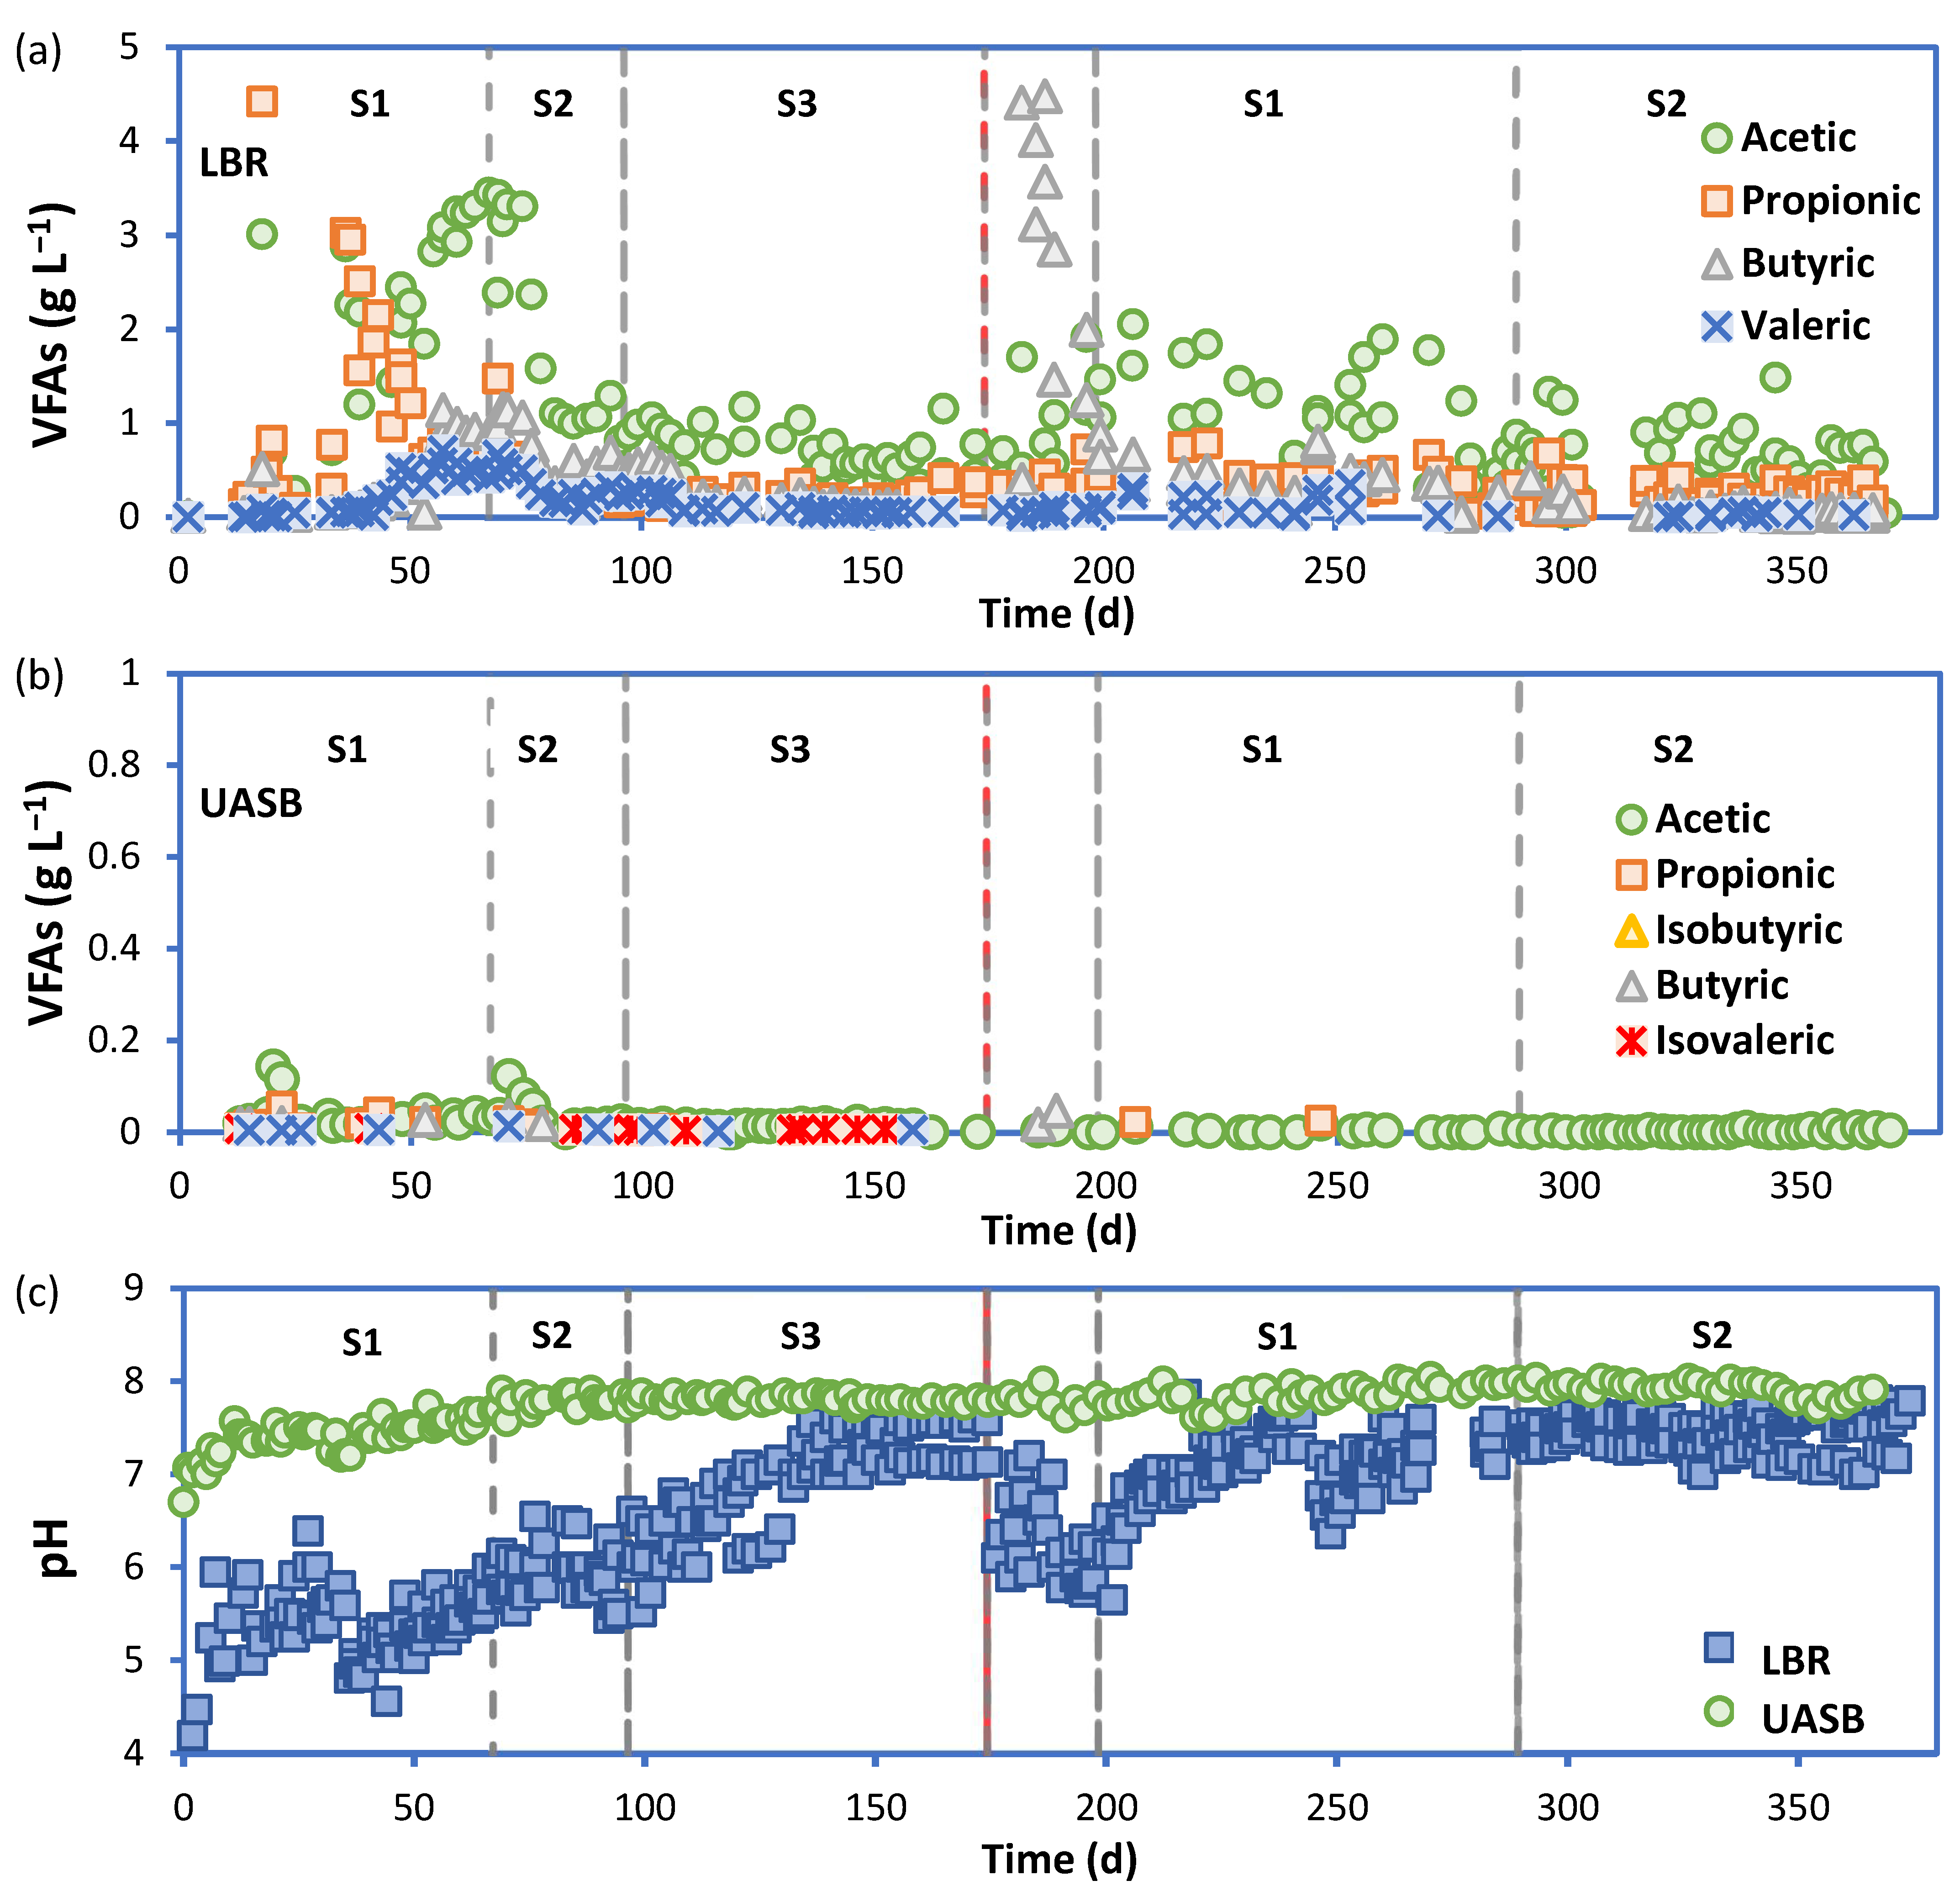
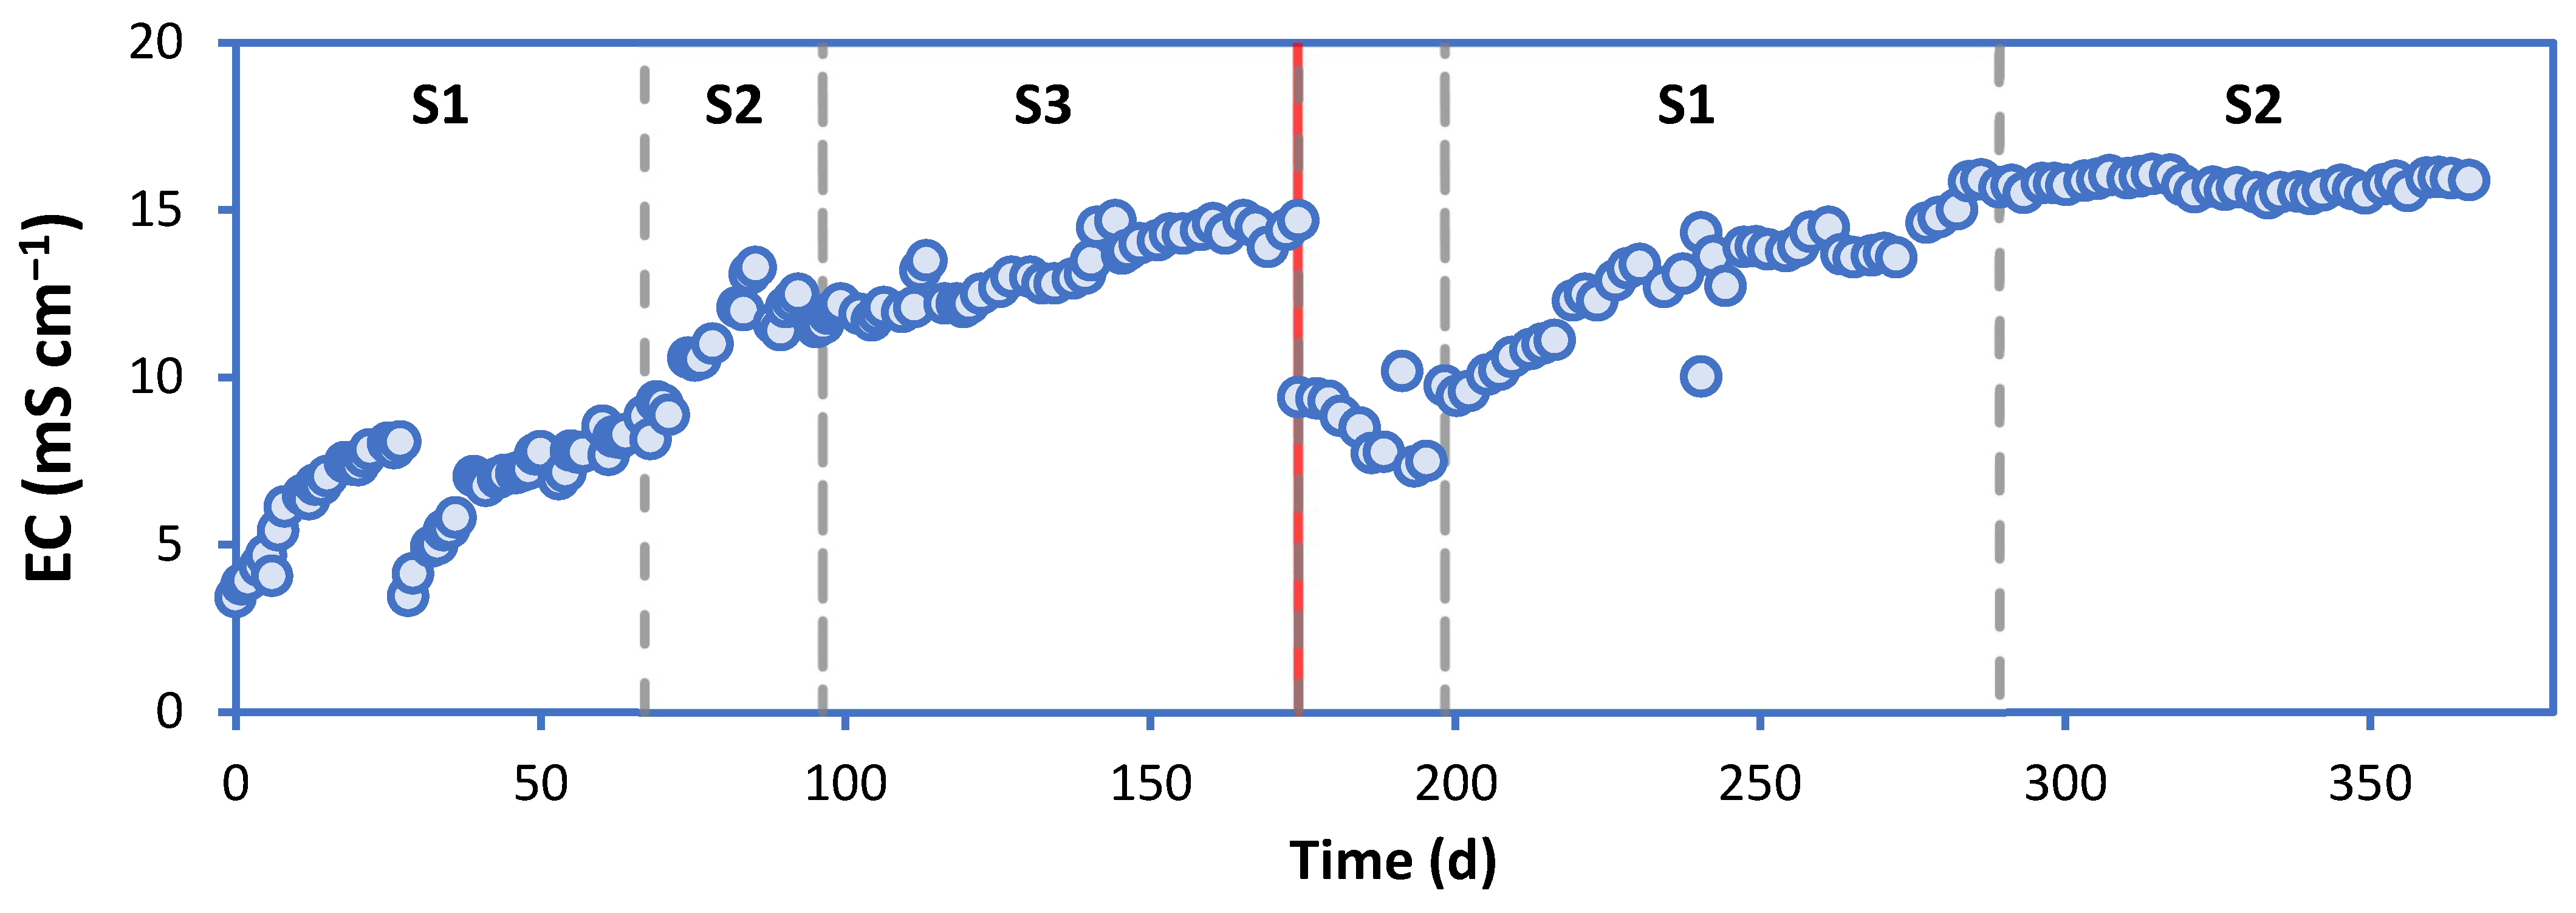
3.2. Performance of the LBR-UASB

The LBR-UASB system was operated for over a year using seasonal FVW. Feeding was performed thrice weekly, and the OLR was maintained on average at 3.07 ± 0.7 g VS L−1 d−1 (Figure 5a). The system started using the S1 mixture (Period I). During this period (days 0–57), methanogenesis was suppressed, and the LBR gas mainly consisted of carbon dioxide (55–65%) and hydrogen (3–12%) (Figure 6a). The biogas composition was consistent with the high VFA concentrations (up to 8 g L−1 of acetic and propionic acids) (Figure 7a) and the low pH (5.44 ± 0.35) (Figure 7c) of the leachate. The UASB reactor was operated at an HRT = 5.6 d (Figure 5b), and the pH remained neutral (7.49 ± 0.14) (Figure 7c) with low VFA concentrations (<0.05 g L−1) (Figure 7b). The biogas recovered had high methane content (74.2 ± 1.9%) (Figure 6b). By the end of period I, the LBR gas hydrogen content decreased to 2.0 ± 0.5%, and the methane content increased from zero to 10.5 ± 0.6%, indicating that LBR methanogenesis had started to establish. The methane yield of the LBR-UASB system (Figure 5c) during period I was 278 ± 96 L kg−1 VS and was primarily attributed to the UASB.
During period II (days 57–87) (S2 mixture), the LBR gas hydrogen content remained low (2.5 ± 0.5%), and the methane content increased from zero to 12.5 ± 0.8% (Figure 6a). The VFA concentrations were between 2 and 4 g L−1 (Figure 7a). The pH of the leachate was 6.00 ± 0.32 (Figure 7c). As in period I, the methane yield was 265 ± 70 L kg−1 VS, primarily due to the UASB (Figure 5c).
During period III (days 87–155) (S3 mixture), the VFA concentration of the leachate decreased below 2 g L−1 (Figure 7a), and the pH became neutral (Figure 7c). As such, the LBR gas hydrogen content was lower than 0.5%, and methane gas increased to 40% (Figure 6a). From day 125 and on, steady-state conditions were recorded, and the overall methane yield stabilized to 360 ± 30 L kg−1 VS (Figure 5c). Under these conditions, the LBR became methanogenic and contributed to 60% of the overall methane yield.
Due to damage in the LBR, it was decided to restart the LBR with the S3 mixture. In this case (period IV, days 160–180), a sharp increase in VFA concentrations was again observed (up to 8 g L−1 of butyric and acetic acids) (Figure 7a), which was accompanied by an LBR gas hydrogen content 20–22% (Figure 6a). However, within 20 days, the LBR hydrogen gas decreased below 1%, and methane gas began to form. Changing the incoming FVW to the autumn/winter mixture (Period V, days 180–270), the LBR gas methane content increased and stabilized to 25% (Figure 6a), followed by neutral pH (Figure 7c) and low VFA concentrations (below 2 g L−1) of the leachate (Figure 7a). During period V, the HRT of the UASB reactor decreased from 5.6 to 2.8 d (Figure 5b), which did not affect the UASB process efficiency (in terms of effluent COD, accumulation of VFA, pH, and biogas composition). As such, the methane yield for the S1 mixture was 375 ± 54 L kg−1 VS (Figure 5c), and the UASB released 74% of the methane gas. During period VI (days 270–350), the system was fed with the S2 mixture, while the HRT of the UASB was further decreased to 1.4, and finally to 0.7 d (Figure 5b). The performance of the UASB remained unaffected, similar to period V, and the overall methane yield was 364 ± 34 L kg−1 VS (Figure 5c). During the whole study period, the concentrations of COD and VFA at the UASB reactor effluent were stable (COD total: 2.42 ± 0.22 g L−1; COD soluble; 1.23 ± 0.04 g L−1; VFAs < 0.05 g L−1; Figure 7b), independently of the applied HRT or FVW mixture, which indicates high process efficiency.
The quantity of shredded FVW fed to the LBR three times a week (150 to 250 g) decreased to 60–92 g per feed at the LBR effluent within 4 to 5 days. The VS removal was estimated per loading between 49 and 77%, averaging 65 ± 7%. Moreover, the average BMP of the effluent solids was 74 ± 17 L kg−1 VS (Figure S6).
It is worthwhile mentioning that the humidity contained in the FVW entering the LBR was adequate to sustain the electrical conductivity of the circulating leachate constant (14.4 ± 0.25 mS cm−1) after being built-up due to leachate recirculation and enrichment with inorganic compounds (Figure 8). At the restart-up of the LBR, the electrical conductivity dropped since the fresh FVW mixture was packed in the LBR. After this, the electrical conductivity increased to 15.75 ± 0.2 mS cm−1.

4. Discussion

4.1. Composition and Methane Yield of Seasonally Generated FVW

Fruit and vegetable wastes are carbohydrate-rich substrates with low lignocellulosic content [1,28]. Mozhiarasi et al. [6] studied the seasonal FVW composition in India. Their sampling campaign was performed from a storage heap outside a market building in June, October–December, and January–May. All samples were characterized by high carbohydrate content (on average 680 and 700 g kg−1 TS for vegetable and fruit market wastes, respectively), followed by proteins (115 and 123 g kg−1 TS, respectively) and lipids (52 and 59 g kg−1 TS, respectively). Edwiges et al. [4] studied FVW collected from a wholesale market in Brazil. They recovered 33 kinds of fruits and vegetables (48% fruits and 52% vegetables), with no individual type representing more than 7% of the mixture on a wet-weight basis. The FVW mixture was ground and analyzed for total carbohydrates (552 g kg−1 VS), proteins (158 g kg−1 VS), and lignocellulose (111 g kg−1 VS cellulose, 114 g kg−1 VS hemicellulose and 38 g kg−1 VS lignin). Di Perta et al. [29] similarly found that FVW was characterized by a high total carbohydrate content (720–920 g kg−1 VS), with the soluble carbohydrate fraction comprising 57 and 90% of the total.
Mixtures of FVW simulating those generated by Mediterranean open markets during the autumn/winter, spring, and summer seasons were prepared by different research groups [7,18,30]. Trujillo Reyes et al. [18] and Scotto Di Perta et al. [29] studied the same mixtures of FVW as in the present study but reduced the size of the mixtures to different levels. Trujillo Reyes et al. [18] studied three size fractions (0–4 mm, ~6 mm, and >10 mm), while Scotto Di Perta et al. [29] reduced the size to 5 mm. In the present study, grinding to 10 mm resulted in the fractionation of the ground material, which was separated into size fractions of 0–4 mm and 4–10 mm. Optical observation verified that different parts of the FVW were distributed in the two fractions; water-soluble constituents but also chopped leaves and stalks or tiny fruit seeds preferred the 0–4 mm fraction. Therefore, the size reduction effect was studied on the FVW mixtures in [18,29]. In contrast, the size fractionation effect was studied after grinding to 10 mm in the present study. The VS content of the FVW mixtures was between 84 and 94%TS with a slightly increasing trend in the order of autumn/winter < spring < summer [7].
Regarding the seasonality effect on the COD content of the FVW mixtures, Scotto Di Perta et al. [29] reported that the autumn/winter mixture contained the highest COD per mass of VS, but this was not verified by Trujillo-Reyes et al. [18] and the present study. On the other hand, they all agreed that there was an increasing trend of the soluble COD and soluble carbohydrates in the order of autumn/winter < spring < summer. In the present study, the mass of the 0–4 mm over the 4–10 mm fractions increased in the same order (Table 1), concluding that seasonality and grinding will result in mixtures richer in soluble organic matter and fractionating toward the smaller size scale in the following order: autumn/winter < spring < summer. In the present study, the TKN measurements showed a decreasing trend in the order of autumn/winter > spring > summer. This is compatible with the results by Trujillo-Reyes et al. [18], who reported an increasing C:N ratio in the order of autumn/winter~spring < summer. Korai et al. [31] found that the C:N ratio in fruits was higher (13–16) than in vegetables (8–9). Therefore, the higher participation of leafy vegetables in autumn/winter and spring than in summer FVW may be a determinant factor of the TKN and C:N ratios in these mixtures. On the other hand, the study of Arhoun et al. [11] showed that the C:N ratios of FVW were very similar throughout the four seasons, averaging 24. However, no quantitative data on the vegetable and fruit content in the various mixtures were reported in the latter study.
The BMP of FVW typically ranges between 340 and 470 L kg−1 VS with an average value of 420 L kg−1 VS [21], which agrees with the results of the present study. FVW from Pakistan’s fruit shops and vegetable markets was collected during summer and winter [31]. Summer mixtures included mostly discarded mango and peels (35%), watermelon (25%), and melons (20%), while winter mixtures consisted of discarded orange and peels (35%), grapefruit and peels (25%), and banana and peels (20%). The BMP tests revealed a similar methane yield for the summer and winter mixtures (i.e., 370 and 400 L kg−1 VS, respectively), agreeing with the results of the present work. Similarly, in the study of Papirio et al. [7], no significant difference in the BMP of seasonal FVW mixtures was reported. On the other hand, in the study of Korai et al. [31], winter blends of fruit and vegetables (1:1) yielded a higher BMP (460 L kg−1 VS) than summer blends (420 L kg−1 VS). Similarly, Arhoun et al. [11] showed that summer mixtures had the lowest BMP (323 L kg−1 VS) than the other seasons (393–416 L kg−1 VS). Reyes et al. [18] reported the highest BMP in the spring mixtures chopped at 10 mm (45% and 67% higher than the BMP of the summer and autumn/winter seasons, respectively). Therefore, there are contradicting results regarding the effect of the seasonality of the BMP values of FVW in the literature, probably because of the high heterogeneity of the mixtures, which induces high uncertainty when trying to draw general conclusions.
Decreasing the particle size of FVW by mechanical pretreatment affected both the methane production rate and the ultimate yield, as evidenced by the present work results. Upon grinding the FVW, water-soluble organics are released from the solid matrix into the smaller fraction (0–4 mm), which contains more humidity (Table 1). This resulted in a higher methane production rate, as expressed by the higher rate constant (Table 2) compared to the rate constant of the other fractions. However, fine grinding often results in the release of low biodegradability or inhibitory compounds such as fragments of fruit peels, seeds, and leaves. Previous studies showed that the methane yield from fruit peels was low (from zero to 202 L kg−1 VS) compared to fruit pulp (287–468 L kg−1 VS) and seeds (504–657 L kg−1 VS) [15]. This was attributed to the chemical composition (lignocellulosic structure), volatile organic compounds (flavors–flavonoids), and the physical structure of fruit fragments. Similarly, Zhao et al. [28] revealed low BMP values and an extended lag-phase in the BMP of different fruit seeds and peels/shells, especially those rich in lignin.
Trujillo-Reyes et al. [18] found that FVW ground at 4 mm yielded methane at a higher rate (approximately 150 L kg−1 VS d−1 irrespectively of the seasonality) but at a lower ultimate yield (from 482 to 310 L kg−1 VS in the spring mixtures as the size was reduced from 10 to <4 mm). To compare the methane production rate with the results of the present study, the BMPmax was multiplied with the rate constant (Table 2), and it was found that the methane production rate ranged from 110 to 162 L kg−1 VS d−1 (the increasing rate was in the order of autumn/winter < spring < summer). However, the increasing trend in the methane production rate with the reducing size reported in [18] was not consistent in the spring season. At the same time, in the present study, this observation was not consistent in the case of the summer season. It is worth mentioning that the rate constant (k, Table 2) and the methane production rate (BMPmax*k) were found to increase in the order of autumn/winter < spring < summer in the case of all fractions in the present study. The higher rate in the case of the smaller fractions is probably due to the smaller size and more soluble organic matter, which promotes the biodegradation rate. On the other hand, the lower ultimate yield of the smaller fractions may be the release of inhibitory compounds that have severe effects as the BMP test evolves (and not from the start). It is known that fruits and vegetables contain terpenes (mainly monoterpenes) with potential antimicrobial properties, which may affect the stability of the anaerobic digestion of wholesale market waste at high organic loading rates [32].

4.2. Comparison of LBR/UASB with Conventional CSTR

Table 3 summarizes the performance of the conventional CSTR and the LBR/UASB system regarding methane yield and VS removal. The data collected from previous studies include anaerobic digester performance parameters during stable operation at low VFA concentrations and the maximum methane yield. Shredded fruit and vegetable market wastes (no particle size was given) were digested by Lin et al. [33] with a methane yield of 420 L kg−1 VS under an OLR = 3 g L−1 d−1. Jiang et al. [34] digested ground vegetable wastes (no particle size was given) and showed high process efficiency at OLR between 3–4 g L−1 d−1 after trace element supplementation. When trace elements were excluded, increasing the OLR higher than 2 g L−1 d−1 was impossible. In a similar study, Li et al. [35] recorded high process efficiency at OLR between 3.0 and 3.5 g L−1 d−1 when trace elements were supplemented in a CSTR treating market FVW. In a previous study without trace elements, it was impossible to operate the CSTR at an OLR higher than 1 g L−1 d−1 [36]. Viswanath et al. [37] used a CSTR at sub-optimum temperature conditions (30 °C) and recorded a methane yield of 370 L kg−1 VS while treating a mixture of fruit and vegetable processing (industrial) residues. The authors provided no data for digester effluent VS nor VS removal efficiency; however, the process performance deteriorated with increasing influent VS concentration (from 56 to 75 and 94 g kg−1).
Similarly, Trujillo-Reyes et al. [18] digested FVW at a high influent VS concentration (100 g kg−1), and it was impossible to increase the OLR higher than 1 g L−1 d−1. Edwidges et al. [4] operated a CSTR at an HRT of 30 d using whole market FVW with increasing influent VS concentration. Maximum process efficiency was recorded between 60 and 90 g kg−1 at influent VS concentration. At higher concentrations (100–120 g kg−1), the CSTR encountered VFA accumulation and low methane yield. Considering the above, it is speculated that high influent VS concentration in CSTRs treating FVW may gradually displace digester anaerobic biomass (inoculum). This was evidenced in the study of Trujillo-Reyes et al. [18], who noticed a severe reduction in the species diversity and relative abundance of methanogenic archaea in all digesters. Decreasing the FVW VS content requires water supplementation (FVW dilution), which may increase the quantity of liquid digestate for treatment and disposal. Since trace element supplementation was beneficial to ensure high methanogenic activity in CSTRs, increasing water addition would result in micro-nutrient losses with the liquid digestate.
The proposed LBR/UASB system provides an interesting alternative for the anaerobic digestion of FVW. It can be operated at high influent VS concentrations and does not require water addition. The liquid fraction generated by the LBR, rich in soluble organics and micro-nutrients, is continuously recycled through the UASB to generate biogas. As there was no water addition, an accumulation of soluble salts occurred in the liquid fraction (evidenced by the gradual increase in the electrical conductivity); however, this accumulated up to a level that was not inhibitory for anaerobic digestion [38]. The humidity of the fresh FVW fed to the LBR was adequate to avert further accumulation of the electrical conductivity. The solids recovered by the LBR effluent yielded a low BMP (50–99 L kg−1 VS), agreeing with the range of 55–147 L kg−1 VS for full-scale biogas plant digestates recorded by Uludag-Demirer and Demirer [39]. Mtz.-Viturtia et al. [23] operated an LBR/UASB system similar to this work. However, the feeding was a standard shredded FVW mixture, constant in composition (tomato 25%, lettuce 25%, cucumber 25%, cauliflower 10%, orange 7.5%, melon 7.5% w/w) instead of seasonally variable as in the present study. The LBR became methanogenic within 15–20 days, and the methane yield was 400 L kg−1 VS while the system was operated at an OLR of 3 g L−1 d−1. Therefore, under similar operational conditions, the LBR/UASB systems responded equally well, albeit the composition of the VFW and its variability in time.
In the study of Rajeshwari et al. [40], the FVW leachate from an LBR was continuously treated in a UASB reactor at high OLR. The authors reported high UASB process efficiency when the OLR reached 15 to 20 g COD L−1 d−1. However, in the present study, the OLR of the UASB could not increase more than 10 g COD L−1 d−1 due to the oversized UASB. This indicated that the UASB could further decrease in volume, and the overall OLR of the system would be increased. Moreover, the yields obtained from the LBR/UASB reactor system are compatible with the BMP tests; irrespectively of the seasonal nature of the FVW, the yield remained high (360–375 L kg−1 VS) and close to the BMP tests (406–429 L kg−1).
Therefore, the two parts of the present study (short-term and long-term experiments) agree that seasonality does not cause stability or other problems during the anaerobic digestion of FVW. It is important to note, though, that the high heterogeneity of the FVW, affected by local, seasonal, and collection conditions, does not permit drawing definite conclusions, as evidenced by contradictory results in the literature. Furthermore, if the small size fractions created during the FVW shredding could be further processed to remove any potential inhibitory agents, the overall methane yield could be increased. Finally, this work was performed with FVW mixtures prepared using fresh fruits and vegetables; thus, an industrial prototype must be designed and operated with raw FVW from open markets.
Table 3. Comparison of FVW anaerobic digestion using LBR/UASB and conventional CSTR.
FVW Origin–PretreatmentV (L)T (°C)VS in
(g kg−1)
VS out
(g kg−1)
RT (d)OLR
(g L−1 d−1)
YCH4
(L kg−1 VS)
VS r (%)Reference
CSTR
Industry FVW–ground453038nr202370Nr[37]
Market FVW–shredded435651822342072[33]
Market VW–ground 4–5 mm603560–70Nr20334083[35]
Market FVW–ground 10 mm43790Nr303285Nr[4]
Simulated VW–ground 1.5357214203–435084[34]
Simulated FVW–ground 4 mm1.73595Nrest 1001254Nr[18]
Simulated FVW–ground 10 mm1.735100Nrest 1001229Nr[18]
Simulated FVW–ground 10 mm103511019453.545082[41]
LBR/UASB
Simulated FVW–ground 1.3 + 0.53557Nr13 + 5340072[23]
Simulated FVW–ground 10 mm1.2 + 2.2371401836 + 103.1 ± 0.7 360–37583This study
est: estimated, Nr: not reported, RT: retention time.

5. Conclusions

During FVW shredding, different size fractions were produced, which entailed different methane production rates and ultimate yields. The smaller fraction (0–4 mm), mainly containing soluble organics but also small leaves, seeds, etc., was characterized by a higher methane production rate, but lower ultimate yield than the larger fraction (4–10 mm). These findings were consistent for most FVW mixtures prepared throughout the year.
Treatment of FVW using the LBR/UASB system ensures a high concentration of active methanogenic biomass inside the UASB, which gradually inoculates the LBR. Under these conditions, the LBR becomes methanogenic, and the overall methane yield of FVW processing is increased. The yield remained high (360–375 L kg−1 VS) and close to the BMP tests (406–429 L kg−1), irrespective of the seasonally variable composition of the FVW mixtures.
The UASB reactor exhibited a stable performance even during operation at high influent flowrates (low HRT). Therefore, the volume of the UASB reactor should be further decreased in future studies, increasing the OLR of the system to more than 3.1 ± 0.7 g VS L−1 d−1. The LBR/UASB system requires no water addition or liquid digestate removal. Furthermore, the electrical conductivity of the recirculating medium remained at a non-inhibitory level during the study period. The digested material was characterized by low water content and BMP values. The results of this study demonstrate that the anaerobic digestion of FVW is possible using LBR/UASB technology.

Supplementary Materials

The following supporting information can be downloaded at: https://www.mdpi.com/article/10.3390/su16010050/s1, Table S1. Composition of fruit and vegetable waste mixtures used for this study; Figure S1: FVW fractionation: (a) schematic presentation of the procedure followed, (b) photographs of the fractions taken from the seasonal FVW mixtures; Figure S2: BMP of wood chips; Figure S3: BMP of S1 mixtures chopped in the 0–10 mm fraction (a) before and (bc) after separation into two individual sub-fractions (0–4 mm and 4–10 mm, respectively). Points represent the experimental data obtained in three replicates. The lines depict the analysis of the first-order kinetics model fitting (black solid line: model, black dotted lines: confidence band at 95% confidence level, magenta dotted lines: prediction band at 95% confidence level; Figure S4: BMP of S2 mixtures chopped in the 0–10 mm fraction (a) before and (bc) after separation into two individual sub-fractions (0–4 mm and 4–10 mm, respectively). Points represent the experimental data obtained in three replicates. The lines depict the analysis of the first-order kinetics model fitting (black solid line: model, black dotted lines: confidence band at 95% confidence level, magenta dotted lines: prediction band at 95% confidence level.; Figure S5: BMP of S3 mixtures chopped in the 0–10 mm fraction (a) before and (bc) after separation into two individual sub-fractions (0–4 mm and 4–10 mm, respectively). Points represent the experimental data obtained in three replicates. The lines depict the analysis of the first-order kinetics model fitting (black solid line: model, black dotted lines: confidence band at 95% confidence level, magenta dotted lines: prediction band at 95% confidence level.; Figure S6: BMP of the digestate.

Author Contributions

Conceptualization, K.S.; Methodology, A.K. and K.S.; Software, K.S.; Investigation, A.K. and K.S.; Data curation, A.K., V.D., A.E. and K.S.; Writing—original draft preparation, V.D. and A.E.; Writing—review and editing, A.K., V.D., A.E. and K.S.; Visualization, A.K., V.D. and A.E.; Supervision, K.S.; Project administration, K.S.; Funding acquisition, K.S. All authors have read and agreed to the published version of the manuscript.

Funding

This work was funded by the project entitled “Employing circular economy approach for OFMSW management within the Mediterranean countries–CEOMED” number A_B.4.2_0058, funded under the ENI CBC MED 2014–2020 program.

Institutional Review Board Statement

Not applicable.

Informed Consent Statement

Not applicable.

Data Availability Statement

The datasets generated during and/or analyzed during the current study are available from the corresponding author.

Conflicts of Interest

The authors have no relevant financial or non-financial interests to disclose.

Abbreviations

ADAnaerobic digestion
BMPBiochemical methane potential
CODTotal chemical oxygen demand
CSTRContinuous stirred tank reactors
ECElectrical conductivity
ECSBExternal circulation sludge bed
FIDFlame ionization detector
FVRFruit-to-vegetable ratio
FVWFruit and vegetable wastes
GCGas chromatography
GHGGreenhouse gas
HRTHydraulic residence time
LBRLeaching bed reactor
OLROrganic loading rate
PFRPlug-flow reactors
RTRetention time
S1, S2, S3Season 1 (autumn/winter), Season 2 (spring), Season 3 (summer)
SDGsSustainable Development Goals
STPStandard temperature and pressure conditions.
TCDThermal conductivity detector
TKNTotal Kjeldahl nitrogen
TSTotal solids
TSSTotal suspended solids
UASBUpflow anaerobic sludge bed
VFAVolatile fatty acids
VSVolatile solids
VSSVolatile suspended solids

References

  1. Ji, C.; Kong, C.X.; Mei, Z.L.; Li, J. A Review of the Anaerobic Digestion of Fruit and Vegetable Waste. Appl. Biochem. Biotechnol. 2017, 183, 906–922. [Google Scholar] [CrossRef] [PubMed]
  2. Pavi, S.; Kramer, L.E.; Gomes, L.P.; Miranda, L.A.S. Biogas Production from Co-Digestion of Organic Fraction of Municipal Solid Waste and Fruit and Vegetable Waste. Bioresour. Technol. 2017, 228, 362–367. [Google Scholar] [CrossRef] [PubMed]
  3. Zia, M.; Ahmed, S.; Kumar, A. Anaerobic Digestion (AD) of Fruit and Vegetable Market Waste (FVMW): Potential of FVMW, Bioreactor Performance, Co-Substrates, and Pretreatment Techniques. Biomass Convers. Biorefinery 2022, 12, 3573–3592. [Google Scholar] [CrossRef]
  4. Edwiges, T.; Frare, L.M.; Lima Alino, J.H.; Triolo, J.M.; Flotats, X.; Silva de Mendonça Costa, M.S. Methane Potential of Fruit and Vegetable Waste: An Evaluation of the Semi-Continuous Anaerobic Mono-Digestion. Environ. Technol. 2020, 41, 921–930. [Google Scholar] [CrossRef]
  5. Majhi, B.K.; Jash, T. Two-Phase Anaerobic Digestion of Vegetable Market Waste Fraction of Municipal Solid Waste and Development of Improved Technology for Phase Separation in Two-Phase Reactor. Waste Manag. 2016, 58, 152–159. [Google Scholar] [CrossRef] [PubMed]
  6. Mozhiarasi, V.; Speier, C.J.; Rose, P.M.B.; Mondal, M.M.; Pragadeesh, S.; Weichgrebe, D.; Srinivasan, S.V. Variations in Generation of Vegetable, Fruit and Flower Market Waste and Effects on Biogas Production, Exergy and Energy Contents. J. Mater. Cycles Waste 2019, 21, 713–728. [Google Scholar] [CrossRef]
  7. Papirio, S.; Trujillo-Reyes, Á.; di Perta, S.; Kalogiannis, A.; Kassab, G.; Khoufi, S.; Sayadi, S.; Frunzo, L.; Esposito, G.; Fermoso, F.G.; et al. Exploring the Biochemical Methane Potential of Wholesale Market Waste from Jordan and Tunisia for a Future Scale-Up of Anaerobic Digestion in Amman and Sfax. Waste Biomass Valorization 2022, 13, 3887–3897. [Google Scholar] [CrossRef]
  8. Padmi, T.; Dewiandratika, M.; Damanhuri, E. An Environmental and Economic Comparison of Fruit and Vegetable Waste Treatment in the Traditional Markets. Int. J. GEOMATE 2018, 15, 9–16. [Google Scholar] [CrossRef]
  9. Eriksson, M.; Spångberg, J. Carbon Footprint and Energy Use of Food Waste Management Options for Fresh Fruit and Vegetables from Supermarkets. Waste Manag. 2017, 60, 786–799. [Google Scholar] [CrossRef]
  10. Garcia-Peña, E.I.; Parameswaran, P.; Kang, D.W.; Canul-Chan, M.; Krajmalnik-Brown, R. Anaerobic Digestion and Co-Digestion Processes of Vegetable and Fruit Residues: Process and Microbial Ecology. Bioresour. Technol. 2011, 102, 9447–9455. [Google Scholar] [CrossRef]
  11. Arhoun, B.; Villen-Guzman, M.; Gomez-Lahoz, C.; Rodriguez-Maroto, J.M.; Garcia-Herruzo, F.; Vereda-Alonso, C. Anaerobic Co-Digestion of Mixed Sewage Sludge and Fruits and Vegetable Wholesale Market Waste: Composition and Seasonality Effect. J. Water Process Eng. 2019, 31, 100848. [Google Scholar] [CrossRef]
  12. Salehiyoun, A.R.; Sharifi, M.; Di Maria, F.; Zilouei, H.; Aghbashlo, M. Effect of Substituting Organic Fraction of Municipal Solid Waste with Fruit and Vegetable Wastes on Anaerobic Digestion. J. Mater. Cycles Waste 2019, 21, 1321–1331. [Google Scholar] [CrossRef]
  13. Russell, L.; Whyte, P.; Zintl, A.; Gordon, S.; Markey, B.; de Waal, T.; Cummins, E.; Nolan, S.; O’flaherty, V.; Abram, F.; et al. A Small Study of Bacterial Contamination of Anaerobic Digestion Materials and Survival in Different Feed Stocks. Bioengineering 2020, 7, 116. [Google Scholar] [CrossRef] [PubMed]
  14. Yan, H.; Cai, F.; Wang, L.; Chen, C.; Liu, G. Compositional Components and Methane Production Potential of Typical Vegetable Wastes. Environ. Sci. Pollut. Res. 2021, 28, 54177–54186. [Google Scholar] [CrossRef]
  15. Sanjaya, A.P.; Cahyanto, M.N.; Millati, R. Mesophilic Batch Anaerobic Digestion from Fruit Fragments. Renew. Energy 2016, 98, 135–141. [Google Scholar] [CrossRef]
  16. Ta, A.T.; Babel, S. Utilization of Green Waste from Vegetable Market for Biomethane Production: Influences of Feedstock to Inoculum Ratios and Alkalinity. J. Mater. Cycles Waste 2019, 21, 1391–1401. [Google Scholar] [CrossRef]
  17. Edwiges, T.; Frare, L.; Mayer, B.; Lins, L.; Mi Triolo, J.; Flotats, X.; de Mendonça Costa, M.S.S. Influence of Chemical Composition on Biochemical Methane Potential of Fruit and Vegetable Waste. Waste Manag. 2018, 71, 618–625. [Google Scholar] [CrossRef]
  18. Trujillo-Reyes, Á.; Serrano, A.; Cubero-Cardoso, J.; Fernández-Prior, Á.; Fermoso, F.G. Does Seasonality of Feedstock Affect Anaerobic Digestion? Biomass Convers. Biorefinery 2022. [Google Scholar] [CrossRef]
  19. Bouallagui, H.; Ben Cheikh, R.; Marouani, L.; Hamdi, M. Mesophilic Biogas Production from Fruit and Vegetable Waste in a Tubular Digester. Bioresour. Technol. 2003, 86, 85–89. [Google Scholar] [CrossRef]
  20. Bouallagui, H.; Haouari, O.; Touhami, Y.; Ben Cheikh, R.; Marouani, L.; Hamdi, M. Effect of Temperature on the Performance of an Anaerobic Tubular Reactor Treating Fruit and Vegetable Waste. Process Biochem. 2004, 39, 2143–2148. [Google Scholar] [CrossRef]
  21. Bouallagui, H.; Touhami, Y.; Ben Cheikh, R.; Hamdi, M. Bioreactor Performance in Anaerobic Digestion of Fruit and Vegetable Wastes. Process Biochem. 2005, 40, 989–995. [Google Scholar] [CrossRef]
  22. Math-Alvarez, J.; Viturtia, A.; Llabrés-Luengo, P.; Cecchi, F. Kinetic and Performance Study of a Batch Two-Phase Anaerobic Digestion of Fruit and Vegetable Wastes. Biomass Bioenergy 1993, 5, 481–488. [Google Scholar] [CrossRef]
  23. Viturtia, A.; Mata-Alvarez, J.; Cecchi, F. Two-Phase Continuous Anaerobic Digestion of Fruit and Vegetable Wastes. Resour. Conserv. Recycl. 1995, 13, 257–267. [Google Scholar] [CrossRef]
  24. Owen, W.F.; Stuckey, D.C.; Healy, J.B., Jr.; Young, L.Y.; McCarty, P.L. Bioassay for monitoring biochemical methane potential and anaerobic toxicity. Water Res. 1979, 13, 485–492. [Google Scholar] [CrossRef]
  25. Angelidaki, I.; Petersen, S.P.; Ahring, B.K. Effects of Lipids on Thermophilic Anaerobic Digestion and Reduction of Lipid Inhibition upon Addition of Bentonite. Appl. Microbiol. Biotechnol. 1990, 33, 469–472. [Google Scholar] [CrossRef]
  26. Standard Methods for the Examination of Water and Wastewater; American Public Health Association, American Water Works Association and Water Environmental Federation: Washington DC, USA, 1999.
  27. Kalogiannis, A.; Vasiliadou, I.A.; Spyridonidis, A.; Diamantis, V.; Stamatelatou, K. Biogas Production from Chicken Manure Wastes Using an LBR-CSTR Two-Stage System: Process Efficiency, Economic Feasibility, and Carbon Dioxide Footprint. J. Chem. Technol. Biotechnol. 2022, 97, 2952–2961. [Google Scholar] [CrossRef]
  28. Zhao, C.; Yan, H.; Liu, Y.; Huang, Y.; Zhang, R.; Chen, C.; Liu, G. Bio-Energy Conversion Performance, Biodegradability, and Kinetic Analysis of Different Fruit Residues during Discontinuous Anaerobic Digestion. Waste Manag. 2016, 52, 295–301. [Google Scholar] [CrossRef]
  29. Scotto di Perta, E.; Cesaro, A.; Pindozzi, S.; Frunzo, L.; Esposito, G.; Papirio, S. Assessment of Hydrogen and Volatile Fatty Acid Production from Fruit and Vegetable Waste: A Case Study of Mediterranean Markets. Energies 2022, 15, 5032. [Google Scholar] [CrossRef]
  30. Spyridonidis, A.; Vasiliadou, I.A.; Akratos, C.S.; Stamatelatou, K. Performance of a Full-Scale Biogas Plant Operation in Greece and Its Impact on the Circular Economy. Water 2020, 12, 3074. [Google Scholar] [CrossRef]
  31. Korai, M.S.; Mahar, R.B.; Uqaili, M.A. The Seasonal Evolution of Fruit, Vegetable and Yard Wastes by Mono, Co and Tri-Digestion at Hyderabad, Sindh Pakistan. Waste Manag. 2018, 71, 461–473. [Google Scholar] [CrossRef]
  32. Trujillo-Reyes, Á.; Serrano, A.; Pérez, A.G.; Peces, M.; Fermoso, F.G. Impact of Monoterpenes in the Stability of the Anaerobic Digestion of Mediterranean Wholesale Market Waste. J. Environ. Chem. Eng. 2023, 11, 109653. [Google Scholar] [CrossRef]
  33. Lin, J.; Zuo, J.; Gan, L.; Li, P.; Liu, F.; Wang, K.; Chen, L.; Gan, H. Effects of Mixture Ratio on Anaerobic Co-Digestion with Fruit and Vegetable Waste and Food Waste of China. J. Environ. Sci. 2011, 23, 1403–1408. [Google Scholar] [CrossRef]
  34. Jiang, Y.; Heaven, S.; Banks, C.J. Strategies for Stable Anaerobic Digestion of Vegetable Waste. Renew. Energy 2012, 44, 206–214. [Google Scholar] [CrossRef]
  35. Li, D.; Sun, J.; Cao, Q.; Chen, Y.; Liu, X.; Ran, Y. Recovery of Unstable Digestion of Vegetable Waste by Adding Trace Elements Using the Bicarbonate Alkalinity to Total Alkalinity Ratio as an Early Warning Indicator. Biodegradation 2019, 30, 87–100. [Google Scholar] [CrossRef]
  36. Li, D.; Chen, L.; Liu, X.; Mei, Z.; Ren, H.; Cao, Q.; Yan, Z. Instability Mechanisms and Early Warning Indicators for Mesophilic Anaerobic Digestion of Vegetable Waste. Bioresour. Technol. 2017, 245, 90–97. [Google Scholar] [CrossRef]
  37. Viswanath, P.; Sumithra Devi, S.; Nand, K. Anaerobic Digestion of Fruit and Vegetable Processing Wastes for Biogas Production. Bioresour. Technol. 1992, 40, 43–48. [Google Scholar] [CrossRef]
  38. Scaglione, D.; Lotti, T.; Ficara, E.; Malpei, F. Inhibition on Anammox Bacteria upon Exposure to Digestates from Biogas Plants Treating the Organic Fraction of Municipal Solid Waste and the Role of Conductivity. Waste Manag. 2017, 61, 213–219. [Google Scholar] [CrossRef]
  39. Uludag-Demirer, S.; Demirer, G.N. Post-Anaerobic Treatability and Residual Biogas Potential of Digestate. Biomass Convers. Biorefinery 2022, 12, 1695–1702. [Google Scholar] [CrossRef]
  40. Rajeshwari, K.V.; Lata, K.; Pant, D.C.; Kishore, V.V.N. A Novel Process Using Enhanced Acidification and a UASB Reactor for Biomethanation of Vegetable Market Waste. Waste Manag. Res. 2001, 19, 292–300. [Google Scholar] [CrossRef]
  41. Ganesh, R.; Torrijos, M.; Sousbie, P.; Lugardon, A.; Steyer, J.P.; Delgenes, J.P. Single-Phase and Two-Phase Anaerobic Digestion of Fruit and Vegetable Waste: Comparison of Start-Up, Reactor Stability and Process Performance. Waste Manag. 2014, 34, 875–885. [Google Scholar] [CrossRef]
Figure 1. Experimental layout of the LBR-UASB system used for the study (P1—LBR recirculation pump, P2—UASB recirculation pump, P3—UASB feeding pump).
Sustainability 16 00050 g001
Figure 2. Percentage variation of the (a) fruit, (b) leafy vegetable, and (c) non-leafy vegetable contribution making up typical waste mixtures from Mediterranean open markets.
Sustainability 16 00050 g002aSustainability 16 00050 g002b
Figure 3. TS content of the FVW mixtures distributed into the different size fractions.
Sustainability 16 00050 g003
Figure 4. Biomethane production potential of the different size fractions of shredded FVW (S1—autumn/winter, S2—spring, S3—summer): (a) 0–10 mm, (b) 0–4 mm, (c) 4–10 mm.
Sustainability 16 00050 g004aSustainability 16 00050 g004b
Figure 5. (a) Overall organic loading rate, (b) the HRT in the UASB reactor, and (c) methane yield of the LBR-UASB reactor system. The red vertical line denotes the restart-up of the LBR, while the grey lines show the time when the FVW mixture changed.
Sustainability 16 00050 g005aSustainability 16 00050 g005b
Figure 6. Biogas composition produced from the (a) LBR and (b) UASB reactor. The red vertical line denotes the restart-up of the LBR, while the grey lines show the time when the FVW mixture changed.
Sustainability 16 00050 g006
Figure 7. VFA concentration of the (a) LBR leachate, (b) UASB reactor effluent, and (c) pH of the leachate and UASB reactor effluent. The red vertical line denotes the restart-up of the LBR, while the grey lines show the time when the FVW mixture changed.
Sustainability 16 00050 g007
Figure 8. Electrical conductivity in the effluent of the UASB. The red vertical line denotes the restart-up of the LBR.
Sustainability 16 00050 g008
Table 1. Characterization of different fractions of shredded FVW used for the study. The data provide the average values of three measurements.
Parameter0–4 mm4–10 mm0–10 mm
(0–4 + 4–10 mm)
Autumn/Winter (S1)
FM distribution (%ww *)2476100
TS (g kg−1)30 ± 182 ± 277 ± 0
VS (g kg−1)27 ± 071 ± 064 ± 1
BMP (L kg VS−1)387 ± 32473 ±17429 ± 13
COD (g kg VS−1)1196 ± 171340 ± 241396 ± 18
TKN (g kg VS−1)28 ± 124 ± 129 ± 1
Spring (S2)
FM distribution (%ww *)4654100
TS (g kg−1)38 ± 192 ± 468 ± 0
VS (g kg−1)35 ± 077 ± 364 ± 2
BMP (L kg VS−1)360 ± 8480 ± 7406 ± 4
COD (g kg VS−1)1221 ± 161512 ± 151280 ± 19
TKN (g kg VS−1)23 ± 224 ± 126 ± 1
Summer (S3)
FM distribution (%ww *)6139100
TS (g kg−1)45 ± 288 ± 272 ± 2
VS (g kg−1)41 ± 281 ± 266 ± 2
BMP (L kg VS−1)441 ± 17527 ± 21426 ±10
COD (g kg VS−1)1533 ± 251439 ± 141354 ± 24
TKN (g kg VS−1)16 ± 118 ± 119 ± 1
* The percentage expresses the part of each fraction (0–4 mm or 4–10 mm) with respect to the total fraction (0–10 mm).
Table 2. Kinetic parameters estimated for all BMP tests.
FractionsBMPexp (L kg−1 VS)BMPmax (L kg−1 VS)k (d−1)χ2R2
Autumn/Winter (S1)
0–10 mm429 ± 13453 ± 40.169 ± 0.0052210.989
0–4 mm387 ± 32386 ± 40.285 ± 0.0054310.975
4–10 mm473 ± 17482 ± 40.178 ± 0.0041970.992
Spring (S2)
0–10 mm406 ± 4407 ± 20.286 ± 0.0061350.992
0–4 mm360 ± 8349 ± 30.387 ± 0.0153410.971
4–10 mm480 ± 7486 ± 30.233 ± 0.0051830.993
Summer (S3)
0–10 mm426 ± 10415 ± 30.557 ± 0.0224540.971
0–4 mm441 ± 17419 ± 50.387 ± 0.0229320.945
4–10 mm527 ± 21520 ± 20.434 ± 0.0102200.992
Disclaimer/Publisher’s Note: The statements, opinions and data contained in all publications are solely those of the individual author(s) and contributor(s) and not of MDPI and/or the editor(s). MDPI and/or the editor(s) disclaim responsibility for any injury to people or property resulting from any ideas, methods, instructions or products referred to in the content.

