Article

Does the National Carbon Emissions Trading Market Promote Corporate Environmental Protection Investment? Evidence from China

School of Economics and Management, University of Chinese Academy of Sciences, Beijing 100190, China
*
Author to whom correspondence should be addressed.
Sustainability 2024, 16(1), 402; https://doi.org/10.3390/su16010402
Submission received: 15 November 2023 / Revised: 27 December 2023 / Accepted: 31 December 2023 / Published: 2 January 2024
(This article belongs to the Topic Energy Economics and Sustainable Development)

Abstract

:
China launched the National Carbon Emissions Trading Market (NCETM) in July 2021, heralding the first nationwide implementation of carbon emissions trading since the 2011 pilot scheme in China. The NCETM serves as a vital policy instrument that employs market mechanisms to regulate and mitigate greenhouse gas emissions. Thus, this study aims to examine how the NCETM in China, as an environmental regulatory policy, impacts environmental protection investment (EPI) made by enterprises. Specifically, the research seeks to address three key questions: (1) Does the NCETM have an impact on corporate EPI? (2) What are the mechanisms underlying the effect of the NCETM on corporate EPI? (3) Additionally, does the impact of the NCETM on corporate EPI vary with the location of the firms? By utilizing financial data from listed firms from 2018 to 2022 and employing the difference-in-differences (DID) model, the empirical results suggest that: (1) NCETM significantly stimulates the increase in EPI by firms. (2) The NCETM promotes environmental investment by inducing higher R&D expenditures. (3) The effects of NCETM on firms’ EPI vary across regions, with the policy only being effective for firms in non-pilot regions that did not engage in the carbon emissions trading market prior to NCETM. This study provides empirical evidence for the microeconomic effects of the NCETM and a useful reference for the implementation of carbon emissions trading policies.

1. Introduction

Given the pressing urgency of the escalating crisis of global warming and the increasingly detrimental impact of human activity on the environment, effective policies aimed at reducing emissions and conserving energy have been discussed by the international community. These efforts should aim not only to curtail emissions but also to necessitate efficient resource allocation among nations [1]. Consequently, discussions about the allocation of carbon emissions rights have been a topic of global interest. The Kyoto Protocol officially began on 16 February 2005, and the European Union’s Emission Trading Scheme (EU ETS) launched in 2005, giving shape to the global carbon market, which aims to effectively allocate carbon emissions rights by trading carbon allowances [2]. As a unique environmental regulatory tool, the carbon emissions trading market exhibits distinct market characteristics [3,4,5]. The primary objective of this initiative is to harness market mechanisms, such as price discovery, to maximize the efficiency of carbon reduction efforts throughout society [3]. The allocation of carbon allowances occurs through government-issued allowances, fixed-price sales, or competitive auctions [6,7,8]. Expanding on this foundation, the carbon emissions trading market is implemented to monitor the emissions rights pricing, creating a secondary market [
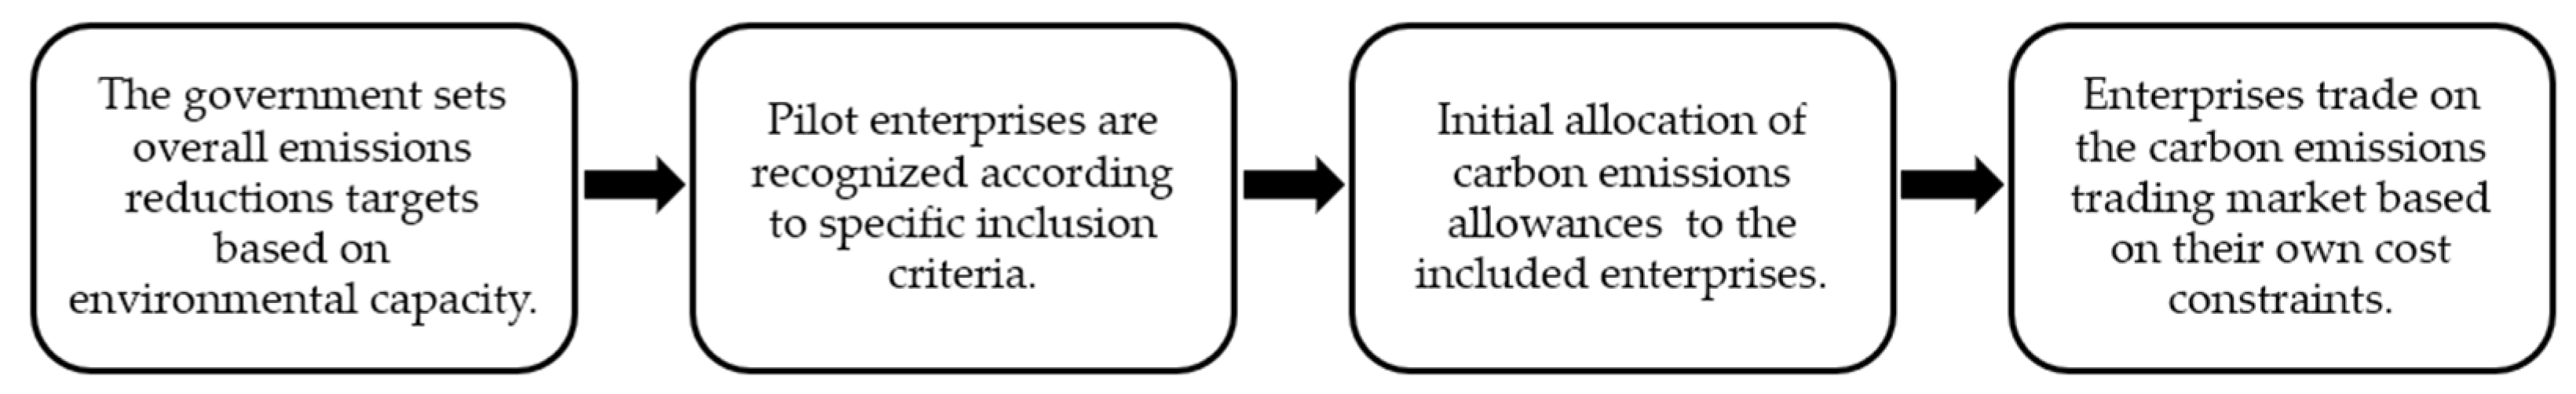
6]. This strategy effectively internalizes environmental pollution externalities into corporate responsibilities through market-based pricing mechanisms, ultimately achieving the goal of reducing the total carbon emissions produced by businesses [8,9]. The frame of the carbon emissions trading system, which utilizes carbon emissions allowances, is presented in Figure 1.
From 2001, when China joined the World Trade Organization, until around 2011, its carbon emissions grew rapidly, increasing from 14.86% to 28.57% of the world’s total [11]. Between 2012 and 2021, China’s carbon emissions growth rate slowed down due to a slowdown in GDP growth, a decline in the energy intensity of GDP, and faster decarbonization [12,13]. However, China remains the largest emitter of CO2, with the highest GDP carbon intensity among major economies worldwide [14]. According to the IEA’s report, global CO2 emissions related to energy and industrial emissions are projected to reach 36.8 billion tons in 2022, with China accounting for about one-third of total global carbon emissions, emitting 12.1 billion tons [14].
To address climate change, since 2011, the Chinese government has taken a pioneering step by launching a pilot carbon emissions trading scheme (CETS) in eight provinces and municipalities. Then, on 16 July 2021, the Chinese government officially announced the establishment of the national carbon emissions trading market (NCETM). As of 17 October 2023, the NCETM had a cumulative turnover of 324.8 million tons and a total turnover of RMB 16.64 billion [15]. This market has now become the major carbon emissions trading platform in the world.
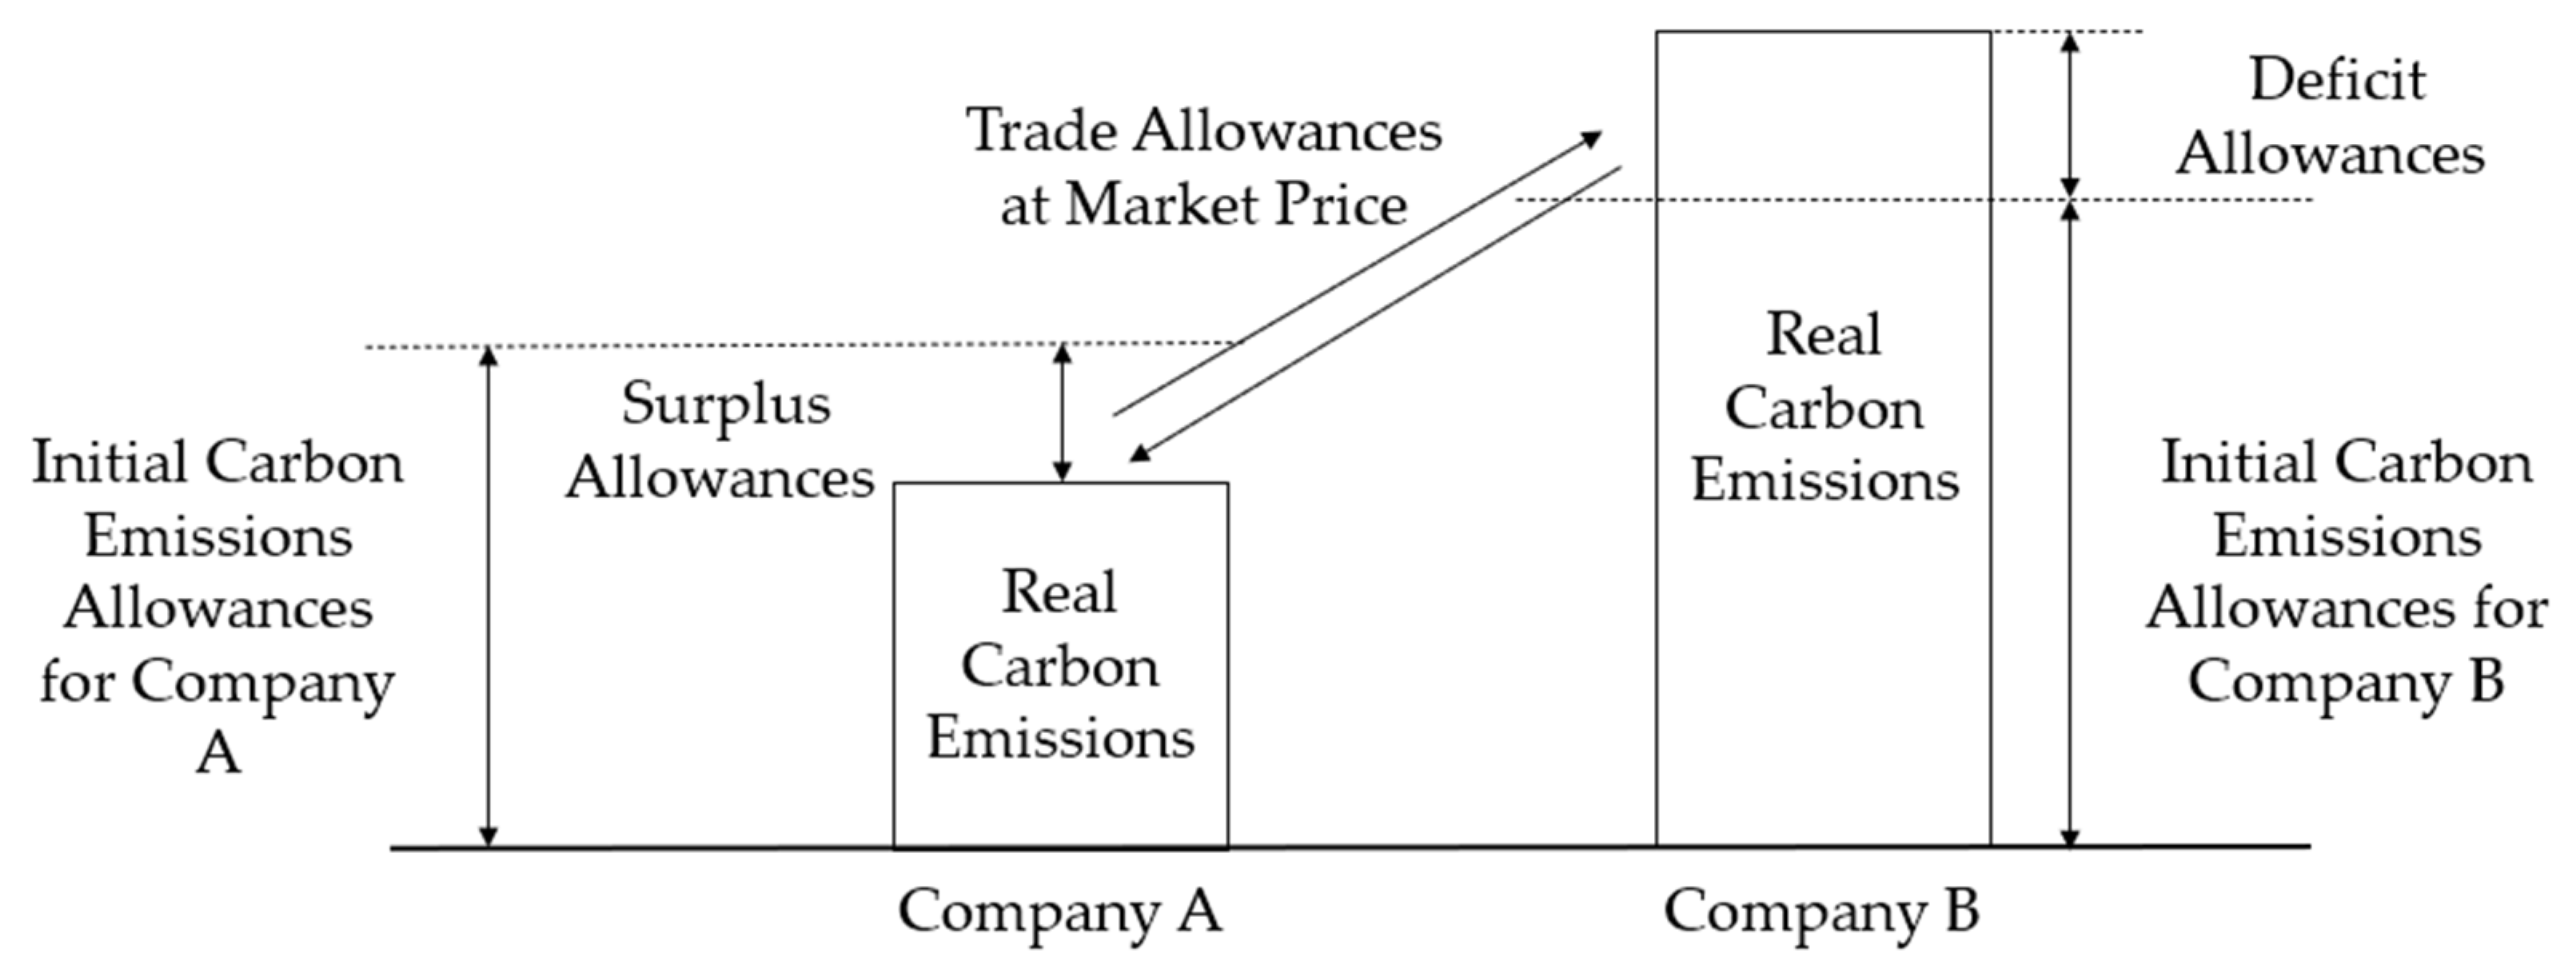
Similar to the stock market, the carbon emissions trading market can be divided into a primary market and a secondary market [6]. The government mainly issues carbon emissions allowances to emissions control enterprises, which constitute the primary market. The issuance of corresponding carbon allowances is governed by a policy cap on total annual emissions. The secondary market primarily serves as a platform for trading surplus carbon allowances, involving participants such as emissions control enterprises and professional investment institutions. A simple visual representation of this trading model is shown in Figure 2.
As significant NCETM participants, enterprises hold considerable sway over carbon emissions resulting from production [16]. The externalities of the eco-environment and the lack of balance between environmental protection and environmental pollution pose a challenge for enterprises in implementing robust environmental governance [17]. In the context of government regulatory instruments, enterprises adopt a stance focused on maximizing economic efficiency [18]. Their decisions are shaped by a careful evaluation of the advantages and disadvantages of proactive environmental investments and the procurement of necessary environmental equipment to meet pollution emissions standards [18]. This results in a scenario characterized by passive environmental governance. Environmental regulations, through exerting pressure, could push companies to engage in environmental stewardship and increase corporate environmental protection investment (EPI) [19], ultimately helping to achieve sustainable development goals. Nevertheless, an overabundance of regulatory pressure can potentially produce adverse effects [20]. When environmental regulations impose external pressure on firms lacking internal motivations, their investment in environmental protection may become a pragmatic compromise between benefits and costs [18]. Corporate investment in environmental protection is often marked by long cycles and a diminished return on investment, deviating from the corporate aim of profit maximization [21]. This leads many enterprises to show reluctance in allocating resources toward programs contributing to environmental protection. As a result, their environmental protection conduct is mainly reactive, mostly motivated by the pursuit of compliance [22].
Therefore, governments need to design innovative policy tools to provide adequate incentives for enterprises to increase their EPI, to achieve green development. The implementation of a carbon emissions trading market has spurred a noteworthy shift, motivating companies to actively pursue innovation in technology and manufacturing processes, resulting in a reduction in carbon emissions [23]. Such proactive engagement generates social benefits and simultaneously strengthens economic gains derived from market mechanisms [16].
The literature lacks a consensus on whether government-mandated environmental regulations are effective in encouraging stronger investments in environmental protection. The pollution paradise hypothesis posits that strict environmental policy requires firms to invest more in the protection and conservation of eco-environment [24]. This can lead to higher costs of production and lower profits [24]. Conversely, Porter’s hypothesis argues that proper environmental regulations could stimulate business investments and encourage innovation in the technology [17]. Such regulations can prompt a transition away from traditional production methods and product structures, ultimately increasing dedication to environmental investments [17]. Moreover, the factor endowment hypothesis suggests that enterprises base their decisions regarding EPI on a calculation that compares the costs incurred by the enterprise to the benefits gained from adhering to environmental regulations [18].
Enterprises’ decisions regarding investments in environmental protection are influenced by numerous factors. Although environmental regulation is a compulsory tool, its effectiveness depends on the specific circumstances. China, a primary emitter of carbon and a prototypical representation of a developing economy, faces unique challenges arising from its distinct political and economic institutional context in setting up and operating a carbon emissions trading market [25,26]. Additionally, the status quo of China’s carbon emissions trading market displays a budding stage with significant dynamism, indicating that maturity and operational efficiency remain distant [27]. The NCETM in China is at a nascent stage, characterized by ongoing testing and evaluation. The trajectory of its development is yet to be fully formed.
Therefore, the effectiveness of the NCETM in China to motivate companies to increase their investment in environmental protection remains uncertain. Previous research on the micro-level impact of the carbon emissions trading market on firms has primarily focused on the market’s influences on aspects, such as firms’ green transformation, capital allocation efficiency, and corporate financing [28,29,30]. However, only a few studies have delved into the area of corporate EPI. While Lv et al. investigated carbon emissions trading and its impact on corporate environmental investment in pilot regions [31], there is still a relative dearth of research from the NCETM perspective. As opposed to the examination of pilot data, a study that encompasses national policy can provide a more comprehensive interpretation of the overall state of policy implementation and allow for a deeper analysis of the long-term impact and sustainability of the policy. As such, this paper will focus on addressing the following research questions: (1) Does the establishment of the NCETM have an effect on firms’ EPI? (2) What mechanisms underlie the impact of the NCETM on corporate EPI? (3) Furthermore, do these effects vary according to the region in which firms are located?
To address these questions, this study conducts a theoretical analysis of how the NCETM affects corporate EPI and its underlying mechanisms. The study’s empirical aspect tests these hypotheses by examining financial data from publicly traded companies in China from 2018 to 2022. The difference-in-differences (DID) model is employed to explore the impact of the NCETM. Further analyses explore the impact’s mechanisms and potential heterogeneity in effects. Our study reveals some significant results. We determine that the implementation of the NCETM positively impacts the EPI of businesses. Our findings specifically indicate that Research and Development (R&D) investment serves as the intermediary role in mediating this effect. Moreover, the impact of the NCETM on enterprises is not consistent across diverse regions. Notably, the NCETM displays a significant influence on the EPI of firms in non-pilot regions, but no such effect is observed in pilot regions, showcasing regional variations.
Thus, this study contributes to the existing literature by empirically validating the positive effect of the NCETM on corporate EPI, while at the same time elucidating the underlying mechanisms. These findings have implications for both academic and practical perspectives on large-scale carbon emissions trading markets and corporate environmental performance. The implications of our study extend to policy considerations, as the study underscores the need for governments to consider the differential impacts of carbon markets on regulated firms across regions. Such insights are critical to improving the performance of national carbon markets. Additionally, our study adds to the literature the factors influencing firm EPI and provides valuable empirical insights for facilitating social green development.
The remaining sections of this paper are organized as follows. Section 2 conducts a comprehensive literature review, delving into prior research and existing literature on both the carbon emissions trading market and the firm’s EPI. Section 3 provides a theoretical analysis along with the formulated research hypotheses. Section 4 delineates the research design, encompassing details on data sources, sample selection, and the chosen methodology. Section 5 offers the empirical results. Section 6 summarizes key findings, engaging in a discussion about the results. Section 7 presents theoretical implications and policy recommendations, as well as limitations and future directions.

2. Literature Review

2.1. Carbon Emissions Trading Market

Since Coase’s introduction of the Coase theorem and its innovative perspective on property rights and environmental issues, this seminal contribution has laid the foundation for subsequent research in this area [9]. Coase posited that well-defined property rights have the capacity to address negative externalities by market exchange, offering the theoretical basis for the emission trading scheme [9]. Related literature predominantly concentrates on the design mechanism of carbon emissions trading markets, carbon pricing, and its macro and micro impacts.
Previous research has analyzed various aspects related to the construction and distribution of carbon emissions trading markets. Niesten et al. focused on two main factors: safeguarding endangered indigenous forests through limits on permitted afforestation and reforestation efforts and specifically excluding these initiatives from carbon credit allocations, and explored the distribution of carbon credits for forest management activities in industrialized areas [32]. Fankhauser and colleagues conducted a study examining the temporal dimension of carbon markets, specifically focusing on the intertemporal design [33]. Their analysis centered around cap-and-trade systems’ structural components at the enterprise level and aimed to critically evaluate the fundamental principles guiding temporal design considerations [33]. Bryant utilized a case study methodology to examine recent efforts to reform the EU ETS, including measures to restrict industrial gas offsets, the implementation of auctions for reverse allowances, and the introduction of the 2030 Climate and Energy Package [34]. Hua et al. (2020) demonstrated a pioneering framework based on blockchain technology for facilitating the private exchange of carbon credits [35]. This innovative model facilitates direct interaction between producers and consumers, incentivizing changes in consumption habits that lead to carbon emissions reduction goals [35].
Carbon pricing research can be broadly categorized into three aspects: factors influencing carbon prices, carbon price volatility and forecasting, and the effectiveness of carbon pricing [36,37,38,39]. Fan and Todorova examined the interaction between energy prices and carbon pricing, emphasizing that the impact of the prices of energy on carbon pricing changes with time [6]. Zhu et al. introduced a multiscale analytical model to investigate the influence factors of carbon pricing, revealing the different effects of electricity prices, stock indices, and coal prices at different time scales [40]. Wu et al. explored the correlation between different energy futures markets and carbon price volatility using the recursive graph (RP) method and recursive quantitative analysis (ROA) [4]. Zhou et al. proposed a hybrid framework involving variational modal decomposition (VMD) for the carbon price forecasting [41]. Wang et al. constructed a carbon price prediction model on the basis of probability density recursive networks, using recursive network construction techniques for data and link prediction [42]. Wang et al. used a lower upper-bound estimation model to estimate the range of carbon pricing [43].
On the macro level, there have been some studies of the impact of carbon markets on economic activity, and the conclusion has been that carbon markets are generally beneficial to social welfare. Zhou et al. concluded that the carbon emissions trading market has the potential to promote regional equilibrium and facilitate the transition towards environmentally sustainable, low-carbon practices in high-emission industries, thereby substantially reducing the cost of carbon emissions and increasing overall societal welfare [44]. Teixidó et al. concluded that the EU ETS is an effective driver of low-carbon technological innovation [45]. Using a DID model, Yang et al. found that CETS promotes employment expansion and carbon emissions reduction [46]. Zhang et al. found that the CETS significantly improved the efficiency of green development, as indicated by an increase in green total factor productivity and a decrease in investment in high-carbon industries in pilot areas [47]. Using multi-period double-difference modeling and spatial econometric methods, Tang and Xu concluded that the CETS significantly increases the green total factor productivity of pilot areas through mechanisms, such as energy structure adjustment, improvement in resource allocation, and promotion of green technology innovation [48].
On the micro level, existing studies have mainly examined the influence of these policies on various dimensions of firm activities, including investment expenditures, innovation and R&D, asset structures, and operating costs. Petroni et al. suggested that carbon emissions trading market could result in some firms cutting back or closing down production, hindering normal investment and reducing investment efficiency [29]. Qi et al. found that pilot carbon trading policies encourage carbon-reduction innovation among enterprises within the pilot scope, especially by reducing financing barriers [28]. Xu et al. found that CETS significantly enhance the environmentally sustainable development for heavy polluters, thereby promoting ecological transformation among these companies [30]. Nonetheless, it is important to note that the effect of carbon emissions trading markets on the EPI has not been thoroughly investigated in prior literature. Lv et al., using data from pilot regions, showed that the introduction of CETS improves corporate EPI by increasing the emissions cost and strengthening the enforcement [31].
However, our study differs from Lv’s work. Specifically, our investigation analyzes different mechanisms by which the NCETM impacts the EPI of firms, using the data produced by the groundbreaking national implementation of a carbon emissions trading market in China. It provides a valuable and unique perspective on the subject.

2.2. Environmental Protection Investment

Investment in environmental protection plays a crucial role in building the social responsibility of firms [49]. The main responsibility for investing in environmental protection lies with enterprises, emphasizing the significant role of businesses in environmental preservation [50]. Additionally, such investments provide benefits for not only the investor but also for society and the environment at large [51]. The benefits of investing in environmental protection are multifaceted, spanning beyond environmental concerns to encompass economic and societal dimensions [52].
Enterprises necessarily consume environmental resources, including water, air, and soil, during their production and operational activities, leading to the generation of pollutant emissions, such as exhaust gases, wastewater, and waste. It has been argued that waste management and pollution prevention investments are undesirable financial burdens and obstacles to a company’s core objectives [24]. However, a growing group of scholars are challenging this viewpoint, asserting that pollution prevention and its accompanying investments result in significant economic advantages. By investing in environmentally sustainable production processes as well as state-of-the-art machinery and equipment, firms have the potential to improve the efficiency of their resource and energy usage [50]. This leads to decreases in both production and operational costs while also enhancing overall business value [20,21].
Furthermore, pollution prevention efforts coupled with production process redesign present enterprises with opportunities to implement paradigm shifts in their manufacturing strategies [53]. Such transformations may take the shape of initiatives such as retrofitting of outdated machinery facilities and dedicated research and innovation in the production sphere. This shift could enhance production efficiency while simultaneously leveraging new opportunities for competitive advantage in response to the launch of the carbon emissions trading market [54].
Additionally, investing in environmental preservation can help mitigate the risks of non-compliance and related costs for companies [55]. Moreover, China’s regulations related to environmental issues have become more stringent, leading to higher environmental risks and expenses for companies [56]. Therefore, companies can reduce their pollution emissions and comply with national standards by proactively investing in environmental protection, resulting in them avoiding environmental burdens, such as protection taxes and penalties [56].
Although academic research has paid relatively limited attention to EPI, it is clear that sensible environmental regulation has the potential to motivate enterprises by incentivizing investments and stimulating technological advancement [57].
In summary, previous research has yet to comprehensively investigate the impact and mechanisms of the policy of carbon emissions trading markets on firms’ EPI. This study utilizes the implementation of the NCETM as a policy event and uses a quasi-natural experimental framework to examine its effects and mechanisms. Unlike previous studies that have relied primarily on pilot project data, the evidence from the study of the NCETM provides a panoramic view of policy implementation at the national level, providing policymakers with a thorough and unbiased assessment of the policy’s impact for future environmental policymaking.

3. Theoretical Analysis and Research Hypotheses

3.1. CETS and Corporate EPI

The Coase theorem posits that, when all parties in society minimize transaction costs and property rights are unambiguous, externalities cease to impede the efficient allocation of resources [9]. As a result, externalities are internalized, and resources flow seamlessly, facilitating the use of market mechanisms, including trading systems, to resolve externalities. This process entails producers and consumers participating in interest-based market transactions until a state of equilibrium is achieved [9].
The low-carbon economy has prompted enterprises to turn toward green investments, specifically in low-carbon technology innovation projects, within the carbon trading framework [58,59]. For enterprises, EPI offers strategic options to limit carbon emissions. These investments help enterprises to take advantage of the carbon emissions trading market to gain additional revenue and improve economic efficiency [47]. Drawing from the microeconomic cost–benefit theory and factor endowment hypothesis, enterprises evaluate costs versus benefits before making any investment [18,60]. Enterprises base their decisions regarding environmental investments on a calculation that compares the costs incurred by the enterprise to the benefits gained from adhering to environmental regulations. According to this framework, strict environmental regulations are considered to encourage investing in environmental protection if the returns resulting from regulatory compliance outweigh the costs associated with it. The point where marginal revenue equals marginal cost (MR = MC) is the crucial decision point for firms [60].
In this study, MR represents the additional benefits gained from an enterprise’s EPI, while MC denotes the additional costs incurred. The decision by enterprises to invest in environmental protection depends on whether the marginal revenue (MR) exceeds the marginal cost (MC). Prior to the implementation of government carbon emissions trading policies, companies faced lax regulations, resulting in low emissions costs and fewer incentives to reduce emissions, leading to MR < MC. However, increasingly strict environmental protection policies and the launching of an NCETM have resulted in higher default costs, whereas investments in environmental protection allow enterprises to potentially profit by selling surplus allowances in the market [61]. As a result, MR > MC, encouraging companies to actively increase their EPI. The increasingly strict environmental protection policies and the launching of the NCETM might motivate companies to actively invest in environmental protection [19,52], to reduce corporate emissions cost, and gain more social value, which will ultimately improve corporate market performance and enhance corporate value [62]. Based on the aforementioned discussion, we propose the following hypothesis:
Hypothesis 1. 
Carbon emissions trading policies can stimulate companies’ environmental investments.

3.2. The Mechanism of Corporate R&D Investment

From a pressure perspective, the NCETM requires companies to acquire carbon emissions allowances corresponding to their actual emissions before the end of the compliance period. If an enterprise continues to use its existing production technologies and methods, it will face the difficult decision of either purchasing additional carbon emissions allowances in the market to offset the excess of specified emissions or, alternatively, reducing production within the constraints of a specified carbon emissions allowance. Regardless of the coping strategy chosen, these actions escalate cost pressures on companies, erode profit margins, and ultimately reduce the competitiveness of their products [31]. However, companies that choose to drive technological advancements and production innovations can not only reduce their long-term emissions costs but also mitigate legitimacy pressures on their operations [58,59]. Technology R&D serves as a way for companies to alleviate environmental regulatory pressures, reduce production costs, and cultivate competitive advantages [63]. Thus, in today’s carbon emissions trading market, the integration of technology R&D and innovation is a key means that companies need to choose to secure competitive advantage [64]. At the same time, as companies enter the NCETM, they face not only more stringent institutional rules regarding carbon verification, reporting, and compliance but also increased scrutiny from markets and investors [64]. As a result, companies are viewing technology R&D as a critical investment and making decisions that increase the R&D investment [65]. To meet the challenges posed by the NCETM and environmental protection regulations, firms are inclined to increase their R&D investment in their long-term planning.
From an incentive perspective, the carbon emissions trading mechanism encourages enterprises to proactively engage in research, development, and implementation of energy-saving and emission-reducing technologies to strengthen their green innovation capabilities [45]. Government policies that subsidize investment expenditures for environmental protection further motivate enterprises to enhance their R&D investment, ultimately enhancing green innovation capabilities and increasing profit margins [21,28].
According to the resource-based view theory, evaluating a company’s resources necessitates considering intangible assets objectively [66]. R&D investments particularly play a critical role in increasing intangible assets, such as enhancing knowledge and promoting innovation in the products [67]. These enhancements may potentially increase returns on environmental investments due to decreased environmental investment costs for companies [68]. Furthermore, R&D intensity could strengthen companies’ participation in environmental protection programs [67]. Firms with higher levels of R&D investment demonstrate a greater inclination to adopt more environmental protection practices [69]. As a result, R&D investment is a crucial factor in determining a company’s EPI.
Based on this analysis, we propose the second hypothesis:
Hypothesis 2. 
NCETM can promote the EPI of enterprises through R&D Investment.
Based on theoretical analysis from various perspectives, including pressure, incentives, and costs, the NCETM will lead enterprises to encourage managers to increase R&D investment to expand EPI. This will result in a “win-win” scenario for both environmental protection and enhanced corporate competitiveness. Figure 3 illustrates the research model of the study, demonstrating the NCETM path to enhance the EPI of the enterprise.

4. Methodology

4.1. Data Source and Processing

The study’s experimental group samples were selected from the list of management entities included in the national carbon emissions control program, as reported by the provincial departments of ecology and environment. Concerning the corporations in the national carbon market regulation list, a total of 1794 entities from 22 provinces were identified based on publicly attainable data (the information for autonomous regions such as Ningxia and Guangxi was not disclosed). To maintain consistency, we exclusively utilized the 2021 list since variations in inclusion between the lists in 2021 and 2022 were trivial. We selected the listed companies from the 2021 list of management entities included in the national carbon emissions control program as the experimental group. We obtained financial data of the listed companies from CSMAR and macroeconomic data from Chioce. We used 2018–2022 as the study interval, which is comprised of 10 half-year periods. The market launched in the first half of 2021. After eliminating ST and ST* corporations, Hong Kong-listed corporations, and listed corporations with absent explanatory variables, the experimental group consisted of 67 listed corporations. These companies represent the industries of electricity, heat, gas, water production, manufacturing, and mining. Detailed information about the industrial distribution of these entities is given in Table 1.

4.2. Research Model

The difference-in-differences (DID) method is a widely used approach for analyzing policy impacts. In this study, we utilize DID to examine the net impact of the NCETM. To mitigate the influence of other confounding variables, like self-selection bias, which can lead to endogeneity issues, we first employ propensity score matching (PSM) to select control group samples. Then, we use one-to-many matching to reduce sampling variance in the DID model.

4.2.1. Propensity Score Matching (PSM)

The factors considered in PSM are as follows: (1) Sector Carbon Emissions Intensity. We define sector carbon emissions intensity as the ratio of sector carbon emissions to sector output to regulate the possibility of enterprises being regulated. Industries with high carbon emissions intensity are more likely to be included in the national carbon emissions control list. This variable was chosen to achieve more precise matching. Data source: National Bureau of Statistics. (2) Total Assets of Company. This study employs the year-end reported values of total company assets as a proxy for total output and also as a control for the probability of enterprise being regulated. High-output companies were prioritized for inclusion in regulation policies based on previous pilot experiences. Data source: Chioce.
The main explanatory variable in this study is whether a listed company is included in the list of management entities included in the national carbon emissions control program. This is represented by a binary variable that equals 1 if included and 0 if not. We extracted financial data from half-yearly reports of these public firms, spanning 10 half-year periods starting from 2018 to 2022. With this information, we formulated a logistic linear model, as described below:
ln P T r e a t i = 1 | x 1 P T r e a t i = 1 | x = α 0 + α 1 ln S e c t o r i + α 2 ln A s s e t s i + ε i
Based on the results of PSM, an analysis of p-values was conducted to identify individuals with significant changes in p-values before and after matching. Additionally, it was ensured that no significant differences in influencing factors emerged between the experimental and control groups after matching. Consequently, a sample of 423 listed companies, excluding those categorized as ST or ST*, was selected as the control group. This study utilizes financial panel data from 490 listed companies for 10 half-year periods, covering their financial reports from 2018 through 2022.

4.2.2. Difference-in-Differences Model

The difference-in-differences (DID) model entails incorporating grouped binary variables and interaction terms with time binary variables, along with discrete components for both binary variables. This methodology is robust and allows for precise estimation of the policy effect. For analytical convenience, we chose not to include the two separate binary variables in our study model. Instead, we will use a two-way fixed-effects DID model. The corresponding constructed model is shown as follows:
Y i t = α 0 + α 1 T r e a t i t · P o s t i t + α 2 C o n t r o l s i t + μ i + τ t + ε i t
In Equation (2), Y i t represents the dependent variable, EPI. The critical interaction term, T r e a t i t · P o s t i t , also referred to as “ d i d ” in the regression results, indicates the interaction between the grouping binary variable and the semi-annual binary variable. The term C o n t r o l s i t includes control variables, such as return on assets ( R o a ), leverage ratio ( L e v ), and operating expenses ( C o s t ) of the enterprise. Moreover, μ i denotes individual fixed effects, τ t represents time fixed effects, and ε i t is the error term.

4.3. Variables and Definitions

4.3.1. Dependent Variable: Environmental Protection Investment of Enterprises, EPI

This study examines the impact of policy effects on corporate EPI. We adopt the methodology suggested in Lyu et al. (2022), which entails taking the projects related to green environmental protection in the notes of corporate financial statements as the current environmental protection investment of enterprises [71]. The majority of funding arises from the capital expenses of ongoing projects, including waste gas and wastewater treatment facilities, as well as desulfurization and denitrification projects. As a result, we have chosen the EPI as the dependent variable. We make adjustments by normalizing the current environmental investment as a percentage of year-end total assets. We expand this value by a factor of 100 and label it as EPI.

4.3.2. Independent Variables: Implementation of NCETM, did (Treat·Post)

This study includes listed enterprises registered in the list of management entities included in the national carbon emissions control program as the experimental group, denoted as 1 for the Treat variable, while those outsiders are considered the control group, denoted as 0. The Post variable is determined by whether the NCETM is launched in the given time period. If the time period is the first half of 2021 or later, Post is denoted as 1. Otherwise, Post is denoted as 0. This study examines the cross-product term between Treat and Post as a key variable.

4.3.3. Control Variables

Drawing from prior studies [28,46,58], we have selected several control variables, which include Net Profit Margin ( R o a ), Leverage Ratio ( L e v ), Operating Expenses ( C o s t ), Cash and Cash Equivalents ( C a s h ), Financial Assets ( F i n a n c e ), Year-over-Year Growth of Operating Income ( G r o w t h ), Board Size ( B s i z e ), Government Subsidies ( S u b ), Years Listed ( A g e ), and Regional Economic Level ( G D P ).
The definitions and calculation methods of all variables are presented in Table 2.

4.4. Descriptive Statistics

Table 3 presents the descriptive statistics for the variables related to the sample in the experimental group and the control group, respectively. All values were rounded to two decimal places during processing.
Panel A presents the descriptive statistics for the experimental group, which consists of 67 listed companies observed over 10 periods, comprising a total of 670 observations. The dependent variable, E P I , has a mean value of 7.01. The minimum value of 0 suggests that some listed companies in the control group may have not made EPI, or this information was not disclosed in their financial reports. The maximum value, 53.27, indicates considerable fluctuations in EPI levels across listed companies, as also evidenced by the standard deviation. Regarding control variables, the most significant distinctions between samples are found in the G r o w t h and L e v . G r o w t h is a quantification of the growth potential of companies, ranging from negative to positive values, indicating significant fluctuations in growth potential among samples. L e v displays a minimum value of 4.56 and a maximum value of 98.09, emphasizing significant differences in companies’ borrowing habits.
Panel B displays descriptive statistics for the control group, comprising 4230 recorded observations for 423 listed companies across 10 periods. The mean of the dependent variable, E P I , is 5.94, with a minimum value of 0 and a maximum value of 51.61. Unlike the experimental group, samples in the control group demonstrated less pronounced numerical fluctuations, plausibly due to policy influence. Among the control variables, the data indicate that there persist noteworthy distinctions between samples in relation to G r o w t h and L e v .
Table 4 presents the correlation coefficients between variables in the entire sample data. The coefficients in the first column are less than 0.2, indicating no significant correlations between the dependent variable and the control variables. The remaining coefficients among the control variables are mostly below 0.4, implying weak or insignificant correlations. Therefore, we can temporarily disregard concerns about multicollinearity among the variables.

5. Empirical Results

5.1. The Results of Benchmark Regression

Table 4 presents the regression results of two regression analyses. In column 2, we focus solely on the impact of policy on corporate EPI, without controlling for any other variables. In this regression, the “did” coefficient is positive and statistically significant at the 0.01 level of significance. These results suggest that the policy has a positive impact on the environmental investments of controlled companies ( α 1 = 1.246 ,   p < 0.01 ). The result in column 3 involves introducing the control variables previously mentioned. In this regression, the coefficient for “did” remains positive, although its significance level decreases and is only significant at the 0.1 level ( α 1 = 0.788 ,   p < 0.1 ). These results lend credit to Hypothesis 1.
From Table 4, it is observed that the debt–equity ratio, L e v , is positively and significantly related to E P I ( α 2 2 = 0.056 ,   p < 0.01 ). This suggests that the company’s asset structure and willingness to incur debt promote environmental protection investment, although with a relatively modest impact. C a s h , which represents liquidity in the form of cash and cash equivalents, has a positive and significant impact on E P I ( α 2 4 = 0.205 ,   p < 0.05 ). Conversely, F i n a n c e is found to be negative and significant ( α 2 5 = 0.078 ,   p < 0.01 ), implying that the company’s financial investments tend to inhibit its environmental protection investment. Board Size ( B s i z e ) is positively and significantly associated with E P I , ( α 2 7 = 2.173 ,   p < 0.01 ), indicating that the involvement and commitment of the company’s management has a positive influence on environmental protection investment. Additionally, the coefficient of the company’s listing age is significantly negative ( α 2 9 = 0.939 ,   p < 0.01 ). It indicates that, as the company’s listing age increasing, it tends to reduce the environmental protection investment.

5.2. Robustness Test

5.2.1. Parallel Trend Test

The use of the difference-in-differences (DID) approach relies on a vital condition, namely that the model conforms to the parallel trend assumption, which previous scholars have established [72]. Not satisfying this requirement may result in biased estimations of policy effects, as the divergences between the two groups after implementing the policy may stem from other sources apart from the policy itself. To evaluate the accuracy of the parallel trends assumption, we performed an initial examination, a typical procedure in the current scholarly works. Interaction terms are created by multiplying half-year dummy variables with the dummy variables of the experimental group, which are then used as explanatory variables in regression. The main objective of this test is to determine if the coefficients are statistically insignificant. The test aims to validate the result that the coefficient on the interaction term between the dummy variable for the pre-policy time point and the dummy variable for the experimental group is not significant. This coefficient captures the difference between the experimental and control groups during a given half-year. In order to mitigate multicollinearity issues, period −1 is selected as the reference. Figure 4 graphically illustrates the results of this regression analysis. Table 5 offers a thorough summary of the coefficients that have been derived from the regression analysis. The coefficients for the interaction terms are not significantly different from zero. This finding validates the important assumption of parallel trends by confirming that there were no significant differences between the experimental and control groups before the policy was implemented.

5.2.2. Placebo Test

In this paper, we chose to change the time when the policy occurs, i.e., assuming that the policy occurs 2 periods earlier, and set the new interaction term variable to be d i d 2 , with all other variables unchanged. As can be seen from the results in Table 6, the coefficients of the new interaction term are not significant, proving that the model passes the placebo test.

5.3. Mechanism Analysis: R&D Investment

The analysis in Section 5.1 emphasizes the successful implementation of the NCETM in facilitating the EPI of enterprises. However, it is imperative to comprehend the mechanism responsible for the policy’s impact on enterprise EPI. Therefore, a comprehensive exploration into the black box mechanisms is needed. As previously mentioned in Section 3.2, the NCETM could prompt firms to choose R&D investment and promote green technological innovation, which results in an increasing EPI. Hence, this study introduces R&D investment as a mediator variable. It could help in investigating the complex cause-and-effect connections that underpin the impact mechanism of carbon trading policies on firms’ EPI. Combined with Equation (2), we perform a mechanism test on Equations (3) and (4).
M e d i a t i o n i t = β 0 + β 1 T r e a t i t · P o s t i t + β 2 C o n t r o l s i t + μ i + τ t + ε i t ,
Y i t = γ 0 + γ 1 T r e a t i t · P o s t i t + θ M e d i a t i o n i t + γ 2 C o n t r o l s i t + μ i + τ t + ε i t ,
The intermediate variable, R D , is calculated as the cumulative total of both expensed and capitalized research and development expenditures, as reported in the financial statements. The regression results for Equations (2)–(4) are presented in Table 7.
Based on the results in columns (2), (3), and (4), it can be concluded that R&D investment, indicated as R D , acts as the intermediary variable by which the NCETM affects the EPI of enterprises. The result in column (2) indicates a significant positive influence of the NCETM on enterprises’ EPI ( α 1 = 0.056 ,   p < 0.1 ). The result in column (3) shows a positive and significant relationship between the NCETM and corporate R&D investment ( β 1 = 0.482 ,   p < 0.05 ), suggesting that the NCETM greatly increases RD investment. In contrast, the results from column (4) indicate a positive d i d coefficient that is statistically insignificant ( γ 1 = 0.782 ,   p > 0.1 ). In conclusion, these results suggest that Hypothesis 2 was supported.

5.4. Heterogeneity Analysis

Extensive research has examined the industry, region, and firm-specific heterogeneity of the effectiveness of carbon emissions trading policies [8,21,28,47,73]. Of particular interest are studies of regional heterogeneity, which are typically differentiated by economic and geographical characteristics [8,47]. Unlike these studies, we focus on the national-level policy of launching a carbon emissions trading market and, therefore, analyze a sub-sample of pilot regions involved in pilot programs since 2013 and non-pilot regions by conducting regression analysis. The objective of this study is to examine if the implementation of national policies has differential effects on regions that have prior experience compared to those that do not. To address the challenge of a relatively small sample size, the sample data were divided into two categories: pilot region sample data and non-pilot region sample data. Table 8 presents detailed regression results for the pilot areas.
Results from the non-pilot regions indicate agreement with the benchmark findings. The regression results for the pilot region sample data indicate that the NCETM has no significant impact on enterprises’ EPI ( α 1 = 0.414 ,   p > 0.1   i n   r e g r e s s i o n   1 ; α 1 = 0 0.603 ,   p > 0.1   i n   r e g r e s s i o n   2 ). Notably, the coefficient of d i d was initially observed as positive before incorporating control variables. However, after introducing control variables, the coefficient of d i d transitions to a negative value.

6. Discussion

This study investigates the relationship between the NCETM and corporate EPI and the intermediate role of R&D investment. The results support both Hypotheses 1 and 2. This research has shown that (1) the NCETM is positively associated with corporate EPI. (2) The effect of the NCETM on corporate EPI is intermediated by R&D investment. (3) The effectiveness of the impact of the NCETM on corporate EPI differs by the region in which the firm is located. The three findings are discussed below.
Firstly, the main focus of this paper is to analyze how the NCETM affects enterprise EPI. The study found that the NCETM acts as a catalyst for environmental investment, which is consistent with the findings of previous studies about the pilot scheme [31]. This trend can be traced back to the market mechanisms embedded in the NCETM, which incentivize companies to increase their environmental protection investment [16]. As one of the world’s largest carbon emitters, China is facing significant pressure to reduce its carbon emissions [14]. Therefore, the Chinese government is prioritizing environmental protection and taking action to combat climate change [10]. At the same time, China presents a vast market with ample business opportunities for carbon reduction [14]. The NCETM provides guidance and incentives for companies to participate in environmental protection investments due to increasingly stringent regulations [16]. Companies will be more proactive in doing so to avoid fines and sanctions [21]. The NCETM could lead to a convergence of cost reduction, alleviated regulatory constraints, and increased economic benefits [21]. The implementation of the NCETM provides financial incentives for firms to proactively reduce emissions, which contrasts with past passive approaches of avoiding fines [9]. This policy encourages firms to participate more actively in environmental investments by increasing the rate of return on firms’ environmental investments as well as providing companies with an extra source of funding to support their environmental investment activities [63]. It extends the existing literature by using the NCETM, a national-wide policy, as a quasi-natural experiment, to explore the effect of the carbon emissions trading market on corporate EPI.
Secondly, this study demonstrates that R&D expenditures serve as a crucial intermediary mechanism in the impact of the NCETM on corporate EPI. On the one hand, China is currently undergoing a critical period of economic transformation and upgrading [74]. Promoting technological innovation and industrial upgrading is crucial for achieving sustainable development [74]. The implementation of the NCETM motivates firms to engage in technological innovation to cope with increasing market and investor concerns about environmental protection and gain market competition advantages [66]. Companies can increase their profit margins by developing and implementing energy-saving and emission-reduction technologies [33]. On the other hand, investment in R&D can increase a firm’s intangible assets to potentially enhance the return on environmental investment [69,71]. Along with the increasing awareness of environmental protection and social responsibility among Chinese companies, it may lead to an increase in firms’ participation in environmental investments [69]. Therefore, the NCETM could promote corporate EPI through increasing R&D investment, which is little discussed in prior literature. For the first time, this study introduces R&D investment as an intermediate variable in the effect of carbon emissions trading market on corporate EPI.
Thirdly, as shown in Table 8, the implementation of NCETM has no significant effect on corporate EPI for firms in the pilot area. Carbon emissions trading market construction in China started with local pilots due to significant differences between China and developed countries and regions in Europe and the United States in terms of their stage of economic development, international carbon emissions reduction responsibilities, distribution of carbon-emitting industries, and degree of electricity marketization [8]. Due to these circumstances, China was unable to fully utilize international experience and therefore had to accumulate experience in carbon emissions trading market construction through pilot experience. This result may be due to the fact that the companies from the pilot region may have already executed a significant volume of EPI or successfully accomplished their green transformation earlier. This might lead to a less notable influence of NCETM on the enterprises’ EPI. Furthermore, the limited sample size and relatively short data window may have contributed to these results. This result demonstrates the effectiveness of the CETS from a different perspective compared to previous studies.

7. Conclusions

7.1. Theoretical Implications and Policy Recommendations

The study provides new insights into the field of carbon emissions trading market and corporate EPI by systematically examining the effect of the nationwide carbon emissions trading market policy on corporate EPI. Firstly, this study introduces the nationwide carbon emissions trading market into the research framework for the first time. Secondly, this study innovatively includes R&D investment as a key mediating variable, to explore the mechanism underlying the effect of the NCETM on corporate EPI. The findings provide empirical support for the relationship between the carbon emissions trading market and corporate EPI. They also offer valuable references on how corporations can optimize their R&D investment in response to carbon emissions trading policies. These insights are useful for subsequent researchers and promote in-depth research in the field of carbon emissions trading market and corporate EPI.
Based on these findings, environmental protection regulation policymakers can benefit from the following insights:
Firstly, the government can expand the list of industries and enterprises involved in the carbon emissions trading market. This could incentivize more enterprises to increase their environmental protection investment. Consequently, it would improve the effectiveness of the country’s environmental governance mechanism. By expanding the reach of the carbon emissions trading market to include more industries and enterprises, the government can encourage greater participation in environmental protection efforts. This, in turn, will promote the overall process of environmental protection throughout the country.
Secondly, the government should explore the implementation of tailored environmental governance policies to enhance the efficacy of regulatory initiatives. Companies in different regions exhibit varying responses to the NCETM. An improved understanding of interregional enterprise variations would enable the government to develop more precise regulations and initiatives. Companies located in pilot regions may gain an edge in the NCETM compared to those in non-pilot regions. This advantage may stem from the fact that firms in pilot regions have already undergone their green transformation in the pilot phases and possess greater familiarity with the carbon emissions trading mechanism. Therefore, the government can compile an account of the pilot regions’ experiences and offer guidance to enterprises in non-pilot regions to improve their adaptation to the carbon emissions trading market.
Thirdly, the study offers a valuable policy reference for other countries seeking to promote environmental protection investments and building carbon trading emissions markets. The results highlight the potential benefits of implementing a carbon market as an effective policy tool to encourage firms to reduce carbon emissions and adopt more sustainable business practices. Other countries can learn from this study by combining carbon market policies with innovation and R&D policies to incentivize firms to adopt greener technologies and production methods. The early experience of pilot regions can also serve as a useful reference for accumulating experience on a limited scale and gradually expanding it to the whole country.

7.2. Future Directions

During the research and writing process, it was found that there were some limitations in this study and further exploration is necessary. Firstly, this study recognizes a limitation in its investigation of the long-term impacts of the NCETM as the policy has only recently been implemented. Future research could expand the study window, covering a more extended period, to comprehensively clarify the medium- and long-term implications of the NCETM.
Secondly, the present investigation examines the influence of the NCETM on corporate EPI predominantly from the standpoint of R&D investment. Nevertheless, the fundamental process might be complex and extend beyond this lone perspective. Future research could examine other moderating and intermediary factors that influence the NCETM’s effect on corporate EPI. For example, studying politically affiliated companies, which often receive increased government aid and protection, to analyze the effect of the NCETM could provide important findings. This research could contribute to the current literature regarding the connection between the NCETM and corporate EPI.
Thirdly, this study examines the impact of the NCETM on corporate EPI without considering the variations in this process across industries and firms. Different industries and firms may encounter distinct market environments and technological requirements, which can influence their response to the NCETM and their investment decisions. Future research could refine the analysis to explore the differentiated responses of different industries and firms when facing NCETM. For instance, comparing factors such as carbon intensity, technology level, and market competitiveness between industries can provide insights into the specific impacts of NCETM on each industry. Additionally, it is important to consider the impact of policy constraints, economic incentives, and social responsibility on these enterprises. This will enable us to provide more targeted recommendations to policymakers and enterprises to promote sustainable development and a green, low-carbon transition.

Author Contributions

Conceptualization, X.Y. and G.P.; methodology, W.J.; writing—original draft, X.Y. and K.W. All authors have read and agreed to the published version of the manuscript.

Funding

This research was funded by the National Natural Science Foundation of China, grant number Project No. 71972174, 72192843, and 72334006.

Institutional Review Board Statement

Not applicable.

Informed Consent Statement

Not applicable.

Data Availability Statement

The variables used in this paper were collected from the China Stock Market and Accounting Research (CSMAR) Database and the Chioce Database.

Conflicts of Interest

The authors declare no conflict of interest.

References

  1. Tang, L.; Wu, J.; Yu, L.; Bao, Q. Carbon Emissions Trading Scheme Exploration in China: A Multi-Agent-Based Model. Energy Policy 2015, 81, 152–169. [Google Scholar] [CrossRef]
  2. Clarkson, P.M.; Li, Y.; Pinnuck, M.; Richardson, G.D. The Valuation Relevance of Greenhouse Gas Emissions under the European Union Carbon Emissions Trading Scheme. Eur. Account. Rev. 2014, 24, 551–580. [Google Scholar] [CrossRef]
  3. Zhang, H.; Duan, M. China’s Pilot Emissions Trading Schemes and Competitiveness: An Empirical Analysis of the Provincial Industrial Sub-Sectors. J. Environ. Manag. 2020, 258, 109997. [Google Scholar] [CrossRef] [PubMed]
  4. Wu, Q.; Wang, M.; Tian, L. The Market-Linkage of the Volatility Spillover between Traditional Energy Price and Carbon Price on the Realization of Carbon Value of Emission Reduction Behavior. J. Clean. Prod. 2020, 245, 118682. [Google Scholar] [CrossRef]
  5. Chen, S.; Li, Y.; Yao, Q. The Health Costs of the Industrial Leap Forward in China: Evidence from the Sulfur Dioxide Emissions of Coal-Fired Power Stations. China Econ. Rev. 2018, 49, 68–83. [Google Scholar] [CrossRef]
  6. Fan, J.H.; Todorova, N. Dynamics of China’s Carbon Prices in the Pilot Trading Phase. Appl. Energy 2017, 208, 1452–1467. [Google Scholar] [CrossRef]
  7. Dormady, N.C. Carbon Auctions, Energy Markets & Market Power: An Experimental Analysis. Energy Econ. 2014, 44, 468–482. [Google Scholar] [CrossRef]
  8. Chen, S.; Shi, A.; Wang, X. Carbon Emission Curbing Effects and Influencing Mechanisms of China’s Emission Trading Scheme: The Mediating Roles of Technique Effect, Composition Effect and Allocation Effect. J. Clean. Prod. 2020, 264, 121700. [Google Scholar] [CrossRef]
  9. Coase, R.H. The Problem of Social Cost. J. Law Econ. 1960, 56, 837–877. [Google Scholar] [CrossRef]
  10. Ministry of Ecology and Environment of the People’s Republic of China Administrative. Measures for Carbon Emissions Trading (Trial Implementation). Available online: https://www.gov.cn/zhengce/zhengceku/2021-01/06/content_5577360.htm (accessed on 19 December 2023).
  11. Global Energy Review: CO2 Emissions in 2021; International Energy Agency: Paris, France, 2021.
  12. Green, F.; Stern, N. China’s Changing Economy: Implications for Its Carbon Dioxide Emissions. Clim. Policy 2017, 17, 423–442. [Google Scholar] [CrossRef]
  13. Cui, L.; Li, R.; Song, M.; Zhu, L. Can China Achieve Its 2030 Energy Development Targets by Fulfilling Carbon Intensity Reduction Commitments? Energy Econ. 2019, 83, 61–73. [Google Scholar] [CrossRef]
  14. CO2 Emissions in 2022; International Energy Agency: Paris, France, 2023.
  15. Shanghai Environment and Energy Exchange. National Carbon Market Daily Consolidated Price Quotes and Transaction Information 20231017. Available online: https://www.cneeex.com/c/2023-10-17/494718.shtml (accessed on 20 December 2023).
  16. Prag, A.; Briner, G.; Hood, C. Making Markets: Unpacking Design and Governance of Carbon Market Mechanisms; OECD: Paris, France, 2012. [Google Scholar]
  17. Porter, M.E.; van der Linde, C. Toward a New Conception of the Environment-Competitiveness Relationship. J. Econ. Perspect. 1995, 9, 97–118. [Google Scholar] [CrossRef]
  18. Leiter, A.M.; Parolini, A.; Winner, H. Environmental Regulation and Investment: Evidence from European Industry Data. Ecol. Econ. 2011, 70, 759–770. [Google Scholar] [CrossRef]
  19. Huang, L.; Lei, Z. How Environmental Regulation Affect Corporate Green Investment: Evidence from China. J. Clean. Prod. 2021, 279, 123560. [Google Scholar] [CrossRef]
  20. Gray, W.B. The Cost of Regulation: OSHA, EPA and the Productivity Slowdown. Am. Econ. Rev. 1987, 77, 998–1006. [Google Scholar]
  21. Tian, L.; Guan, X.; Li, Z.; Li, X. Reform of Environmental Protection Fee-to-Tax and Enterprise Environmental Protection Investment: A Quasi-Natural Experiment Based on the Implementation of the Environmental Protection Tax Law. J. Finance Econ. 2022, 48, 32–46. [Google Scholar] [CrossRef]
  22. Maggioni, D.; Santangelo, G.D. Local Environmental Non-Profit Organizations and the Green Investment Strategies of Family Firms. Ecol. Econ. 2017, 138, 126–138. [Google Scholar] [CrossRef]
  23. Zhu, J.; Fan, Y.; Deng, X.; Xue, L. Low-Carbon Innovation Induced by Emissions Trading in China. Nat. Commun. 2019, 10, 4088. [Google Scholar] [CrossRef]
  24. Arouri, M.E.H.; Caporale, G.M.; Rault, C.; Sova, R.; Sova, A. Environmental Regulation and Competitiveness: Evidence from Romania. Spec. Sect. Planet. Boundaries Glob. Environ. Gov. 2012, 81, 130–139. [Google Scholar] [CrossRef]
  25. Stoerk, T.; Dudek, D.J.; Yang, J. China’s National Carbon Emissions Trading Scheme: Lessons from the Pilot Emission Trading Schemes, Academic Literature, and Known Policy Details. Clim. Policy 2019, 19, 472–486. [Google Scholar] [CrossRef]
  26. Goulder, L.H.; Morgenstern, R.D.; Munnings, C.; Schreifels, J. China’s National Carbon Dioxide Emission Trading System. Econ. Energy Environ. Policy 2017, 6, 1–18. [Google Scholar] [CrossRef]
  27. Sun, L.; Xiang, M.; Shen, Q. A Comparative Study on the Volatility of EU and China’s Carbon Emission Permits Trading Markets. Phys. Stat. Mech. Its Appl. 2020, 560, 125037. [Google Scholar] [CrossRef]
  28. Qi, S.-Z.; Zhou, C.-B.; Li, K.; Tang, S.-Y. Influence of a Pilot Carbon Trading Policy on Enterprises’ Low-Carbon Innovation in China. Clim. Policy 2021, 21, 318–336. [Google Scholar] [CrossRef]
  29. Petroni, G.; Bigliardi, B.; Galati, F. Rethinking the Porter Hypothesis: The Underappreciated Importance of Value Appropriation and Pollution Intensity. Rev. Policy Res. 2019, 36, 121–140. [Google Scholar] [CrossRef]
  30. Xu, S.; Pan, W.; Wen, D. Do Carbon Emission Trading Schemes Promote the Green Transition of Enterprises? Evidence from China. Sustainability 2023, 15, 6333. [Google Scholar] [CrossRef]
  31. Lv, S.; Lv, Y.; Gao, D.; Liu, L. The Path to Green Development: The Impact of a Carbon Emissions Trading Scheme on Enterprises’ Environmental Protection investment. Sustainability 2023, 15, 12551. [Google Scholar] [CrossRef]
  32. Niesten, E.; Frumhoff, P.C.; Manion, M.; Hardner, J.J. Designing a Carbon Market That Protects Forests in Developing Countries. Philos. Trans. R. Soc. Lond. Ser. Math. Phys. Eng. Sci. 2002, 360, 1875–1888. [Google Scholar] [CrossRef]
  33. Fankhauser, S.; Hepburn, C. Designing Carbon Markets. Part I: Carbon Markets in Time. Energy Policy 2010, 38, 4363–4370. [Google Scholar] [CrossRef]
  34. Bryant, G. The Politics of Carbon Market Design: Rethinking the Techno-Politics and Post-Politics of Climate Change: The Politics of Carbon Market Design. Antipode 2016, 48, 877–898. [Google Scholar] [CrossRef]
  35. Hua, W.; Jiang, J.; Sun, H.; Wu, J. A Blockchain Based Peer-to-Peer Trading Framework Integrating Energy and Carbon Markets. Appl. Energy 2020, 279, 115539. [Google Scholar] [CrossRef]
  36. Narassimhan, E.; Gallagher, K.S.; Koester, S.; Alejo, J.R. Carbon Pricing in Practice: A Review of Existing Emissions Trading Systems. Clim. Policy 2018, 18, 967–991. [Google Scholar] [CrossRef]
  37. Zhang, X.; Wang, J. An Enhanced Decomposition Integration Model for Deterministic and Probabilistic Carbon Price Prediction Based on Two-Stage Feature Extraction and Intelligent Weight Optimization. J. Clean. Prod. 2023, 415, 137791. [Google Scholar] [CrossRef]
  38. An, Y.; Zhou, D.; Yu, J.; Shi, X.; Wang, Q. Carbon Emission Reduction Characteristics for China’s Manufacturing Firms: Implications for Formulating Carbon Policies. J. Environ. Manag. 2021, 284, 112055. [Google Scholar] [CrossRef] [PubMed]
  39. Aldy, J.E. Pricing Climate Risk Mitigation. Nat. Clim. Chang. 2015, 5, 396–398. [Google Scholar] [CrossRef]
  40. Zhu, B.; Ye, S.; Han, D.; Wang, P.; He, K.; Wei, Y.-M.; Xie, R. A Multiscale Analysis for Carbon Price Drivers. Energy Econ. 2019, 78, 202–216. [Google Scholar] [CrossRef]
  41. Zhou, F.; Huang, Z.; Zhang, C. Carbon Price Forecasting Based on CEEMDAN and LSTM. Appl. Energy 2022, 311, 118601. [Google Scholar] [CrossRef]
  42. Wang, M.; Zhu, M.; Tian, L. A Novel Framework for Carbon Price Forecasting with Uncertainties. Energy Econ. 2022, 112, 106162. [Google Scholar] [CrossRef]
  43. Wang, J. Causal Carbon Price Interval Prediction Using Lower Upper Bound Estimation Combined with Asymmetric Multi-Objective Evolutionary Algorithm and Long Short-Term Memory. Expert Syst. Appl. 2024, 236, 121286. [Google Scholar] [CrossRef]
  44. Zhou, P.; Zhang, L.; Zhou, D.Q.; Xia, W.J. Modeling Economic Performance of Interprovincial CO2 Emission Reduction Quota Trading in China. Appl. Energy 2013, 112, 1518–1528. [Google Scholar] [CrossRef]
  45. Teixidó, J.; Verde, S.F.; Nicolli, F. The Impact of the EU Emissions Trading System on Low-Carbon Technological Change: The Empirical Evidence. Ecol. Econ. 2019, 164, 106347. [Google Scholar] [CrossRef]
  46. Yang, X.; Jiang, P.; Pan, Y. Does China’s Carbon Emission Trading Policy Have an Employment Double Dividend and a Porter Effect? Energy Policy 2020, 142, 111492. [Google Scholar] [CrossRef]
  47. Zhang, S.; Wang, Y.; Hao, Y.; Liu, Z. Shooting Two Hawks with One Arrow: Could China’s Emission Trading Scheme Promote Green Development Efficiency and Regional Carbon Equality? Energy Econ. 2021, 101, 105412. [Google Scholar] [CrossRef]
  48. Tang, A.; Xu, N. The Impact of Environmental Regulation on Urban Green Efficiency—Evidence from Carbon Pilot. Sustainability 2023, 15, 1136. [Google Scholar] [CrossRef]
  49. Graves, S.B.; Waddock, S.A. Institutional Owners and Corporate Social Performance. Acad. Manag. J. 1994, 37, 1034–1046. [Google Scholar] [CrossRef]
  50. Peng, F.; Li, B. Analysis of Environment Protection Investment. Environ. Sci. Technol. 2005, 28, 72–74. [Google Scholar] [CrossRef]
  51. Zhang, X.; Wu, L.; Zhang, R.; Deng, S.; Zhang, Y.; Wu, J.; Li, Y.; Lin, L.; Li, L.; Wang, Y.; et al. Evaluating the Relationships among Economic Growth, Energy Consumption, Air Emissions and Air Environmental Protection Investment in China. Renew. Sustain. Energy Rev. 2013, 18, 259–270. [Google Scholar] [CrossRef]
  52. Wang, L. Earnings Pressure, External Supervision, and Corporate Environmental Protection Investment: Comparison between Heavy-Polluting and Non-Heavy-Polluting Industries. J. Clean. Prod. 2023, 385, 135648. [Google Scholar] [CrossRef]
  53. Palmer, K.; Oates, W.E.; Portney, P.R. Tightening Environmental Standards: The Benefit-Cost or the No-Cost Paradigm? J. Econ. Perspect. 1995, 9, 119–132. [Google Scholar] [CrossRef]
  54. Filbeck, G.; Gorman, R.F. The Relationship between the Environmental and Financial Performance of Public Utilities. Environ. Resour. Econ. 2004, 29, 137–157. [Google Scholar] [CrossRef]
  55. Konar, S.; Cohen, M.A. Information As Regulation: The Effect of Community Right to Know Laws on Toxic Emissions. J. Environ. Econ. Manag. 1997, 32, 109–124. [Google Scholar] [CrossRef]
  56. Wang, K.; Cui, W.; Mei, M.; Lv, B.; Peng, G. The Moderating Role of Environmental Information Disclosure on the Impact of Environment Protection Investment on Firm Value. Sustainability 2023, 15, 9174. [Google Scholar] [CrossRef]
  57. Chang, K.-C.; Wang, D.; Lu, Y.; Chang, W.; Ren, G.; Liu, L.; Zhou, X. Environmental Regulation, Promotion Pressure of Officials, and Enterprise Environmental Protection Investment. Front. Public Health 2021, 9, 724351. [Google Scholar] [CrossRef] [PubMed]
  58. Zhang, W.; Li, G.; Guo, F. Does Carbon Emissions Trading Promote Green Technology Innovation in China? Appl. Energy 2022, 315, 119012. [Google Scholar] [CrossRef]
  59. del Río, P.; Tarancón Morán, M.Á.; Albiñana, F.C. Analysing the Determinants of Environmental Technology Investments. A Panel-Data Study of Spanish Industrial Sectors. J. Clean. Prod. 2011, 19, 1170–1179. [Google Scholar] [CrossRef]
  60. Drèze, J.; Stern, N. Chapter 14 The Theory of Cost-Benefit Analysis. In Handbook of Public Economics; Handbook of Public Economics; Elsevier: Amsterdam, The Netherlands, 1987; Volume 2, pp. 909–989. [Google Scholar]
  61. Yang, L.; Qin, H.; Xia, W.; Gan, Q.; Li, L.; Su, J.; Yu, X. Resource Slack, Environmental Management Maturity and Enterprise Environmental Protection Investment: An Enterprise Life Cycle Adjustment Perspective. J. Clean. Prod. 2021, 309, 127339. [Google Scholar] [CrossRef]
  62. Yang, L.; Qin, H.; Gan, Q.; Su, J. Internal Control Quality, Enterprise Environmental Protection Investment and Finance Performance: An Empirical Study of China’s A-Share Heavy Pollution Industry. Int. J. Environ. Res. Public Health 2020, 17, 6082. [Google Scholar] [CrossRef] [PubMed]
  63. Zhou, F.; Wang, X. The Carbon Emissions Trading Scheme and Green Technology Innovation in China: A New Structural Economics Perspective. Econ. Anal. Policy 2022, 74, 365–381. [Google Scholar] [CrossRef]
  64. Acemoglu, D.; Aghion, P.; Bursztyn, L.; Hemous, D. The Environment and Directed Technical Change. Am. Econ. Rev. 2012, 102, 131–166. [Google Scholar] [CrossRef]
  65. Zhang, Y.-J.; Peng, Y.-L.; Ma, C.-Q.; Shen, B. Can Environmental Innovation Facilitate Carbon Emissions Reduction? Evidence from China. Energy Policy 2017, 100, 18–28. [Google Scholar] [CrossRef]
  66. Russo, M.V.; Fouts, P.A. A Resource-Based Perspective On Corporate Environmental Performance And Profitability. Acad. Manag. J. 1997, 40, 534–559. [Google Scholar] [CrossRef]
  67. Padgett, R.C.; Galan, J.I. The Effect of R&D Intensity on Corporate Social Responsibility. J. Bus. Ethics 2010, 93, 407–418. [Google Scholar] [CrossRef]
  68. King, A.; Lenox, M. Exploring the Locus of Profitable Pollution Reduction. Manag. Sci. 2002, 48, 289–299. [Google Scholar] [CrossRef]
  69. Chakrabarty, S.; Wang, L. The Long-Term Sustenance of Sustainability Practices in MNCs: A Dynamic Capabilities Perspective of the Role of R&D and Internationalization. J. Bus. Ethics 2012, 110, 205–217. [Google Scholar] [CrossRef]
  70. National Carbon Market Information Network Information Disclosure of Key Emitters. Available online: https://www.cets.org.cn/zdpfdwxxgk/index.jhtml (accessed on 21 December 2023).
  71. Lyu, M.; Xu, G.; Shen, Y. Monetary Policy and Corporate Environmental Investment: Evidence from the Most Polluting Listed Companies in China. Econ. Manag. J. 2019, 11, 55–71. [Google Scholar] [CrossRef]
  72. Becker, S.O.; Pascali, L. Religion, Division of Labor, and Conflict: Anti-Semitism in Germany over 600 Years. Am. Econ. Rev. 2019, 109, 1764–1804. [Google Scholar] [CrossRef]
  73. Xiao, J.; Li, G.; Zhu, B.; Xie, L.; Hu, Y.; Huang, J. Evaluating the Impact of Carbon Emissions Trading Scheme on Chinese Firms’ Total Factor Productivity. J. Clean. Prod. 2021, 306, 127104. [Google Scholar] [CrossRef]
  74. Bai, T.; Qi, Y.; Li, Z.; Xu, D. Digital Economy, Industrial Transformation and Upgrading, and Spatial Transfer of Carbon Emissions: The Paths for Low-Carbon Transformation of Chinese Cities. J. Environ. Manag. 2023, 344, 118528. [Google Scholar] [CrossRef]
Figure 1. Implementation process of the carbon emissions trading system [10].
Sustainability 16 00402 g001
Figure 2. A simple example of the NCETM in China [10].
Sustainability 16 00402 g002
Figure 3. Theoretical mechanism model.
Sustainability 16 00402 g003
Figure 4. EPI parallel trend test.
Sustainability 16 00402 g004
Table 1. Industrial distribution [70].
Industry CodeSecondary IndustryQuantity
C13Manufacturing—Food Processing of Agricultural and Sideline Products1
C14Manufacturing—Food Manufacturing3
C15Manufacturing—Alcohol, Beverage, and Refined Tea Manufacturing1
C17Manufacturing—Textile Industry2
C22Manufacturing—Paper and Paper Products Industry9
C25Manufacturing—Petroleum Processing, Coking, and Nuclear Fuel Processing2
C26Manufacturing—Chemical Raw Materials and Chemical Products Manufacturing21
C27Manufacturing—Pharmaceutical Manufacturing1
C28Manufacturing—Chemical Fiber Manufacturing3
C29Manufacturing—Rubber and Plastic Products Manufacturing2
C31Manufacturing—Ferrous Metal Smelting and Rolling Processing3
C32Manufacturing—Non-Ferrous Metal Smelting and Rolling Processing2
D44Electricity, Heat, Gas, and Water Production and Supply—Electricity and Heat Production and Supply16
B06Mining—Coal Mining and Washing4
B07Mining—Oil and Natural Gas Extraction1
J67Financial Industry—Capital Market Services1
S90Comprehensive—Comprehensive1
Table 2. Variable descriptions and calculation methods.
Variable TypeVariableDefinitions and Calculation Methods
Dependent variable E P I EPI = Environmental protection investment for the current period/period-end total assets × 100
Independent variable T r e a t In the case of enterprises in the list of management entities included in the national carbon emissions control program, the value is 1; otherwise, it is 0.
Control variable R o a Net profit/average balance of total assets. Measures the company’s profitability.
L e v Period-end total debt divided by period-end total assets, reflecting the company’s ability to pay for the debt.
C o s t ln (operating expenses). Measures the company’s daily operational expenses.
C a s h ln (cash and cash equivalents). Measures the company’s liquidity.
F i n a n c e (Total financial assets for the current period/period-end total assets) ×   100 . Measures non-environmental investments of the company.
G r o w t h (Operating income in y e a r t + 1 operating income in y e a r t )/(operating income in y e a r t ). Represents the company’s growth potential.
B s i z e ln (Number of board members +   1 ). Represents the decision-making awareness of the company’s top management.
S u b ln (Government subsidies). One of the sources of funding for corporate EPI.
A g e ln (current year − year of listing + 1). Represents the company’s maturity.
G D P ln (GDP). Represents the economic level of the region where the company is located.
Table 3. Descriptive statistics.
Panel A: Experimental Group
VariableNMeanStdMinMax
E P I 6707.018.340.0053.27
R o a 6705.607.34−79.5552.80
L e v 67047.1218.544.5698.09
C o s t 67019.062.460.0025.02
C a s h 67020.523.040.0025.77
F i n a n c e 6707.169.880.0052.22
G r o w t h 67014.1042.67−62.20763.33
B s i z e 6702.950.232.563.87
S u b 67016.333.380.0022.88
A g e 6702.850.671.103.43
G D P 67010.670.778.1611.77
Panel B: Control Group
VariableNMeanStdMinMax
E P I 42305.947.200.0051.61
R o a 42306.659.37−212.5063.87
L e v 423041.5661.171.311879.04
C o s t 423017.333.790.0022.25
C a s h 423018.894.180.0024.25
F i n a n c e 42305.989.050.0086.06
G r o w t h 423021.3279.99−97.022744.14
B s i z e 42302.870.222.304.42
S u b 423014.614.110.0020.82
A g e 42302.170.920.003.47
G D P 423010.820.717.3411.77
Table 4. Benchmark regression result.
(1)(2)
Variables E P I E P I
d i d 1.246 ***0.788 *
(0.463)(0.468)
R o a −0.003
(0.015)
L e v 0.056 ***
(0.006)
C o s t 0.102
(0.121)
C a s h 0.205 **
(0.086)
F i n a n c e −0.078 ***
(0.012)
G r o w t h −0.002
(0.001)
B s i z e 2.173 ***
(0.501)
S u b −0.041
(0.045)
A g e −0.939 ***
(0.155)
G D P 0.109
(0.151)
_ c o n s 6.021 ***−5.946 **
(0.108)(2.66)
Observations49004584
R-squared0.0010.051
Note: ***, **, and * indicate the significance levels of 1%, 5%, and 10%, respectively. The numbers in parentheses are standard errors.
Table 5. Parallel trend test results.
Period E P I
pre_30.570
(0.786)
pre_20.053
(0.594)
current−0.117
(0.454)
post_1−0.277
(0.807)
post_2−0.718
(0.834)
post_3−0.028
(0.955)
q: base 10
20.949 **
(0.276)
30.300
(0.264)
41.071 **
(0.359)
51.469 ***
(0.386)
61.756 ***
(0.432)
72.068 ***
(0.436)
81.608 ***
(0.412)
92.085 ***
(0.420)
102.357 ***
(0.420)
_ c o n s 4.706 ***
(0.288)
Observations4900
R-squared0.019
Note: *** and ** indicate the significance levels of 1% and 5%, respectively. The numbers in parentheses are standard errors.
Table 6. Placebo test results.
VariablesEPI
d i d
0.192
(0.393)
R o a
−0.014
(0.015)
L e v
1.875 ***
(0.145)
C o s t
−0.707 ***
(0.143)
C a s h
−0.488 ***
(0.100)
F i n a n c e
−0.105 ***
(0.011)
G r o w t h
−0.001
(0.001)
B s i z e
1.915 ***
(0.497)
S u b
−0.025
(0.044)
A g e
−1.167 ***
(0.155)
G D P
0.180
(0.150)
_ c o n s −16.339 ***
(2.707)
Observations4584
R-squared0.069
Note: *** indicates the significance level of 1%. The numbers in parentheses are standard errors.
Table 7. Mechanism analysis results.
(2)(3)(4)
EPIRDEPI
d i d 0.788 *0.482 **0.782
(0.468)(0.2)(0.553)
R D −0.012 *
(0.018)
R o a −0.0030.036 ***−0.003
(0.015)(0.011)(0.014)
L e v 0.056 ***−0.037 ***0.056 ***
(0.006)(0.005)(0.007)
C o s t 0.1020.69 ***0.11
(0.121)(0.123)(0.13)
C a s h 0.205 **−0.561 ***0.198 **
(0.086)(0.093)(0.084)
F i n a n c e −0.078 ***−0.071 ***−0.079 ***
(0.012)(0.007)(0.009)
G r o w t h −0.0020.002 *−0.002 **
(0.001)(0.001)(0.001)
B s i z e 2.173 ***0.639 **2.18 ***
(0.501)(0.301)(0.643)
S u b −0.041−0.011−0.041
(0.045)(0.061)(0.049)
A g e −0.939 ***−0.259 **−0.942 ***
(0.155)(0.114)(0.148)
G D P 0.1090.454 ***0.115
(0.151)(0.111)(0.177)
_ c o n s −5.946 **0.299−5.942 *
(2.66)(1.63)(3.095)
Observations458445844584
R-squared0.0510.0830.051
Note: ***, **, and * indicate the significance levels of 1%, 5%, and 10%, respectively. The numbers in parentheses are standard errors.
Table 8. Regression results for the pilot area.
(1)(2)
Variables E P I E P I
d i d 0.414−0.603
(0.57)(0.526)
R o a −0.026
(0.024)
L e v 0.048 ***
(0.011)
C o s t 0.405 *
(0.214)
C a s h 0.409 ***
(0.135)
F i n a n c e −0.087 ***
(0.013)
G r o w t h 0
(0.003)
B s i z e 3.771 ***
(1.134)
S u b −0.144 *
(0.079)
A g e −1.476 ***
(0.273)
G D P −0.608
(0.377)
_ c o n s 5.918 ***−9.213
(0.186)(5.875)
Observations14701470
R-squared00.098
Note: *** and * indicate the significance levels of 1% and 10%, respectively. The numbers in parentheses are standard errors.
Disclaimer/Publisher’s Note: The statements, opinions and data contained in all publications are solely those of the individual author(s) and contributor(s) and not of MDPI and/or the editor(s). MDPI and/or the editor(s) disclaim responsibility for any injury to people or property resulting from any ideas, methods, instructions or products referred to in the content.

