Article

Ultrafiltration Harvesting of Microalgae Culture Cultivated in a WRRF: Long-Term Performance and Techno-Economic and Carbon Footprint Assessment

by
Juan Francisco Mora-Sánchez
1,*,
Josué González-Camejo
1,*,
Guillermo Noriega-Hevia
2,
Aurora Seco
1 and
María Victoria Ruano
1
1
CALAGUA-Unidad Mixta UV-UPV, Departament d’Enginyeria Química, Universitat de València, Avinguda de la Universitat s/n, 46100 Valencia, Spain
2
CALAGUA-Unidad Mixta UV-UPV, Institut Universitari d’Investigació d’Enginyeria de l’Aigua i Medi Ambient-IIAMA, Universitat Politècnica de Valencia, Camí de Vera s/n, 46022 Valencia, Spain
*
Authors to whom correspondence should be addressed.
Sustainability 2024, 16(1), 369; https://doi.org/10.3390/su16010369
Submission received: 1 December 2023 / Revised: 21 December 2023 / Accepted: 29 December 2023 / Published: 31 December 2023
(This article belongs to the Special Issue Microalgae-Based Wastewater Treatment Processes and Biorefineries)

Abstract

:
A cross-flow ultrafiltration harvesting system for a pre-concentrated microalgae culture was tested in an innovative anaerobic-based WRRF. The microalgae culture was cultivated in a membrane photobioreactor fed with effluent from an anaerobic membrane bioreactor treating sewage. These harvested microalgae biomasses were then anaerobically co-digested with primary and secondary sludge from the water line. Depending on the needs of this anaerobic co-digestion, the filtration harvesting process was evaluated intermittently over a period of 212 days for different operating conditions, mainly the total amount of microalgae biomass harvested and the desired final total solids concentration (up to 15.9 g·L−1 with an average of 9.7 g·L−1). Concentration ratios of 15–27 were obtained with average transmembrane fluxes ranging from 5 to 28 L·m−2·h−1. Regarding membrane cleaning, both backflushing and chemical cleaning resulted in transmembrane flux recoveries that were, on average, 21% higher than those achieved with backflushing alone. The carbon footprint assessment shows promising results, as the GHG emissions associated with the cross-flow ultrafiltration harvesting process could be less than the emissions savings associated with the energy recovered from biogas production from the anaerobic valorisation of the harvested microalgae.

1. Introduction

Worldwide, industrial activities are facing great challenges to become more sustainable and “carbon free” by minimising emissions of greenhouse gases (GHG). Within industrial activities, large-scale wastewater treatment has scarcely considered sustainability in its processes so far, although its energy consumption is highly relevant as it has prioritised effluents’ quality requirements. The energy consumption of urban wastewater treatment has been reported to account for above 1% of a country’s total energy consumption in Europe [1]. The current paradigm of water treatment needs to be shifted towards more sustainable and circular activities [2]. In fact, the new proposal for the updated wastewater treatment directive, which is currently being revised, aims to achieve energy neutrality by 2040 for all wastewater facilities above 10,000 p.e. [3]. For this reason, many researchers are on the lookout for alternative wastewater treatment systems that can be instrumental in reducing GHG emissions.
A green alternative whose interest has grown exponentially in the last decade is the cultivation of microalgae in combination with wastewater treatment. This alternative allows for the reduction in carbon emissions, the recovery of nutrients from water streams, and the production of valuable microalgae biomass that contains approximately 50% carbon, 10% nitrogen, and 1% phosphorus [4,5,6,7,8,9]. Furthermore, wastewater valorisation through microalgae cultivation has been reported to reduce environmental impact and energy consumption compared to conventional treatment based on activated sludge systems [10].
Despite the many benefits of microalgae cultivation, current full-scale systems are scarce. One of the main issues of microalgae-based water resource recovery facilities (WRRFs) is the large surface areas that are required for the successful cultivation of microalgae, as open reactors’ depths are shallow (i.e., 15–40 cm), and hydraulic retention times (HRT) are typically around 3–10 days [11,12,13,14,15]. To improve this, an increasing number of authors are testing different options to make the technology more efficient. For instance, some authors are trying to develop instrumentation, control, and automation (ICA) systems to improve microalgae performance [16]. Other reactor configurations have been proposed to increase the photosynthetic efficiency of microalgae, for instance, by using thin-layer reactors to increase light availability [17,18]. For example, Morales-Amaral et al. [19] produced higher amounts of biomass in a 2 cm deep thin-layer reactor than in a raceway pond (43% more). Other authors have incorporated membrane separation technologies to decouple the HRT from the solids retention time (SRT) in order to increase the nutrient loading to the treatment system while maintaining the microalgae biomass in the reactor for longer periods of time, giving them more time to grow and increase productivity [20,21]. Luo et al. [20] managed to reduce the HRT up to 1 d (decoupled from the SRT of 9–30 d) using membrane photobioreactor technology. This implied an increase in nitrogen and phosphorus yields of 25–100%. In addition, Gao et al. [22] were able to increase biomass productivity when reducing the HRT from 6 to 2 d (SRT = 21 d). To achieve this decoupling, the microalgae biomass needs to be separated from the wastewater stream, which is not a simple process and requires the use of harvesting systems that are generally energetically and economically demanding [23,24]. A harvesting step is also necessary to concentrate the microalgae biomass with the aim of obtaining added value by-products, such as biogas from its anaerobic digestion [25], biocrude with a high content of alkenes and alkanes [26], biodiesel [27], lipids [28], fatty acid methyl esters [29], nutraceutical applications as linoleic and linolenic acids [30], eicosapentaenoic acid (EPA) and docosahexanoic acid (DHA) [31], or pigments in a biorefinery approach [32].
The main obstacle linked to microalgae-derived bioproducts, such as biofuels or biomethane, is their high cost when compared to petroleum-derived products. For instance, the cost of 10,000 tonnes of microalgal biomass with a lipid content of 30% is computed at 3.19 EUR/L, including biomass conversion, tariffs, and market prices [32]. In contrast, petroleum costs are 2.5 times cheaper [32]. Hence, optimising parameters involved in the production of harvested microalgal biomass is indispensable to improving process efficiency. Concerning the use of algal biomass for biogas, as opposed to its conventional combustion in combined heat and power (CHP) units, its conversion into biomethane can provide both environmental benefits (reducing GHG emissions) and economic benefits (enhanced efficiency in utilizing the energy contained in the biomass) [33]. Under current market conditions in Europe, the production of biomethane, including anaerobic digestion and related expenses, is estimated to cost around 70–90 EUR/MWh [33]. In addition to the costs associated with production and upgrading, there are additional costs associated with the transmission of biomethane to the grid or alternative management. About 5% (approximately 3–4 EUR/MWh) is allocated to grid connection costs, and liquefaction costs are estimated at about 12 EUR/MWh [33]. Although biomethane faces challenges in competing with natural gas due to its lower prices and higher availability, the need to reduce CO2 emissions and achieve long-term economic decarbonisation argues in favour of biomethane production. Significantly, there is an increasing interest in biomethane in industries that are challenging to electrify, as its use does not incur carbon costs under the EU ETS when it is substituted for natural gas. Microalgae harvesting is a crucial stage in the production of microalgae for bioproducts or their valorisation as biomethane, accounting for 20–30% of the total cost. It ranks second only to cultivation costs, emphasising the need for its optimisation [27] to increase the competitiveness of the biorefinery approach.
Harvesting systems such as gravity sedimentation, coagulation–flocculation, electroflocculation, magnetic flocculation, bioflocculation, flotation, centrifugation, and filtration have been widely reported (Table 1).
Filtration appears to be a highly promising technique for harvesting due to its ability to achieve high concentrations (concentration ratios up to a maximum of 150, with final concentrations reaching a TSS of 170 g·L−1), high-quality water effluents that could be reused for irrigation, and it can avoid damage to the microalgae cells so that they could be returned to the cultivation unit [2,21,45]. Ultrafiltration has been reported in the literature for microalgae harvesting in both dead-end configuration (without a retentate stream) [21,37,50,51,52] and cross-flow configuration (CF-UF) (with retentate and permeate streams) [21,37,44,45,47,50,51,52,53]. However, the major concern with membranes is related to fouling, which significantly increases operating costs due to physical cleaning (shear stress from cross-flow velocity in cross-flow filtration, air/gas-sparging in dead-end filtration, backflushing, etc.) and chemical cleaning, which in turn reduces membrane lifetime [54,55]. Consequently, the use of filtration as a harvesting process needs further optimisation to enhance the feasibility of microalgae cultivation technology. Zhao et al. [21] gathered energy consumption data for filtration harvesting processes from 2003 to 2022, reporting values up to 3.5 kWh·m−3 of treated microalgae culture, with some peak values higher but the majority falling between 0.2 and 1 kWh·m−3 for permeate fluxes between 17 and 45 LMH. Particularly, energy requirements for CF–UF of microalgae are reported to be between 0.17 and 2.23 kWh·m−3 for initial concentrations of the culture between 1 and 2 g·L−1 and final concentration ratios ranging from 25 to 113, transmembrane pressure (TMP) ranging from 0.31 to 2 bar, and cross-flow velocities (CFV) from 0.17 to 2 m·s−1 [21,44,47,50,53,56]. However, data on the energy consumption of membrane-based microalgae harvesting are still scarce [21].
One advantage of harvesting by CF–UF is that recent studies have reported that it can be used as a pre-treatment step for anaerobic valorisation of microalgae as it promotes biodegradability (Table 1). For instance, Giménez et al. [25] concluded that the effect of the CF–UF harvesting technique on the integrity of microalgae cell walls, in terms of viability and biodegradability, exhibited a noticeable effect that increased biodegradability. It was hypothesised that this effect was attributed to the induction of greater shear stress, which is not observed to the same extent in the case of dead-end ultrafiltration. The flexibility afforded by the difference in performance between the dead-end and cross-flow configurations in terms of cell wall integrity is one of the strengths of the filtration technology applied to microalgae harvesting, due to its ability to adapt to different potential uses of the harvested biomass.
The aim of this study is to evaluate the long-term performance of a CF–UF process to harvest the microalgae biomass cultivated in a membrane photobioreactor for its further valorisation through anaerobic co-digestion. Specifically, this microalgae biomass is produced in an anaerobic-based WRRF platform for sulphate-rich sewage treatment [57]. In addition, this study presented a techno-economic assessment and a GHG emissions assessment at a pilot scale to facilitate the economic and environmental feasibility study of membrane-based harvesting. In particular, different biogas valorisation Scenarios were looked at for the harvesting unit and a digestion unit for the anaerobic valorisation of harvested microalgae in terms of greenhouse gas emissions.

2. Materials and Methods

2.1. Description of the Harvesting Pilot Plant

The layout of the WRRF is shown in Supplementary Materials (Figure S1), which consisted of a combination of membrane technologies with anaerobic processes for the valorisation of organic matter from wastewater in the form of biogas with anaerobic membrane bioreactor (AnMBR) technology and nutrient recovery using microalgae cultivation with membrane photobioreactor technology (MPBR). This MPBR unit used membranes to decouple the SRT from the HRT, which was demonstrated to significantly promote microalgae activity [45]. This initial harvesting stage consisted of two membrane tanks with a set of hollow fibre ultrafiltration membranes (KMS Puron®, Koch Membrane Systems, Wilmington, MA, USA) with a total membrane area of 3.44 m2 and an average pore size of 0.03 µm. The performance of this first stage has been previously analysed by González-Camejo et al. [58]. The primary microalgae species in the culture were Coelastrella and Desmodesmus, representing over 99% of the total eukaryotic cells [59].
Anaerobic co-digestion using AnMBR technology was used for the energy recovery of all waste streams from the water line (i.e., primary sludge, AnMBR sludge, and harvested microalgae). Prior to this, a second harvesting stage, using CF–UF, was used to achieve the desired levels of total suspended solids (TSS) in the microalgae waste (from the MPBR unit) to be fed to the anaerobic co-digestion unit. This pilot scale facility was located at the Carraixet WWTP (Spain) and used as an influent for the effluent from the pre-treatment stage of the full-scale plant. A more detailed description can be found elsewhere [56].
The CF–UF pilot plant is shown in detail in Figure 1. The installation included a feed tank (0.7 m3), a retentate tank (0.04 m3), the cross-flow membrane module (in a vertical disposition, 1 m long), and, finally, the clean-in-place (CIP) tank (0.2 m3). This unit employed a tubular module with ultrafiltration membranes (HF 5.0-43-PM500, ROMICON®, Koch Membrane Systems, Wilmington, MA, USA). The pore size of the membranes had a molecular weight cut-off of 500 kDa, effectively retaining macromolecules. The total filtration surface covered 1 m2, ensuring efficient separation and concentration of the microalgae biomass. The total cross-sectional area was 0.0003 m2. This plant, which was operated in batch mode in cycles, allowed the removal of excess water, resulting in highly concentrated algal biomass suitable for subsequent co-digestion processes [60].

2.2. Instrumentation and Automation

The cross-flow harvesting system was automated to evaluate the filtration process properly (Figure 1). The following online sensors were installed: (i) one level transmitter in the feed tank LIT-1 (Waterpilot FMX167, Endress Hauser AG, Reinach, Switzerland) to determine the feed tank level, LFT (m); (ii) one temperature probe in the retentate tank, TT-1 (RTD PT100 RS PRO, RS Components, Corby, UK); (iii) one suspended solids sensor in the retentate tank, TSS-1 (SOLITAX ts-line sc LXV423.99.00100, Hach, Loveland, CO, USA); (iv) one liquid flow meter in the retentate conduction (SITRANS FM MAG 1100 DN15, SIEMENS AG, Munich, Germany); and (v) three pressure gauges (PG-1 in the feed to the membrane, PG-2 in the retentate of the membrane, and PG-3 in the backflushing pipe).
In terms of electromechanical equipment, there were 3 pumps: P-1 was the feed pump to the retentate tank in order to continuously replenish it with fresh culture to be concentrated and also to recirculate the fresh culture to the feed tank to guarantee proper mixing conditions; P-2 was the feed pump to the membrane module; and P-3 was the auxiliary pump to enable backflushing (Figure 1). Additionally, the plant was equipped with the following auxiliary equipment: an on/off solenoid valve (SOV-1) to allow the feed into the retentate tank; a level switch in the retentate tank, LS-1, acting on the solenoid valve SOV-1; and a valve (MV-1) to enable the collection of harvested microalgae after the completion of each batch’s work cycle. The SOLITAX transmitter used in this study was equipped with colour correction and an automatic cleaning valve, which improved the representativeness and accuracy of the measured and recorded data. Moreover, this sensor was installed with a 30 degree deviation from the regular perpendicular angle to the retentate tank surface to prevent probe fouling and reduce the noise of the signal. Furthermore, a comprehensive sensor cleaning protocol was implemented to improve and ensure stable data acquisition. The SOLITAX probe was calibrated once a week using laboratory data obtained from grab samples that were collected in duplicate from the retentate tank at the beginning and end of each cycle, according to the standard methods [61]: method 2540 E. A linear correlation was established with the values recorded continuously by the SOLITAX probe (R2 = 0.9919; p-value < 0.05; n = 38).
All sensors were connected to a programmable logic controller (PLC) for process automation, data acquisition, and control. The PLC established communication with a PC on which supervisory control and data acquisition software (SCADA , SIMATIC WinCC V7) was installed to receive, transform, and perform calculations with the obtained data, as well as enable visualisation of all relevant process parameters.

2.3. Pilot Plant Operation and Monitoring

The harvesting plant was operated in batch mode in cycles. In each cycle, the pre-concentrated culture from the MPBR plant stored in the feed tank was pumped (P-1) to the retentate tank until it was full, as detected by the level switch (LS-1) that closed the feed valve to the retentate tank (SOV-1). The P-1 pump remained on to ensure proper mixing conditions in the feed tank. The culture in the retentate tank was then continuously fed to the cross-flow membrane, producing a permeate that was stored in the CIP tank and a retentate stream that returned to the retentate tank. As the volume of the retentate tank decreased (due to the accumulation of permeate in the CIP), the feed pump (P-1) was automatically activated to replenish the retentate tank. This operation was carried out continuously until the desired level of TSS concentration in the retentate tank was reached (over 8 g TSS·L−1). In some cycles, the feed tank volume was exhausted, but the filtration cycle did not stop because the desired TSS concentration was not achieved. The required TSS concentration varied slightly depending on the requirements of the subsequent anaerobic co-digestion unit in the WRRF pilot plant.
To achieve this TSS concentration, the membrane was operated at a constant transmembrane pressure (TMP), whereas the transmembrane flux (J) remained variable. The TMP (bar) was calculated using Equation (1) [62]:
T M P = P 1 + P 2 2 P p e r m e a t e ,
where P1 represents the inlet gauge pressure (bar) to the membrane module, obtained by PG-1; P2 is the outlet gauge pressure (bar), measured by PG-2 in the retentate stream; and Ppermeate is the permeate gauge pressure (bar).
Cheryan [62] established that Ppermeate should be zero when the permeate is open to the atmosphere, as in the present study. However, given the vertical configuration of the membrane and the outlet location at the top of the module, a constant Ppermeate of 0.049 bar (0.5 m of water column) was considered.
Once the desired TSS concentration was reached, the harvested microalgae biomass was then removed, and the membrane was cleaned physically (backflushing) and sometimes chemically (every 6 operating cycles). In each cycle, the backflushing pump (P-3) was operated at its maximum capacity with a total backwash volume of 90 L.
The CF-UF plant was operated in batch cycles for 212 days (from June to January), during which the WRRF pilot plant ran continuously. A total of 78 cycles were performed, two to three times per week (with some periods of non-operation), with an average duration of 25 h per cycle. The cycle duration varied mainly according to the available pre-concentrated microalgae biomass from the MPBR pilot plant (total volume and TSS concentration), the TSS concentration required for the subsequent anaerobic co-digestion unit in the pilot plant, and membrane permeability. This initial TSS concentration (TSSi) was measured off-line in the feed tank and varied depending on the operation of the MPBR plant, which in turn depended on several variables [58,63,64]. Table 2 summarises the average operating and outdoor conditions over the 78 cycles.
For each operating cycle, the following parameters were calculated to fully monitor the filtration process:
i.
Cross-flow velocity, CFV (m·s−1), is calculated as follows:
C F V = Q P 2 A C F ,
where QP−2 is the feed flow rate to the membrane module (m3·s−1) and ACF is membrane cross-sectional area (m2);
ii.
Permeate flow rate, Qp (L·h−1), was calculated hydraulically using LFT data from LIT-1, i.e., feed tank level variation (which is equivalent to CIP tank level variation):
Q p = Δ L F T · A F T Δ t · 1000 ,
where ΔLFT was the variation in LFT (m) in a set period within the work cycle, Δt (h) and AFT was the feed tank area (m2);
iii.
Transmembrane flux, J (LMH), was calculated as follows:
J = Q p A F   ,
where Qp was the permeate flow rate (L·h−1) and AF was the filtration area of the membranes (m2);
iv.
Standardised transmembrane flux at 20 °C, J20 (LMH), is calculated as follows:
J 20 = J · e 0.0239 · ( T 20 ) ,
where T (°C) is the temperature of the microalgae culture being concentrated in the harvesting system, measured by TT-1;
v.
Normalised transmembrane flux at 20 °C, J20:J20,0,
J 20 : J 20,0 = J 20 J 20,0   ,
where J20,0 is the initial J20 obtained at the start of the entire experiment (32.7 LMH);
vi.
Membrane permeability standardised at 20 °C, K20 (LMH·bar−1) Equation (7):
K 20 = J 20 T M P ;
vii.
Backflush flow rate, QBF (L·min−1), was calculated as follows:
Q B F = V B F t B F ,
where VBF (L) was the backflush volume measured in a time tBF (min);
viii.
Transmembrane pressure during backflushing (TMPBF) was calculated by Equation (9):
T M P B F = P B F P 1 + P 2 2 ,
where PBF (bar) is the discharge gauge pressure of pump P-3, measured by PG-3;
ix.
Harvested microalgae culture biomass, M_TSSHV (g), is calculated as follows:
M _ T S S H V = T S S f · V _ H V ,
where TSSf was the TSS recorded by the TSS-1 sensor at the end of each cycle (g·m−3) and V_HV was the final volume in the retentate tank at the end of each cycle (m3);
x.
Harvesting rate HV_r (g TSS·m−2·h−1), was calculated as follows:
H V _ r = M _ T S S H V A F · t o p e r a t i o n ,
where toperation is the cycle duration (h);
xi.
Concentration ratio r (Equation (12)):
r = T S S f T S S i .

2.4. Energy and Chemical Reagent Consumption

The energy consumption of the pumps P-1 and P-2 (W) was calculated by adapting the equations proposed by Judd and Judd [65] and Ortiz-Tena et al. [66] (see Equations (13) and (22)). This energy model has already been applied to different UF membrane systems used in microalgae cultivation [58].
W P , j = Q P , j · g ·   ρ culture · L + L eq   ·   f   ·   v 2 D   ·   2   ·   g asp + L + L eq   ·   f   ·   v 2 D   ·   2   ·   g imp + Z 1 Z 2 η pump _ j ,
where WP,j is the power required for pump j (W), considering both the suction and discharge sections of the pump, using: the volumetric flow rate (QP,j in m3·s−1), the acceleration of gravity (g in m·s−2), the density of the culture (ρculture in kg·m−3), the length of the pipeline (L in m), the pressure drops due to accidents expressed as equivalent length (Leq in m), the velocity of the culture (v in m·s−1), the friction factor (f, dimensionless), the cross-sectional diameter (D in m), the difference in elevation to overcome (Z1−Z2, in m), and the efficiency of pump j (ηpump_j, 0.60 [57]).
To calculate the ρculture (kg·m−3), the density of wet green microalgae biomass, ρa,w (kg·m−3), was calculated using Equation (14) [67]:
ρ a , w = x w · ρ w + 1 x w · ρ a , d ,
where xw was the water mass content of wet green algal biomass, 0.82 [67]; ρa,d was the density of dry green microalgae biomass, 1400 kg·m−3 [67]; and ρw was the water density.
The density of the culture ρculture can be obtained using Equation (15):
ρ c u l t u r e = ρ a , w + ρ w T S S ρ a , w + 1 ,
where TSS (kg·m−3) was the microalgae concentration in the culture.
Regarding the viscosity of water, μw (Pa·s), it was calculated using Equation (16) [68], valid between 0 and 40 °C, which aligned with the operating range of this study:
μ w = μ w , 20 · 10 20 T T + 96 · 1.2364 1.37 × 10 3 · 20 T + 5.7 × 10 6 · 20 T 2 ,
where μw,20 was 0.001002 Pa·s.
Mass fractional content in dry solids in the microalgae biomass, wa,d can be obtained by Equation (17) [67]:
w a , d = 1 x w · ρ a , d ρ a , w .
The microalgae volume fraction in the culture, Φv,a, was determined by Equation (18) [67]:
Φ v , a = T S S ρ a , w · w a , d ,
where TSS (kg·m−3) was the microalgae concentration in the culture.
The viscosity of the microalgae culture can be calculated using Equation (19), adapted from [67], which provides reliable values for the range Φv,a ≤ 0.115, well above the maximum value in this study:
μ c u l t u r e = μ w · 1 Φ v , a Φ v , a m 2 ,
where  Φ v , a m  was the maximum microalgae volume fraction, established at 0.637.
The friction factor (f) was calculated using the Swamee–James equation (Equation (20)):
f = 0.25 l o g 10 k D 3.7 + 5.74 R e 0.9 2 ,
where Re is the dimensionless Reynolds number, k (m) is the internal roughness of the pipe, and D (m) is the cross-sectional diameter of the pipeline.
For the calculation of the power consumed by pump P-3 (W), used in the backflushing stages, Equation (21) was employed:
W P , 3 = Q B F · T M P B F 0.6 · η P 3 ,
where ηP-3 was the efficiency of the pump P-3, with a value of 0.60 [57].
The total energy consumption EC (kWh) was determined by Equation (22) by aggregating the individual energy consumptions of each pump (WP,j in kW) multiplied by each operation time, tj (h), for all three pumps:
E C = W P , j · t j .
Based on the total energy consumption for each cycle, three ratios of interest have been defined:
i.
The energy consumption ratio of the harvesting system (ECm_TSS, in kWh·tTSS−1) per tonne of harvested microalgae biomass (M_TSSHV, in t) (Equation (23));
ii.
The energy consumption ratio of the harvesting system (ECv_HV, in kWh·m−3) per treated volume of pre-concentrated microalgae culture, i.e., the initial volume of the feed tank (Vi, in m−3) (Equation (24));
iii.
The energy consumption ratio of the harvesting system (ECv_WRRF, kWh·m−3) per treated volume of water in the WRRF pilot plant (V_WRRF treated to generate Vi, in m−3) (Equation (25)):
E C m _ T S S = E C M _ T S S H V ,
E C v _ H V = E C V i   ,
E C v _ W R R F = E C V _ W R R F   .
The chemical cleanings of the membrane were effectively carried out using a dose of 200 ppm of sodium hypochlorite (NaClO) for 10 min, followed by rinsing with water only. As already mentioned, the chemical cleanings were performed every 150 h of operation, i.e., 6 cycles (on average). The parameter NaOClCv_WRRF (g Cl·m−3) was defined to determine the sodium hypochlorite reagent consumption ratio per m3 treated in the WRRF (Equation (26)).
N a O C l C v _ W R R F = M C l V _ W R R F C C ,
where M_Cl (g Cl) is the NaClO mass used in chemical cleanings expressed as active chlorine and V_WRRFCC (m–3) is the amount of water treated in the WRRF since the last chemical cleaning.
Finally, the most relevant operating costs for the CF-UF pilot plant were estimated, considering energy consumption and the use of sodium hypochlorite in chemical cleanings, OPEXEC+Cl (EUR·m−3 treated in WRRF). The cost for electricity was the average for the UE-27 in October 2023 (0.178 EUR·kWh−1) [69]. The cost for hypoclorite in Europe was taken from [70] (0.013 EUR·gCl−1).

2.5. GHG Estimation

To estimate the GHG emissions associated with the CF–UF process, the methodology proposed by Parravacini et al. [71] was considered to have been adapted similarly to previous works [60] and taken into account [72]. This methodology includes the estimation of both direct (GHGdirect) and indirect (GHGindirect) emissions related to the energy consumption of the harvesting unit and the energy consumption and biogas production of the anaerobic digestion of the harvested microalgae under mesophilic conditions. The biogas production from the anaerobic digestion of harvested microalgae biomass was determined based on the experimental data from previous studies [25,73]. In addition, the increase in methane yields due to the effect of CF–UF on the microalgae valorisation (i.e., higher anaerobic biodegradability), according to [25], was also considered. In particular, this effect was taken into account by considering the enhancement of biogas production according to the concentration ratio (r) of the harvested microalgae. Methane yield correlated directly with the concentration ratio (r) for r values below 13.3 [25,73]. In contrast, for r values above 13.3, methane yield remained constant at 0.294 Nm−3·kgTSS−1.
As for biogas valorisation, three Scenarios were established: (i) Scenario 1, involving the use of high-efficiency cogeneration technology with a combined heat and power (CHP) system; (ii) Scenario 2, considering the upgrading to biomethane using conventional membrane technology and its subsequent injection into the grid; and (iii) Scenario 3, assessing the upgrading to biomethane using microalgae culture, which increased methane production during the anaerobic digestion (AD) stage due to the additional production of algal biomass at the upgrading unit and subsequent injection into the grid, but this technology did not have the possibility of heat recovery.
To determine the net energy demand per tonne of harvested microalgae biomass, E (kWh·tTSS−1) by means of Equation (27), it was necessary to estimate: Qdemand—the total thermal energy demand (kWh·tTSS−1) (Equation (28)); Wdemand—the total electrical energy demand (kWh·tTSS−1) (Equation (29)); and QBM— the biomethane production in Scenarios 2 and 3 (kWh·tTSS−1), calculated by (Equation (30)) if Qdemand was positive, and by (Equation (31)) if Qdemand was zero or negative.
E k W h · t T S S 1 = Q d e m a n d + W d e m a n d + Q B M ,
Q d e m a n d k W h · t T S S 1 = Q T O T Q r e c o v e r e d ,
W d e m a n d k W h · t T S S 1 = W T O T W r e c o v e r e d ,
Q B M k W h · t T S S 1 = Q d e m a n d Q B G · φ u p g r a d i n g ,
Q B M k W h · t T S S 1 = Q B G · φ u p g r a d i n g ,
where QTOT is the heat required by the anaerobic digestion process per tonne of harvested microalgae biomass (kWh·tTSS−1); Qrecovered is the heat recovered in the CHP system for Scenario 1, or the heat recovered in the upgrading stage for Scenario 2 (kWh·tTSS−1); WTOT are the electrical consumptions of the equipment of the CF–UF pilot plant, the anaerobic digester and the valorisation system of each Scenario per tonne of harvested microalgae biomass (kWh·tTSS−1); Wrecovered is the electricity recovered in the CHP stage for Scenario 1 per tonne of harvested microalgae biomass (kWh·tTSS−1); QBG is the gross production of raw biogas per tonne of harvested microalgae biomass; and φupgrading is the efficiency of the upgrading process. Ratios, efficiencies, and emission factors are taken from [60,71,74,75,76,77].
Direct GHG emissions, indirect GHG emissions, and total GHG emissions per tonne of harvested microalgae biomass (M_TSSHV, in t) were calculated using Equations (32)–(35).
G H G d i r e c t , s c . 1 k g C O 2 e · t T S S 1 = M B G · E F C H 4 , s c 1 · 28 ,
G H G d i r e c t , s c 2 & 3 k g C O 2 e · t T S S 1 = M B M · E F C H 4 , s c , i · 28 ,
G H G i n d i r e c t k g C O 2 e · t T S S 1 = ( Q B M + Q d e m a n d ) · E F n a t u r a l g a s + W d e m a n d · E F e l e c t r i c i t y ,
G H G t o t a l = G H G d i r e c t + G H G i n d i r e c t ,
where MBG is the calculated gross production of raw biogas per tonne of harvested microalgae biomass (kgCH4·tTSS−1); MBM is the production of biomethane per tonne of harvested microalgae biomass (kgCH4·tTSS−1);  E F C H 4 , i  is the methane losses emission factor for each Scenario; Qdemand is the total thermal energy demand per tonne of harvested microalgae biomass (kWh·tTSS−1); Wdemand is the total electrical energy demand per tonne of harvested microalgae biomass (kWh·tTSS−1); EFnatural_gas is the specific emission factor for fossil natural gas from the grid in Europe, 0.238 kg CO2e·kWh−1; and EFelectricity is the specific emission factor of European power companies, 0.224 kg CO2e·kWh−1.

3. Results

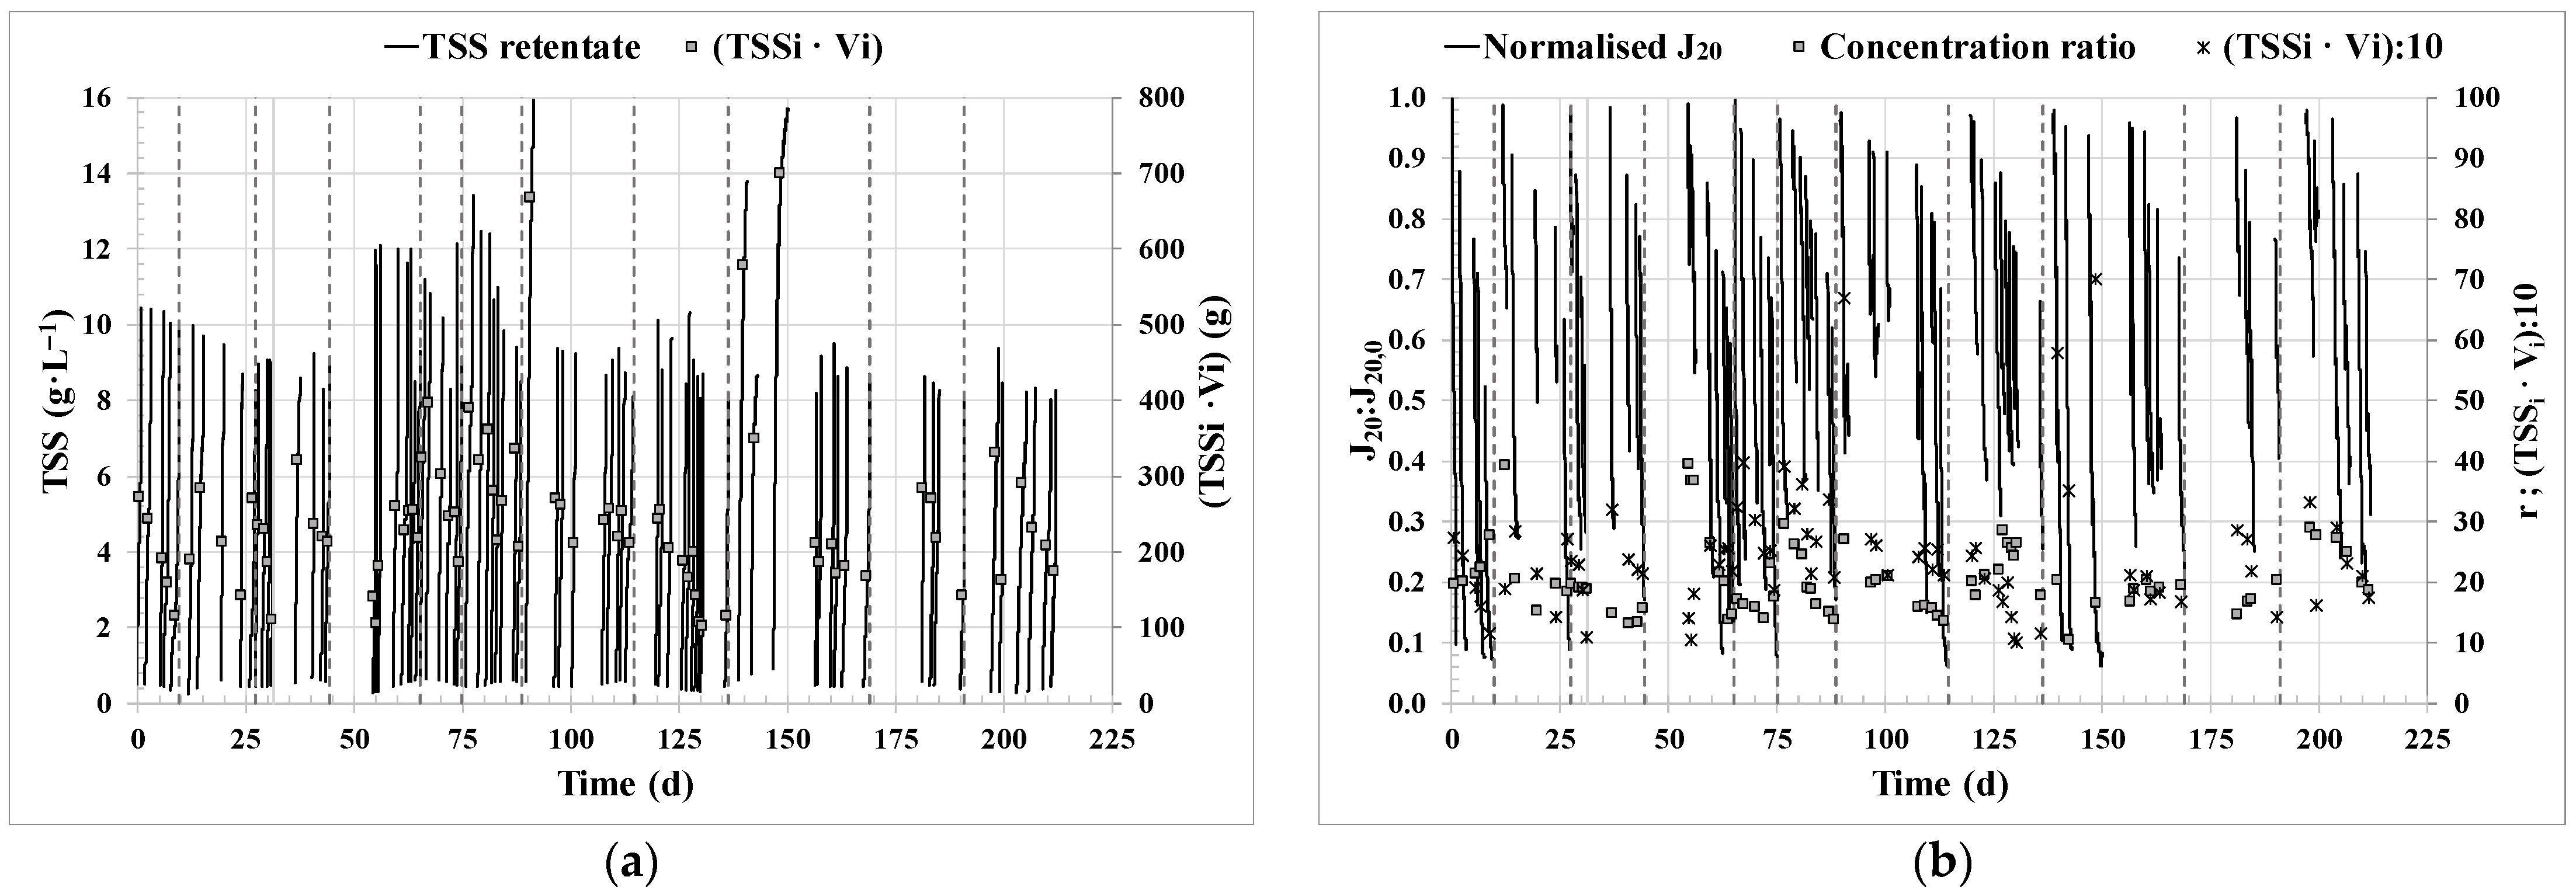
3.1. Filtration Performance

The harvesting pilot plant was in operation for a total of 1968 h, intermittently distributed over a total of 78 cycles during the 212 days of operation of the WRRF pilot plant. Table 3 shows the average values of the main filtration performance parameters, where the resulting J and concentration ratios are in the range of other similar studies [21,50].
CFV: cross-flow velocity; HV_r: biomass harvesting rate; J20: transmembrane flux standardised at 20 °C; J20,0: initial J20; K20: membrane permeability standardised at 20 °C; QBF: backflush flow rate; r: concentration ratio; TMPBF: backflush stage transmembrane pressure; TSSf: total suspended solids of the harvested biomass.
The filtration performance varied mainly according to the available pre-concentrated microalgae biomass from the MPBR pilot plant (TSSi·Vi), the TSS concentration required for the subsequent anaerobic co-digestion unit (TSSf), and the initial membrane permeability of each cycle depending on the membrane cleaning previously applied (physical or physical + chemical), in terms of normalised J20:J20,0. These operating conditions and the resulting filtration performance are shown in Figure 2a with the evolution of the TSS concentration in the retentate tank during each operating cycle and in Figure 2b for 20 °C standardised transmembrane flux normalised by the initial flux (J20:J20,0), concentration ratio (r), and the total mass culture to be harvested (total volume (Vi) per total suspended solids (TSSi) in the feed tank). Both the total mass culture harvested (102–700 g) and the final TSS (8.0–15.9 g·L−1) in each cycle varied significantly in some periods, which strongly influenced the performance of the filtration cycle in terms of the duration of the cycle and the final values obtained for the normalised transmembrane flux (Figure 2b) at the end of the cycle. For instance, the cycle with the highest TSSf and total mass culture harvested (cycle at 149–150 operating days) lasted 74 h, and J20:J20,0 reached the lowest values of the operating period, i.e., 0.08.
Backflushing stages were performed at the end of each cycle, and in Figure 2b, the dashed lines indicate the end of the cycles when chemical cleaning was also performed (backflush followed by chemical cleaning). Within each cycle, J20:J20,0 started with a relatively high value and decreased as the cycle progressed, due to the increase in TSS concentration in the retentate tank. After each BF stage, when considering consecutive cycles with similar TSSi, J20:J20,0 at the beginning of the cycle partially recovered compared to the initial one of the previous cycle. However, full recovery was not achieved because backflushing only removed reversible fouling [58,78]. Indeed, an accumulation of irreversible fouling is indirectly observed with the decrease of J20:J20,0 at the beginning of the consecutive cycles between the dashed lines (between chemical cleanings). In contrast, when a backflush followed by a chemical cleaning is performed, a greater recovery of filtration capacity can be observed, expressed as J20:J20,0. The average of the initial values for J20:J20,0 obtained from cycles immediately after a combination of backflushing and chemical cleaning was 0.98 ± 0.01, in contrast to the initial values from cycles after backflushing alone, which were 0.81 ± 0.10. The operation demonstrated long-term stability. Following a chemical cleaning after cycle 72 (1,737 h of operation, or 88% of the operating time), the initial J20:J20,0 value for cycle 73 was 0.96. This represents a loss of only 4% of the initial membrane permeability, demonstrating the significant robustness of the technology.
In Figure 3, detailed figures for the period between day 54 and day 78 of operation are presented (cycles 19 to 33), in an arbitrary manner, to observe the evolution of J20:J20,0, concentration ratio, biomass to be harvested, and TSS in the retentate stream over only a few batch-operating cycles. In Figure 3b, the partial effect of the backflushing at the end of each cycle on the J20:J20,0 recovery is evident, as is the significantly higher effect of the chemical cleaning performed after cycles 26 and 32. Figure 3a shows that the evolution of the TSS concentration in the retentate tank had an inflection point in each cycle. This inflection point corresponds to the time when the feed tank volume was exhausted, removing the dilution effect and reducing the retentate volume and the transmembrane flux, as seen by the slower decline of J20:J20,0 (Figure 3b). Cycles 22 to 26 (from day 58 of operation prior to chemical cleaning) shown in Figure 3 were operated for a similar total culture mass harvested but decreasing concentration ratio; however, a gradual increase in cycle time was observed as the values of J20:J20,0 decreased due to the accumulation of irreversible fouling.
One notable strength of the CF–UF technology as a second harvesting step lies in its robustness and reliability during operation, consistently ensuring the attainment of the 8 g·L−1 target. This target was necessary for the overall functionality of the WRRF pilot plant, specifically in the anaerobic digestion process [57]. However, it is well known that the energy demand of cross-flow operations is higher than that of dead-end operations. Therefore, there is room for improvement.

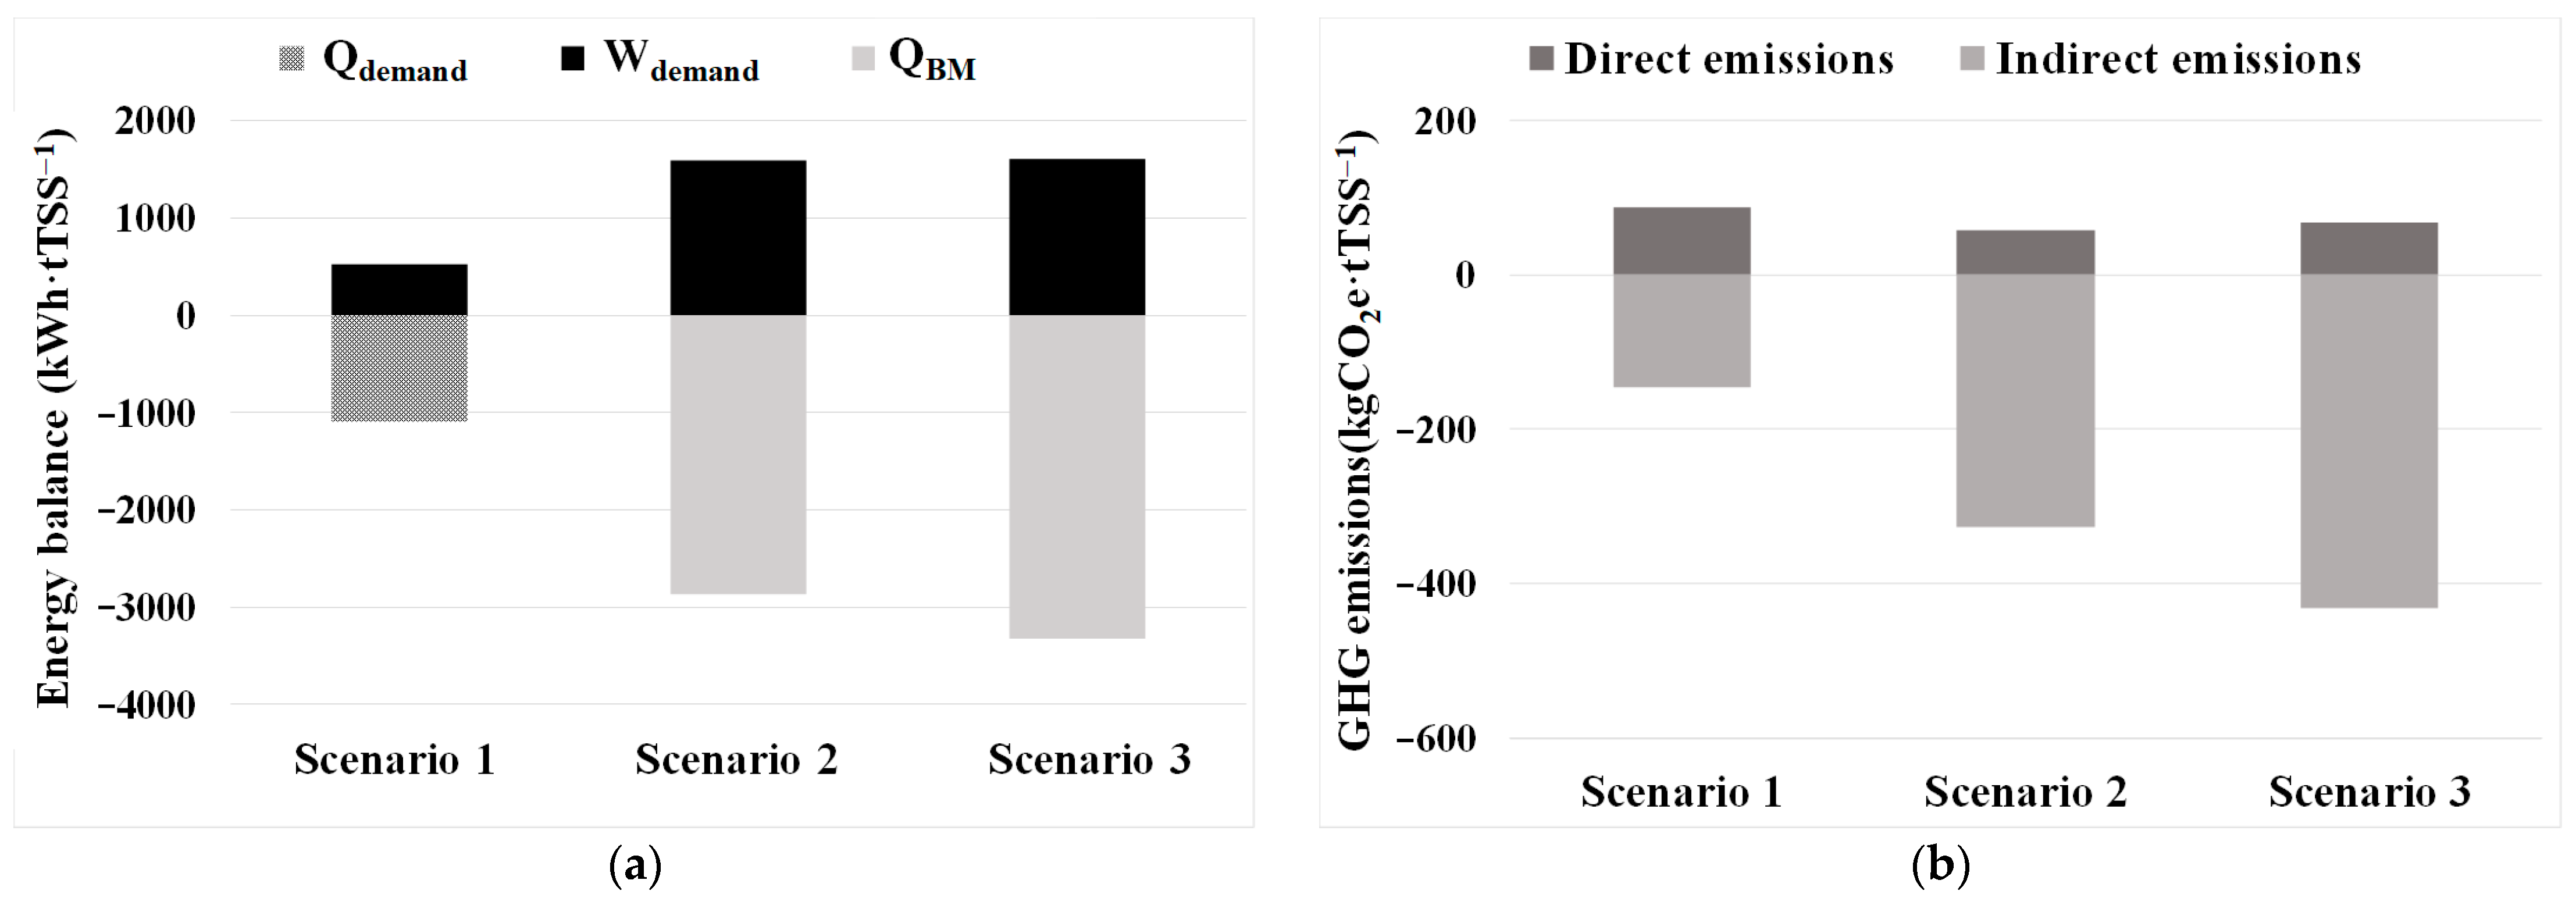
3.2. Techno-Economic and Carbon Footprint Assessment

Table 4 shows the values of the energy ratios and chemical reagent consumption rates defined in Equations (24–27) for the entire operating period.
The energy ratios obtained in this study for an average concentration ratio of the harvested biomass of 21 are within the normal range reported in the literature for this type of biomass and technology [21]. It should be noted that the present study is a pilot plant performance study of almost 2000 h of batch operation over a 7 month operation of the WRRF pilot plant. In particular, the obtained energy demand is also in the range of other membrane-based microalgae harvesting systems, i.e., 0.17–2.23 kWh·m−3 [21,50,79]. Other harvesting technologies are even more energy-intensive, such as centrifugation, which can consume up to 8 kWh·m−3 to achieve 90% efficiency [21]. Important to note is that there is room for improvement in the resulting filtration performance, for instance, by means of optimising the frequency of physical and chemical cleanings.
Given the specific emission factor of European power companies (EFelectricity = 0.224 kgCO2e·kWh−1), the indirect GHG emissions associated exclusively with the electrical consumption of the harvesting unit in this study amounted, on average, to 338 kgCO2e·tTSS−1. This result is consistent with other studies on microalgae harvesting using different technologies, such as Wei et al. [80], who reported emissions of 483 kgCO2e·tTSS−1 for the harvesting of Chlorella vulgaris through flocculation and electroflotation up to a concentration ratio of r = 100; or Brentner et al. [81], who reported emissions of 1751 kgCO2e·tTSS−1 for the harvesting of Scenedesmus dimorphus through centrifugation.
Figure 4 shows, for a concentration ratio of 21, the results of the energy balance (Qdemand, Wdemand, and QBM) and the GHG assessment (GHGdirect and GHGindirect) related to the harvesting unit and the anaerobic digestion unit for the harvested biomass for the three biogas valorisation Scenarios considered.
As Figure 4a shows, Scenario 1 would not be able to cover all the electrical consumption (Wdemand) but would produce a significant surplus of heat, Qdemand. In the case of Scenario 2, heat recovery from conventional membrane upgrading would cover the heat requirements of the mesophilic digestion unit, and the substantial Wdemand requirements would be greatly exceeded by the primary energy content of the biomethane injected into the grid, QBM. The difference between Scenarios 2 and 3 in terms of Qdemand can be explained by the lack of thermal recovery in microalgae-based harvesting systems. In Figure 4b, GHG emissions reflect the energy assessment due to the savings related to the fossil energy sources substituted by these renewable sources. Scenario 3 would be the most favourable one both in terms of energy recovery and GHG emissions savings. This improved performance could be primarily attributed to the additional biomethane production from CO2 absorbed in the microalgae-based upgrading stage compared to both Scenarios 1 and 2, along with the low energy consumption of the upgrading process and the high methane recovery efficiency (exceeding 97.6%), compared to a combined efficiency of approximately 68% for cogeneration in Scenario 1.
Figure 5 illustrates the net GHG emissions for all batch cycles vs. the concentration ratio (r), in the case of Scenario 3, chosen as an example since the trend is proportional for all Scenarios. Given that most of the employed (r) values surpass the maximum methane yield obtained from previous results, i.e., the same methane yield is considered for r values above 13.3 [25,73], the most favourable GHG emission values are observed for relatively low (r) values, around 13–17. These results are promising, as the associated emissions could remain below zero for CF–UF membranes over a wide range of operating conditions, thereby resulting in net emissions savings.

4. Conclusions

Cross-flow ultrafiltration appeared to be a robust technology for harvesting pre-concentrated microalgae biomass, which operated efficiently under variable operating conditions and was able to achieve biomass concentrations of up to 16 gTSS·L−1 (concentration ratio of up to 39.5). The performance of cross-flow ultrafiltration was comparable to other membrane-based harvesting systems in terms of transmembrane flux, concentration ratios, and energy requirements. A backflushing step was performed after each batch cycle, and the periodic combination of backflushing with chemical cleaning was necessary for long-term operation. The recovery of transmembrane flux after physical and chemical cleaning was significant, 21% higher than that achieved with backflushing alone. Based on these results, further optimisation is required to improve membrane productivity in terms of CAPEX and OPEX by optimising physical and chemical cleaning. If the harvested microalgae biomass were valorised for biogas production, the direct and indirect GHG emissions associated with the harvesting process could be less than the emissions savings associated with the energy recovered through the production of this renewable energy source, especially if the biogas is upgraded through a microalgae cultivation process.

Supplementary Materials

The following supporting information can be downloaded at: https://www.mdpi.com/article/10.3390/su16010369/s1, Figure S1: Flow diagram of the WRRF scheme.

Author Contributions

Conceptualisation, J.F.M.-S. and M.V.R.; data curation, J.F.M.-S. and G.N.-H.; formal analysis, J.F.M.-S.; funding acquisition, A.S.; investigation, J.F.M.-S., J.G.-C. and G.N.-H.; methodology, J.F.M.-S. and M.V.R.; project administration, A.S.; resources, A.S.; supervision, M.V.R.; validation, J.F.M.-S. and M.V.R.; visualisation, J.F.M.-S.; writing—original draft, J.F.M.-S. and J.G.-C.; writing—review and editing, J.G.-C. and M.V.R. All authors have read and agreed to the published version of the manuscript.

Funding

This research work was supported by the Science and Innovation Spanish Ministry (Projects CTM2014-54980-C2-1-R/C2-2-R) and the European Regional Development Fund (ERDF). Generalitat Valenciana supported this study via fellowship APOTI/2016/56 to the first author. The Science and Innovation Spanish Ministry has also supported this study via a pre-doctoral FPU fellowship to the second author (FPU14/05082). The authors would also like to acknowledge the support received from the Universitat Politècnica de València via a pre-doctoral FPI fellowship for the third author, as well as the financial aid received from the European Climate KIC association for the ‘MAB 2.0’ Project (APIN0057_2015-3.6-230_P066-05).

Institutional Review Board Statement

Not applicable.

Data Availability Statement

The datasets generated during and/or analysed during the current study are confidential.

Conflicts of Interest

The authors declare no conflicts of interest.

Glossary

ACFMembrane cross-sectional area
ADAnaerobic digestion
AFFiltration area of the membranes
AFTFeed tank area
AnMBRAnaerobic membrane bioreactor
CF-UFCross-flow ultrafiltration
CFVCross-flow velocity
CHPCombined heat and power system
CIPClean-in-place
DCross-sectional diameter
EEnergy balance calculation
ECTotal energy consumption
ECm_TSSEnergy consumption ratio of the harvesting system per harvested microalgae biomass
ECv_HVEnergy consumption ratio of the harvesting system per treated volume of pre-concentrated microalgae culture
ECv_WRRFEnergy consumption ratio of the harvesting system per treated volume of water in the WRRF
EFCH4Methane losses emission factor
EFelectricitySpecific emission factor of European power companies
EFnatural_gasSpecific emission factor for fossil natural gas from the grid in Europe
fFriction factor
FITLiquid flow rate transmitter
gAcceleration of gravity
GHGGreenhouse gas
GHGdirectDirect greenhouse gas emissions
GHGindirectIndirect greenhouse gas emissions
GHGtotalTotal greenhouse gas emissions
HRTHydraulic retention time
HV_r Harvesting rate
ICAInstrumentation, control, and automation
JTransmembrane flux
J2020 °C standardised transmembrane flux
J20,0Initial 20°C standardised transmembrane flux at the inception of the entire experiment
J20:J20,0Normalised transmembrane flux at 20 °C
kInternal roughness of the pipe
K2020 °C standardised permeability
lLength of the pipeline
leqPressure drops due to accidents expressed as equivalent length
LLevel
LITLevel-indicating transmitter
LMHLitter per square metre and hour
LSLevel switch
MBGGross production of raw biogas, expressed as methane mass
MBMBiomethane production, expressed as methane mass
M_ClSodium hypochlorite reagent mass used in chemical cleaning
M_TSSHVHarvested microalgae culture biomass
MPBRMembrane photobioreactor
MVValve
NaOClCv_WRRFSodium hypochlorite reagent consumption ratio per m3 treated in the WRRF
OPEXEC+ClOperating costs for energy consumption and sodium hypochlorite for the CF–UF pilot plant per m3 treated in the WRRF
p.e.Population equivalent
PGPressure gauge
PjPressure at point j
P-jPump number j
PLCProgrammable logic controller
QBGGross production of raw biogas, expressed as primary energy
QBMBiomethane production, expressed as primary energy
QdemandTotal thermal energy demand
QjFlow rate for pump or stream j
QrecoveredHeat recovered by the biogas valorisation system
QTOTHeat required by the anaerobic co-digestion process
rConcentration ratio
SCADASupervisory control and data acquisition software
SOVOn/off solenoid valve
SRTSolids retention time
TTemperature
TMPTransmembrane pressure
TSSTotal suspended solids
TSSfFinal TSS concentration for an operation cycle
TSSiInitial TSS concentration for an operation cycle
TTTemperature transmitter
vVelocity
V_HVFinal volume in the retentate tank for an operation cycle
V_WRRF Volume of water treated in the WRRF to generate V_HV
V_WRRFCC Volume of water treated in the WRRF since the last chemical cleaning
ViInitial volume in the feed tank for an operation cycle
wa,dMass fractional content in dry solids in green microalgae biomass
WdemandTotal electrical energy demand
WP,jPower required for pump j
WrecoveredElectricity recovered by the biogas valorisation system
WRRFWater resource recovery facility
xwWater mass content of wet green microalgae biomass
ZjElevation of point j
ΔLjVariation in level j
ΔtVariation in time
  Φ w , a m Maximum microalgae volume fraction in the culture
Φw,aMicroalgae volume fraction in the culture
ηpump_jEfficiency of pump j
φupgradingEfficiency of the upgrading process
μViscosity
ρDensity

References

  1. Walker, N.L.; Williams, A.P.; Styles, D. Pitfalls in international benchmarking of energy intensity across wastewater treatment utilities. J. Environ. Manag. 2021, 300, 113613. [Google Scholar] [CrossRef] [PubMed]
  2. Foglia, A.; González-Camejo, J.; Radini, S.; Sgroi, M.; Li, K.; Eusebi, A.L.; Fatone, F. Transforming wastewater treatment plants into reclaimed water facilities in water-unbalanced regions. An overview of possibilities and recommendations focusing on the Italian case. J. Clean. Prod. 2023, 410, 137264. [Google Scholar] [CrossRef]
  3. European Comission. Proposal for a Directive of the European Parliament and of the Council Concerning Urban Wastewater Treatment. 2022. Available online: https://environment.ec.europa.eu/publications/proposal-revised-urban-wastewater-treatment-directive_en (accessed on 23 October 2023).
  4. Yuan, S.; Lei, W.; Cen, Y.; Liu, Q.; Liu, J.; Fu, J.; Han, Y. Economic analysis of global microalgae biomass energy potential. Sci. Total Environ. 2023, 899, 165596. [Google Scholar] [CrossRef] [PubMed]
  5. Khan, S.; Thaher, M.; Abdulquadir, M.; Faisal, M.; Mehariya, S.; Al-Najjar, M.A.A.; Al-Jabri, H.; Das, P. Utilization of Microalgae for Urban Wastewater Treatment and Valorization of Treated Wastewater and Biomass for Biofertilizer Applications. Sustainability 2023, 15, 16019. [Google Scholar] [CrossRef]
  6. Olabi, A.G.; Shehata, N.; Sayed, E.T.; Rodriguez, C.; Anyanwu, R.C.; Russell, C.; Abdelkareem, M.A. Role of microalgae in achieving sustainable development goals and circular economy. Sci. Total Environ. 2023, 854, 158689. [Google Scholar] [CrossRef] [PubMed]
  7. Shilton, A. Pond Treatment Technology; IWA Publishing: London, UK, 2006. [Google Scholar] [CrossRef]
  8. Reynolds, C.S. The Ecology of Phytoplankton (Ecology, Biodiversity and Conservation); Cambridge University Press: Cambridge, UK, 2006; ISBN 9780511542145. [Google Scholar]
  9. Solovchenko, A.E.; Ismagulova, T.T.; Lukyanov, A.A.; Vasilieva, S.G.; Konyukhov, I.V.; Pogosyan, S.I.; Lobakova, E.S.; Gorelova, O.A. Luxury phosphorus uptake in microalgae. J. Appl. Phycol. 2019, 31, 2755–2770. [Google Scholar] [CrossRef]
  10. Acién Fernández, F.G.; Gómez-Serrano, C.; Fernández-Sevilla, J.M. Recovery of Nutrients from Wastewaters Using Microalgae. Front. Sustain. Food Syst. 2018, 2, 59. [Google Scholar] [CrossRef]
  11. Nagarajan, D.; Lee, D.-J.; Chen, C.-Y.; Chang, J.-S. Resource recovery from wastewaters using microalgae-based approaches: A circular bioeconomy perspective. Bioresour. Technol. 2020, 302, 122817. [Google Scholar] [CrossRef]
  12. Arbib, Z.; de Godos, I.; Ruiz, J.; Perales, J.A. Optimization of pilot high rate algal ponds for simultaneous nutrient removal and lipids production. Sci. Total Environ. 2017, 589, 66–72. [Google Scholar] [CrossRef]
  13. García-Galán, M.J.; Gutiérrez, R.; Uggetti, E.; Matamoros, V.; García, J.; Ferrer, I. Use of full-scale hybrid horizontal tubular photobioreactors to process agricultural runoff. Biosyst. Eng. 2018, 166, 138–149. [Google Scholar] [CrossRef]
  14. Rossi, S.; Mantovani, M.; Marazzi, F.; Bellucci, M.; Casagli, F.; Mezzanotte, V.; Ficara, E. Microalgal cultivation on digestate: Process efficiency and economics. Chem. Eng. J. 2023, 460, 141753. [Google Scholar] [CrossRef]
  15. Xu, X.; Gu, X.; Wang, Z.; Shatner, W.; Wang, Z. Progress, challenges and solutions of research on photosynthetic carbon sequestration efficiency of microalgae. Renew. Sustain. Energy Rev. 2019, 110, 65–82. [Google Scholar] [CrossRef]
  16. Oruganti, R.K.; Biji, A.P.; Lanuyanger, T.; Show, P.L.; Sriariyanun, M.; Upadhyayula, V.K.; Gadhamshetty, V.; Bhattacharyya, D. Artificial intelligence and machine learning tools for high-performance microalgal wastewater treatment and algal biorefinery: A critical review. Sci. Total Environ. 2023, 876, 162797. [Google Scholar] [CrossRef] [PubMed]
  17. Clagnan, E.; Dell’Orto, M.; Štěrbová, K.; Grivalský, T.; Manoel, J.A.C.; Masojídek, J.; D’Imporzano, G.; Acién-Fernández, F.G.; Adani, F. Impact of photobioreactor design on microalgae-bacteria communities grown on wastewater: Differences between thin-layer cascade and thin-layer raceway ponds. Bioresour. Technol. 2023, 374, 128781. [Google Scholar] [CrossRef] [PubMed]
  18. De Vree, J.H.; Bosma, R.; Janssen, M.; Barbosa, M.J.; Wijffels, R.H. Comparison of four outdoor pilot-scale photobioreactors. Biotechnol. Biofuels 2015, 8, 215. [Google Scholar] [CrossRef] [PubMed]
  19. Morales-Amaral, M.d.M.; Gómez-Serrano, C.; Acién, F.G.; Fernández-Sevilla, J.M.; Molina-Grima, E. Outdoor production of Scenedesmus sp. in thin-layer and raceway reactors using centrate from anaerobic digestion as the sole nutrient source. Algal Res. 2015, 12, 99–108. [Google Scholar] [CrossRef]
  20. Luo, Y.; Le-Clech, P.; Henderson, R.K. Assessment of membrane photobioreactor (MPBR) performance parameters and operating conditions. Water Res. 2018, 138, 169–180. [Google Scholar] [CrossRef]
  21. Zhao, Z.; Muylaert, K.; Vankelecom, I.F.J. Applying membrane technology in microalgae industry: A comprehensive review. Renew. Sustain. Energy Rev. 2023, 172, 113041. [Google Scholar] [CrossRef]
  22. Gao, F.; Peng, Y.-Y.; Li, C.; Cui, W.; Yang, Z.-H.; Zeng, G.-M. Coupled nutrient removal from secondary effluent and algal biomass production in membrane photobioreactor (MPBR): Effect of HRT and long-term operation. Chem. Eng. J. 2018, 335, 169–175. [Google Scholar] [CrossRef]
  23. Alkarawi, M.A.S.; Caldwell, G.S.; Lee, J.G.M. Continuous harvesting of microalgae biomass using foam flotation. Algal Res. 2018, 36, 125–138. [Google Scholar] [CrossRef]
  24. Liu, Z.; Hao, N.; Hou, Y.; Wang, Q.; Liu, Q.; Yan, S.; Chen, F.; Zhao, L. Technologies for harvesting the microalgae for industrial applications: Current trends and perspectives. Bioresour. Technol. 2023, 387, 129631. [Google Scholar] [CrossRef] [PubMed]
  25. Giménez, J.B.; Bouzas, A.; Carrere, H.; Steyer, J.-P.; Ferrer, J.; Seco, A. Assessment of cross-flow filtration as microalgae harvesting technique prior to anaerobic digestion: Evaluation of biomass integrity and energy demand. Bioresour. Technol. 2018, 269, 188–194. [Google Scholar] [CrossRef] [PubMed]
  26. Das, P.; Khan, S.; Thaher, M.; AbdulQuadir, M.; Hoekman, S.K.; Al-Jabri, H. Effect of harvesting methods on the energy requirement of Tetraselmis sp. biomass production and biocrude yield and quality. Bioresour. Technol. 2019, 284, 9–15. [Google Scholar] [CrossRef] [PubMed]
  27. Liu, Q.; Zhang, M.; Lv, T.; Chen, H.J.; Chika, A.O.; Xiang, C.L.; Guo, M.X.; Wu, M.H.; Li, J.J.; Jia, L.S. Energy-producing electro-flocculation for harvest of Dunaliella salina. Bioresour. Technol. 2017, 241, 1022–1026. [Google Scholar] [CrossRef] [PubMed]
  28. Kim, K.; Shin, H.; Moon, M.; Ryu, B.-G.; Han, J.-I.; Yang, J.-W.; Chang, Y.K. Evaluation of various harvesting methods for high-density microalgae, Aurantiochytrium sp. KRS101. Bioresour. Technol. 2015, 198, 828–835. [Google Scholar] [CrossRef]
  29. Mahesh, R.; Naira, V.R.; Maiti, S.K. Concomitant production of fatty acid methyl ester (biodiesel) and exopolysaccharides using efficient harvesting technology in flat panel photobioreactor with special sparging system via Scenedesmus abundans. Bioresour. Technol. 2019, 278, 231–241. [Google Scholar] [CrossRef]
  30. Lv, J.; Zhao, F.; Feng, J.; Liu, Q.; Nan, F.; Xie, S. Extraction of extracellular polymeric substances (EPS) from a newly isolated self-flocculating microalga Neocystis mucosa SX with different methods. Algal Res. 2019, 40, 101479. [Google Scholar] [CrossRef]
  31. Chen, Z.; Shao, S.; He, Y.; Luo, Q.; Zheng, M.; Zheng, M.; Chen, B.; Wang, M. Nutrients removal from piggery wastewater coupled to lipid production by a newly isolated self-flocculating microalga Desmodesmus sp. PW1. Bioresour. Technol. 2020, 302, 122806. [Google Scholar] [CrossRef]
  32. Banu, J.R.; Preethi; Kavitha, S.; Gunasekaran, M.; Kumar, G. Microalgae based biorefinery promoting circular bioeconomy-techno economic and life-cycle analysis. Bioresour. Technol. 2020, 302, 122822. [Google Scholar] [CrossRef]
  33. Sulewski, P.; Ignaciuk, W.; Szymańska, M.; Wąs, A. Development of the Biomethane Market in Europe. Energies 2023, 16, 2001. [Google Scholar] [CrossRef]
  34. Baroni, G.; Yap, K.Y.; Webley, P.A.; Scales, P.J.; Martin, G.J. The effect of nitrogen depletion on the cell size, shape, density and gravitational settling of Nannochloropsis salina, Chlorella sp. (marine) and Haematococcus pluvialis. Algal Res. 2019, 39, 101454. [Google Scholar] [CrossRef]
  35. Sun, J.; Jiang, S.; Yang, L.; Chu, H.; Peng, B.-Y.; Xiao, S.; Wang, Y.; Zhou, X.; Zhang, Y. Microalgal wastewater recycling: Suitability of harvesting methods and influence on growth mechanisms. Sci. Total Environ. 2023, 859, 160237. [Google Scholar] [CrossRef] [PubMed]
  36. Dai, D.; Qv, M.; Liu, D.; Tang, C.; Wang, W.; Wu, Q.; Yin, Z.; Zhu, L. Structural insights into mechanisms of rapid harvesting of microalgae with pH regulation by magnetic chitosan composites: A study based on E-DLVO model and component fluorescence analysis. Chem. Eng. J. 2023, 456, 141071. [Google Scholar] [CrossRef]
  37. De Morais, E.G.; Sampaio, I.C.F.; Gonzalez-Flo, E.; Ferrer, I.; Uggetti, E.; García, J. Microalgae harvesting for wastewater treatment and resources recovery: A review. New Biotechnol. 2023, 78, 84–94. [Google Scholar] [CrossRef] [PubMed]
  38. Rossi, S.; Visigalli, S.; Cascino, F.C.; Mantovani, M.; Mezzanotte, V.; Parati, K.; Canziani, R.; Turolla, A.; Ficara, E. Metal-based flocculation to harvest microalgae: A look beyond separation efficiency. Sci. Total Environ. 2021, 799, 149395. [Google Scholar] [CrossRef] [PubMed]
  39. Figueiredo, D.; Ferreira, A.; Quelhas, P.; Schulze, P.S.; Gouveia, L. Nannochloropsis oceanica harvested using electrocoagulation with alternative electrodes—An innovative approach on potential biomass applications. Bioresour. Technol. 2022, 344, 126222. [Google Scholar] [CrossRef] [PubMed]
  40. Coward, T.; Lee, J.G.; Caldwell, G.S. Harvesting microalgae by CTAB-aided foam flotation increases lipid recovery and improves fatty acid methyl ester characteristics. Biomass Bioenergy 2014, 67, 354–362. [Google Scholar] [CrossRef]
  41. Japar, A.S.; Azis, N.M.; Takriff, M.s.; Haiza, M.Y.N.; Yasin, M.H.M. Application of Different Techniques to Harvest Microalgae. Trans. Sci. Technol. 2017, 4, 98–108. [Google Scholar]
  42. Razzak, S.A.; Ali, S.A.M.; Hossain, M.M.; Delasa, H. Biological CO2 fixation with production of microalgae in wastewater—A review. Renew. Sustain. Energy Rev. 2017, 76, 379–390. [Google Scholar] [CrossRef]
  43. Fasaei, F.; Bitter, J.; Slegers, P.; van Boxtel, A. Techno-economic evaluation of microalgae harvesting and dewatering systems. Algal Res. 2018, 31, 347–362. [Google Scholar] [CrossRef]
  44. Gerardo, M.L.; Oatley-Radcliffe, D.L.; Lovitt, R.W. Minimizing the Energy Requirement of Dewatering Scenedesmus sp. by Microfiltration: Performance, Costs, and Feasibility. Environ. Sci. Technol. 2014, 48, 845–853. [Google Scholar] [CrossRef] [PubMed]
  45. Zhang, M.; Yao, L.; Maleki, E.; Liao, B.-Q.; Lin, H. Membrane technologies for microalgal cultivation and dewatering: Recent progress and challenges. Algal Res. 2022, 44, 101686. [Google Scholar] [CrossRef]
  46. Wang, L.; Pan, B.; Gao, Y.; Li, C.; Ye, J.; Yang, L.; Chen, Y.; Hu, Q.; Zhang, X. Efficient membrane microalgal harvesting: Pilot-scale performance and techno-economic analysis. J. Clean. Prod. 2019, 218, 83–95. [Google Scholar] [CrossRef]
  47. Hwang, T.; Park, S.-J.; Oh, Y.-K.; Rashid, N.; Han, J.-I. Harvesting of Chlorella sp. KR-1 using a cross-flow membrane filtration system equipped with an anti-fouling membrane. Bioresour. Technol. 2013, 139, 379–382. [Google Scholar] [CrossRef] [PubMed]
  48. Elcik, H.; Cakmakci, M.; Ozkaya, B. The fouling effects of microalgal cells on crossflow membrane filtration. J. Membr. Sci. 2016, 499, 116–125. [Google Scholar] [CrossRef]
  49. Monte, J.; Sá, M.; Galinha, C.F.; Costa, L.; Hoekstra, H.; Brazinha, C.; Crespo, J.G. Harvesting of Dunaliella salina by membrane filtration at pilot scale. Sep. Purif. Technol. 2018, 190, 252–260. [Google Scholar] [CrossRef]
  50. Mo, W.; Soh, L.; Werber, J.R.; Elimelech, M.; Zimmerman, J.B. Application of membrane dewatering for algal biofuel. Algal Res. 2015, 11, 1–12. [Google Scholar] [CrossRef]
  51. Bilad, M.; Discart, V.; Vandamme, D.; Foubert, I.; Muylaert, K.; Vankelecom, I.F. Harvesting microalgal biomass using a magnetically induced membrane vibration (MMV) system: Filtration performance and energy consumption. Bioresour. Technol. 2013, 138, 329–338. [Google Scholar] [CrossRef]
  52. De Baerdemaeker, T.; Lemmens, B.; Dotremont, C.; Fret, J.; Roef, L.; Goiris, K.; Diels, L. Benchmark study on algae harvesting with backwashable submerged flat panel membranes. Bioresour. Technol. 2013, 129, 582–591. [Google Scholar] [CrossRef]
  53. Bhave, R.; Kuritz, T.; Powell, L.; Adcock, D. Membrane-Based Energy Efficient Dewatering of Microalgae in Biofuels Production and Recovery of Value Added Co-Products. Environ. Sci. Technol. 2012, 46, 5599–5606. [Google Scholar] [CrossRef]
  54. González-Camejo, J.; Andreola, C.; Maceratesi, V.; Toscano, G.; Eusebi, A.L.; Fatone, F. Biorefineries to improve water and resource recovery in the seafood-processing industry. In Advanced Technologies in Wastewater Treatment: Food Processing Industry; Elsevier: Amsterdam, The Netherlands, 2023; pp. 127–154. [Google Scholar] [CrossRef]
  55. Segredo-Morales, E.; González-Martín, C.; Vera, L.; González, E. Performance of a novel rotating membrane photobioreactor based on indigenous microalgae-bacteria consortia for wastewater reclamation. J. Ind. Eng. Chem. 2023, 119, 586–597. [Google Scholar] [CrossRef]
  56. Zhang, X.; Hu, Q.; Sommerfeld, M.; Puruhito, E.; Chen, Y. Harvesting algal biomass for biofuels using ultrafiltration membranes. Bioresour. Technol. 2010, 101, 5297–5304. [Google Scholar] [CrossRef] [PubMed]
  57. Seco, A.; Aparicio, S.; González-Camejo, J.; Jiménez-Benítez, A.; Mateo, O.; Mora-Sánchez, J.F.; Noriega-Hevia, G.; Sanchis-Perucho, P.; Serna-García, R.; Zamorano-López, N.; et al. Resource recovery from sulphate-rich sewage through an innovative anaerobic-based water resource recovery facility (WRRF). Water Sci. Technol. 2018, 78, 1925–1936. [Google Scholar] [CrossRef] [PubMed]
  58. González-Camejo, J.; Aparicio, S.; Jiménez-Benítez, A.; Pachés, M.; Ruano, M.; Borrás, L.; Barat, R.; Seco, A. Improving membrane photobioreactor performance by reducing light path: Operating conditions and key performance indicators. Water Res. 2020, 172, 115518. [Google Scholar] [CrossRef] [PubMed]
  59. Aparicio, S.; González-Camejo, J.; Seco, A.; Borrás, L.; Robles, Á.; Ferrer, J. Integrated microalgae-bacteria modelling: Application to an outdoor membrane photobioreactor (MPBR). Sci. Total Environ. 2023, 884, 163669. [Google Scholar] [CrossRef] [PubMed]
  60. Mora-Sánchez, J.F.; Serna-García, R.; Bouzas, A.; Seco, A.; Ruano, M.V. Anaerobic Membrane Bioreactor for Microalgae and Primary Sludge Co-Digestion at Pilot Scale: Instrumentation, Control and Automation Implementation, and Performance Assessment. Water 2023, 15, 3225. [Google Scholar] [CrossRef]
  61. APHA; American Public Health Association; American Water Works Association; Water Environment Federation. Standard Methods for the Examination of Water and Wastewater, 22nd ed.; APHA: Washington, DC, USA, 2012. [Google Scholar]
  62. Cheryan, M. Ultrafiltration and Microfiltration, 2nd ed.; CRC Press LLC: Boca Raton, FL, USA, 1998. [Google Scholar]
  63. González-Camejo, J.; Barat, R.; Aguado, D.; Ferrer, J. Continuous 3-year outdoor operation of a flat-panel membrane photobioreactor to treat effluent from an anaerobic membrane bioreactor. Water Res. 2020, 169, 115238. [Google Scholar] [CrossRef]
  64. Rossi, S.; Sforza, E.; Pastore, M.; Bellucci, M.; Casagli, F.; Marazzi, F.; Ficara, E. Photo-respirometry to shed light on microal-gae-bacteria consortia—A review. Rev. Environ. Sci. Biotechnol. 2020, 19, 43–72. [Google Scholar] [CrossRef]
  65. Judd, S.; Judd, C. Chapter 3—Design. In The MBR Book; Elsevier Science: Oxford, UK, 2006; pp. 123–162. ISBN 9781856174817. [Google Scholar] [CrossRef]
  66. Tena, F.O.; Ranglová, K.; Kubač, D.; Steinweg, C.; Thomson, C.; Masojidek, J.; Posten, C. Characterization of an aerated submerged hollow fiber ultrafiltration device for efficient microalgae harvesting. Eng. Life Sci. 2021, 21, 607–622. [Google Scholar] [CrossRef]
  67. Souliès, A.; Pruvost, J.; Legrand, J.; Castelain, C.; Burghelea, T.I. Rheological properties of suspensions of the green microalga Chlorella vulgaris at various volume fractions. Rheol. Acta 2013, 52, 589–605. [Google Scholar] [CrossRef]
  68. Kestin, J.; Sokolov, M.; Wakeham, W.A. Viscosity of liquid water in the range −8 °C to 150 °C. J. Phys. Chem. Ref. Data 1978, 7, 941–948. [Google Scholar] [CrossRef]
  69. Ministry of Industry and Tourism. Net Price of Electricity for Domestic Use and Industrial Use: Madrid, Spain. 2023. Available online: https://www.mincotur.gob.es/es-es/IndicadoresyEstadisticas/BoletinEstadistico/Energ%C3%ADa%20y%20emisiones/4_12.pdf (accessed on 23 October 2023). (In Spanish).
  70. Bunzl. Floquet Aqua: Sant Boi Llobregat, Spain. 2023. Available online: https://www.bunzlspain.com/hipoclorito-sodico-floquet-aqua-150g.html (accessed on 23 October 2023). (In Spanish).
  71. Parravicini, V.; Nielsen, P.H.; Thornberg, D.; Pistocchi, A. Evaluation of greenhouse gas emissions from the European urban wastewater sector, and options for their reduction. Sci. Total Environ. 2022, 838, 156322. [Google Scholar] [CrossRef] [PubMed]
  72. Eriksson, O. Environmental Technology Assessment of Natural Gas Compared to Biogas. In Natural Gas; Potocnik, P., Ed.; InTechOpen: London, UK, 2010; pp. 127–146. [Google Scholar]
  73. Greses, S. Anaerobic Degradation of Microalgae from the Effluent Treatment of a Submerged Anaerobic Membrane Reactor. Ph.D. Thesis, Universitat de València, Valencia, Spain, 2017. (In Spanish). [Google Scholar]
  74. Brémond, U.; Bertrandias, A.; de Buyer, R.; Latrille, E.; Jimenez, J.; Escudié, R.; Steyer, J.-P.; Bernet, N.; Carrere, H. Recirculation of solid digestate to enhance energy efficiency of biogas plants: Strategies, conditions and impacts. Energy Convers. Manag. 2021, 231, 113759. [Google Scholar] [CrossRef]
  75. Muller, O.; Bricker, P.; Laurin, B.; Mouton, L. Climate Change and Electricity, European Carbon Factor, Benchmarking of CO2 Emissions by Europe’s Largest Electricity Utilities, 21st ed.; INIS-FR--22-0804; International Atomic Energy Agency: Vienna, Austria, 2022. [Google Scholar]
  76. Bright Biomethane. Purepac Grand. Enschede, the Netherlands. 2023. Available online: https://www.brightbiomethane.com/ (accessed on 28 June 2023).
  77. Méndez, L.; García, D.; Perez, E.; Blanco, S.; Muñoz, R. Photosynthetic upgrading of biogas from anaerobic digestion of mixed sludge in an outdoors algal-bacterial photobioreactor at pilot scale. J. Water Process Eng. 2022, 48, 102891. [Google Scholar] [CrossRef]
  78. Du, X.; Shi, Y.; Jegatheesan, V.; Haq, I.U. A Review on the Mechanism, Impacts and Control Methods of Membrane Fouling in MBR System. Membranes 2020, 10, 24. [Google Scholar] [CrossRef]
  79. Chen, M.; Chen, Y.; Zhang, Q. A Review of Energy Consumption in the Acquisition of Bio-Feedstock for Microalgae Biofuel Production. Sustainability 2021, 13, 8873. [Google Scholar] [CrossRef]
  80. Wei, C.; Xu, Y.; Xu, L.; Liu, J.; Chen, H. Comparative life-cycle assessment of various harvesting strategies for biogas production from microalgae: Energy conversion characteristics and greenhouse gas emissions. Energy Convers. Manag. 2023, 289, 117188. [Google Scholar] [CrossRef]
  81. Brentner, L.B.; Eckelman, M.J.; Zimmerman, J.B. Combinatorial Life Cycle Assessment to Inform Process Design of Industrial Production of Algal Biodiesel. Environ. Sci. Technol. 2011, 45, 7060–7067. [Google Scholar] [CrossRef]
Figure 1. Flow diagram of the cross-flow ultrafiltration-based harvesting system. CIP: clean-in-place; CF-UF: cross-flow ultrafiltration; FIT: liquid flow rate transmitter; LIT: level indicating transmitter; LS: level switch; MV: manual valve; P: pump; PG: pressure gauge; SOV: on/off solenoid valve; TSS: total suspended solids; TT: temperature transmitter.
Sustainability 16 00369 g001
Figure 2. Evolution of filtration performance regarding: (a) Total suspended solids (TSS) concentration in the retentate and biomass to be harvested (TSSi·Vi); (b) 20 °C standardised transmembrane flux (J20) normalised by the initial flux (J20,0); concentration ratio (r) and biomass to be harvested (TSSi·Vi)/10. Dashed lines indicate the performance of chemical cleanings. TSSi: initial TSS concentration for an operation cycle; Vi: initial volume in the feed tank for an operation cycle.
Sustainability 16 00369 g002
Figure 3. Details of the filtration performance for an aleatory period of 24 days of operation (cycles 19 to 33): (a) Total suspended solids (TSS) concentration in the retentate and biomass to be harvested (TSSi·Vi); (b) 20 °C standardised transmembrane flux (J20) normalised by the initial flux (J20,0); concentration ratio (r) and biomass to be harvested (TSSi·Vi)/10. Dashed lines indicate the performance of chemical cleanings. TSSi: initial TSS concentration for an operation cycle; Vi: initial volume in the feed tank for an operation cycle.
Sustainability 16 00369 g003
Figure 4. Energy balance and GHG assessment for a concentration ratio of 21 for three different biogas valorisation Scenarios: Scenario 1: cogeneration; Scenario 2: membrane upgrading; and Scenario 3: microalgae upgrading: (a) energy balance in terms of Qdemand, Wdemand, and QBM; (b) direct and indirect GHG emissions. Qdemand: total thermal energy demand; Wdemand: total electrical energy demand; and QBM: biomethane production, expressed as primary energy.
Sustainability 16 00369 g004
Figure 5. Total GHG emissions for Scenario 3 (microalgae upgrading to biomethane).
Sustainability 16 00369 g005
Table 1. Pros and cons of microalgae biomass separation technology.
TechnologyAdvantagesDisadvantagesReferences
SedimentationSimple.
Low CAPEX and OPEX.
Poor settling capacity.
Low effluent quality.
Low biomass concentration.
Biomass losses.
Time consuming.
[23,34,35]
Coagulation–FlocculationProper settling rate.
Proper effluent quality.
Effective as a pre-concentrating step.
High doses of chemical reagents.
Possible photosynthesis inhibition from metallic flocculants.
Metal presence in harvested biomass.
Poor effluent quality for reuse.
[27,34,35,36,37,38]
ElectroflocculationFlocculants are not required.Metal presence in harvested biomass.
Emerging technology (low TRL).
[24,27,39]
Magnetic flocculationFast, scalable, and efficient.
Natural polymers can be added to coat magnetic particles.
Low efficiency for small particles.
Low magnetic capacity lifetime.
Emerging technology (low TRL).
[24,36,37]
BioflocculationToxic chemicals are not required.
Prevention of microalgae contamination.
Bioflocculants are produced from biomass.
Genetic engineering can enhance bioflocculant production.
Factors affecting bioflocculant release remain unclear.
Emerging technology (low TRL).
[24,37]
FlotationLow CAPEX.
Low HRT.
High cost-effective method.
Small footprint.
Possible disruption of microalgae (pro for anaerobic valorisation).
The use of reagents can imply extra costs.
Possible disruption of microalgae (disadvantage if the integrity of biomass is needed).
[23,37,40]
CentrifugationQuick and simple.
Most algal cell types can be harvested.
Can be used as a second-step harvesting process.
High energy demand.
High CAPEX.
Shear stress on microalgae.
Low EPS removal.
[24,37,41,42,43]
FiltrationHigh effluent quality.
Small footprint.
Can be combined with pre-harvesting steps.
Moderate to high biomass concentration.
Depending on the technology and configuration employed, it can ensure the integrity of the microalgae or promote the hydrolysis of the microalgae.
Membrane fouling and clogging.
Membrane productivity in terms of CAPEX and OPEX.
High energy requirements.
[21,24,25,44,45,46,47,48,49]
Table 2. Average operating and outdoor conditions over the 78 cycles of cross-flow ultrafiltration.
ParameterUnitMean ± SD
Temperature°C22 ± 6
Inlet gauge pressure (P1)bar2.11 ± 0.04
Outlet gauge pressure (P2)bar0.48 ± 0.02
Transmembrane pressure (TMP)bar1.25 ± 0.02
Initial volume in the feed tank (Vi)L450 ± 65
Initial TSS in the feed tank (TSSi)g·L−10.50 ± 0.12
Table 3. Average filtration performance over the entire operating period (78 cycles).
ParameterUnitMean ± SD
TSSf g·L−19.7 ± 1.7
CFVm·s−11.2 ± 0.3
J20LMH16 ± 8
Normalised flux (J20:J20,0)-0.49 ± 0.23
K20LMH·bar−113 ± 6
TMPBFbar1.21 ± 0.08
QBFL·min−131 ± 8
HV_rg·m−2·h−19 ± 3
r-21 ± 6
Cycle durationh25 ± 9
Table 4. Energy and chemical reagent consumption of the cross-flow ultrafiltration unit.
ParameterAcronymUnitMean ± SD
Energy consumption ratio per harvested algal biomassECm_TSSkWh·kg−11.51 ± 0.64
Energy consumption ratio per treated volume of pre-concentrated microalgae cultureECv_HVkWh·m−30.76 ± 0.32
Energy consumption ratio per total treated volume in the WRRFECv_WRRFkWh·m−30.39 ± 0.16
Sodium hypochlorite consumption per total treated volume in the WRRFNaOClCV_WRRFg Cl·m−30.97 ± 0.39
Operating expenses of energy and sodium hypochlorite per total treated volume in the WRRFOPEXEC+ClEUR·m−30.082 ± 0.034
Disclaimer/Publisher’s Note: The statements, opinions and data contained in all publications are solely those of the individual author(s) and contributor(s) and not of MDPI and/or the editor(s). MDPI and/or the editor(s) disclaim responsibility for any injury to people or property resulting from any ideas, methods, instructions or products referred to in the content.

