Article

Spatiotemporal Dynamics in Economic, Social, and Environmental Upgrading in China: Coupling Coordination and Influencing Factors

School of Geography and Planning, Sun Yat-sen University, Guangzhou 510275, China
*
Author to whom correspondence should be addressed.
Sustainability 2024, 16(1), 357; https://doi.org/10.3390/su16010357
Submission received: 26 November 2023 / Revised: 25 December 2023 / Accepted: 28 December 2023 / Published: 30 December 2023

Abstract

:
The focus on the concept of upgrading in the study of global production networks has expanded from economic upgrading to encompass social and environmental upgrading. However, rare research pays attention to the complex interplay among these three aspects. This paper tries to integrate the economic, social, and environmental upgrading into an analytical framework through the lens of coupling coordination. Using the Granger causality test and panel regression model, it provides empirical evidence and an explanation of the triad’s interaction based on the Chinese case study. It is found that, over the past twenty-five years from 1996 to 2020, China has seen a significant improvement in the coupling coordination of economic, social, and environmental upgrading with the coordination degree rising from 0.35 to 0.51, though it remains at a low level of coordination. Regional disparities in economic upgrading are more pronounced than those in social and environmental upgrading, and the inter-group disparities between economic and environmental upgrading have widened following the economic crisis. Panel regression analysis shows that economic globalization, public governance, legal environment, and environmental regulation positively influence the coupling coordination of the three types of upgrading, while economic privatization and corporate violations of law tend to have a negative impact.

1. Introduction

In the context of global production networks or global value chains, the concept of “upgrading” typically refers to the process of economic upgrading. Economic upgrading is defined as the process through which enterprises enhance their competitiveness and innovation capabilities to increase value added and profits, thereby improving economic efficiency [1]. At a macro level, it can be viewed as the process by which a country or region achieves higher efficiency within the global production networks [2]. With increasing research focusing on labor rights within global value chains [3,4], the concept of upgrading has expanded to include social dimensions, thus giving rise to the concepts of social upgrading. Unlike economic upgrading, social upgrading emphasizes the welfare of laborers, entailing improvements in employment quality, higher income, better social security, and greater social rights, thereby enhancing their social status and value [5]. The research on economic and social upgrading has been relatively abundant. With the growing focus on issues related to sustainable development of the ecological environment, the concept of upgrading is gradually expanding towards the environmental domain [6]. This expansion has led to the emergence of the concept of environmental upgrading. Environmental upgrading, on the other hand, focuses more on the protection and improvement of the ecological environment. Specifically, it can be seen as the process where businesses and other actors in the global value chains improve or minimize their environmental impact, including production, processing, distribution, consumption, and disposal or recycling [7].
The extension of the concept of economic upgrading to encompass social and environmental upgrading reflects a growing concern for sustainable development within global value chains. In these chains, economic entities such as corporations, in pursuit of economic upgrading, often engage in competitive behaviors for profit maximization. However, the realization of more sustainable global production networks is contingent upon considering the impacts on labor entities and the external environment [8,9]. The concepts of social and environmental upgrading place greater emphasis on labor rights and environmental protection, expanding the beneficiaries of value gains to include social and environmental domains and taking into account the externalities produced by economic upgrading. Furthermore, the sustainability of social and environmental upgrading is also subject to economic outcomes, including financial viability [6], implying that without a continuous generation of profit surplus, it becomes challenging to provide corresponding safeguards for labor rights and ecological well-being. Therefore, the interplay and negotiation among social, economic, and environmental upgrading within the global production networks are crucial for achieving sustainable development [6,10]. However, current research focuses on the relationships either between economic and social upgrading or between economic and environmental upgrading, with little attention paid to the interplay between these three aspects. This paper aims to fill the gap by examining the coupling and coordination of economic, social, and environmental upgrading in China from 1996 to 2020. Since the reform and opening up in 1978, China’s rapid economic development has been accompanied by significant labor rights violations and environmental pollution, leading to imbalanced development across economic, social, and environmental domains. However, with China’s gradual shift towards high-quality development, certain progress has been observed in environmental protection and the safeguarding of social welfare, offering some advisory lessons for sustainable development models. The exploration of the development process and the interrelationships among economic, social, and environmental upgrading in China may contribute to the ongoing discussion about the sustainable development of economic globalization.
In summary, the focus of research in global production networks has progressively shifted from economic upgrading to social upgrading, and finally to environmental upgrading. To elucidate the interplay among economic, social, and environmental upgrading, this study initially measures these three types of upgrading based on their respective theoretical underpinnings. Subsequently, it incorporates methods such as coupling coordination degree and Granger causality tests to examine the causal relationships of these interactions which are between the economic, social, and environmental upgrading in China from 1996 to 2020. This is followed by an analysis of their evolutionary trends. Additionally, the study employs the inequality index to conduct a spatial pattern analysis of regional disparities among these three aspects, providing temporal and spatial empirical insights into their interactions. Finally, a panel regression model is utilized to reveal the influencing factors of these relationships. This paper contributes empirical evidence from China on the integrated interaction among the three types of upgrading, offering a theoretical foundation for promoting coordinated development in economic, social, and environmental spheres.

2. Literature Review

In the context of global production networks, research pertaining to the trinity of upgrading concepts often accentuates the developmental interrelations between economic and social upgrading, or between economic and environmental upgrading [11]. The discourse on economic and social upgrading predominantly emphasizes the influence and impetus of the former on the latter. Early studies posited that social upgrading is a natural concomitant of economic upgrading, presuming that the emergence of social upgrading is an inevitability once a certain threshold of economic upgrading is reached. This suggested a deterministic linkage where economic upgrading invariably leads to social upgrading. However, empirical research has progressively unveiled a more intricate relationship between these two facets [12], indicating that their interplay is not a straightforward linear causality [13,14]. For instance, in contrast to developed nations, economic upgrading in developing countries less frequently translates into social upgrading [15]. This disparity is particularly pronounced among specific demographic groups, such as women [16], informal sector workers [17], or laborers positioned at the lower-value segments of the value chain [12], where economic upgrading does not readily lead to social advancement. Furthermore, the agency of laborers plays a pivotal role; workers, through means of protest and strikes, can bolster their bargaining power to propel social upgrading [18], albeit potentially at the cost of diminishing the global market competitiveness of enterprises, thereby precipitating the economic downgrading [19]. Scholars therefore argued that economic upgrading leading to social upgrading is not a natural process but relies on the power relation between capital and labor and the way this relation is institutionalized [20]. In line with this argument, it is suggested that public governance plays a crucial role in promoting the transformation process [1].
The scholarly investigation into the interplay between economic and social upgrading is the most established, whereas the exploration of the relationship between economic and environmental upgrading follows in maturity. The focus of research on economic and environmental upgrading is on their intertwined and mutually influential processes. Concurrent instances of environmental upgrading and downgrading exist within the ambit of economic upgrading. For example, the digital transformation inherent in economic upgrading can effectively enhance the clean production capacity of industries, thereby reducing external pollution [21], and thus facilitating environmental upgrading through economic advancement. Conversely, economic upgrading in developed regions could potentially lead to the relocation of high-pollution industries to less developed areas, creating “pollution havens” and resulting in a more severe environmental crisis, hence contributing to an overall environmental downgrading [22]. The outcomes of economic upgrading within the context of environmental upgrading are marked by uncertainty. The costs required for green transformation in environmental upgrading are contingent upon the profits generated by economic upgrading. For instance, supplier companies are often burdened with costly environmental protection expenses imposed by leading enterprises without a concomitant increase in profits, resulting in an economic downgrading even as they achieve environmental upgrading, thus falling into a state of disequilibrium [7]. This mutually constraining relationship between economic and environmental upgrading is more prevalent in developing countries [6]. Additionally, the interplay between economic and environmental upgrading can yield divergent outcomes across different economic sectors. In the shipping industry, for example, strategies aimed at energy cost savings can enhance product competitiveness, thereby promoting economic upgrading, while simultaneously contributing to environmental upgrading through reduced energy consumption and carbon emissions, achieving a synergistic development of both [23]. However, in the garment industry, situations arise where environmental upgrading occurs alongside economic downgrading [24].
Research on the interrelation between social and environmental upgrading, though less prolific, has revealed complex dynamics between these two aspects. The process of environmental upgrading can potentially lead regions to incur the costs of green growth [25], thereby precipitating a decline in social welfare [26]. Conversely, it might foster social upgrading through skill development for laborers, wage increases, and improvements in working conditions. In this vein, laborers actively participate in greening production processes, furthering environmental upgrading, and thereby achieving a synergistic development of both social and environmental upgrading [27]. Instances of simultaneous decline in both dimensions have also been documented [28]. Thus, the dyadic interactions among social, economic, and environmental upgrading are intricately coupled and influenced by a myriad of internal and external factors. Incorporating the interactive relationships and complex coupling mechanisms of these three types of upgrading into a unified framework is essential [29], yet empirical evidence in this area remains scant [30].
Investigating the determinants influencing the achievement and interrelationships of economic, social, and environmental upgrading represents another pivotal research question [11,31]. Existing studies primarily focus on the impact of economic globalization and local governance as key influencing factors. It has been observed that foreign direct investment positively affects all three forms of upgrading [32,33,34]. Specifically, variations in supply chain governance models can yield distinct outcomes in social, economic, and environmental upgrading [35,36]. For instance, compared to market governance, captive and relational governance more robustly support the synchronized development of these three types of upgrading [11]. Within the realm of local governance, the management roles of national and government policies significantly influence these upgrading processes [37,38]. Post-economic development, developing countries tend to emphasize the coordinated advancement of economic, social, and environmental upgrading [39]. This is achieved through intensified regulatory oversight and optimization of legal frameworks to localize economic value, thereby facilitating the harmonized progression of the three types of upgrading [40,41]. Smaller-scale local governments also strive for local benefits through forms such as cooperatives [42].
In summary, current research tends to lean more towards examining the relationships between economic and social upgrading as well as between economic and environmental upgrading, with limited supplementary focus on the interplay between social and environmental upgrading. There is a lack of integrated consideration of the complex coupling of these three types of upgrading. Moreover, in terms of research scope, existing studies predominantly concentrate on static, micro-level case studies, with an absence of macro-level exploration of the dynamic interrelationships among the three types of upgrading. There is potential for mutually beneficial, synergistic development among economic, social, and environmental upgrading, as well as the possibility of relative disequilibrium or even overall degeneration in all three areas. Important research topics include how to transform the benefits of economic upgrading into social and environmental upgrading, how to enhance the role of environmental upgrading in boosting regional economic benefits and labor welfare, and how to motivate labor dynamism to foster an environment conducive to technological innovation and ecological conservation, thereby enabling social upgrading to positively influence economic and environmental upgrading.

3. Materials and Methods

3.1. Measurement of Economic, Social and Environmental Upgrading

Economic upgrading is the process through which enterprises enhance their innovation and competitiveness, thereby achieving higher value-added gains. This comprehensive concept includes four distinct types of upgrading: process upgrading, aimed at improving production efficiency; product upgrading, involving the creation of advanced products; functional upgrading, directed towards higher value-added production activities; and chain upgrading, focusing on the adoption of new industrial technologies to create more complex production chains. These enterprise-level activities have broader implications, triggering economic growth, structural transformations, and improvements in quality at the provincial or national level. These outcomes can be effectively gauged using corresponding proxy variables [5]. In the context of this paper, provincial economic upgrading is assessed across four dimensions: economic structure, economic efficiency, economic innovation, and economic growth (Table 1). This measurement reflects the regional shift towards a higher value-added economic structure, the enhancement of labor productivity and industrial innovation capabilities, and the improvement of per capita output in economic growth.
The economic structure indicator aims to measure the speed of change and the depth of transition in a region’s economic industry structure. To achieve this, the investigation applied the Lilien coefficient [43] and an index that portrays the sophistication of the industrial structure. The economic efficiency indicator determines the extent to which economic upgrading is translated into tangible outcomes. It is measured through two proxy variables: the ratio of profits from large-scale industrial enterprises to their main business income, and the rate of social labor productivity. The economic innovation indicator determines the degree of technological progress in economic production and its effect on boosting production efficiency or raising product value. This is measured by four proxy variables: the proportion of R&D expenditure in relation to GDP, the ratio of granted invention patent applications to R&D expenditure, per capita technology market transaction value, and the proportion of new product sales income from industrial enterprises above a designated size to their main business income. The economic growth indicator reflects the overall economic development of a region, applying per capita GDP growth as the proxy variable.
Social upgrading involves the process of guaranteeing workers’ fundamental rights and enhancing the standard of their employment. It depicts the degree and procedure of enhancing workers’ welfare in global economic production. Social upgrading covers different aspects such as employment, standards and rights at work, social protection, and social dialogue [44]. It can be classified into four dimensions [5]: (1) Labor employment should indicate sufficient job opportunities, appropriate compensation, and a secure and healthy work environment. (2) Social security should guarantee job stability and support workers’ immediate needs. (3) Basic rights should include prohibiting child labor, forced labor, discriminatory practices, and poor working conditions while ensuring freedom of association. (4) Social dialogue refers to a system where social and economic organizations collaborate with the government to resolve industrial relations conflicts, including economic democracy, collective bargaining, and participation in labor policy formulation and implementation. Therefore, regional social upgrading is the improvement of workers’ employment quality, social security, basic work rights, and their rights to collective bargaining. Based on these four dimensions, a comprehensive assessment framework comprising four primary indicators and ten secondary indicators has been developed to evaluate the level of the social upgrading of thirty provinces/municipalities/autonomous regions (hereinafter referred to as provinces, excluding Tibet, Hong Kong, Macao, and Taiwan) in China (Table 2).
Table 2 illustrates that labor employment quantifies the improvement of job opportunities and wage growth. This study measures job opportunities using two proxy variables: the number of job openings registered by establishments during the current period and the unemployment rate. Remunerated employment is proxied by the average salary of urban employees. Social security signifies the degree of protection laborers receive in society, which is measured by the medical insurance coverage rate. Basic rights underline the assurance of essential rights that laborers should have, both as part of the labor force and as social participants. This comprises three indicators: access to education, gender equality, and union participation. Social dialogue encompasses the systems and channels through which employees can correspond and negotiate with employers, governments, and other stakeholders in a fair and democratic way. The measurement comprises three indicators: negotiation and consultation, union roles, and economic democracy.
Environmental upgrading is the process through which actors, including firms, reduce their environmental impacts via technological innovations, production process enhancements, and management styles. This process entails reducing the harm inflicted on the environment throughout the production system [7,30]. Environmental upgrading involves both process and outcome components [45]. The process component of environmental upgrading highlights the inputs of different actors into the environmental improvement process, such as firms using greening technologies for production, local governments implementing pollution control measures, and autonomous responses at the societal level [46]. The findings of environmental upgrading pertain mainly to the significant decrease in local environmental impacts, encompassing the enhancement of energy efficiency, the minimization of carbon dioxide emissions, and the mitigation of pollution in the environment. Drawing on the aforementioned conceptual discernment and data validity at the provincial level, this investigation delineates environmental enhancement at the regional level across four dimensions: green innovation, green inputs, energy conservation and emission reduction, and pollution reduction achievements (Table 3). These dimensions gauge green innovation prowess, local (provincial) environmental protection input, the efficacy of saved energy and reduced emissions, as well as results of environmental pollution control, extending the single-dimensional quantification approach of previous studies [47,48] to multiple dimensions.
Green innovation reflects the level of green technology and related innovation and development capacity, measured by the percentage of green utility patents per capita. Green input refers to the local input to the process of greening the economy, including both top-down (government attention) and bottom-up (social participation) inputs, and is measured by investment completed for pollution control per unit of industrial value added and the number of environmental proposals form NPC deputies and CPPCC members. Energy conservation and emission reduction indicates the efficiency of energy conservation and emission reduction in the process of economic development and is expressed in terms of energy consumption per unit of GDP and carbon dioxide emissions per unit of GDP. Pollution reduction achievements emphasize the treatment of environmental pollution elements to reduce their negative impact on the environment, including three aspects: water pollution, air pollution, and waste utilization, which are represented by three proxy variables: wastewater treatment rate, sulfur dioxide emissions per unit of industrial value-added and comprehensive utilization rate of industrial solid waste, respectively.
This paper uses a combination of the entropy weighting method and the CRITIC allocation method to determine the weights of the above indicators to calculate the composite index. The entropy weighting method determines the indicator weights by calculating the entropy value of each indicator, and the CRITIC assignment method determines the indicator weights by the comparison intensity of the indicators and the conflict between the indicators, and the combination of the two takes into account both the correlation between the indicators and the degree of dispersion between the indicators. The indicator weights were determined with reference to existing research [49]. After nondimensionalizing the original data using the range method, this study calculated the CRITIC weight ( w j 1 ) and the entropy weight ( w j 2 ) for the indicator j . Assuming equal importance of the two weighting methods, the combined weight ( w j ) can be computed as follows:
w j = 0.5 w j 1 + 0.5 w j 2
Finally, the aggregate of the weights provides the comprehensive index for each system:
U s = j = 0 n w j X j
Here, X j is the nondimensionalized variable, i represents a specific year and region, j represents a specific indicator, Us stands for any one of economic, social, or environmental upgrading, and n signifies the number of indicators.

3.2. Research Methods

3.2.1. Model of Coupling Coordination Degree

This paper uses the coupling coordination degree model to depict the relationships among economic, social, and environmental upgrading. The model is widely used to quantify the coupling conditions and coordinated developmental relationships between different systems, with applications in fields such as urbanization and ecological environment studies [50]. The degree of coupling reflects the synchronicity among the three systems, while the coupling coordination degree additionally considers the developmental levels of the systems themselves, thereby representing a composite picture of their synchronicity and individual developmental progress. In other words, the coupling coordination degree not only portrays the synchronous relationship among economic, social, and environmental upgrading but also takes into account their individual advancements. A high degree of coupling coordination indicates not just parallel development among the three but also their concurrent enhancement, thus illustrating the synergistic elevation of all three types of upgrading. Similarly, this model can also represent the synchronized development between any two of these upgrading types. The paper employs a revised formula for the coupling coordination degree model [51]:
C = [ 1 s > s , s = 1 n   ( U s U s ) 2 m = 1 n 1   m ] × ( s = 1 n   U s m a x U s ) 1 n 1
T = s = 1 n   α s × U s , s = 1 n   α s = 1
D = C × T
Here, C represents the coupling degree, T stands for the degree of development, and D is the coupling coordination degree; Us refers to any one of the economic, social, or environmental upgrading, and U s refers the others excluding Us. αs is a specific weight. Based on the fact that the three types of upgrading are equally important in the study [52], the value of αs was set to 1/2 in the model of any two upgrading and 1/3 in the model of all three types of upgrading together in this study. Based on the numerical levels of coupling coordination degree and the three types of upgrading derived from the study, and referring to the existing study [53], the equal interval division method [54] was used to classify the coupling coordination degree stage into five categories (Table 4). A value below 0.4 indicates imbalanced coupling coordination, where any two or all three types of upgrading do not interact in a mutually supportive way, while a value above 0.4 indicates a coordinated state of mutual supportiveness between any two or all three types of upgrading in the region.

3.2.2. Inequality Index

The inequality index is utilized to measure the degree of disparity among different regions, thereby delineating the changing trends of regional disparities across different years. This study employs the Theil index to depict the variations in economic upgrading, social upgrading, and environmental upgrading across various regions. The formula is [55]:
T h e i l = 1 n i = 1 n   y i y ¯ ln y i y ¯
Here, n signifies the number of regions (30 provinces/municipalities directly under the central government/autonomous regions), i corresponds to the region, y i represents the relevant numerical series intended for measurement in region i (namely economic, social, and environmental upgrading), and y ¯ denotes the average of y i . The Theil index can also be decomposed to assess the level of imbalance among the four major regions: East, Central, West, and Northeast China. The formula for this decomposition is [56]:
T I n t e r = k = 1 K   Y k × ln Y k n k n
In this formula, T I n t e r is the inter-regional (inter-group) disparities, Y k is the ratio of social, economic, or environmental improvement in region k to the total composite index, n k is the number of districts in region k. K is the total number of districts, which is 4 (including East, Central, West, and Northeast China).

3.2.3. Granger Causality Test for Panel Data

In order to demonstrate the causality of the interactions behind the coupling coordination of economic, social, and environmental upgrading, this study utilizes the Granger causality test. The Granger causality test analyses the causal relationship between the two in terms of temporal sequencing and is modeled as follows [57]:
y i , t = α i + k = 1 K   γ i k y i , t k + k = 1 K   β i k x i , t k + ε i , t
Here, αi is the constant term, εi,t is the error term, γ and β are the regression coefficients, and K is the maximum lag order of x and y. The null hypothesis is H0: β   ( k ) = 0 for any k, and the alternative hypothesis is H1: there exists k such that β   ( k ) ≠ 0. If the null hypothesis is rejected, then x is the granger cause of y, and similarly it can be tested if y is the granger cause of x.

3.2.4. Panel Regression Model and Research Hypotheses

Panel regression models are used to reveal influencing factors of the coupling coordination relationship of three types of upgrading. The ordinary least squares (OLS) approach provides a direct measure of the relationship of influence, while the fixed effects (FE) model accounts for the impact of individual factors. However, these models inadvertently sidestep issues related to heteroscedasticity and serial autocorrelation. To address these biases, the feasible generalized least squares (FGLS) estimation method was used in this study [58]. The regression model is formulated as follows:
D i t = C + β i X i t + a i + ε i t
Here, i stands for the region, t represents the year, D i t denotes the coupling coordination of the economic, social, and environmental upgrading in each region, and X i t represents a set of explanatory variables. Further, β i is the regression coefficient, a i indicates the FE associated with the region, C is the constant, and ε i t is the random error term.
The relationship between economic, social, and environmental upgrading is influenced by a combination of market, government, and institutional factors such as economic privatization, economic globalization, public governance, legal environment, corporate violations of law, and environmental regulation [11,31,59]. First, economic privatization poses challenges to the coupling coordination of economic, social, and environmental upgrading. A higher level of regional economic privatization, indicative of a larger proportion of private enterprises, leads to intensified internal market competition. This often results in myopic corporate behavior, which tends to overlook labor rights and environmental protection, thereby shifting more negative externalities of production onto society and the environment. Such a scenario hampers the ability of economic upgrading to drive social and environmental upgrading, adversely affecting their coupled and coordinated development. In contrast, state-owned capital focuses not only on the transformation and upgrading capabilities of enterprises [60] but also on safeguarding labor rights [61] and assuming responsibility for environmental protection [62], thus acting as a facilitator for the coupling coordination of economic, social, and environmental upgrading. In this study, the degree of economic privatization is measured by the proportion of non-state-owned economy in industrial sales (NSTAT), an index representing the revenue of non-state-owned industrial enterprises as a percentage of total industrial sales [63].
Second, economic globalization positively impacts the coupling coordination of economic, social, and environmental upgrading [64,65,66]. The entry of global capital into local markets spurs investment and technology transfer, catalyzing regional economic growth and transformative upgrading. This process not only creates employment opportunities but also introduces green technologies and sustainable management philosophies. Moreover, leader firms, adhering to their corporate social responsibility (CSR) mandates, contribute to societal and environmental advancements. These corporations often mandate local supplier firms to improve labor conditions, provide social insurance, comply with clean production standards, and reduce pollutant emissions. Economic globalization is quantified using the per capita foreign direct investment (ln(pIFDI)).
Third, effective public governance contributes to the coupling coordination of these three types of upgrading. Local governmental officials, incentivized by promotion assessment mechanisms, actively drive regional economic development and industrial upgrading [67]. They also amplify their focus on ecological management and pollution control investments, thereby facilitating both economic and environmental upgrading. Concurrently, as representatives of public welfare, governments have the onus to protect labor rights and mitigate environmental pollution. This is typically achieved through enacting labor policies, executing employment strategies, enhancing welfare systems [20], and establishing and implementing ecological legal frameworks, alongside bolstering green industry investments [68]. The metric for public governance ability is the per capita fiscal expenditure (ln(pFE)).
Fourth, a robust legal environment is instrumental in harmonizing the coupling coordination of economic, social, and environmental upgrading. A well-established legal framework is crucial in attracting businesses [69], fostering a competitive market ecosystem, and laying the groundwork for economic upgrading. Regions with a higher legal safeguard standard exhibit elevated social transparency [70], effectively channeling and addressing labor concerns regarding rights and environmental improvements. This ensures the protection of labor rights and the amelioration of working conditions, thereby facilitating green industry upgrading and motivating workforce innovation and entrepreneurship, which are vital for economic and environmental progress. The legal environment is assessed through the index of development of market intermediaries and the legal system environment [71], representing the external environment’s support and protection for local market development (LAW).
Fifth, corporate violations of law are detrimental to the coupling coordination of the three. Certain enterprises, in pursuit of transformation and upgrading strategies like automation, relocation, or mergers, often overlook labor rights and breach labor contract laws. Others transfer polluting processes to regions with underdeveloped regulatory frameworks, leading to environmental downgrading. Thus, economic upgrading founded on violations and illegality fails to concurrently elevate social and environmental upgrading. The corporate violation is measured by the proportion of fines and forfeitures in the GDP (FP_GDP).
Lastly, environmental regulation plays a crucial role in facilitating the coupling coordination of economic, social, and environmental upgrading. Such regulation drives technological innovation via the “innovation compensation effect” [72], compelling enterprises to revamp their production methods [40], adopt green and clean technologies, and enhance international competitiveness, thereby fostering both economic and environmental upgrading [73,74]. The transition to a low-carbon, green economy propelled by environmental regulation generates new green job opportunities [41], elevates employment standards, and thus promotes social upgrading. The extent of environmental regulation is gauged by the count of environmental penalty cases (ln(ER)). The statistical outcomes of all the elements in the panel regression models are delineated in Table 5. Based on the analysis of the above model and related influencing factors, two research hypotheses are proposed:
Hypothesis 1: 
Economic globalization, public governance, legal environment, and environmental regulation positively influence the coupling coordination of economic, social, and environmental upgrading.
Hypothesis 2: 
Economic privatization and corporate violations of law tend to have a negative impact on the coupling coordination of economic, social, and environmental upgrading.
Table 5. Descriptive statistics for variables in regression model.
Regression VariablesMeasurement IndicatorsMeanMedianMaximumMinimumVarianceObservation
DDegree of coupling coordination0.4130.3970.7400.2510.073750
NSTATIndex of non-state economy’s share in industrial sales6.0345.89112.796−1.0923.426750
ln(pIFDI)Logarithm of per capita foreign direct investment8.7648.62514.4424.0181.460750
ln(pFE)Logarithm of per capita fiscal expenditure8.0858.37411.0133.0001.512750
LAWIndex of development of market intermediaries and the legal system environment4.9143.71314.297−0.7363.329750
FP_GDPRatio of fines and forfeitures in fiscal revenue to GDP0.0030.0030.0070.0010.001750
ln(ER)Logarithm of environmental penalty cases7.3677.43610.7181.3861.395750

3.3. Data Sources

This study covers 30 provinces in China (excluding Tibet, Hong Kong, Macao, and Taiwan) from 1996 to 2020, forming a research sample of 750. Data were obtained from the China Statistical Yearbook, China Statistical Yearbook On Environment, China Environmental Yearbook, China Energy Statistical Yearbook, China Labor Statistical Yearbook, China Social Statistical Yearbook, China Urban Statistical Yearbook, provincial statistical yearbooks, and the National Bureau of Statistics and the report of the Marketability Index [63] for the corresponding years. Some missing data were supplemented by linear interpolation.

4. Evolution and Regional Disparities in the Coupling Coordination between Economic, Social, and Environmental Upgrading

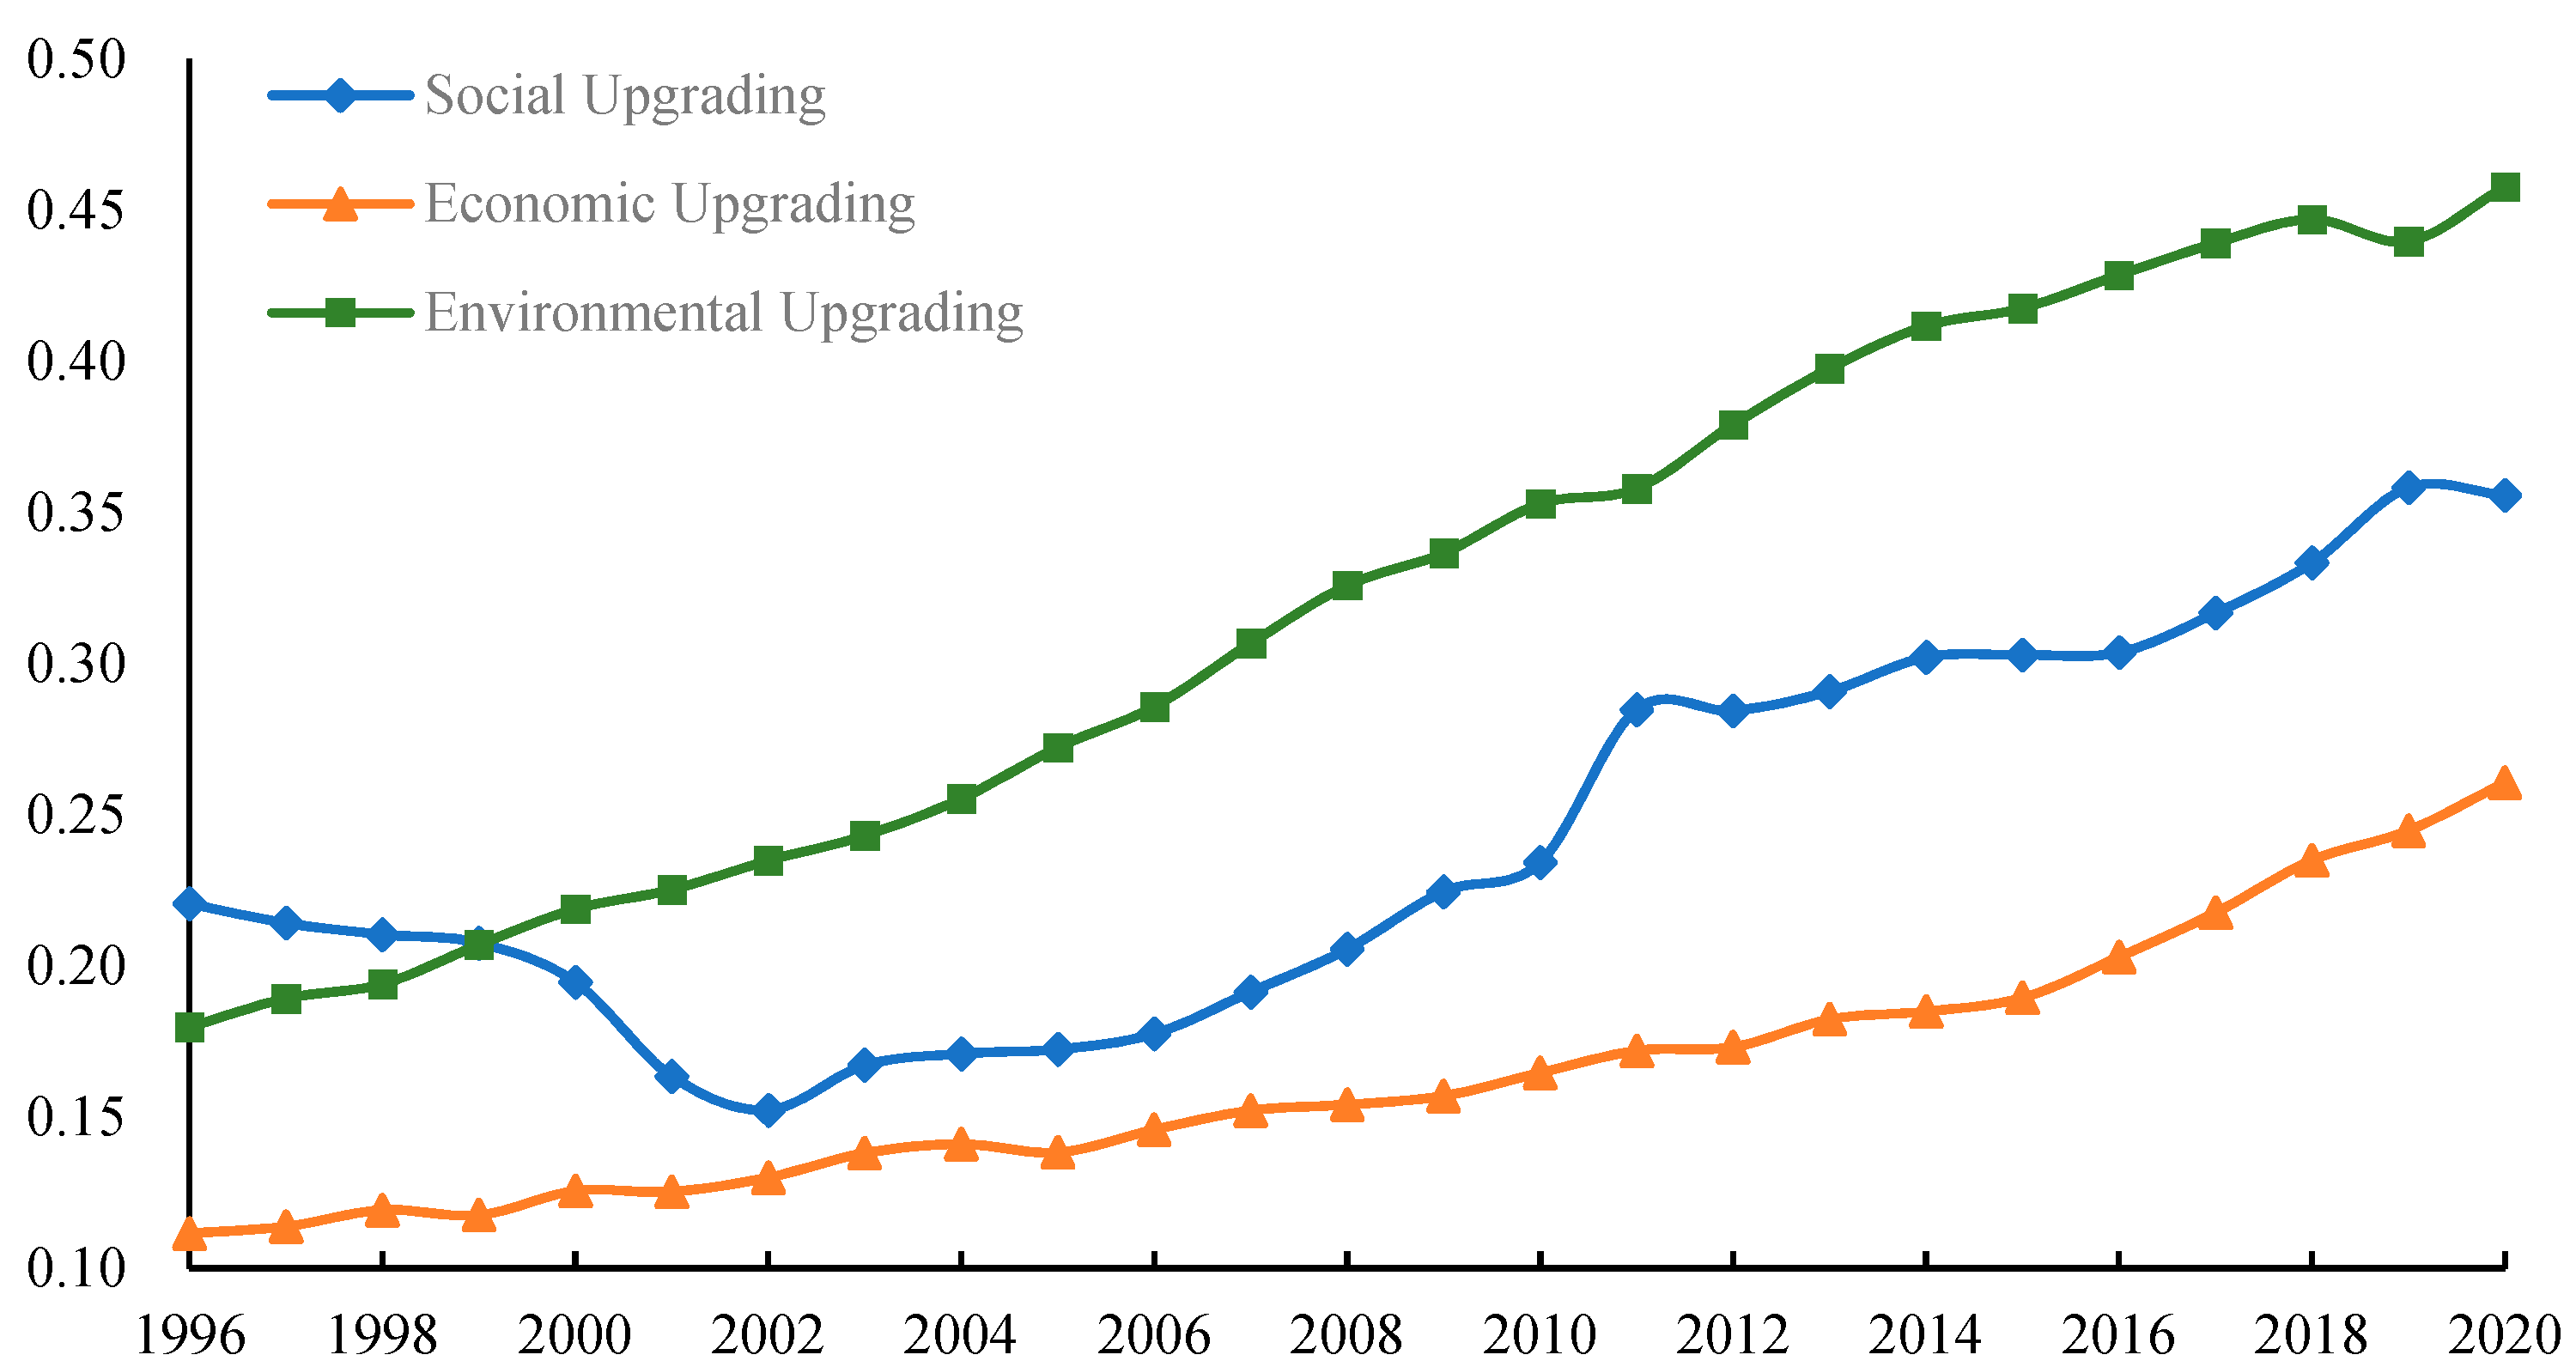
4.1. Evolution of Economic, Social and Environmental Upgrading

Figure 1 illustrates the changing characteristics of the mean values of the composite indices for economic, social, and environmental upgrading in China. From 1996 to 2020, the index for social upgrading in China rose from 0.22 to 0.36, overall exhibiting a trend of initial decline followed by a rise. Prior to 2002, the level of social upgrading consistently declined, while post-2002, it maintained an upward trajectory. In contrast to social upgrading, economic upgrading demonstrated a continual upward trend, escalating from 0.11 in 1996 to 0.27 in 2020. Similarly, environmental upgrading showed a relatively stable growth trend, rapidly increasing from 0.18 in 1996 to 0.46 in 2020, with a faster growth rate compared to social and economic upgrading. The primary cause for the social downgrade prior to 2002 was the mid-1990s reform of state-owned enterprises, which led to millions of workers being laid off or compelled to enter a highly competitive labor market [75]. This market-oriented reform dismantled the “iron rice bowl” of stable employment and income provided by the state sector during the early socialist era [76], resulting in the loss of stable jobs and a decline in social welfare coverage for housing, pensions, children’s education, and healthcare [77].

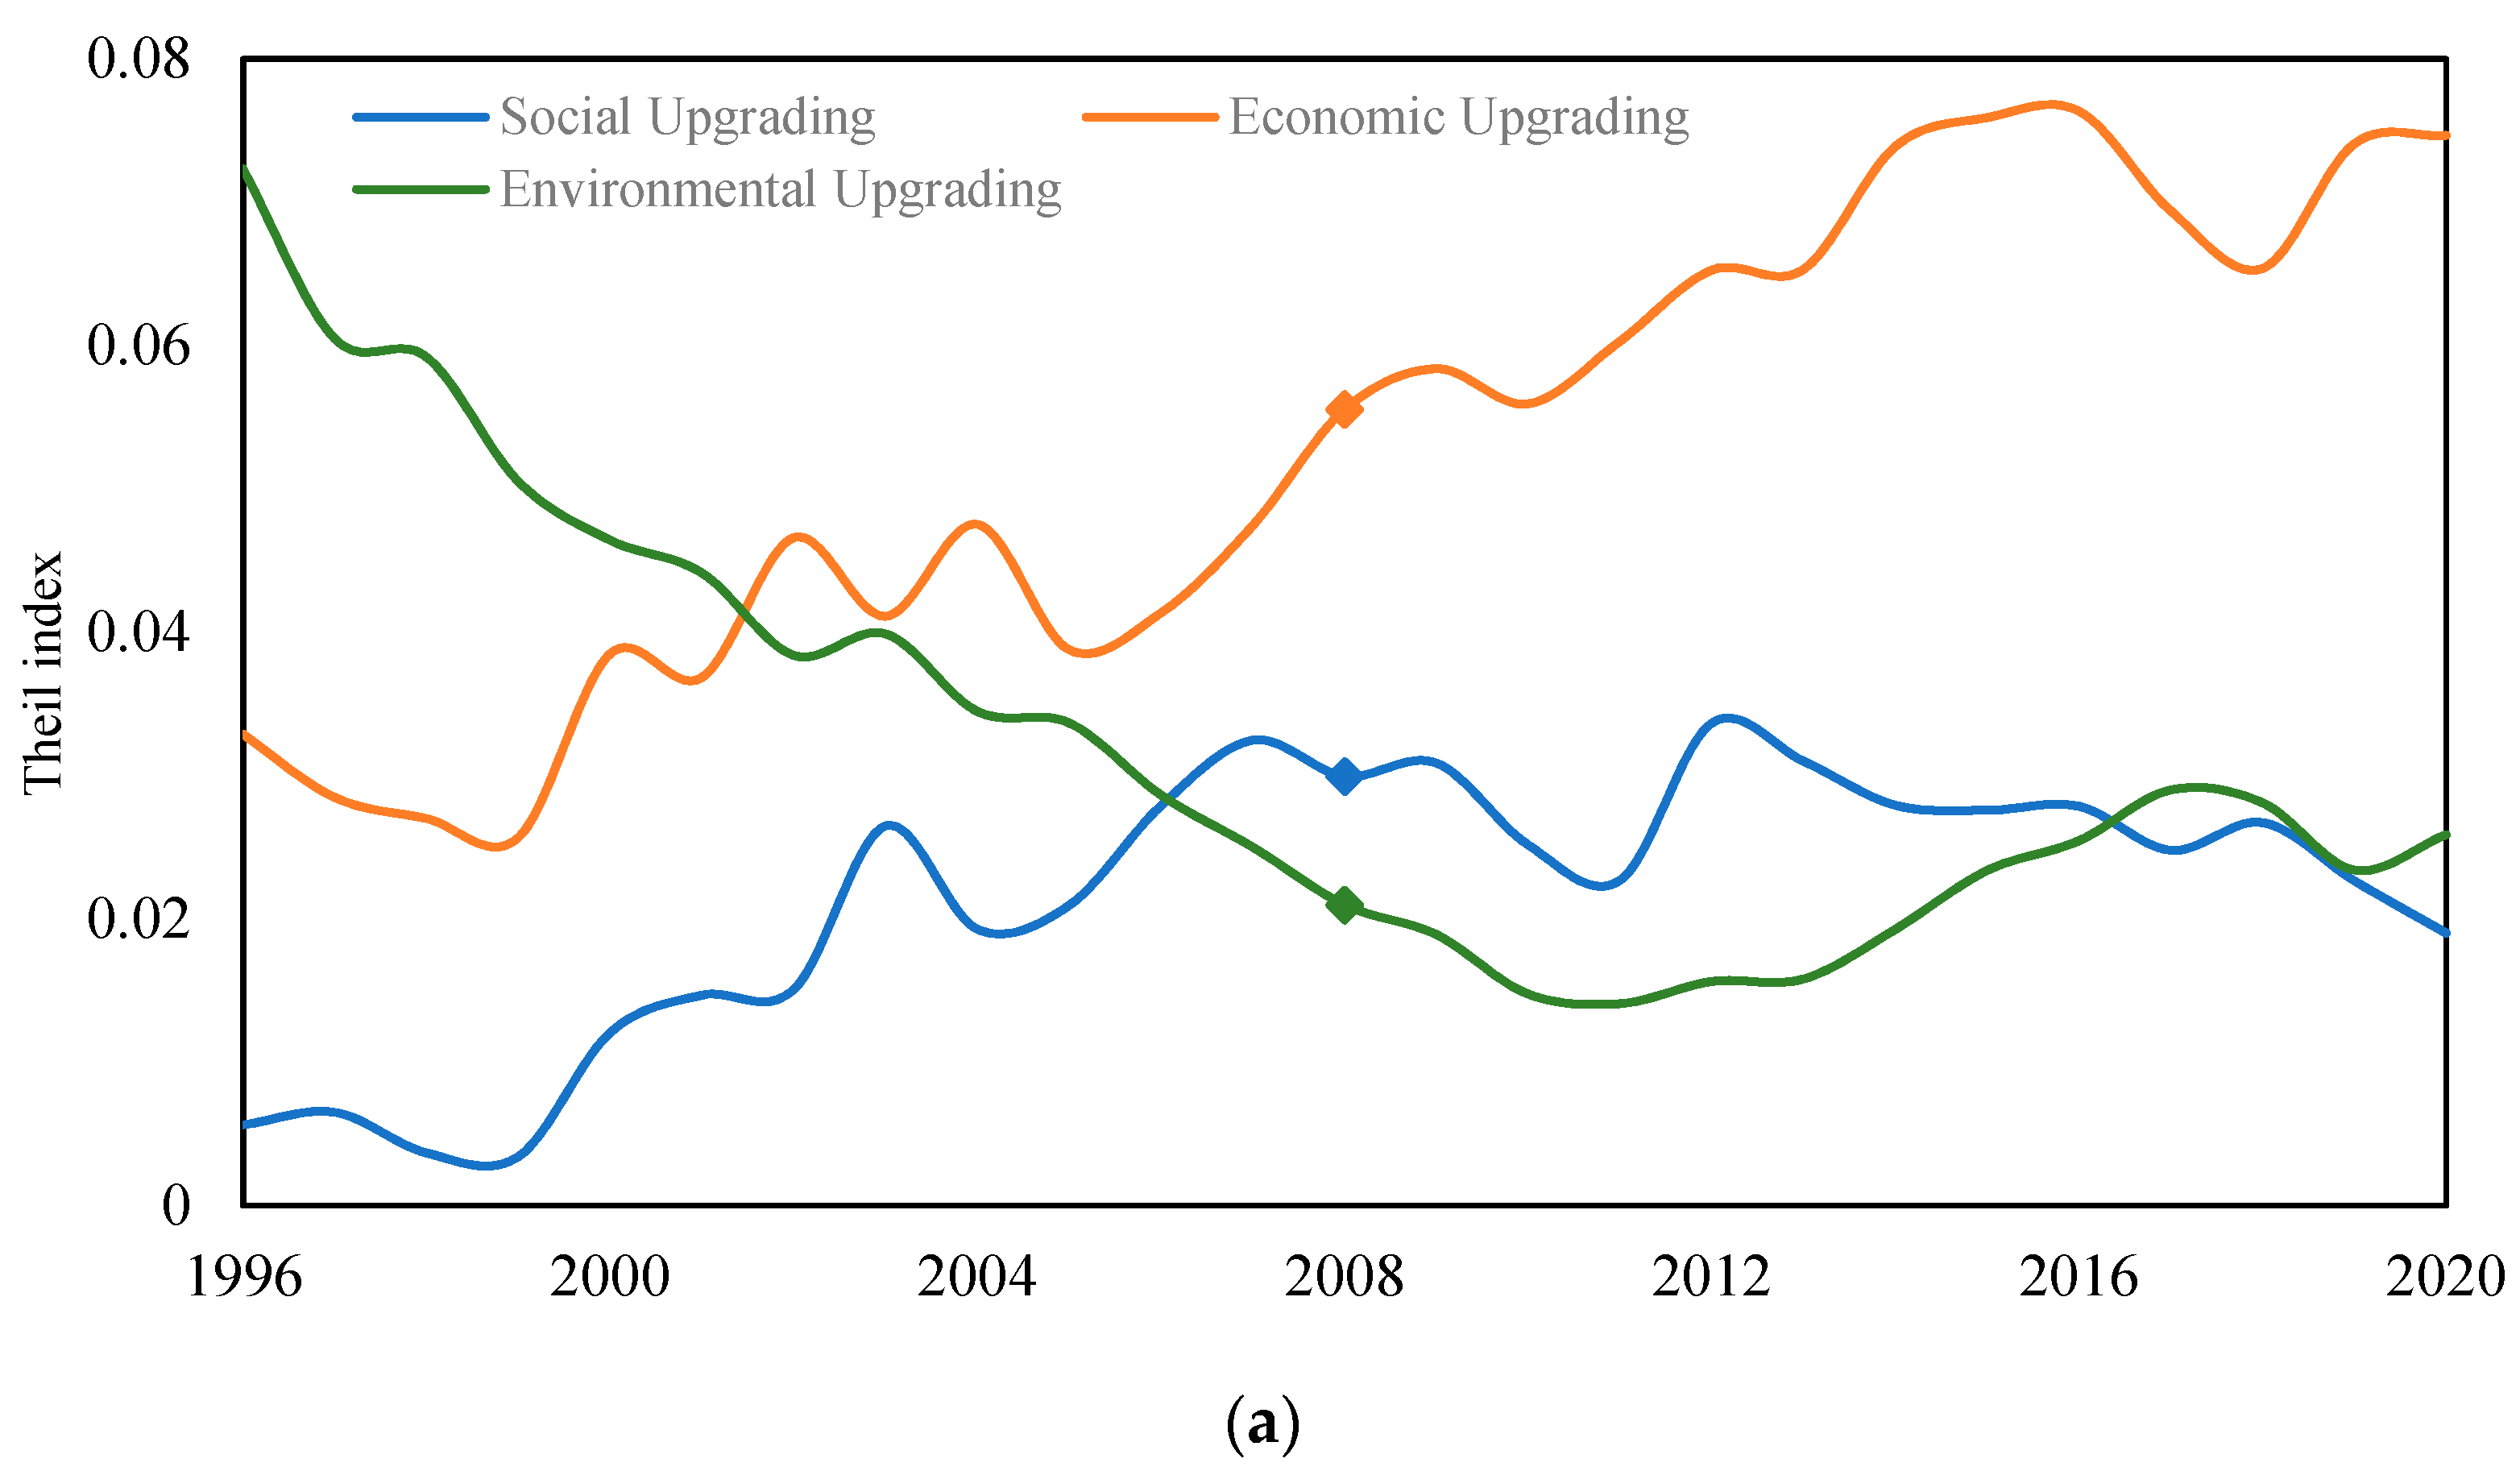
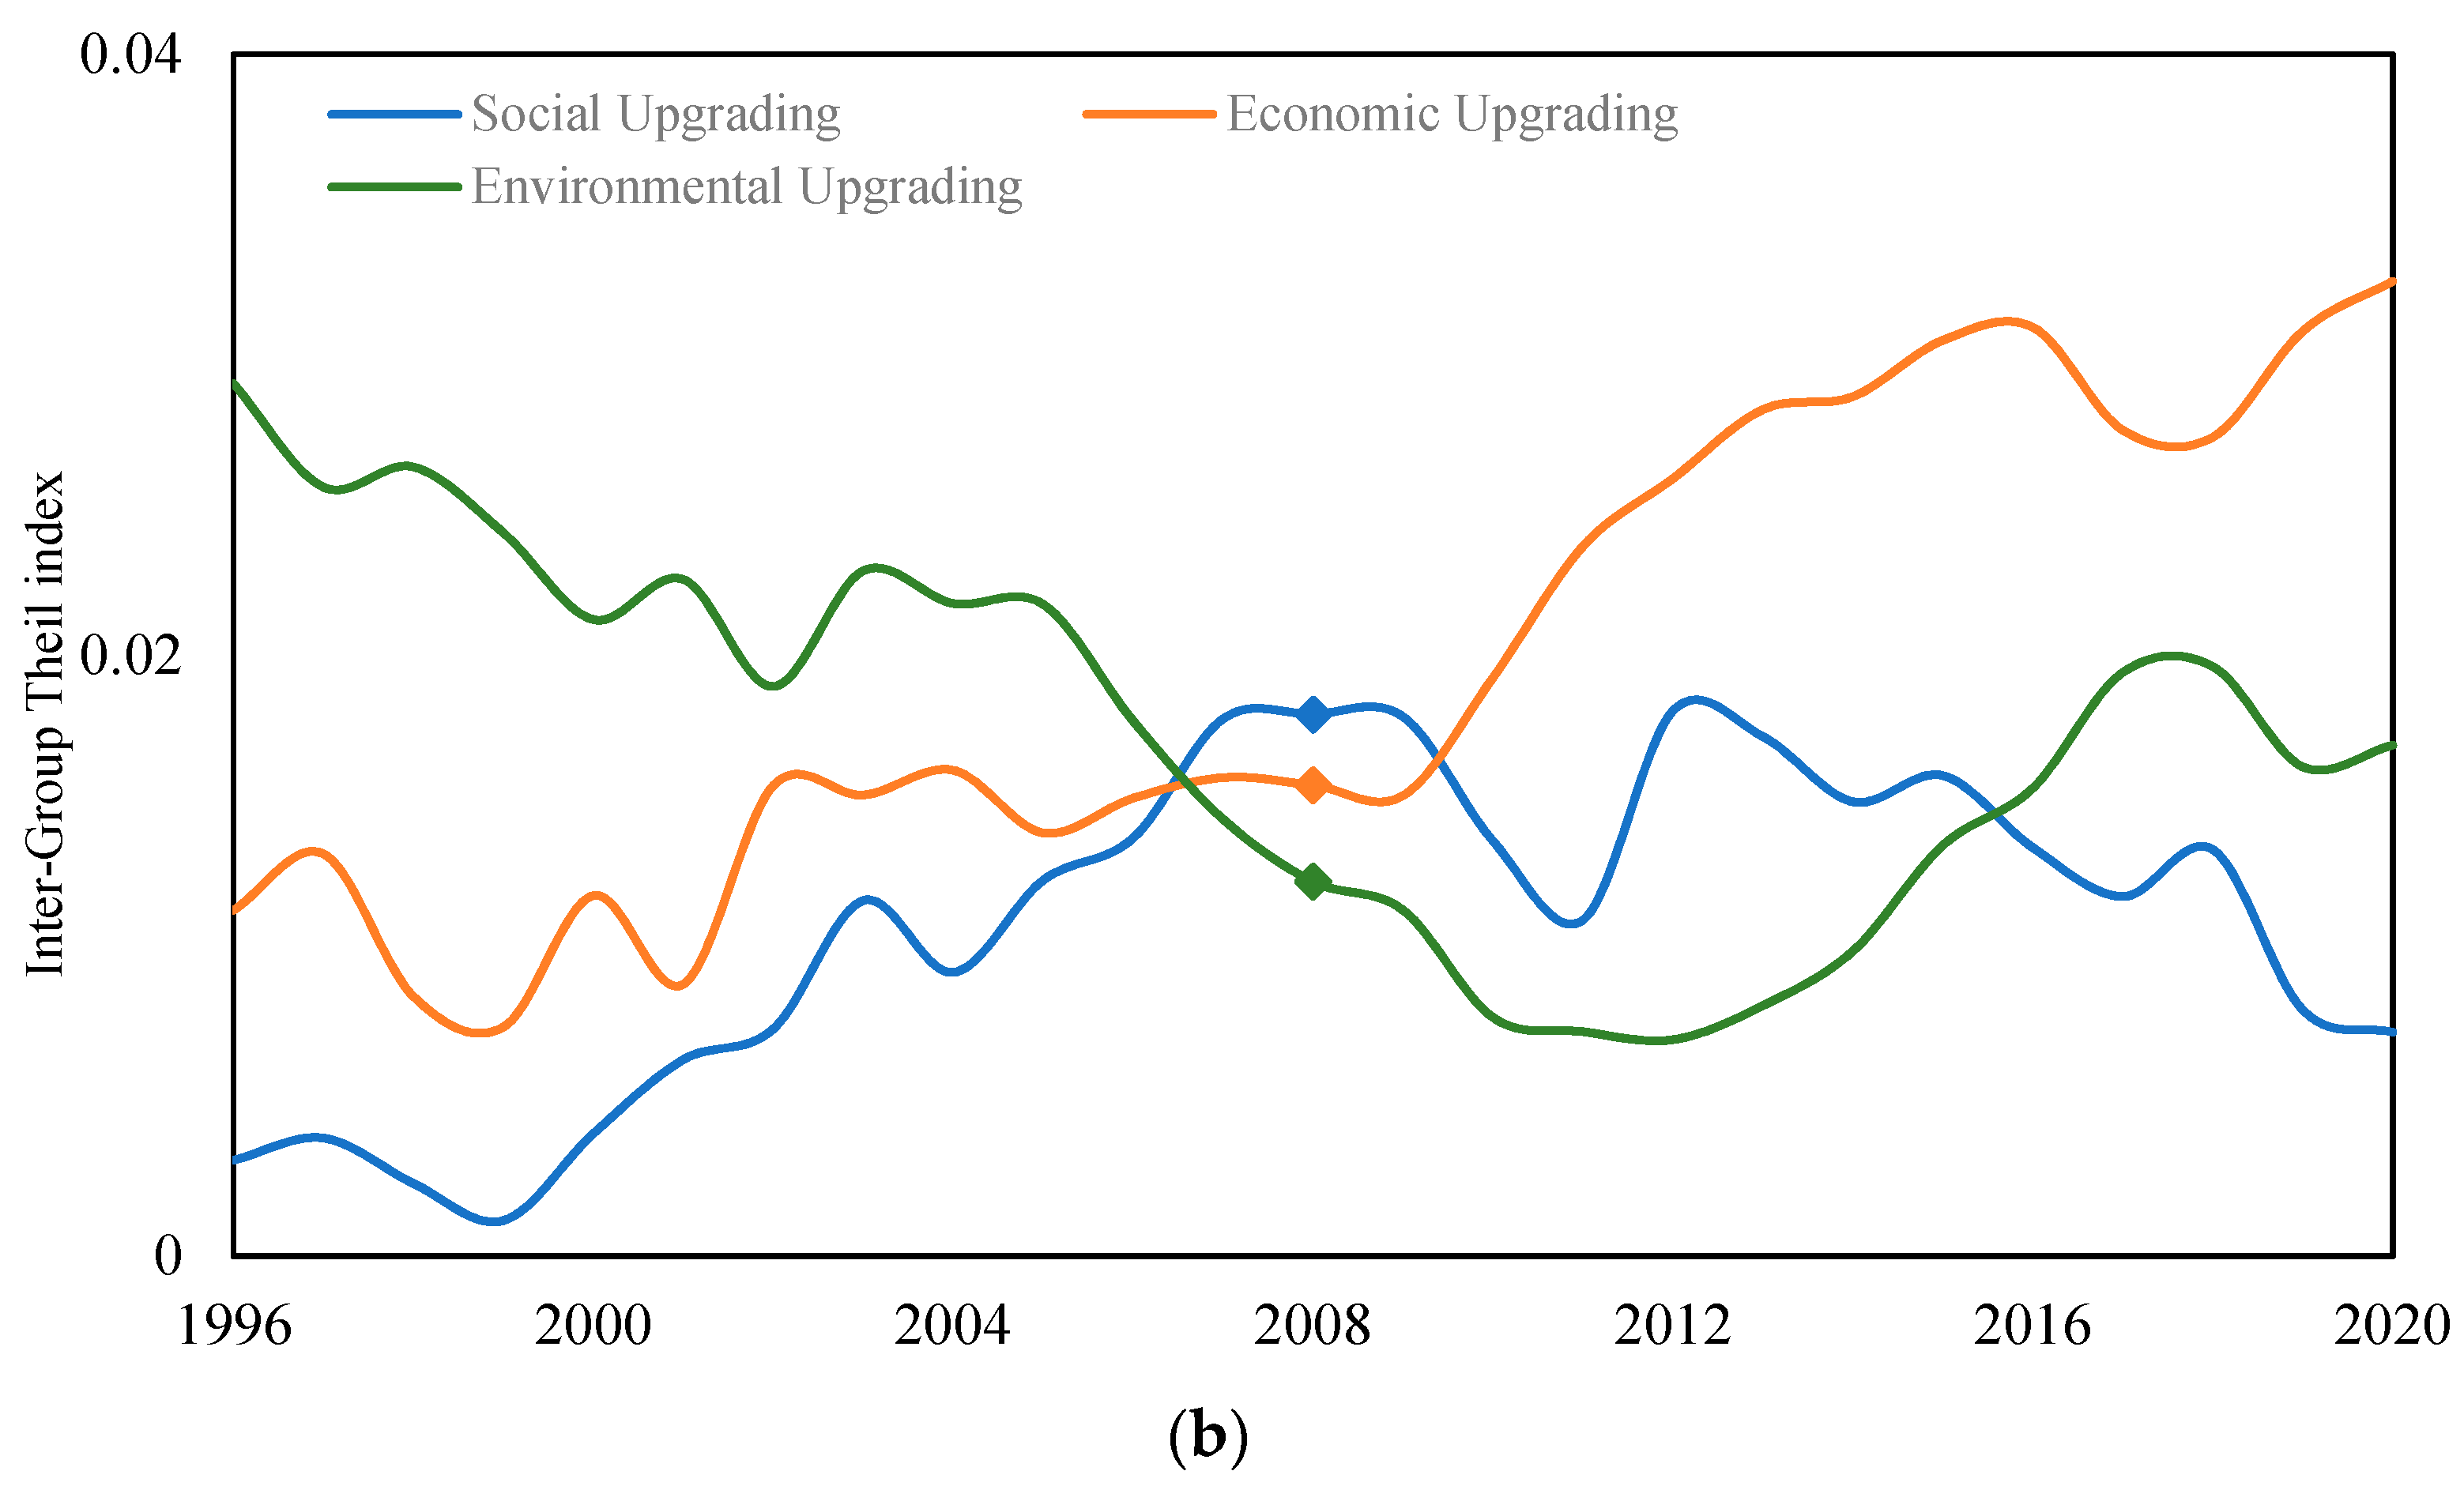
4.2. Regional Disparities in Economic, Social and Environmental Upgrading

Figure 2a illustrates that the regional disparities in economic upgrading are substantial and increasingly pronounced, indicating that developed regions have a stronger capacity for economic upgrading compared to underdeveloped areas. The disparities in social upgrading are relatively minor and stable, with an upward trend followed by a decrease after the 2008 economic crisis, but overall, the differences among regions remain small. The range of regional differences in environmental upgrading is notable, showing a decreasing trend in the early stages of the economic crisis and subsequently a gentle increase. Overall, these disparities are relatively minor and comparable to those in social upgrading. Integrating the insights from Figure 1 and Figure 2a reveals that despite the ongoing development in social upgrading in China since 2002, there has been no intensification of regional disparities. The issue of geographical imbalance in social upgrading is less significant compared to economic upgrading. The spatial disparities in environmental upgrading, after the economic crisis, are comparable to those in social upgrading but significantly lesser than in economic upgrading (Figure 2b). From the perspective of inter-group disparities, the greatest disparities in economic upgrading are observed among the eastern, central, western, and northeastern regions, with the eastern region significantly outpacing the others in terms of economic development. Among the remaining regions, the northeast exhibits comparatively rapid progress and a higher degree of economic advancement, while the central region marginally surpasses the west, though the difference is minimal. In terms of social upgrading, the eastern region also leads, with the northeast and central regions displaying similar levels that are collectively higher than the western region. However, the variation across all four regions is less pronounced in social upgrading compared to economic upgrading. For environmental upgrading, the eastern region again ranks highest, followed by the central region, which exceeds both the northeast and the west. Nevertheless, the regional disparities in environmental upgrading are still lower on average than those in economic upgrading. Moreover, the extent of regional differences in economic upgrading significantly increased after the economic crisis, and the regional disparities in environmental upgrading also noticeably intensified in the years following the crisis, whereas the inter-group disparities in social upgrading align with the overall trend of differences (Figure 2b).
Due to the significant influence of marketization factors, economic upgrading tends to foster regional imbalances in development under the impact of agglomeration effects [71]. In contrast, social and environmental upgrading are more heavily regulated by governmental and institutional factors. For example, the Chinese government, by refining labor contract laws and environmental protection regulations, has enhanced the protection of labor rights and the strength of ecological preservation, thereby restraining the exploitation of labor and pollution of the environment by capital [78]. These governmental interventions contribute to the regional equilibrium in social and environmental upgrading. However, compared to social upgrading, environmental upgrading is more closely tied to the process of economic upgrading. After the economic crisis, the developed coastal regions in the east underwent industrial upgrading, accompanied by the spatial relocation of labor-intensive and high-pollution industries. The acceptance of low value-added and high-pollution industries transferred from the eastern region by less developed areas outside the eastern region has led to an exacerbation of disparities in both economic and environmental upgrading compared to the eastern region. This shift consequently intensified the inter-group disparities in both economic and environmental upgrading.

4.3. Granger Causality Test for Economic, Social and Environmental Upgrading

This study utilizes the Granger causality test model to examine the causal interactions among economic, social, and environmental upgrading. The unit root test was conducted for these three variables, and upon application of the Levin–Lin–Chu (LLC) and augmented Dickey–Fuller (ADF) tests, it was determined that cointegration could only be achieved at the first difference sequence. Subsequently, a cointegration test was conducted, and the Engle–Granger two-step method confirmed a cointegration relationship among the three variables, warranting a Granger causality analysis [79]. The results (Table 6) indicate that social upgrading (SocU), economic upgrading (EcoU), and environmental upgrading (EnvU) can be considered mutual Granger causes within lag periods of two to four, revealing the interactive relationships among them.

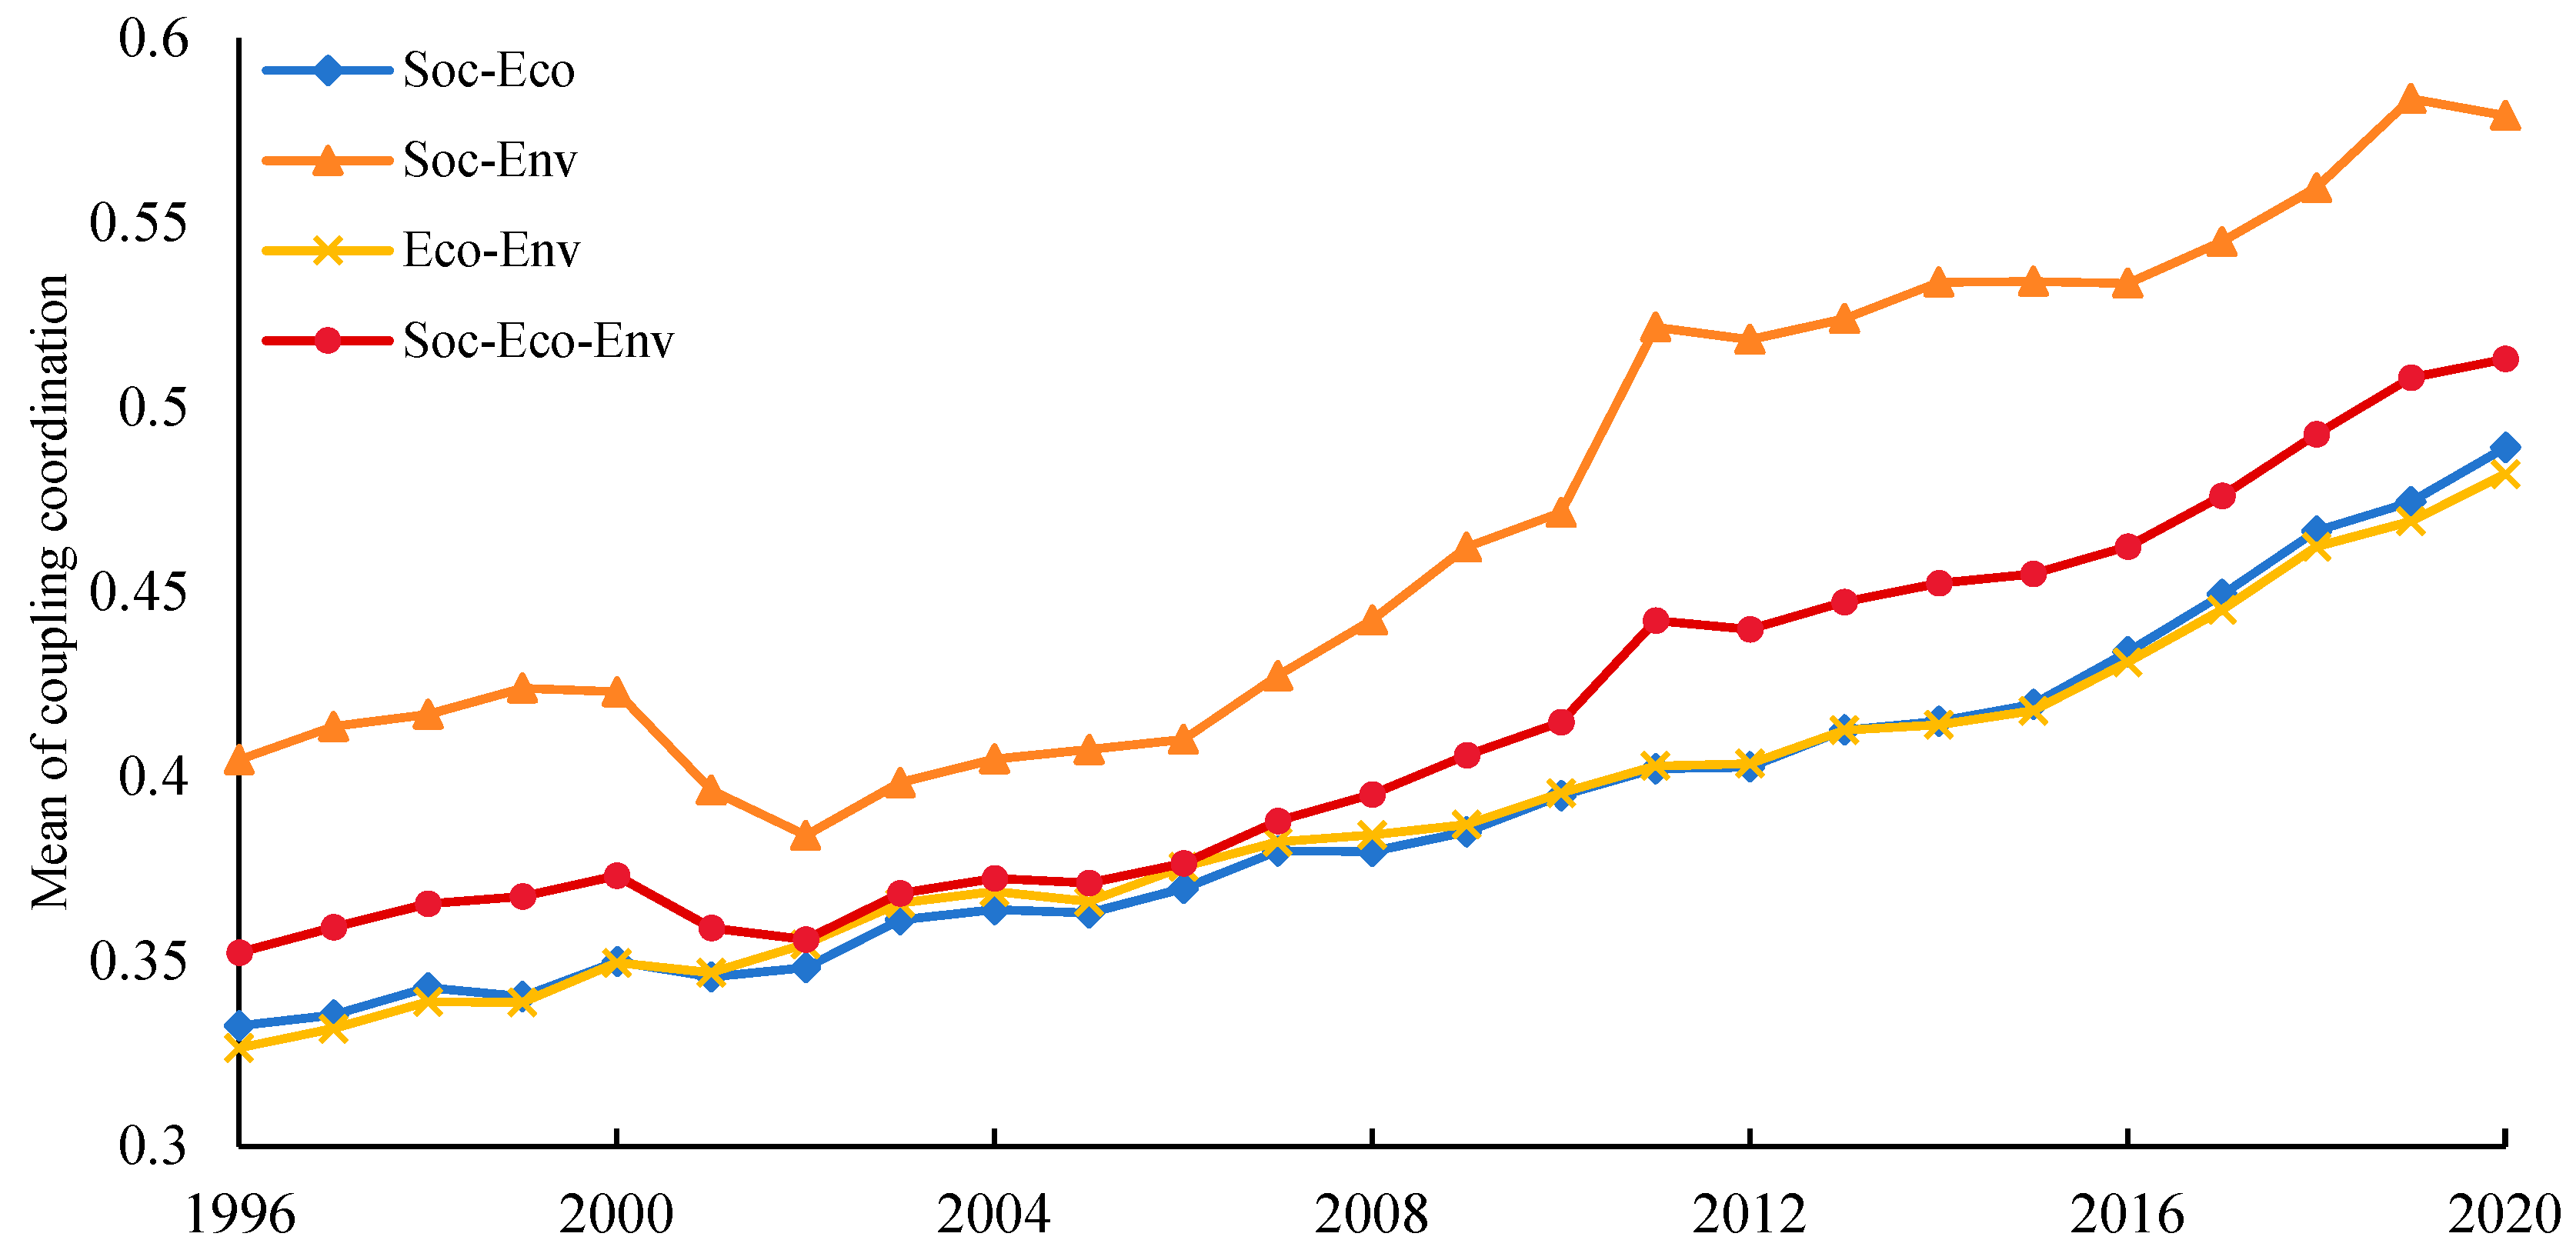
4.4. The Degree of Coupling Coordination of Economic, Social and Environmental Upgrading

Figure 3 reveals a clear trend in the development of the coupling coordination degree between economic, social, and environmental upgrading. The coupling coordination degree of social–economic (Soc–Eco), social–environmental (Soc–Env), and economic–environmental (Eco–Env) upgrading have, respectively, increased from 0.40 to 0.58, from 0.33 to 0.49, and from 0.33 to 0.48. However, the trajectory of Soc–Env shows a marked difference compared to the other pairs. The overall trend of the Soc–Env coupling coordination stage has been fluctuating, experiencing a dip to a moderate imbalance level between 1996 and 2002, followed by a consistent rise to approach a moderate coordination stage by 2020. Before 2002, the development trends of social and environmental upgrading, which Soc–Env represents, were inversely related. With China’s preliminary establishment of an environmental regulatory framework in the 1990s and the implementation of initiatives like “One Order, Two Goals” policies (the “One Order, Two Goals” policies are the environmental regulation adopted by the Chinese government to reduce pollution. The term “One Order” implies the enforcement of total emission control for pollutants, mandating that emissions from industrial sources comply with either national or regional standards. “Two Goals” refers to the requirement that the environmental air and surface water quality in cities directly under the central government, provincial capitals, cities in special economic zones, coastal open cities, and key tourist cities, adhere to specific national standards designated for different functional zones. https://www.gov.cn/guoqing/2012-04/10/content_2584066.htm (accessed on 10 November 2023)) after 1996, continuous environmental upgrading occurred. In contrast, the wave of marketization reforms and layoffs in state-owned enterprises led to a short-term decline in Soc–Env coordination due to social downgrading. After 2002, with the ongoing occurrence of social and environmental upgrading (as depicted in Figure 1), the Soc–Env coordination steadily improved. Over twenty-five years, both the Soc–Eco and Eco–Env coordination levels evolved from a moderate imbalance to a low coordination stage, with their development trends largely converging. The stable increase in the coupling coordination of economic upgrading with the other types reflects China’s transition from an economy-centric to a high-quality development model.
The coupling coordination degree of economic, social, and environmental upgrading (Soc–Eco–Env) increased from a moderate imbalance level of 0.35 to a low coordination level of 0.51 over a span of 25 years (Figure 3). This evolution was marked by a declining trend prior to 2002 due to factors like social downgrading (as illustrated in Figure 1), followed by a notable ascending trend thereafter. On one hand, economic upgrading has been a critical driver for social and environmental upgrading. Persistent profits not only stimulate vitality among various entities, leading to social and environmental upgrading in the primary distribution phase but also provide the economic foundation for labor welfare and environmental compensation in the secondary distribution phase. Alongside marketization reforms and China’s accession to the WTO, the continuous emergence of economic upgrading has been ensured, while the establishment of labor contract laws and environmental protection regulations has guaranteed the genesis of social and environmental upgrading. On the other hand, social upgrading, by enhancing labor quality, has optimized the innovation environment and improved production efficiency [80]. Meanwhile, environmental upgrading, through green innovation, has not only increased efficiency and reduced energy consumption in production but also expanded the blue ocean market (the blue ocean market refers to a market that has little or no competition, and therefore offers high potential for growth and profits. It is a market where the existing rules of the game are irrelevant or can be changed by the actions and beliefs of the industry players. What Is Blue Ocean? Definition in Markets and Characteristics (investopedia.com) (accessed on 10 November 2023)), thereby bolstering the overall international competitiveness of the industry and providing a significant impetus for economic upgrading. Moreover, social upgrading has elevated labor rights, enabling workers to strive for a quality environment and engage in green innovation. Concurrently, environmental upgrading, through technological training, job expansion, and improved working conditions, has enhanced labor welfare and productivity [81,82], laying a foundation for the synergistic development of these three types of upgrading.

5. Factors Influencing the Coupling Coordination among Economic, Social, and Environmental Upgrading

5.1. Panel Regression Model Tests

The unit root problems in the data can lead to spurious regression results; hence, it is essential to conduct unit root tests. The Levin–Lin–Chu (LLC) and augmented Dickey–Fuller (ADF) tests (Table 7) reveal that the regression models achieve same-order integration at first difference. Utilizing the KAO and Pedroni test methods (Table 8) for cointegration testing confirms the existence of cointegration relationships within the regression models, justifying the use of panel regression analysis. During the panel model selection process, the F-test indicates the rejection of the mixed effects model, while the Hausman test suggests the adoption of the fixed effects model. Considering the significant regional disparities among provinces and the short panel nature of the data, individual fixed effects are employed for regression analysis.

5.2. Regression Results

Based on the ordinary least squares (OLS), fixed effects (FE), and feasible generalized least squares (FGLS) models, regression analysis was conducted, with the results presented in Table 9. The coefficient of the economic privatization variable was negative across all models at the 1% significance level, indicating that economic privatization adversely affects the coupling coordination of economic, social, and environmental upgrading. Non-state enterprises, often prioritizing economic benefits, tend to overlook labor welfare and environmental protection, making it more challenging for workers to advocate for their rights, including a clean working environment [83].
The coefficient of the economic globalization variable was significantly positive at the 1% level in models 2 and 3, suggesting that higher levels of economic globalization in a region are conducive to the coupling coordination of economic, social, and environmental upgrading. The influx of foreign capital provides ample employment opportunities and advanced environmental technologies and management styles. This also drives local enterprises to develop and improve labor rights through competitive effects [84], further promoting the development of green production modes [66], and aiding in the synergistic development of economic, social, and environmental upgrading.
The coefficient of the public governance variable was significantly positive at the 1% level, illustrating that strong governmental influence is beneficial for the coupling coordination of economic, social, and environmental upgrading. Adequate government finances not only facilitate effective subsidization of labor and environmental pollution control but also empower investment in regional industrial chain upgrading and integration, improving production technology, and promoting green production. This assists in transforming the benefits of economic upgrading into social and environmental upgrading, leading to their collective enhancement.
The coefficient of the legal environment variable was positively significant at the 1% level across all models, indicating that a sound legal environment is advantageous for the coupling coordination of economic, social, and environmental upgrading. A stable legal environment implies market stability, thus attracting capital and creating jobs while ensuring healthy internal market competition, beneficial for the protection of labor rights. The transparency and stability of the legal environment not only facilitate economic upgrading by reducing transaction costs but also internalize external costs like pollution, effectively driving corporate accountability and environmental upgrading.
The coefficient of the corporate violation variable was negatively significant at the 1% level, signifying that corporate illegal activities have a negative impact on the coupling coordination of economic, social, and environmental upgrading. Frequent corporate violations imply flaws in the local business environment, impeding industrial transformation and upgrading. Non-compliance with labor and environmental laws hinders the protection of labor rights and clean production process innovations, further obstructing the possibility of workers driving benefit innovation and green innovation and hindering the emergence of social and environmental upgrading.
The coefficient of the environmental regulation variable was positively significant at the 1% level, meaning environmental regulation positively influences the coupling coordination of economic, social, and environmental upgrading. On one hand, environmental regulation, by enhancing environmental protection legislation and enforcement, creates an economic and social system conducive to green production, such as corresponding green financial and other productive service industries [85], fostering an innovative environment and promoting economic upgrading. On the other hand, promoting green transformation also creates employment opportunities, provides training and management opportunities, enhances labor quality and rights, and improves the overall employment level [86,87], facilitating the synergistic development of social and environmental upgrading.

6. Discussion and Conclusions

6.1. Discussion

The empirical results of the Granger causality analysis in the article further corroborate the interactive relationships among economic upgrading, social upgrading, and environmental upgrading, as previously established in studies [6,27,88]. This addresses the gap in unified empirical research on economic, social, and environmental upgrading [30]. Moreover, it verifies that economic upgrading does not necessarily lead to social upgrading [12]. Social and environmental upgrading can be preemptively enhanced through top-down forces such as government intervention, rather than being driven by economic upgrading. The regional disparities in the results, especially after the economic crisis, reveal a significant divergence between the coastal eastern regions and other areas. This is attributed to the relocation of labor-intensive, highly polluting, and low-value-added industries from the eastern coastal areas to the inland, thereby widening the gap in terms of economic, social, and environmental upgrading. This phenomenon further confirms the “pollution haven hypothesis” [22] and highlights the evolving trend of industrial relocation from China’s eastern regions to other areas [89]. Contrary to previous studies [6,15], China, as the largest developing country, has not fallen into a predicament where economic upgrading is mutually constrained by social or environmental upgrading. Lastly, in the analysis of influencing factors, panel regression results show that top-down government governance, environmental regulation, and the strength of the state economy can effectively promote the coordinated development of local economic, social, and environmental upgrading, partially confirming existing research [27,88]. Additionally, the level of foreign investment also effectively fosters the development of local economic, social, and environmental upgrading, aligning with previous study conclusions [32,33,34].

6.2. Conclusions

In this study, the concepts of economic upgrading, social upgrading, and environmental upgrading are consolidated into an integrated analytical framework. This approach facilitates an examination of their interrelationships and determinants through a lens of coupling coordination, providing macro-level longitudinal empirical evidence of the triad’s interaction. This not only substantiates but also extends prior empirical inquiries into the dyadic relationships of the three types of upgrading, thus supplementing an empirical groundwork for future theoretical explorations into the dynamics and influencers of these interconnected upgrading. And the quantitative approach of this unified framework not only serves as a reference for empirical studies based on administrative units in other regions but also offers viable insights for a comparative and investigational platform concerning the unified coupling relationship of the three aspects. This progressively broadens the understanding and perception of the interactive effects of the three types of upgrading within the global production network. Through long-term evolutionary analysis, this method facilitates a more profound exploration of the mechanisms of interaction among the three types of upgrading and also provides a referential viewpoint for further investigation into their influencing factors. In recognition of the significant provincial disparities in China, this study enriches the diversity of research samples, thereby facilitating the validation of the interrelationships among the three types of upgrading. This approach yields more complex empirical results. Moreover, the Chinese case exemplifies the critical role of government action. The study reflects the tangible impacts of government governance, environmental regulation, and state economy in fostering social and economic upgrading, contributing insights to the sustainable development of global production networks, and offering reference for local governance in these three types of upgrading. The findings over the past quarter-century since 1996 underscore significant enhancements in economic, social, and environmental upgrading in China, with the coupling coordination degree rising from 0.35 to 0.51. This tangentially reflects the efficacy of China’s transition towards a paradigm of high-quality development. Two primary insights emerge at the level of regional disparities: first, the regional variances in economic upgrading surpass those in social and environmental upgrading, attributable to the latter’s susceptibility to national governance mechanisms. The coupling coordination of any two or all three of these upgrading has seen consistent augmentation, yet they linger in the low stage of coordination. Collectively, the interplay among these three types of upgrading in China is inclined towards a benign, synergistic evolution, with the interrelations between social–economic, economic–environmental, and economic–environmental upgrading exhibiting predominantly positive facilitative effects. The regression analyses elucidate that factors such as economic globalization, public governance, legal environments, and environmental regulations positively sway their coupling coordination degree, whereas variables like economic privatization and corporate violation have adverse effects. This suggests that promoting participation in global production networks, strengthening the role of public governance, and improving the quality of the institutional and regulatory environment can enhance the coupling coordination of economic, social, and environmental upgrading, thereby promoting socio-economic and ecologically sustainable development.
The research into the interrelations among these three types of upgrading is in essence an investigation into whether the amplification of labor rights and ecological environmental enhancements can reap the benefits of economic profit growth, aiming for more sustainable global production networks. We found that government intervention is key in balancing economic, social, and environmental development. Policymakers should enhance environmental regulation, improve monitoring technologies, and invest in eco-innovation. They should also create platforms for labor feedback and skill training to ensure sustainable regional development in global production networks. Businesses need a holistic approach, integrating economic efficiency with social and environmental responsibilities, like upskilling employees and developing cleaner technologies for market competitiveness. Moreover, our study offers a comprehensive framework for researchers to understand the interplay between economic, social, and environmental upgrading in global production networks, serving as a methodological and empirical reference for further research in this field. Future scholarly endeavors might probe deeper into the interplay of these three types of upgrading across diverse regional contexts and how this interplay unfolds at the firm level. Through comparative research, efforts should be directed to uncover factors conducive to the coupling coordination of economic, social, and environmental upgrading, seeking policy frameworks and institutional arrangements at various scales—national, regional, and corporate—that support their harmonious and coordinated progression.

Author Contributions

Conceptualization, G.H.; Methodology, B.C. and J.Y.; Formal analysis, B.C.; Validation, G.H., B.C. and J.Y.; Data curation, J.Y.; Writing—original draft preparation, B.C.; Writing—review & editing, G.H.; Supervision, G.H.; Funding acquisition, G.H. All authors have read and agreed to the published version of the manuscript.

Funding

This research was funded by the National Natural Science Foundation of China (grant number 42122007).

Institutional Review Board Statement

Not applicable.

Informed Consent Statement

Not applicable.

Data Availability Statement

The data used in the study are available from the corresponding author upon request.

Conflicts of Interest

The authors declare that they have no conflicts of interest.

References

  1. Gereffi, G.; Lee, J. Economic and social upgrading in global value chains and industrial clusters: Why governance matters. J. Bus. Ethics 2016, 133, 25–38. [Google Scholar] [CrossRef]
  2. Gereffi, G. International trade and industrial upgrading in the apparel commodity chain. J. Int. Econ. 1999, 48, 37–70. [Google Scholar] [CrossRef]
  3. Coe, N.M. Geographies of production III: Making space for labour. Prog. Hum. Geogr. 2013, 37, 271–284. [Google Scholar] [CrossRef]
  4. Huang, G.Z.; Zhou, J. A review of international research on social upgrading and its implications for China. Hum. Geogr. 2021, 36, 15–23,+107. Available online: https://link.cnki.net/doi/10.13959/j.issn.1003-2398.2021.03.003 (accessed on 10 November 2023). (In Chinese).
  5. Milberg, W.; Winkler, D. Economic and social upgrading in global production networks: Problems of theory and measurement. Int. Labour Rev. 2011, 150, 341–365. [Google Scholar] [CrossRef]
  6. Khan, M.J.; Ponte, S.; Lund-Thomsen, P. The ‘Factory Manager Dilemma’: Purchasing practices and environmental upgrading in apparel global value chains. Environ. Plan. A Econ. Space 2020, 52, 766–789. [Google Scholar] [CrossRef]
  7. De Marchi, V.; Di Maria, E.; Ponte, S. The greening of global value chains: Insights from the furniture industry. Compet. Chang. 2013, 17, 299–318. [Google Scholar] [CrossRef]
  8. Krauss, J.E.; Krishnan, A. Global decisions versus local realities: Sustainability standards, priorities and upgrading dynamics in agricultural global production networks. Glob. Netw. 2022, 22, 65–88. [Google Scholar] [CrossRef]
  9. Mashilo, A.M.; Webster, E. Upgrading in automotive global production networks: Workers’ power in South Africa. J. Labor Soc. 2021, 24, 525–555. [Google Scholar] [CrossRef]
  10. Krishnan, A. The origin and expansion of regional value chains: The case of Kenyan horticulture. Glob. Netw. 2018, 18, 238–263. [Google Scholar] [CrossRef]
  11. Golini, R.; De Marchi, V.; Boffelli, A.; Kalchschmidt, M. Which governance structures drive economic, environmental, and social upgrading? A quantitative analysis in the assembly industries. Int. J. Prod. Econ. 2018, 203, 13–23. [Google Scholar] [CrossRef]
  12. Lee, J.; Gereffi, G. Global value chains, rising power firms and economic and social upgrading. Crit. Perspect. Int. Bus. 2015, 11, 319–339. [Google Scholar] [CrossRef]
  13. Bernhardt, T.; Milberg, W. Does Economic Upgrading Generate Social Upgrading? Insights from the Horticulture, Apparel, Mobile Phones and Tourism Sectors. Available online: https://papers.ssrn.com/sol3/papers.cfm?abstract_id=1987694 (accessed on 10 November 2023).
  14. Milberg, W.; Winkler, D. Outsourcing Economics: Global Value Chains in Capitalist Development; Cambridge University Press: Cambridge, UK, 2013; pp. 262–271. [Google Scholar]
  15. Bernhardt, T.; Pollak, R. Economic and social upgrading dynamics in global manufacturing value chains: A comparative analysis. Environ. Plan. A Econ. Space 2016, 48, 1220–1243. [Google Scholar] [CrossRef]
  16. Sproll, M. Social upgrading in global value chains from a perspective of gendered and intersectional social inequalities. In Economic and Social Upgrading in Global Value Chains: Comparative Analyses, Macroeconomic Effects, the Role of Institutions and Strategies for the Global South; Teipen, C., Ed.; Springer International Publishing: Berlin, Germany, 2022; pp. 145–169. [Google Scholar]
  17. Butollo, F. Moving Beyond cheap labour? Industrial and social upgrading in the garment and LED industries of the Pearl River Delta. J. Curr. Chin. Aff. 2013, 42, 139–170. [Google Scholar] [CrossRef]
  18. Ahmed, N.; Nathan, D. Capturing the Gains: Improving Wages and Working Conditions in the Bangladeshi Garment Sector: The Role of Horizontal and Vertical Relations. Available online: https://www.cambridge.org/core/books/abs/labour-in-global-value-chains-in-asia/improving-wages-and-working-conditions-in-the-bangladesh-garment-sector-the-role-of-horizontal-and-vertical-relations/E78153E2B76C44E173A361996432FDB2 (accessed on 10 November 2023).
  19. Mulubiran, T.F.; Karlsen, A. The role of local stakeholders in transforming economic upgrading into social upgrading in Ethiopian textile and garment firms. Int. Labour Rev. 2023, 162, 45–67. [Google Scholar] [CrossRef]
  20. Pyke, F.; Lund-Thomsen, P. Social upgrading in developing country industrial clusters: A reflection on the literature. Compet. Chang. 2016, 20, 53–68. [Google Scholar] [CrossRef]
  21. Qi, G.; Wang, Z.; Wang, Z.; Wei, L. Has industrial upgrading improved air pollution? Evidence from China’s digital economy. Sustainability 2022, 14, 8967. [Google Scholar] [CrossRef]
  22. Wei, D.; Liu, Y.; Zhang, N. Does industry upgrade transfer pollution: Evidence from a natural experiment of Guangdong Province in China. J. Clean. Prod. 2019, 229, 902–910. [Google Scholar] [CrossRef]
  23. Poulsen, R.T.; Ponte, S.; Sornn-Friese, H. Environmental upgrading in global value chains: The potential and limitations of ports in the greening of maritime transport. Geoforum 2018, 89, 83–95. [Google Scholar] [CrossRef]
  24. Goger, A. The making of a ‘business case’ for environmental upgrading: Sri Lanka’s eco-Factories. Geoforum 2013, 47, 73–83. [Google Scholar] [CrossRef]
  25. Dercon, S. Is green growth good for the poor? World Bank Res. Obs. 2014, 29, 163–185. [Google Scholar] [CrossRef]
  26. Braun-Munzinger, C. Chinese CSR standards and industrial policy in GPNs. Crit. Perspect. Int. Bus. 2019, 16, 165–185. [Google Scholar] [CrossRef]
  27. Khattak, A.; Farida, S. Environmental upgrading leading to social upgrading in global value chains: Evidence from Bangladesh and Sri Lanka upgrading the global garment industry. In Upgrading The Global Garment Industry: Internationalization, Capabilities And Sustainability; Rana, M.B., Allen, M.M.C., Eds.; Edward Elgar Publishing: London, UK, 2021; p. 235. [Google Scholar]
  28. Dannenberg, P.; Revilla Diez, J.; Schiller, D. Spaces for integration or a divide? New-generation growth corridors and their integration in global value chains in the Global South. Z. Wirtsch. 2018, 62, 135–151. [Google Scholar] [CrossRef]
  29. De Marchi, V.; Di Maria, E.; Micelli, S. Environmental Upgrading in Global Production Network. Available online: http://www.dukeviuworkshop.org/index.php?option=com_content&view=article&id=26 (accessed on 20 July 2011).
  30. Khattak, A.; Pinto, L. A systematic literature review of the environmental upgrading in global value chains and future research agenda. J. Distrib. Sci. 2018, 16, 11–19. [Google Scholar] [CrossRef]
  31. Huang, G.Z.; Zhou, J. Measurement, spatiotemporal pattern and driving mechanism of social upgrading in China. Acta Geogr. Sin. 2021, 76, 3043–3060. (In Chinese) [Google Scholar] [CrossRef]
  32. Shahid, R.; Shahid, H.; Shijie, L.; Jian, G. Developing nexus between economic opening-up, environmental regulations, rent of natural resources, green innovation, and environmental upgrading of China-empirical analysis using ARDL bound-testing approach. Innov. Green Dev. 2024, 3, 100088. [Google Scholar] [CrossRef]
  33. Reinecke, G.; Posthuma, A. The link between economic and social upgrading in global supply chains: Experiences from the Southern Cone. Int. Labour Rev. 2019, 158, 677–703. [Google Scholar] [CrossRef]
  34. Danish, M.; Khattak, A. Economic and social upgrading of firms in football global value chains. J. Distrib. Sci. 2020, 18, 97–106. [Google Scholar] [CrossRef]
  35. Sako, M.; Zylberberg, E. Supplier strategy in global value chains: Shaping governance and profiting from upgrading. Socio-Econ. Rev. 2019, 17, 687–707. [Google Scholar] [CrossRef]
  36. Ivarsson, I.; Alvstam, C.G. Upgrading in global value-chains: A case study of technology-learning among IKEA-suppliers in China and Southeast Asia. J. Econ. Geogr. 2011, 11, 731–752. [Google Scholar] [CrossRef]
  37. De Marchi, V.; Alford, M. State policies and upgrading in global value chains: A systematic literature review. J. Int. Bus. Policy 2022, 5, 88–111. [Google Scholar] [CrossRef]
  38. Jensen, F.; Whitfield, L. Leveraging participation in apparel global supply chains through green industrialization strategies: Implications for low-income countries. Ecol. Econ. 2022, 194, 107331. [Google Scholar] [CrossRef]
  39. Riisgaard, L.; Lund-Thomsen, P.; Coe, N.M. Multistakeholder initiatives in global production networks: Naturalizing specific understandings of sustainability through the better cotton initiative. Glob. Netw. 2020, 20, 211–236. [Google Scholar] [CrossRef]
  40. Zhang, G.; Zhang, P.; Zhang, Z.G.; Li, J. Impact of environmental regulations on industrial structure upgrading: An empirical study on Beijing-Tianjin-Hebei region in China. J. Clean. Prod. 2019, 238, 117848. [Google Scholar] [CrossRef]
  41. Fankhauser, S.; Jotzo, F. Economic growth and development with low-carbon energy. Wiley Interdiscip. Rev. Clim. Change 2018, 9, e495. [Google Scholar] [CrossRef]
  42. Wentink, C.R.; Raemaekers, S.; Bush, S.R. Co-governance and upgrading in the South African small-scale fisheries value chain. Marit. Stud. 2017, 16, 5. [Google Scholar] [CrossRef]
  43. Ansari, M.R.; Mussida, C.; Pastore, F. Note on Lilien and modified Lilien index. Stata J. 2014, 14, 398–406. [Google Scholar] [CrossRef]
  44. Barrientos, S.; Gereffi, G.; Rossi, A. Economic and social upgrading in global production networks: A new paradigm for a changing world. Int. Labour Rev. 2011, 150, 319–340. [Google Scholar] [CrossRef]
  45. Krishnan, A.; De Marchi, V.; Ponte, S. Environmental upgrading and downgrading in global value chains: A framework for analysis. Econ. Geogr. 2023, 99, 25–50. [Google Scholar] [CrossRef]
  46. Khattak, A.; Stringer, C.; Benson-Rea, M.; Haworth, N. Environmental upgrading of apparel firms in global value chains: Evidence from Sri Lanka. Compet. Change 2015, 19, 317–335. [Google Scholar] [CrossRef]
  47. Shahid, R.; Shijie, L.; Yifan, N.; Jian, G. Pathway to green growth: A panel-ARDL model of environmental upgrading, environmental regulations, and GVC participation for the Chinese manufacturing industry. Front. Environ. Sci. 2022, 10, 1206. [Google Scholar] [CrossRef]
  48. Shahid, R.; Li, S.; Gao, J.; Altaf, M.A.; Jahanger, A.; Shakoor, A. The carbon emission trading policy of China: Does it really boost the environmental upgrading? Energies 2022, 15, 6065. [Google Scholar] [CrossRef]
  49. Lu, H.; Zhao, Y.; Zhou, X.; Wei, Z. Selection of agricultural machinery based on improved CRITIC-entropy weight and GRA-TOPSIS method. Processes 2022, 10, 266. [Google Scholar] [CrossRef]
  50. Zhang, F.; Xu, N.; Wang, C.; Guo, M.; Kumar, P. Multi-scale coupling analysis of urbanization and ecosystem services supply-demand budget in the Beijing-Tianjin-Hebei region, China. J. Geogr. Sci. 2023, 33, 340–358. [Google Scholar] [CrossRef]
  51. Wang, S.J.; Kong, W.; Ren, L.; Zhi, D.-D.; Dai, B.-T. Research on misuses and modification of coupling coordination degree model in China. J. Nat. Resour. 2021, 36, 793–810. [Google Scholar] [CrossRef]
  52. Wang, C.; Wang, X.; Wang, Y.; Zhan, J.; Chu, X.; Teng, Y.; Liu, W.; Wang, H. Spatio-temporal analysis of human wellbeing and its coupling relationship with ecosystem services in Shandong Province, China. J. Geogr. Sci. 2023, 33, 392–412. [Google Scholar] [CrossRef]
  53. Huang, J.C.; Ying, N.; Yu, G. Spatiotemporal characteristics and driving mechanism of the coupling coordination degree of urbanization and ecological environment in Kazakhstan. J. Geogr. Sci. 2020, 30, 1802–1824. [Google Scholar] [CrossRef]
  54. Chen, X.; Meng, Q.; Wang, K.; Liu, Y.; Shen, W. Spatial patterns and evolution trend of coupling coordination of pollution reduction and carbon reduction along the Yellow River Basin, China. Ecol. Indic. 2023, 154, 110797. [Google Scholar] [CrossRef]
  55. Hartvigsen, M. Land reform and land fragmentation in Central and Eastern Europe. Land Use Policy 2014, 36, 330–341. [Google Scholar] [CrossRef]
  56. Ying, L.G. China’s changing regional disparities during the reform period. Econ. Geogr. 1999, 75, 59–70. [Google Scholar] [CrossRef]
  57. Dumitrescu, E.I.; Hurlin, C. Testing for Granger non-causality in heterogeneous panels. Econ. Model. 2012, 29, 1450–1460. [Google Scholar] [CrossRef]
  58. Musau, V.M.; Waititu, A.G.; Wanjoya, A.K. Modeling panel data: Comparison of GLS estimation and robust covariance matrix estimation. Am. J. Theor. Appl. Stat. 2015, 4, 185–191. [Google Scholar] [CrossRef]
  59. Yin, K.; Miao, Y.; Huang, C. Environmental regulation, technological innovation, and industrial structure upgrading. Energy Environ. 2022. [Google Scholar] [CrossRef]
  60. Li, M.; Guan, S. Does China’s state-owned sector lead industrial transformation and upgrading? J. Clean. Prod. 2022, 338, 130412. [Google Scholar] [CrossRef]
  61. Arnold, D. The impact of privatization of state-owned enterprises on workers. Am. Econ. J. Appl. Econ. 2022, 14, 343–380. [Google Scholar] [CrossRef]
  62. Wang, Q.; Liu, M.; Zhang, B. Do state-owned enterprises really have better environmental performance in China? Environmental regulation and corporate environmental strategies. Resour. Conserv. Recycl. 2022, 185, 106500. [Google Scholar] [CrossRef]
  63. Wang, X.L.; Hu, L.P.; Fan, G. Marketization Index of China’s Provinces: NERI Report 2021; Social Sciences Academic Press: Beijing, China, 2021; pp. 202–248. (In Chinese) [Google Scholar]
  64. Jindra, B.; Hatani, F.; Steger, T.; Hiemer, J. Social upgrading and cooperative corporate social responsibility in global value chains: The case of Fairphone in China. Glob. Netw. 2019, 19, 371–393. [Google Scholar] [CrossRef]
  65. Ruwanpura, K.N. Garments without guilt? Uneven labour geographies and ethical trading: Sri Lankan labour perspectives. J. Econ. Geogr. 2016, 16, 423–446. [Google Scholar] [CrossRef]
  66. Lund-Thomsen, P.; Pillay, R.G. CSR in industrial clusters: An overview of the literature. Corp. Gov. Int. J. Bus. Soc. 2012, 12, 568–578. [Google Scholar] [CrossRef]
  67. Wang, E.; Cao, Q.; Ding, Y.; Sun, H. Fiscal decentralization, government environmental preference and industrial green transformation. Sustainability 2022, 14, 14108. [Google Scholar] [CrossRef]
  68. Liu, J.; Zhao, M.; Wang, Y. Impacts of government subsidies and environmental regulations on green process innovation: A nonlinear approach. Technol. Soc. 2020, 63, 101417. [Google Scholar] [CrossRef]
  69. Demirguc-Kunt, A.; Love, I.; Maksimovic, V. Business environment and the incorporation decision. J. Bank. Financ. 2006, 30, 2967–2993. [Google Scholar] [CrossRef]
  70. Montes, G.C.; Luna, P.H. Fiscal transparency, legal system and perception of the control on corruption: Empirical evidence from panel data. Empir. Econ. 2021, 60, 2005–2037. [Google Scholar] [CrossRef]
  71. Cheong, T.S.; Wu, Y. The impacts of structural transformation and industrial upgrading on regional inequality in China. China Econ. Rev. 2014, 31, 339–350. [Google Scholar] [CrossRef]
  72. Hamamoto, M. Environmental regulation and the productivity of Japanese manufacturing industries. Resour. Energy Econ. 2006, 28, 299–312. [Google Scholar] [CrossRef]
  73. Wang, L.; Wang, Z.; Ma, Y. Heterogeneous environmental regulation and industrial structure upgrading: Evidence from China. Environ. Sci. Pollut. Res. 2022, 29, 13369–13385. [Google Scholar] [CrossRef]
  74. Chen, L.; Li, W.; Yuan, K.; Zhang, X. Can informal environmental regulation promote industrial structure upgrading? Evidence from China. Appl. Econ. 2022, 54, 2161–2180. [Google Scholar] [CrossRef]
  75. Huang, G.Z.; Xing, Z.G.; Wei, C.Z.; Xue, D.S. The driving effect of informal economies on urbanization in China. J. Geogr. Sci. 2022, 32, 785–805. [Google Scholar] [CrossRef]
  76. Lee, C. Against the Law: Labor Protests in China’s Rustbelt and Sunbelt; University of California Press: Berkeley, CA, USA, 2007. [Google Scholar]
  77. Kuruvilla, S.; Lee, C.; Gallagher, M. (Eds.) From Iron Rice Bowl to Informalization: Markets, Workers and the State in a Changing China; Cornell University Press: Ithaca, NY, USA, 2011. [Google Scholar]
  78. Qian, T.; Bian, J.; Liu, S. China’s employment policy since 1949: Retrospect, present, and future directions. Labor Hist. 2022, 63, 618–635. [Google Scholar] [CrossRef]
  79. Shahbaz, M.; Lean, H.H.; Shabbir, M.S. Environmental Kuznets curve hypothesis in Pakistan: Cointegration and Granger causality. Renew. Sustain. Energy Rev. 2012, 16, 2947–2953. [Google Scholar] [CrossRef]
  80. Gambardella, A.; Panico, C.; Valentini, G. Strategic incentives to human capital. Strateg. Manag. J. 2015, 36, 37–52. [Google Scholar] [CrossRef]
  81. Aguilar-Gomez, S.; Dwyer, H.; Zivin, J.G.; Neidell, M. This is air: The “nonhealth” effects of air pollution. Annu. Rev. Resour. Econ. 2022, 14, 403–425. [Google Scholar] [CrossRef]
  82. Rasool, S.F.; Wang, M.; Tang, M.; Saeed, A.; Iqbal, J. How toxic workplace environment effects the employee engagement: The mediating role of organizational support and employee wellbeing. Int. J. Environ. Res. Public Health 2021, 18, 2294. [Google Scholar] [CrossRef] [PubMed]
  83. Lin, J.Y. State-owned enterprise reform in China: The new structural economics perspective. Struct. Change Econ. Dyn. 2021, 58, 106–111. [Google Scholar] [CrossRef]
  84. Biglaiser, G.; Lee, H. The effects of different entry modes of foreign direct investment on labor rights in the developing world. J. Hum. Rights 2019, 18, 165–183. [Google Scholar] [CrossRef]
  85. Zhang, N.; Sun, J.; Tang, Y.; Zhang, J.; Boamah, V.; Tang, D.; Zhang, X. How do green finance and green technology innovation impact the TZE River economic belt’s industrial structure upgrading in China? A moderated mediation effect model based on provincial panel data. Sustainability 2023, 15, 2289. [Google Scholar] [CrossRef]
  86. Ren, S.; Liu, D.; Li, B.; Wang, Y.; Chen, X. Does emissions trading affect labor demand? Evidence from the mining and manufacturing industries in China. J. Environ. Manag. 2020, 254, 109789. [Google Scholar] [CrossRef]
  87. Stanef-Puică, M.R.; Badea, L.; Șerban-Oprescu, G.L. Green jobs—A literature review. Int. J. Environ. Res. Public Health 2022, 19, 7998. [Google Scholar] [CrossRef]
  88. Zhou, J.; Huang, G.Z. The effect of economic upgrading on social upgrading in China under economic globalization. Geogr. Res. 2021, 40, 3364–3381. (In Chinese) [Google Scholar] [CrossRef]
  89. Zhao, X.; Liu, C.; Sun, C.; Yang, M. Does stringent environmental regulation lead to a carbon haven effect? Evidence from carbon-intensive industries in China. Energy Econ. 2020, 86, 104631. [Google Scholar] [CrossRef]
Figure 1. The flux in the indices for economic, social, and environmental upgrading.
Sustainability 16 00357 g001
Figure 2. Spatial evolution trend of disparities in economic, social, and environmental upgrading. (a) The evolutionary trend of regional disparities from 1996 to 2020 based on provincial-level unit; (b) The evolutionary trend of regional disparities from 1996 to 2020 based on inter-group unit (East, Central, West, and Northeast China).
Sustainability 16 00357 g002aSustainability 16 00357 g002b
Figure 3. Trends of average coupling coordination degree among economic, social, and environmental upgrading, both in pairs and as a whole.
Sustainability 16 00357 g003
Table 1. Measurement of economic upgrading.
Primary IndicatorsSecondary
Indicators
Proxy VariablesInfluence DirectionWeight
Economic structureChange rateLilien coefficient+0.0970
Industrial upgradingIndustrial structure sophistication index
(Value added of tertiary industry/value added of secondary industry)
+0.0833
Economic efficiencyOutcome conversionProfits from industrial enterprises above designated size/main business income+0.0462
Quality benefitSocial labor productivity+0.1170
Economic innovationR&D investmentR&D expenditure/GDP+0.1063
R&D outputsGranted invention patent applications/R&D expenditure+0.0920
Innovation environmentPer capita technology market transaction value+0.2895
Innovation efficiencyNew product sales income from industrial enterprises above designated size/main business income+0.1196
Economic growthOutput growthPer capita GDP growth+0.0490
Table 2. Measurement of social upgrading.
Primary
Indicators
Secondary IndicatorsProxy VariablesInfluence DirectionWeight
Labor
employment
Job opportunitiesCurrent job openings registered by businesses+0.1491
Unemployment rateUnemployment rate0.0545
Remunerated employmentAverage salary of urban employees+0.1251
Social
security
Social securityMedical insurance coverage rate+0.1333
Basic rightsAccess to educationProportion of employed individuals with a college degree or above+0.0910
Gender equalityProportion of female workers+0.0584
Union participationRatio of union membership to total employment+0.0461
Social
dialogue
Negotiation and consultationSuccess rate of labor dispute arbitrations+0.0541
Union roleSuccess rate of dispute mediation involving unions+0.1526
Economic democracyNumber of implemented rational suggestions+0.1359
Table 3. Measurement of environmental upgrading.
Primary IndicatorsSecondary IndicatorsProxy VariablesInfluence DirectionWeight
Green innovationGreen technologyPercentage of green utility patents per capita +0.3183
Green inputsGovernment attentionInvestment completed for industrial pollution control/industrial value added+0.1349
Social participationNumber of environmental proposals from NPC deputies and CPPCC members+0.1201
Energy conservation and emission reductionEnergy efficiencyEnergy consumption/GDP0.0593
Carbon emission efficiencyCarbon dioxide emissions/GDP0.0462
Pollution reduction achievementsWater pollutionWastewater treatment rate+0.1433
Air pollutionIndustrial sulfur dioxide emissions/industrial value added0.0481
Waste utilizationComprehensive utilization rate of industrial solid waste+0.1298
Table 4. Stage of coupling coordination degree.
Coupling Coordination DegreeDivision of Developmental Stages
(0, 0.2]Severe imbalance
(0.2, 0.4]Moderate imbalance
(0.4, 0.6]Low coordination
(0.6, 0.8]Low coordination
(0.8, 1]Advanced coordination
Table 6. Results of Granger causality test.
Null Hypothesis:Lags: 2Lags: 3Lags: 4
F-StatisticProbF-StatisticProbF-StatisticProb
SocU does not Granger Cause EcoU6.660.004.310.013.870.00
EcoU does not Granger Cause SocU19.120.0010.710.007.710.00
SocU does not Granger Cause EnvU3.760.023.530.013.000.02
EnvU does not Granger Cause SocU50.720.0032.020.0023.340.00
EnvU does not Granger Cause EcoU7.570.006.330.006.110.00
EcoU does not Granger Cause EnvU5.860.004.930.003.160.01
Table 7. Results of unit root test.
VariableLLCADFStationarity
Statisticp-ValueStatisticp-ValueState
D−4.190.0073.310.12Non-stationary
ΔD−19.940.00407.590.00Stationary
NSTAT2.210.9954.020.69Non-stationary
ΔNSTAT−15.070.00299.770.00Stationary
ln(pIFDI)1.220.8985.590.02Non-stationary
Δln(pIFDI)−13.240.00366.030.00Stationary
ln(pFE)−3.630.00154.340.00Stationary
Δln(pFE)−5.250.00292.160.00Stationary
LAW−5.310.00108.760.00Stationary
ΔLAW−16.440.00362.220.00Stationary
FP_GDP−4.070.00115.490.00Stationary
ΔFP_GDP−17.180.00339.960.00Stationary
ln(ER)−5.200.00110.550.00Stationary
Δln(ER)−25.000.00529.610.00Stationary
Table 8. Results of panel cointegration test.
MethodologyKAOPedroni
ADF-StatisticPanel PP-StatisticPanel ADF-StatisticGroup PP-StatisticGroup ADF-Statistic
Statistic−5.79−3.72−4.65−10.25−6.58
p-value0.000.000.000.000.00
ResultReject the null hypothesis
Table 9. Results of panel regression.
Dependent VariableModel 1
OLS
Model 2
FE
Model 3
FGLS
NSTAT−0.005 ***−0.003 ***−0.002 ***
ln(pIFDI)0.0010.020 ***0.019 ***
ln(pFE)0.015 ***0.013 ***0.013 ***
LAW0.003 ***0.007 ***0.007 ***
FP_GDP−5.339 ***−7.639 ***−5.760 ***
LNER0.007 ***0.005 ***0.003 **
Constant0.194 **0.098 **0.110 ***
N750750750
R20.6290.8520.851
Adjusted-R20.6260.8450.844
F-test209.59 ***117.28 ***116.67 ***
Note: ** denotes statistical significance at a level of p < 0.05, and *** denotes statistical significance at a level of p < 0.01; the values within parentheses represent standard deviation.
Disclaimer/Publisher’s Note: The statements, opinions and data contained in all publications are solely those of the individual author(s) and contributor(s) and not of MDPI and/or the editor(s). MDPI and/or the editor(s) disclaim responsibility for any injury to people or property resulting from any ideas, methods, instructions or products referred to in the content.

