Article

Sequential Methodology for the Selection of Municipal Waste Treatment Alternatives Applied to a Case Study in Chile

by
Estefani Rondón Toro
,
Ana López Martínez
* and
Amaya Lobo García de Cortázar
Grupo de Ingeniería Ambiental, Departamento de Ciencias y Técnicas del Agua y del Medio Ambiente, Universidad de Cantabria, Avda. de Los Castros, 39005 Santander, Spain
*
Author to whom correspondence should be addressed.
Sustainability 2023, 15(9), 7734; https://doi.org/10.3390/su15097734
Submission received: 19 March 2023 / Revised: 22 April 2023 / Accepted: 5 May 2023 / Published: 8 May 2023
(This article belongs to the Special Issue Solid Waste Management: An International Outlook)

Abstract

:
Most municipalities in developing countries lack technical and economic resources to improve their municipal solid waste management (MSWM) system. Therefore, tools are needed that enable the most appropriate solutions to be identified to put waste to better use. This study presents an easy-to-apply sequential methodology for the analysis of MSWM alternatives. The method consists of two stages: (1) screening available technologies based on a small set of key variables; (2) ordering the selected alternatives by a combination of multicriteria methods that integrate local priorities. For this second stage, a basic series of technical, environmental, economic and social indicators is proposed. The methodology is applied to a case study where current management is limited to mixed municipal solid waste (MSW) disposal in a landfill without gas recovery. Seven options for implementing energy recovery in landfill, using mechanical plants to recover part of recyclable material, treating the organic fraction, and employing refuse-derived fuel and/or waste to energy incineration, were evaluated together with the current situation and considering four scenarios. The results identify various alternatives that allow the sustainability of MSWM in the case study to improve. Notwithstanding, today, it is necessary to introduce economic instruments that discourage final disposal to make municipal waste recovery viable.

1. Introduction

Municipal solid waste management (MSWM) has become a topic of growing global concern [1]. There are major differences in implemented municipal waste management systems between some countries and others. Countries with a higher level of economic development have considerably raised public awareness and advanced technological solutions in place, and they are adopting preventive waste generation approaches. Developing countries, where the population focuses more on survival or prospering in the short term, resort to less expensive low-tech solutions [2]. In these countries, municipal solid waste (MSW) is usually directed to sanitary landfills or disposed in open dumping sites, which poses environmental and health risks [3]. The increase in waste generation and the depletion of sites available for final disposal imply higher management costs [4]. Along with this, demographic expansion, improved living standards and more environmental awareness in these countries make improving current MSWM systems an urgent matter [5]. The main issues that developing countries face on this path include lack of adequate governance instruments, inefficient use of resources, relying excessively on imported equipment, inadequate financing methods and application of technology, uneven service provision and poor technical expertise [6].
The lack of technical and economic resources for, and general information on, the problem, together with the great complexity of the MSWM system where the informal sector is extremely relevant [7], all render landfill disposal the preferred option when planning MSW “management” in developing countries [8]. Despite the fact that landfilling has a stronger environmental impact than other MSW treatment alternatives, such as recycling or incineration [9], sanitary landfills at least allow to protect health and the environment with simple economical technology [10].

1.1. MSWM in Latin American and the Caribbean

In 2022, the population in the Latin America and the Caribbean (LAC) region came to 658 million inhabitants [11], of whom 81.2% lived in urban areas [12]. Currently, 52% and 28.3% of the waste generated in this region are disposed in sanitary landfills and open dumps or in non-specified landfills, respectively [1]. Although the number of sanitary landfills has significantly increased in the region in the last decade, many face serious environmental and operational problems [13]. New technologies must be implemented for appropriate MSW treatment to reduce volumes and to avoid negative impacts on ecosystems and society [3]. Other management options, such as incineration, anaerobic digestion, composting, and even formal recycling, are still emerging techniques in LAC, and they all have relatively low implantation rates compared to other world regions [1]. However, social development can only be sustainable if generated waste does not accumulate but rather is reused, recycled and fully recovered [8].
In recent years, important regulatory advances have been made in LAC to establish a framework for the best waste use. Chile can be taken as an example of being a vanguard country in this group of countries. Recently, ambitious collection and recovery goals for light packaging waste (of at least 70%) by 2035 have been established [14], as has the recovery of at least 66% of the organic fraction (OF) from MSW by 2040 [15]. To fulfill these goals, a change in the collection scheme is planned with the incorporation of separate door-to-door collection systems for recyclables. Today, however, MSW is mostly collected mixed (99%) and disposed of in sanitary landfills [16]. The nationwide MSW recovery or recycling rate is less than 1% [17] and is achieved mostly by a pilot system in the country’s capital, where approximately 12% of the mixed recyclable waste is separately collected by a door-to-door service [18].
This mostly mixed collection situation is the commonest in LAC, where the main priority is still to increase the collection service coverage and to improve the sanitary conditions of the final disposal sites [19]. This is why the present work focuses on alternatives applicable to management systems in which MSW is collected mixed.

1.2. Available Treatment Technologies

There are three alternatives with the longest tradition in the treatment and/or disposal of mixed collected MSW: landfill, landfill with gas recovery (LFG) and incineration [20]. LFG recovery is well suited for places that receive a high percentage of biodegradable matter with high moisture content. It allows to take advantage of the energy contained in waste and also helps to mitigate greenhouse gas (GHG) emissions from waste by converting methane into carbon dioxide [21]. For power generation to be viable, minimum LFG flows are required [22]. In addition, each potential LFG for the energy project should be evaluated based on local conditions, especially the availability of energy markets [23].
Incineration has become an important element of MSW management strategies worldwide. Most of the energy stored in MSW fractions can be recovered as heat used in energy production through incineration [24]. A key benefit of incineration lies in reducing waste volumes and, hence, a smaller landfill disposal space is required. For the waste incineration process to allow energy recovery, a lower heating value (LHV) of at least 7 MJ/kg is needed [25]. As part of an integrated waste management strategy, there are generally two incineration scenarios: total mass burn and non-recyclable mass burn [26]. An essential complement to incineration is an ash landfill (Ash-LF), where the ashes generated during waste combustion are managed, usually as hazardous waste.
To improve these alternatives and to seek the best use of resources, nowadays, employing mechanical-biological treatment (MBT) plants has extended, where mixed waste fractions are pretreated [27]. These plants combine processes to first recover certain recyclable materials, such as glass, paper, cardboard, metals, etc., and to, second, stabilize the OF [28] to reduce its volume and degradability [29]. MBT plants are used worldwide, with installed capacities currently ranging from 12,000 to 500,000 tons per year (t/y) [30]. Europe is one of the regions with the most plants of this type in operation. In 2017, there were some 570 facilities that treated around 55 million tons, and 120 new plants are expected to be installed by 2025 [31].
MBT plants can include different processes. Edo (2019) generally classifies them and identifies, among others, three types that receive mixed MSW: mechanical treatment or triage plants (MTP); recovery and composting plants (RCP); and recovery, biomethanization and composting plants (RBCP) [28]. In MTP, only one separation of mixed recyclable materials is carried out. These plant types are common for waste selection in the waste streams that come from either wet–dry collection systems or some separate collection programs for recyclable materials.
RCP and RBCP include a first mechanical stage to recover recyclable materials and the separation of the OF and a second biological stage for the biostabilization of the latter. The biological stage can be carried out by either composting (aerobic treatment) or biomethanization (anaerobic treatment) with the subsequent composting of the digestate, as performed in RBCP. Part of the rejects of these plant types (RCP and RBCP) can be employed to produce refuse-derived fuel (RDF), as long as its LHV is around 15 MJ/kg to make its use feasible [25].

1.3. Decision-Making Tools

With this wide variety of technologies available today for treatment, identifying the optimal solution for each context is complex. The selection of alternatives must consider environmental performance, economic viability and social acceptability aspects, whose assessment must be made on a case-by-case basis by integrating local conditions [4,32]. With this aim, multicriteria analysis methods can be very useful as support tools, even in areas where decision makers’ technical capacity is limited, which is common in developing countries. These tools should: (1) clearly show the process of evaluating alternatives; (2) help to systematize data collection; (3) allow the agile incorporation of information generated in other contexts (e.g., taken from the literature); and (4) introduce specific criteria and weightings according to local interests.
Of the mathematical techniques for a multicriteria analysis, the Technique for Order of Preference by Similarity to Ideal Solution (TOPSIS) technique stands out for being widely used in various fields [33]. TOPSIS is the multicriteria decision-making method proposed by Hwang and Yoon (1981) [34] and modified by Yoon (1987) [35] and Hwang et al. (1993) [36]. It is simple and easy to understand [37]. It also has good computational efficiency and allows the relative performance of each alternative to be measured in a simple mathematical form [38]. This method has been employed to select the best waste management options in certain application cases by taking into account environmental, economic and technological criteria [20,39] or by also including socio-political criteria [40,41,42].
In the LAC region, studies have been carried out to evaluate alternative municipal waste management or treatment with different approaches. Several studies focus on analyzing the potential of converting waste into energy with different treatment techniques [43,44,45,46,47,48]. Others address the economic feasibility of applying distinct waste treatment techniques in several cities [43,49]. In the same context but applied to specific case studies, multicriteria decision techniques have been used to consider social, economic, political and environmental aspects [4,50,51]. Rodrigues and Mondelli (2021) apply TOPSIS to select the best scenario in terms of material recovery and reducing waste to landfills by integrating environmental, economic, social and technical factors [52].
This study presents an easy-to-apply sequential methodology to analyze MSWM alternatives by considering multiple criteria in similar contexts to the LAC region. The following section presents the developed methodology based on the sequential application of a screening matrix and the TOPSIS method, which can serve as a reference for other places. An example of application in a case study is described below, in which different solutions are proposed to seek the best use of resources by the treatment and disposal of the municipal waste that is mostly collected as mixed waste. Finally, the results of the analysis are shown to discuss their sensitivity to distinct weighting options, which respond to several scenarios of local interests.

2. Methodology

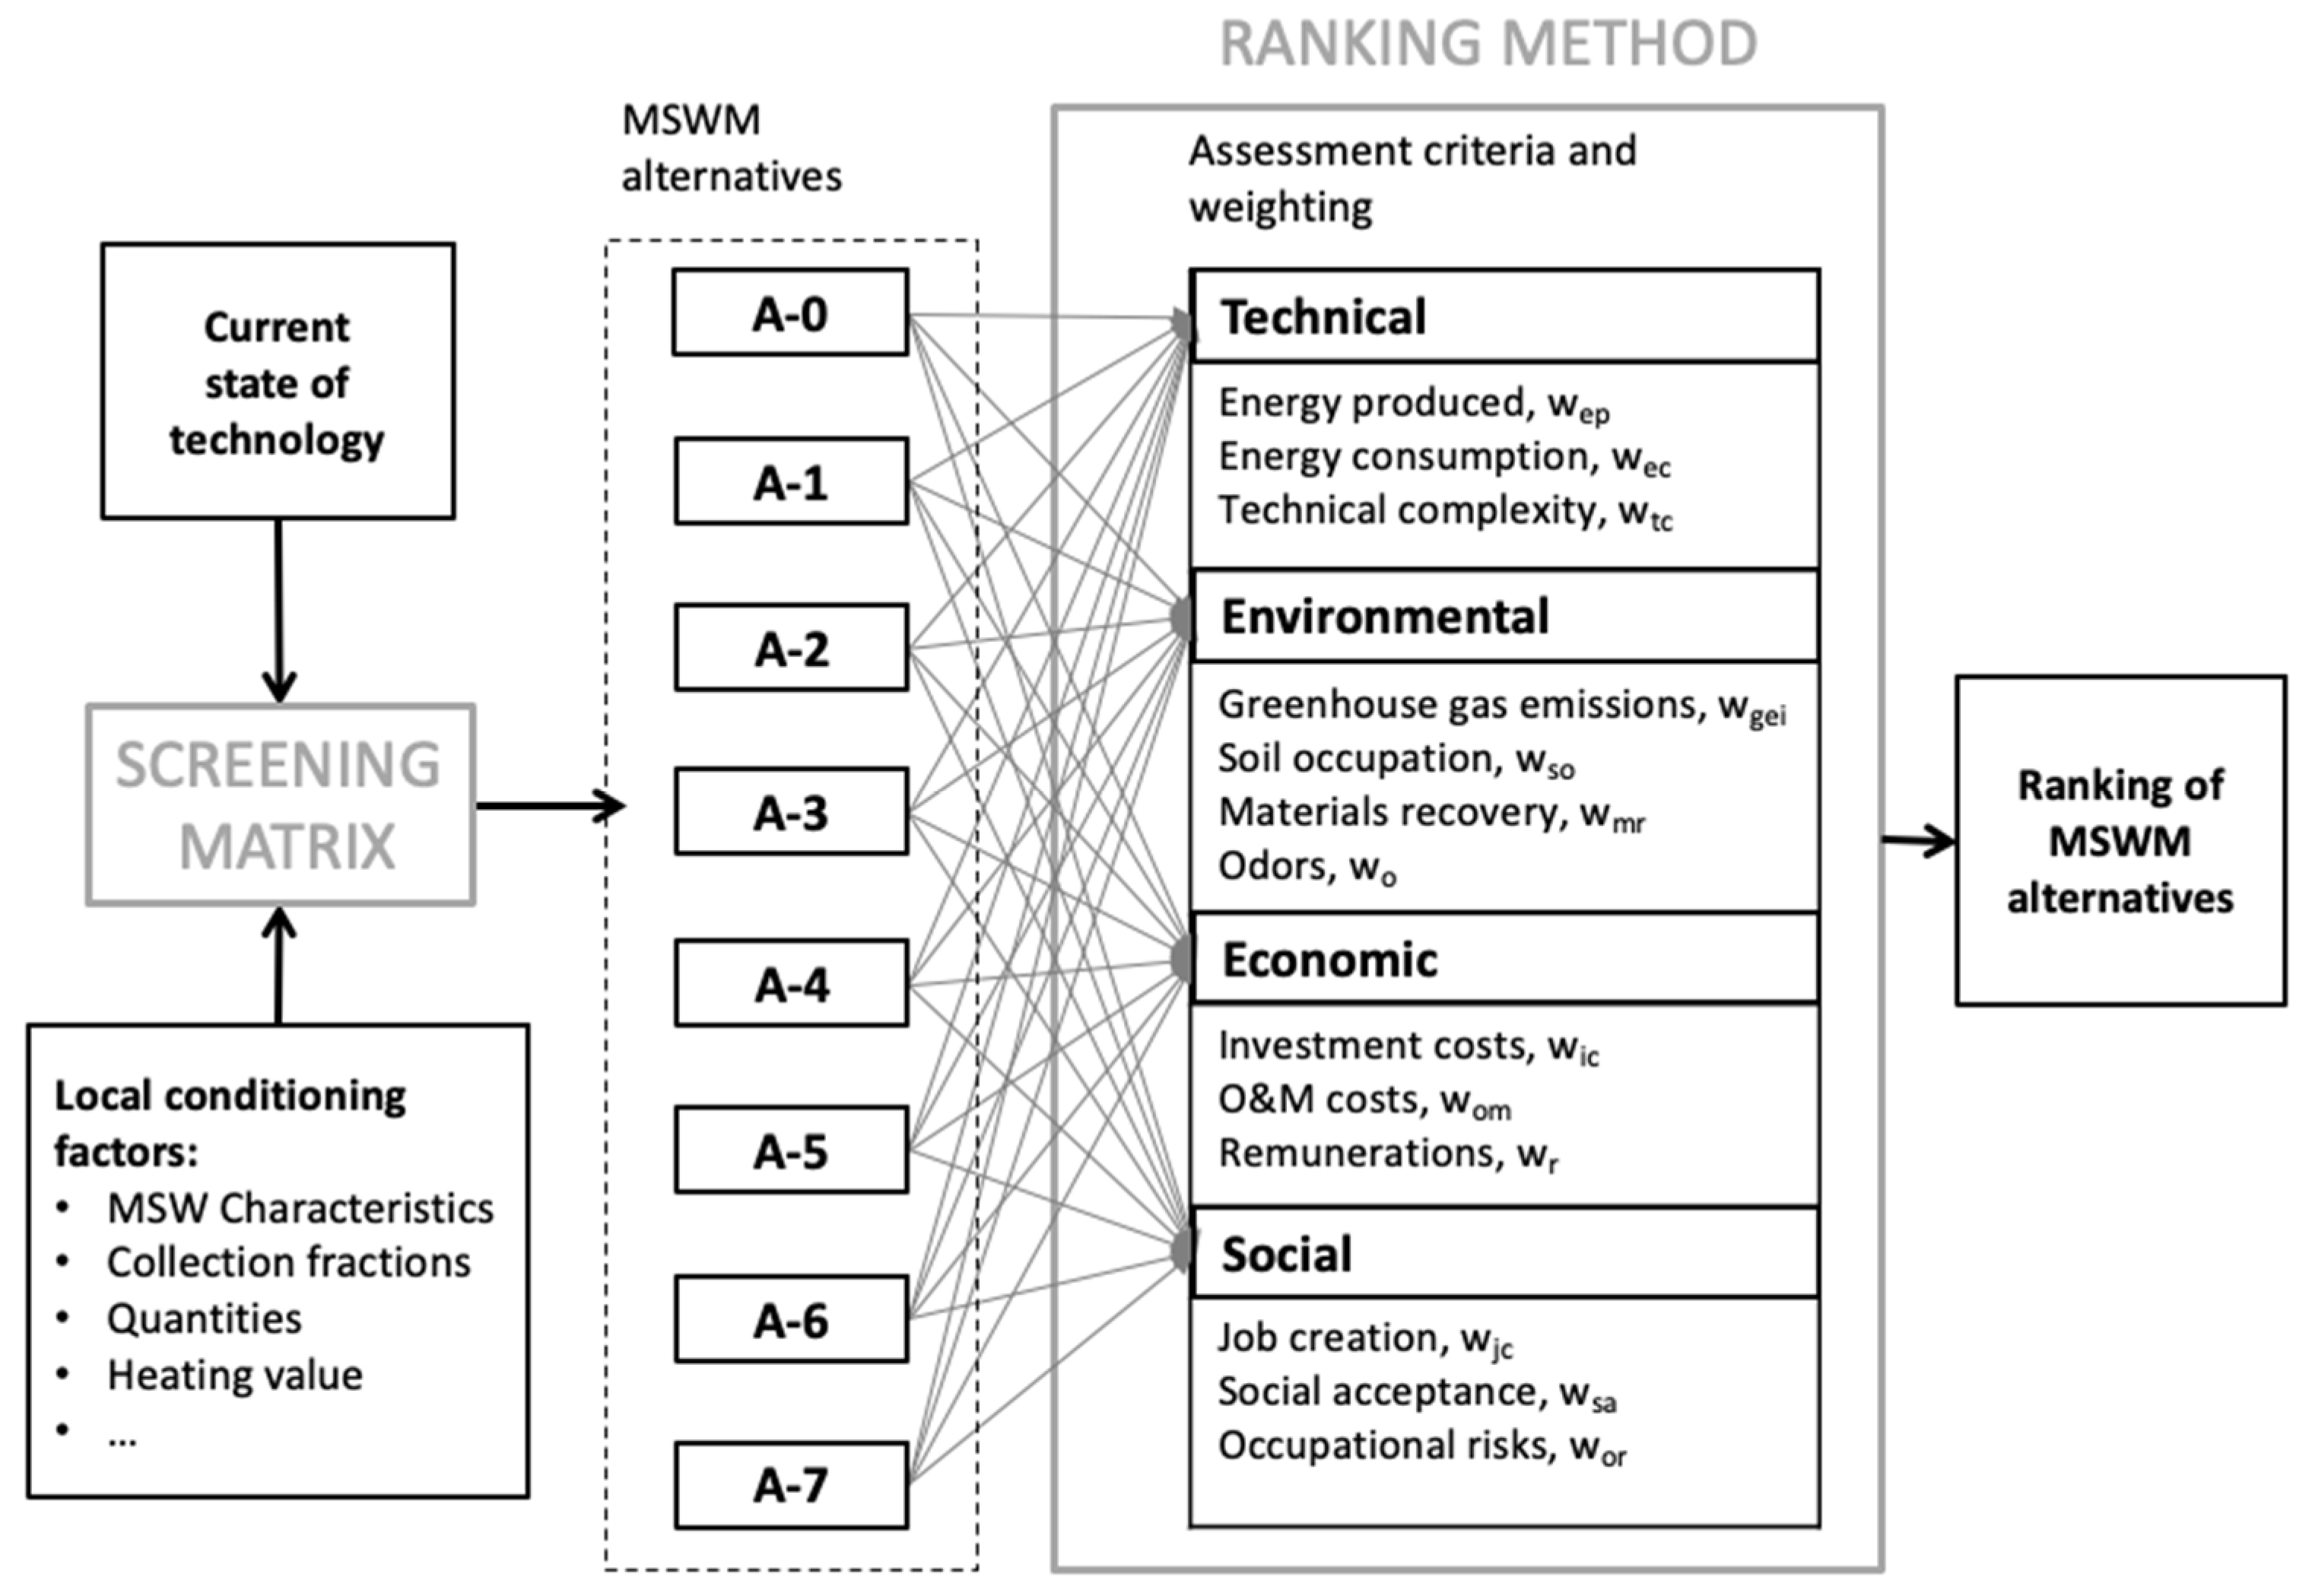
2.1. Proposed Sequence

Figure 1 shows the scheme of the sequential methodology proposed for decision making in this research. By considering specific conditioning factors for waste management, such as fractions of waste collected separately, their main characteristics and amounts generated on the one hand, and available technologies on the other hand, a screening matrix allows the technologies that are viable in the studied case to be identified. These possible technologies can subsequently be combined to define MSW treatment alternatives that can be evaluated and prioritized using the multicriteria tool, which enables criteria of a different nature (technical, environmental, economic and social) to be considered in more detail.

2.2. Case Study

An area of northern Chile with 420,000 inhabitants was chosen as a case study. The MSWM there currently focuses on a final disposal site that receives 165,937 t/y of mixed collected waste, with a daily average of 455 t. The average composition of the MSW received in the facility is 49% OF, 17% plastic, 11% paper–cardboard, 2% glass, 1% metals and 20% others, with an average global moisture content of 37%. There is no separate collection in the area. The LHV for the current waste composition is 9.98 MJ/kg.

2.3. Screening Matrix

This study considered the six technologies described above: landfill, LFG, incineration with energy recovery (I-ER), and pretreatment in MTP, RPC and RBCP. As a first step to define the MSWM alternatives, the application of several basic criteria is proposed through the screening matrix that, based on easily accessible information, allows directly ruling out those options that are inappropriate for the local conditions of the studied case. Table 1 presents the screening matrix created in this study, which brings together the considered technologies by assigning to each one the minimum requirements to implement it. By taking previous works as a reference [25,53], seven basic implementation criteria were herein selected in relation to the characteristics of the waste to be treated, the deployed waste collection method and the socio-economic conditions of the place.
As a first variable, the MSW fraction to be treated is identified. All the alternatives considered in this study are suitable for treating mixed fractions. In addition, some can be applied to specific selectively collected materials, such as the recyclable fraction in MTP or the OF in RCP and RBCP. Although mixed materials are allowed, alternatives based on biological processes, such as LFG, RCP and RBCP, require a minimum proportion of biodegradable matter in the mixture. They are not suitable for inert waste.
The LHV is a main characteristic of waste when its potential recovery is evaluated. Energy recovery through incineration is only feasible when waste meets the requirement set out in Table 1, as mentioned in the Introduction. Otherwise, it is necessary to use a large amount of supplementary fuel during the process, which decreases its efficiency to such an extent that energy recovery cannot be considered [10,25].
Furthermore, the larger the amount of waste to be treated, the lower the treatment’s unit cost. A larger amount of waste favors economies of scale, which is essential for the feasibility of more expensive technologies [25,55]. When small amounts of waste are treated, more complex treatments are penalized, and they can even be considered no longer suitable.
Different authors [10,25,55] agree that technological maturity, complexity and investment, and operation and maintenance (O&M) costs are the main conditioning factors for implementing an alternative. Technology maturity describes its development level, which is given by the number of years it has been on the market, the number of installations in operation internationally, the expected service availability and the reliability of its operation. Technological complexity encompasses the degree of qualification that operating personnel require and the system’s technical complexity.
As a result of applying the matrix presented in Table 1, decision makers can obtain a first list of suitable technologies for the given context. In an area with certain technical limitations, for example, those alternatives with medium–high complexity should not be considered. Thus, options RBCP and I-ER would be rejected. Based on these results, different alternatives for the MSW treatment system can be defined, which can include one or several of the technologies that have “passed” the screening matrix. The following section details the criteria and indicators that can be used in the second phase to select waste treatment alternatives.

2.4. Ranking Method

2.4.1. Assessment Criteria and Indicators

Delgado et al. (2020) [20] define a series of criteria and indicators for the selection of MSWM alternatives. Table 2 details the criteria and indicators herein proposed based on the above-cited work. The values of the 13 indicators for each process unit were obtained from a comprehensive scientific and technical literature review. Table 2 shows the finally adopted values. The proposed assessment structure can be modified by adding columns (treatment units to be considered) or rows (evaluation indicators) and by changing the value given to each indicator when case-specific data are, or better information is, available. Some considerations for the criteria and indicators used in this study are described below.
The qualitative criteria were assessed on scales from 1 to 5 (5 is high and 1 is low). For the alternatives that consider the disposal of rejects and subsequent LFG use, a gas generation rate over time was estimated to check if it was sufficient for energy production. Considering the ranges compiled by [57], and taking into account that MBT can reduce waste biodegradability by more than 79% [58], gas generation and the net energy potential ratios of 80 Nm3/t and 80 kWh/t for fresh waste, and of 16 Nm3/t and 16 kWh/t for the waste pretreated in MBT were taken for calculations. A gas collection rate of 40,000 Nm3/month was taken as a minimum threshold for energy production in landfills [22]. To estimate the gas flux obtained from the biomethanization at RBCP, a ratio of 45 Nm3 biogas/t (equivalent to a net electrical energy yield of 220 kWh/t) was considered [59].
The net GHG emissions are considered among the environmental criteria. The emissions avoided through the recovery of materials were calculated individually per mass of each material type (Table 3). Recovered materials (RM) include paper, cardboard, metals, plastic, glass, the biostabilized OF, and other outputs from recovery plants such as RDF or recovered slag.
Regarding economic criteria, in the case study in Chile, the cost per ton received at the facility was taken as 14 €/t [16] without distinguishing between the installation type because there is currently no economic penalty in the country for final disposal. The sale price of biostabilized material was taken to be 10 €/t [56] and per RM type, as shown in Table 3. A zero sale value was assigned to slag from incineration plants by assuming a common case today, in which it is used in sanitary landfills as a covering material or to stabilize slopes [69].
Table 3. Avoided emissions and sale price per RM type.
VariablePaperCardboardMetalsPlasticGlassRDF
kg CO2-eq/t−559 [65]−559 [65]−3006 [65]27 [65]27 [65]−337 [65]
Sale price (€/t)61 [70] 22 [70]52 [70]39 [70]24 [70]25 [56]
The electricity sale price depends on the availability of networks for connection, demand and the local energy market. As a reference, in 2022, the energy sale prices in the LAC region varied between 0.04 and 0.30 €/kWh [71]. For this study, it was assumed that all the energy produced in the system was available for sale, and the sale price of the Chilean market for unconventional renewable energy was taken. To consider the effects of supply and demand variations on the market, the values obtained from 2017 to 2022 were averaged. This gave the distribution price through the central interconnected system to be 0.070 €/kWh [72]. It was also assumed that consumed energy was tendered for the operation stage at an average cost of 0.021 €/kWh [73], which was included in the operating costs for each alternative.
The value corresponding to each indicator per treatment alternative is calculated as the sum of the values obtained by applying Table 2 to each unitary process that makes up the alternative. As the quantitative values in the table are expressed in unit terms per unit ton of waste treated, the assessment of the indicator in each process is obtained by multiplying these values by the amount of waste treated in it.

2.4.2. Criteria Integration and Weighting

After assessing each indicator, to obtain the overall evaluation of the treatment alternatives, the TOPSIS method is used, which allows a weighted integration of all the considered criteria and indicators. A comprehensive description of the mathematical development of the method can be found in other works [20]. It is based on the calculation of the distance of each alternative (i) from the “Ideal Positive” ( d i + ) and “Ideal Negative” ( d i ) solutions, which are, respectively, the best and worst possible rating for the alternatives considered according to each criterion, and they are calculated based on the values and weights given to the corresponding indicators. In this case, the weights assigned to each criterion were distributed evenly among all the indicators included in it.
The relative closeness of each alternative (i) to the ideal solution for each criterion (k), Rki, is defined by Equation (1), where m is the number of analyzed alternatives.
R k i = d i + d i + d i   ,   i = 1 , 2 , , m
Rki is in the range between 0 and 1, with the best alternative being that closest to 1 because this means that it is closer to the ideal alternative. Considering the different weights assigned to the criteria (Pk), the overall assessment of each alternative, Rgi, is obtained by integrating all the contemplated criteria; see Equation (2).
R g i = k = 1 4 P k × R k i

2.5. Sensitivity Analysis

A sensitivity analysis helps to understand how much the result of the evaluation varies when giving different weights to indicators. The total score obtained by each alternative and, therefore, its position in the ranking, can change based on the relevance assigned to each indicator, which varies according to the context.
In order to assess the sensitivity of the results in the case study, the ranking obtained by considering each criterion individually for the defined alternatives, and the results of four weighting scenarios, were analyzed: scenario (1), which involves all the criteria described above; scenario (2), where the environmental criterion is neglected; scenario (3), where the social criterion is not considered; scenario (4), where 90% of the total weight is assigned to the economic criterion and the remaining 10% is equally distributed among the other three criteria. Equal weights were given to the different criteria in each scenario except the last one. Scenarios (2), (3) and (4) move away from the sustainability paradigm, in which all the criteria have a significant weight, but they can represent different approaches to the priorities of a developing area, where the population prioritizes short-term gain or survival and, thus, resorts to cheaper low-tech approaches [2,8].

3. Results and Discussion

3.1. Definition of MSW Treatment Alternatives

Given the latest advances in waste legislation and the aforementioned valorization goals, Chile would be able to assume technologies with medium and medium–high complexity with no strict economic limits for investment and operation. Thus, in this case, all the technologies included in the screening matrix (Table 1) defined in this work would be “viable”. By considering them all, the seven alternatives summarized in Table 4 are defined. All these alternatives contemplate only the treatment of the collected mixed MSW fraction, except A2 and A5, which consider the separate collection of recyclables in part (12%) of the served area. The alternatives to be studied are called A1 to A7, while A0 represents the current scenario.
Table 5 shows the mass balances per alternative based on the operation data of plants with similar characteristics [28,56]. Diagrams of alternatives are included in the Supplementary Materials. For MTP, data were taken from a similar plant currently installed in the Metropolitan Region of Santiago de Chile [18], which combines manual and mechanical processes.
In all the alternatives involving energy production, the waste characteristics meet the minimum energy recovery requirements described above. In particular, the incoming MSW exceeds the minimum requirements for LHV in incineration plants (considered in alternatives A3 and A5). The RDF obtained in option A6 is composed of pretreated OF (38.6%), paper (11.4%), cardboard (11.4%), and glass (4.5%). With this composition, the estimated LHV of RDF is 16.2 MJ/kg, which meets the requirements for its use as fuel in cement kilns. According to the references described above, the defined landfills meet the conditions for energy recovery from gas with an estimated gas generation of 663,748 (A1 and A2), 91,773 (A4), 69,266 (A6) and 91,060 (A7) Nm3/month, respectively. In alternative A7, a gas generation rate of 301,163 Nm3/month is estimated for the biomethanization process, which is also enough for energy production.

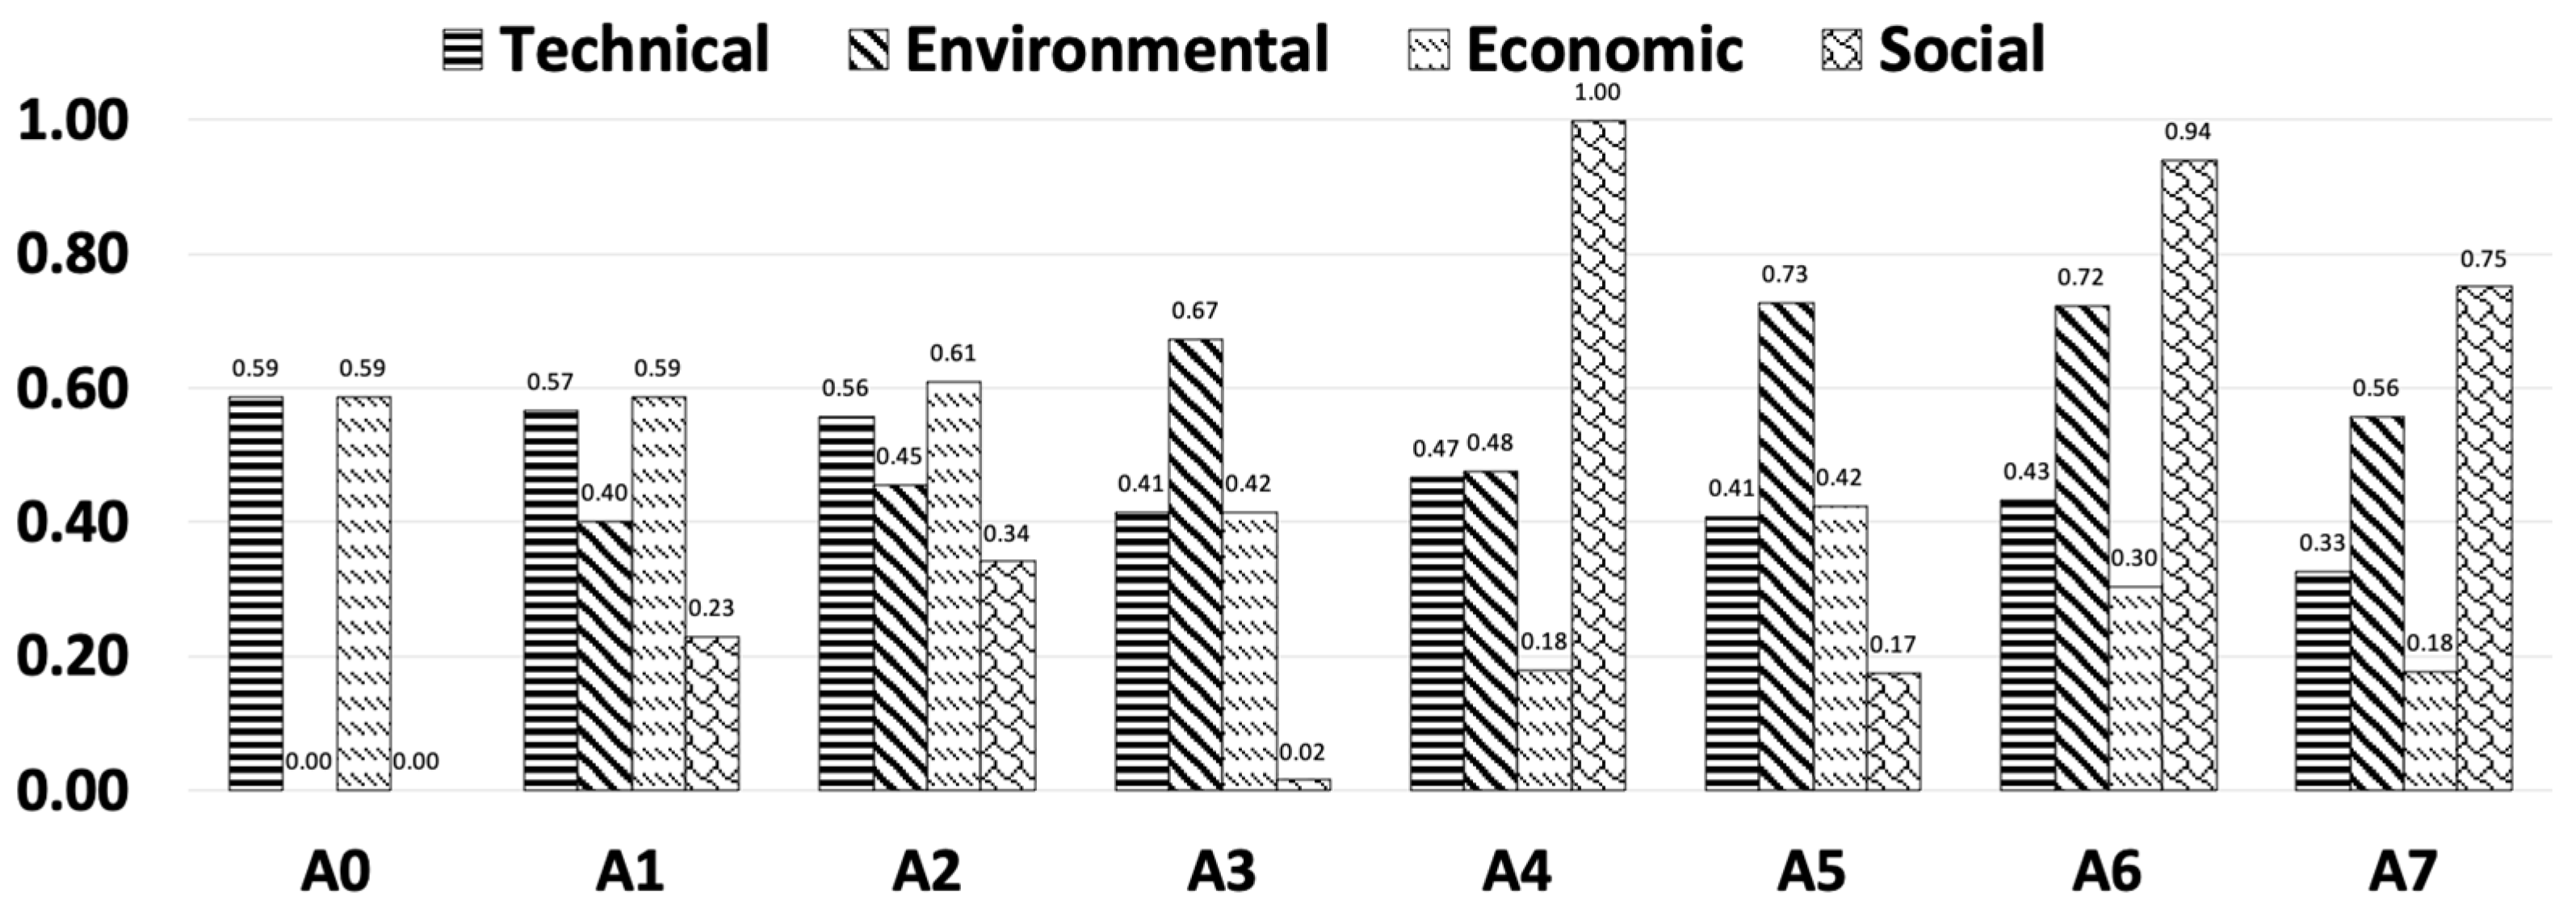
3.2. Partial Results

Table 6 shows the results obtained for each indicator in the considered alternatives.
The indicators that refer to technical criteria show different trends. Alternatives A3 (I-ER + Ash-LF + LF) and A5 (MTP + I-ER + Ash-LF + LF) stand out for produced energy: a principal element in both is incineration. Thus, as a disadvantage, they present the highest technological complexity. In accordance with other authors [24,74], the incineration scenario has the highest power generation capacity. Ref. [75] agrees with this observation by noting that incinerators can meet one-quarter of demand through waste-derived energy as a key component in a country’s energy diversification strategy. The treatment alternatives with the best consumed values energy are A0 (LF) and A1 (LFG), which match lower technological complexity.
From the environmental perspective, four alternatives stand out with the best results. A6 (RCP + RDF production + LFG) and A7 (RBCP + LFG) are those that avoid the largest amount of GHG emissions, mainly from using RDF as fuel (A6) and applying anaerobic OF treatment (A7). The facilities considered in alternatives A3 and A5 are those that produce a smaller quantity of rejects. They have the least land occupation and the best score for controlling odor generation. This is perhaps a great advantage for some cities of LAC, where available land for waste disposal is a serious issue because the large landfills there are almost on the verge of their disposal capacity [19,76].
Regarding recovery of materials, A6 stands out for its RDF production, mainly as RM, which is followed by A5 and A3 for slag recovery. Although waste-to-energy (WtE) technologies appear one level lower than recycling in the hierarchy principle for waste management, they play a complementary and essential role for implementing a circular economy [77]. This explains the interest in combining these technologies with other waste valorization processes because they enable a loss of valuable materials to be avoided, which are otherwise deposited in landfills and, in turn, reduce land use as final disposal sites.
As regards economic criteria, alternatives A0, A1 and A2 (MTP + LFG) entail the lowest investment costs, while those that incorporate incineration (A3 and A5) represent the most investment efforts. However, in A0, A1, A2, A3 and A5, revenues compensate O&M costs, while the cases that consider MBT plants (A4, A6 and A7) involve high operational costs that cannot be amortized by selling by-products in the scenario herein assumed.
In relation to social criteria, alternatives A4, A6 and A7 stand out for giving rise to the creation of more jobs. These results coincide with Milutinović et al. (2014) [78], who highlight that the alternatives that incorporate the manual separation of materials are more labor-intensive than others based on using machinery, such as incineration or landfill.
The best assessment in social acceptance terms corresponds to alternatives A4, A6 and A7, and it falls in line with Milutinović et al. (2016) [79] and Khan and Kabir (2020) [80], who suggest that social acceptance for RCP and RBCP is better than for other technologies in the developing world. Similarly, these results agree with the last National Environmental Survey carried out in Chile [81], which shows that implementing these options would fall more in line with the environmental awareness of the country’s citizens. On the contrary, the worst valued alternatives (A3 and A5) are those that include incineration as the main technology because of social opposition to the potential negative health effects of its operation close to inhabited areas [82].
Finally, the results of the occupational risks indicator suggest that the plants with RCP (A4 and A6) would be the safest alternatives for workers, while A0, A1 and A3 would entail the highest risk.
Table 7 details standardized results. The most favorable values per indicator are shown in bold. Based on these results and considering the same weight per indicator, the ranking of alternatives would be: A6 > A4 > A2 > A7 > A1 > A5 > A0.

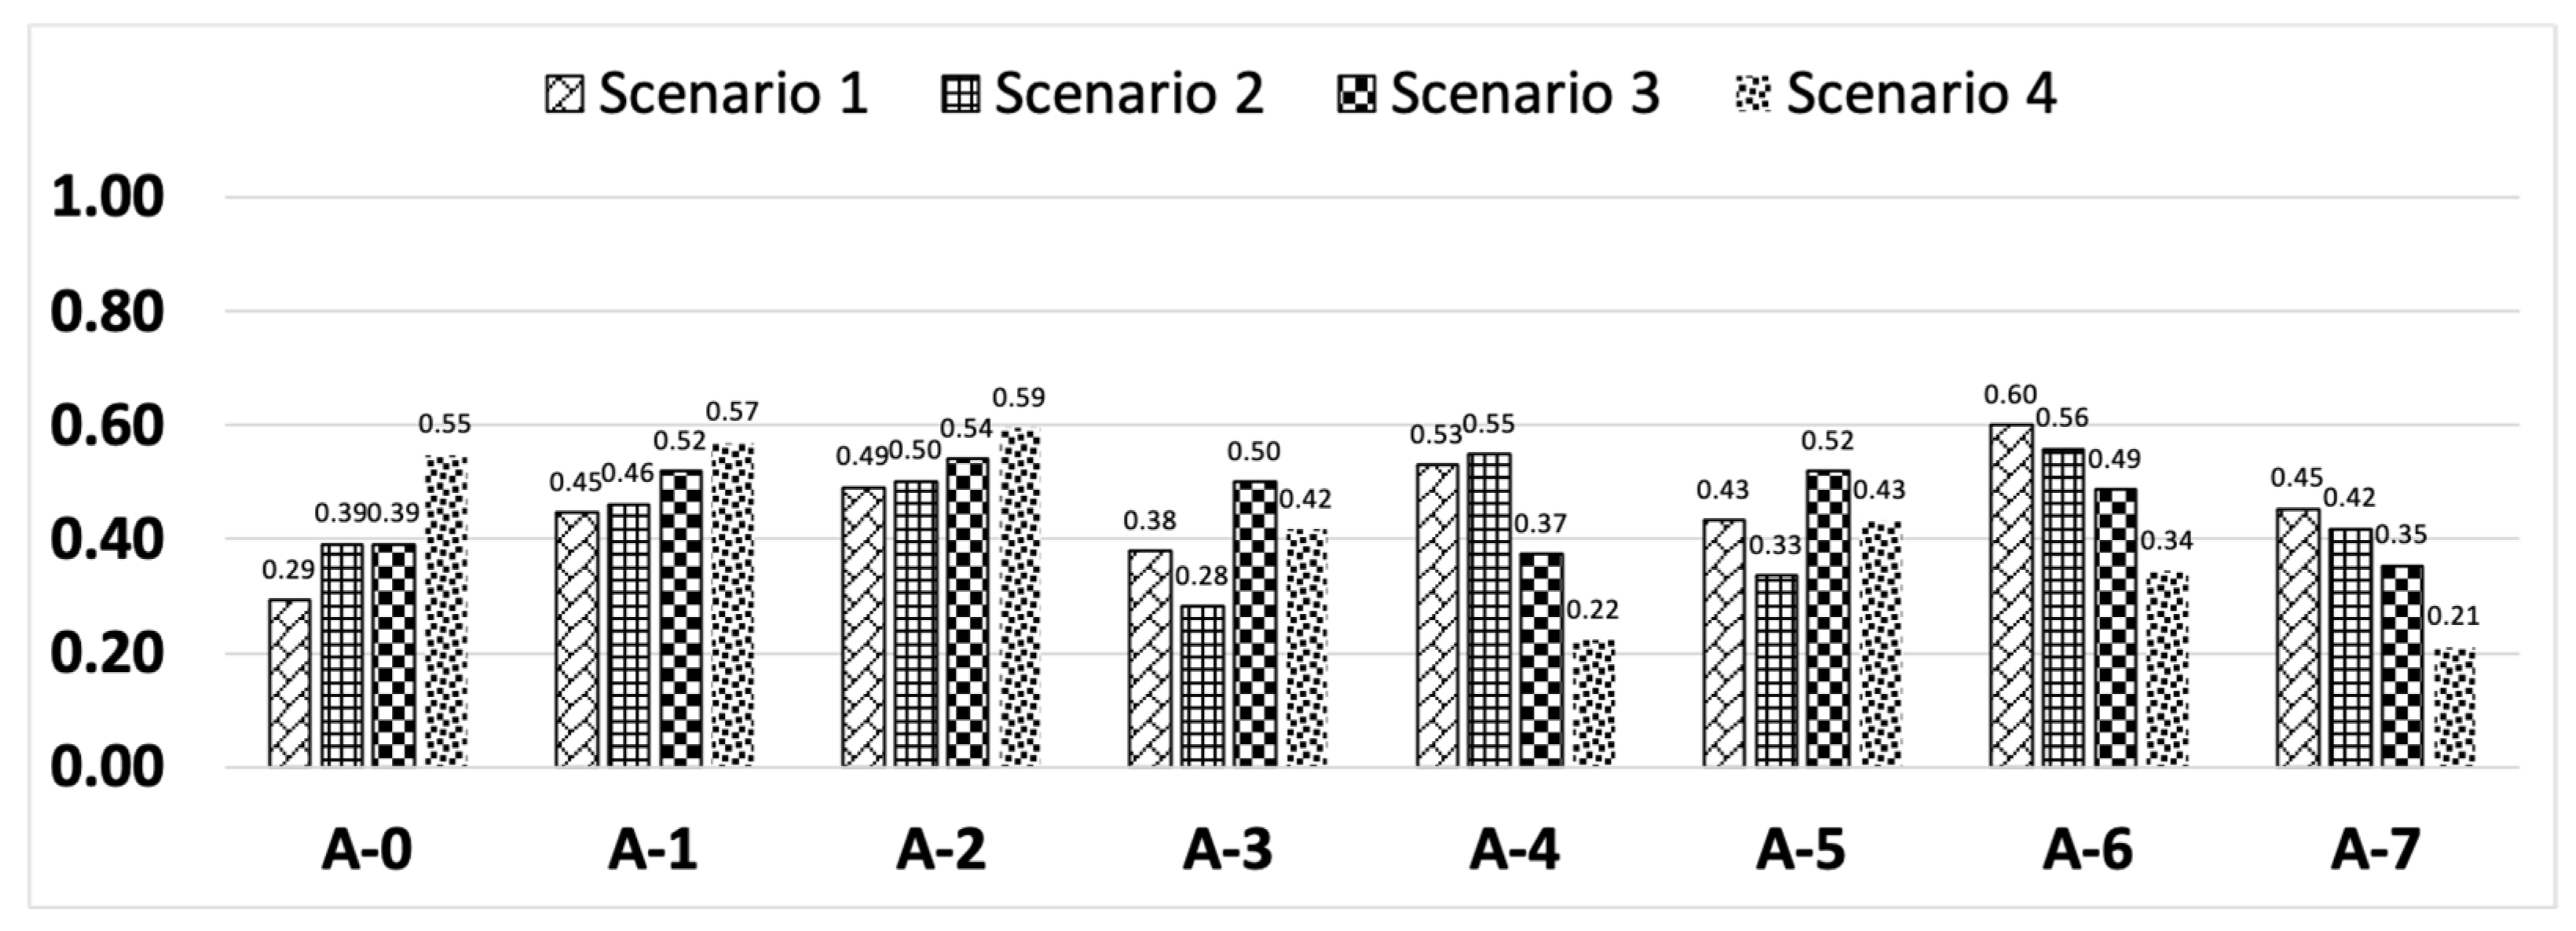
3.3. Sensitivity Analysis

3.3.1. Integration of Indicators

From the technical point of view, Table 7 shows that alternative A3, followed by A5, would be the best evaluated if only the indicator related to electricity generation (T1) was considered, but these two would remain as the last options if this indicator was not contemplated instead of the other two (T2 and T3). As the balance between the generated and consumed energy would give similar weights to T1 and T2 (without considering T3), according to this criterion, the preferred alternatives would be A1 and A2, which are followed by A0 and A3. If only technical complexity was covered in this criterion, then A0 would remain the best one. In any case, A4, A6 and A7 would never appear as preferred options from the technical point of view with the indicators selected in this work.
In relation to the environmental indicators, A6, A7 and A4 would be better evaluated if only the indicator related to avoided emissions were taken into account, but these three would occupy third, fourth and fifth position, respectively, if only indicators E2, E3 and E4 were considered (with similar weights).
In this evaluation, A6, A7 and A4 would be better evaluated if only the indicators on material recovery (E3) and avoided emissions (E1) were considered. However, in land use terms (E2), A5, A6 and A3 would occupy less surface area to install plants. For the environmental impact due to odor, A5, A3 and A7 would be the best evaluated, with the first two due to thermal waste treatment, which would allow better emissions control, and the last one due to OF management through biomethanization. In any case, from an environmental perspective, the worst valued alternatives would be A0, A1 and A2, which contemplate the final disposal of a larger amount of MSW.
Of the economic indicators, the EC1 indicator (investment cost) would be better evaluated for alternatives A0, A1 and A2. The first two would also be the best alternatives for operating costs (EC2) but not for economic remuneration (EC3), which would be the worst evaluated. If only operational costs (EC2) and remuneration (EC3) were contemplated, then the best alternative would be A2, which is followed by A1 and A5. Considering a scenario in which the economic aspect was limiting and by taking all the economic indicators with an equal weight, the most convenient alternatives would be A0, A2 and A1, and A5, A3 and A6 would be the worst evaluated ones.
Finally, with the social criterion, for S1 (number of created jobs), the best evaluated alternatives would be A4, A7 and A6, which coincide as the best evaluated in indicators S2 (social acceptance) and S3 (occupational risks). The worst evaluated alternatives in the set of social indicators coincide with those that consider landfill and thermal treatment (A0, A3, A1, A5 and A2).

3.3.2. Integration of Criteria

Figure 2 shows the results of combining indicators by criteria and considering equal weights for them all. For each criteria, it depicts how a different best alternative (that with the highest Ri) is obtained. Therefore, in this case, no ideal alternative can be taken as the best from all the standpoints. The selection of one or another depends on local priorities which, in this methodology, can be introduced into the weighting of the indicators and/or criteria.
Figure 3 shows the results for the four different studied weighting scenarios.
The preferred solution (or the first position ranking) in scenarios 1 and 2 is A6 (RCP with RDF production and LFG), although it is far from a hypothetical ideal solution. Compared to other options that include pretreatment with material recovery from collected mixed waste, this one also allows part of the rejects to be recovered for RDF production. This valorization offers benefits, such as using alternative fuels in industry and applying the circular economy paradigm by reducing the final disposal of resources that are still energy rich [28]. This preferred alternative is aligned with the results obtained by [83]. These authors evaluate four scenarios by considering indicators: landfilling and GHG emissions reduction, energy recovery efficiency and life cycle costs and benefits. Their best option for MSWM is that which considers an MBT plant by combining the application of RDF with waste gasification. In this scenario, the amount of waste to be disposed significantly reduces and, thus, extends the useful life of the landfill by, in turn, further reducing emissions and with more energy efficiency due to the high heating value of RDF. However, the authors add that this scenario may lead to a lower economic profit due to the current low RDF price, although an increase in its demand is expected given growing climate change concern.
The second and third positions in both scenarios 1 and 2 are for A4 (RCP with LFG) and A2 (MTP with LFG). A4 is preferred for its social repercussions, as is A2 for its low complexity and good economic balance. These results coincide with the positions obtained by [84] for two similar scenarios, which consider the recovery of materials combined with the final disposal of rejects. These authors evaluate eight scenarios by contemplating economic, socio-environmental, socio-technical and environmental indicators using multicriteria tools. They conclude that combining recycling with sanitary landfill sites is a good option in developing countries for cities that lack the necessary infrastructure and economic resources to implement a complete recycling and composting scheme. The fourth position in scenario 1 is attributed to A7, which stands out for environmental criteria, while in scenario 2, it is for A1, where the economic aspect prevails, followed by the technical one.
In scenario 3 (that does not consider the social criterion), the preferred alternative is A2. This alternative stands out for the economic criterion, which involves striking a balance between operational costs and economic rewards. In rankings 2 and 3 for the same scenario, A5 and A1 stand out, the former for its benefits for the environmental aspect and the latter for its economic benefits, which are followed by technical ones.
In scenario 4, which prioritizes the economic criterion, the preferred alternatives are those with higher economic rewards than O&M costs (in ranking order: A2, A1, A0, A5, A3). Of these, the best valued one coincides with less technical complexity and lower waste recovery (only a small fraction of MSW is recovered in alternative A2, with slag and metals from slag in alternatives A5 and A3). These results coincide with [85], who show that it is common in developing countries to contemplate the collection of only mixed waste for its simplicity, lower costs and less demanded public participation.

3.4. Practical Implications of the Results

Figure 3 shows the small differences between the preferred alternatives in the four scenarios: the difference between the Ri obtained for the alternatives that remain in the first and third positions is 0.11, 0.06, 0.02 and 0.04 in scenarios 1 to 4, respectively. This indicates that the ranking is very sensitive to weight distribution. Therefore, this result in a real case would point out the need to carry out a subsequent study to select the best of the more highly valued alternatives. The study could attempt to increase the accuracy of the indicators assessment to consider other relevant indicators in the specific context or to adjust the weights given to better reflect the corresponding priorities.
The Chilean government is planning to implement the Extended Producer Responsibility Law at the end of 2023 [86]. To fulfill the set collection and valorization goals, it is necessary to improve recovery efficiency by promoting different technologies and system designs. The promotion of systems such as those preferred in the first three analyzed scenarios, where a bigger waste fraction is recovered (in the form of recyclable materials, OF for compost, using rejects as fuel, and even energy recovery), would allow, among the already described benefits, to extend the useful life of final disposal sites, which is a pressing and urgent situation in the country.
The obtained partial results show that the solutions that incorporate some waste recovery stage far exceed the costs of the current scenario. With the values adopted in this study (economic retributions assumed for MSW reception and the sales of energy and materials), the financial balance would be only partially compensated. Economic remuneration is subject to the existence of demand and to fluctuations in RM prices and, thus, other incomes would be necessary. This need may be an obstacle for fulfilling the planned recovery goals and for also implementing new MSWM technologies in LAC countries unless economic instruments are created that progressively discourage final disposal and make waste treatment and recovery viable. In an analysis such as that herein presented, this reality is the equivalent to prioritizing economic aspects, and it could even be revealed with a new indicator (with a substantial weight in the decision), which explicitly contemplates economic balance.

4. Conclusions

This work proposes a sequential methodology to evaluate MSWM alternatives by considering various criteria to be applied in developing countries. The successive application of a screening matrix and a multicriteria weighting method allows seven treatment technologies to be defined and ranked by considering their technical, environmental, economic and social impacts for the case study.
The case study results indicate that several alternatives permit the current MSWM situation to improve, especially in countries such as Chile, which intend to fulfill high recovery goals, and where it is urgent to reduce the need for final disposal spaces.
The performed sensitivity analysis shows that the ranking is very sensitive to weight distribution. The preferred alternative for an equal distribution of weights (scenario 1) and when the environmental criterion is neglected (scenario 2) is A6, which stands out with an intensive recovery of waste resources through mixed waste pretreatment, RDF production using part of rejects, and gas recovery in landfills. When neglecting the social criterion, the first alternative in the ranking is A2, which includes a material recovery plant for a small fraction of recyclable materials collected separately (12% of the total MSW) and the final disposal (in a landfill with energy recovery) of the rest. Considering all the criteria with priority for economic aspects (with a 90% weight in scenario 4), the preferred alternatives are those with higher economic rewards than operation costs, which coincide with less technical complexity and the lowest waste recovery solutions, and focus on final disposal.
The results also demonstrate that economic criteria still currently prevail, which leads to strategies where waste is directed mainly to final disposal. The tendency is to maintain the status quo, which prevents the goals set by legislation from being fulfilled. In developing countries, the difficulty in financing alternatives that incorporate some recovery stage is one of the major obstacles to implement them. So, it is necessary to introduce economic instruments that progressively discourage final disposal to make waste treatment and recovery viable.
The methodology used in this study can be extended to other cases in Chile, in the LAC region or in developing countries in general by adjusting the solid waste data and scenario definitions. Depending on the interest and information available in each study, indicators can be added and the values assigned here can be modified. Whatever the objective is, attention must be paid to the given weights so that they reflect the real priorities of the context.

Supplementary Materials

The following supporting information can be downloaded at: https://www.mdpi.com/article/10.3390/su15097734/s1, Figure S1: A-2: MTP + LFG; Figure S2: A-3: I-ER + Ash-LF + LF; Figure S3: A-4: RCP + LFG; Figure S4: A-5: MTP + I-ER + Ash-LF + LF; Figure S5: A-6: RCP + Production of RDF + LFG; Figure S6: A-7: RBCP + LFG.

Author Contributions

Conceptualization, A.L.G.d.C.; methodology, A.L.G.d.C.; formal analysis, E.R.T.; investigation, E.R.T. and A.L.M.; resources, E.R.T. and A.L.M.; data curation, A.L.M.; writing—original draft preparation, E.R.T.; writing—review and editing, A.L.G.d.C. and A.L.M.; supervision, A.L.G.d.C. All authors have read and agreed to the published version of the manuscript.

Funding

This research received no external funding.

Institutional Review Board Statement

Not applicable.

Informed Consent Statement

Not applicable.

Data Availability Statement

The data presented in this study are available in the Supplementary Materials.

Conflicts of Interest

The authors declare no conflict of interest.

Abbreviations

Ash-LFAsh landfillMSWMMunicipal solid waste management
GHGGreenhouse gasOFOrganic fraction
I-ERIncineration with energy recoveryO&MOperation and maintenance
LACLatin America and the CaribbeanRBCPMaterials recovery, biomethanization and composting plant
LHVLower heating valueRCPMaterials recovery and composting plant
LFLandfillRDFRefuse derived fuel
LFGLandfill gasRMRecovered materials
MBTMechanical–biological treatmentTOPSISTechnique for Order of Preference by Similarity to Ideal Solution
MTPMechanical treatment plantWtEWaste-to-Energy
MSWMunicipal solid waste

References

  1. Kaza, S.; Yao, L.C.; Bhada-Tata, P.; Van Woerden, F. What a Waste 2.0: A Global Snapshot of Solid Waste Management to 2050; World Bank Publications: Washington, DC, USA, 2018. [Google Scholar]
  2. Chalhoub, M.S. Public Policy and Technology Choices for Municipal Solid Waste Management a Recent Case in Lebanon. Cogent Environ. Sci. 2018, 4, 1529853. [Google Scholar] [CrossRef]
  3. Ferreira, C.R.N.; Infiesta, L.R.; Monteiro, V.A.L.; Starling, M.C.V.M.; da Silva Júnior, W.M.; Borges, V.L.; Carvalho, S.R.; Trovó, A.G. Gasification of Municipal Refuse-Derived Fuel as an Alternative to Waste Disposal: Process Efficiency and Thermochemical Analysis. Process Saf. Environ. Prot. 2021, 149, 885–893. [Google Scholar] [CrossRef]
  4. Tsydenova, N.; Vázquez Morillas, A.; Cruz Salas, A. Sustainability Assessment of Waste Management System for Mexico City (Mexico)—Based on Analytic Hierarchy Process. Recycling 2018, 3, 45. [Google Scholar] [CrossRef]
  5. Margallo, M.; Ziegler-Rodriguez, K.; Vázquez-Rowe, I.; Aldaco, R.; Irabien, Á.; Kahhat, R. Enhancing Waste Management Strategies in Latin America under a Holistic Environmental Assessment Perspective: A Review for Policy Support. Sci. Total Environ. 2019, 689, 1255–1275. [Google Scholar] [CrossRef] [PubMed]
  6. Ghazvinei, P.T.; Mir, M.A.; Darvishi, H.H.; Ariffin, J. University Campus Solid Waste Management: Combining Life Cycle Assessment and Analytical Hierarchy Process; Springer Briefs in Environmental Science; Springer International Publishing: Cham, Switzerland, 2017; ISBN 978-3-319-43227-4. [Google Scholar]
  7. Wilson, D.C.; Rodic, L.; Modak, P.; Soos, R.; Carpintero Rogero, A.; Velis, C.; Iyer, M.; Simonett, O. Global Waste Management Outlook; United Nations Environment Programme & International Solid Waste Association: Vienna, Austria, 2015; ISBN 9789280734799. [Google Scholar]
  8. Batista, M.; Goyannes Gusmão Caiado, R.; Gonçalves Quelhas, O.L.; Brito Alves Lima, G.; Leal Filho, W.; Rocha Yparraguirre, I.T. A Framework for Sustainable and Integrated Municipal Solid Waste Management: Barriers and Critical Factors to Developing Countries. J. Clean. Prod. 2021, 312, 127516. [Google Scholar] [CrossRef]
  9. Yadav, P.; Samadder, S.R. A Global Prospective of Income Distribution and Its Effect on Life Cycle Assessment of Municipal Solid Waste Management: A Review. Environ. Sci. Pollut. Res. 2017, 24, 9123–9141. [Google Scholar] [CrossRef]
  10. Kaza, S.; Bhada-Tata, P. Decision Maker’s Guides for Solid Waste Management Technologies; World Bank Publications: Washington, DC, USA, 2018. [Google Scholar]
  11. United Nations. Department of Economic and Social Affairs. Population Division. World Population Prospects 2022: Summary of Results; UN DESA/POP/2022/TR/NO. 3; United Nations: New York, NY, USA, 2022. [Google Scholar]
  12. UN-Habitat. World Cities Report 2022. Envisaging the Future of Cities; United Nations Human Settlements Programme: Nairobi, Kenya, 2022. [Google Scholar]
  13. Hettiarachchi, H.; Ryu, S.; Caucci, S.; Silva, R. Municipal Solid Waste Management in Latin America and the Caribbean: Issues and Potential Solutions from the Governance Perspective. Recycling 2018, 3, 19. [Google Scholar] [CrossRef]
  14. Ministerio del Medio Ambiente; Gobierno de Chile. Decreto 12. Establece Metas de Recolección y Valorización y Otras Obligaciones Asociadas de Envases y Embalajes; Biblioteca del Congreso Nacional—Ley Chile: Santiago de Chile, Chile, 2021. [Google Scholar]
  15. Ministerio del Medio Ambiente; Gobierno de Chile. Estrategia Nacional de Residuos Orgánicos. Chile 2040; Ministerio del Medio Ambiente: Santiago de Chile, Chile, 2020. [Google Scholar]
  16. Subsecretaría de Desarrollo Regional y Administrativo; Gobierno de Chile. Diagnóstico de La Situación Por Comuna y Por Región En Materia de Residuos Sólidos Domiciliarios y Asimilables; Subsecretaría de Desarrollo Regional y Administrativo: Santiago de Chile, Chile, 2018. [Google Scholar]
  17. Ministerio del Medio Ambiente; Gobierno de Chile. Registro de Emisiones y Transferencias de Contaminantes. Tasas de Valorización o Reciclaje de Residuos Municipales. 2019. Available online: https://retc.mma.gob.cl/indicadores/residuos-disposicion-al-suelo/ (accessed on 4 June 2022).
  18. KDM S.A. Declaración de Impacto Ambiental. Planta Recuperadora de Reciclables Relleno Sanitario Loma Los Colorados. Available online: https://www.e-seia.cl/archivos/9b8_DIA_Planta_Recuperadora_RSLLC_KDM_rev08.pdf (accessed on 22 April 2021).
  19. Savino, A.; Solorzano, G.; Quispe, C.; Correal, M.C. Waste Management Outlook for Latin America and the Caribbean; UN Environment; United Nations Environment Programme, Latin America and the Caribbean Office: Panama City, Panama, 2018. [Google Scholar]
  20. Delgado, M.; López, A.; Cuartas, M.; Rico, C.; Lobo, A. A Decision Support Tool for Planning Biowaste Management Systems. J. Clean. Prod. 2020, 242, 118460. [Google Scholar] [CrossRef]
  21. Tan, S.T.; Hashim, H.; Lim, J.S.; Ho, W.S.; Lee, C.T.; Yan, J. Energy and Emissions Benefits of Renewable Energy Derived from Municipal Solid Waste: Analysis of a Low Carbon Scenario in Malaysia. Appl. Energy 2014, 136, 797–804. [Google Scholar] [CrossRef]
  22. Di Maria, F.; Sordi, A.; Micale, C. Experimental and Life Cycle Assessment Analysis of Gas Emission from Mechanically–Biologically Pretreated Waste in a Landfill with Energy Recovery. Waste Manag. 2013, 33, 2557–2567. [Google Scholar] [CrossRef]
  23. The World Bank. Energy Sector Management Assistance Programme. In Handbook for the Preparation of Landfill Gas to Energy Projects in Latin America and the Caribbean; The International Bank for Reconstruction and Development: Washington, DC, USA, 2004. [Google Scholar]
  24. Ouda, O.K.M.; Raza, S.A.; Nizami, A.S.; Rehan, M.; Al-Waked, R.; Korres, N.E. Waste to Energy Potential: A Case Study of Saudi Arabia. Renew. Sustain. Energy Rev. 2016, 61, 328–340. [Google Scholar] [CrossRef]
  25. Mutz, D.; Hengevoss, D.; Hugi, C.; Gross, T. Waste-to-Energy Options in Municipal Solid Waste Management. A Guide for Decision Makers in Developing and Emerging Countries; Hinchliffe, D., Frommann, J., Gunsilius, E., Eds.; Deutsche Gesellschaft für Internationale Zusammenarbeit (GIZ) GmbH: Eschborn, Germany, 2017. [Google Scholar]
  26. Abdallah, M.; Shanableh, A.; Arab, M.; Shabib, A.; Adghim, M.; El-Sherbiny, R. Waste to Energy Potential in Middle Income Countries of MENA Region Based on Multi-Scenario Analysis for Kafr El-Sheikh Governorate, Egypt. J. Environ. Manag. 2019, 232, 58–65. [Google Scholar] [CrossRef] [PubMed]
  27. Pires, A.; Martinho, G.; Chang, N.-B. Solid Waste Management in European Countries: A Review of Systems Analysis Techniques. J. Environ. Manag. 2011, 92, 1033–1050. [Google Scholar] [CrossRef]
  28. Edo Alcón, N. Diseño de Una Metodología Para El Control de Calidad de Los Rechazos Producidos En Las Plantas de Tratamiento Mecánico-Biológico de Residuos Sólidos Urbanos. Ph.D. Thesis, Doctorado en Tecnologías Industriales y Materiales, Jaume I University, Castellón, Spain, 2019. [Google Scholar]
  29. Ministerio de Agricultura Alimentación y Medio Ambiente; Gobierno de España. Gestión de Biorresiduos de Competencia Municipal. Guía Para La Implementación de La Recogida Separada y Tratamiento de La Fracción Orgánica; Servicio de Publicaciones del Ministerio de Agricultura, Alimentación y Medio Ambiente: Madrid, Spain, 2013. [Google Scholar]
  30. Waste Atlas. Charts. MBT Charts. Annual Capacity. Available online: http://www.atlas.d-waste.com/ (accessed on 12 September 2022).
  31. ecoprog. The Market for Mechanical Biological Waste Treatment in Europe. Locations, Plants, Backgrounds and Market Estimations. Available online: https://www.ecoprog.com/publikationen/abfallwirtschaft/mba.htm (accessed on 18 April 2020).
  32. Asefi, H.; Shahparvari, S.; Chhetri, P. Advances in Sustainable Integrated Solid Waste Management Systems: Lessons Learned over the Decade 2007–2018. J. Environ. Plan. Manag. 2020, 63, 2287–2312. [Google Scholar] [CrossRef]
  33. De Feo, G.; Galasso, M.; Landi, R.; Donnarumma, A.; De Gisi, S. A Comparison of the Efficacy of Organic and Mixed-Organic Polymers with Polyaluminium Chloride in Chemically Assisted Primary Sedimentation (CAPS). Environ. Technol. 2013, 34, 1297–1305. [Google Scholar] [CrossRef]
  34. Hwang, C.-L.; Yoon, K. Methods for Multiple Attribute Decision Making. In Lecture Notes in Economics and Mathematical Systems; Springer: Berlin/Heidelberg, Germany, 1981; Volume 186, pp. 58–191. ISBN 978-3-540-10558-9. [Google Scholar]
  35. Yoon, K. A Reconciliation among Discrete Compromise Solutions. J. Oper. Res. Soc. 1987, 38, 277. [Google Scholar] [CrossRef]
  36. Hwang, C.-L.; Lai, Y.-J.; Liu, T.-Y. A New Approach for Multiple Objective Decision Making. Comput. Oper. Res. 1993, 20, 889–899. [Google Scholar] [CrossRef]
  37. Alao, M.A.; Ayodele, T.R.; Ogunjuyigbe, A.S.O.; Popoola, O.M. Multi-Criteria Decision Based Waste to Energy Technology Selection Using Entropy-Weighted TOPSIS Technique: The Case Study of Lagos, Nigeria. Energy 2020, 201, 117675. [Google Scholar] [CrossRef]
  38. Elsayed, E.A.; Dawood, A.K.S.; Yan, K. Evaluating Alternatives through the Application of Topsis Method with Entropy Weight. Int. J. Eng. Trends Technol. 2017, 46, 60–66. [Google Scholar] [CrossRef]
  39. Shahnazari, A.; Rafiee, M.; Rohani, A.; Bhushan Nagar, B.; Ebrahiminik, M.A.; Aghkhani, M.H. Identification of Effective Factors to Select Energy Recovery Technologies from Municipal Solid Waste Using Multi-Criteria Decision Making (MCDM): A Review of Thermochemical Technologies. Sustain. Energy Technol. Assess. 2020, 40, 100737. [Google Scholar] [CrossRef]
  40. Ali, Y.; Aslam, Z.; Dar, H.S.; Mumtaz, U.U. A Multi-Criteria Decision Analysis of Solid Waste Treatment Options in Pakistan: Lahore City—A Case in Point. Environ. Syst. Decis. 2018, 38, 528–543. [Google Scholar] [CrossRef]
  41. Govind Kharat, M.; Murthy, S.; Jaisingh Kamble, S.; Raut, R.D.; Kamble, S.S.; Govind Kharat, M. Fuzzy Multi-Criteria Decision Analysis for Environmentally Conscious Solid Waste Treatment and Disposal Technology Selection. Technol. Soc. 2019, 57, 20–29. [Google Scholar] [CrossRef]
  42. Gaur, A.; Prakash, H.; Anand, K.; Kumar, G.; Hussain, A. Evaluation of Municipal Solid Waste Management Scenarios Using Multi-Criteria Decision Making under Fuzzy Environment. Process Integr. Optim. Sustain. 2022, 6, 307–321. [Google Scholar] [CrossRef]
  43. Alzate, S.; Restrepo-Cuestas, B.; Jaramillo-Duque, Á. Municipal Solid Waste as a Source of Electric Power Generation in Colombia: A Techno-Economic Evaluation under Different Scenarios. Resources 2019, 8, 51. [Google Scholar] [CrossRef]
  44. Lino, F.A.M.; Ismail, K.A.R. Evaluation of the Treatment of Municipal Solid Waste as Renewable Energy Resource in Campinas, Brazil. Sustain. Energy Technol. Assess. 2018, 29, 19–25. [Google Scholar] [CrossRef]
  45. Sagastume Gutiérrez, A.; Mendoza Fandiño, J.M.; Cabello Eras, J.J. Alternatives of Municipal Solid Wastes to Energy for Sustainable Development. The Case of Barranquilla (Colombia). Int. J. Sustain. Eng. 2021, 14, 1809–1825. [Google Scholar] [CrossRef]
  46. Ludlow, J.; Jalil-Vega, F.; Schmidt Rivera, X.; Garrido, R.A.; Hawkes, A.; Staffell, I.; Balcombe, P. Organic Waste to Energy: Resource Potential and Barriers to Uptake in Chile. Sustain. Prod. Consum. 2021, 28, 1522–1537. [Google Scholar] [CrossRef]
  47. González, P.; Riveros, S.; Concha, S.; Casas, Y. Waste-to-Energy Options within a Circular Economy Strategy in a Developing Country: The Case of the Bio Bio Region in Chile. Int. J. Energy Prod. Manag. 2018, 3, 144–156. [Google Scholar] [CrossRef]
  48. Torres-Lozada, P.; Manyoma-Velásquez, P.; Gaviria-Cuevas, J.F. Prioritization of Waste-to-Energy Technologies Associated with the Utilization of Food Waste. Sustainability 2023, 15, 5857. [Google Scholar] [CrossRef]
  49. Ossa, D.A.; Aristizábal, A.J.; Ospina, D. Comprehensive Analysis of Solid Waste for Energy Projects in Colombia. Eng. J. 2020, 24, 35–52. [Google Scholar] [CrossRef]
  50. Taboada-González, P.; Aguilar-Virgen, Q.; Ojeda-Benítez, S.; Cruz-Sotelo, S. Application of Analytic Hierarchy Process in a Waste Treatment Technology Assessment in Mexico. Environ. Monit. Assess. 2014, 186, 5777–5795. [Google Scholar] [CrossRef] [PubMed]
  51. Brenes-Peralta, L.; Jiménez-Morales, M.F.; Campos-Rodríguez, R.; De Menna, F.; Vittuari, M. Decision-Making Process in the Circular Economy: A Case Study on University Food Waste-to-Energy Actions in Latin America. Energies 2020, 13, 2291. [Google Scholar] [CrossRef]
  52. Rodrigues, E.; Mondelli, G. Assessment of Integrated MSW Management Using Multicriteria Analysis in São Paulo City. Int. J. Environ. Sci. Technol. 2021, 19, 7981–7992. [Google Scholar] [CrossRef]
  53. Fernández-González, J.M.; Grindlay, A.L.; Serrano-Bernardo, F.; Rodríguez-Rojas, M.I.; Zamorano, M. Economic and Environmental Review of Waste-to-Energy Systems for Municipal Solid Waste Management in Medium and Small Municipalities. Waste Manag. 2017, 67, 360–374. [Google Scholar] [CrossRef] [PubMed]
  54. Waste-C-Control. Database of Waste Management Technologies. Available online: http://www.epem.gr/waste-c-control/database/default.htm (accessed on 12 February 2020).
  55. Correal, M.; Rihm, A. Towards the Valorization of Solid Waste in Latin America and the Caribbean. Basic Concepts, Feasibility Analysis and Public Policy Recommendations; Interamerican Development Bank: Washington, DC, USA, 2022. [Google Scholar]
  56. Rodrigo Ilarri, J.; Rodrigo Clavero, M.E.; Fernández González, J.M. Alternativas de Valorización y Eliminación de Residuos Sólidos Urbanos; ENTORNOS Diseño y percepción, S.L., Ed.; Reproval, S.L.: Valencia, Spain, 2014. [Google Scholar]
  57. Tchobanoglous, G.; Kreith, F. Handbook of Solid Waste Management, 2nd ed.; McGraw Hill Professional: New York, NY, USA, 2002; ISBN 9780071356237. [Google Scholar]
  58. Heyer, K.U.; Hupe, K.; Stegmann, R. Methane Emissions from MBT Landfills. Waste Manag. 2013, 33, 1853–1860. [Google Scholar] [CrossRef]
  59. Zaman, A.U. Comparative Study of Municipal Solid Waste Treatment Technologies Using Life Cycle Assessment Method. Int. J. Environ. Sci. Technol. 2010, 7, 225–234. [Google Scholar] [CrossRef]
  60. Di Maria, F.; Sordi, A.; Micale, C. Optimization of Solid State Anaerobic Digestion by Inoculum Recirculation: The Case of an Existing Mechanical Biological Treatment Plant. Appl. Energy 2012, 97, 462–469. [Google Scholar] [CrossRef]
  61. Hong, J.; Li, X.; Zhaojie, C. Life Cycle Assessment of Four Municipal Solid Waste Management Scenarios in China. Waste Manag. 2010, 30, 2362–2369. [Google Scholar] [CrossRef]
  62. Di Maria, F.; Sordi, A.; Micale, C. Energy Production from Mechanical Biological Treatment and Composting Plants Exploiting Solid Anaerobic Digestion Batch: An Italian Case Study. Energy Convers. Manag. 2012, 56, 112–120. [Google Scholar] [CrossRef]
  63. Murphy, J.D.; McKeogh, E. Technical, Economic and Environmental Analysis of Energy Production from Municipal Solid Waste. Renew. Energy 2004, 29, 1043–1057. [Google Scholar] [CrossRef]
  64. Manfredi, S.; Tonini, D.; Christensen, T.H.; Scharff, H. Landfilling of Waste: Accounting of Greenhouse Gases and Global Warming Contributions. Waste Manag. Res. J. A Sustain. Circ. Econ. 2009, 27, 825–836. [Google Scholar] [CrossRef]
  65. Smith, A.; Brown, K.; Ogilvie, S.; Rushton, K.; Bates, J. Waste Management Options and Climate Change; Final Report ED21158R4.1; Office for Official Publications of the European Communities: Luxembourg, 2001. [Google Scholar]
  66. Hill, N.; Walker, H.; Beevor, J.; James, K. 2011 Guidelines to Defra/DECC’s GHG Conversion Factors for Company Reporting: Methodology Paper for Emission Factors; DEFRA-Department for Environment Food and Rural Affairs: London, UK, 2011. [Google Scholar]
  67. Friends of the Earth. More Jobs, Less Waste. Potential for Job Creation through Higher Rates of Recycling in the UK and EU; Friends of the Earth Limited: London, UK, 2010. [Google Scholar]
  68. Fuentealba Bahamondes, J.E. Plan de Negocio Planta de Tratamiento Mecánico Biológico de Residuos Sólidos Urbanos. Master’s Thesis, Facultad de Ciencias Físicas y Matemáticas, University of Chile, Santiago de Chile, Chile, 2018. [Google Scholar]
  69. Lam, C.H.K.; Ip, A.W.M.; Barford, J.P.; McKay, G. Use of Incineration MSW Ash: A Review. Sustainability 2010, 2, 1943–1968. [Google Scholar] [CrossRef]
  70. Correal, M.; Laguna, A. Estimación de Costos de Recolección Selectiva y Clasificación de Residuos Con Inclusión de Organizaciones de Recicladores: Herramienta de Cálculo y Estudios de Caso En América Latina y El Caribe; Inter American Development Bank: Washington, DC, USA, 2018. [Google Scholar]
  71. Global Petrol Prices. Electricity Prices, June 2022. Available online: https://www.globalpetrolprices.com/electricity_prices/ (accessed on 2 February 2023).
  72. Coordinador Eléctrico Nacional. Costos Marginales. Available online: https://www.coordinador.cl/mercados/graficos/costos-marginales/ (accessed on 21 September 2022).
  73. Comisión Nacional de Energía de Chile. Anuario Estadístico de Energía. Available online: https://www.cne.cl/wp-content/uploads/2022/07/AnuarioEstadisticoEnergia2021.pdf (accessed on 10 October 2022).
  74. Soares, F.R.; Martins, G. Using Life Cycle Assessment to Compare Environmental Impacts of Different Waste to Energy Options for Sao Paulo’s Municipal Solid Waste. J. Solid Waste Technol. Manag. 2017, 43, 36–46. [Google Scholar] [CrossRef]
  75. Hoang, A.T.; Varbanov, P.S.; Nižetić, S.; Sirohi, R.; Pandey, A.; Luque, R.; Ng, K.H.; Pham, V.V. Perspective Review on Municipal Solid Waste-to-Energy Route: Characteristics, Management Strategy, and Role in Circular Economy. J. Clean. Prod. 2022, 359, 131897. [Google Scholar] [CrossRef]
  76. OECD-Organization for Economic Cooperation and Development. Waste Management and the Circular Economy in Selected OECD Countries; Organisation for Economic Cooperation and Development: France, Paris, 2019. [Google Scholar] [CrossRef]
  77. Van Caneghem, J.; Van Acker, K.; De Greef, J.; Wauters, G.; Vandecasteele, C. Waste-to-Energy Is Compatible and Complementary with Recycling in the Circular Economy. Clean Technol. Environ. Policy 2019, 21, 925–939. [Google Scholar] [CrossRef]
  78. Milutinović, B.; Stefanović, G.; Dassisti, M.; Marković, D.; Vučković, G. Multi-Criteria Analysis as a Tool for Sustainability Assessment of a Waste Management Model. Energy 2014, 74, 190–201. [Google Scholar] [CrossRef]
  79. Milutinović, B.; Stefanović, G.; Kyoseva, V.; Yordanova, D.; Dombalov, I. Sustainability Assessment and Comparison of Waste Management Systems: The Cities of Sofia and Niš Case Studies. Waste Manag. Res. J. A Sustain. Circ. Econ. 2016, 34, 896–904. [Google Scholar] [CrossRef]
  80. Khan, I.; Kabir, Z. Waste-to-Energy Generation Technologies and the Developing Economies: A Multi-Criteria Analysis for Sustainability Assessment. Renew. Energy 2020, 150, 320–333. [Google Scholar] [CrossRef]
  81. Dirección de Estudios Sociales del Instituto de Sociología. Informe Final. “Encuesta Nacional de Medio Ambiente 2018”. Licitación N° 608897-110-LE17; Pontificia Universidad Católica de Chile: Santiago de Chile, Chile, 2018. [Google Scholar]
  82. Vlachokostas, C.; Achillas, C.; Michailidou, A.V.; Tsegas, G.; Moussiopoulos, N. Externalities of Energy Sources: The Operation of a Municipal Solid Waste-to-Energy Incineration Facility in the Greater Thessaloniki Area, Greece. Waste Manag. 2020, 113, 351–358. [Google Scholar] [CrossRef]
  83. Zhao, R.; Sun, L.; Zou, X.; Fujii, M.; Dong, L.; Dou, Y.; Geng, Y.; Wang, F. Towards a Zero Waste City- an Analysis from the Perspective of Energy Recovery and Landfill Reduction in Beijing. Energy 2021, 223, 120055. [Google Scholar] [CrossRef]
  84. Coban, A.; Ertis, I.F.; Cavdaroglu, N.A. Municipal Solid Waste Management via Multi-Criteria Decision Making Methods: A Case Study in Istanbul, Turkey. J. Clean. Prod. 2018, 180, 159–167. [Google Scholar] [CrossRef]
  85. Alzamora, B.R.; de Vasconcelos Barros, R.T.; de Oliveira, L.K.; Gonçalves, S.S. Forecasting and the Influence of Socioeconomic Factors on Municipal Solid Waste Generation: A Literature Review. Environ. Dev. 2022, 44, 100734. [Google Scholar] [CrossRef]
  86. Ministerio del Medio Ambiente. Gobierno de Chile. Ley 20920. Establece El Marco Para La Gestión de Residuos, La Responsabilidad Extendida Del Productor y Fomento Al Reciclaje; Biblioteca del Congreso Nacional—Ley Chile: Santiago de Chile, Chile, 2016. [Google Scholar]
Figure 1. Proposed methodology for the definition and selection of waste management alternatives.
Sustainability 15 07734 g001
Figure 2. Ri values for the eight alternatives evaluated per criteria (by taking equal weights for all the indicators considered per criterion).
Sustainability 15 07734 g002
Figure 3. Ri values for the eight alternatives evaluated per scenario: scenario 1 with all the criteria; scenario 2 and scenario 3 that neglect the environmental and social criteria, respectively; scenario 4 where 90% of the total weight is assigned to the economic criterion.
Sustainability 15 07734 g003
Table 1. Screening matrix. Criteria for the applicability of the considered treatment units.
Conditioning FactorsLFLFGMTPRCPRBCPI-ER
FractionMixedMixed aMixed
Recyclables
Mixed a and OFMixed a and OFMixed [10] a
LHV (MJ/kg)---- b- b>7 [25]
Quantity (t/y)->50,000 [23], c10,000–
50,000 [54]
10,000–
500,000 [30,54]
10,000–
328,000 [54]
60,000–
500,000 [10]
Technical complexityLowMedium [55]Medium [55]Medium [55]Medium-high [55]Medium-high [55]
Proven technologyProven [10]Proven [10]Proven [55]Proven [55]Proven [55]Proven [55]
Investment costs (€/t/y) d2–20 e5–50 [10]100–198 [54]42–560 [54]58–420 [54]180–1181 [10,54]
O&M costs (€/t/y) d2–34 e6–114 [10]18–40 [54,56]24–95 [54]18–160 [54]8–205 [54]
a OF > 30%. It should represent <50% for I-ER the OF. b RDF could be produced with the rejection of these plants if it exceeds the required energy potential. c Value adapted for an average operation time of 20 years. d Costs of technologies vary with their installed capacity. e Estimated from the values for LFG.
Table 2. Assessment of the indicators proposed for the assessment of municipal waste treatment alternatives.
CriteriaIndicatorsLFLFGAsh-LFI-ERMTPRCPRBCP
Technical
(T)
T1Energy produced (kWh/t)080; 16 [57,58] a0544 [59]--220 [60]
T2Energy consumption (kWh/t)0.42 [61]0.42 [61]0.42 [61]153 [61]23.1 [62], b33 [62]98.1 [62,63] c
T3Technical complexity1245334
Environmental
(E)
E1GHG emissions (kg CO2-eq/t)674/−25.5 [64] d,e−24 [64] d1.1 [65] f−10 [65] - g−42 [66] h−126 [66] h
E2Soil occupation (m2/t)4.21 [61]4.21 [61]2.1 [61] i0.76 [61]0.4 [10]1.2 [10]0.63 [10,63]
E3Materials recovery (t/y) 000- j- j- j- j
E4Odor nuisances5311132
Economic
(EC)
EC1Investment costs (€/t/y)54.5 [53] j73.1 [53] j16.8 [53] j242.7 [53] j104.3 [53] j140.6 [53] j142.4 [53] j
EC2O&M costs (€/t/y)10.9 [53] j12.7 [53] j3.2 [53] j42.7 [53] j28.8 [53] j35.7 [53] j36.1 [53] j
EC3Economic remunerations (€/t) -- k0- k- k- k- k
Social
(S)
S1Job creation (Jobs/1000t) 0.1 [67]0. 1 [67]0.1 [67]0.1 [67]0.4 [68]0.4 [68]0.4 [68]
S2Social acceptance 1211544
S3Occupational risks5555334
a OF values for not treated and treated in MBT, respectively. For the calculation of the energy potential of waste in landfills, see the details below this table. b Adapted value: it is assumed that MTP consumes 70% of the energy of RCP. c Adapted value: AD consumes 75 kWh/t. This value is assumed plus 70% of the RCP consumption. d Average values. e For a conventional landfill and a low organic waste landfill with gas flaring, respectively. f Only the emissions from transporting ash from the incineration plant to the sanitary landfill are considered. g Only the avoided emissions per type of RM are considered (Table 3). h Only the emissions avoided by the OF treatment are considered (Table 3). i Half the land occupation established for a conventional landfill is considered. j Adapted value. k Economic remunerations from waste reception and the sale of by-products (energy, biostabilized material, RDF, RM) are discussed in the text. The values taken in this study are shown in Table 3.
Table 4. MSW treatment alternatives considered in the case study.
AlternativeProcessSystems Summary
PretreatmentWtEFinal Disposal
A0--LFLF
A1-LFGLFGLFG
A2MTP *LFGLFGMTP + LFG
A3-I-ERAsh-LF + LFI-ER + Ash-LF + LF
A4RCPLFGLFGRCP + LFG
A5MTP *I-ERAsh-LF + LFMTP + I-ER + Ash-LF + LF
A6RCPRDF productionLFGRCP + RDF production + LFG
A7RBCPBiomethanizationLFGRBCP + LFG
* For the separation of materials from the separately collected fraction (12% of total MSW amount).
Table 5. Summary of the mass balance per alternative.
AlternativeRecovered MaterialsBiological TreatmentRDFLandfill b
RMRejectsBiostabilizedRejectsLosses a
t/yt/yt/yt/yt/yt/yt/y
A0------165,937 c
A1------165,937 d
A214,456 e6181----151,481 d
A320,507 f16,995----16,995 g,h
A47334 e76,78619,24326,94034,638-104,722 d,g
A533,132 e,f15,330----15,330 g,h
A68356 e,i76,78619,24326,94034,63851,75151,950 g,d
A78147 e76,96919,24326,94034,638-103,909 g,d
a Water loss by evaporation, solids converted into gas, etc. b Disposal of rejects from the mechanical, biological and RDF pretreatment for the corresponding cases. c Landfill with flare. d Landfill with biogas production (LFG). e RM recovered from mechanical treatment: plastic, glass, paper, cardboard, metal. f Materials valorized from slag. The metals recovered from slag correspond to 2% of RM. g Bulky waste represents 0.6% of the input waste. For A5, it represents 0.5% of input. h Corresponding to rejects from slag recovery and fly ash. The latter is disposed separately in an Ash-LF and represents 1% of rejects. i It includes the metals recovered during the RDF production process.
Table 6. Assessment of indicators per alternative.
AlternativeTechnicalEnvironmentalEconomicSocial
T1T2T3E1E2E3E4EC1EC2EC3S1S2S3
kWh/ykWh/y-t CO2-eqm2t/y-€/y€/yJobs--
A0069,6941111,842698,595059,034,6061,801,4122,262,4091715
A17,964,97669,6942−3982698,5950312,126,6762,114,7012,819,9581725
A27,964,976540,3472−5849645,98914,456313,222,7052,525,4903,666,8452325
A389,728,11025,198,63558689194,16820,507141,134,0937,265,9328,714,9821815
A41,101,2735,487,0493−8941640,00426,577330,977,1947,261,8482,826,1967734
A581,931,32523,485,68445599184,08833,132139,481,7697,188,7518,718,8692515
A6831,1975,464,8843−25,193417,83379,349326,625,4506,710,2424,153,8837234
A719,443,22616,224,3913−15,949541,99827,390231,219,7857,321,8442,898,0477734
Table 7. Normalized scores * per indicator and alternative, and the overall ranking in the balanced weighting scenario.
AlternativeTechnicalEnvironmentalEconomicSocialOverall Ranking
T1T2T3E1E2E3E4EC1EC2EC3S1S2S3
A00.0000.3330.3330.0000.0000.0000.0000.3330.3330.0000.0000.0000.0008
A10.0300.3330.2420.2110.0000.0000.1350.3010.3140.0290.0000.1500.0005
A20.0300.3270.2310.2150.0260.0460.1510.2900.2900.0730.0380.2040.0653
A30.3330.0000.0000.1880.2450.0650.2470.0000.0030.3330.0090.0000.0007
A40.0040.2610.1860.2200.0280.0840.1350.1050.0040.0290.3330.3330.3332
A50.3040.0230.0160.1940.2500.1040.2500.0170.0080.3330.0460.0660.0606
A60.0030.2620.1390.2500.1360.2500.1440.1510.0370.0980.3040.3310.3131
A70.0720.1190.1300.2330.0760.0860.1760.1030.0000.0330.3330.3330.1674
* The highest score per indicator is depicted in bold.
Disclaimer/Publisher’s Note: The statements, opinions and data contained in all publications are solely those of the individual author(s) and contributor(s) and not of MDPI and/or the editor(s). MDPI and/or the editor(s) disclaim responsibility for any injury to people or property resulting from any ideas, methods, instructions or products referred to in the content.

