Article

How Does the Degree of Competition in an Industry Affect a Company’s Environmental Management and Performance?

1
Department of Business Administration, Anyang University, Anyang 14028, Republic of Korea
2
College of Business Administration, Konkuk University, Seoul 05029, Republic of Korea
*
Author to whom correspondence should be addressed.
Sustainability 2023, 15(9), 7675; https://doi.org/10.3390/su15097675
Submission received: 1 March 2023 / Revised: 20 April 2023 / Accepted: 4 May 2023 / Published: 7 May 2023

Abstract

:
Environmental management, which was recognized as a functional part of corporate management, has recently been recognized as a strategic element of all business activities. It can be defined as a series of management activities to improve environmental performance throughout the business process and simultaneously achieve profitability and sustainability. Accordingly, businesses are now abandoning the existing management philosophy that economic and environmental feasibility are inevitably in conflict and establishing strategies and methods to achieve both. Meanwhile, industry affects the business performance of individual companies. Since the performance of a company tends to be influenced by the intensity of competition in an industry, it is necessary to analyze the structural factors that determine the intensity of competition in an industry in order to predict the future performance of a company. Therefore, we studied how environmental management affects corporate performance given the level of industry competition. The results are as follows. First, environmental management positively impacts corporate performance. Second, a high level of competition within an industry moderates the relationship between environmental management and corporate performance. By verifying the influence of the industry to which a company belongs, that is, the level of competition within the industry, we confirm that a company’s environmental management can be used strategically to gain a competitive advantage. With the finding that the impact of a company’s environmental practices differs by industry in line with the degree of competition, we expect this study to be helpful for future research into strategic ESG activities.

1. Introduction

Numerous studies have investigated issues related to environmental management and the results have revealed a relationship between corporate activities harmful to the environment and corporate performance [1,2,3]. Moreover, the COVID-19 pandemic has raised awareness on the importance of corporate investment in a robust environmental management system [4]. This is because people’s perceptions of the environment have changed significantly due to the emergence of social issues such as the pandemic that have been caused by climate change [5]. As the business environment has changed due to climate change, the role of environmental responsibility in realizing social value has been emphasized. In the past, if a company neglected social responsibility activities, it was only to the extent that it was not praised. Today, however, if a company does not practice environmental management, its performance drops, investors sell their stocks, financial institutions do not lend it money, and consumers turn away [6]. Therefore, researchers now emphasize the need to investigate the role of environmental practices in sustainable corporate growth [5,6].
In 1989, an Exxon Valdez tanker ran aground on a reef in Alaska, USA. The costs of and fines for the removal of spilled crude oil became an opportunity for companies to attach importance to environmental responsibility [7]. In a survey by the Federation of Korean Industries, the most authoritative national association of businessmen in Korea, environmental response was evaluated as being the most important among ESG (environment, society, governance) activities for global management. In addition, after the US administration of Joe Biden rejoined the Paris Climate Agreement and established a global trend that imprints the keyword “environment” with the goal of net zero carbon emissions by 2050, corporate responsibility toward the environment has become the biggest concern [8]. Consequently, an increasing number of investment institution managers now make climate change and sustainability the top priorities in their portfolios when making decisions [9]. This suggests that new investments in coal-related businesses, the main culprit of greenhouse gas emissions, will be completely stopped in the future, and existing coal-related businesses may close or withdraw sequentially. Industries causing harm to the environment must recognize the importance of ESG to a company and perform it. It is also necessary to respond to environmental risks by establishing environmental management systems [10]. Environmental management was earlier recognized as a functional part of corporate management. Now, however, it is recognized as a strategic factor in all management activities of a company. From this perspective, it is a series of management activities to simultaneously achieve economic profitability and sustainability by improving environmental performance throughout the business process. Breaking away from the existing management philosophy that economic and environmental feasibility are inevitably in conflict, companies now establish and implement environmental management strategies that can achieve both. Focusing on the effectiveness of environmental management in line with the growing importance of the environmental factor among ESG, the purpose of this study is to empirically study the impact of environmental management on corporate performance.
The various activities of the company are affected by an uncertain industrial environment. We considered industry-level factors that could affect the environmental management of companies, because uncertainties in business activities and their predictions are directly affected by external environmental factors [11]. In this study, industry concentration, which refers to the intensity of competition within an industry, is considered to be an industry-level factor that directly affects companies. According to Porter’s theory of industry structure analysis, competition within an industry is an important factor that influences managers’ decision making and determines a company’s profitability [12]. Companies face competition constantly and must create profit by setting strategies that consider the competition factors that affect their industry [13]. Considering the competition within an industry, we verify how environmental management affects a company’s long-term value creation. Therefore, this study focuses on competition within an industry to empirically confirm that corporate performance can vary with the level of environmental management, with the latter being a strategy used to promote the sustainable growth of companies.
This study reviews a company’s performance in environmental management covering a longer time series (2002–2020) than that in previous studies and analyzes the role of the degree of competition in the industry in which it competed during the same period. Our study is also the most recent to examine the importance of environmental management, which has become a global trend due to the pandemic, in relation to the degree of competition in an industry.

2. Literature Review and Hypothesis Development

2.1. Environmental Management and Corporate Performance

Environmental management has recently emerged as a new management paradigm worldwide, and the demand for eco-friendly management has increased rapidly. With the full-fledged opening of the Paris Agreement era in 2021 and management emphasizing climate change and the environment in line with the carbon neutral stance of the international community, the importance of environmental management among ESG activities is being emphasized. Moreover, the COVID-19 pandemic has raised awareness of the importance of corporate investment in a robust environmental management system [4]. Environmental issues caused by companies, such as greenhouse gas emissions, water management, and air pollution, have attracted attention globally [14]. In addition, owing to the climate change caused by environmental problems, the carbon neutrality of companies is not an option but a necessity. Companies can minimize the future costs of non-compliance to environmental regulations by conducting and operating compliant businesses [15,16]. Similarly, a company’s operating costs can be reduced if it considers environmentally friendly business strategies [17]. From a normative stakeholder perspective, consumers will have a positive perception of environmentally friendly products and services [16]. Generally, the main stakeholders of a company are its employees, customers, and the government, who may react positively to the green and eco-friendly image that the company builds [15,18]. Previous studies on corporate performance considering environmental management are as follows. Ref. [19] found a positive relationship between environmental and market performances in a sample of 350 companies in the UK. Ref. [20] analyzed the impact of the disclosure of greenhouse gas consumption by Australian companies on Tobin’s Q and proved that this had a negative impact in terms of stakeholder theory. This finding suggests that stakeholders respond negatively to practices such as greenhouse gas emission which harm the environment. Furthermore, [1] found a positive relationship between environmental performance and stock returns in a sample of 394 companies in the US. Thus, companies engaging in environmentally responsible business operations can create positive stakeholder perceptions, resulting in improved economic performance [21,22,23]. Therefore, we propose the following hypothesis:
Hypothesis 1. 
Environmental management positively affects corporate performance.

2.2. Environmental Management Considering Industry Competition

Industry concentration, which indicates the degree of competition, refers to the ratio of the transaction amount of a few major companies to that of an industry [24]. Nikolaeva and Bicho [25] found that the competitive pressure is an important factor in firms’ voluntary environmental practices.
Studies on environmental practices considering the competition within an industry are as follows. Fernández-Kranz and Santaló [26] found that firms in more competitive industries implemented better environmental practices than those in less competitive industries did, which had a positive impact on their performance. According to [27], when the intensity of competition within an industry is high due to low industry concentration, the environmental management practices of competitors in the industry put companies under pressure for growth and survival and make them imitate competitors’ practices initially. After imitation, however, each company performs active environmental management to differentiate itself from its competitors, thereby enhancing stakeholders’ trust in the company, product quality, and value to stakeholders, and, in turn, corporate performance. Moreover, in highly competitive industries, environmental management programs, such as parts recycling and green marketing, have proven to have market value.
Environmental management may have a positive impact not only on a company’s external performance such as sales but also on cognitive aspects such as brand recognition and attitudes toward the company. Thus, it can be an important product differentiator and a strategically important tool to strengthen relationships with customers [28]. However, in monopolized markets, even environmentally sensitive consumers must purchase products from monopolistic companies. Therefore, incentives for environmental practices may not be high in such markets [29]. Fierce competition may lead to poor profitability of a product, which is then likely to be withdrawn from the market; therefore, management may prioritize cost savings for survival. Nonetheless, environmental management is essential for improving the long-term company image. Prior studies have argued that higher levels of competition may result in less incentives for companies to spend on environmental management because the latter’s economic benefits are limited, but they may ultimately increase environmental practices for companies to gain a strategic advantage in the fierce competition. Bhattacharya and Sen [28] verified that when under competitive pressure, a company can strengthen its competitive edge by publicizing its eco-friendly product quality via social responsibility activities, differentiating it from its competitors and improving productivity. A similar view was reported in the study of [30]. Therefore, this study argues that the intensity of competition within an industry will have a moderating effect on the relationship between environmental management and corporate performance, and proposes the following hypothesis to empirically verify this.
Hypothesis 2. 
A high level of competition within an industry moderates the relationship between environmental management and corporate performance.

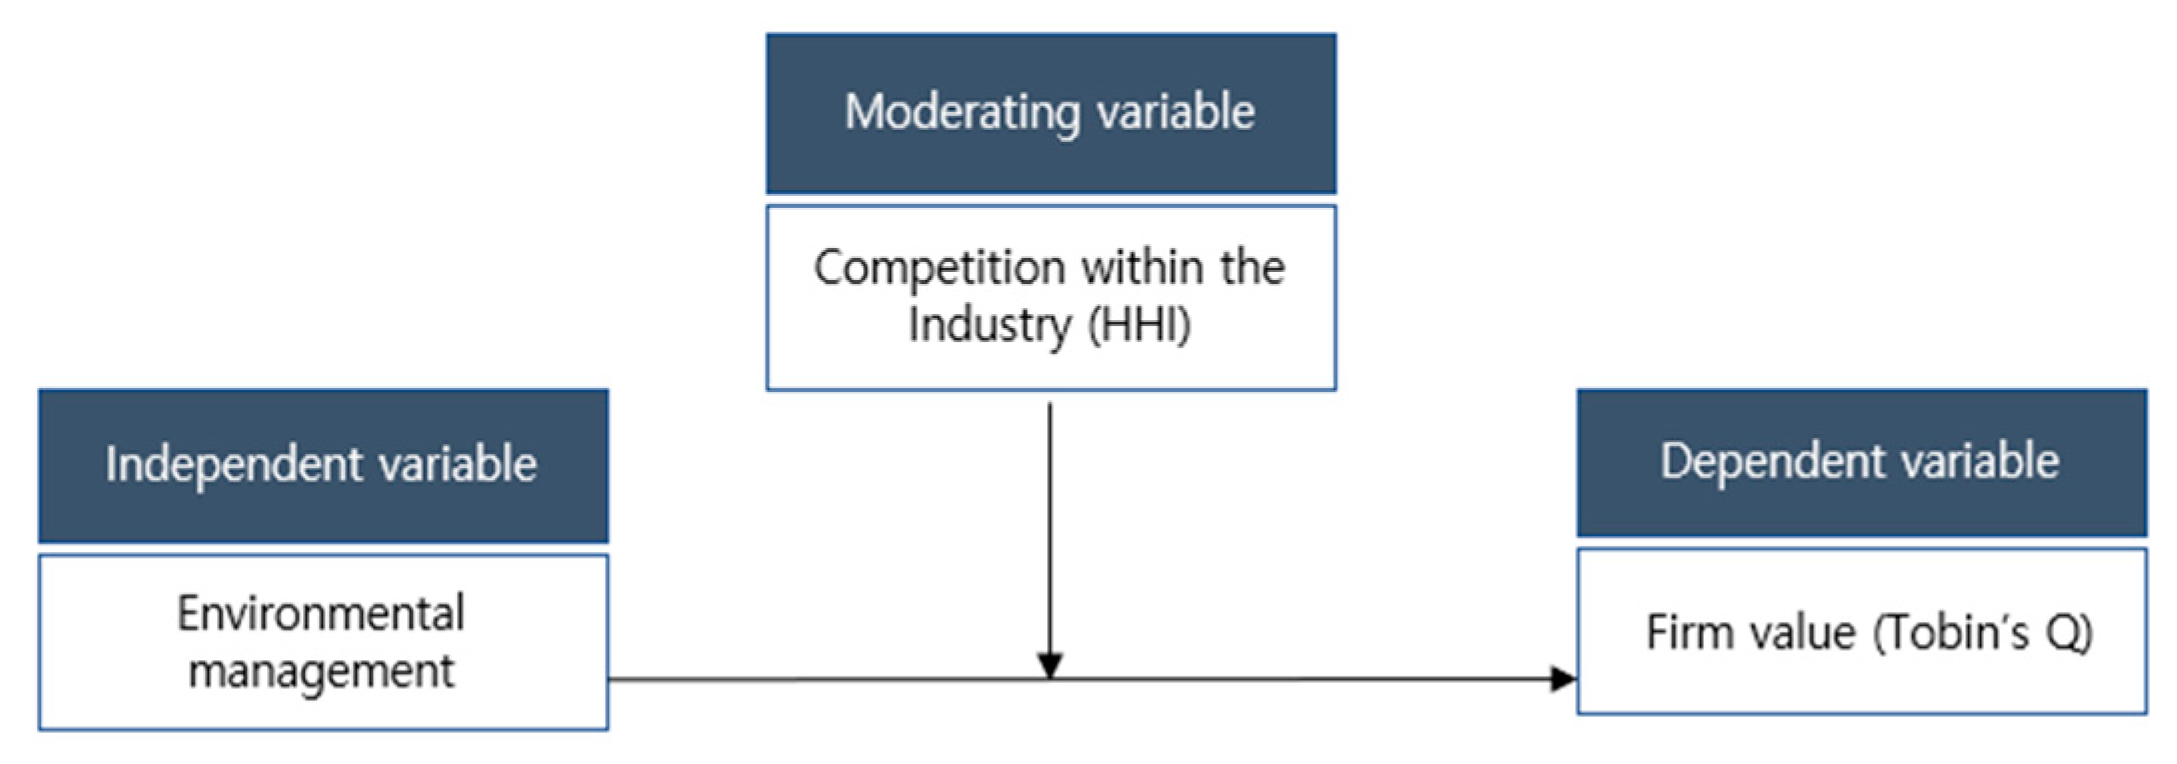
2.3. Theoretical Framework

The proposed model is based on Porter’s industrial structure analysis. This theory states that a company’s performance is determined by its external environment, particularly the industry [13]. Since the early 1990s, Michael Porter has consistently emphasized that an active competitive environment within an industry is the most important factor for improving the competitiveness of industries and companies. Industry competition implies the degree of competition among companies in an industry for products and services in terms of price, quality, and market scope. To analyze the degree of industry competition, it is necessary to identify the degree of industry concentration, which reflects a company’s dominance in the market. A high level of industry concentration is advantageous for existing businesses, but it makes it difficult for new players to enter. This study examined how a company’s environmental management affects its performance, given the degree of competition within the industry. Figure 1 illustrates the research model.

3. Materials and Methods

3.1. Model Construction

The data used in this study have a hierarchical relationship. This is because companies share many elements with their respective industries and have hierarchical attributes in their respective industries. This study applied a multilevel methodology, considering that companies belonging to an industry may be affected by the characteristics of that industry. If hierarchical data are analyzed using general ordinary least squares (OLS), the analysis will not only assume independence but may also result in the blocking or mixed effects of industry characteristics [31,32]. Therefore, a multilevel analysis was performed to best explain the nested model, considering the hierarchical industry–firm relationship. Using this analysis, we investigated the impact of industry concentration on the effect of environmental management on corporate performance. The equation for the research model is as follows: TOBIN’s Qij = γ00 + γ01 × HHI j + γ10 × Environmentij + γ11 × HHIj × Environmentij + u0j + u1j × Environmentij + rij.

3.2. Model Variables

Companies focus on environmental management. They aim to improve corporate performance through cooperation with partners to practice and spread environmental management, establishing and operating networks for sharing environmental information and various other environmental activities. This study used Tobin’s Q as a surrogate indicator of corporate growth and investigated the impact of environmental management on Tobin’s Q. To measure the environmental management variables, the environmental information of Korean companies released in Korea’s sustainability report or ESG report was used. The report describes various environmental practices of Korean companies. Specifically, it includes information on practices regarding raw materials, energy, water, biodiversity, waste, legal compliance, compliance monitoring, transportation, and R&D for ecosystems. This study collected data on electricity usage reduction, decreases in greenhouse gas emissions, decreases in waste discharge, the cost of environmental investment, and R&D for eco-friendly product innovation.
Tobin’s Q was used as an indicator of corporate performance. The formula is the asset’s market value divided by its replacement costs. Chung and Pruitt [33] proposed a revised formula that approximates Tobin’s Q: (market value of equity + book value of liabilities)/book value of total assets. The advantage of this formula is that it shows the relationships between managerial equity ownership and firm value, managerial performance and tender offer gains, investment opportunities and tender offer responses, and between financing, dividends, and compensation policies [33]. Tobin’s Q usually acts as a proxy for company value and corporate performance from an investor’s perspective [34,35].
A company’s performance is influenced by its industry [13]. Porter argues that a vigorously competitive environment within an industry promotes its growth and that of its firms [12]. We used the degree of competition in an industry as a moderating variable to verify its influence on environmental management and corporate performance. The Herfindahl–Hirschman index is the most frequently used proxy for the degree of competition in an industry in research on corporate performance [36]. The Herfindahl–Hirschman index measures market concentration as the sum of squared market shares of all companies in an industry, which means that it considers all companies and gives greater importance to companies with larger market shares.
The Herfindahl–Hirschman index’s formula is as follows.
Herfindahl Hirschman   index = j = 1 n S 2 i j t
Considering a market in which n companies operate and the i -th company’s market share is S i , the HHI is defined as the sum of squares of the market participants’ shares. The HHI is a positive number. If the market share is expressed as a fraction of the total market, 0 < HHI ≤ 1.
In addition, we introduced several control variables to investigate the relationship between the independent and dependent variables. The control variables used in this study are the number of employees, company size, proportion of foreign shareholders, year characteristics, and industry characteristics. A company’s size affects its performance and environmental management. It is also an important factor in determining the profitability and value of the company. As large companies have more useful resources than SMEs do, their environmental management and corporate performance are expected to be higher than those of SMEs [2]. Foreign investors are efficient monitoring observers and alleviate information asymmetry between companies and investors. It can be a device that further performs environmental management strategies [37].

3.3. Data Collection

The data used for the empirical analysis were from 102 companies that published sustainability or ESG reports over an 18-year period from 2002 to 2020. We collected 1190 environmental management cases from each company. Data were collected for approximately a year from May 2020 to April 2021 by directly accessing the company’s website, reading the sustainability or ESG report, and checking the annual environmental information figures. Each company’s sustainability or ESG report faithfully and transparently followed the Global Reporting Initiative (GRI) guidelines. The GRI is an international organization that presents guidelines for sustainability reports worldwide. The final sample consisted of 728 cases from 87 companies, excluding 15 financial and unlisted companies. The financial data for the sample were obtained from TS-2000. The industries were classified as follows: rubber and plastic manufacturing, public enterprises, metal manufacturing, tobacco manufacturing, wholesale and retail, purpose machinery manufacturing, leisure and personal services, petroleum refining, food manufacturing, engineering and allied technical services, transportation equipment manufacturing, pharmaceutical manufacturing, automobile manufacturing, electrical equipment manufacturing, telecommunications, general construction, transportation, and warehouse chemical manufacturing. The total number of companies in the sample was 87. With a total of 12 companies, the warehouse chemical manufacturing industry had the largest representation, followed by electrical equipment manufacturing with 9 companies, and the telecommunications industry with 7 companies. The remaining industries, with three to five companies each, show an even overall distribution. The tobacco-manufacturing industry has a monopoly.

4. Results

4.1. Extraction of Environmental Variables

Table 1 presents the results of the exploratory factor analysis to extract the environmental variables. We used principal components to estimate the factor loadings and the varimax method for rotation. Looking at the factor analysis results, the factor value increased when the reduction in greenhouse gas emissions and waste discharge was higher, and when the recycling rate and environmental investment costs were higher. The factor was 1.0 or more and the cumulative explanatory power of the factor was 60.591%, which was higher than 50.0%, indicating a good model fit.

4.2. Descriptive Statistics and Correlation Analysis

To verify the hypotheses, descriptive statistics and correlation analyses were performed for the study variables. Table 2 presents the descriptive statistics of the variables and Table 3 presents the correlation analysis.

4.3. Regression Analysis Results

The impact of environmental management on corporate performance and the moderating effect of competition within the industry were analyzed, and the results are presented in Table 4. In analyzing the relationship between environmental management and performance, the effect of a time lag should be considered; therefore, we verified the effect of environmental management in the previous year (t − 1) on corporate performance in the current year (t). The results are as follows.
Model 1 was a null model. Model 2 was the result when only the control variable was inputted. Model 3 was the result of Hypothesis 1, which verified the influence of environmental management on corporate performance. The analysis showed that environmental management has a significant positive impact on corporate performance. In other words, when environmental management practices improve, corporate performance also improves significantly. This can be interpreted to mean that a company’s efforts to improve the environment lower the management costs of industrial waste and pollutants, which ultimately improves corporate performance [1,19,20]. Thus, Hypothesis 1 was supported. This supports previous research that argues that corporate environmental management can continuously enhance corporate performance by improving consumer perception and the reputation of a company [38,39,40,41,42]. Model 4 verifies Hypothesis 2 on the moderating effect of industry concentration on the relationship between environmental management and corporate performance. The results show a significantly negative moderating effect (β = −0.074, p < 0.05). In other words, when environmental management increases, corporate performance increases more rapidly in an industry with fiercer competition than in an industry without such competition. Thus, Hypothesis 2 was supported. This also supports previous research showing that a company improves its performance by augmenting stakeholder trust in product credit, value, and quality via active environmental management practices to differentiate itself from competitors [26,27]. Figure 2 illustrates these results.

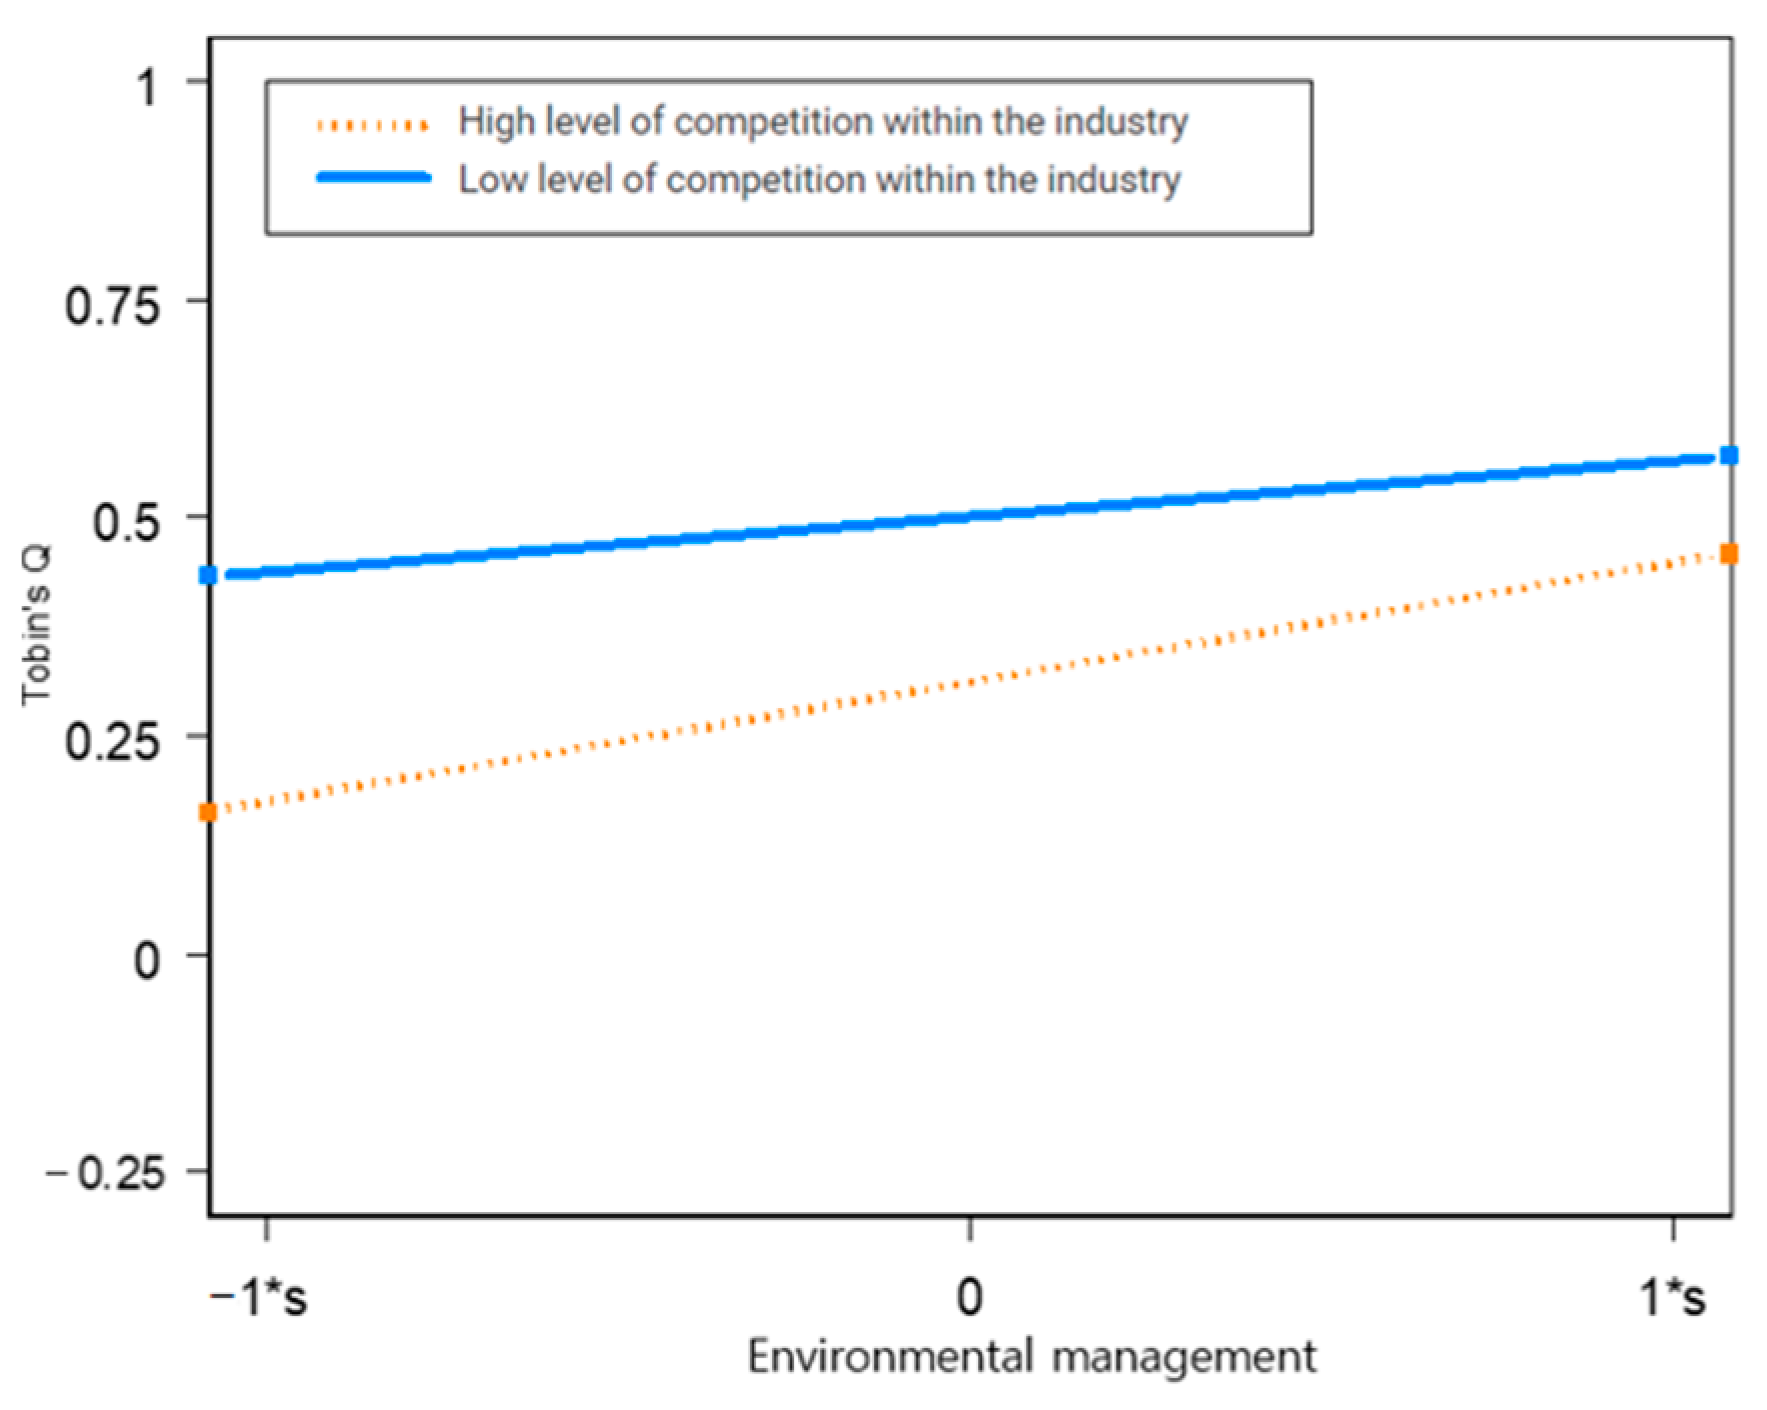
4.4. Further Analysis (Analysis of Environmental Management Mean Differences According to Competition within the Industry)

The purpose of the analysis in this section is to verify the relevance of the test results of Hypothesis 2 by examining whether the environmental management level varies with the competition within an industry. Differences in environmental management were analyzed by dividing the groups into high industry concentration and low industry concentration groups.
The industry sector was divided into manufacturing, information, and communication services, as well as distribution subsectors. Thereafter, each industry concentration was divided into upper and lower groups, and the differences in environmental management according to the industrial characteristics were analyzed. The results of the t-tests are presented in Table 5.
The results of the difference analysis according to industry concentration groups are as follows. The group with a low industry concentration had higher levels of environmental practices than the group with a high industry concentration did. In Korea, this is reflected in the implementation of carbon neutrality via greenhouse gas reduction measures and investment activities, primarily by large corporations with fierce competition. Additionally, since competition in the product market works as an external governance structure for a company, the higher the level of competition in the product market, the less information asymmetry of the company there is. Based on this logic, it can be inferred that the fiercer the competition, the more active the environmental activities of companies [43]. These results support the results of Hypothesis 2, which confirmed the importance of competition within an industry.

5. Conclusions

The unexpected shock of the COVID-19 pandemic brought many changes to society and industry [44]. Given the perception that companies that managed ESG activities well were more resilient to the COVID-19 crisis than those that did not, the transition to being an eco-friendly company is recognized as an indispensable corporate survival strategy [45]. This study focused on environmental management practices among ESG activities, which are becoming increasingly important worldwide, and confirmed that environmental management affects corporate performance depending on the degree of competition within the industry to which a company belongs. To validate the study hypotheses, data on environmental practices were collected from 87 domestic companies in Korea that released sustainability reports. The collected data were then analyzed using SPSS 20 and HLM 8.1. The main results are as follows:
First, environmental management was found to have a positive impact on corporate performance. According to previous studies, companies’ environmental improvement efforts help to lower industrial waste and pollutant management costs, which can ultimately improve corporate performance [1,19,20]. Our results support those of previous studies and suggest that corporate environmental management practices can prevent risk factors.
Second, a high level of competition within an industry moderates the relationship between environmental management and corporate performance. It has been proven that companies can enhance competitiveness by differentiating themselves from competitors and improving productivity by publicizing their eco-friendly product quality as competition intensifies. Therefore, in low-concentration industries where a company’s operating risk is higher, engaging in environmental management may help the company to appeal to stakeholders and boost corporate performance. The results of this study corroborate those of prior studies [26,27]. Additional analyses were conducted to confirm these findings. Differences in environmental management were analyzed by dividing companies into groups with high and low industry concentrations. The analysis revealed that the level of environmental practices was high in the highly competitive group. These results again support the study findings by reaffirming the influence of competition within an industry.
The limitations of this study are as follows. This study used environmental variable data from sustainability reports as a proxy for environmental management. To increase the likelihood of the generalization of the analysis results, a demonstration analysis using substitute variables in addition to the proxy used in this study needs to be carried out. For example, further verification is needed using the Korea Economic Justice Index (KEJI) of the Economic and Justice Research Institute of Korea to measure corporate ESG activities.

Author Contributions

Y.J.C. conceptualized the study and prepared the original draft. J.W.Y. carried out the investigation and formal analysis. All authors have read and agreed to the published version of the manuscript.

Funding

This paper was supported by Konkuk University in 2022, grant number 2022-A019-0052.

Institutional Review Board Statement

Not applicable.

Informed Consent Statement

Not applicable.

Data Availability Statement

Not applicable.

Conflicts of Interest

The authors declare no conflict of interest.

References

  1. Yadav, P.L.; Han, S.H.; Rho, J.J. Impact of environmental performance on firm value for sustainable investment: Evidence from large US firms. Bus. Strategy Environ. 2016, 25, 402–420. [Google Scholar] [CrossRef]
  2. Younis, H.; Sundarakani, B. The impact of firm size, firm age and environmental management certification on the relationship between green supply chain practices and corporate performance. Benchmarking Int. J. 2020, 27, 319–346. [Google Scholar] [CrossRef]
  3. Xue, B.; Zhang, Z.; Li, P. Corporate environmental performance, environmental management and firm risk. Bus. Strategy Environ. 2020, 29, 1074–1096. [Google Scholar] [CrossRef]
  4. Micah, A.E.; Bhangdia, K.; Cogswell, I.E.; Lasher, D.; Lidral-Porter, B.; Berezvai, Z.; Gaál, P.; Joó, T.; Lám, J.; Palicz, T.G. Global investments in pandemic preparedness and COVID-19. Lancet Glob. Health 2023, 11, e385–e413. [Google Scholar] [CrossRef]
  5. Tchetchik, A.; Kaplan, S.; Blass, V. Recycling and consumption reduction following the COVID-19 lockdown: The effect of threat and coping appraisal, past behavior and information. Resour. Conserv. Recycl. 2021, 167, 105370. [Google Scholar] [CrossRef]
  6. Koh, H.-K.; Burnasheva, R.; Suh, Y.G. Perceived ESG (environmental, social, governance) and consumers’ responses: The mediating role of brand credibility, Brand Image, and perceived quality. Sustainability 2022, 14, 4515. [Google Scholar] [CrossRef]
  7. Birkland, T.A. In the wake of the Exxon Valdez: How environmental disasters influence policy. Environ. Sci. Policy Sustain. Dev. 1998, 40, 4–32. [Google Scholar] [CrossRef]
  8. South, D.; Vangala, S.; Hung, K. The Biden Administration’s Approach to Addressing Climate Change. Clim. Energy 2021, 37, 8–18. [Google Scholar] [CrossRef]
  9. Cai, Y.; Jo, H.; Pan, C. Doing well while doing bad? CSR in controversial industry sectors. J. Bus. Ethics 2012, 108, 467–480. [Google Scholar] [CrossRef]
  10. Keefe, J.F. From SRI to sustainable investing. GreenMoney J. 2007, 66. [Google Scholar]
  11. Milliken, F.J. Three types of perceived uncertainty about the environment: State, effect, and response uncertainty. Acad. Manag. Rev. 1987, 12, 133–143. [Google Scholar] [CrossRef]
  12. Porter, M.E. Competitive Strategy: Creating and Sustaining Superior Performance; The Free Press: New York, NY, USA, 1985. [Google Scholar]
  13. Porter, M.E.; Kramer, M.R. The competitive advantage of corporate philanthropy. Harv. Bus. Rev. 2002, 80, 56–68. [Google Scholar] [PubMed]
  14. Green, W.; Li, Q. Evidence of an expectation gap for greenhouse gas emissions assurance. Account. Audit. Account. J. 2011, 25, 146–173. [Google Scholar] [CrossRef]
  15. Hart, S.L. A natural-resource-based view of the firm. Acad. Manag. Rev. 1995, 20, 986–1014. [Google Scholar] [CrossRef]
  16. Shrivastava, P. Environmental technologies and competitive advantage. Strateg. Manag. J. 1995, 16, 183–200. [Google Scholar] [CrossRef]
  17. Russo, M.V.; Fouts, P.A. A resource-based perspective on corporate environmental performance and profitability. Acad. Manag. J. 1997, 40, 534–559. [Google Scholar] [CrossRef]
  18. Berman, S.L.; Wicks, A.C.; Kotha, S.; Jones, T.M. Does stakeholder orientation matter? The relationship between stakeholder management models and firm financial performance. Acad. Manag. J. 1999, 42, 488–506. [Google Scholar] [CrossRef]
  19. Al-Najjar, B.; Anfimiadou, A. Environmental policies and firm value. Bus. Strategy Environ. 2012, 21, 49–59. [Google Scholar] [CrossRef]
  20. Wang, L.; Li, S.; Gao, S. Do greenhouse gas emissions affect financial performance?–an empirical examination of Australian public firms. Bus. Strategy Environ. 2014, 23, 505–519. [Google Scholar] [CrossRef]
  21. Epstein, M.J.; Schnietz, K.E. Measuring the cost of environmental and labor protests to globalization: An event study of the failed 1999 Seattle WTO talks. Int. Trade J. 2002, 16, 129–160. [Google Scholar] [CrossRef]
  22. Branco, M.C.; Rodrigues, L.L. Issues in corporate social and environmental reporting research: An overview. Issues Soc. Environ. Account. 2007, 1, 72–90. [Google Scholar] [CrossRef]
  23. Baumgartner, R.J. Managing corporate sustainability and CSR: A conceptual framework combining values, strategies and instruments contributing to sustainable development. Corp. Soc. Responsib. Environ. Manag. 2014, 21, 258–271. [Google Scholar] [CrossRef]
  24. Kohli, A.K.; Jaworski, B.J. Market orientation: The construct, research propositions, and managerial implications. J. Mark. 1990, 54, 1–18. [Google Scholar] [CrossRef]
  25. Nikolaeva, R.; Bicho, M. The role of institutional and reputational factors in the voluntary adoption of corporate social responsibility reporting standards. J. Acad. Mark. Sci. 2011, 39, 136–157. [Google Scholar] [CrossRef]
  26. Fernández-Kranz, D.; Santaló, J. When necessity becomes a virtue: The effect of product market competition on corporate social responsibility. J. Econ. Manag. Strategy 2010, 19, 453–487. [Google Scholar] [CrossRef]
  27. Siegel, D.S.; Vitaliano, D.F. An empirical analysis of the strategic use of corporate social responsibility. J. Econ. Manag. Strategy 2007, 16, 773–792. [Google Scholar] [CrossRef]
  28. Bhattacharya, C.B.; Sen, S. Doing better at doing good: When, why, and how consumers respond to corporate social initiatives. Calif. Manag. Rev. 2004, 47, 9–24. [Google Scholar] [CrossRef]
  29. Campbell, J.L. Why would corporations behave in socially responsible ways? An institutional theory of corporate social responsibility. Acad. Manag. Rev. 2007, 32, 946–967. [Google Scholar] [CrossRef]
  30. Flammer, C. Does product market competition foster corporate social responsibility? Evidence from trade liberalization. Strateg. Manag. J. 2015, 36, 1469–1485. [Google Scholar] [CrossRef]
  31. Hox, J.J.; Maas, C.J.; Brinkhuis, M.J. The effect of estimation method and sample size in multilevel structural equation modeling. Stat. Neerl. 2010, 64, 157–170. [Google Scholar] [CrossRef]
  32. Raudenbush, S.W.; Bryk, A.S. Hierarchical Linear Models: Applications and Data Analysis Methods; Sage: New York, NY, USA, 2002; Volume 1. [Google Scholar]
  33. Chung, K.H.; Pruitt, S.W. A simple approximation of Tobin’s q. Financ. Manag. 1994, 23, 70–74. [Google Scholar] [CrossRef]
  34. Alajlani, S.E.; Posecion, O.T. Measuring market valuation of Amman stock exchange industrial sectors: Tobin’s Q ratio as investors’ market performance indicator. Res. J. Financ. Account. 2018, 9, 77–84. [Google Scholar]
  35. Jinji, N.; Zhang, X.; Haruna, S. Does a firm with higher Tobin’sq prefer foreign direct investment to foreign outsourcing? N. Am. J. Econ. Financ. 2019, 50, 101044. [Google Scholar] [CrossRef]
  36. Dhaliwal, D.; Huang, S.; Khurana, I.K.; Pereira, R. Product market competition and conditional conservatism. Rev. Account. Stud. 2014, 19, 1309–1345. [Google Scholar] [CrossRef]
  37. Bushee, B.J.; Noe, C.F. Corporate disclosure practices, institutional investors, and stock return volatility. J. Account. Res. 2000, 38, 171–202. [Google Scholar] [CrossRef]
  38. Scholtens, B. A note on the interaction between corporate social responsibility and financial performance. Ecol. Econ. 2008, 68, 46–55. [Google Scholar] [CrossRef]
  39. Mishra, S.; Suar, D. Does corporate social responsibility influence firm performance of Indian companies? J. Bus. Ethics 2010, 95, 571–601. [Google Scholar] [CrossRef]
  40. Monda, B.; Giorgino, M. Corporate Governance and shareholder value in listed firms: An empirical analysis in five countries (France, Italy, Japan, UK, USA). Corp. Ownersh. Control 2013, 10, 36–50. [Google Scholar] [CrossRef]
  41. Gregory, A.; Whittaker, J.; Yan, X. Corporate social performance, competitive advantage, earnings persistence and firm value. J. Bus. Financ. Account. 2016, 43, 3–30. [Google Scholar] [CrossRef]
  42. Boubaker, S.; Cellier, A.; Manita, R.; Saeed, A. Does corporate social responsibility reduce financial distress risk? Econ. Model. 2020, 91, 835–851. [Google Scholar] [CrossRef]
  43. Griffith, R. Product Market Competition, Efficiency and Agency Costs: An Empirical Analysis; IFS Working Papers; Institute for Fiscal Studies: London, UK, 2001. [Google Scholar]
  44. Kulic, N.; Dotti Sani, G.M.; Strauss, S.; Bellani, L. Economic disturbances in the COVID-19 crisis and their gendered impact on unpaid activities in Germany and Italy. Eur. Soc. 2021, 23, S400–S416. [Google Scholar] [CrossRef]
  45. Atkins, J.; Doni, F.; Gasperini, A.; Artuso, S.; La Torre, I.; Sorrentino, L. Exploring the effectiveness of sustainability measurement: Which ESG metrics will survive COVID-19? J. Bus. Ethics 2022, 1–18. [Google Scholar] [CrossRef] [PubMed]
Figure 1. Research model.
Sustainability 15 07675 g001
Figure 2. Graph of the moderating effect.
Sustainability 15 07675 g002
Table 1. Extraction of environment factors.
ItemFactor
Greenhouse Gas Emission Reduction0.525
Waste Discharge Reduction0.767
Recycling Rate0.520
Environmental Investment Costs0.684
Table 2. Descriptive statistics analysis.
VariableMeanSDMinimumMaximum
Energy Consumption Reduction (TJ)−4640 144,710 −1,475,037 2,369,125
GHG Emissions Reduction (tCO2eq)−42,180501,700−4,317,5048,084,702
Waste Amount Reduction (TON)−10,183 257,691 −4,534,000 1,937,200
Recycling Rate (%)0.68 0.25 0.02 1.00
Environmental Investment Cost59,430 327,390 1.00 4,858,500
R&D for Ecosystems (%)0.03 0.05 0.00 0.41
Assets15.521.4110.7519.20
Employees11,6009200169310,000
Foreign Equity (%)24.1416.18065
Industry concentration (%)0.46 0.21 0.27 1.00
Tobin’s Q1.12 1.01 0.07 6.74
Table 3. Correlation analysis.
VariableEnvironmentAssetsEmployeesForeign EquityIndustry ConcentrationTobin’s Q
Environment1
Assets−0.0741
Employees−0.168 **0.502 ***1
Foreign Equity−0.0320.492 **0.397 ***1
Industry Concentration−0.131 **0.124 *0.0630.0211
Tobin’s Q0.138 **−0.1920.0040.374 ***0.387 ***1
* p < 0.05, ** p < 0.01, *** p < 0.001.
Table 4. Regression analysis results.
Dependent VariableModel 1Model 2Model 3Model 4
Null Model
Constant0.135 (6.521 ***)0.328 (4.589) ***0.305 (5.804) ***0.310 (5.904) ***
Environment 0.101 (2.589) *0.094 (2.488) *0.264 (2.814) **
Assets −0.325 (−7.448) ***−0.311 (−7.223) ***−0.310 (−7.220) ***
Employees 0.004 (1.236)0.003 (1.191)0.003 (1.184)
Foreign Equity 0.036 (12.221) ***0.036 (12.209) ***0.033 (10.828) ***
Industry Concentration 0.211 (2.705) **0.191 (2.324) *
Environment x Industry Concentration −0.074 (−2.641) **
σ20.822890.527660.528990.52875
τ 0.232060.168450.151710.15508
Deviance1794.061214.281210.221205.65
* p < 0.05, ** p < 0.01, *** p < 0.001.
Table 5. Differences in environmental management considering competition within industry.
ConcentrationMeanSDtp
Environmental managementHigh *−0.420.8615.070.000
Low0.560.89
* High industry concentration group: n = 310; low industry concentration group: n = 418.
Disclaimer/Publisher’s Note: The statements, opinions and data contained in all publications are solely those of the individual author(s) and contributor(s) and not of MDPI and/or the editor(s). MDPI and/or the editor(s) disclaim responsibility for any injury to people or property resulting from any ideas, methods, instructions or products referred to in the content.

