Article

A Lipidomic Profile of a Sustainable Source of Omega-3 Long-Chain Polyunsaturated Fatty Acids, Greenshell Mussels™, Perna canaliculus

by
Matthew C. Taylor
1,
Rodney D. Roberts
2 and
Matthew R. Miller
3,*
1
CSIRO Environment, Canberra, ACT 2601, Australia
2
SPATnz, Glenduan, Nelson 7071, New Zealand
3
Cawthron Institute, Nelson 7045, New Zealand
*
Author to whom correspondence should be addressed.
Sustainability 2023, 15(9), 7586; https://doi.org/10.3390/su15097586
Submission received: 3 April 2023 / Revised: 1 May 2023 / Accepted: 2 May 2023 / Published: 5 May 2023

Abstract

:
Greenshell mussel (GSM- Perna canaliculus) is the most important aquaculture species in New Zealand and produces one of the most expensive bioactive lipid extracts on the nutraceutical market. There have been numerous studies on the composition of GSM as well as pre-clinical and clinical studies on the efficacy of GSM extracts and foods. With increases in analytical capabilities, lipidomic studies using advanced mass spectral data may provide new insight into the content and activity of the lipidome, the totality of all lipids, of GSM. This study is the first reported characterisation of the GSM lipidome which may disclose important novel information regarding its nutrition, biology, physiology, and epidemiology. This study adds to the traditional lipid analytical outputs with new lipidomic capabilities to interrogate the lipid species differences between tissues rich in oil. We have identified 16 different lipid species in GSM including ceramide aminoethyl phosphonate (CAEP). Many lipid species are differentially expressed between tissues and correlation analysis demonstrates lipid species associated with the digestive gland that may be obtained from food sources, whilst other lipid species are dominant in the mantle or gonad. Linking this new information to the GSM breeding programmes may deliver functional breeding attributes to deliver premium strains for enhanced nutrition and/or extract production.

1. Introduction

The Greenshell™ mussel (GSM), is endemic to the coastlines of New Zealand. The mussels are farmed in waters that provide all the nutrition required for their growth. GSM is New Zealand’s leading aquaculture species, in terms of both total volume and value. In 2022 the New Zealand GSM industry produced revenue of ~USD 192M from 33,237 tonnes of exported products [1]. GSMs are sold as food and are also used to produce high-value nutraceuticals including oil extracts and freeze-dried mussel powders, for example, Lyprinol®. GSM lipids are extracted by supercritical CO2 with/without ethanol as a co-solvent or by using chemical extraction methods to produce nutraceutical oils. To the best of our knowledge, GSM oil is the most valuable marine oil (by price) in the world (~US$1220/kg in 2023). Studies have shown that lipid extracted from GSM has numerous health benefits, including the ability to reduce inflammation, reduce pain, and aid mobility [2,3,4,5,6,7,8,9] recently reviewed by Miller, et al. [10]. This high price is driven not only by the consumer benefits but by the high cost of extraction and production of GSM oil.
The GSM lipid fraction contains a high proportion of omega-3 long-chain (C ≥ 20) polyunsaturated fatty acids (omega-3 LC-PUFAs), predominantly docosahexaenoic acid (DHA, 22:6n-3) and eicosapentaenoic acid (EPA, 20:5n-3), which are split between the triacylglycerol and polar lipid classes [11,12,13,14]. Further, it contains a series of novel lipids not found in commodity marine oil such as anchovies, tuna, and sardine, including non-methylene-interrupted (NMI)-FA, fatty aldehydes (FALD), plasmalogens and phytosterols [12]. The lipid content of GSM, and the lipid classes and fatty acid (FA) profile of GSM oil, are affected by many factors, including the season, location, and the types and amounts of algae consumed [12,13].
GSMs are filter feeders and obtain lipids directly from the microalgae they consume. GSMs are considered to be one of the most sustainable sources of omega-3 LC-PUFA available as they are farmed, rather than wild-harvested, and do not require any dietary inputs for their nutrition [10]. Recently there have been attempts to understand the capacity that invertebrates have in the production of omega-3 LC-PUFA [15]. Functional gene characterisation of the freshwater mollusk Unionida (Elliptio complanata) demonstrated a series of desaturases that have the ability to produce omega-3 LC-PUFA de novo [15]. This finding indicates mussels may have the capacity to make significant amounts of omega-3 LC-PUFA and possibly other fatty acids endogenously rather than obtaining them from dietary sources.
Understanding the physiology and nutritional requirements of GSM might result in higher yields for the nutraceutical industry and better human health outcomes for consumers. Lipids are important components of cellular membranes and are integral to various physiological processes like reproduction, growth, immunological responses, and energy reserves. The lipid diversity, particularly for intact lipids, in GSM is poorly understood as research has focused on traditional techniques of FAME analysis by gas chromatography (GC) or GC-mass spectrometry and lipid class assessed by thin layer chromatography–flame ionisation detection (TLC-FID i.e., Iatroscan™) [11,12,13,14]. Technological advancements have provided tools to unveil the diversity in intact lipids. These advances include ultra-high performance liquid chromatography (UHPLC) and new column phases as well as improvements to mass spectroscopy such as the electrospray ionisation source (ESI), further developments in multidimensional and high-resolution mass spectrometry, and incremental improvements in data analysis (recently reviewed by [16]). Lipidomics, a branch of metabolomics, is the science targeting the lipidome (e.g., the totality of biological lipids in an organism). Understanding the lipidome for GSM could disclose important information regarding the nutrition, biology, physiology, genetics, and epidemiology of bivalves. It may also aid research looking at the efficacy of GSM extracts in pre-clinical and clinical studies [17,18,19]. This knowledge, once applied, has the potential to improve GSM production, analytics, clinical outcomes, and the resilience of the GSM industry to environmental changes.
In this study, we compare the results of three oil-rich tissues from GSM using both a traditional analysis of lipids and a lipidomics method that uses a C30 reverse phase UHPLC column that has the capacity to separate not only lipid classes and species but also iso-baric lipid species in a single LC-MS/MS analysis.

2. Materials and Methods

2.1. Greenshell Mussels (GSM) Sampling

GSMs were provided by SpatNZ (Nelson NZ). Nine GSM were weighed, measured (length and width at widest point), shucked, and then the mussel meat and shell weights were recorded. Three tissues were dissected from each mussel: gonads, mantle, and digestive gland as per Miller et al. [12]. Only female mussels of harvestable fatness and gonads containing both eggs and storage reserves were used in this trial. Gonad maturity was scored using the visual grading system defined by Buchanan [20].

2.2. Traditional Lipid Chemistry Analysis

Lipids from the GSM samples were extracted using a modified Folch methodology [21]. In brief, mussel homogenate (1–2 g) was extracted in 20 mL of chloroform/methanol (2:1) with constant mixing for 20 min, and phase splitting was achieved by the addition of 4 mL of NaCl solution in H2O (0.9%, w/v). The organic lower phase was collected and concentrated under nitrogen.
Lipid classes were analysed with an Iatroscan MK V thin-layer chromatography-flame ionisation detector (TLC-FID) (Iatron Laboratories, Tokyo, Japan). Samples were spotted onto silica gel SIII Chromarods (5-µm particle size) and developed in a glass tank lined with pre-soaked filter paper. The solvent system used for lipid separation was hexane/diethyl ether/acetic acid (60:17:0.1, v/v/v). After development for 25 min, the Chromarods were dried with hot air and analysed immediately to minimise absorption of atmospheric contaminants. Lipid classes were quantified using Clarity software (DataApex; Prague, The Czech Republic). The FID was calibrated for each lipid class using the following compounds: phosphatidylcholine, cholesterol, oleic acid, hydrocarbon (squalene), and triglyceride (TG, Glyceryl Trioleate). All standards were purchased from Sigma Aldrich (Auckland, New Zealand).
An aliquot of the total lipid extract (TLE) from each sample type was trans-methylated in methanol/chloroform/hydrochloric acid (10:1:1, v/v/v) for 1 h at 100 °C. After the addition of water, the mixture was extracted three times with hexane/chloroform (4:1, v/v) to obtain fatty acid methyl esters (FAME). Samples were made up to 1 mL with an internal injection standard (19:0 FAME). FAME samples were run in accordance with AOAC official methods 963.22 “Methyl Esters of fatty acids in oils and fats”. In brief, FAME was analysed by gas chromatography (GC) performed using an Agilent 6890 with an Agilent SP-2560 silica capillary column (100 m v 0.25 mm i.d., 0.2 μm film thickness) and flame ionisation detection (FID). Samples (1 μL) were injected via a split injector at 260 °C. The column temperature program was: 220 °C at 17 min then raise by 2.8 °C min−1 to 240 °C and hold for 5 min. Nitrogen was the carrier gas. GC results were typically repeatable to within ±5% of the individual component area for replicate analyses. Supelco 37 Component FAME (Auckland, Sigma Aldrich) Mix was utilised for verification of FAME identification.

2.3. Lipidomic Analysis

Samples were analysed on a ThermoScientific Orbitrap Fusion tribrid mass spectrometer coupled with a ThermoScientific Vanquish UHPLC system based on the methods of Rampler [22]. Briefly, 2 µL of the sample was injected onto a Vanquish C30 column (ThermoFisher, Waltham, MA, USA) at a flow rate of 0.26 mL/min and initial composition of 30% solvent B. The composition was raised to 43% B at 2 min then 55% at 2.1 min, 21 min 65% B, 18 min 85% B, 20 min 100% B, 25 min 100% B, returning to 30% B at 25.1 min until the end of the analysis at 30 minutes. The source conditions for the H-ESI source were spray voltage 3500 V in positive ion mode or 2400 V in negative ion mode. The gas pressures were set to sheath gas, 35 arb units, auxiliary gas 5 arb units, sweep gas 1 arb units, and both the vaporiser temperature and ion transfer tube were 300 °C. The mass spectrometer was operated in both positive and negative ion modes with the MS scan conducted in the Orbitrap set at 120,000 resolution and a scan range between 250–1500 m/z in positive ion mode and 320–2000 m/z in negative ion mode with the automatic gain control (AGC) target of 4.0 × 10⁵. MS/MS analysis was conducted in the ion trap, ions that reached an intensity greater than 5.0 × 10³ were isolated using the quadrupole set at 0.7 m/z, the HCD collision energy was set at 25, 30 and 35% in positive ion mode, and 30% in negative ion mode, and the mass was excluded for 5 seconds. Phosphatidylcholine analysis was conducted by a triggered MS/MS if the positive daughter ion was 184 m/z, the parent ion was isolated using the quadrupole and subjected to CID fragmentation at 32%. Similarly, the neutral loss of fatty acid on a triacylglycerol also triggers MRM using CID at 35% to confirm TAG species.
Orbitrap fusion data were analysed using LipidSearch software (version 4.1.3, ThermoFisher) using the product search feature with the precursor tolerance set to 5.0 ppm and product tolerance set to 0.5 Da to reflect the use of the ion trap for the MS/MS analysis. The orbitrap database was selected. In the first pass of the analysis, all lipid classes were selected and the ions were -H, +HCOO, -2H for negative ion mode and +H+, +NH4+ in positive ion mode. Compound Discoverer was also used to further identify unknowns. After successive rounds of data analysis with both LipidSearch and Compound Discoverer, lipid species were identified using LipidSearch algorithm to search the MS/MS spectra and create positive identification of the lipid species. The MS/MS data provided sufficient information to determine the acyl chain composition of each lipid species but not the stereospecific numbering (sn) of the acyl chain position on the 3 carbon glycerol backbone and thus denoted as “_” between acyl chains (“/” is used when sn position is known). Retention time and m/z graphs were plotted to establish the ordered elution of lipids.
Further analysis was conducted using in-house R scripts (R version 4.2.1, using the tidyverse package [23,24]) for data normalisation of Compound Discoverer (ThermoFisher) results and to aid in the identification of lipid species. Probabilistic quotient normalisation (PQN) was applied to normalise the data without the potential introduction of artificial correlations in the data [25]. Missing values were removed from the data analysis. Statistical analysis and plotting were conducted using the R packages stats, emmeans, ggplot2, cowplot, GGally, ggfortify, and RColorBrewer packages. The significance between tissues was determined for compounds that were present in more than half of the samples and were present in all three tissues using ANOVA and Tukey HSD of the log-transformed data. Principal component analysis (PCA) was conducted for singular value decomposition using the “prcomp” function in the R Stats package. Correlation analysis was conducted using the “pairs” function in the R graphics package and the Pearson correlation coefficient was calculated using the “cor” function in the R Stats package.

3. Results

The mussels selected for analysis were large females (average shell length 113 ± 11 mm, width 51± 5 mm) with marketable plumpness and colour (gonad visual grading score 6.6 ± 0.4). Gonads, mantle, and digestive glands were chosen as organs of interest as they have been previously shown to contain the majority of the lipid content and are important in digestion and reproduction [12]. The tissues tested made up about 45% of the total wet weight of the GSM, relatively clean samples could be dissected out representing the bulk of each organ. The remainder includes muscle, foot, gills, digestive tract heart, and some remnants of the target tissues.

3.1. Traditional Lipid Chemistry Analysis

The lipid content, lipid class, and fatty acid content are shown in Table 1. This traditional way to present the lipid data gives the overall content class and fatty acid profile of GSM. The gonad had the highest lipid content (4.8 g/100 g) of the three organs, while the mantle was leaner with only 1.6 g/100 g lipid. The lipid class analysis, by TLC-FID, showed that the majority of the lipid in all three organs was polar lipids.

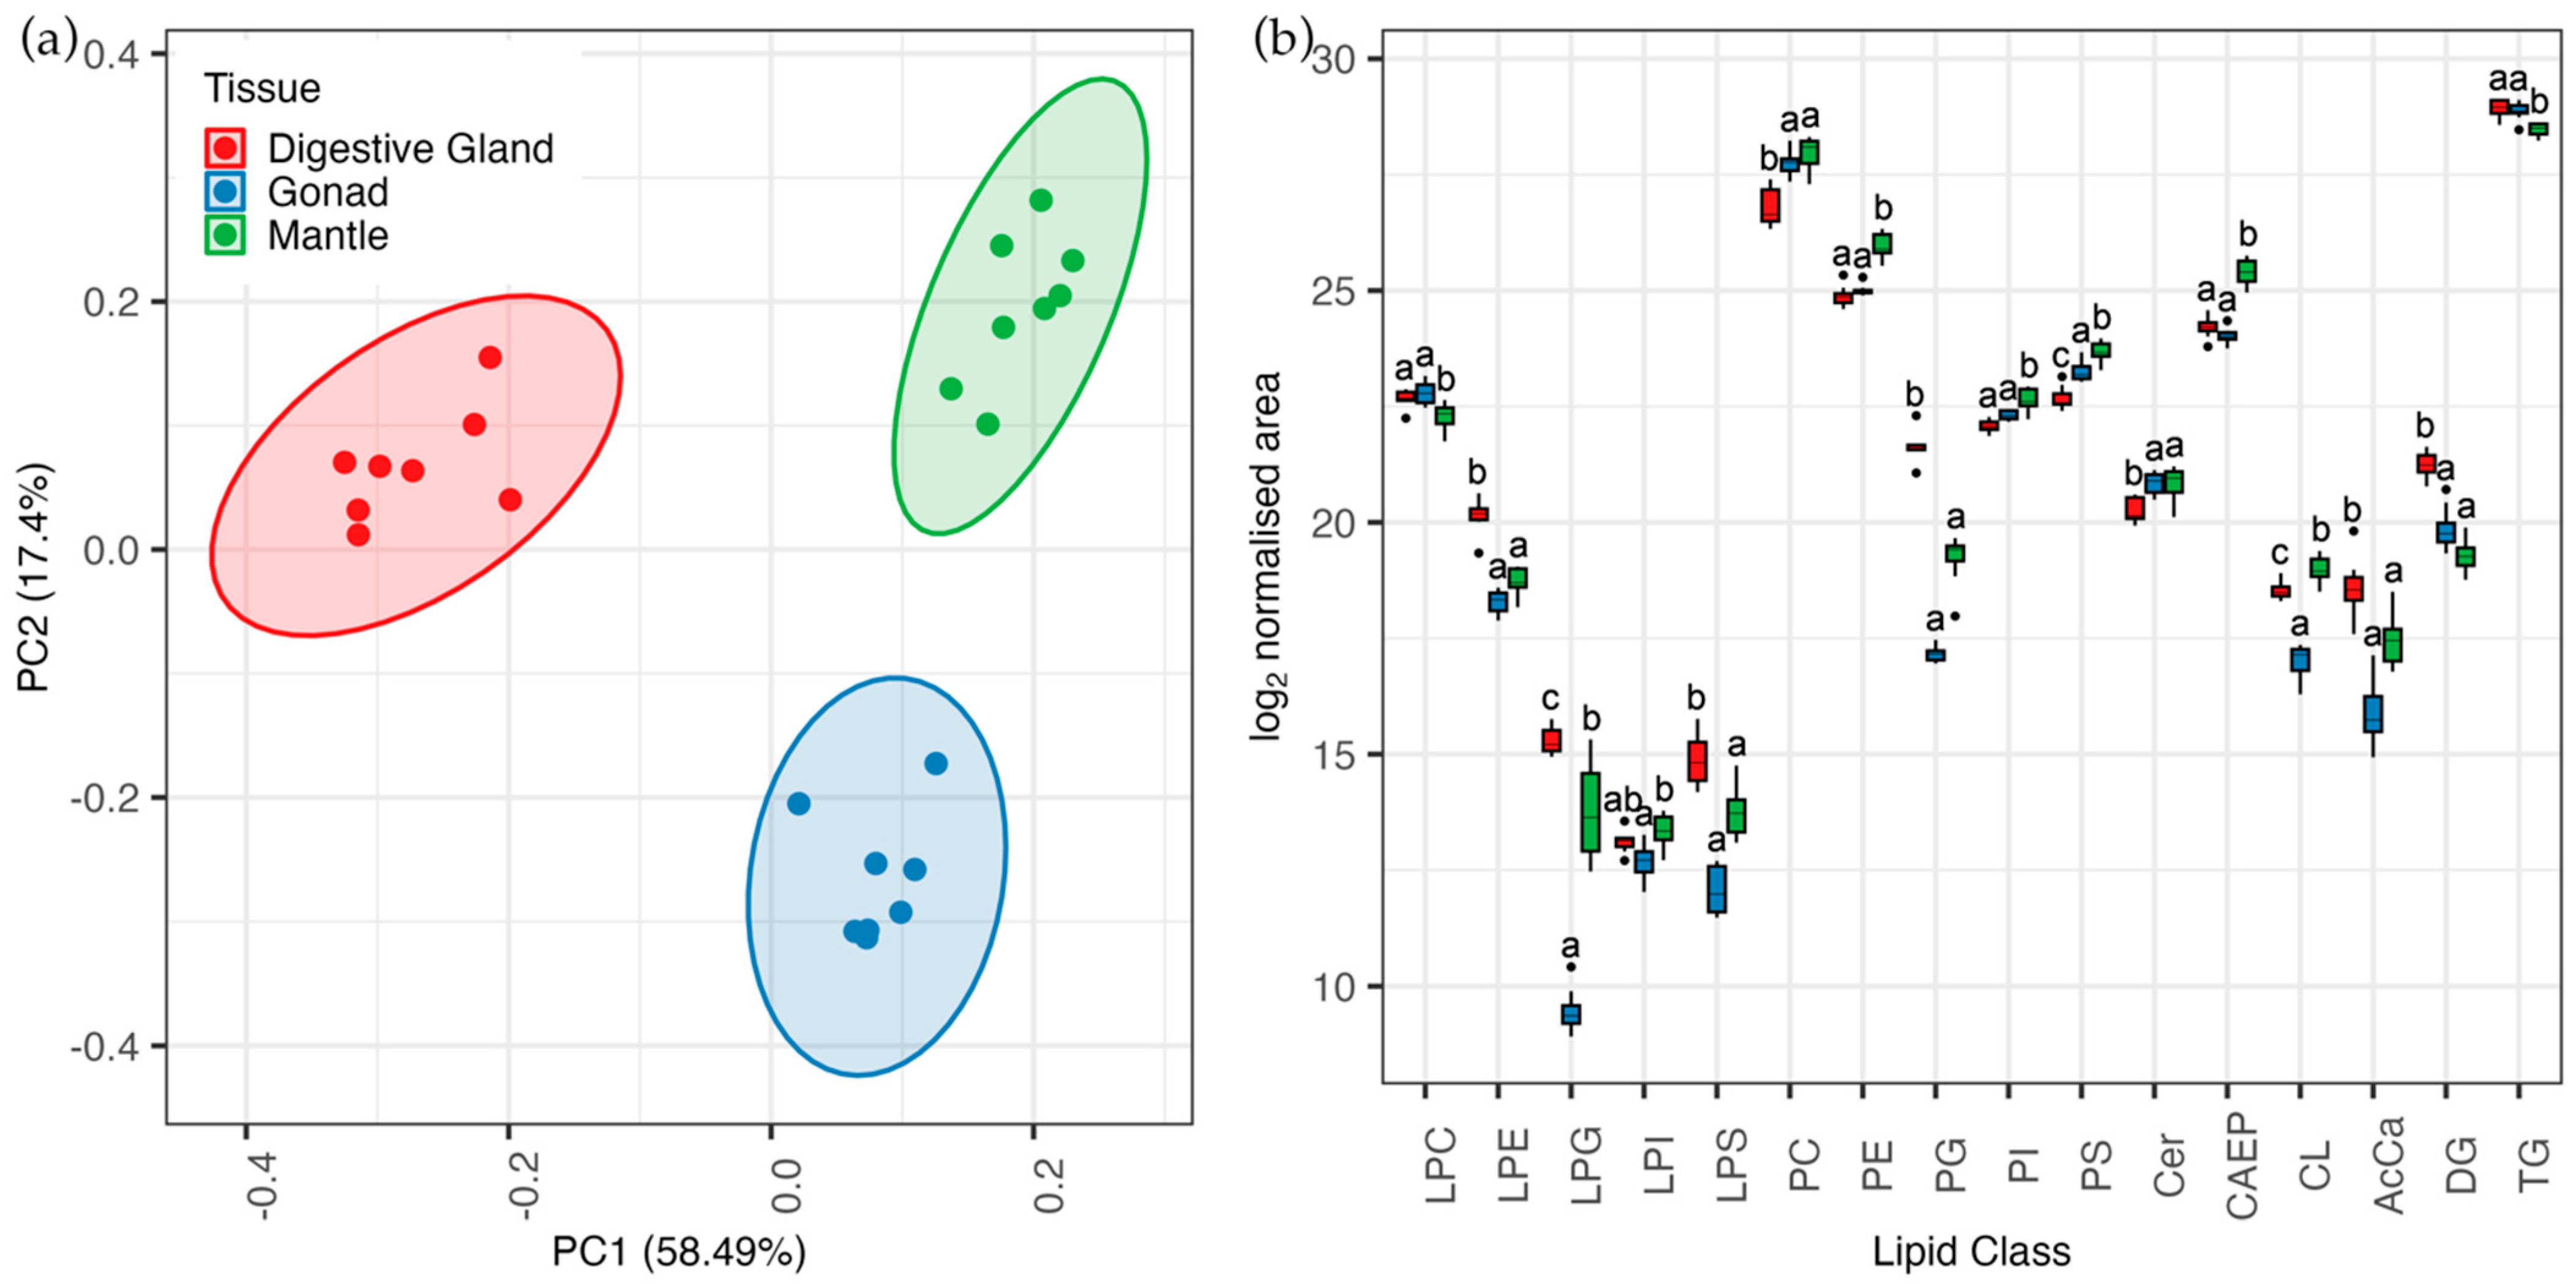
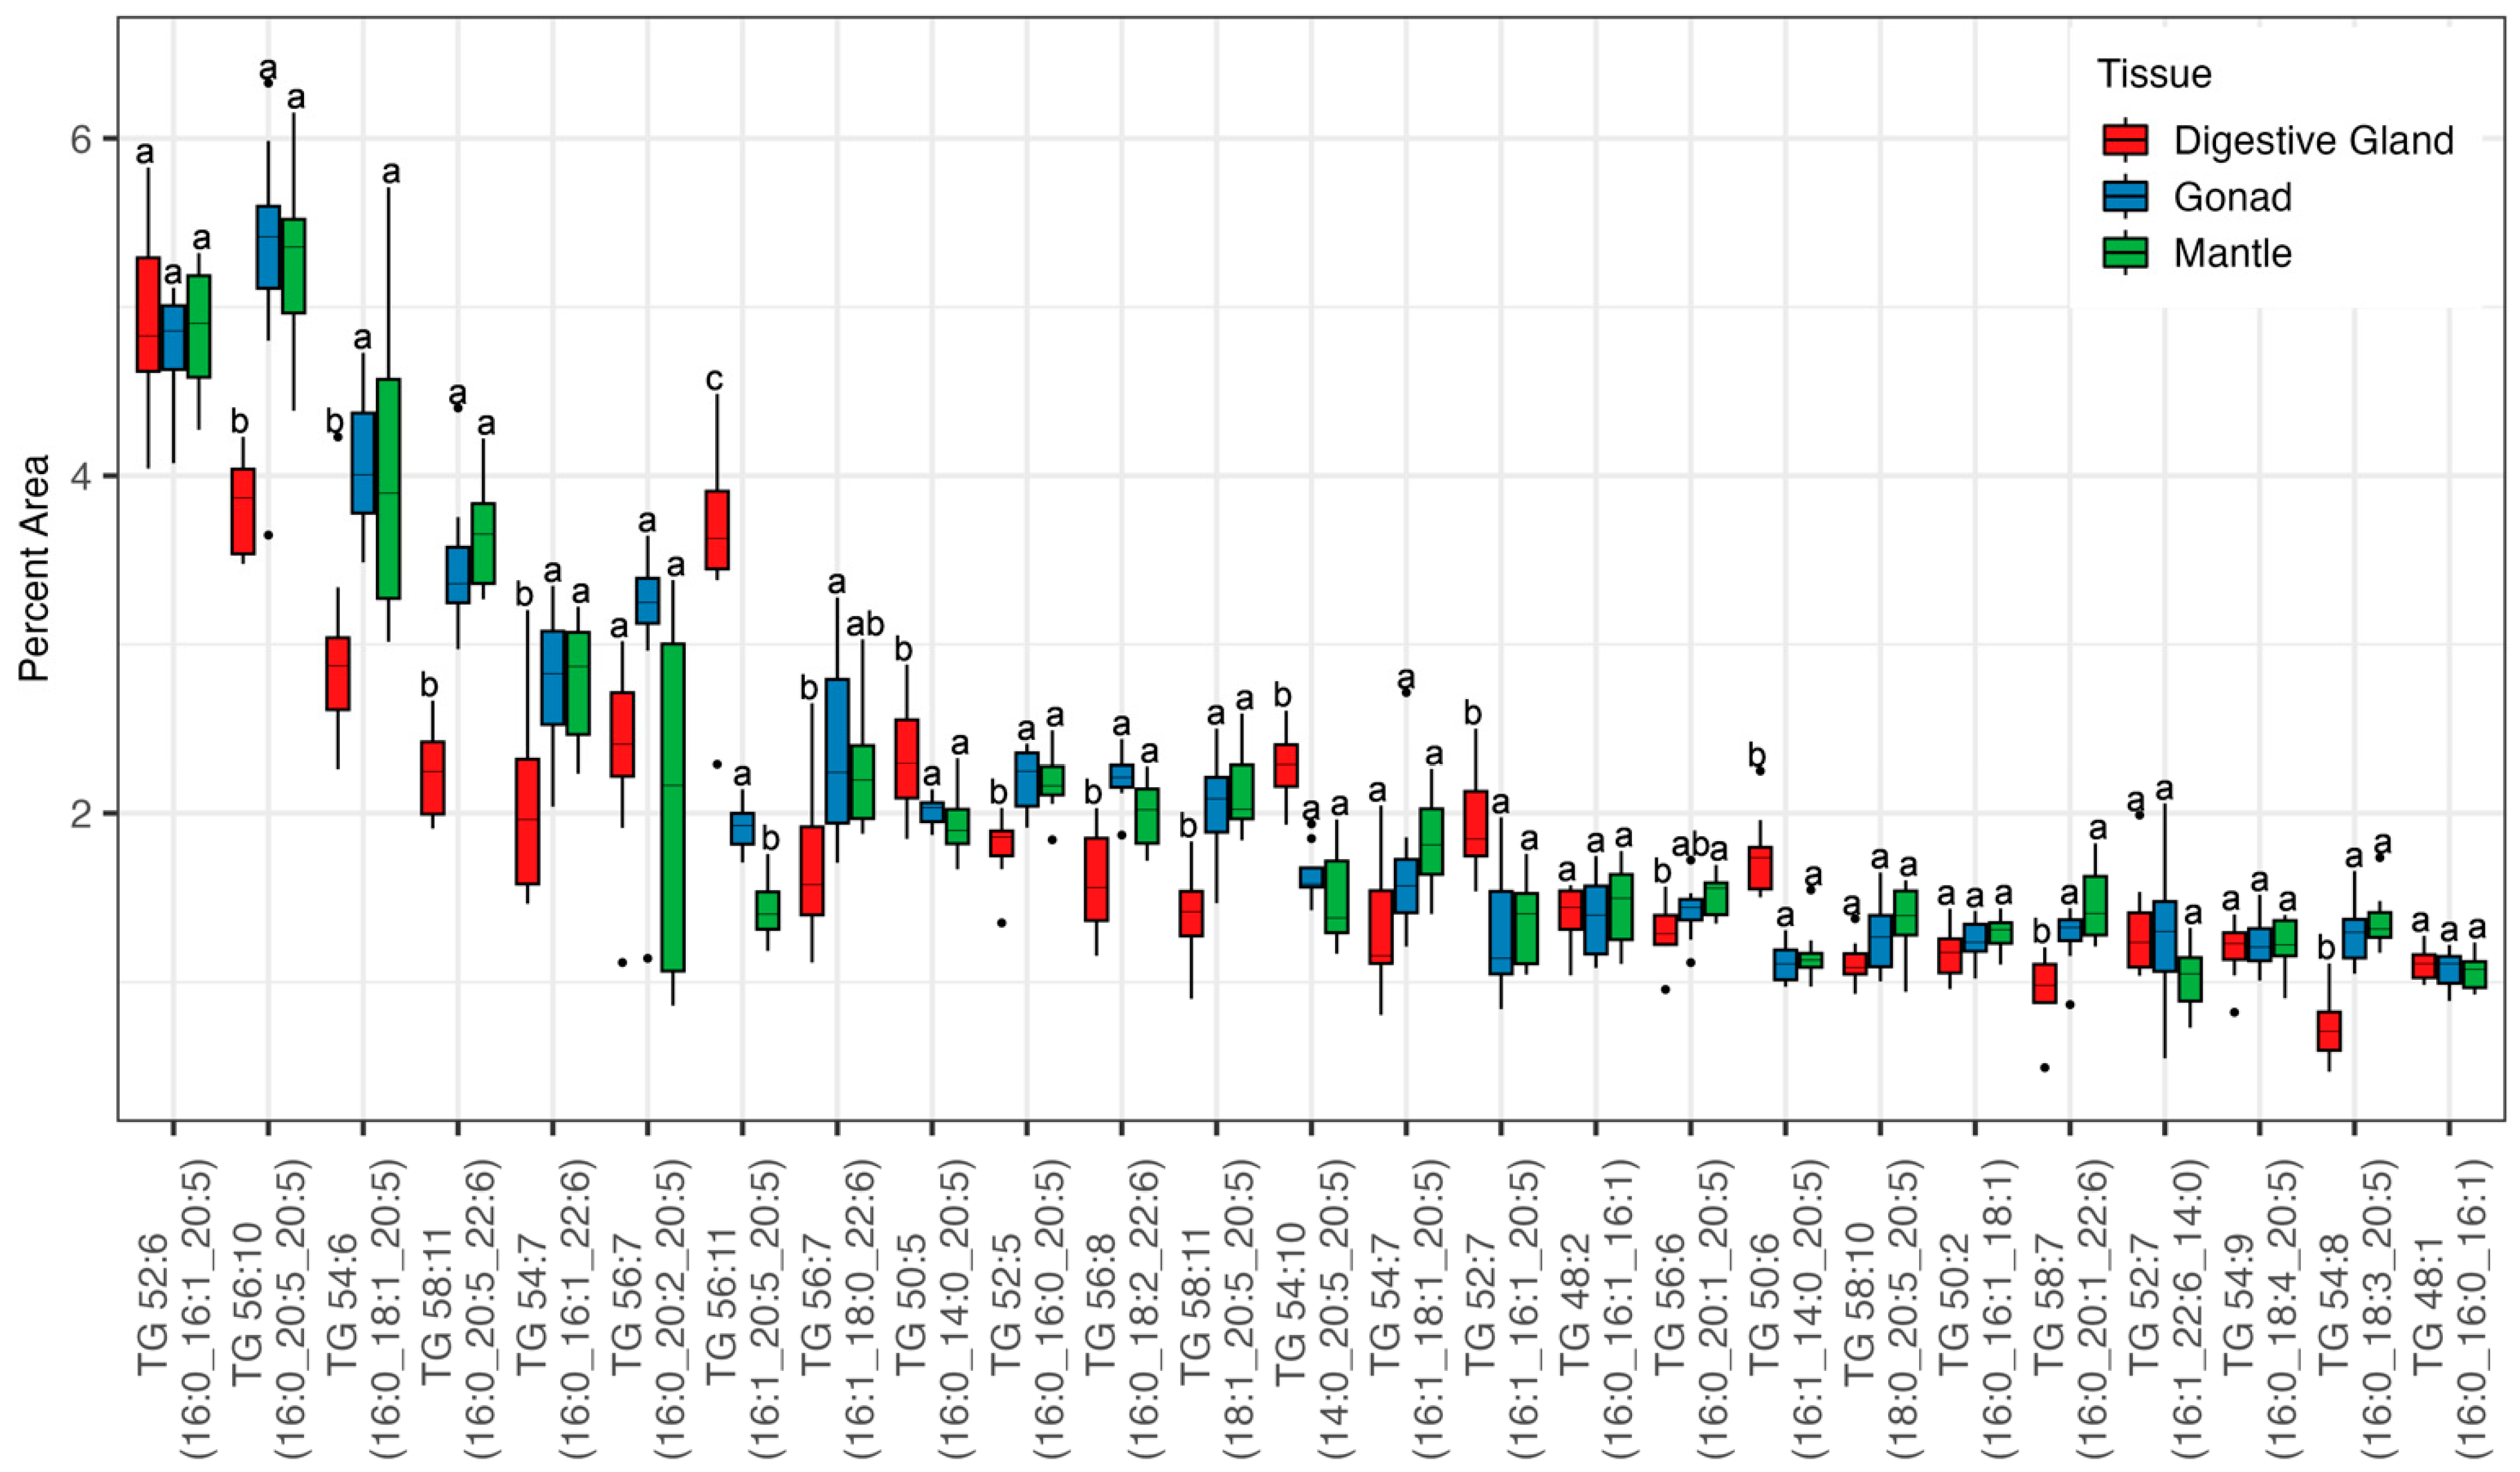
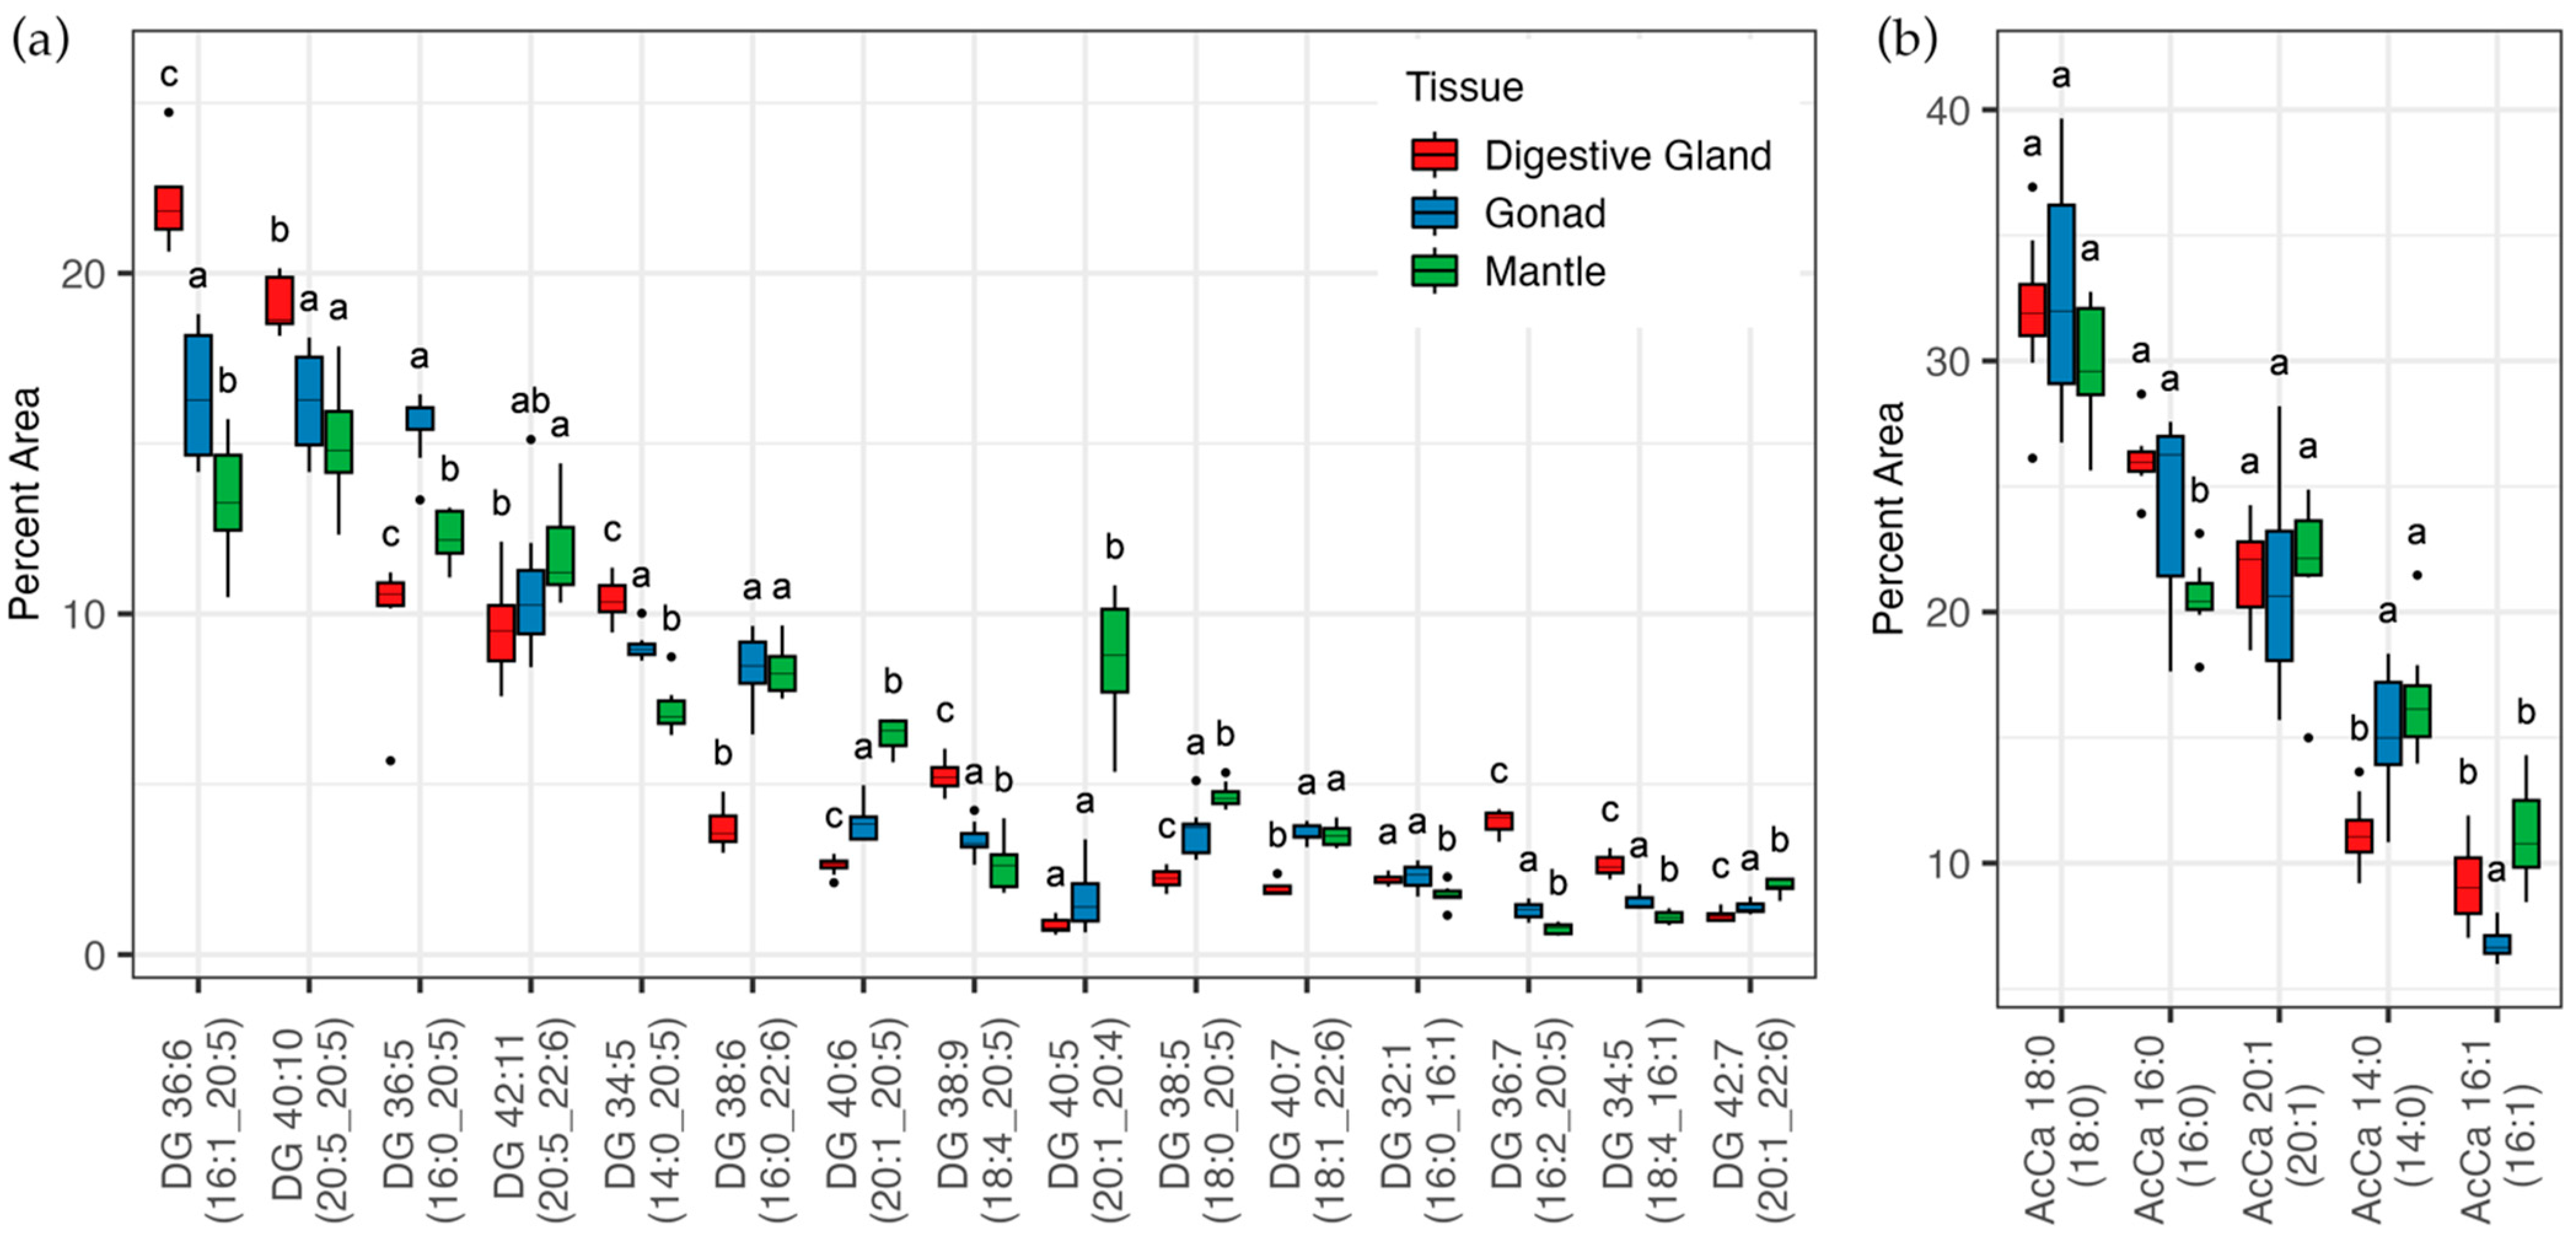
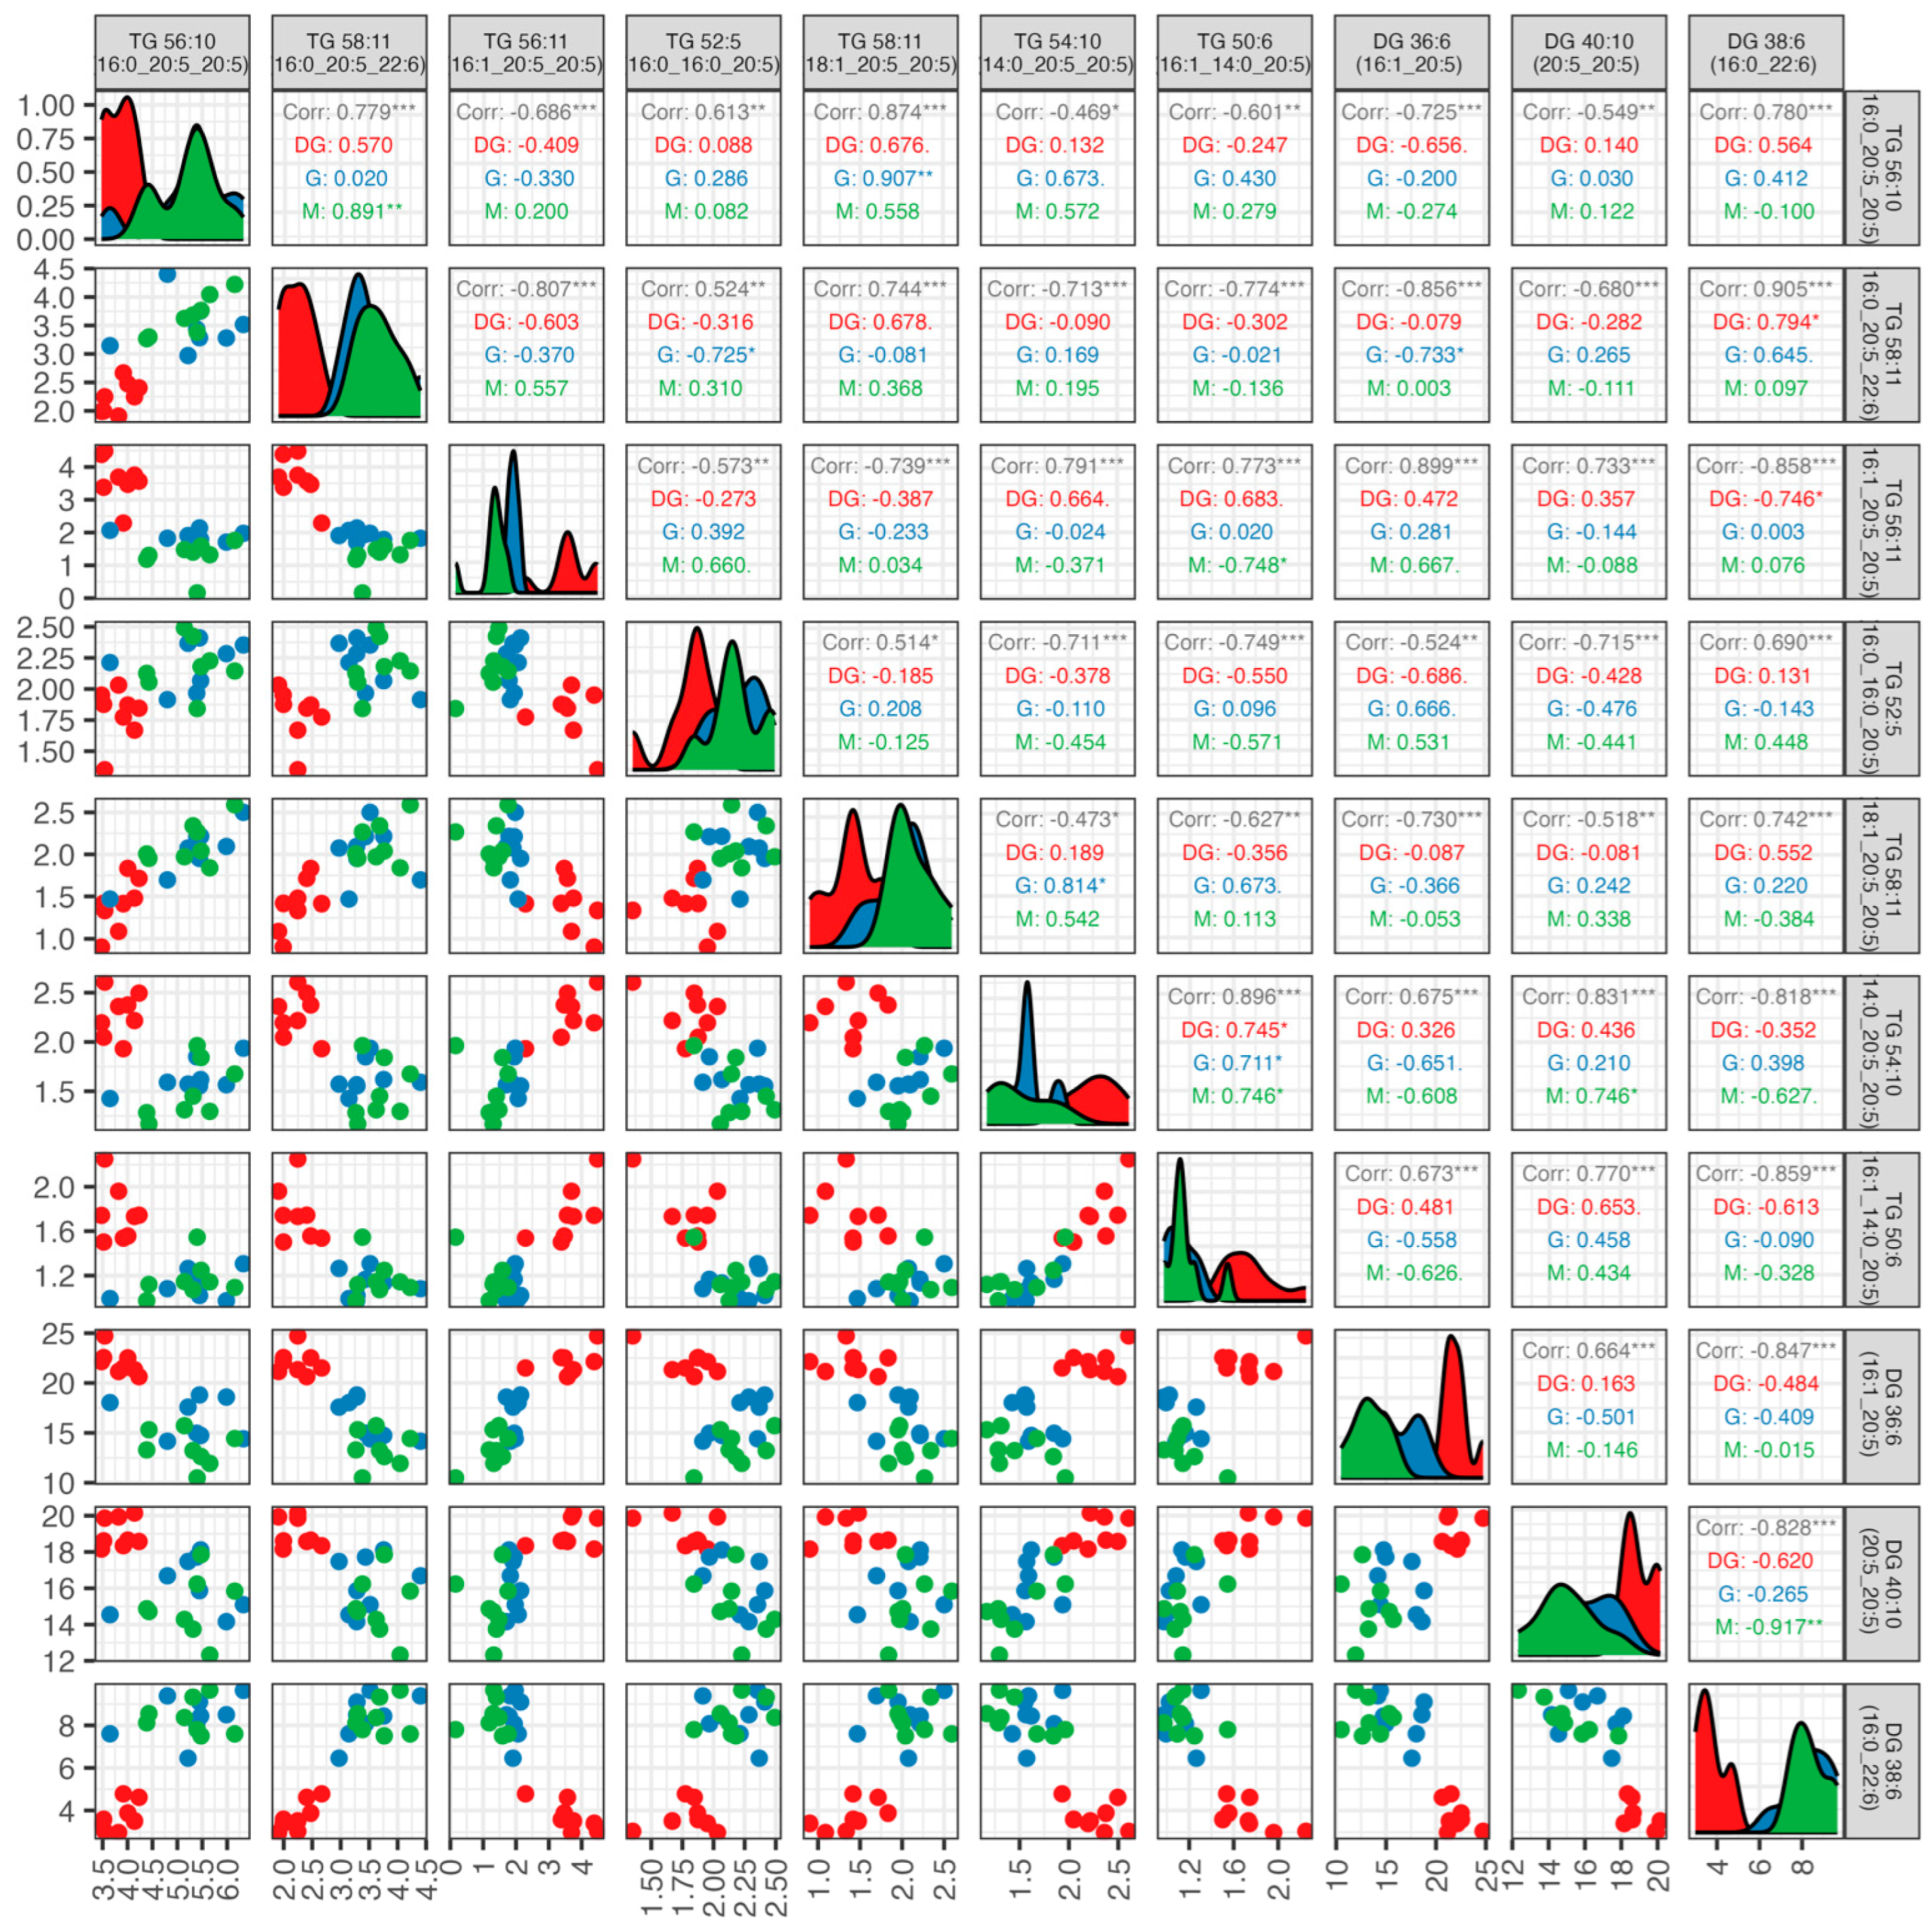
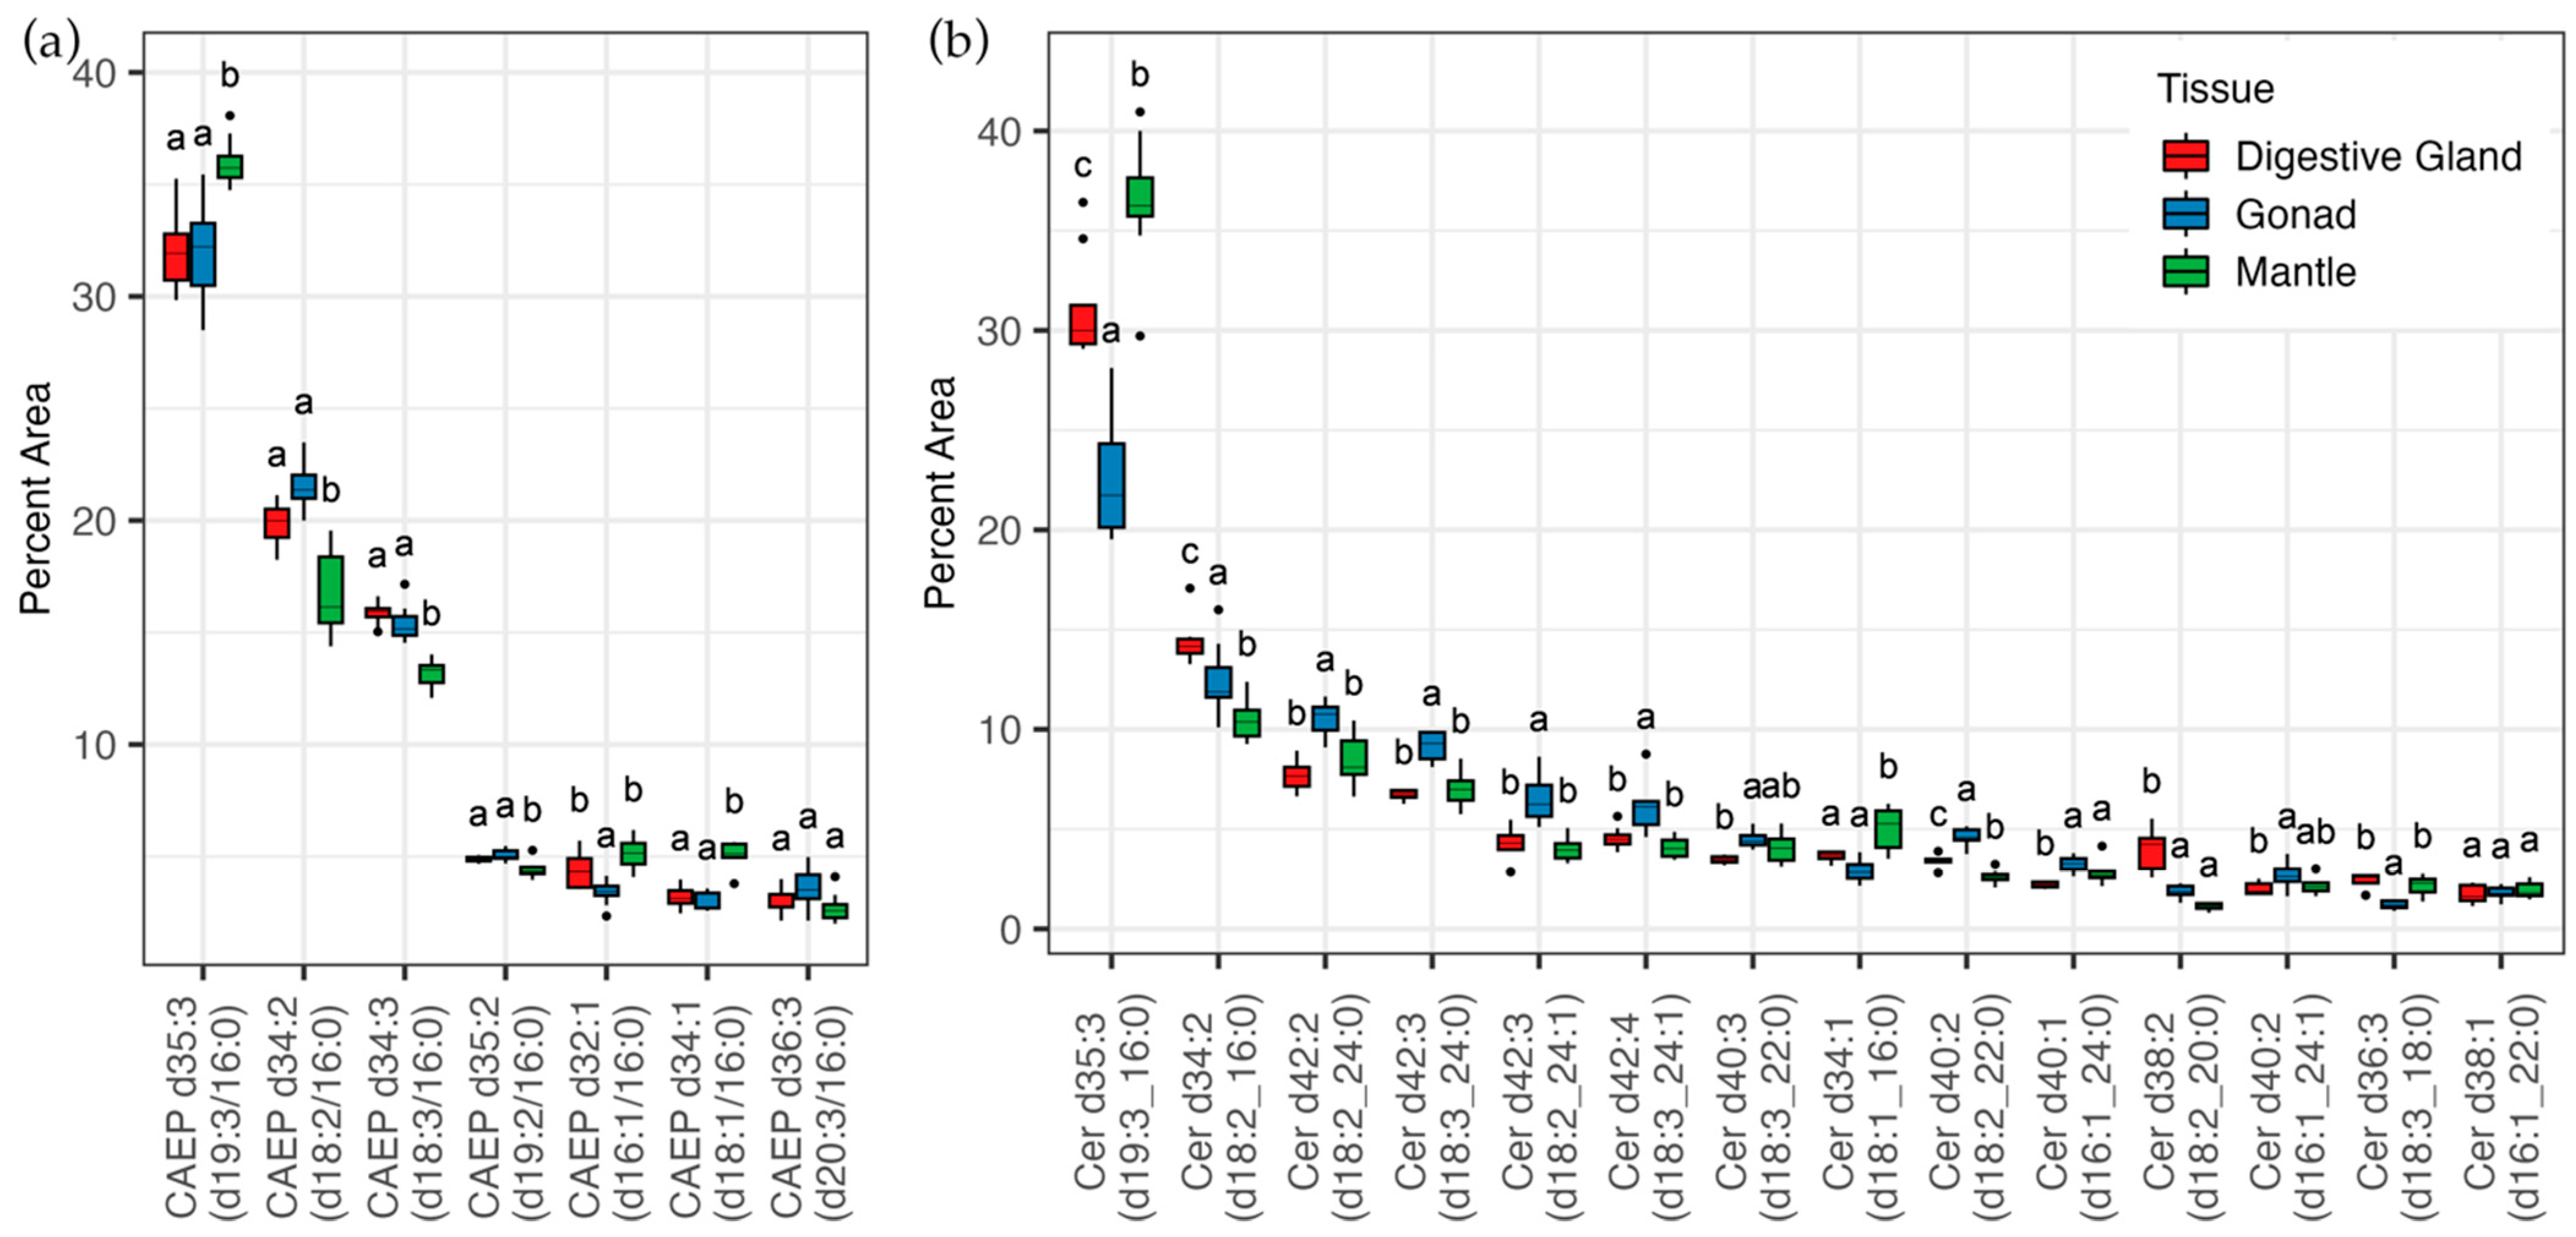
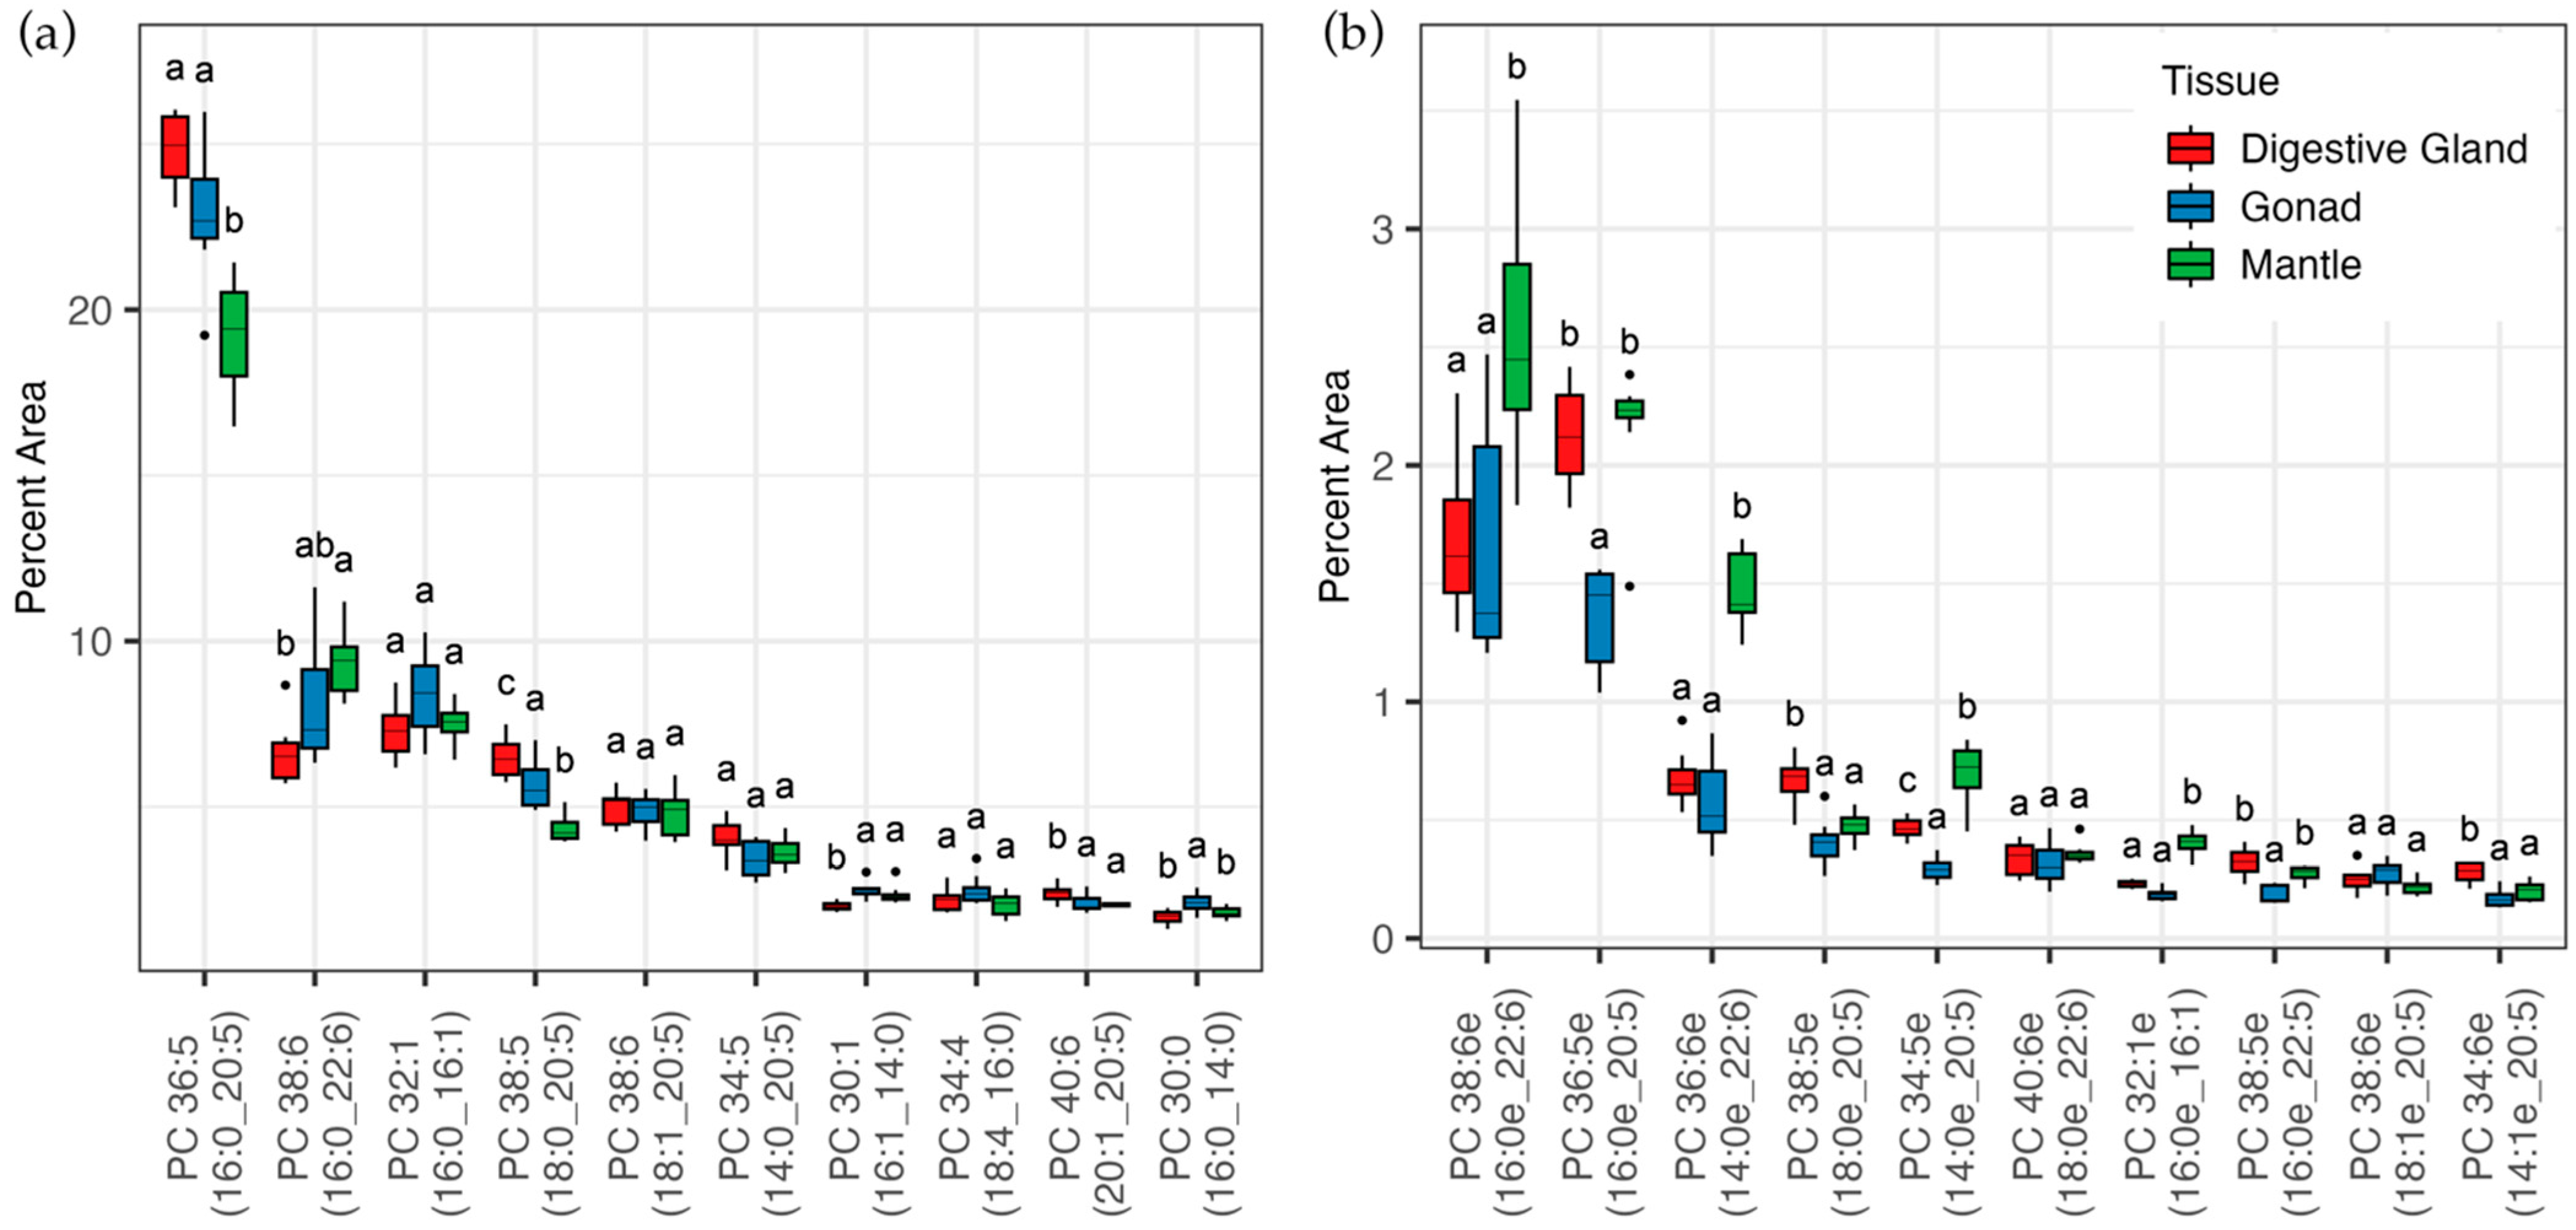
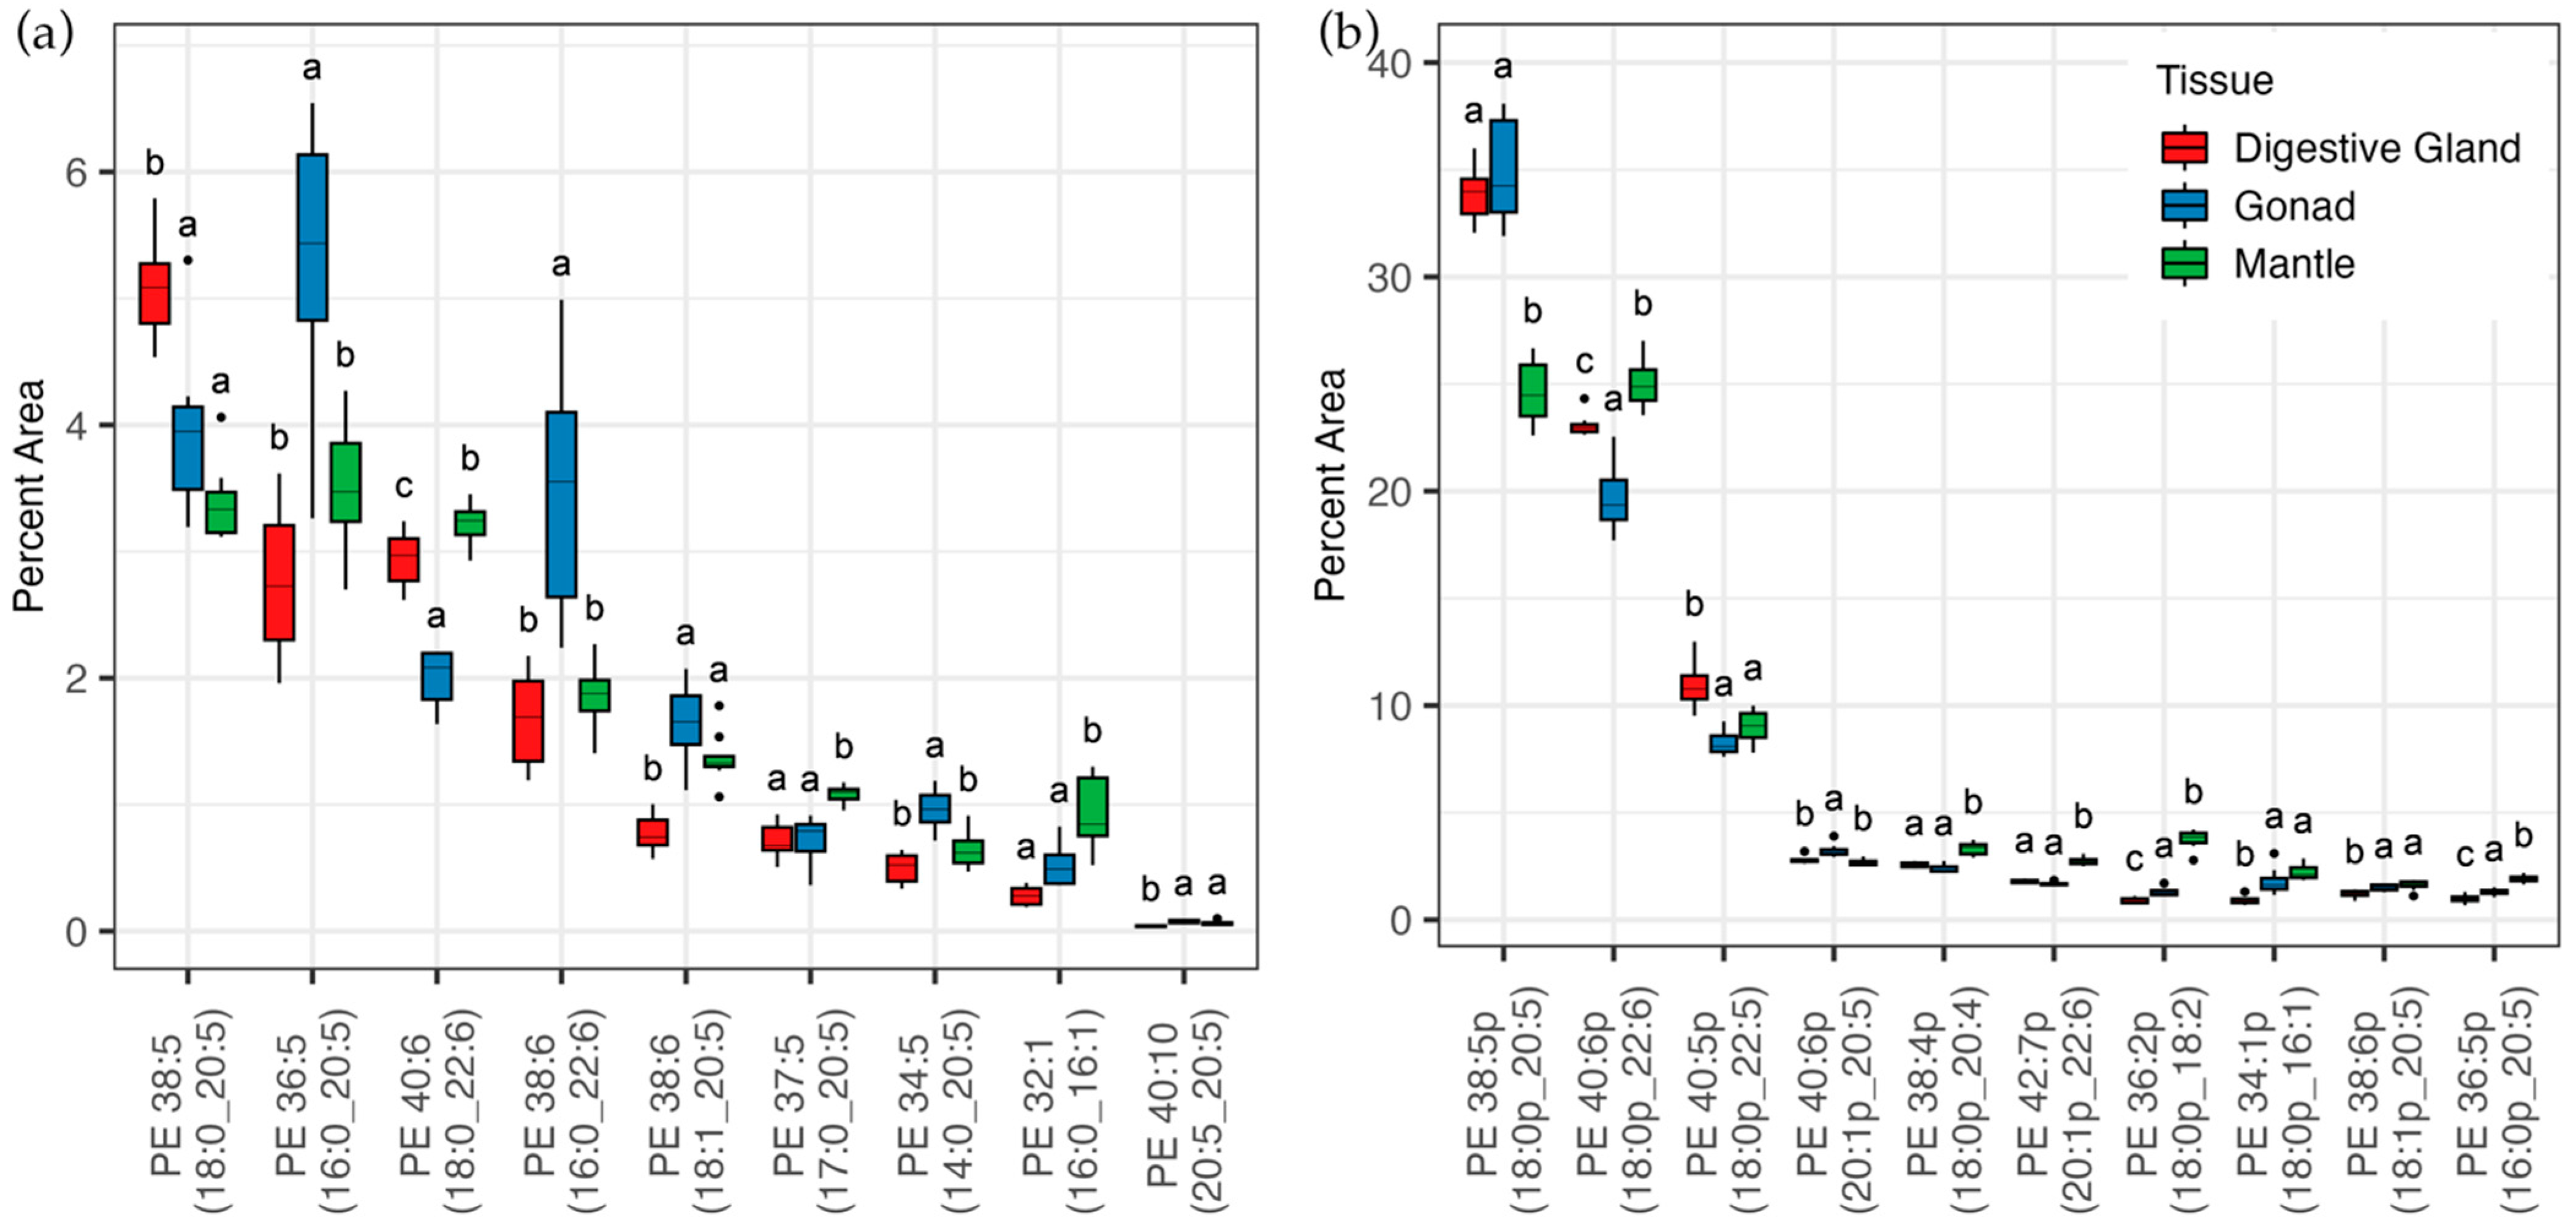
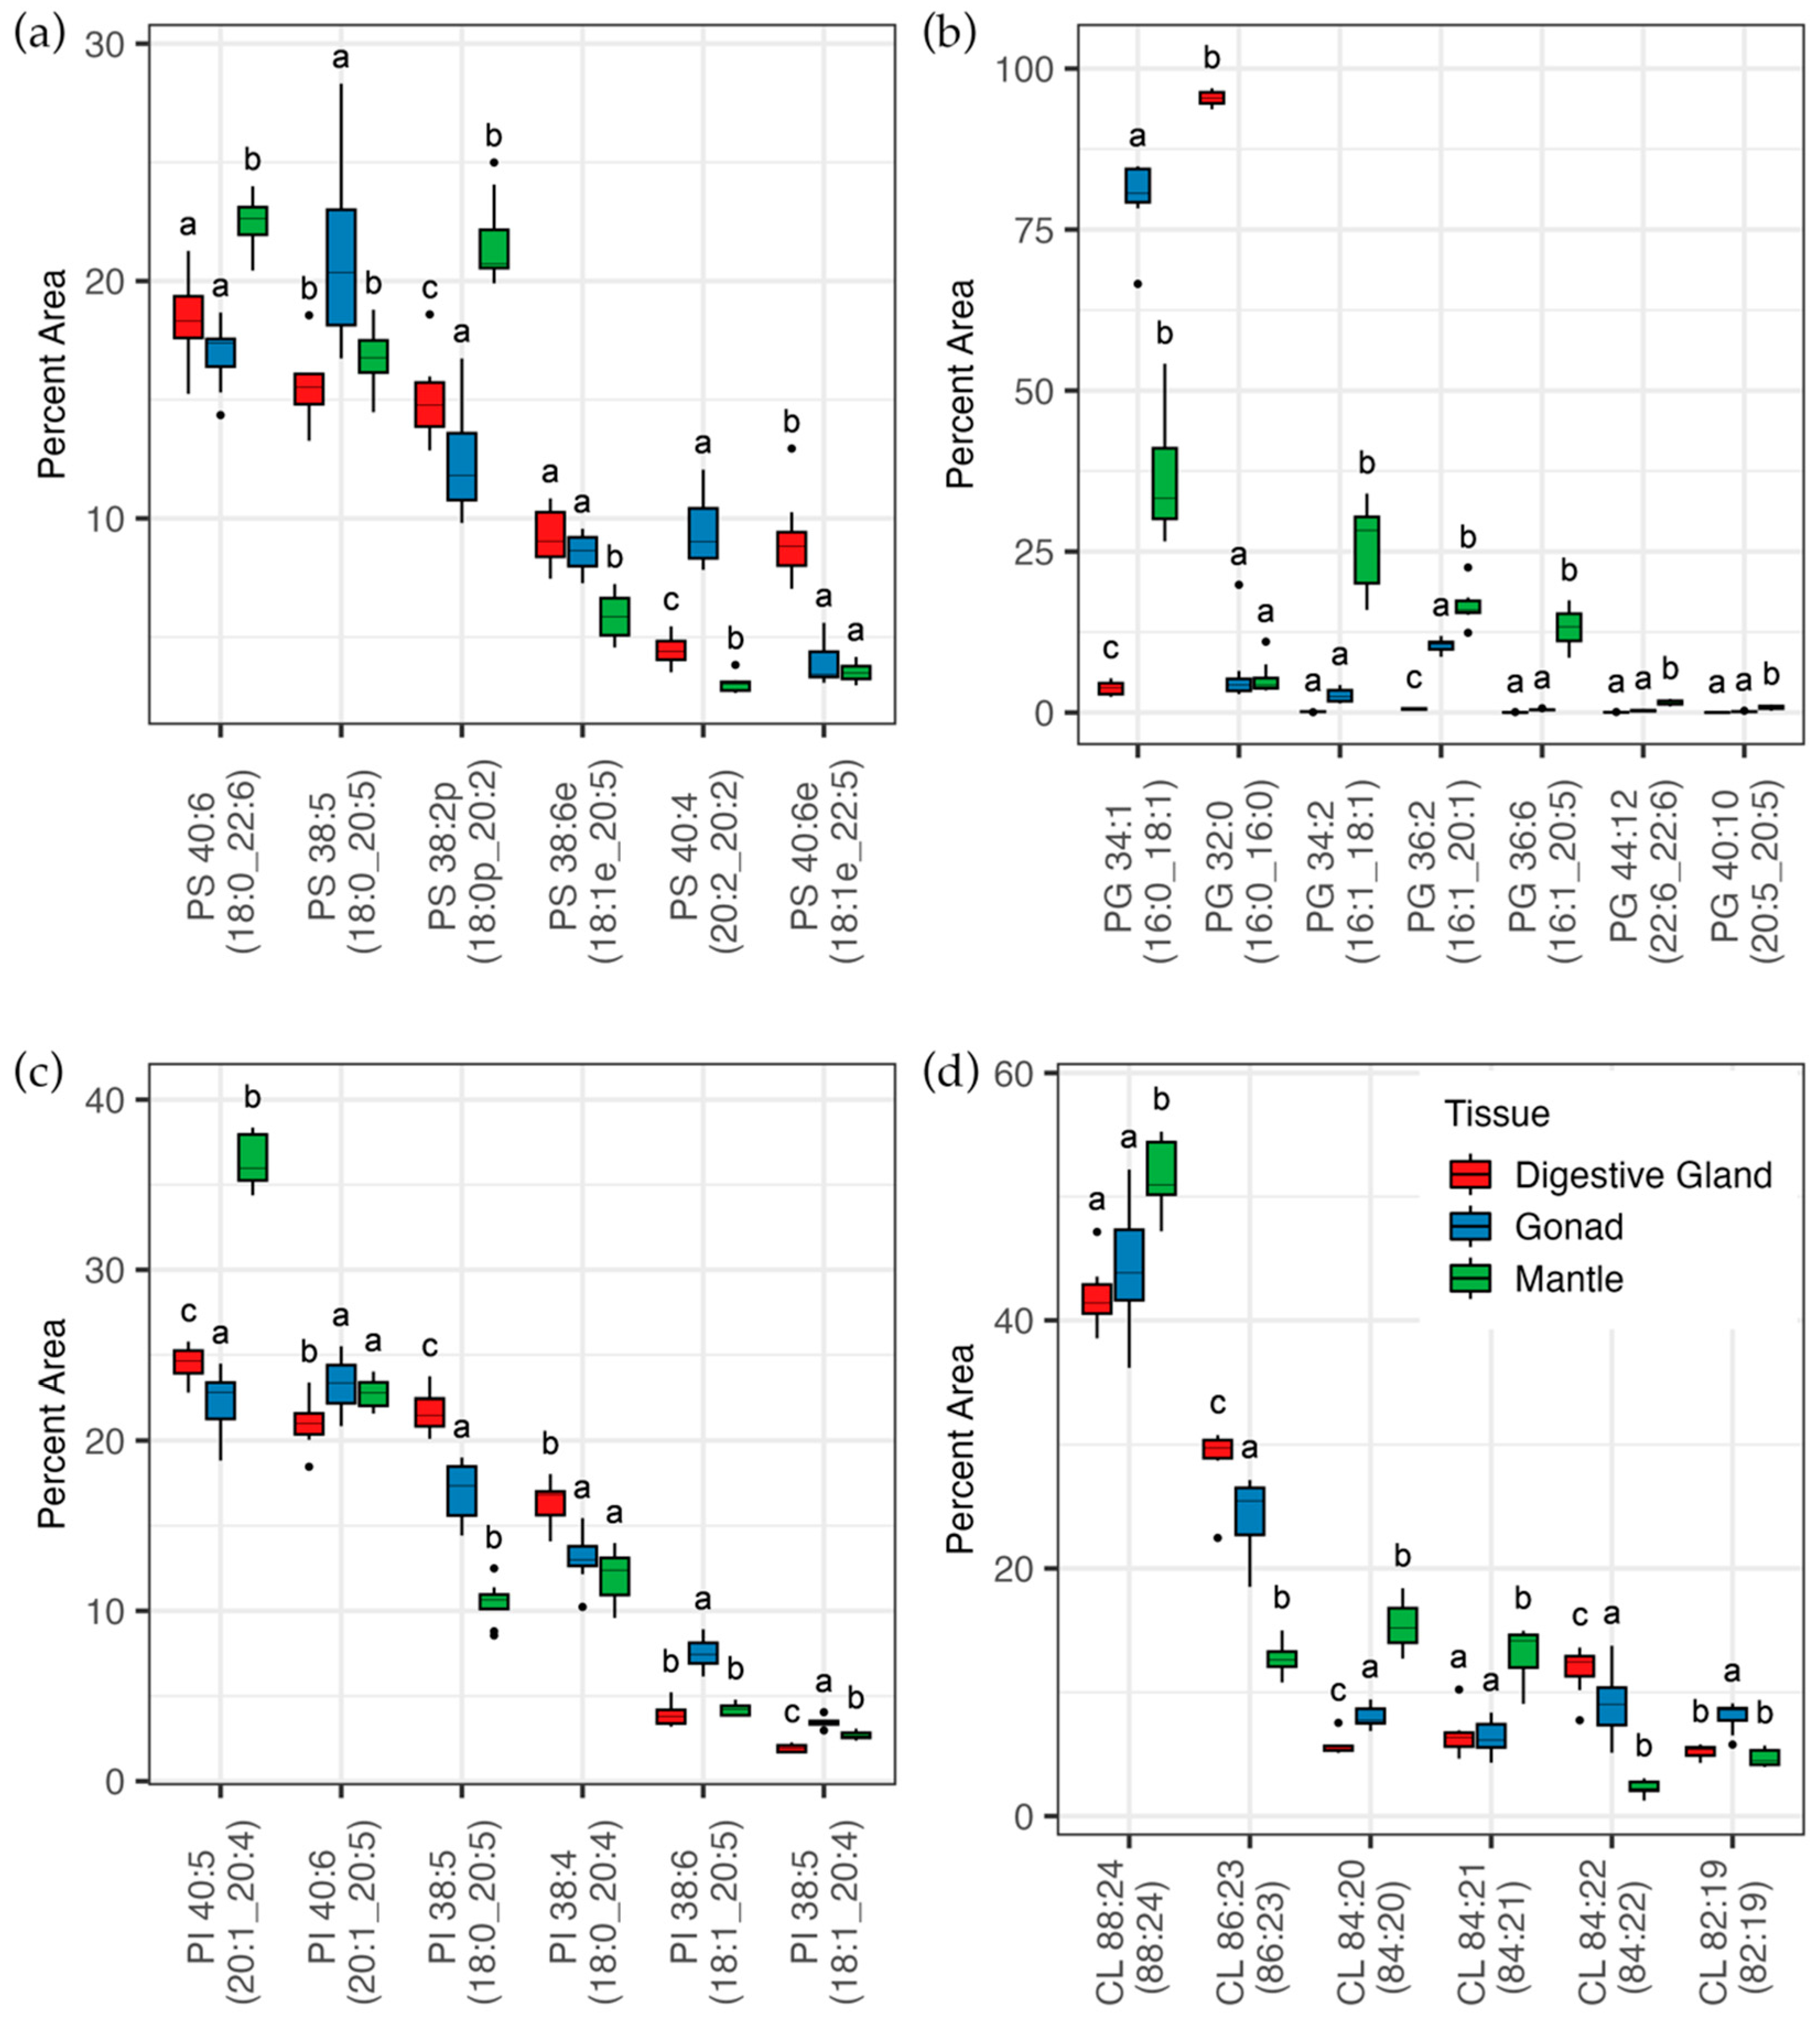
3.2. Lipidomic Analysis

Analysis of the LC-MS/MS chromatograms identified 16 different lipid classes, not including ether and vinyl ether-linked hydrocarbon chains. Following lipid identification, the normalised data were log2 transformed and principal components analysis was used to determine if the lipid composition was different between the three tissue types. PCA analysis (Figure 1a) using the complete dataset shows a clear separation between the different tissue types of GSM. The first component shows a clear separation between the digestive gland (red) and the other two tissue types, accounting for almost 60% of the differences. The second principal component accounted for about 17% of the differences and demonstrates the differences between the mantle (blue) and gonad (green).
We then compared the lipid classes using a more traditional analysis and combined all of the lipid species within a class; the lyso phospholipids were separated from the diacyl, ether, and vinyl ether phospholipids. As there were no lipid standards for the ceramide aminoethyl phosphonate (CAEP) at the time of analysis, the normalised log2 transformed area was used to produce a box plot of the lipid class data (Figure 2). Consistent with the lipid class data (from Table 1), there is significantly less TG in the mantle compared to the digestive gland and gonad. The difference in the polar lipid distribution (mantle 86.2 > gonad 70.1 > digestive gland 66.4 g/100 g of oil) is most likely due to significantly less phosphatidylcholine (PC) in the digestive gland and significantly more phosphatidylethanolamine (PE) and CAEP in the mantle. There is a similarity in the distribution of the lyso-phospholipids and acylcarnitine (AcCa) species, indicating phospholipid breakdown/remodeling for AcCa formation and energy production. Cardiolipin, a mitochondrial lipid, is significantly lowest in the gonad and significantly highest in the mantle.
The major lipid class of the GSM chloroform extract for each of the three different tissue types is the triglyceride (TG) species. Over 200 TG species were identified, predominantly acyl-glycerides with very few ether TG species identified. Twenty-five different TG species make up approximately 50% of the TG oil composition of each tissue (Figure 2). The use of a C30 column has enabled the baseline separation of many TG isomers in GSM oil with a relatively fast gradient. The chromatographic separation of lipid species increases the complexity of the lipidome by separating isobaric lipid species [26]. In the twenty-five most abundant TGs in GSM oil, we have identified isobaric species of 52:7, 54:7, and 56:7 that contain either an EPA or DHA. These TG species are baseline separated compared to using a similar gradient with a more conventional separation on a C18 or C8 column where the isobaric species usually overlap.
The top five most abundant TG all contain both palmitic acid and EPA: TG 52:6 (16:0_16:1_20:5), TG 56:10 (16:0_20:5_20:5), TG 54:6 (16:0_18:1_20:5), TG 58:11 (16:0_20:5_22:6) and TG 56:7 (16:0_20:2_20:5). In the digestive gland, TG 56:11 (16:1_20:5_20:5) and TG 56:7 (16:0_20:2_20:5) are more abundant than the DHA containing species. There were few significant differences in the percentage of TG species between gonad and mantle tissues, the only significant difference was between TG 56:11 (16:1_20:5_20:5) which is significantly lower in the mantle. For sixteen of the top 25 most abundant TG species, there is a significant difference between the digestive gland and one or both of the other tissues. There is significantly more TG in the digestive gland in five species which all contain either 16:1 or 14:0 fatty acids, namely TG 56:11 (16:1_20:5_20:5), TG 50:5 (16:0_14:0_20:5), TG 54:10 (14:0_20:5_20:5), TG 52:7 (16:1_16:1_20:5) and TG 50:6 (16:1_14:0_20:5). All of the five TG species that contain DHA (22:6) are lower in the digestive gland than in both other tissues. EPA is found in at least one position in 15 of the top 25 most abundant TG species, whereas DHA is only found in 5 lipid species, although not all species contain long-chain fatty acids. However, medium-chain fatty acids are found in all of the top 25 most abundant lipid species, with palmitic acid found in 16 species.
Sixteen diglyceride (DG) species were identified and were all diacyl species with no ether lipids. The two most abundant were DG 36:6 (16:1_20:5) and DG 40:10 (20:5_20:5) shown in Figure 3a which were both significantly more abundant in the digestive gland. Other species with higher abundance in the digestive gland all contained fatty acids 14:0, 16:2, 18:2, or 18:4 which are consistent with the observations for the TG species. Species with FA 20:1 (20:1_20:4, 20:1_20:5, and 20:1_22:6) were all significantly higher in the mantle. The remaining species with a DHA (22:6) moiety were all significantly more abundant in the mantle than in the digestive gland. Acylcarnitine species (Figure 3b) associated with β-oxidation and lipid breakdown [27], show a strong preference for the degradation and mitochondrial translocation of the high-energy unsaturated and monounsaturated species, with the highest amount in total occurring in the digestive gland. Surprisingly, the AcCa 14:0 has a relatively low distribution in the digestive gland. AcCa 16:0 is lowest in the mantle and AcCa 16:1 is lowest in the gonad. There is little difference between the relative percentage distribution of AcCa in tissues and also no difference in AcCa 18:0.
To investigate the relationship between the DG and TG pools, we conducted a correlation analysis between the most abundant lipid species that show differential expression between the tissues (Figure 4). This analysis shows a strong positive correlation between di-EPA TG species with the two TG species containing either 16:0 and 18:1 (TG 58:11(18:1_20:5_20:5) and TG 56:10 (16:0_20:5_20:5)) showing a very strong positive correlation with each other and with the two species containing either 14:0 or 16:1 (TG 54:10 and TG 56:11) having a strong negative correlation. The predominant positive correlation was between TG 56:11 (16:1_20:5_20:5), TG 54:10 (14:0_20:5_20:5), TG 50:6 (16:1_14:0_20:5), TG 50:5 (16:0_14:0_20:5) and TG 52:7 (16:1_16:1_20:5), which all have significantly higher abundance in the digestive gland than in the gonad and mantle; correlation coefficient greater than 0.60.
The correlation of the major DG species with corresponding TG species shows the two major DG species correlate strongly with TG. The most abundant DG species (DG 36:6 (16:1_20:5), has a strong correlation (0.89) with TG 56:11 (16:1_20:5_20:5). Whereas DG 40:10 (20:5_20:5) has the strongest correlation, 0.83, with TG (14:0_20:5_20:5). These species are all characterised by a significantly higher percent in the digestive gland and in the case of 16:1 containing TG 56:11 almost half as much in both the gonad and mantle. Conversely, the DHA containing DG 16:0_22:6 has a strong negative correlation with the EPA containing DG species (DG 36:6 -0.847 and DG 40:10, -0.828), and has a very strong correlation (>0.90) with TG (16:0_20:5_22:6) which indicates that this TG species may have 20:5 in the sn-3 position.
Liquid chromatography of oil extracted from GSM tissues showed a number of large peaks which elute in the polar lipid fraction of the chromatogram that were not identified using standard databases. These lipid species ionised in both positive and negative ion modes and were determined to be CAEP species [28]. GSMs have significant levels of ceramide and CAEP and there are significant differences in the abundances of CAEP between GSM tissues with a major accumulation in the mantle (Figure 5a). Twenty-one ceramide species were identified with the most abundant shown in Figure 5b. The most abundant species of both CAEP and ceramide were the 1,3 dihydroxy- (d)35:3 (d19:3_16:0) which accounted for approximately 30% of the abundance for each class and significantly more in the mantle than the other two tissues. The predominant sphingoid bases for both CAEP and ceramide are d19:3, d18:2, and d18:3. The next most abundant CAEP species were CAEP d34:2 and CAEP d36:3 which accounted for around 10% more than the other CAEP species and were less abundant in the mantle. For the ceramides, the species distribution slowly tapered from Cer d34:2 (d18:2_16:0) which accounted for approximately 10% of the ceramide pool.
The phosphatidylcholine (PC) species are typically the most identified phospholipid species in biological tissue by lipidomic techniques. This is partly due to their ease of ionisation and also the fragmentation of phosphocholine which gives a unique diagnostic ion of 184 m/z. In GSM tissues, 81 PC species were identified and they were predominantly acyl species, although ether (e) and plasmalogen (p, vinyl ether) linked species were also identified. PC 36:5 (16:0_20:5) was almost twice as abundant as the other species accounting for approximately 20% of the PC pool (Figure 6a), although it was significantly lower in the mantle. Less than 10% each of another two palmitic-containing species PC 38:6 (16:0_22:6) and PC 32:1 (16:0_16:1) had only a small difference between the tissues. The ether-linked containing PC species were characterised by some of the more abundant species being more abundant in the mantle, namely the DHA ether-containing species (14:0e_22:6) and (16:0e_22:6) (Figure 6b).
Phosphatidylethanolamine (PE) is easily detected in positive ion mode through the neutral loss of the head group (141 m/z). Negative ion fragmentation results in the predominant loss of the fatty acid from the sn-2 position, enabling confirmation of the fatty acid composition. We identified 29 PE species including ether and plasmalogen species. Unusually, the ether-linked PE species were more abundant than the acyl-linked species. For the acyl species (Figure 7a) only PE 38:5 was significantly higher in the digestive gland. The two palmityl containing species, together with a LC-PUFA, were both significantly higher in the gonad along with PE 34:5 (14:0_20:5). Three species were significantly higher in the mantle containing the acyl pairs (18:0_22:6, 17:0_20:5 and 16:0_16:1). For the ether-linked PE species (Figure 7b), three species were dominant in abundance; these were all annotated as having a plasmalogen 18:0p and an LC-PUFA, either (20:5, 22:5 or 22:6). The mantle differs more significantly to the other two tissues, particularly with almost 10% less PE 38:5p (18:0_20:5) and significantly more PE 40:6p (18:0p_22:6).
The phospholipids phosphatidylserine (PS), phosphatidylglycerol (PG), and phosphatidylinositol (PI) are all detected through negative ion mode and fragmentation gives rise to the loss of acyl chains again allowing composition determination. These phospholipids are not only less dominant than PC and PE but have lower signal intensity, and therefore it is harder to detect low-abundance species. Eleven PS species were annotated, the two most abundant species containing either DHA or EPA with stearic acid (Figure 8a). The DHA-containing species were more abundant in the mantle and EPA species were significantly more abundant in the gonad. The PG distribution was entirely different for each tissue (Figure 8b), only seven PG species were identified. In the digestive gland, PG was almost entirely PG 32:0 (16:0_16:0) with less than 5% PG 34:1. PG 34:1 (16:0_16:1) was the most predominant PG species in both the gonad and mantle. However, the mantle had a more even distribution with PG 34:2, PG 36:2, and PG 36:6. The mantle also had significantly more di EPA and di-DHA PG than both other tissues. Figure 8c shows the 6 most abundant PI species. In total, there were 16 PI species annotated. PI 40:5 (20:1_20:4) is significantly higher in the mantle than in the other tissues. It accounts for almost 35% of the total PI species in the mantle, with >10% more than the other tissues. This corresponds with an almost similar increase in the corresponding DG species.
Cardiolipin (CL) species are associated with the inner membrane of the mitochondria and can be detected in both positive ion mode [M+H]+ and negative ion mode [M-H] and [M-2H]2. The daughter ions in negative ion mode are the diagnostic free fatty acids and in positive ion mode are fragmented into two DAG -H20+. Some indication of the composition can be gleaned although the exact location of the acyl chains cannot be confirmed. The CL species containing four DHA moieties, CL 88:24 (22:6/22:6/22:6/22:6), accounted for between 40-50% of the CL in GSM. This along with the other species that contain 3 DHA moieties and a medium chain FA CL 84:21 (18:3_22:6_22:6_22:6) and CL 84:20 (18:2_22:6_22:6_22:6) were significantly more abundant in the mantle. The two species that were significantly less in the mantle were both EPA-containing species CL 86:23 (20:5_22:6_22:6_22:6) and CL 82:19 (18:2_20:5_22:6_22:6). The final species containing an equal mixture of both EPA and DHA, CL 84:22 (20:5/22:6/20:5/22:6), is proportionally more abundant in the gonad. These results indicate potential remodeling or differences in the bioavailability of the precursors in the different tissues.

4. Discussion

Marine bivalves such as mussels, oysters, and scallops are a sustainable source of both protein and omega-3 LC-PUFAs. As filter feeders, they grow and survive on microorganisms from the marine environment having one of the lowest carbon footprints of animal protein sources [29]. The waste shells have been used successfully for redeveloping habitats through artificial reefs [30]. The ecosystem services range from filtering and cleaning water enabling more light (decreasing turbidity) and food for benthic organisms and improving the water quality, and may be used for the restoration of the seabed [31]. If 1% of the suitable tropical coastlines were used for farming of bivalves they could supply the protein demands of over 700 million people, approx. 3.8 Mt of omega-3 [32].
Both the traditional lipid analysis and lipidomic analysis of the three tissues of GSM shed light on their biological function from their environmental conditions to the transfer of nutrients for biological function and replication, through to their potential health benefits. GSM obtain all their nutrients from their immediate environment and are responsive to environmental changes and stressors. Seasonal changes, spawning events, and environmental stressors will heavily influence tissues such as the digestive gland and gonad. In this study, the digestive gland has the highest concentration of triglyceride in its oil (TG 31 g/100 g oil), presumably due to the high lipid concentration in the diet and a high lipid concentration of the organ (4.1 mg/100 g).
Due to the high amount of lipids in the gonad, 57% of the total TG comes from the gonad fraction. This is important as it is the TG fraction that is extracted by the supercritical extraction process preferentially over the PL when no co-solvent is utilised. Therefore, the gonad fat and TG content of GSM are vital to the yield of oil for commercial nutraceutical producers.
The polar lipid classes are not differentiated through the TLC-FID analysis performed here. There are methods available to determine broad PL classes, but often involve multiple developments of the TLC rods and multiple analyses. From experience this multiple development approach can be quite variable and hard to achieve good repeatability on samples. Other methods such as LC-MS lipidomics shown in this study and NMR are better techniques to look at PL classes; however, both techniques have limitations.
The majority of the fatty acids in GSMs are PUFA with the omega-3 dominating (high omega-3/omega-6 ratio ~9–12). GSMs have been shown to be a good source of omega-3 LC-PUFA and are thought to obtain these important lipids directly from the microalgal source, although recent studies indicate that these invertebrates may have the capability to endogenously produce omega-3 LC PUFA. Interestingly the proportion of DHA in the mantle was higher (12 g/100 g FA) and EPA lower (20.6 g/100 g) than determined for the other organs. Traditional lipid analysis has been used to approximate diet through signature lipid comparisons. The EPA to DHA ratio is ~2 to 3, indicating greater diatom to flagellates in the GSM diet which is supported by a high 16:1/16:0 ratio [33]. This is higher in the gonad and digestive gland than in previous reports [12,14] and could be due to changes in storage or utilisation in the different organs, seasonal or spatial differences, or possible changes in diet.
This traditional analysis of GSM is in the same format as many other previous research [12,13,14] which makes comparisons between studies possible, however traditional analysis lacks the depth and resolution of lipidomic analysis. The lipidomic analysis shows higher DG and lyso-phosopholipids than occur in the other tissues. These observations and a lower abundance of phospholipids suggest that lipases are involved in the acyl chain cleavage of TG to DG and phospholipids to lyso-phospholipids. The acylcarnitines are also increased in the digestive gland, showing a need for energy production and the breakdown of the saturated and monounsaturated fatty acids. Acylcarnitines are predominantly involved in lipid degradation via the beta-oxidation pathway, where they transport acyl chains into the mitochondrial matrix for degradation. Acylcarnitines may be a stress biomarker in bivalves as they are up-regulated as they go into a stress response and move to anaerobic metabolism [34]. Lipidomic analysis may provide greater depth of metabolic activity and future studies could identify biomarkers for environmental and stress conditions.
The most abundant triglyceride in both the gonad and mantle was TG 56:10 (16:0_20:5_20:5) which has a significant negative correlation with the second most abundant lipid in the digestive gland which was TG 56:11 (16:1_20:5_20:5). This corresponds with significantly higher concentrations of DG 36:6 (16:1_20:5) and DG 40:10 (20:5_20:5) in the digestive gland. This inverse relationship is suggesting lipid remodeling mechanisms are involved in the removal and modification of dietary lipids rich in myristic (14:0) and palmitoleic (16:1) fatty acids. Elongation and desaturation of lipids can take place on phosphatidylcholine, where PC 36:5 (16:0_20:5) accounts for over 20% of the PC content and is most abundant in the digestive gland. Remodeling of lipids would account for the increases in palmitic (16:0), stearic (18:0), oleic (18:1), and DHA (22:6) species seen in DG and TG species in the mantle and gonad.
Lipidomics may provide key information regarding the diet and location or the capacity to edit, modify and selectively utilise/translocate particular lipid species. A higher percent of 14:0, 16:1, and 18:4 DG and TG species in the digestive gland could indicate a diet of either dinoflagellates or brown algae [35]. This would change seasonally and would also depend on the particular species found in the waters. The distribution and ratio of TG to phospholipid are in accordance with the organ’s function, namely that the mantle, which is involved in environmental sensing and provides an outer coat for the other organs, contains a high PL low TG ratio in the oil. The gonad which requires large energy stores for reproduction has a higher concentration of TG and the digestive gland contains microbial food sources rich in oil. Phospholipids are the predominant polar lipids and biologically are the main component of cell membranes. The phospholipid class and acyl chain structure determine its shape and functionality. PC and PE are usually the most abundant phospholipid in all organisms and the major structural components of biological membranes. The relative sum abundance of the results obtained in this study is consistent with these observations. PC is usually associated with the outer membrane of cells and involved in the remodeling, elongation, and desaturation of lipids, while PE has a more conical shape which is important for the more concave inner membrane. The overall phospholipid composition of GSM is consistent with the phospholipid composition of Mytilus edulis [36,37] having predominant PC and PE as the predominant classes with a high proportion of plasmalogen PE species and only small numbers of PI, PS, and PG species identified. A higher proportion of plasmalogen derived 18:0 FALD [11] is found in the mantle which is consistent with the higher concentrations of PE in the tissue and high concentrations of 18:0 plasmalogens in the PE class.
The phosphonate (carbon–phosphate bond) is uncommon in land-based organisms and is more prevalent in marine environments. Through genome sequencing the enzyme responsible for the biosynthesis of the C-P bond, phosphoenolpyruvate mutase pepM has been found in approximately 5% of the bacterial genomes and also identified in the sea snail (Lottia gigantean) and sea anemone (Nematostella vectensis) [38]. As filter feeders, GSM would likely sequester CAEP or its precursor, 2-aminoethyl phosphonate, from its diet or symbionts. The phosphonates are a group of compounds with potential bioactive properties and have been reported for their antibacterial, antiparasitic, and herbicidal properties [39]. While the bioactivities of some phosphono-peptides and other phosphonates are known, the biological properties of phosphonolipids are not well studied [40].
Cardiolipins are found in the inner mitochondrial membrane of all tissues, although they were originally discovered in heart tissue. They are essential for the formation and stability of Complex III and IV super complex of the mitochondrial electron transport chain [41] and play a major role in other mitochondrial functions such as ATP synthase and the proton gradient, cytochrome C release and apoptosis, and mitochondrial formation and dynamics [42]. In GSM the mantle has significantly more CL than the digestive gland and both these tissues are significantly higher than the gonad (Figure 1b.), indicating that both the digestive gland and mantle are involved in energy production, whereas the gonad is more likely involved in energy storage. The acyl chain composition lacks the diversity of other lipids and is usually quite specific. Tafazzin remodels cardiolipin in a coenzyme A independent fashion; enzyme studies with Drosophila tafazzin show a high specificity for 18:2 and that there is negligible arachidonyl activity [43]. Of particular interest is the observation that the GSM cardiolipins all contain DHA and EPA, with very few other lipid species present. As with Drosophila and mammalian cardiolipin, there are very few cardiolipin species, with the predominant species being CL 88:24 (22:6_22:6_22:6_22:6). In blue mussel, both CL 88:24 and 88:23 were reported [36], whereas both 18:2 and 18:3 containing species were most abundant in the mantle of GSM. Overall, the results are of particular interest to the evolution of mitochondria and their adaption to different environments (membrane structure is important and potentially related to enzyme activity) and are of further interest regarding the environment and nutrient uptake for marine organisms.
All bivalves including GSMs are a sustainable source of omega-3 LC-PUFA which are in high demand globally due to their numerous health benefits. While tuna oil contains mainly TG and krill oil is a mixture of TG and phospholipid, with the phospholipid fraction in the form of phosphatidylcholine, GSM oil has a mixture of both TG and phospholipid with a wider range of PL lipid classes and many more novel FA including NMIs, plasmalogens, and FALD. In terms of human diet and health benefits, LC-PUFA-containing phospholipids may have more health benefits through alternate uptake mechanisms and can cross the blood-brain barrier [44]. Plasmalogen PE species with EPA have been shown to efficiently increase brain omega-3 PUFA concentration [45]. The phospholipid PUFA species have been shown to be quickly taken up in the brain and other tissues where PUFA deficiency is occurring. However, DHA in the form of non-esterified fatty acids may be the most efficient form of DHA, being supplied by adipose through the storage of dietary TG’s [46]. Long-term dietary-derived DHA in the form of TG may lead to longer-term outcomes through the release of non-esterified fatty acids. A higher EPA to DHA ratio has also been associated with increased health outcomes through a decrease in C-reactive protein and decreases in inflammation [47]. The balanced distribution of phospholipid and TG may provide these fatty acids through multiple uptake mechanisms, with a higher ratio of EPA to DHA leading to greater health benefits.
The CAEP lipids are the third most abundant phospholipid in some mussel species [48]. CAEP d35:3 (d19:3_16:0) and CAEP d34:2 (d18:2:16:0) have also been identified as the major CAEP in blue mussels and may assist in the adaptation to thermal stress [28]. There is little clinical data or reports on the health benefits of these lipids. However, it has been demonstrated that CAEP is readily hydrolysed to ceramide and sphingoid bases in the mouse gut [49], which would give CAEPs similar bioactivity to other sphingolipids. Dietary sphingomyelin has been reported to augment acute and chronic inflammation, obesity, and gut inflammation [50]. This appears in contradiction to the fact that sphingosine-1-phosphate is known to be a pro-inflammatory compound and an increase in sphingolipids should therefore increase this pro-inflammatory response. Polyunsaturated sphingoid bases, that are derived from GSM and other marine CAEP, are unable to form sphingosine-1-phosphate and thus may be protective against ulcerative colitis and other inflammatory colon cancers [51].

5. Conclusions

This paper focused on a qualitative analysis of the different GSM tissues to provide new results on the distribution of a range of lipid classes in this unique and commercially harvested species, and to demonstrate the utility of lipidomics alongside traditional lipid profiles in such research and development. The traditional lipid profile is a concise data set and easily comparable to published results in lipid or broad nutritional studies. Conversely, lipidomic analysis in marine organisms is still in its infancy. Many standards are available but are more suited for the fatty acid composition of mammalian and plant-based lipids. Other lipids such as the CAEP have no available standards and are not present in lipidomic reference datasets, creating further challenges for studying lipidomics in marine systems. The lipidomic data set highlights the complexity of the lipidome and allows a more detailed examination of the roles of specific lipids in metabolism and function. This could assist studies aimed at understanding the molecules and physiological processes underpinning the bioactivity of GSM powders and oils (10), and could ultimately help breeding programmes to produce GSM strains with enhanced bioactivity.

Author Contributions

Conceptualisation, M.C.T., R.D.R. and M.R.M.; methodology, M.C.T. and M.R.M.; formal analysis, M.C.T. and M.R.M.; investigation, M.C.T. and M.R.M.; resources, M.C.T., R.D.R. and M.R.M.; data curation, M.C.T. and M.R.M.; writing—original draft preparation, M.C.T. and M.R.M.; writing—review and editing, M.C.T., R.D.R. and M.R.M.; visualisation, M.C.T.; supervision, M.R.M.; project administration, M.R.M.; funding acquisition, M.R.M. All authors have read and agreed to the published version of the manuscript.

Funding

This research was supported by the New Zealand High Value Nutrition National Science Challenge (Musseling up: High-value Greenshell™ mussel foods; UOAX1421) and the Science and Industry Endowment Fund (SIEF, National Agricultural and Environmental Sciences Precinct) which provided financial support to conduct the research, authorship, and/or publication of this article.

Institutional Review Board Statement

Not applicable.

Informed Consent Statement

Not applicable.

Data Availability Statement

Not applicable.

Acknowledgments

The authors gratefully acknowledge Andrew Stanley (Sanford Limited) for his support and guidance for this study. Ronan Griffin, Steven Lui, and Joshua Fitzgerald for assistance with preparation of extraction and fatty acid preparation; the Food Testing Laboratory at Cawthron Institute for technical assistance and sample analysis.

Conflicts of Interest

The funders had no role in the design of the study; in the collection, analyses, or interpretation of data; in the writing of the manuscript; or in the decision to publish the results. Rodney Roberts works for a company supplying GSM spat for cultivation which is owned by the GSM producer, Sanford Limited.

References

  1. Aquaculture New Zealand. Mussel Export Statisticss; January 2022 to December 2022. Available online: https://www.aqua.org.nz/exports (accessed on 20 March 2023).
  2. Mickleborough, T.D.; Sinex, J.A.; Platt, D.; Chapman, R.F.; Hirt, M. The effects PCSO-524(R), a patented marine oil lipid and omega-3 PUFA blend derived from the New Zealand green lipped mussel (Perna canaliculus), on indirect markers of muscle damage and inflammation after muscle damaging exercise in untrained men: A randomized, placebo controlled trial. J. Int. Soc. Sports Nutr. 2015, 12, 10. [Google Scholar] [CrossRef] [PubMed]
  3. Wood, L.G.; Hazlewood, L.C.; Foster, P.S.; Hansbro, P.M. Lyprinol reduces inflammation and improves lung function in a mouse model of allergic airways disease. Clin. Exp. Allergy 2010, 40, 1785–1793. [Google Scholar] [CrossRef] [PubMed]
  4. Cobb, C.S.; Ernst, E. Systematic review of a marine nutriceutical supplement in clinical trials for arthritis: The effectiveness of the New Zealand green-lipped mussel Perna canaliculus. Clin. Rheumatol. 2006, 25, 275–284. [Google Scholar] [CrossRef]
  5. Gibson, S.L.M.; Gibson, R.G. The treatment of arthritis with a lipid extract of Perna canaliculus: A randomized trial. Complement. Ther. Med. 1998, 6, 122–126. [Google Scholar] [CrossRef]
  6. Cho, S.H.; Jung, Y.B.; Seong, S.C.; Park, H.B.; Byun, K.Y.; Lee, D.C.; Song, E.K.; Son, J.H. Clinical efficacy and safety of Lyprinol, a patented extract from New Zealand green-lipped mussel (Perna Canaliculus) in patients with osteoarthritis of the hip and knee: A multicenter 2-month clinical trial. Eur. Ann. Allergy Clin. Immunol. 2003, 35, 212–216. [Google Scholar]
  7. Lau, C.S.; Chiu, P.K.Y.; Chu, E.M.Y.; Cheng, I.Y.W.; Tang, W.M.; Man, R.Y.K.; Halpern, G.M. Treatment of knee osteoarthritis with Lyprinol®, lipid extract of the green-lipped mussel—A double-blind placebo-controlled study. Prog. Nutr. 2004, 6, 17–31. [Google Scholar]
  8. Szechinski, J.; Zawadzki, M. Measurement of pain relief resulting from the administration of Perna canaliculus lipid complex PCSO-524™ as compared to fish oil for treating patients who suffer from osteoarthritis of knee and/or hip joints. Reumatologia 2011, 49, 244–252. [Google Scholar]
  9. Abshirini, M.; Coad, J.; Wolber, F.M.; von Hurst, P.; Miller, M.R.; Tian, H.S.; Kruger, M.C. Effects of Greenshell™ mussel intervention on biomarkers of cartilage metabolism, inflammatory markers and joint symptoms in overweight/obese postmenopausal women: A randomized, double-blind, and placebo-controlled trial. Front. Med. 2022, 9, 1063336. [Google Scholar] [CrossRef]
  10. Miller, M.R.; Abshirini, M.; Wolber, F.M.; Tuterangiwhiu, T.R.; Kruger, M.C. Greenshell Mussel Products: A Comprehensive Review of Sustainability, Traditional Use, and Efficacy. Sustainability 2023, 15, 3912. [Google Scholar] [CrossRef]
  11. Miller, M.R.; Perry, N.; Burgess, E.; Marshall, S. Regiospecific analyses of triacylglycerols of Hoki (Macruronus novaezelandiae) and Greenshell™ mussel (Perna canaliculus). J. Am. Oil Chem. Soc. 2011, 88, 509–515. [Google Scholar] [CrossRef]
  12. Miller, M.; Pearce, L.; Bettjeman, B. Detailed distribution of lipids in Greenshell™ mussel (Perna canaliculus). Nutrients 2014, 6, 1454–1474. [Google Scholar] [CrossRef] [PubMed]
  13. Miller, M.R.; Tian, H. Changes in proximate composition, lipid class and fatty acid profile in Greenshell™ mussels (Perna canaliculus) over an annual cycle. Aquac. Res. 2018, 49, 1153–1165. [Google Scholar] [CrossRef]
  14. Murphy, K.J.; Mooney, B.D.; Mann, N.J.; Nichols, P.D.; Sinclair, A.J. Lipid, FA, and sterol composition of New Zealand green lipped mussel (Perna canaliculus) and Tasmanian blue mussel (Mytilus edulis). Lipids 2002, 37, 587–595. [Google Scholar] [CrossRef] [PubMed]
  15. Kabeya, N.; Fonseca, M.M.; Ferrier, D.E.K.; Navarro, J.C.; Bay, L.K.; Francis, D.S.; Tocher, D.R.; Castro, L.F.C.; Monroig, Ó. Genes for de novo biosynthesis of omega-3 polyunsaturated fatty acids are widespread in animals. Sci. Adv. 2018, 4, eaar6849. [Google Scholar] [CrossRef]
  16. Laudicella, V.A.; Whitfield, P.D.; Carboni, S.; Doherty, M.K.; Hughes, A.D. Application of lipidomics in bivalve aquaculture, a review. Rev. Aquac. 2019, 12, 678–702. [Google Scholar] [CrossRef]
  17. Siriarchavatana, P.; Kruger, M.C.; Miller, M.R.; Tian, H.S.; Wolber, F.M. The Preventive Effects of Greenshell Mussel (Perna canaliculus) on Early-Stage Metabolic Osteoarthritis in Rats with Diet-Induced Obesity. Nutrients 2019, 11, 1601. [Google Scholar] [CrossRef]
  18. Eason, C.T.; Adams, S.L.; Puddick, J.; Romanazzi, D.; Miller, M.R.; King, N.; Johns, S.; Forbes-Blom, E.; Hessian, P.A.; Stamp, L.K.; et al. Greenshell Mussels: A Review of Veterinary Trials and Future Research Directions. Vet. Sci. 2018, 5, 36. [Google Scholar] [CrossRef]
  19. Ulbricht, C.; Chao, W.; Costa, D.; Nguyen, Y.; Seamon, E.; Weissner, W. An Evidence-Based Systematic Review of Green-Lipped Mussel (Perna canaliculus) by the Natural Standard Research Collaboration. J. Diet. Suppl. 2009, 6, 54–90. [Google Scholar] [CrossRef]
  20. Buchanan, S. Measuring reproductive condition in the Greenshell (TM) mussel Perna canaliculus. N. Z. J. Mar. Freshw. Res. 2001, 35, 859–870. [Google Scholar] [CrossRef]
  21. Folch, J.; Lees, M.; Sloane Stanley, G.H. A simple method for the isolation and purification of total lipides from animal tissues. J. Biol. Chem. 1957, 226, 497–509. [Google Scholar] [CrossRef]
  22. Rampler, E.; Criscuolo, A.; Zeller, M.; El Abiead, Y.; Schoeny, H.; Hermann, G.; Sokol, E.; Cook, K.; Peake, D.A.; Delanghe, B.; et al. A Novel Lipidomics Workflow for Improved Human Plasma Identification and Quantification Using RPLC-MSn Methods and Isotope Dilution Strategies. Anal. Chem. 2018, 90, 6494–6501. [Google Scholar] [CrossRef] [PubMed]
  23. R Core Team. R: A Language and Environment for Statistical Computing; R Foundation for Statistical Computing: Vienna, Austria, 2022. [Google Scholar]
  24. Wickham, H.; Averick, M.; Bryan, J.; Chang, W.; McGowan, L.D.A.; Francois, R.; Grolemund, G.; Hayes, A.; Henry, L.; Hester, J.; et al. Welcome to the Tidyverse. J. Open Source Softw. 2019, 4, 1686. [Google Scholar] [CrossRef]
  25. Dieterle, F.; Ross, A.; Schlotterbeck, G.; Senn, H. Probabilistic quotient normalization as robust method to account for dilution of complex biological mixtures. Application in H-1 NMR metabonomics. Anal. Chem. 2006, 78, 4281–4290. [Google Scholar] [CrossRef] [PubMed]
  26. Lee-Chang, K.J.; Taylor, M.C.; Drummond, G.; Mulder, R.J.; Mansour, M.P.; Brock, M.; Nichols, P.D. Docosahexaenoic Acid Is Naturally Concentrated at the sn-2 Position in Triacylglycerols of the Australian Thraustochytrid Aurantiochytrium sp. Strain TC 20. Mar. Drugs 2021, 19, 382. [Google Scholar] [CrossRef]
  27. Giesbertz, P.; Ecker, J.; Haag, A.; Spanier, B.; Daniel, H. An LC-MS/MS method to quantify acylcarnitine species including isomeric and odd-numbered forms in plasma and tissues. J. Lipid Res. 2015, 56, 2029–2039. [Google Scholar] [CrossRef]
  28. Facchini, L.; Losito, I.; Cataldi, T.R.I.; Palmisano, F. Ceramide lipids in alive and thermally stressed mussels: An investigation by hydrophilic interaction liquid chromatography-electrospray ionization Fourier transform mass spectrometry. J. Mass Spectrom. 2016, 51, 768–781. [Google Scholar] [CrossRef]
  29. Warmerdam, S.; Vickers, J.; Palairet, N. Life Cycle Assessment of New Zealand Mussels and Oysters; Thinkstep Ltd. for Aquaculture New Zealand & Ministry of Primary Industries: Wellington, New Zealand, 2021. [Google Scholar]
  30. Hernandez, A.B.; Brumbaugh, R.D.; Frederick, P.; Grizzle, R.; Luckenbach, M.W.; Peterson, C.H.; Angelini, C. Restoring the eastern oyster: How much progress has been made in 53 years? Front. Ecol. Environ. 2018, 16, 463–470. [Google Scholar] [CrossRef]
  31. Bridger, D.; Attrill, M.J.; Davies, B.F.R.; Holmes, L.A.; Cartwright, A.; Rees, S.E.; Cabre, L.M.; Sheehan, E.V. The restoration potential of offshore mussel farming on degraded seabed habitat. Aquac. Fish Fish. 2022, 2, 437–449. [Google Scholar] [CrossRef]
  32. Willer, D.F.; Aldridge, D.C. Sustainable bivalve farming can deliver food security in the tropics. Nat. Food 2020, 1, 384–388. [Google Scholar] [CrossRef]
  33. Jónasdóttir, S.H. Fatty acid profiles and production in marine phytoplankton. Mar. Drugs 2019, 17, 151. [Google Scholar] [CrossRef]
  34. Zhou, C.; Song, H.; Feng, J.; Hu, Z.; Yang, M.J.; Shi, P.; Li, Y.R.; Guo, Y.J.; Li, H.Z.; Zhang, T. Metabolomics and biochemical assays reveal the metabolic responses to hypo-salinity stress and osmoregulatory role of cAMP-PKA pathway in Mercenaria mercenaria. Comput. Struct. Biotechnol. J. 2022, 20, 4110–4121. [Google Scholar] [CrossRef] [PubMed]
  35. Zhukova, N.V. Fatty Acids of Marine Mollusks: Impact of Diet, Bacterial Symbiosis and Biosynthetic Potential. Biomolecules 2019, 9, 857. [Google Scholar] [CrossRef] [PubMed]
  36. Laudicella, V.A.; Beveridge, C.; Carboni, S.; Franco, S.C.; Doherty, M.K.; Long, N.; Mitchell, E.; Stanley, M.S.; Whitfield, P.D.; Hughes, A.D. Lipidomics analysis of juveniles’ blue mussels (Mytilus edulis L. 1758), a key economic and ecological species. PLoS ONE 2020, 15, e0223031. [Google Scholar] [CrossRef]
  37. Yin, F.W.; Zhou, D.Y.; Zhao, Q.; Liu, Z.Y.; Hu, X.P.; Liu, Y.F.; Song, L.; Zhou, X.; Qin, L.; Zhu, B.W.; et al. Identification of glycerophospholipid molecular species of mussel (Mytilus edulis) lipids by high-performance liquid chromatography-electrospray ionization-tandem mass spectrometry. Food Chem. 2016, 213, 344–351. [Google Scholar] [CrossRef]
  38. Yu, X.M.; Doroghazi, J.R.; Janga, S.C.; Zhang, J.K.; Circello, B.; Griffin, B.M.; Labeda, D.P.; Metcalf, W.W. Diversity and abundance of phosphonate biosynthetic genes in nature. Proc. Natl. Acad. Sci. USA 2013, 110, 20759–20764. [Google Scholar] [CrossRef]
  39. Metcalf, W.W.; van der Donk, W.A. Biosynthesis of Phosphonic and Phosphinic Acid Natural Products. Annu. Rev. Biochem. 2009, 78, 65–94. [Google Scholar] [CrossRef] [PubMed]
  40. Kafarski, P. Phosphonates: Their Natural Occurrence and Physiological Role. In Contemporary Topics about Phosphorus in Biology and Materials; David, G.C., Maja Dutour, S., Božana, Č., Helga Füredi, M., Eds.; IntechOpen: Rijeka, Croatia, 2019; pp. 1–19. [Google Scholar]
  41. Bazan, S.; Mileykovskaya, E.; Mallampalli, V.K.P.S.; Heacock, P.; Sparagna, G.C.; Dowhan, W. Cardiolipin-dependent Reconstitution of Respiratory Supercomplexes from Purified Saccharomyces cerevisiae Complexes III and IV. J. Biol. Chem. 2013, 288, 401–411. [Google Scholar] [CrossRef]
  42. Paradies, G.; Paradies, V.; Ruggiero, F.M.; Petrosillo, G. Role of Cardiolipin in Mitochondrial Function and Dynamics in Health and Disease: Molecular and Pharmacological Aspects. Cells 2019, 8, 728. [Google Scholar] [CrossRef]
  43. Xu, Y.; Malhotra, A.; Ren, M.D.; Schlame, M. The enzymatic function of tafazzin. J. Biol. Chem. 2006, 281, 39217–39224. [Google Scholar] [CrossRef]
  44. Ahmmed, M.K.; Ahmmed, F.; Tian, H.; Carne, A.; Bekhit, A.E. Marine omega-3 (n-3) phospholipids: A comprehensive review of their properties, sources, bioavailability, and relation to brain health. Compr. Rev. Food Sci. Food Saf. 2020, 19, 64–123. [Google Scholar] [CrossRef]
  45. Fu, S.S.; Wen, M.; Zhao, Y.C.; Shi, H.H.; Wang, Y.M.; Xue, C.H.; Wei, Z.H.; Zhang, T.T. Short-term supplementation of EPA-enriched ethanolamine plasmalogen increases the level of DHA in the brain and liver of n-3 PUFA deficient mice in early life after weaning. Food Funct. 2022, 13, 1906–1920. [Google Scholar] [CrossRef] [PubMed]
  46. Heath, R.J.; Wood, T.R. Why Have the Benefits of DHA Not Been Borne Out in the Treatment and Prevention of Alzheimer’s Disease? A Narrative Review Focused on DHA Metabolism and Adipose Tissue. Int. J. Mol. Sci. 2021, 22, 11826. [Google Scholar] [CrossRef] [PubMed]
  47. AbuMweis, S.; Abu Omran, D.; Al-Shami, I.; Jew, S. The ratio of eicosapentaenoic acid to docosahexaenoic acid as a modulator for the cardio-metabolic effects of omega-3 supplements: A meta-regression of randomized clinical trials. Complement. Ther. Med. 2021, 57, 102662. [Google Scholar] [CrossRef] [PubMed]
  48. Kariotoglou, D.M.; Mastronicolis, S.K. Phosphonolipids in the mussel Mytilus galloprovincialis. Z. Nat. C 1998, 53, 888–896. [Google Scholar] [CrossRef]
  49. Tomonaga, N.; Manabe, Y.; Sugawara, T. Digestion of Ceramide 2-Aminoethylphosphonate, a Sphingolipid from the Jumbo Flying Squid Dosidicus gigas, in Mice. Lipids 2017, 52, 353–362. [Google Scholar] [CrossRef] [PubMed]
  50. Norris, G.H.; Blesso, C.N. Dietary and Endogenous Sphingolipid Metabolism in Chronic Inflammation. Nutrients 2017, 9, 1180. [Google Scholar] [CrossRef]
  51. Suh, J.H.; Saba, J.D. Sphingosine-1-phosphate in inflammatory bowel disease and colitis-associated colon cancer: The fat’s in the fire. Transl. Cancer Res. 2015, 4, 469–483. [Google Scholar] [CrossRef]
Figure 1. Panel (a) Principal Component Analysis of identified lipids from GSM. Panel (b) plot of summed lipid class data. AcCa Acetyl Carnitine, CAEP ceramide aminoethyl phosphonate, Cer, Ceramide, CL Cardiolipin, DG diarylglycerol, LPC lyso phosphatidylcholine, LPE lyso phosphatidylethanolamine, LPG lyso phosphatidylglycerol, LPI. Digestive gland (red), gonad (blue), and mantle (green). Box plots show the median, first and third quartiles, minimum and maximum, different letters above indicate a significant (p < 0.05) difference to the other tissues within the same lipid class.
Sustainability 15 07586 g001
Figure 2. The top 25 most abundant triglyceride (TG) species in GSM tissues. Digestive gland (red), gonad (blue), and mantle (green). Lipid species names on the x-axis indicate the sum total of carbons in the acyl chains with the number of double bonds. The lipid species acyl chain composition is shown in brackets, the underscore is used to denote that the sn-position of each acyl chain is unknown. Box plots show the median, first and third quartiles, minimum and maximum, different letters above indicate a significant (p < 0.05) difference to the other tissues for each lipid species.
Sustainability 15 07586 g002
Figure 3. The lipid species distribution of diglyceride (DG), panel (a), and acylcarnitine (AcCa), panel (b). Both plots are expressed as the relative percentage of each lipid class. Only the top 15 most abundant DG species are shown. All of the AcCa species identified are shown. Digestive gland (red), gonad (blue), and mantle (green). Box plots show the median, first and third quartiles, minimum and maximum, different letters above indicate a significant (p < 0.05) difference to the other tissues for each lipid species.
Sustainability 15 07586 g003
Figure 4. Correlation plot of TG species, with a limited number of species included for visual purposes. Values in grey represent the overall correlation, coloured values represent the correlation within the tissue as Figure 2. Values from 0 to 0.16 have none to negligible correlation, 0.20 to 0.29 weak, 0.30 to 0.39 moderate, 0.40 to 0.69 strong, and values above 0.70 have a very strong correlation. Significance of the correlation shown with stars following each value; *** p < 0.001; **, p < 0.01; *, p < 0.05; ‘.’, p < 0.10. Negative values have a negative correlation coefficient. Charts on a diagonal depict the distribution of concentrations for each TG/DG species in each tissue.
Sustainability 15 07586 g004
Figure 5. The distribution of ceramide aminoethyl phosphonate (CAEP) species, panel (a) and ceramide (Cer) species, panel (b). Both plots are expressed as the relative percentage of each lipid class. Digestive gland (red), gonad (blue), and mantle (green). Box plots show the median, first and third quartiles, minimum and maximum, different letters above indicate a significant (p < 0.05) difference to the other tissues for each lipid species.
Sustainability 15 07586 g005
Figure 6. The distribution of phosphatidylcholine (PC) species with acyl bonds, panel (a), and PC species with ether bonds, panel (b). Both plots are expressed as the relative percent of the PC class. Digestive gland (red), gonad (blue), and mantle (green). Box plots show the median, first and third quartiles, minimum and maximum, different letters above indicate a significant (p < 0.05) difference to the other tissues for each lipid species.
Sustainability 15 07586 g006
Figure 7. The distribution of phosphatidylethanolamine (PE) species with acyl bonds, panel (a), and PE species with ether bonds, panel (b). Both plots are expressed as the relative percent of the PE class. Digestive gland (red), gonad (blue), and mantle (green). Box plots show the median, first and third quartiles, minimum and maximum, different letters above indicate a significant (p < 0.05) difference to the other tissues for each lipid species.
Sustainability 15 07586 g007
Figure 8. The distribution of phosphatidylserine (PS) species, panel (a); phosphatidylglycerol (PG), panel (b); phosphatidylinositol (PI), panel (c) and cardiolipin (CL) panel (d). For cardiolipins refer to the text for the acyl chain composition. Digestive gland (red), gonad (blue), and mantle (green). Box plots show the median, first and third quartiles, minimum and maximum, different letters above indicate a significant (p < 0.05) difference to the other tissues for each lipid species.
Sustainability 15 07586 g008
Table 1. Traditional analysis of the three organs of Greenshell mussel for proximate composition, lipid class, and fatty acid analysis.
Mantle Digestive GlandGonadMantle Digestive GlandGonad
Composition Whole tissueExtracted oil
Moisture (g/100 g of Organ)81.272.568.9NANANA
Lipid (g/100 g of Organ)1.64.24.8NANANA
Lipid (g/100 g of GSM)0.280.450.77NANANA
Proportion of organ in the Mussel 16.117.710.7 NANANA
Lipid class content mg/100 g of GSMg/100 g of oil
Hydrocarbon/nonpolar lipids1.91.92.10.70.40.3
Free Fatty Acids2.74.01.31.00.90.2
Triacylglycerols27.2138.7219.89.831.028.4
Sterols6.75.49.22.41.21.2
Polar lipids238.2297.3541.986.266.470.1
Fatty acid content (mg/100 g of GSM)mg/100g of GSM% Fatty acids
C14:0 myristic acid9.316.930.94.24.75.0
C15:0 pentadecanoic acid1.21.43.20.60.40.5
C16:0 palmitic acid32.649.498.714.713.816.0
C16:1 palmitoleic acid16.236.755.87.310.39.0
C16:2n4 hexadecadienoic acid1.34.24.90.61.20.8
C17:0 heptadecanoic acid1.51.84.00.70.50.6
C18:0 stearic acid8.713.622.73.93.83.7
C18:1n7 vaccenic acid6.09.519.52.72.73.2
C18:1n9c oleic acid2.64.96.81.21.41.1
C18:1t elaidic acid0.20.20.90.10.10.1
C18:2n6c linoleic acid3.84.99.31.71.41.5
C18:3n3 alpha linolenic acid (ALA)1.42.44.90.70.70.8
C18:3n6 gamma linolenic (GLA)0.30.61.30.10.20.2
C18:3n4 octadecatrienoic acid4.15.010.41.91.41.7
C18:4n3 stearidonic acid (SDA)3.99.116.31.82.52.6
C20:0 arachidic acid0.10.30.30.00.10.0
C20:1 gadoleic acid0.90.91.40.40.30.2
C20:3n3 cis-11, 14, 17-eicosatrienoic acid0.10.50.80.00.10.1
C20:3n6 cis-8, 11, 14-eicosatrienoic acid0.61.22.50.30.30.4
C20:4n3 eicosatetraenoic acid0.61.92.30.30.50.4
C20:4n6 arachidonic acid (AA)4.55.38.22.11.51.3
C20:5n3 eicosapentaenoic acid (EPA)45.594.9157.920.626.525.5
C22:5n3 docosapentaenoic acid (DPA)3.76.79.11.71.91.5
C22:6n3 docosahexaenoic acid (DHA)28.230.767.012.88.610.8
Fatty acid classes mg/100 g of GSM% Fatty acids
∑SFA53.683.7160.124.223.425.9
∑MUFA26.052.284.411.814.613.6
∑PUFA98.2167.3294.644.446.747.6
∑n-3 PUFA83.5146.1258.137.840.841.7
∑n-6 PUFA9.312.021.24.23.43.4
Other Fatty acids mg/100 g of GSMmg/100 g of GSM
16:0 FALD 0.60.60.90.30.20.2
18:0 FALD13.513.615.66.13.82.5
16:0 OH1.80.68.10.80.21.3
20:2 NMI 3.55.710.81.61.61.7
22:2 NMI4.24.87.41.91.31.2
Note: Left column describes the lipid content in totality (mg per 100 g of mussel) of the mussel and the right column describes the extracted oil (g per 100 g of oil). NA; not applicable. GSM = Greenshell Mussel (n = 9), SFA = Sum of Saturated fatty acids, MUFA = Sum of Monounsaturated fatty acids, PUFA = Sum of Polyunsaturated fatty acids, n-3 = omega-3, n-6 = omega-6, c, cis; FALD, fatty aldehydes; NMI, non-methylene interrupted; OH, Hydroxy fatty acids.
Disclaimer/Publisher’s Note: The statements, opinions and data contained in all publications are solely those of the individual author(s) and contributor(s) and not of MDPI and/or the editor(s). MDPI and/or the editor(s) disclaim responsibility for any injury to people or property resulting from any ideas, methods, instructions or products referred to in the content.

