Article

Does National Independent Innovation Demonstration Zone Construction Help Improve Urban Green Total Factor Productivity? A Policy Assessment from China

1
School of Business and Tourism Management, Yunnan University, Kunming 650500, China
2
School of Political Science and Public Administration, Henan Normal University, Xinxiang 453007, China
*
Author to whom correspondence should be addressed.
Sustainability 2023, 15(9), 7417; https://doi.org/10.3390/su15097417
Submission received: 24 March 2023 / Revised: 24 April 2023 / Accepted: 26 April 2023 / Published: 29 April 2023
(This article belongs to the Special Issue Sustainable and Innovative Green Economy)

Abstract

:
Taking the innovation policy pilot of the national independent innovation demonstration zone (NIIDZ) as a quasi-natural experiment, we select a set of data covering 283 cities in China from 2004 to 2016 to empirically test the impact and mechanism of NIIDZ on urban green total factor productivity (GTFP) by using a progressive difference-in-differences (DID) model. The research indicates that the NIIDZ policy pilot can effectively help promote the growth of urban GTFP; talent agglomeration and local fiscal expenditure on science and technology are important channels for the policy to promote urban GTFP. Various methods have proved the reliability of our research results. Further, affected by geographical location, resource endowment and population size, the pilot effects of the NIIDZ also demonstrate regional heterogeneity. Our study provides a useful supplement for innovation policy evaluation from both theoretical and empirical perspectives.

1. Introduction

With the intensification of resource constraints and the arrival of the stage of diminishing factor returns, the extensive development model of relying on the expansion of factor input scale to drive economic growth in China is no longer sustainable [1]. The long-term “GDP only” development goal has indirectly led to serious issues such as environmental pollution and carbon emissions. According to the environmental performance index (EPI) (2022) provided by both Yale and Columbia, China’s environmental performance index ranked 160th among 180 countries in 2022. In addition, nowadays, China is the world’s largest CO2 emissions emitter [2,3]. In response to this situation, the Chinese government has not only made a solemn commitment to the international community to reduce carbon emissions but also incorporated the construction of ecological civilization into the economic development goals and put forward the notions of “building a beautiful China” and “realizing the high-quality development”. Changing the mode of economic development and realizing the transformation of economic growth from pursuing quantity to improving quality and realizing green development is the only way out for China’s economic growth.
Total factor productivity (TFP) is widely adopted to measure economic growth efficiency [4], which is a typical economic quantity prioritization index. However, traditional TFP ignores energy input and undesirable output [5]. On the basis of TFP, the green total factor productivity (GTFP) brings resource consumption and environmental pollution into the factor analysis framework and calculates and modifies the total factor productivity under the constraints of resource and environment [6], which can better reflect the quality of economic growth. In this sense, improving GTFP reflects green development.
Although often disrupting established balances, innovation has always been a formidable engine for improving economic growth throughout history [7]. Numerous studies have proved that innovation exerts a positive effect on economic growth [8,9,10,11]. Nevertheless, the impact of innovation on green development may be two-sided. On the one hand, innovation helps to improve energy efficiency and thus promotes green economic growth; on the other hand, while increasing production capacity, innovation may produce a rebound effect on energy use, thus causing pollution [12,13]. In light of this, in China, the question of “whether innovation is conducive to green development” has become a research hotspot. Numerous studies have examined the correlation between innovation and GTFP in China and found that both basic innovation and application innovation have a driving effect on GTFP [14,15]. Technology innovation also plays an indispensable role in regional green development [16,17,18]. These studies provide a solid foundation for us to understand the role of innovation. However, the existing studies are all about the description and discussion of regional innovation capability and innovation degree, and few focus on evaluating the effect of government innovation policies.
In 2006, China released the strategy of “building an innovative country”, and at the 18th CPC National Congress in 2012, the implementation of an innovation-driven development strategy was also clearly proposed. Relying on innovation to promote China’s economic transformation has attracted significant attention from policymakers. Among a series of existing innovation policies, one of the most representative policies is to build the national independent innovation demonstration zone (NIIDZ) in many cities. The NIIDZ policy encourages NIIDZ cities to gain practical experience in technological innovation and in developing high-tech industries [19]. Similar to Silicon Valley in the United States and the Daedeok Science Town in South Korea, China’s NIIDZs may play a certain leading role in regional innovation [20]. In addition, it has been found by Liu et al. (2022) that the NIIDZ policy plays a positive role in China’s haze pollution control. However, there is no research investigating the green development effect of the NIIDZ policy.
In view of this, this study attempts to evaluate the policy effect of China’s NIIDZ innovation-driven policy, explore its impact on urban GTFP and explore its underlying impact mechanism. We regard the pilot of the NIIDZ policy as a quasi-natural experiment and select the sample data of 283 cities in China from 2004 to 2016 to empirically test the policy effect by adopting the progressive difference-in-differences (DID) method. We make the following contributions: first, unlike traditional causal identification methods for evaluating innovation’s green effects, this study takes the innovation policy pilot of NIIDZs as a quasi-natural experiment, which can effectively overcome the endogenous problems caused by traditional estimation methods [21,22]; second, from the perspective of talent factor agglomeration and fiscal support for science and technology, our research deeply reveals the influential mechanisms through which the innovation pilot help promote urban GTFP, which is a beneficial supplement to the existing action mechanisms in the evaluation of innovation policy effects [19,23]; and third, it examines the heterogeneity of the policy pilot effects in cities with different geographical locations, population scales and resource endowments, which can deepen the research on the differences in policy effectiveness [19]. Our study provides a new perspective on the economic impact assessment of NIIDZs.
The rest of this study is arranged as follows. Section 2 is a brief review of the literature. Section 3 provides the policy background and theoretical analysis framework. Section 4 provides the data and methodology. Section 5 reports the benchmark empirical results. Section 6 analyzes the influence mechanism and heterogeneity discussion, and Section 7 is our conclusion.

2. Literature Review

Relevant previous studies mainly focused on three aspects: the measurement of GTFP; the impact of innovation on urban GTFP; and the economic and environmental effects of the construction of NIIDZs in China.
In terms of the measurement of GTFP, it still follows the TFP calculation framework. The calculation methods of TFP mainly include parametric and nonparametric estimation. Representative parameter estimation methods include the Solow residual value method and the stochastic frontier analysis (SFA) method. According to the Solow residual value method, the growth of total factor productivity is approximately equal to the residual value after deducting the growth rate of each input factor from the output growth rate [24,25]. Numerous articles have adopted this method to measure TFP [26,27]. The SFA method is another parametric estimation method, which is used to estimate the TFP under technically inefficient conditions [24]. These two methods both require a specific production function; thus, it is difficult to keep the estimation results consistent. In addition to the parametric estimation, the nonparametric estimation represented by data envelopment analysis (DEA) is broadly adopted by scholars to measure TFP [28,29,30,31]. In the use process of DEA, the calculation of TFP can be expanded to GTFP by taking environmental factors into account in the input and output. Some scholars introduce pollution emissions as the input factors [32], and others adopt the “directional distance function (DDF)” by [33] to include pollution as the unexpected output in the DEA efficiency; meanwhile, the Malmquist–Luenberger (ML) index is used by scholars for measuring environmental productivity [34,35]. To overcome some defects of traditional DDF, based on the slack variables’ measurement [36], some studies introduced the slack-based model (SBM), which is a non-radial, non-angle model. Further, to overcome the limitations of the ML index, [37] proposes the global Malmquist–Luenberger (GML) productivity index, which can decompose GTFP into efficiency and technology change. SBM-DEA combined with the GML index has become a popular method to measure GTFP by scholars [38,39].
In terms of the impact of innovation on urban GTFP, there is a consensus that technological innovation is an important guarantee for achieving the coordination of economic development and environmental protection [30]. Whether technological innovation or green technological innovation can help promote urban GTFP by improving resource utilization efficiency, promoting regional industrial structure upgrades, environmental regulations, etc. [24,40], is unclear. This promotion effect in China may be linear or nonlinear [41], and this effect may present negatively or not significantly due to regional resource endowment, regional location, the regional economic development level and other factors [17,42,43]. Additionally, the promotion effect of innovation on urban GTFP is usually characterized by spatial spillover [17,44]. In the measuring method of regional technology innovation, patent applications are always adopted in previous studies [45,46]. In some literature, R&D expenditure or R&D institutions are used to measure innovation levels [47,48]. Apparently, the measurement of regional innovation focuses on innovation capability, but few studies focus on the effect evaluation of regional innovation policies.
In terms of the evaluation of the effect of China’s NIIDZ pilot policy, previous research mainly pays attention to the effect of NIIDZs on regional innovation ability [49], regional economic growth [20] and regional land use efficiency [50] and the significance of NIIDZ on haze control [19] and air pollution [51]. However, there is still a lack of research on the influence of the NIIDZ pilot on China’s green economic development from a quantitative perspective.
After a systematic review of relevant studies, it can be found that there is still a lack of evaluation of the effect of China’s NIIDZ innovation-driven policy on green development. In view of this, this study aims to perform a systematic analysis of the NIIDZ policy from both theoretical and empirical aspects to fill the gap in research.

3. Policy Background and Theoretical Analysis

3.1. Policy Introduction

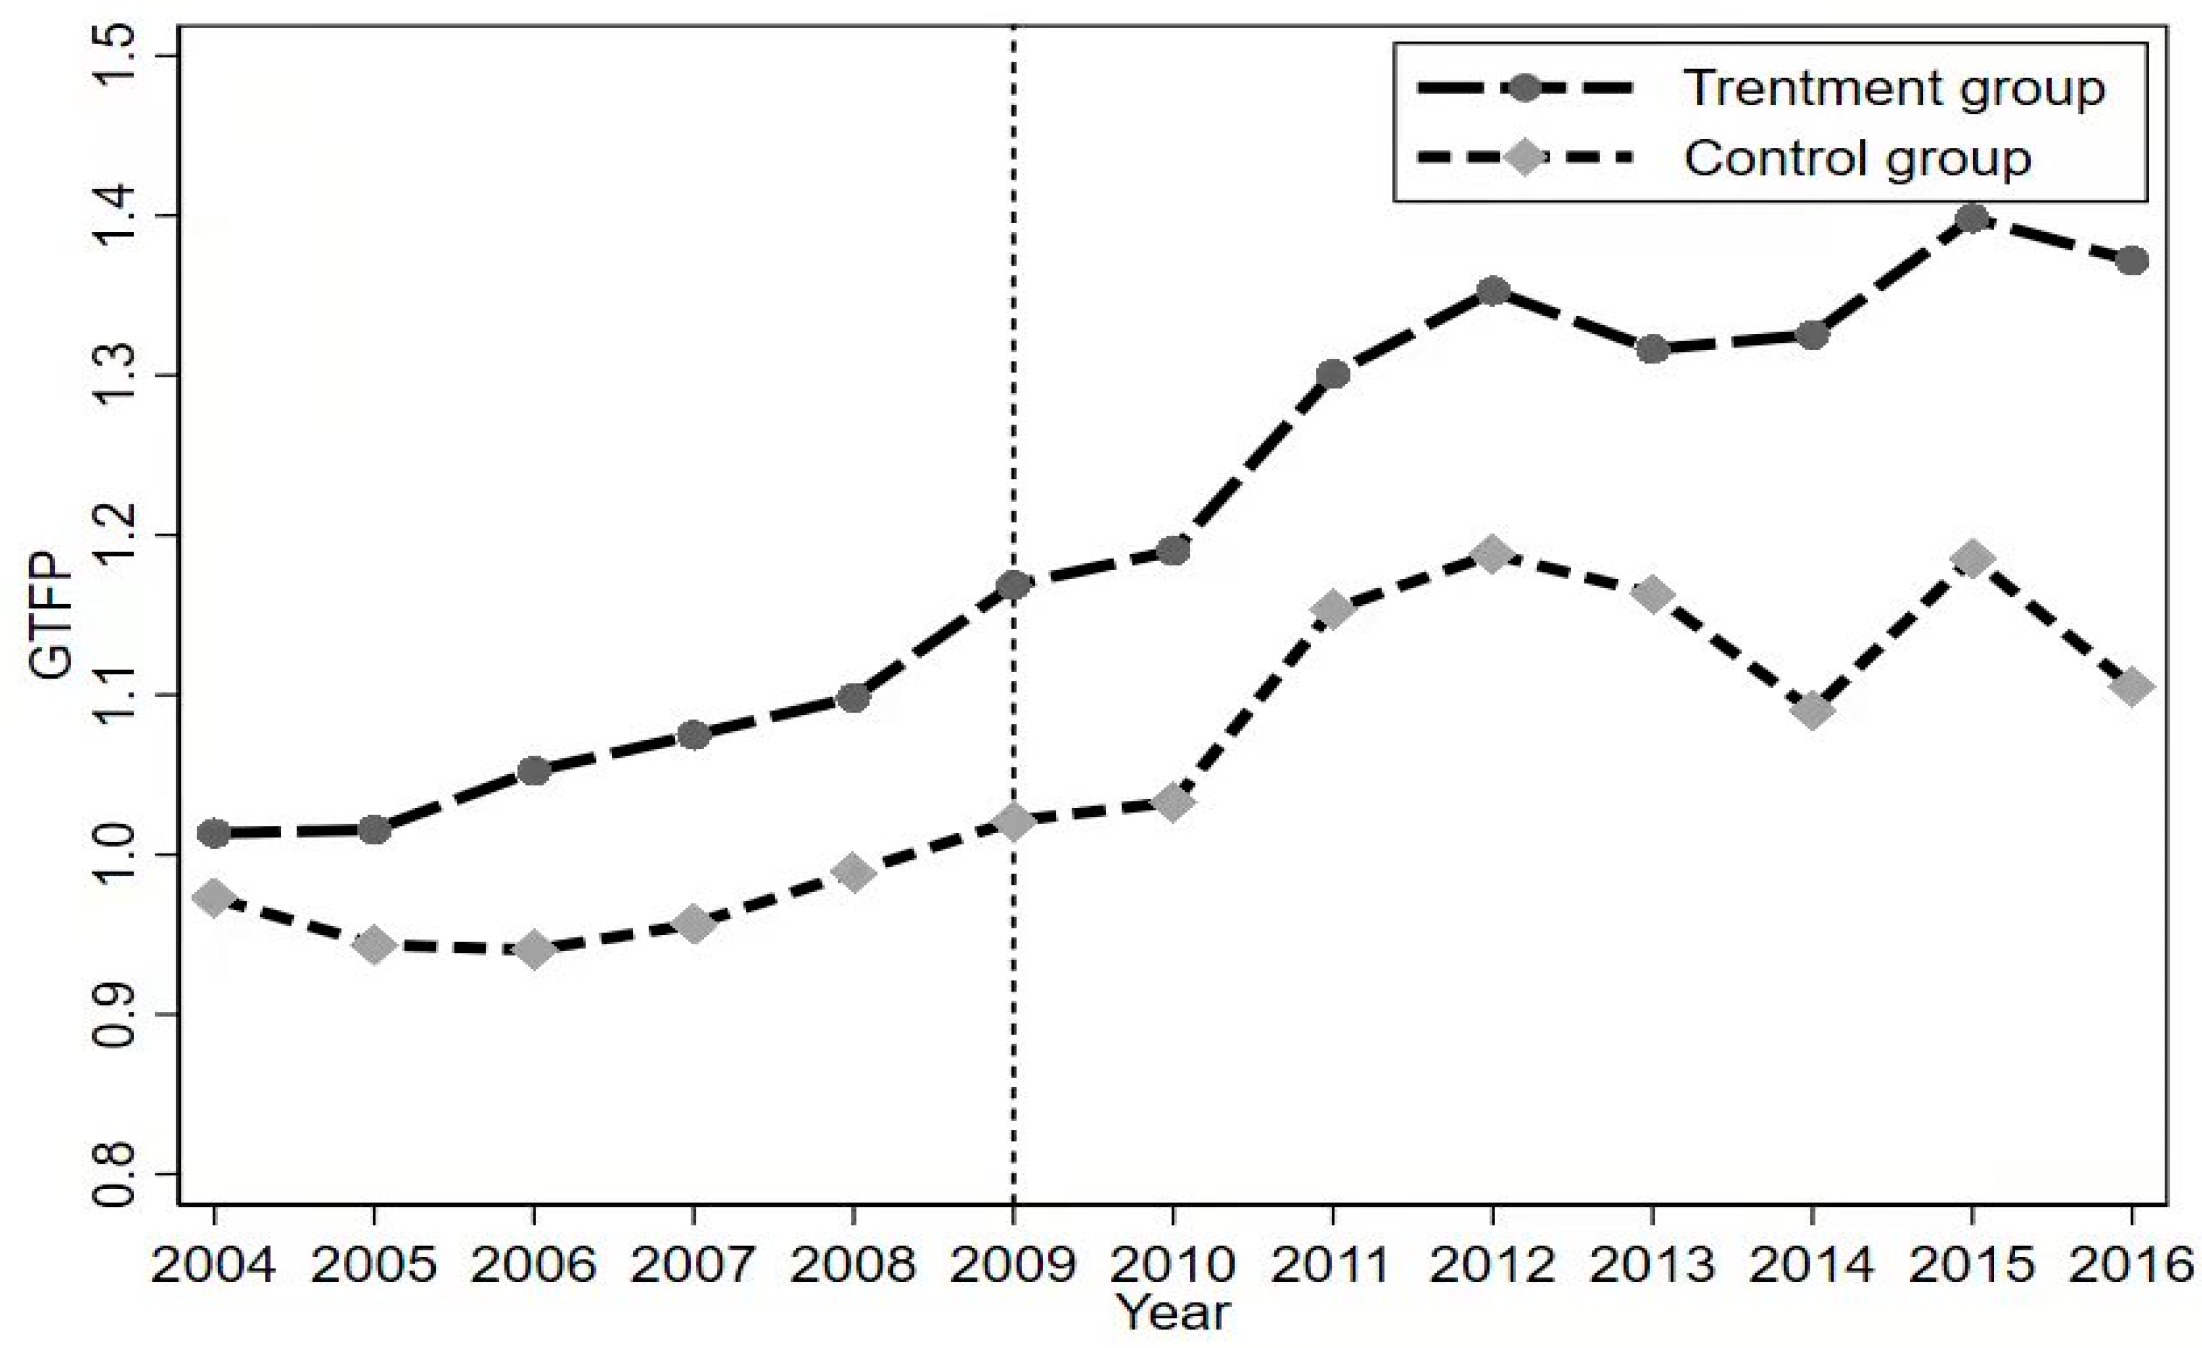
In March 2009, with the approval of the State Council, the first NIIDZ “ZhongGuanCun NIIDZ” was established. The “12th Five Year Plan for Science and Technology Development” and the “Opinions on Deepening the Reform of the Scientific and Technological System and Accelerating the Construction of the National Innovation System”, which were issued by the state in 2011 and 2012, respectively, all require greater efforts to build NIIDZs. Later, at the executive meeting of the State Council in 2014, Premier Li proposed that the pilot policy of ZhongGuanCun should be promoted on a larger scale and the construction of NIIDZ should be accelerated. The State Council clearly pointed out in Document No. 7 issued in 2020 that they wish to encourage cities to integrate the resources of national high-tech zones based on local conditions, build NIIDZs and explore new paths for innovation-driven development at a higher level. In response to the call of the central government and to explore new models and new paths of innovation, cities have actively established NIIDZ pilots and issued a series of corresponding policies in these pilots.
As of June 2022, there are 23 NIIDZs in China, covering more than 60 cities. In terms of its main functions, the NIIDZ provides various types of business entities with tax incentives, equity incentives, financial innovation and other pilot work. From the perspective of the geographical distribution of NIIDZs, it almost involves the three major economic belts in China. In terms of quantity, the number of NIIDZs in eastern regions is greater than that in central and western regions. In this study, due to the data availability, we select data from 283 prefecture-level cities in China from 2004 to 2016 as the research sample. Among our sample, 42 cities are NIIDZ pilot cities, and the remaining are non-pilot cities.

3.2. Theoretical Analysis

The construction of the NIIDZ aims to guide local regions to carry out innovation and entrepreneurship activities and provide various entities with the policies, environment and financial support needed for innovation. Then, will the construction of NIIDZs affect GTFP? Based on the theoretical basis of existing research and the policy background of the NIIDZ construction, this study believes that the NIIDZ pilot policy will affect GTFP through many channels. On the one hand, through the implementation of pilot policies covering finance, taxation and development planning, the NIIDZ policy pilot promotes the rational allocation of innovative elements such as labor, capital and land, effectively empowers local economic growth and reduces the emissions of pollutants through economies of scale, which is conducive to driving the growth of local GTFP; on the other hand, through the improvement of infrastructure construction, NIIDZ provides a loose and nice innovation environment for enterprises, universities and research and development institutions, thus promoting the R&D of green technologies and the improvement of production capacity and contributing to the increase in urban GTFP. Based on this, we formulate the first research hypothesis:
Hypothesis 1. 
The pilot policy of NIIDZ is conducive to improving urban GTFP.
In addition to the abovementioned direct impact, there are indirect effects of the NIIDZ pilot policy on urban GTFP, and we discuss it from two aspects of talent gathering and fiscal support.
First, the improvement of GTFP is inseparable from talent gathering. According to the absorptive capacity theory [52], the innovation output depends not only on the amount of innovation input but also on the ability to identify, absorb and apply new knowledge by using internal prior knowledge. It is found that the shortage of human capital in the whole region will lead to the low ability of this region to learn and internalize new knowledge, thus hindering the development of innovative activities and economic growth [53]. It is apparent that the agglomeration of talent is conducive to the promotion of knowledge absorptive capacity, thus helping to turn innovation into productivity and green technology into pollution reduction ability, which can help improve regional GTFP. In addition to absorptive capacity, talent agglomeration is beneficial to the spillover of knowledge [54]. When innovative talent gathers in a limited area to a certain scale, knowledge spillovers can be generated through knowledge sharing, project cooperation, academic exchanges, etc., thus promoting the innovation ability of surrounding areas, contributing to the promotion of green production technology and improving the GTFP. Through sorting out the documents related to the construction of NIIDZs, it can be found that one of the tasks of NIIDZs is to attract innovative talent. Through the introduction of a series of talent introduction policies, the NIIDZ absorbs a large number of overseas high-level talent, professional and technical talent, business management talent, etc., gathered here and provides policy support for the development of universities and scientific research institutions, which is conducive to the integration of industry and research. Therefore, it is reasonable to believe that NIIDZs can help improve urban GTFP by talent agglomeration.
Second, fiscal expenditure on science and technology is another important channel for the construction of NIIDZs to promote urban GTFP. As an important aspect of fiscal policy, fiscal expenditure on science and technology is an important factor driving green technology innovation [55]. From the standpoint of enterprises and R & D institutions, the government’s fiscal subsidies, R&D expenditure plus deduction and other policies can effectively reduce the cost of green innovation of R & D entities, improve the “risk-benefit” boundary of innovation activities and guide enterprises and R & D institutions to increase green innovation input, which is conducive to increasing green economic output and improving GTFP [56]. At the same time, the government’s fiscal support for science and technology for enterprises helps to form an “inductive effect” in the whole society, attracts private capital into the field of green science and technology innovation and helps to promote the optimal allocation of capital factor, thus helping the R & D of clean technology and improving the regional GTFP. The biggest policy preference for the construction of the NIIDZ is that it provides greater fiscal support for enterprises and research and development institutions in the demonstration zone. The reason local governments increase fiscal support for science and technology in NIIDZs is not only from the guidance of national policies but also from the competition between local governments. In order to achieve innovation-driven green economic growth, under the existing mechanism of official tenure, local governments will choose to increase fiscal expenditure on science and technology. To sum up, the NIIDZ pilot policy can promote urban GTFP by increasing fiscal expenditure on science and technology.
According to the above analysis, we propose the second hypothesis:
Hypothesis 2. 
The pilot policy of NIIDZ can help improve urban GTFP by talent agglomeration and increasing fiscal expenditure on science and technology.

4. Econometric Model, Variable and Data

4.1. Regression Specifications

During our sample period of 2004–2016, there were 21 NIIDZs distributed in more than 40 cities, providing a quasi-natural experiment for our study. Specifically, we divided 283 cities into two groups: 42 cities covering the NIIDZ as the experimental group and other 241 cities as the control group. At the same time, because the establishment of the NIIDZ is approved in batches, and considering that the traditional DID model can only evaluate the effect of the policy pilot at a single time point, a progressive DID model is adopted to evaluate the effect of the NIIDZ pilot policy on urban GTFP. The regression specification is as follows:
G T F P i t = α 0 + α 1 T r e a t e d i t + φ X i t + μ i + v t + ε i t
where GTFPit represents the dependent variable; Treatedit is the core independent variable in this study, indicating the policy pilot dummy variable. Xit is a set of control variables; μ i and v t imply the regional fixed effect and time fixed effect, respectively. ε i t is the standard error term.
Furthermore, to verify the possible action mechanisms of talent agglomeration and fiscal expenditure on science and technology, referring to the intermediary effect model [57], Equations (2) and (3) are constructed for inspection:
I n t e r i t = β 0 + β 1 T r e a t e d i t + φ X i t + μ i + v t + ε i t
G T F P i t = γ 0 + γ 1 T r e a t e d i t + γ 2 I n t e r i t + φ X i t + μ i + v t + ε i t
where Interit represents the intermediary variable and other variables are the same as those in Equation (1). If the estimated coefficient of Treatedit in Equation (2) and the coefficient of Interit in Equation (3) are significant, Interit is the intermediary path of the NIIDZ pilot policy to promote the urban GTFP.

4.2. Variables

The explained variable in this study is the urban GTFP. According to the study by Tone and Tsutsui [58], we adopt the super-efficiency EBM model based on non-guidance, undesirable output and variable return to scale, combined with the GML (global Malmquist–Luenberger) index to calculate urban GTFP. The index system of GTFP is shown in Table 1.
As for the core explanatory variable Treatedit, Treatedit = pilot × time. The pilot equals 1 if there is an NIIDZ constructed in the city and 0 otherwise. Likewise, during the year of the NIIDZ construction and all subsequent years, the variable time shall be attributed a value of 1 and assume a value of 0 for all other time periods. The mediating variable includes talent agglomeration (AGG) and fiscal expenditure on science and technology (Exp). AGG is measured by the location entropy index of people engaged in finance, computer services and software, scientific research, education, culture, sports and entertainment and leasing and commercial services. Exp represents the ratio of fiscal expenditure on science and technology to local GDP.
Considering other influential factors, referring to previous studies [59,60,61], we set the financial development level (Fin), human capital (Hum), environmental regulation (Er), city size (Scale), resource endowment (Res), urbanization level (Urb), economic development level (Dev) and the openness degree (Open) as control variables. All the variable definitions are presented in Table 2.

4.3. The Sample Selection and Data Description

Due to the data availability, this study selects the panel data of 3679 observations from 283 prefecture-level cities in China from 2004 to 2016 as the research sample. The data are mainly from China Urban Statistical Yearbook (2005–2017), China Statistical Yearbook (2004–2017) and the China research data service platform (CNDRS). The descriptive statistical results of each variable are shown in Table 3.

5. Empirical Results Analysis

5.1. Benchmark Regression Results

Table 4 reports the baseline regression results of Equation (1). First, without adding control variables, column (1) shows that the estimated coefficient of the policy variable (Treated) is 0.396, which is significant at the significance level of 1%; second, column (2) shows that the regression coefficient of Treated is 0.131, which is significant at the 1% level when the control variables are not added but the time and regional effects are controlled; finally, column (3) implies that after controlling other relevant influencing factors, the estimated coefficient of Treated is 0.126, with a significance level of 1%, indicating that the innovation policy pilot of the NIIDZ can significantly promote the growth of urban GTFP, contributing to the green development of the urban economy.
When accounting for control variables, the estimated coefficients of Hum, Urb and Dev demonstrate a significant positive relationship with urban green economic growth. This suggests that a greater proportion of the labor force receiving higher education, higher urbanization rates and higher per capita GDP all contribute positively to urban green economic growth in a given region. In addition, the estimated coefficient of Er is positive and meets the significance level of 1%, indicating that environmental regulation is one of the important means for a local government to help improve urban GTFP. In addition, Fin, Res and Open all exert negative impacts on urban GTFP. Possible reasons include the following: When more financial loans flow into high-energy-consuming industries, it can bring economic growth but also cause environmental pollution, which is not conducive to the development of a green economy, also emphasizing the importance of developing green finance. In addition, the increase in the resource-based industries’ output will lead to serious pollution, which is not conducive to urban GTFP. The expansion of foreign direct investment is not conducive to the growth of urban GTFP, indicating that there may exist a “pollution haven hypothesis” effect in China.

5.2. Robustness Examination

5.2.1. Parallel Trend Test

A vital premise for the use of a DID method is that there is a common change trend in the samples of the experimental group and the control group before the event. This study makes a common trend test on the growth changes of urban GTFP of the experimental group and the control group before and after the implementation of NIIDZ. Results are shown in Figure 1 and Figure 2.
From Figure 2, it is found that there is no significant difference between the estimated coefficient of Treated and 0 from periods four to two before the policy was implemented, implying that the parallel trend hypothesis is valid. In the seven periods after implementing the NIIDZ pilot policy, the coefficient of Treated in each period is significantly greater than 0, indicating that the NIIDZ pilot policy has a significant positive impact on the urban GTFP. Furthermore, it can be observed that the impact of this promotion exhibits a progressive upward trend, albeit with occasional fluctuations over time. In the year before the implementation of the policy, the estimation coefficient of Treated is also significantly positive, indicating that the implementation effect of this policy has a pre-effect, which may be the market reaction caused by the government releasing the signal of policy implementation in advance.

5.2.2. Other Robustness Test

To further examine the reliability of our results, we conduct the following robustness test.
First, to ensure sample homogeneity, we have redefined the sample range by excluding municipalities and sub-provincial cities, which exhibit distinct differences in administrative level and economic scale compared to other prefecture-level cities in China. As municipalities directly under the central government and sub-provincial cities possess a solid economic foundation and receive more policy support, removing them from the sample range helps to mitigate the risk of sample selection errors. The estimation results, presented in column (1) of Table 5, reveal an estimated coefficient of 0.076 for Treated with a 5% significance level, suggesting that the positive impact of the NIIDZ pilot policy on urban GTFP is credible.
Second, to address self-selection bias, we employ a combination of propensity score matching and the difference-in-differences (PSM-DID) method. The propensity score is calculated using logit regression, and the experimental and control groups are matched using the 1:1 nearest neighbor method to obtain the regression samples. The DID method is then applied to identify the causal relationship. The results in Column (2) of Table 5 indicate that the estimated coefficient of Treated is 0.121 with a significance level of 5%. This finding not only suggests that the pilot policy of NIIDZ had a positive impact on urban GTFP but also demonstrates the effectiveness of the matching method in reducing sample selection bias.
Third, the proxy variable of the dependent variable GTFP is re-estimated using the slack-based (SBM) method. In the benchmark regression, GTFP is measured by the EBM-DEA model. To make up for the shortcomings of the traditional DEA slack variable calculations and its non-proportional assessments, the SBM model is more appropriate. After re-estimating the dependent variable, we re-estimated Equation (1), and the regression results are shown in column (3) of Table 5. It can be seen that the promotion effect of Treated on urban GTFP is still significant.
Fourth, the traditional DID method is adopted to re-estimate this causal effect. Taking 2009 as the policy implementation year, we re-set the control group and experimental group. All samples of cities whose NIIDZ was set up later than 2009 are deleted. Treated0 indicates the policy variable, and the estimated coefficient of Treated0 is reported in column (4) of Table 5. The results show that the estimated coefficient of Treated0 is still positive at the 1% significance level, which is consistent with the previous results.
Finally, a placebo test is conducted to help eliminate the impact of unobserved factors. We randomly select the experimental group during pilot years as a research sample and repeat this process 500 times. Figure 3 shows that the estimated values of the coefficients of Treated in the random process are mostly distributed around zero. The estimated coefficient obtained through actual policy assessment is represented by the red vertical dashed line. It is evident that the simulation results based on counterfactuals differ significantly from the actual results. Therefore, it is reasonable to believe that the previous research results are not random but highly reliable.
Our benchmark regression results and the robustness test all verify that Hypothesis 1 is supported.

6. Mechanism Analysis and Heterogeneity Discussion

6.1. Influential Mechanism Analysis

Theoretical analysis suggests that talent agglomeration and fiscal expenditure on science and technology may be two positive action mechanisms for NIIDZ constructions to affect urban GTFP. According to Equations (2) and (3), we performed the empirical test, and the mediating effect estimation results are displayed in Table 6. The estimated coefficient values of Treated in columns (1) and (3) are positive at the 1% significance level, indicating that after controlling for other relevant factors, the construction of NIIDZ effectively promotes talent agglomeration and increases local government expenditure on science and technology. Columns (2) and (4) imply that talent agglomeration and local fiscal expenditure on science and technology significantly promote the improvement of urban GTFP. Therefore, talent agglomeration and the increase in local fiscal expenditure on science and technology are two effective action mechanisms for the NIIDZ pilot policy to promote the urban GTFP. In addition, judging from the estimated coefficient, the mediating effect of AGG and Exp accounts for about 6.95% of the total effect and 6.07% of the total effect, respectively. This indicates that both AGG and Exp have a partial mediating effect, and the NIIDZ pilot policy can also improve the urban GTFP through other indirect mechanisms.
The results above show that Hypotheses 2 is supported.

6.2. Heterogeneity Discussion

The previous analysis shows that the construction of NIIDZs can significantly promote the level of urban GTFP. For cities with different characteristics, does the policy effect still exist? If the answer is yes, is there any difference? In this section, we further explore the impact heterogeneity of the NIIDZ pilot policy on urban GTFP.
Firstly, considering the location difference of cities, we divide cities into eastern cities and central and western cities. Compared with the central and western regions, the economic development level of cities in eastern China is relatively developed. Secondly, we have categorized cities into two groups based on their population size: large cities and small- to medium-sized cities. Specifically, cities with a population of over 5 million are classified as large cities. Thirdly, according to resource endowment, cities are divided into resource-based and non-resource-based. Estimation results are shown in Table 7.
From column (1) and column (2) in Table 7, we can find that compared with the eastern regions, the pilot effect of the NIIDZ is more significant in cities located in central and western regions. A possible reason is that compared with the eastern cities, the overall innovation capacity of the central and western regions of China is relatively weak. Under the dual-track resource allocation model of government and market, the innovation-driven strategy represented by the NIIDZ construction is more conducive to the effective allocation of innovation resources by the central and western governments, and NIIDZ can play a better role in providing timely assistance, thus better promoting the urban GTFP.
Estimation results of column (3) and column (4) show that the promotion effect of the NIIDZ pilot policy on GTFP is only significant in large cities. The possible reasons are that on the one hand, those cities with a large development scale have a stronger talent-gathering ability, which is more conducive to promoting urban green technology innovation and improving GTFP by virtue of their platform advantages and scale advantages of economic development. On the other hand, larger cities often have strong local fiscal strength, which can provide more fiscal support for science and technology innovation, indirectly promoting the improvement of urban GTFP.
Column (5) and column (6) report the impact heterogeneity in non-resource-based cities and resource-based cities. Compared with resource-based cities, the impact of NIIDZ construction on urban GTFP in non-resource-based cities is more significant. A reasonable explanation may lie in that for resource-based cities, innovation-driven strategies make greater marginal contributions to pollution reduction and green economy development; thus, the NIIDZ pilot policy’s contribution to urban GTFP is more significant.

7. Conclusions

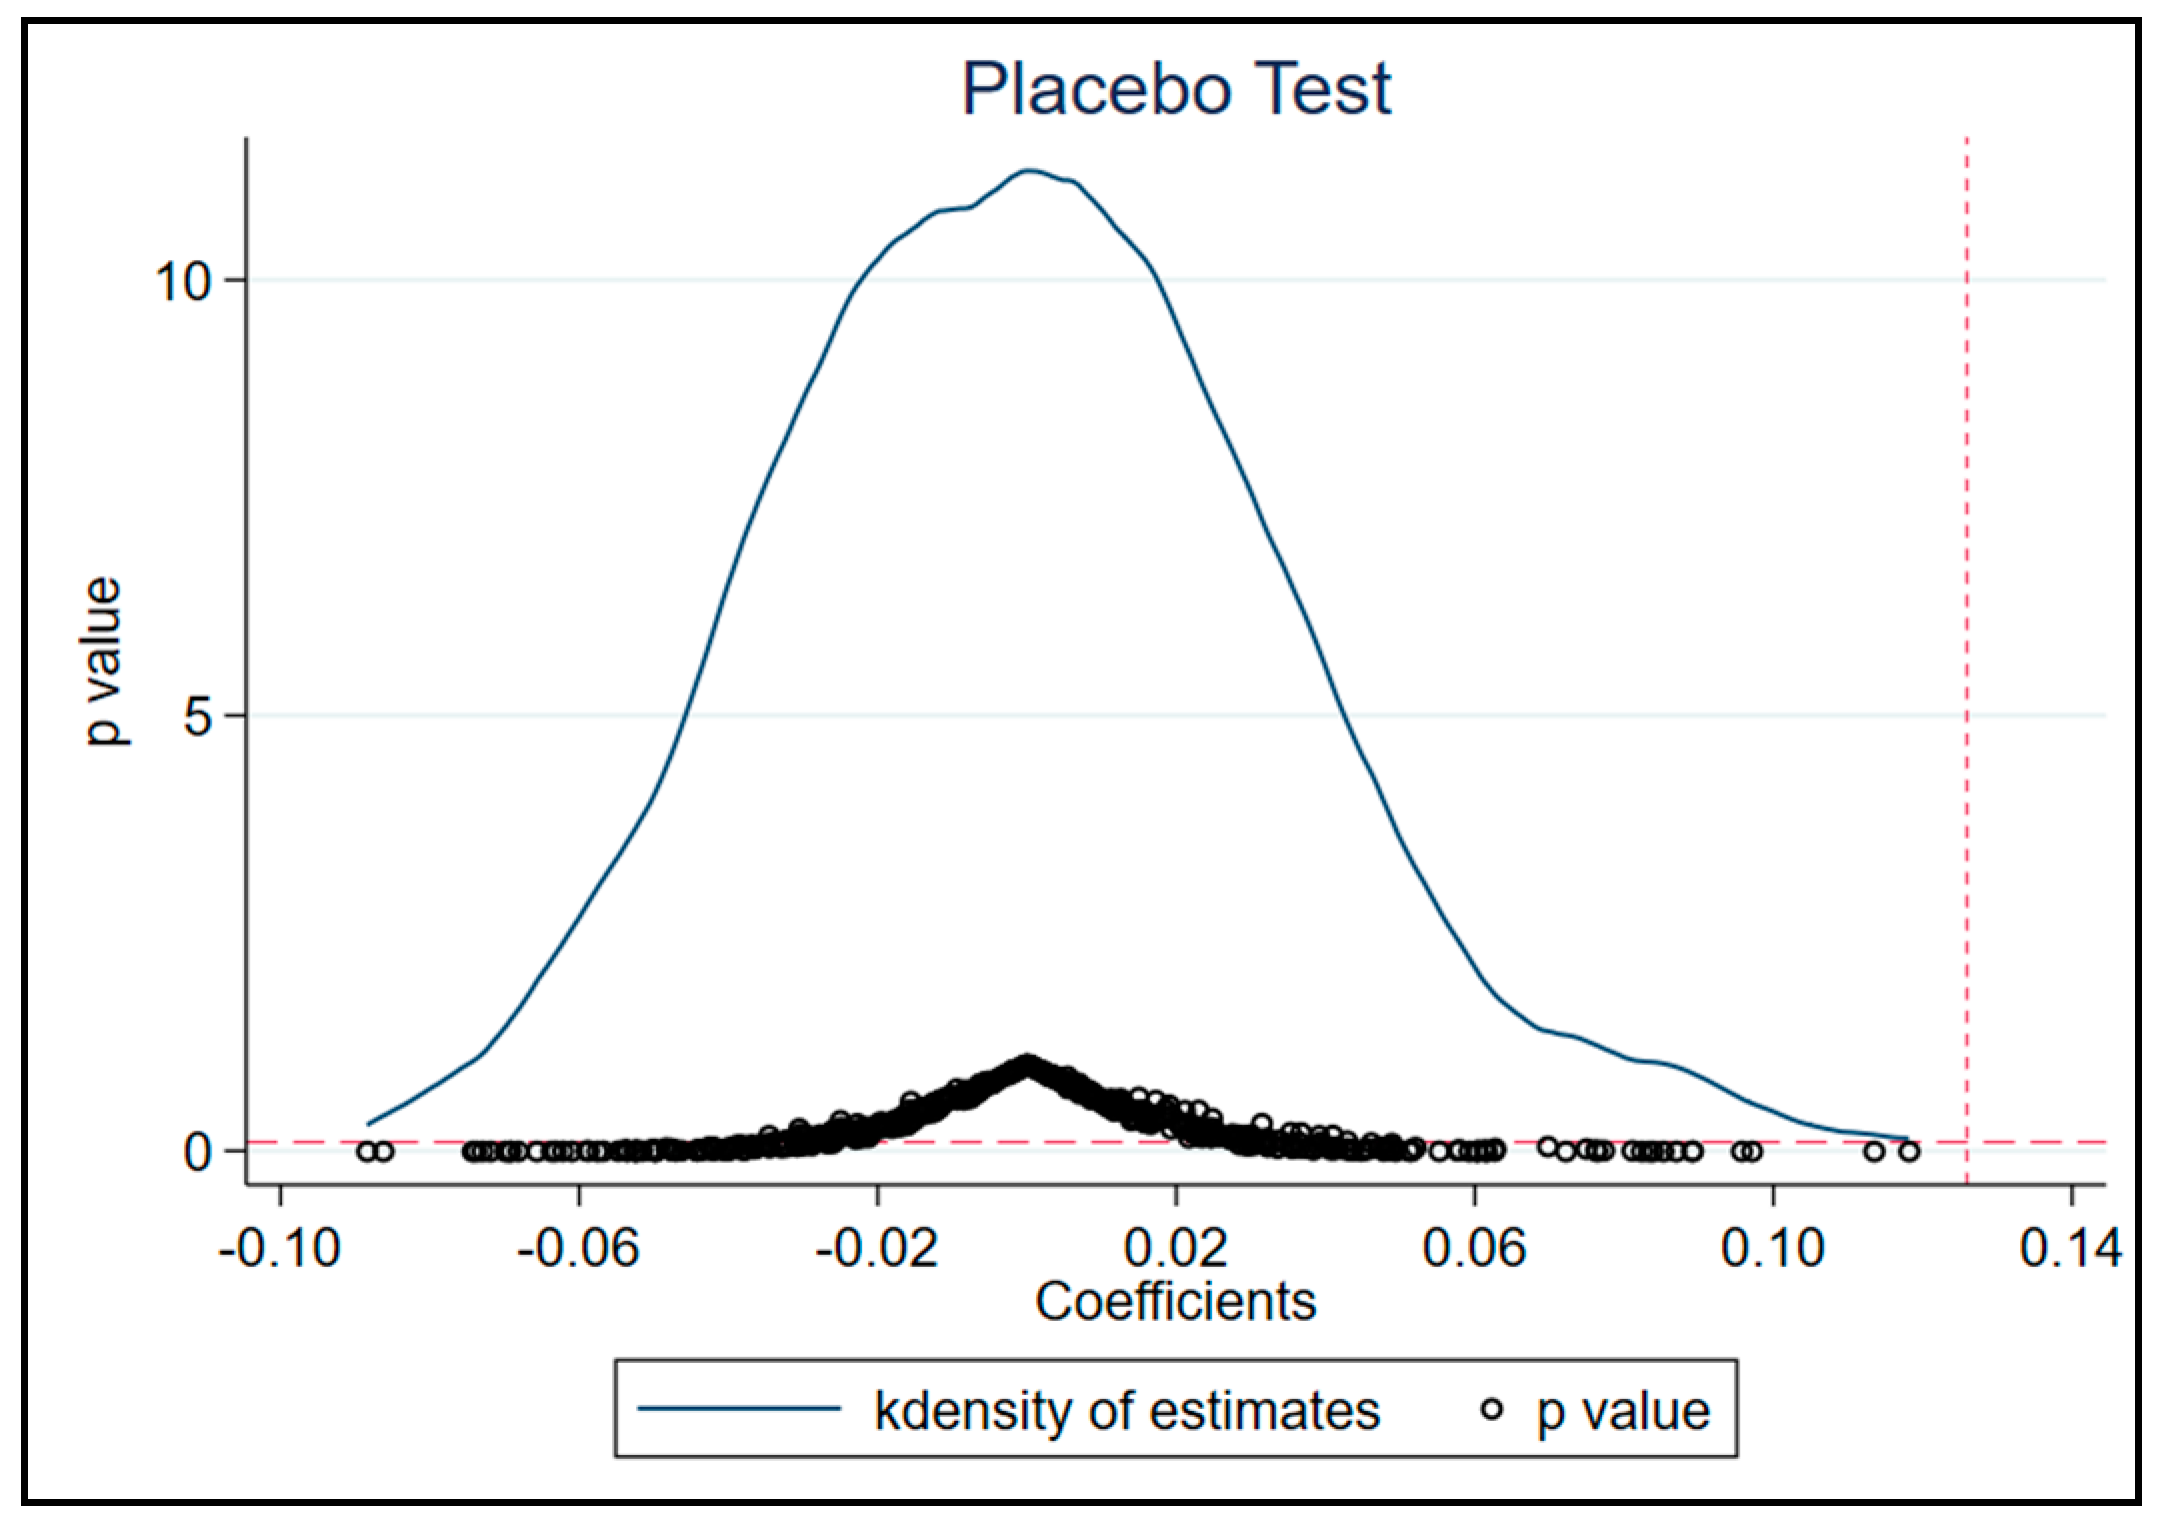
Employing a progressive difference-in-differences method, this study analyzes how the national independent innovation demonstration zone pilot policy in China affects urban green total factor productivity in 2004–2016 by using a set of prefecture-level cities’ panel data. Empirical results show that on average, after controlling some other influencing factors, the marginal contribution of the establishment of national independent innovation demonstration zones to urban green total factor productivity is 12.6%. To further test the reliability of the estimation results, we conducted a series of robustness tests, including reselecting the sample range, re-estimating the explained variable, using the PSM-DID method and using the traditional DID method. Estimation results all confirm that the pilot policy of national independent innovation demonstration zones in China exerts significant positive effects on urban green total factor productivity. Using the mediating effect model, we also confirm that talent agglomeration and fiscal expenditure on science and technology are two effective action mechanisms through which the national independent innovation demonstration zone pilot policy contributes to urban green total factor productivity. In addition, there is regional disparity in the GTFP growth effects of the national independent innovation demonstration zone pilot policy, and these effects vary across city size and local resource endowment. Compared with the eastern cities, medium and small cities and resource-based cities, the promotion effects of NIIDZs on urban GTFP are more obvious in western cities, large cities and non-resource-based cities.
Based on these findings, we put forward some policy recommendations: First, the Chinese government should summarize the experience of the pilot areas, promote these pilot projects and set up innovation demonstration areas in more cities for them to play a positive role in green development. Second, the construction of national independent innovation demonstration zones should be tailored to local conditions. Small- and medium-sized cities, central and western regions and resource-based cities should be given more attention, and fiscal investment in science and technology should be strengthened to take full advantage of the leading role of national independent innovation demonstration zones. Third, policymakers should pay full attention to the role of human capital in NIIDZ’s promotion of green growth. Local governments should strengthen investment in higher education and vigorously strengthen the training of innovative talents. At the same time, a sound talent introduction policy should be formulated to take full advantage of the role of talent in green growth.
There are several limitations of our study. First, the National Independent Innovation Demonstration Zone is one of China’s policies to implement innovation-driven strategies. There are many other innovation policies that we have not discussed. For example, the construction of innovative cities will also have an impact on GTFP. Therefore, in the future, we will consider other policies and evaluate the synergy of various policies. Second, due to the availability of data, our sample data range is 2004–2016, and the latest data have not been analyzed, so we will continue to discuss this effect after updating the sample in the future. Third, in addition to talent agglomeration and fiscal expenditure, there are other intermediate mechanisms for NIIDZ’s impact on GTFP, which need to be further explored.

Author Contributions

Conceptualization, H.Y. and N.X.; methodology, N.X.; software, N.X.; validation, H.Y. and J.Z.; formal analysis, H.Y.; investigation, H.Y. and J.Z.; resources, N.X.; data curation, H.Y.; writing—original draft preparation, H.Y.; visualization, N.X.; supervision, J.Z.; project administration, J.Z.; funding acquisition, N.X. All authors have read and agreed to the published version of the manuscript.

Funding

The research was funded by the Philosophy and Social Science Foundation of Henan Province (grant number 2021CJJ149).

Institutional Review Board Statement

Not applicable.

Informed Consent Statement

Not applicable.

Data Availability Statement

The data come mainly from China City Statistical Yearbook (2005–2017), China Statistical Yearbook (2005–2017) and the EPS database.

Acknowledgments

The authors express their gratitude for the support from Yunnan University and Henan Normal University.

Conflicts of Interest

The authors declare no conflict of interest.

References

  1. Liu, W. Economic Growth and the Goal of Well-off Society in an All-Round Way under the Impact of Epidemic Situation. Manag. World 2020, 36, 1–8. (In Chinese) [Google Scholar]
  2. Tian, Y.; Feng, C. The internal-structural effects of different types of environmental regulations on China’s green total-factor productivity. Energy Econ. 2022, 113, 106246. [Google Scholar] [CrossRef]
  3. Li, W.; Jian, J. The spatial spillover effect of high-speed railway on CO2 emissions in China. Environ. Sustain. Ind. 2022, 16, 100204. [Google Scholar] [CrossRef]
  4. Li, G.; Liao, F. Input digitalization and green total factor productivity under the constraint of carbon emissions. J. Clean. Prod. 2022, 377, 134403. [Google Scholar] [CrossRef]
  5. Cheng, Z.; Li, X.; Zhu, Y.; Wang, M. The effects of agglomeration externalities on urban green total-factor productivity in China. Econ. Syst. 2022; 101025, in press. [Google Scholar] [CrossRef]
  6. Li, K.; Lin, B. Economic growth model, structural transformation, and green productivity in China. Appl. Energy 2017, 187, 489–500. [Google Scholar] [CrossRef]
  7. Magnani, M. Innovation: Engine of Economic Growth (and Employment). In Making the Global Economy Work for Everyone: Lessons of Sustainability from the Tech Revolution and the Pandemic; Magnani, M., Ed.; Springer International Publishing: Cham, Switzerland, 2022; pp. 1–16. [Google Scholar]
  8. Pece, A.M.; Simona, O.E.O.; Salisteanu, F. Innovation and Economic Growth: An Empirical Analysis for CEE Countries. Procedia Econ. Financ. 2015, 26, 461–467. [Google Scholar] [CrossRef]
  9. Prokop, V.; Hajek, P.; Stejskal, J. Configuration Paths to Efficient National Innovation Ecosystems. Technol. Forecast. Soc. 2021, 168, 120787. [Google Scholar] [CrossRef]
  10. Wang, R.; Tan, J. Exploring the coupling and forecasting of financial development, technological innovation, and economic growth. Technol. Forecast. Soc. 2021, 163, 120466. [Google Scholar] [CrossRef]
  11. Pradhan, R.P.; Arvin, M.B.; Bahmani, S. Are innovation and financial development causative factors in economic growth? Evidence from a panel granger causality test. Technol. Forecast. Soc. 2018, 132, 130–142. [Google Scholar] [CrossRef]
  12. Sohag, K.; Begum, R.A.; Abdullah, S.M.S.; Jaafar, M. Dynamics of energy use, technological innovation, economic growth and trade openness in Malaysia. Energy 2015, 90, 1497–1507. [Google Scholar] [CrossRef]
  13. Li, W.; Wang, J.; Chen, R.; Xi, Y.; Liu, S.Q.; Wu, F.; Masoud, M.; Wu, X. Innovation-driven industrial green development: The moderating role of regional factors. J. Clean. Prod. 2019, 222, 344–354. [Google Scholar] [CrossRef]
  14. Ge, P.; Huang, X.; Han, X. Innovation-driven and “the Belt and Road” green total factor productivity improvement: An analysis of heterogeneous innovation based on the new economic growth model. Econ. Sci. 2018, 1, 37–51. (In Chinese) [Google Scholar]
  15. Wang, S.; Gu, S. Basic Innovation or Applied Innovation? Which One Drives High-quality Development of Economy: Based on the Research of Countries along the “Belt and Road”. Financ. Econ. 2020, 11, 108–121. (In Chinese) [Google Scholar]
  16. Yang, Y.; Wu, D.; Xu, M.; Yang, M.; Zou, W. Capital misallocation, technological innovation, and green development efficiency: Empirical analysis based on China provincial panel data. Environ. Sci. Pollut. R 2022, 29, 65535–65548. [Google Scholar] [CrossRef]
  17. Wang, H.; Cui, H.; Zhao, Q. Effect of green technology innovation on green total factor productivity in China: Evidence from spatial durbin model analysis. J. Clean. Prod. 2021, 288, 125624. [Google Scholar] [CrossRef]
  18. Du, K.; Li, J. Towards a green world: How do green technology innovations affect total-factor carbon productivity. Energy Policy 2019, 131, 240–250. [Google Scholar] [CrossRef]
  19. Liu, F.; Fan, Y.; Yang, S. Environmental benefits of innovation policy: China’s national independent innovation demonstration zone policy and haze control. J. Environ. Manag. 2022, 317, 115465. [Google Scholar] [CrossRef]
  20. We, L.; Bu, W. Research on the Economic Growth Promoting Effect of National Innovation Demonstration Zone. Sci. Technol. Prog. Policy 2018, 35, 48–56. (In Chinese) [Google Scholar]
  21. Jiakui, C.; Abbas, J.; Najam, H.; Liu, J.; Abbas, J. Green technological innovation, green finance, and financial development and their role in green total factor productivity: Empirical insights from China. J. Clean. Prod. 2023, 382, 135131. [Google Scholar] [CrossRef]
  22. Wu, J.; Xia, Q.; Li, Z. Green innovation and enterprise green total factor productivity at a micro level: A perspective of technical distance. J. Clean. Prod. 2022, 344, 131070. [Google Scholar] [CrossRef]
  23. Yu, Y.; Chen, X.; Zhang, N. Innovation and energy productivity: An empirical study of the innovative city pilot policy in China. Technol. Forecast. Soc. 2022, 176, 121430. [Google Scholar] [CrossRef]
  24. Zhao, X.; Nakonieczny, J.; Jabeen, F.; Shahzad, U.; Jia, W. Does green innovation induce green total factor productivity? Novel findings from Chinese city level data. Technol. Forecast. Soc. 2022, 185, 122021. [Google Scholar] [CrossRef]
  25. Solow, R.M. Technical Change and the Aggregate Production Function. Rev. Econ. Stat. 1957, 39, 312–320. [Google Scholar] [CrossRef]
  26. Ten Raa, T.; Shestalova, V. The Solow residual, Domar aggregation, and inefficiency: A synthesis of TFP measures. J. Prod. Anal. 2011, 36, 71–77. [Google Scholar] [CrossRef]
  27. Zhai, R.; Lou, Z. Chinese agricultural output and TFP: 1661–2019. Econ. Lett. 2022, 213, 110415. [Google Scholar] [CrossRef]
  28. Peng, Y.; Chen, Z.; Xu, J.; Lee, J. Analysis of green total factor productivity trend and its determinants for the countries along silk roads. Growth Chang. 2020, 51, 1711–1726. [Google Scholar] [CrossRef]
  29. Zhuang, W.; Wang, Y.; Lu, C.; Chen, X. The green total factor productivity and convergence in China. Energy Sci. Eng. 2022, 10, 2794–2807. [Google Scholar] [CrossRef]
  30. Wang, M.; Pang, S.; Hmani, I.; Hmani, I.; Li, C.; He, Z. Towards sustainable development: How does technological innovation drive the increase in green total factor productivity? Sustain. Dev. 2021, 29, 217–227. [Google Scholar] [CrossRef]
  31. Wu, G.; Baležentis, T.; Sun, C.; Xu, S. Source control or end-of-pipe control: Mitigating air pollution at the regional level from the perspective of the Total Factor Productivity change decomposition. Energy Policy 2019, 129, 1227–1239. [Google Scholar] [CrossRef]
  32. Chen, K.; Huang, Y.; Yang, C. Analysis of regional productivity growth in China: A generalized metafrontier MPI approach. China Econ. Rev. 2009, 20, 777–792. [Google Scholar] [CrossRef]
  33. Chung, Y.H.; Färe, R.; Grosskopf, S. Productivity and Undesirable Outputs: A Directional Distance Function Approach. J. Environ. Manag. 1997, 51, 229–240. [Google Scholar] [CrossRef]
  34. Tian, P.; Lin, B. Promoting green productivity growth for China’s industrial exports: Evidence from a hybrid input-output model. Energy Policy 2017, 111, 394–402. [Google Scholar] [CrossRef]
  35. Xu, X.; Huang, X.; Huang, J.; Gao, X.; Chen, L. Spatial-Temporal Characteristics of Agriculture Green Total Factor Productivity in China, 1998–2016: Based on More Sophisticated Calculations of Carbon Emissions. Int. J. Environ. Res. Public Health 2019, 16, 3932. [Google Scholar] [CrossRef] [PubMed]
  36. Tone, K. A slacks-based measure of efficiency in data envelopment analysis. Eur. J. Oper. Res. 2001, 130, 498–509. [Google Scholar] [CrossRef]
  37. Oh, D. A global Malmquist-Luenberger productivity index. J. Prod. Anal. 2010, 34, 183–197. [Google Scholar] [CrossRef]
  38. Gu, B.; Liu, J.; Ji, Q. The effect of social sphere digitalization on green total factor productivity in China: Evidence from a dynamic spatial Durbin model. J. Environ. Manag. 2022, 320, 115946. [Google Scholar] [CrossRef]
  39. Li, C.; Qi, Y.; Liu, S.; Wang, X. Do carbon ETS pilots improve cities’ green total factor productivity? Evidence from a quasi-natural experiment in China. Energy Econ. 2022, 108, 105931. [Google Scholar] [CrossRef]
  40. Wang, S.; Li, G.; Fang, C. Urbanization, economic growth, energy consumption, and CO2 emissions: Empirical evidence from countries with different income levels. Renew. Sustain. Energy Rev. 2018, 81, 2144–2159. [Google Scholar] [CrossRef]
  41. Zhou, Y.; Xu, Y.; Liu, C.; Fang, Z.; Fu, X.; He, M. The Threshold Effect of China’s Financial Development on Green Total Factor Productivity. Sustainability 2019, 11, 3776. [Google Scholar] [CrossRef]
  42. Luo, Y.; Lu, Z.; Salman, M.; Song, S. Impacts of heterogenous technological innovations on green productivity: An empirical study from 261 cities in China. J. Clean. Prod. 2022, 334, 130241. [Google Scholar] [CrossRef]
  43. Zhang, D.; Vigne, S.A. How does innovation efficiency contribute to green productivity? A financial constraint perspective. J. Clean. Prod. 2021, 280, 124000. [Google Scholar] [CrossRef]
  44. Cao, J.; Law, S.H.; Bin Abdul Samad, A.R.; Binti W Mohamad, W.N.; Wang, J.; Yang, X. Effect of financial development and technological innovation on green growth—Analysis based on spatial Durbin model. J. Clean. Prod. 2022, 365, 132865. [Google Scholar] [CrossRef]
  45. Wei, L.; Lin, B.; Zheng, Z.; Wu, W.; Zhou, Y. Does fiscal expenditure promote green technological innovation in China? Evidence from Chinese cities. Environ. Impact. Assess 2023, 98, 106945. [Google Scholar] [CrossRef]
  46. Ma, Y.; Zhang, Q.; Yin, Q. Top management team faultlines, green technology innovation and firm financial performance. J. Environ. Manag. 2021, 285, 112095. [Google Scholar] [CrossRef]
  47. Kleinknecht, A.; Van Montfort, K.; Brouwer, E. The Non-Trivial Choice between Innovation Indicators. Econ. Innov. New Technol. 2002, 11, 109–121. [Google Scholar] [CrossRef]
  48. Borghesi, S.; Cainelli, G.; Mazzanti, M. Linking emission trading to environmental innovation: Evidence from the Italian manufacturing industry. Res. Policy 2015, 44, 669–683. [Google Scholar] [CrossRef]
  49. Qin, H.; Xiao, H.; Wu, J.; Zhang, X. National Independent Innovation Demonstration Zone, Government Innovation Preferences, and Regional Innovation Capability. East China Econ. Manag. 2021, 35, 52–62. [Google Scholar]
  50. Xu, N.; Zhao, D.; Zhang, W.; Zhang, H.; Chen, W.; Ji, M.; Liu, M. Innovation-Driven Development and Urban Land Low-Carbon Use Efficiency: A Policy Assessment from China. Land 2022, 11, 1634. [Google Scholar] [CrossRef]
  51. Fang, L.; Tang, H.; Li, J. Impacts of National Independent Innovation Demonstration Zone Construction on Urban Air Pollution: Evidence from a Quasi-Natural Experiment. J. Xi’an Jiaotong Univ. 2022, 42, 49–62. (In Chinese) [Google Scholar]
  52. Cohen, W.M.; Levinthal, D.A. Innovation and Learning: The Two Faces of R&D. Econ. J. 1989, 99, 569–596. [Google Scholar]
  53. Yang, C.; Lin, H. Openness, Absorptive Capacity, and Regional Innovation in China. Environ. Plan. A Econ. Space 2012, 44, 333–355. [Google Scholar] [CrossRef]
  54. Ning, L.; Wang, F.; Li, J. Urban innovation, regional externalities of foreign direct investment and industrial agglomeration: Evidence from Chinese cities. Res. Policy 2016, 45, 830–843. [Google Scholar] [CrossRef]
  55. Che, D.; Wu, C.; Ren, X.; Wu, F. How Does Fiscal Technology Expenditure Affect Enterprise Technology Innovation? Heterogeneity, Macro-micro mechanism and Government Incentive Structure. China Soft Sci. 2020, 3, 171–182. (In Chinese) [Google Scholar]
  56. Zhou, Z.; Li, J.; Qin, Y.; Duan, D. The Influence of Fiscal Technology Expenditure on Total Factor Productivity and Its Mechanism. Econ. Geogr. 2022, 42, 108–116. (In Chinese) [Google Scholar]
  57. Baron, R.M.; Kenny, D.A. The moderator–mediator variable distinction in social psychological research: Conceptual, strategic, and statistical considerations. J. Pers. Soc. Psychol. 1986, 51, 1173. [Google Scholar] [CrossRef]
  58. Tone, K.; Tsutsui, M. An epsilon-based measure of efficiency in DEA–A third pole of technical efficiency. Eur. J. Oper. Res. 2010, 207, 1554–1563. [Google Scholar] [CrossRef]
  59. Lee, C.; Lee, C. How does green finance affect green total factor productivity? Evidence from China. Energy Econ. 2022, 107, 105863. [Google Scholar] [CrossRef]
  60. Wang, M.; Xu, M.; Ma, S. The effect of the spatial heterogeneity of human capital structure on regional green total factor productivity. Struct. Chang. Econ. D 2021, 59, 427–441. [Google Scholar] [CrossRef]
  61. Tan, R.; Pan, L.; Xu, M.; He, X. Transportation infrastructure, economic agglomeration and non-linearities of green total fac tor productivity growth in China: Evidence from partially linear functional coefficient model. Transp. Policy 2022, 129, 1–13. [Google Scholar] [CrossRef]
Figure 1. The Trend of GTFP.
Sustainability 15 07417 g001
Figure 2. The Common Trend Test. Note: The x-axis represents the year before and after the construction of the NIIDZ. −4~−1 are years before NIIDZ implementation. Furthermore, 1~7 represent years after policy implementation. The Y-axis represents the estimated coefficients of Treated with a 95% confidence interval.
Sustainability 15 07417 g002
Figure 3. Placebo Test.
Sustainability 15 07417 g003
Table 1. Urban GTFP Index System.
IndexSpecific IndexIndicator Description
InputEnergy inputUrban power consumption (unit: 10,000 kw·h)
Labor inputTotal urban employment (unit: ten thousand people)
Capital inputUrban capital stock (unit: CNY ten thousand)
Expected outputEconomic benefit
output
Urban GDP (unit: CNY ten thousand)
Unexpected outputWastewater dischargeTotal industrial wastewater discharge of a city (unit: 10,000 tons)
Exhaust emissionsSO2 emission from urban industry (unit: 10,000 tons)
Emission of urban industrial smoke (powder) dust (unit: 10,000 tons)
Note: The data come from China Urban Statistical Yearbook.
Table 2. Variable Definitions.
VariableDefinitions
Explained VariableGTFPUrban green total factor productivity, which is calculated by super EBM-GML index
Explanatory variableTreatedTreated = pilot × time; the pilot equals 1 if the city covers an innovation pilot and 0 otherwise; the time equals 1 if the innovation pilot has been established in the city and 0 otherwise.
Mediating variableAGGThe location entropy index of people engaged in finance, computer services and software, scientific research, education, culture, sports and entertainment and leasing and commercial services (The location entropy measurement formula is: (Number of employees of finance, computer services and software, scientific research, education, culture, sports and entertainment, leasing and commercial services in the city/number of all employees in the city)/(Number of employees of finance, computer services and software, scientific research, education, culture, sports and entertainment, leasing and commercial services in the country/Number of all employees in the country).
ExpFiscal expenditure on science and technology/GDP
Control variablesFinYear-end loan balance/GDP
HumNumber of students in ordinary colleges and universities/Number of laborers
ErThe comprehensive index of sulfur dioxide removal rate, industrial smoke (powder) dust removal rate and comprehensive utilization rate of industrial solid waste, which is synthesized by the entropy method
ScalePopulation of municipal districts at the end of the year
ResProportion of employees in mining industry/Total population at the end of the year
UrbUrban resident population/Total population
DevNatural logarithm of the per capita GDP
OpenActual foreign direct investment/GDP
Table 3. Data Descriptive Statistics.
VariableNMeanS.D.MinMax
GTFP36791.0800.3300.2803.300
Fin36790.8000.4800.0807.450
Hum36790.0200.0200.000 0.130
Er36790.5500.2100.0600.990
Scale36794.5800.7702.6607.800
Res36790.0100.0200.000 0.240
Urb36790.7805.5800.01089.600
Dev36799.8700.7404.34012.780
Open36790.0200.0200.000 0.150
Table 4. Benchmark Regression Results.
Variable(1)(2)(3)
GTFPGTFPGTFP
Treated0.396 ***0.131 ***0.126 ***
(8.28)(3.03)(2.82)
Fin −0.060 *
(−1.95)
Hum 3.567 ***
(2.96)
Er 0.078 **
(2.00)
Scale −0.001
(−0.02)
Res −3.199 **
(−1.99)
Urb 0.003 ***
(4.69)
Dev 0.263 ***
(4.01)
Open −0.922 **
(−2.30)
Constant1.069 ***0.979 ***−1.414 **
(198.36)(74.27)(−2.26)
Regional fixed effectNoYesYes
Time fixed effectNoYesYes
N367936793679
R20.0350.2520.307
F-value68.53036.69134.255
Note: The numbers in parentheses are robust t-statistics. ***, ** and * represent significance levels of 1%, 5% and 10%, respectively.
Table 5. Robustness Test.
VariableReselect SamplesPSM-DIDGTFP Measured by SBM-GMLTraditional DID
(1)(2)(3)(4)
Treated0.076 **0.121 **0.240 ***
(2.43)(2.53)(2.91)
Treated0 0.422 ***
(5.90)
ControlsYesYesYesYes
Constant−1.536 ***−2.647 ***−1.407−1.630 ***
(−2.36)(−3.82)(−1.97)(−7.20)
Regional fixed effectsYesYesYesYes
Time fixed effectsYesYesYesYes
Observation3627212236793159
R20.2990.4370.3280.2874
F-value27.1423.17365.2855.59
Note: The numbers in parentheses are robust t-statistics. *** and ** represent significance levels of 1% and 5%, respectively.
Table 6. Mechanism Examination.
Variable(1)(2)(3)(4)
AGGGTFPExpGTFP
Treated0.063 ***0.117 ***0.009 ***0.118 ***
(3.93)(5.21)(9.40)(5.18)
AGG 0.128 ***
(5.37)
Exp 0.747 **
(1.97)
ControlsYesYesYesYes
Constant2.704 ***−1.865 ***0.026−1.539 ***
(12.84)(−6.24)(2.02)(−5.25)
Regional fixed effectsYesYesYesYes
Time fixed effectsYesYesYesYes
Observation3679367936793679
R20.85270.76070.67630.7590
F-value64.4935.2923.2734.95
Intermediary effect0.00810.1182
Intermediary effect/total effect0.06950.0607
Sobel Test3.1721.929
0.00150.0500
Note: The dependent variables in columns (1) and (3) are AGG and Exp, respectively. The dependent variable in columns (2) and (4) is GTFP. The numbers in parentheses are robust t-statistics. *** and ** represent significance levels of 1% and 5%, respectively.
Table 7. Heterogeneity Discussion.
VariableLocationPopulation ScaleResource Endowment
Eastern CitiesCentral and Western CitiesLarge ScaleMedium and Small ScaleNon-Resource-Based CitiesResource-Based Cities
(1)(2)(3)(4)(5)(6)
Treated0.112 **0.162 ***0.109 **0.0340.115 ***0.068 *
(2.12)(3.69)(2.41)(0.27)(2.65)(1.76)
ControlsYesYesYesYesYesYes
Constant−1.225 *−1.626 ***−0.418−1.554 ***−0.850−1.730 *
(−1.69)(−1.85)(−0.59)(−1.91)(−1.36)(−1.66)
Regional fixed effectYesYesYesYesYesYes
Time fixed effectYesYesYesYesYesYes
Observation154721321820185921971482
R20.46890.2460.4660.2110.4070.216
F-value30.6615.3224.3412.2225.7312.81
Note: The numbers in parentheses are robust t-statistics. ***, ** and * represent significance levels of 1%, 5% and 10%, respectively.
Disclaimer/Publisher’s Note: The statements, opinions and data contained in all publications are solely those of the individual author(s) and contributor(s) and not of MDPI and/or the editor(s). MDPI and/or the editor(s) disclaim responsibility for any injury to people or property resulting from any ideas, methods, instructions or products referred to in the content.

