Article

Coupling and Coordination between Digital Economy and Urban–Rural Integration in China

1
School of Economics, Shandong University of Finance and Economics, Jinan 250014, China
2
School of Economics, University of Bristol, Bristol BS8 1QU, UK
3
School of Economics, University of Nottingham Ningbo China, Ningbo 315000, China
4
Faculty of Economics, Chiang Mai University, Chiang Mai 50200, Thailand
*
Author to whom correspondence should be addressed.
Sustainability 2023, 15(9), 7299; https://doi.org/10.3390/su15097299
Submission received: 29 January 2023 / Revised: 26 March 2023 / Accepted: 19 April 2023 / Published: 27 April 2023

Abstract

:
The positive interaction between digital economy development and urban–rural relationship adjustment can both expand the contribution of technological factors and enhance the balance of urban–rural development. This paper aims to explore the trends and barriers to the coupled and coordinated development of the digital economy and urban–rural integration. This paper measures the degree of coupled coordination between the digital economy and urban–rural integration based on provincial panel data from 2013 to 2020 in China. Based on this, this paper investigates the characteristics and driving forces of the coupled coordination relationship through the chronological evolution method and geographically weighted regression. The results show that (1) the coupling relationship between the digital economy and urban–rural integration has improved substantially in Chinese provinces; (2) heterogeneity still exists at the provincial level; (3) this relationship is expected to be optimized over time; and (4) information construction, rational distribution, balanced growth, equalization of public services and digital-industry development does have a positive effect on the improvement of the coupled coordination relationship, and the popularity of the internet has a negative effect. Accordingly, this paper mainly draws the following conclusions. The coupling relationship between the digital economy and urban–rural integration in the Chinese provinces shows a tendency to be more coordinated. It is necessary to promote the development of the five positive drivers and to guide and regulate the negative drivers.

1. Introduction

Restructuring and reshaping the urban–rural relationship is an important part of national modernization. China’s urban–rural relations are experiencing a development trend from antagonism to integration. With the development of society, the following distinct changes in the characteristics of the urban–rural structure have taken place as China’s per capita GDP grows from USD 1042 in 2001 to USD 12,741 in 2022. With the increase in income, the consumption structure of residents has also undergone great changes. The Engel coefficient of the population decreased from 40.5% in 2001 to 29.8% in 2021. As the level of urbanization increases, the trend of a two-way flow of resource factors gradually emerges [1]. However, the differences between urban and rural development levels have been the major reason to restrict balanced development in China for a long time [2]. The income ratio between urban and rural residents (rural residents’ income = 1) in 2022 is still as high as 2.45 in addition to individual-level distributional problems, imbalances in the areas of macro growth and infrastructure [3] are also important manifestations of the urban–rural gap in China.
Equitable distribution, balanced growth, and improved infrastructure are important components of the UN Sustainable Development Goals. Since the 1980s, especially since the 21st century, the Chinese government has made improving the urban–rural relationship one of its major goals. The Chinese government has focused on implementing special policies in rural and urban areas, respectively, to eliminate the urban–rural dichotomy and to promote integrated urban–rural development. The digital economy is the main economic form after the agricultural and industrial economies, and it has greatly changed the industrial and agricultural forms, which inevitably have a great impact on the development of the urban–rural relationship [4]. The Chinese Government put forward plans for smart cities and digital villages in succession under the policy framework for establishing a digital China. This is an important measure to achieve urban–rural common prosperity in the era of the digital economy. We can see that the digital economy and urban–rural integration have strong compatibility in policy: on one hand, the digital economy brings a new potential technical route for the development of urban–rural integration, and on the other hand, the increasing need of cities and villages for each other provides new scenarios for the development of a digital economy. The future is an important opportunity to promote the deep integration of the digital economy and the real economy and to realize the prosperity of the digital economy. It is also a critical stage for improving urban–rural coordination and achieving urban–rural integration. Therefore, there is an urgent need for China to explore the specific effects and coordination mechanisms of the digital economy and the integrated development of urban and rural areas. In this context, this study is prescient.
With the rapid development of the digital economy and urban–rural integration, the mutual influence between the two has become complex. Therefore, this paper is benefit to understand the level and inner mechanism of the coordinated development of digital economy and urban–rural integration more fully, and further discusses the spatial relationship between the two. However, there are not enough studies that relate the digital economy to urban–rural integration. Among these studies, most of them are concerned with the impact of the digital economy on urban–rural integration. Few articles discuss the impact of rural-urban integration on the digital economy and their interrelationship. Therefore, this paper attempts to provide evidence for the following three perspectives. First, the level of coupled coordination between the digital economy and urban–rural integration gradually increases nationwide and in each province. Second, the coupling and coordination level of the digital economy and urban–rural integration in each region and province is still in the process of continuous optimization. Third, the main endogenous mechanisms of the coupled coordination of the digital economy and urban–rural integration are information construction, internet penetration, digital industry development, rational distribution, balanced growth, and equalization of public services; the impact of the endogenous mechanisms has differences.
This study makes marginal contributions in the following aspects. First, this paper is the first to propose the endogenous mechanism of the digital economy and urban–rural integration and use it as a basis to build an indicator evaluation system of the digital economy and urban–rural integration by drawing on relevant literature. Second, this paper attempts to integrate the digital economy and urban–rural integration into a unified theoretical framework and analyze their coupling and coordination. Third, this paper uses equations for chronological evolution and geographically weighted regression (GWR) models to discuss the trends and main drivers of the coordinated relationship between the two. This study is expected to provide theoretical support and policy recommendations for the development of the digital economy and urban–rural integration, to deeply explore the value and functions of the digital economy, and to promote the high-quality development of urban–rural integration and common prosperity of urban and rural areas.

2. Literature Review and Mechanism Analysis

2.1. Literature Review

The literature review consists of three main parts: the definition of the digital economy, the definition of urban–rural integration, and the study of combining digital economy and urban–rural integration.
The concept of the digital economy appeared in the 1990s. Tapscott [5] was the first to put forward the concept of “the digital economic times”. He pointed out that the digital economy realized the combination of intelligence, knowledge, and creativity through breakthroughs in technology and intellectual network, sequentially facilitating the growth of the economy. The early research on the digital economy always focused on technologies of the digital economy and the laws of industrial development. Lane [6] mentioned that a digital economy is an economic form driven jointly by information communication and computing technologies, resulting in extensive growth of the e-commerce industry and changes in traditional business models. Teo [7] and Cheon and Kim [8] further clarified the definition of the digital economy, and Cheon and Kim [8] also clarified the boundary of the digital economy on this basis. The G20 Hangzhou Summit in 2016 formed a broad consensus on the definition of the digital economy through the “G20 Digital Economy Development and Cooperation Initiative”, i.e., the economic activities which take digitized knowledge and information as the key productive elements, the modern information network as the important carrier, the effective application of information communication technologies as the important impetus to improve the efficiency and optimize the economic structure [9].
There are two main types of methods used by academia to measure the digital economy. The first type is to use a single proxy for the scale of industries related to the digital economy. Since the connotation and extension of the digital economy are extremely broad, although this type of method can also better reflect the impact of the development of the digital economy, it is difficult to comprehensively reflect the changes in the internal structure of the digital economy. The second type of method is the indicator system method, which constructs an indicator system from multiple dimensions of digital economy development and standardizes it. This approach can pass the development of each element within the digital economy. For example, the Organization for Economic Cooperation and Development (OECD) measures the prosperity of the digital economy in four dimensions: smart infrastructure, innovation capacity, digital industry, and empowered society [10], and the European Union (EU) publishes the Digital Economy and Society Index (DESI), which covers human capital, Internet connectivity, commercial applications of digital technologies, and digital public services [11]. Hanna (2020) constructed an evaluation index of the digital economy in terms of digital infrastructure, digital platform, digital governance, and data processing [12].
An urban–rural relationship is an interaction and connection between cities and villages, interactional, mutually influenced, and mutually restricted, and it is formed on the basis of the specific social and economic system [13]. As the stages of economic development change, the relationships between cities and villages are constantly changing. Different from the digital economy, cities and villages are the two most important forms of settlement of human civilization, and economists have concluded and explored the laws of development and interaction of these two in early phases. At the primary phase of economic development, Adam Smith [14] put forward the first theory of the urban–rural relationship, i.e., the “Urban-Rural” Natural Order Theory. This theory pointed out that the development of agricultural villages in the early days of the industrial revolution played an important role in cities. The industrial revolution caused profound changes in the relationship between cities and villages, and urban–rural conflicts arose. Marx and Engels formed the urban–rural integration theory based on their criticism and absorption of the discussions on the urban–rural relationship of classical economics and utopian socialism. Marx believed that the development of the urban–rural relationship will experience four phases “separation- antagonism-coordination-integration”. Urban–rural integration is the last phase of the development of Marxist urban–rural relations [15]. In the 20th century, Syrquin and Chenery [16] pointed out that the advancement of urbanization accompanied by industrialization is a common feature of development in all countries. The “Lewis—Fei—Ranis” model describes a kind of urban–rural dual structure for the balanced growth of industry and agriculture [17,18]. After that, many researchers challenged the trend of urban–rural division and deviation and put forward abundant theoretical hypotheses, such as the regional network model proposed by Douglass [19], the desakota model by McGee [20], and the urban–rural dynamic theory by Lynch [21], etc.
Urban–rural integration is the last stage in the development of urban–rural relations [22]. This concept broadly and extensively includes the coordination of factors and industries in the relationship between urban and rural areas [23,24,25,26,27]. There is no accepted standard to measure the level of urban–rural integration. Established studies have constructed a multidimensional evaluation index system of urban–rural integration mainly in terms of factor flow, industrial development and infrastructure, and public services [28]. Some scholars also point out that urban–rural integration corresponds to the coordination of urban–rural economic and social development, the innovation of urban–rural factor combinations, the improvement of urban–rural factor marketability, the optimization of urban–rural ecological environment and spatial layout, and the equal sharing of urban–rural development achievements [29,30].
It can be seen that the definition and measurement of the digital economy or urban–rural integration have been relatively well researched. However, relatively little literature addresses the integration of the digital economy and urban–rural integration compared to the extensive practice. Of the limited literature, the vast majority focuses on the digital economy driving urban–rural integration [31,32,33,34,35]. Very little literature has described how urban–rural integration can help the digital economy. Therefore, this paper will attempt to fill the gap in four aspects: (1) complementing and improving the intrinsic mechanism of coupled and coordinated development of digital economy and urban–rural integration; (2) measuring the coupled and coordinated development of digital economy and urban–rural integration; (3) analyzing the characteristics of this coupled and coordinated relationship; and (4) empirically analyzing the influence of each factor on this coupled coordination degree.
The remaining parts of this paper are arranged as the following: Section 3 is the introduction of empirical methods and data pretreatment; Section 4 is the report of empirical results; and Section 5 is the conclusion and discussion of this paper.

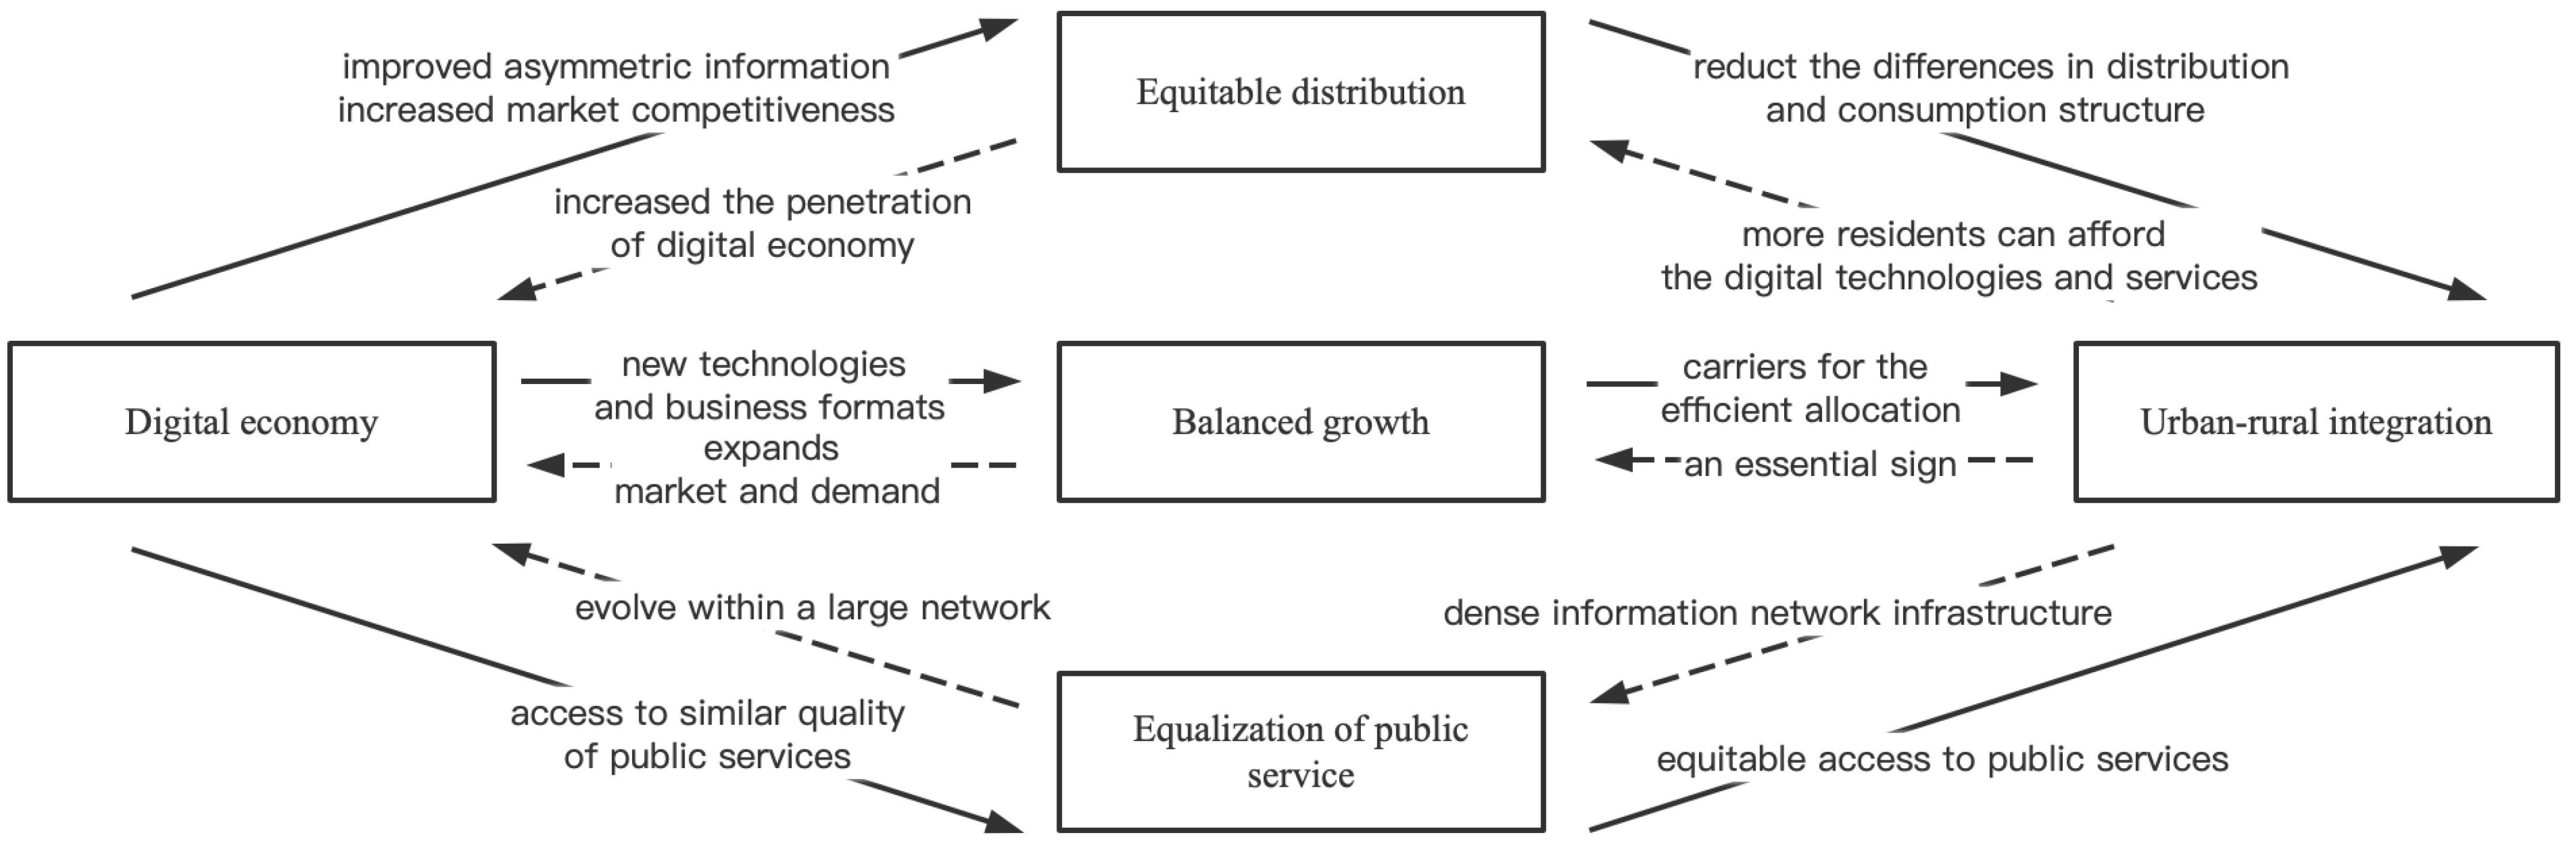
2.2. Mechanism Analysis

Understanding the mechanism of interaction between the digital economy and urban–rural integration is the key to initially identifying the driving force of their coupling and coordination. The digital economy is an important driver of efficiency improvement and structural optimization in the economy. Further urban–rural integration provides a broader market and fuller financial support for the development of the digital economy. In terms of equitable distribution, the development of the digital economy has improved asymmetric information and increased market competitiveness. This creates more economic opportunities for individuals, which leads to a reduction in the differences in income distribution and product consumption structure between urban and rural individuals. The improvement in individual income distribution and product consumption between urban and rural areas has allowed more residents to afford digital technologies and services, i.e., this has increased the penetration of the digital economy. In terms of balanced growth, the new technologies and business formats embedded in the digital economy provide carriers for the efficient allocation of factors between urban and rural areas, which can be beneficial to balanced growth between urban and rural areas. Balanced growth is an essential sign of integrated urban–rural development and urban and rural balanced growth greatly expands the market and demand for the digital economy. In terms of public services, the new digital economy, such as online medicine, online government, and public online classrooms, has given rural areas access to a similar quality of public services as urban areas. In this way, urban and rural residents can have more equitable access to public services provided by the government. The dense information network infrastructure has created a unified and extensive information and communication network between cities and villages. The digital economy can evolve within this large network. Figure 1 illustrates these mechanism paths more visually.

3. Index System Formulation, Data Source, and Evaluation Methods

3.1. Development of the Indicator System

As mentioned earlier, integrated urban–rural development is mainly manifested as equitable distribution of wealth among urban and rural residents, robust and balanced development of the urban and rural economy, and the equal allocation of urban and rural public resources. The Petty–Clark theorem [36] stated that the structural antagonisms between the agricultural industries which are mainly carried by rural settlement and the nonagricultural industries which are mainly carried by urban settlement prevail in developing countries. Therefore, this paper constructs the indicator system of urban–rural integration from three aspects: equitable distribution, balanced growth, and equalization of public services. In terms of equitable distribution, the structural opposition between urban and rural industries leads to the differences in urban and rural residents’ employment sector and quality, and these differences further result in the difference in urban and rural income and consumption structure. Generally speaking, compared to rural residents, urban residents have higher per capita income and can afford more consumption. In terms of balanced growth, the structural opposition between urban and rural industries leads to differences in industrial size and the circulation service system. The higher allocative efficiency of elements of urban nonagricultural sectors makes the capital accumulating rate of nonagricultural industries much higher than the rural agricultural sectors. The differences in circulation service systems, on one hand, are manifested as the differences between the urban and rural capital reinvestment, and, on the other hand, are manifested as the differences between the flow capacities of urban and rural consumer goods. Meanwhile, in the public domain, the imbalanced development of the urban–rural economy also hinders the equal allocation of public services.
Specifically, in this paper, we refer to Zhang Bosheng and Yang Zisheng [37] and Zhang Aiting et al. [38] for the selection of indicators of urban–rural development coordination level. This paper selects eight indicators that can reflect the urban–rural development level, from the three aspects of equitable distribution, balanced growth, and the equalization of public service, as shown in Table 1. In this paper, we also consider the availability of data. In order to manifest the integration of urban–rural development, this paper references the methods of Zhang and Yang [37], uses corresponding urban subindicators and rural subindicators, and calculates each indicator by using the coefficient of variation method.
X i = σ i μ i
Therein, indicator X i represents the coefficient of variation between subindicator x i 1 and subindicator x i 2 in Table 1; σ i is the standard deviation of x i 1 and x i 2   μ i is the arithmetic mean of x i 1 and x i 2 . The smaller the value of indicator X i is, the smaller the dispersion degree between urban and rural subindicators which are corresponded by the ith indicator in the indicator layer, and this reflects a better urban–rural integration degree of this indicator. The integrated urban–rural development index reflects the urban–rural integration state by measuring the differences in urban–rural development from several dimensions. Therefore, the method applied in this paper to calculate the urban–rural integration development index by making a weighted summation is as follows:
X = 1 i = 1 8 W i · X i
X is the urban–rural integration development index, whose value range is [0, 1]. The bigger the index value is, the higher the integration degree of urban–rural development is. W i is the weight of the ith indicator X i , and W i is calculated by using entropy weight method.
The digital economy is a new type of economic form that has achieved technical integration, industrial integration, and the integration of producers and consumers. It takes digitized information as the core element of the production, information technology as the support, and the modern information network as the main carrier, and uses digitized technology to provide the products or services [39]. Therefore, the digital economy is indeed a comprehensive development product of informatization [40] and the internet [41], and the digital industry based on this [42]. Informatization provides hardware and software supports for the development of the digital economy, while the popularization degree of the internet decides the size of the potential markets in the digital economy. Informatization mainly includes infrastructure such as optical cables, base stations, talent teams, etc., and its influence is formed through businesses such as telecommunications, software, and so on. The popularization of the internet includes the popularization of internet devices at fixed terminals and mobile terminals, as well as the popularization of users. The development of digital industry can be measured by the popularization degree of enterprise websites and computers as well as the development state of e-commerce.
Based on this, this paper references the methods to select variables in the measurement system of digital economy development in the literature of Liu et al. [43] and Han et al. [44] and selects 14 subindicators that can reflect the development state of digital economy from three aspects: informatization construction, popularization of the internet, and development of digital industries, as shown in Table 2. Data are standardized as follows for the analysis of coupling-coordination degree:
Y i , t = y i , t y i , t   m i n y i , t   m a x y i , t   m i n
Therein, Y i , t is the ith subindicator in the tth year after being standardized; y i , t is the ith subindicator of the original data in the tth year; y i , t   m a x is the maximum value of the ith subindicator of the original data in the tth year; and y i , t   m i n is the minimum value of the ith subindicator of original data in the tth year. As there is an obvious logical progressive relationship at the indicator layer, this paper references the method of Liu et al. [43] and uses the digital economy development index, i.e., using the average-weight method to assign weights and perform linear weighting operations respectively at the element, indicator, and subindicator level.

Data Sources

The basic data of this paper originates from the “China Statistical Yearbook”, the “China Rural Areas Statistical Yearbook”, the “China urban-rural construction statistical yearbook”, and the “China Population and Employment Statistics Yearbook” of 2013–2020, and the average years of education of the urban and rural populations are measured and calculated by the treatment method mentioned in the “China National Human Development Report 2013” (See Note 2 in Table 1 for details). As the four municipalities directly under the central government, including Beijing, Shanghai, Tianjin, and Chongqing, have high degrees of urbanization and smaller rural areas, the statistical data of their rural areas is seriously deficient, and the agricultural and rural development in the two autonomous regions, including Tibet and Xinjiang, have their geographical and humanistic particularities. Therefore, after being sorted, the samples for this study cover the data of 25 provincial administrative units in China, excluding the six provinces and cities mentioned above and Hong Kong, Macao, and Taiwan.

3.2. Evaluation Methods

3.2.1. Coupling-Coordination Model

Coupling-coordination degree reflects the interaction degree among the subsystems in a coupling system, and the coupling effect and the coordination degree decide the evolution and development trends of the coupling system. The coupling effect refers to the strength of interaction among the subsystems. The coordination degree represents the degree to which the interactions of the subsystems promote the benign development of the subsystems. There is a complicated nonlinear coupling relationship between the subsystems of digital economy and urban–rural integration, therefore, this paper puts both in one framework and constructs the digital economy urban–rural integration coupling system. The coupling-coordination model can be expressed as,
D = C × T
C = ( U 1 × U 2 ( U 1 + U 2 2 ) 2 ) 1 2
T = α U 1 + β U 2
In Equation (4), D is the coupling-coordination level of the system, C is the coupling degree between the two subsystems, and T is the coordinating development degree between the two subsystems. U 1   a n d   U 2 are two values representing the two subsystems. Since both of the subsystems are major movers to achieve common prosperity and are of great significance in economic and social development, the undetermined coefficients, α and β, of both of the subsystems are set as 0.5. Referring to the criteria of research by Zhao et al. [45], Li and Zhang [46] and Han et al. [44], the coupling-coordination degree grades are divided as in Table 3.

3.2.2. Equations for Chronological Evolution

The digital economy urban–rural integration coupling system is a complicated system relationship, including the digital economy subsystem and the urban–rural integration subsystem. According to the system theory, this paper expresses the evolution equation of these two subsystems as:
U 1 ( X , t ) = d U 1 ( X ) d t
U 2 ( Y , t ) = d U 2 ( Y ) d t
In Equations (7) and (8), U 1 ( X , t ) and U 2 ( Y , t ) are respectively the evolution trends of the digital economy subsystem and the urban–rural integration subsystem under the joint influence of both endogenous and exogenous factors. Therefore, the evolution rate change equation of the two subsystems is:
V 1 ( X ) = d U 1 ( X , t ) d t
V 2 ( Y ) = d U 2 ( Y , t ) d t
In Equations (9) and (10), U 1 ( X , t ) and U 2 ( Y , t ) are respectively the evolution trends of the digital economy subsystem and the urban–rural integration subsystem under the joint influence of both endogenous and exogenous factors. V 1 ( X ) and V 2 ( Y ) are respectively the evolution rates.

3.2.3. Geographically Weighted Regression (GWR)

The geographically weighted regression model extends the lack of explanatory power of the traditional linear regression model for spatial independent variables and is able to reflect the change in the spatial regression relationship with spatial location. Its computational model is that:
y i = β 0 u i , v i + j = 1 k β k u i , v i x i j + ε i
In Equation (11), y i is the coupling-coordination degree of the digital economy and the urban–rural integration in the ith provincial district; x i j is the jth influencing factor of the coupling-coordination degree of i provincial district; u i , v i is the spatial geographic coordinates of province and region i; β k u i , v i is the jth regression parameter of the ith provincial district; and ε i is the random error term.

4. Results

4.1. Measurement of SubSystems

The level of subsystem development and its differences are the basis of the system coupling and coordination relations. Table 4 shows the subsystem development indices calculated on the basis of the previously described methodology and data. In order to emphasize the gap between the indices, the development indices of the two subsystems are written in the form of fractions in Table 4. The numerator and denominator denote the digital economy development index and the urban–rural integration development index, respectively. Further, the national average is also calculated in Table 4.
The results of the two development index measurements show the characteristics of synchronous and different speeds. First, the national averages are synchronized with different speeds. In terms of growth trends, both have undergone an evolutionary process of development from a lower level to a higher level. The digital economy development index has increased from 0.128 in 2013 to 0.348 in 2020, while the urban–rural integration subsystem has fluctuated from 0.180 in 2013 to 0.203 in 2020. In 2013, the development level of the digital economy subsystem was lower than that of the urban–rural integration subsystem, though the difference between the two gradually narrowed during the evolution of system development. Since 2015, the digital economy development index has exceeded the urban–rural integration development index from the national average.
The characteristic of synchronization with different speeds also applies at the provincial level. Most of the sample provinces, with the exception of six provinces and regions, have received different degrees of improvement in both development indices. Heilongjiang, Fujian, Inner Mongolia, Qinghai, Henan, and Jiangxi saw their urban–rural integration levels decline, though only marginally. It should be emphasized that the differences in growth rates are not only between the two development indices of the same provinces but also between different provinces. The above analysis shows that the development evolution of the two subsystems shows a more complex correlation of homogeneous changes. This may be due to the changes in the relationship between the two. Therefore, further research on the coupled coordination relationship between the digital economy and urban–rural integration is necessary.

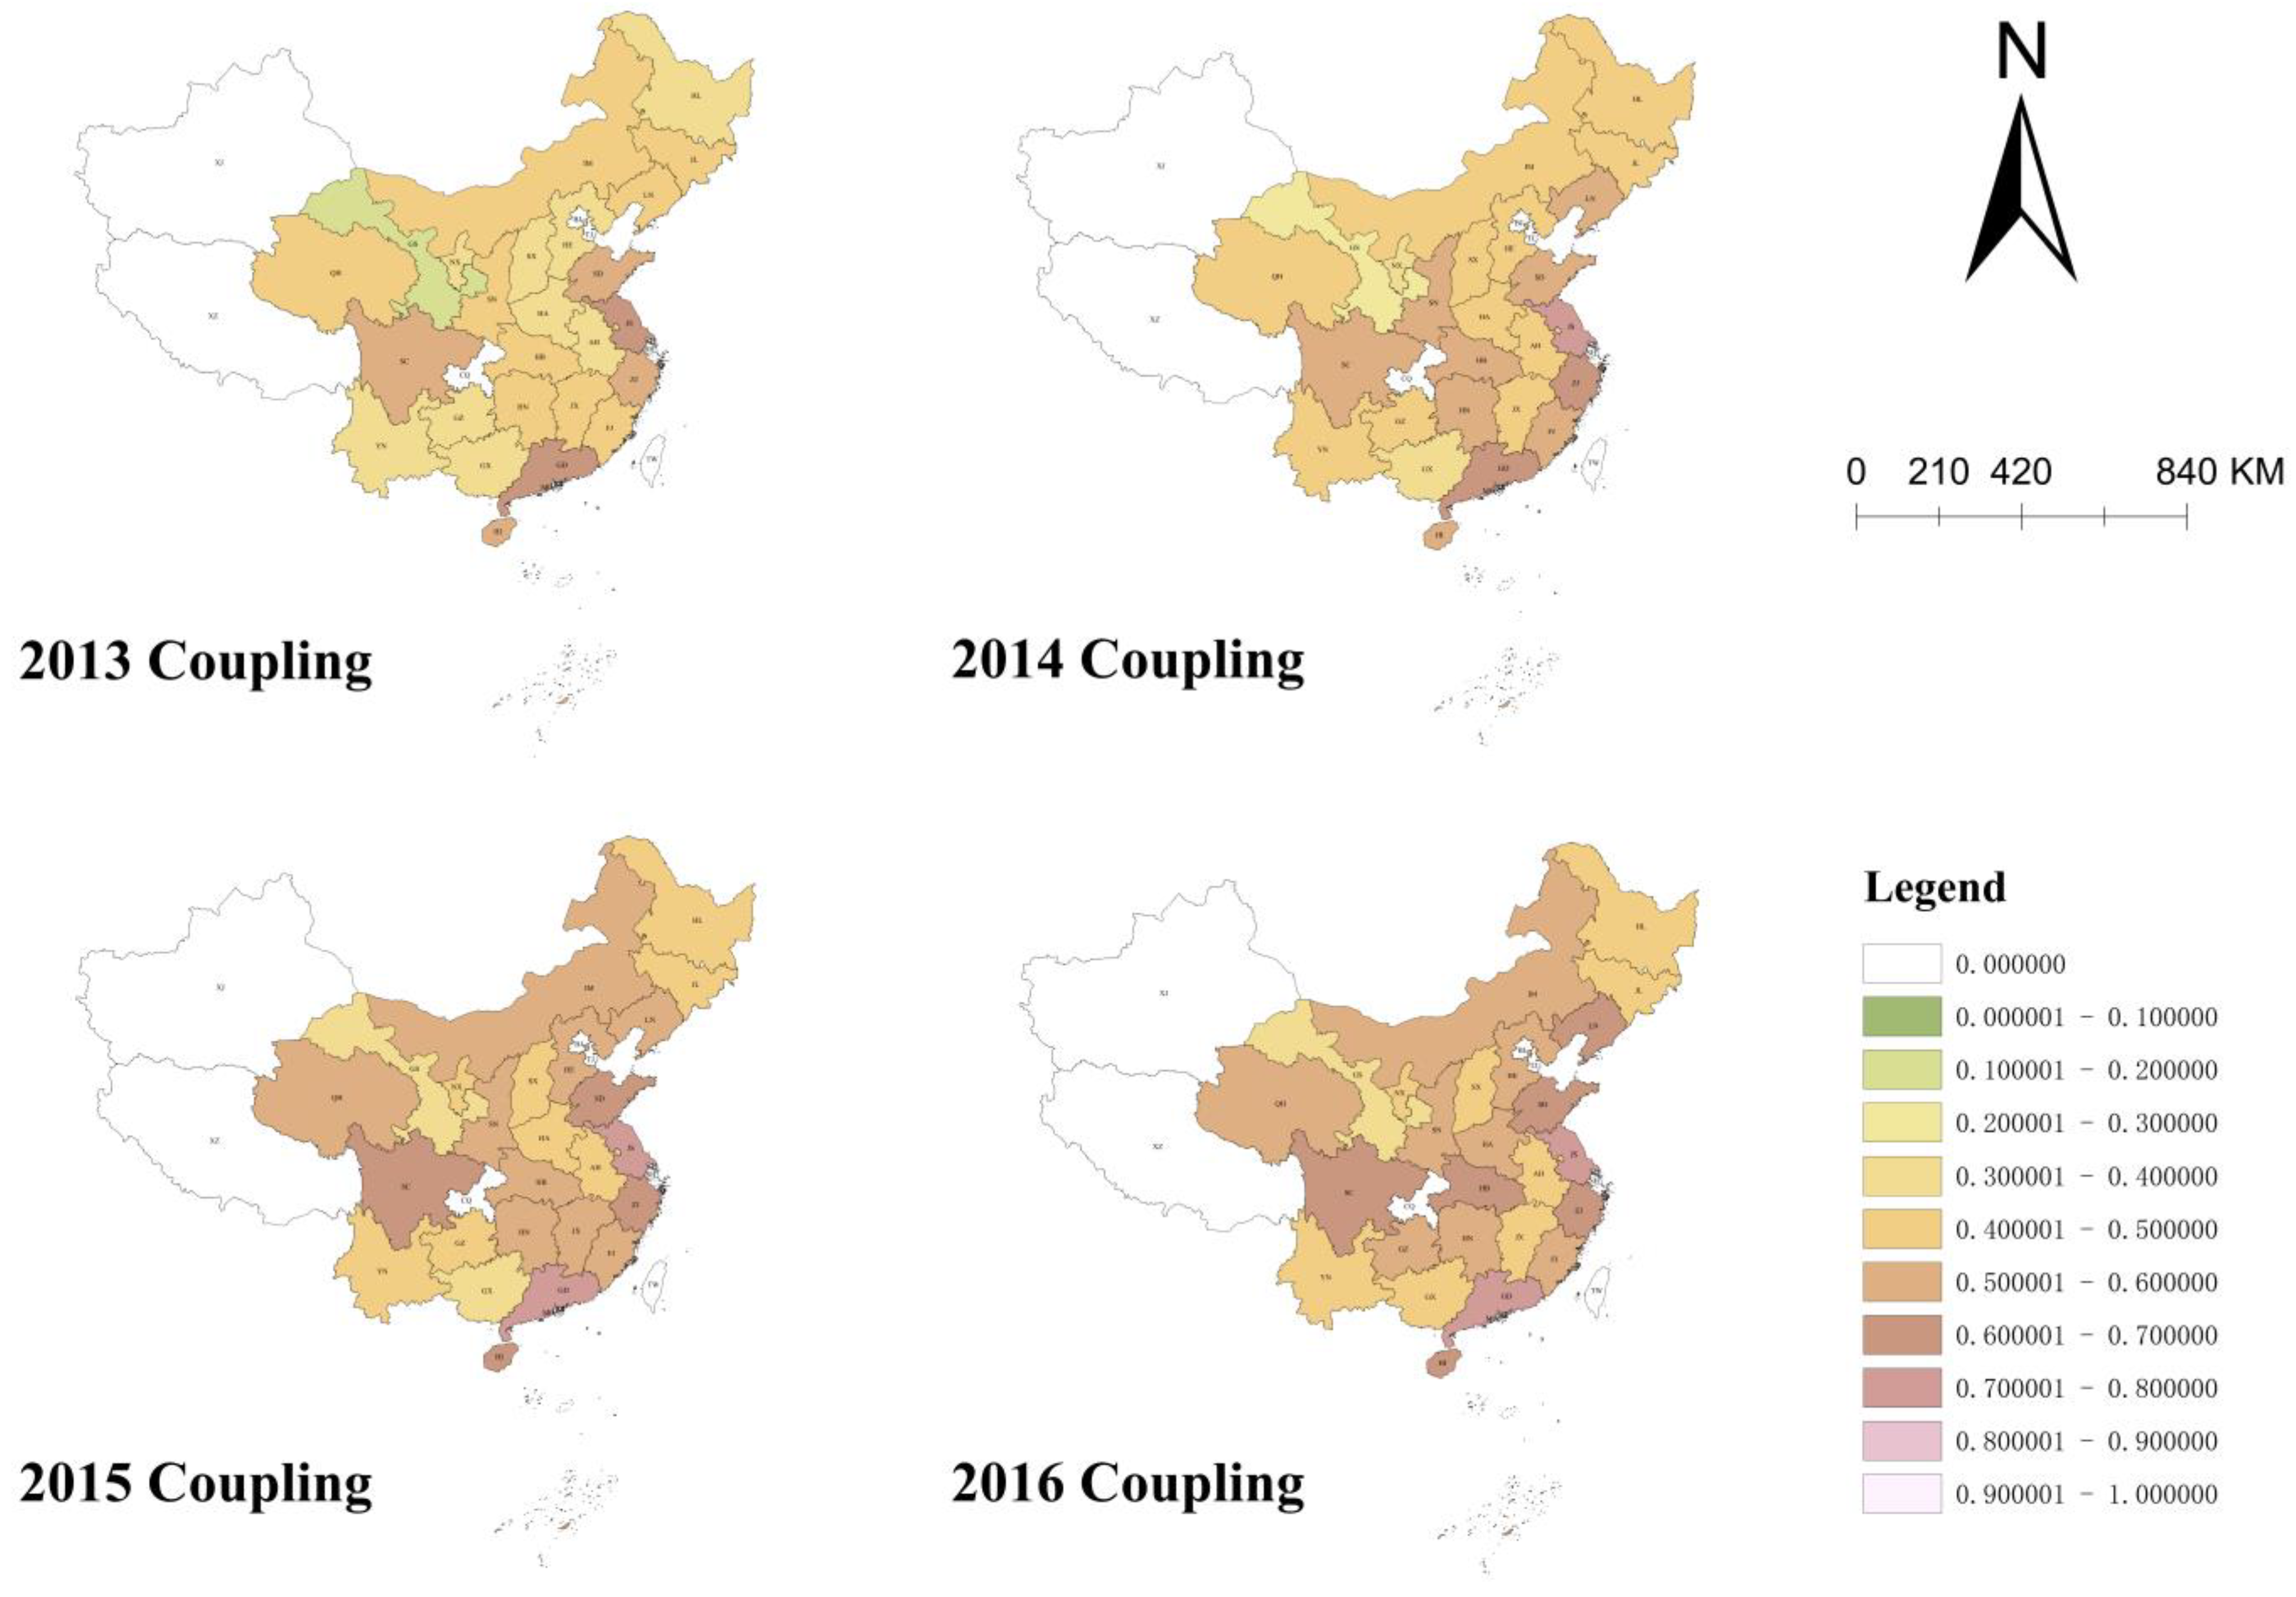
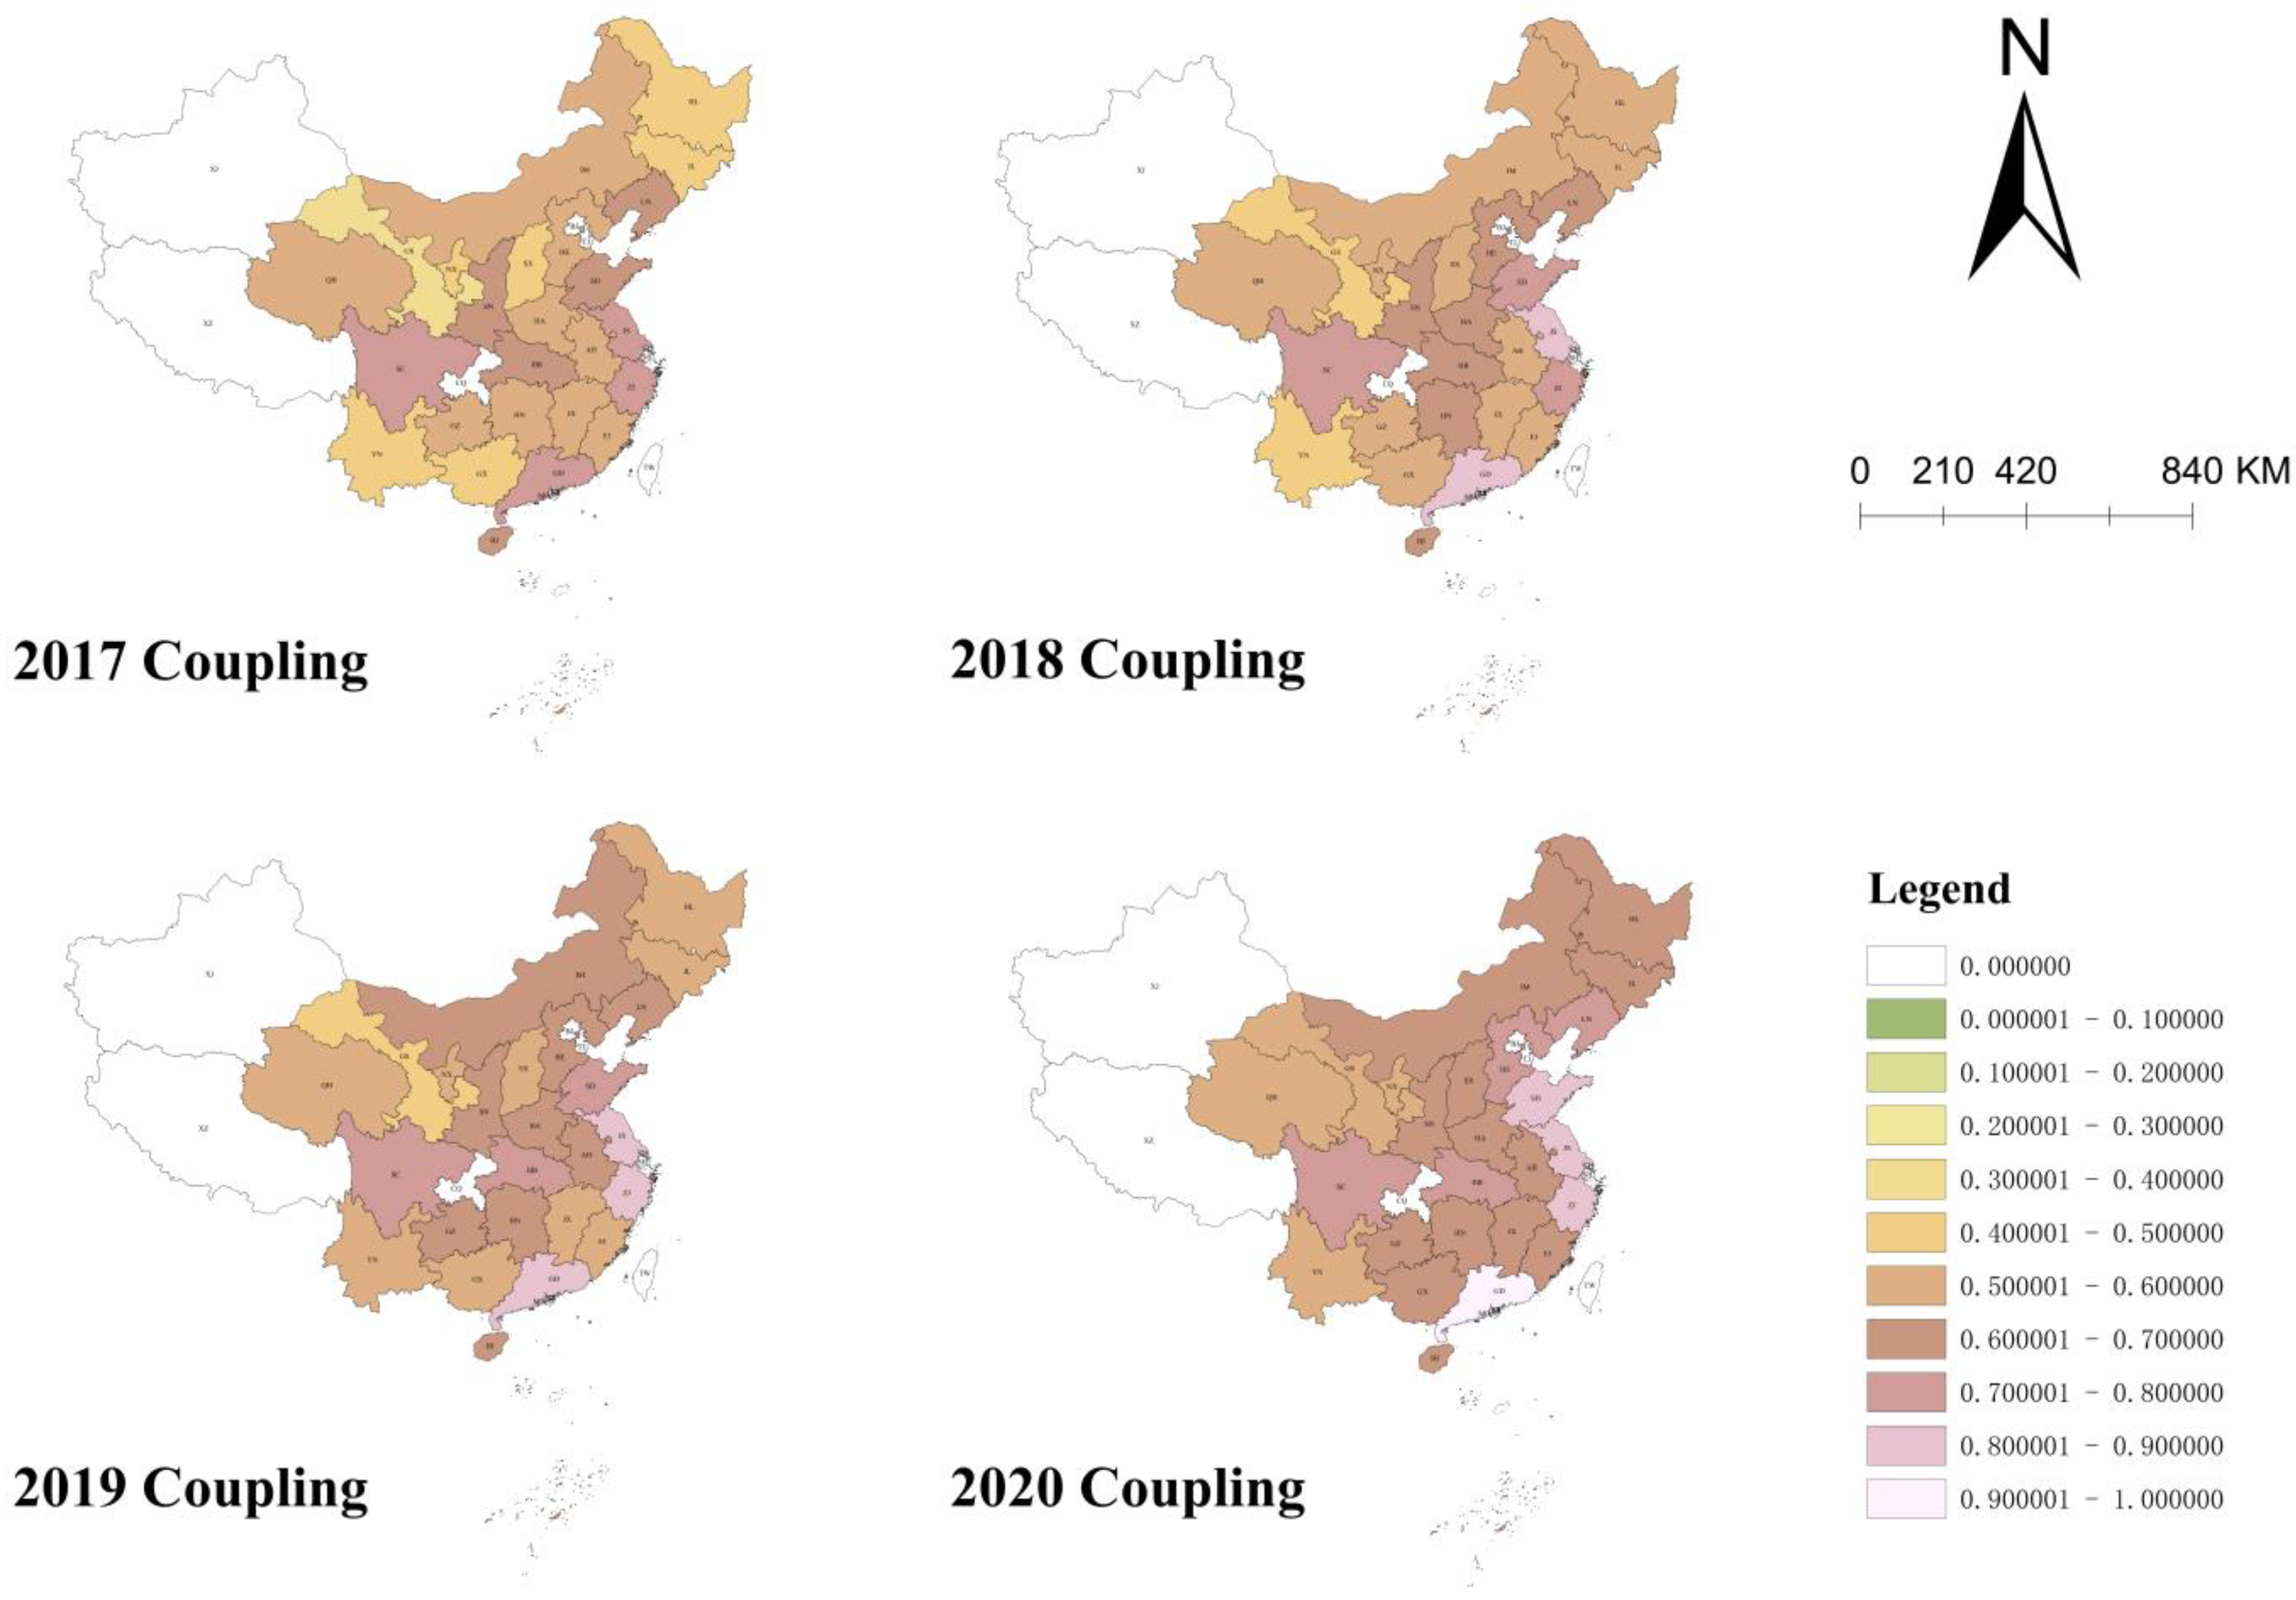
4.2. Coupling-Coordination Analysis

There are complex interactions between the digital economy and urban–rural integration. In this paper, the interrelationship between the digital economy subsystem and the urban–rural integration subsystem is measured and analyzed by provinces and regions using the coupling-coordination degree model. Table 5 shows the calculated results and national average values of the coupling-coordination degree between the digital economy subsystem and the urban–rural integration subsystem in each province and region. From an overall perspective, the mean value of the coupling-coordination degree between the digital economy and urban–rural integration in China from 2013 to 2020 increased from 0.427 to 0.680, an increase of 59.25%. The coupling-coordination relationship between China’s digital economy and urban–rural coordination developed from the antagonistic stage of near dissonance to the high-level coupling stage of primary coordination.
Figure 2 shows more intuitively the provincial spatial and temporal distribution characteristics of digital economy and urban–rural coordination. The colors of the color blocks in each province and region all deepen over time. This indicates that the coupling-coordination relationship between each province and region has improved between 2013 and 2020. However, there are significant inter-provincial spatial differences in the coupled coordination relationship between the digital economy and urban–rural integration. From the heat map (Figure 2), the level of coupling coordination in the southeastern coastal provinces of Shandong, Jiangsu, Zhejiang, Fujian, and Guangdong is at a relatively high value in 2013. The other provinces in the sample that also had relatively high values in 2013 were Sichuan, an important province in the southwest. In the following eight years, the coupling coordination of these six provinces remains at relatively high levels. Looking at the heat map over the years, we can see that the distribution of the coupling-coordination degree of the sample provinces in the eight years shows a pattern of growth centered on the above six provinces and spreading around.

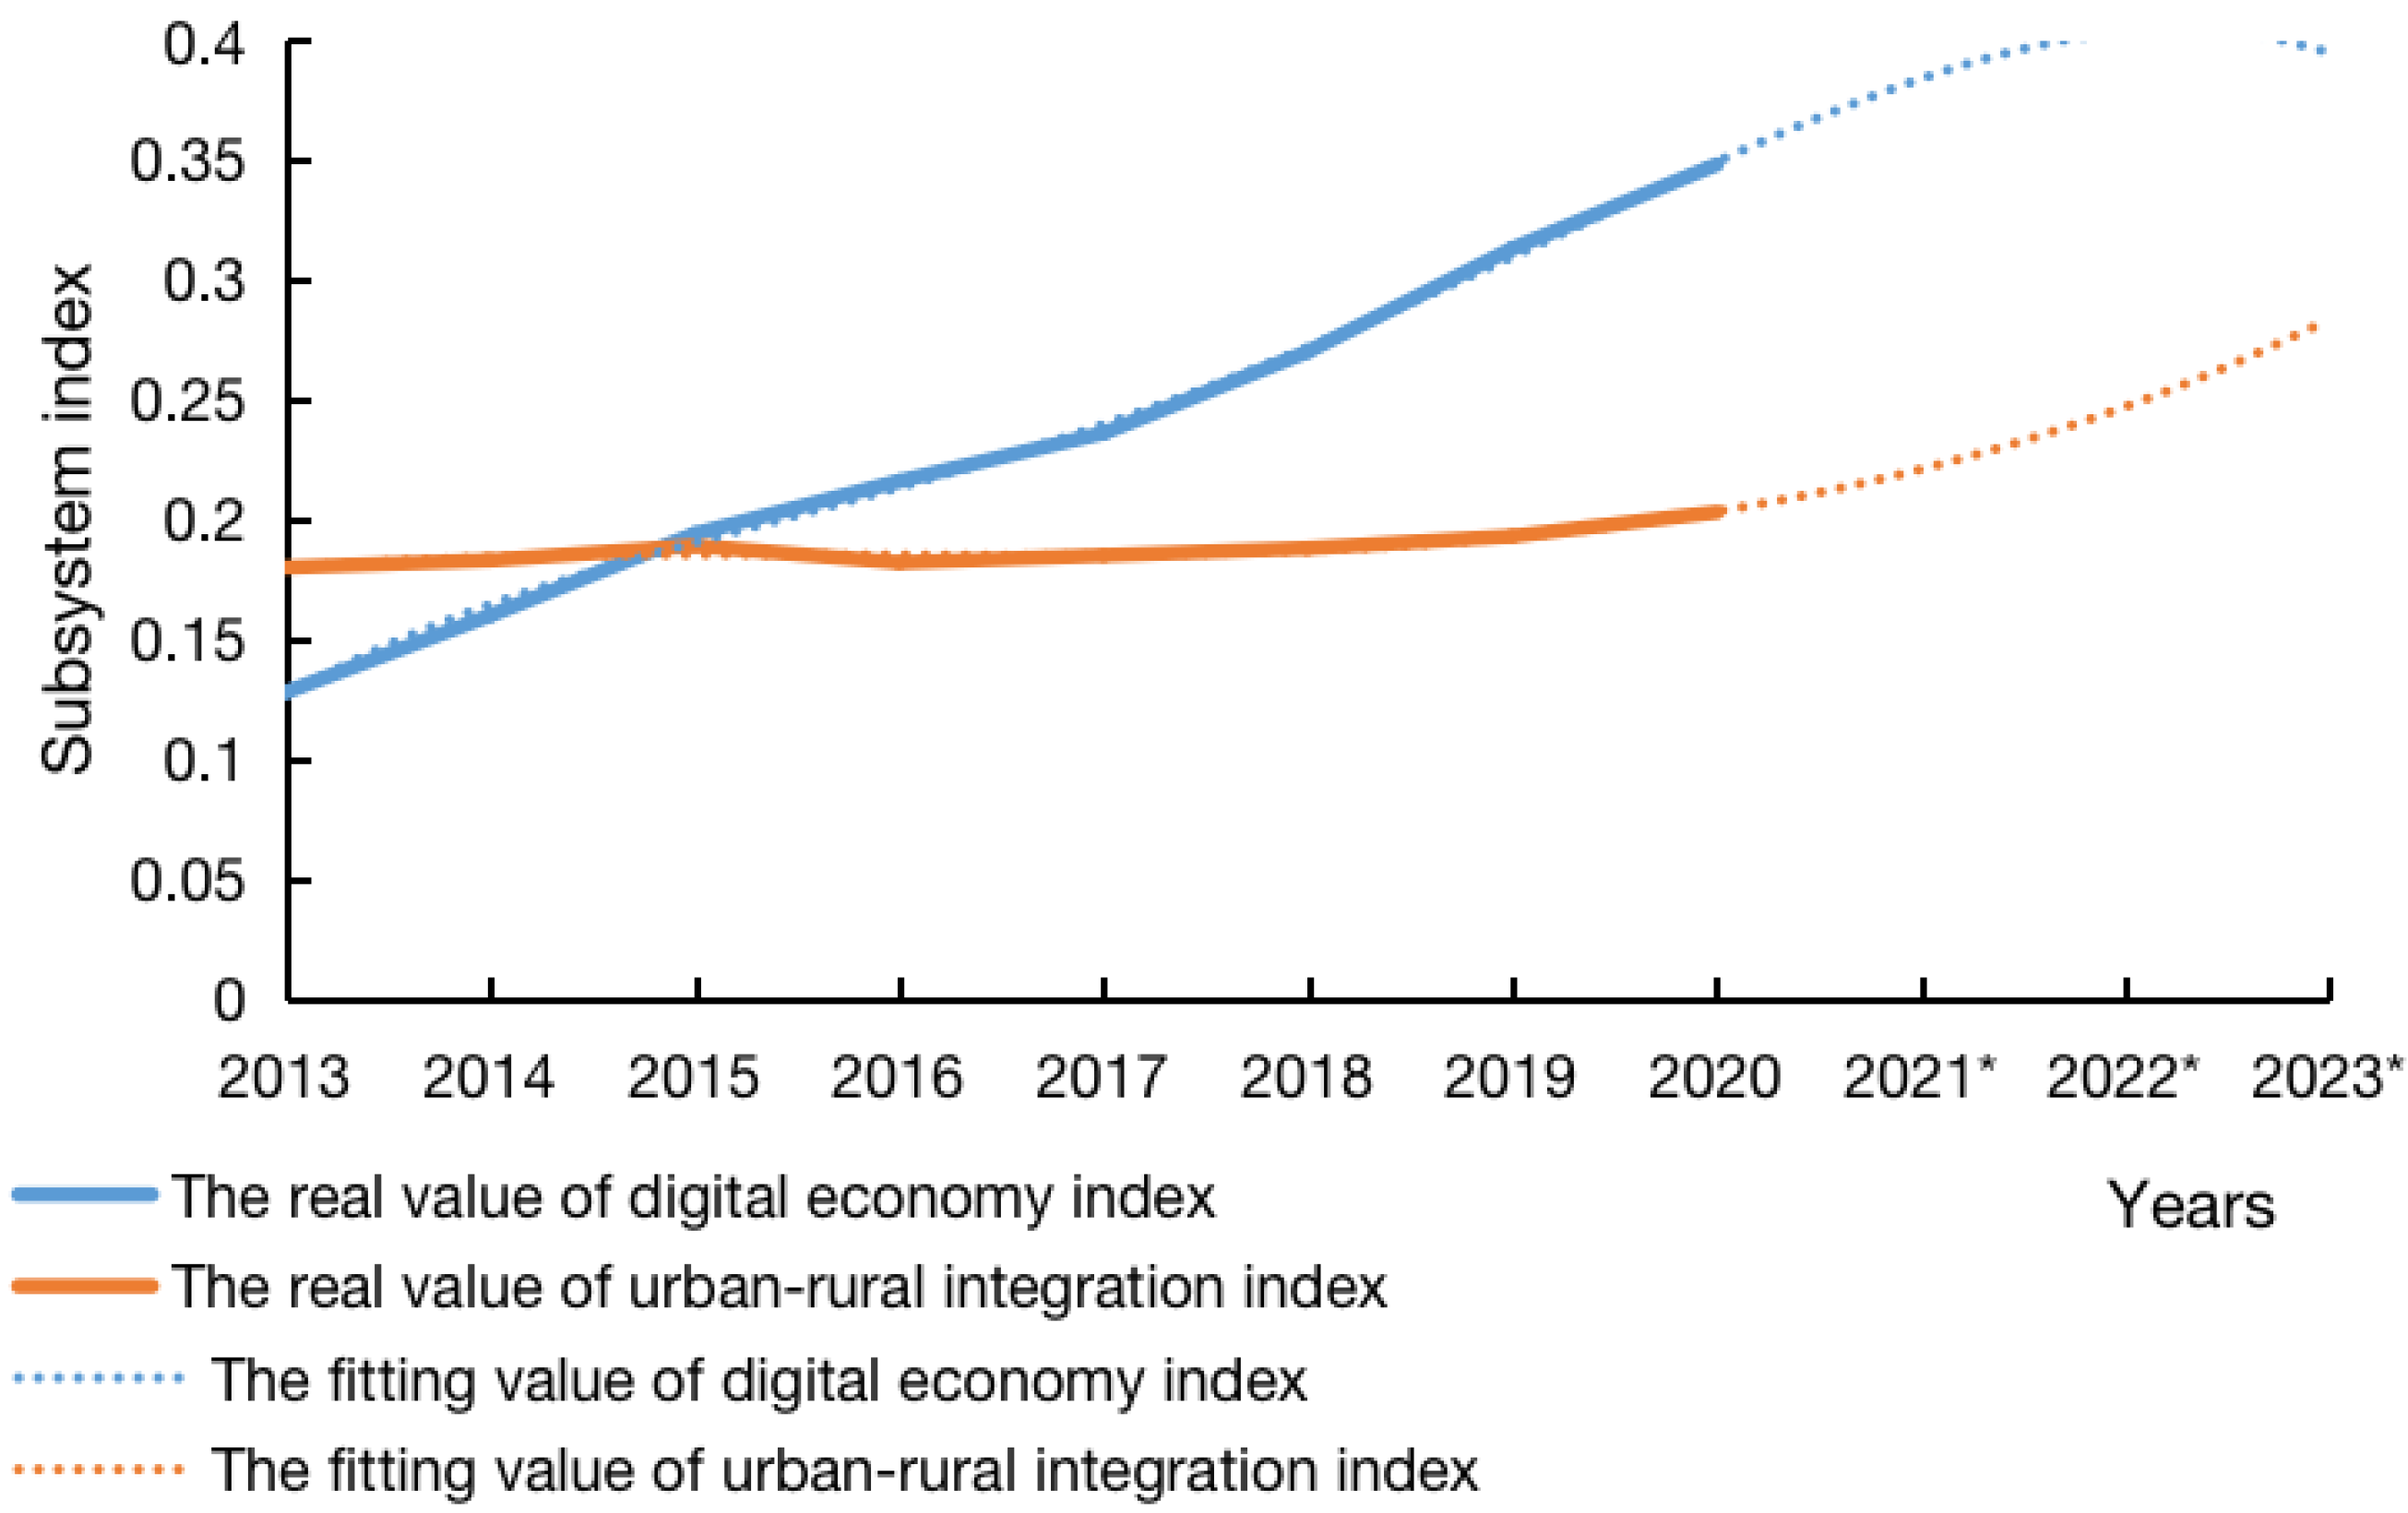
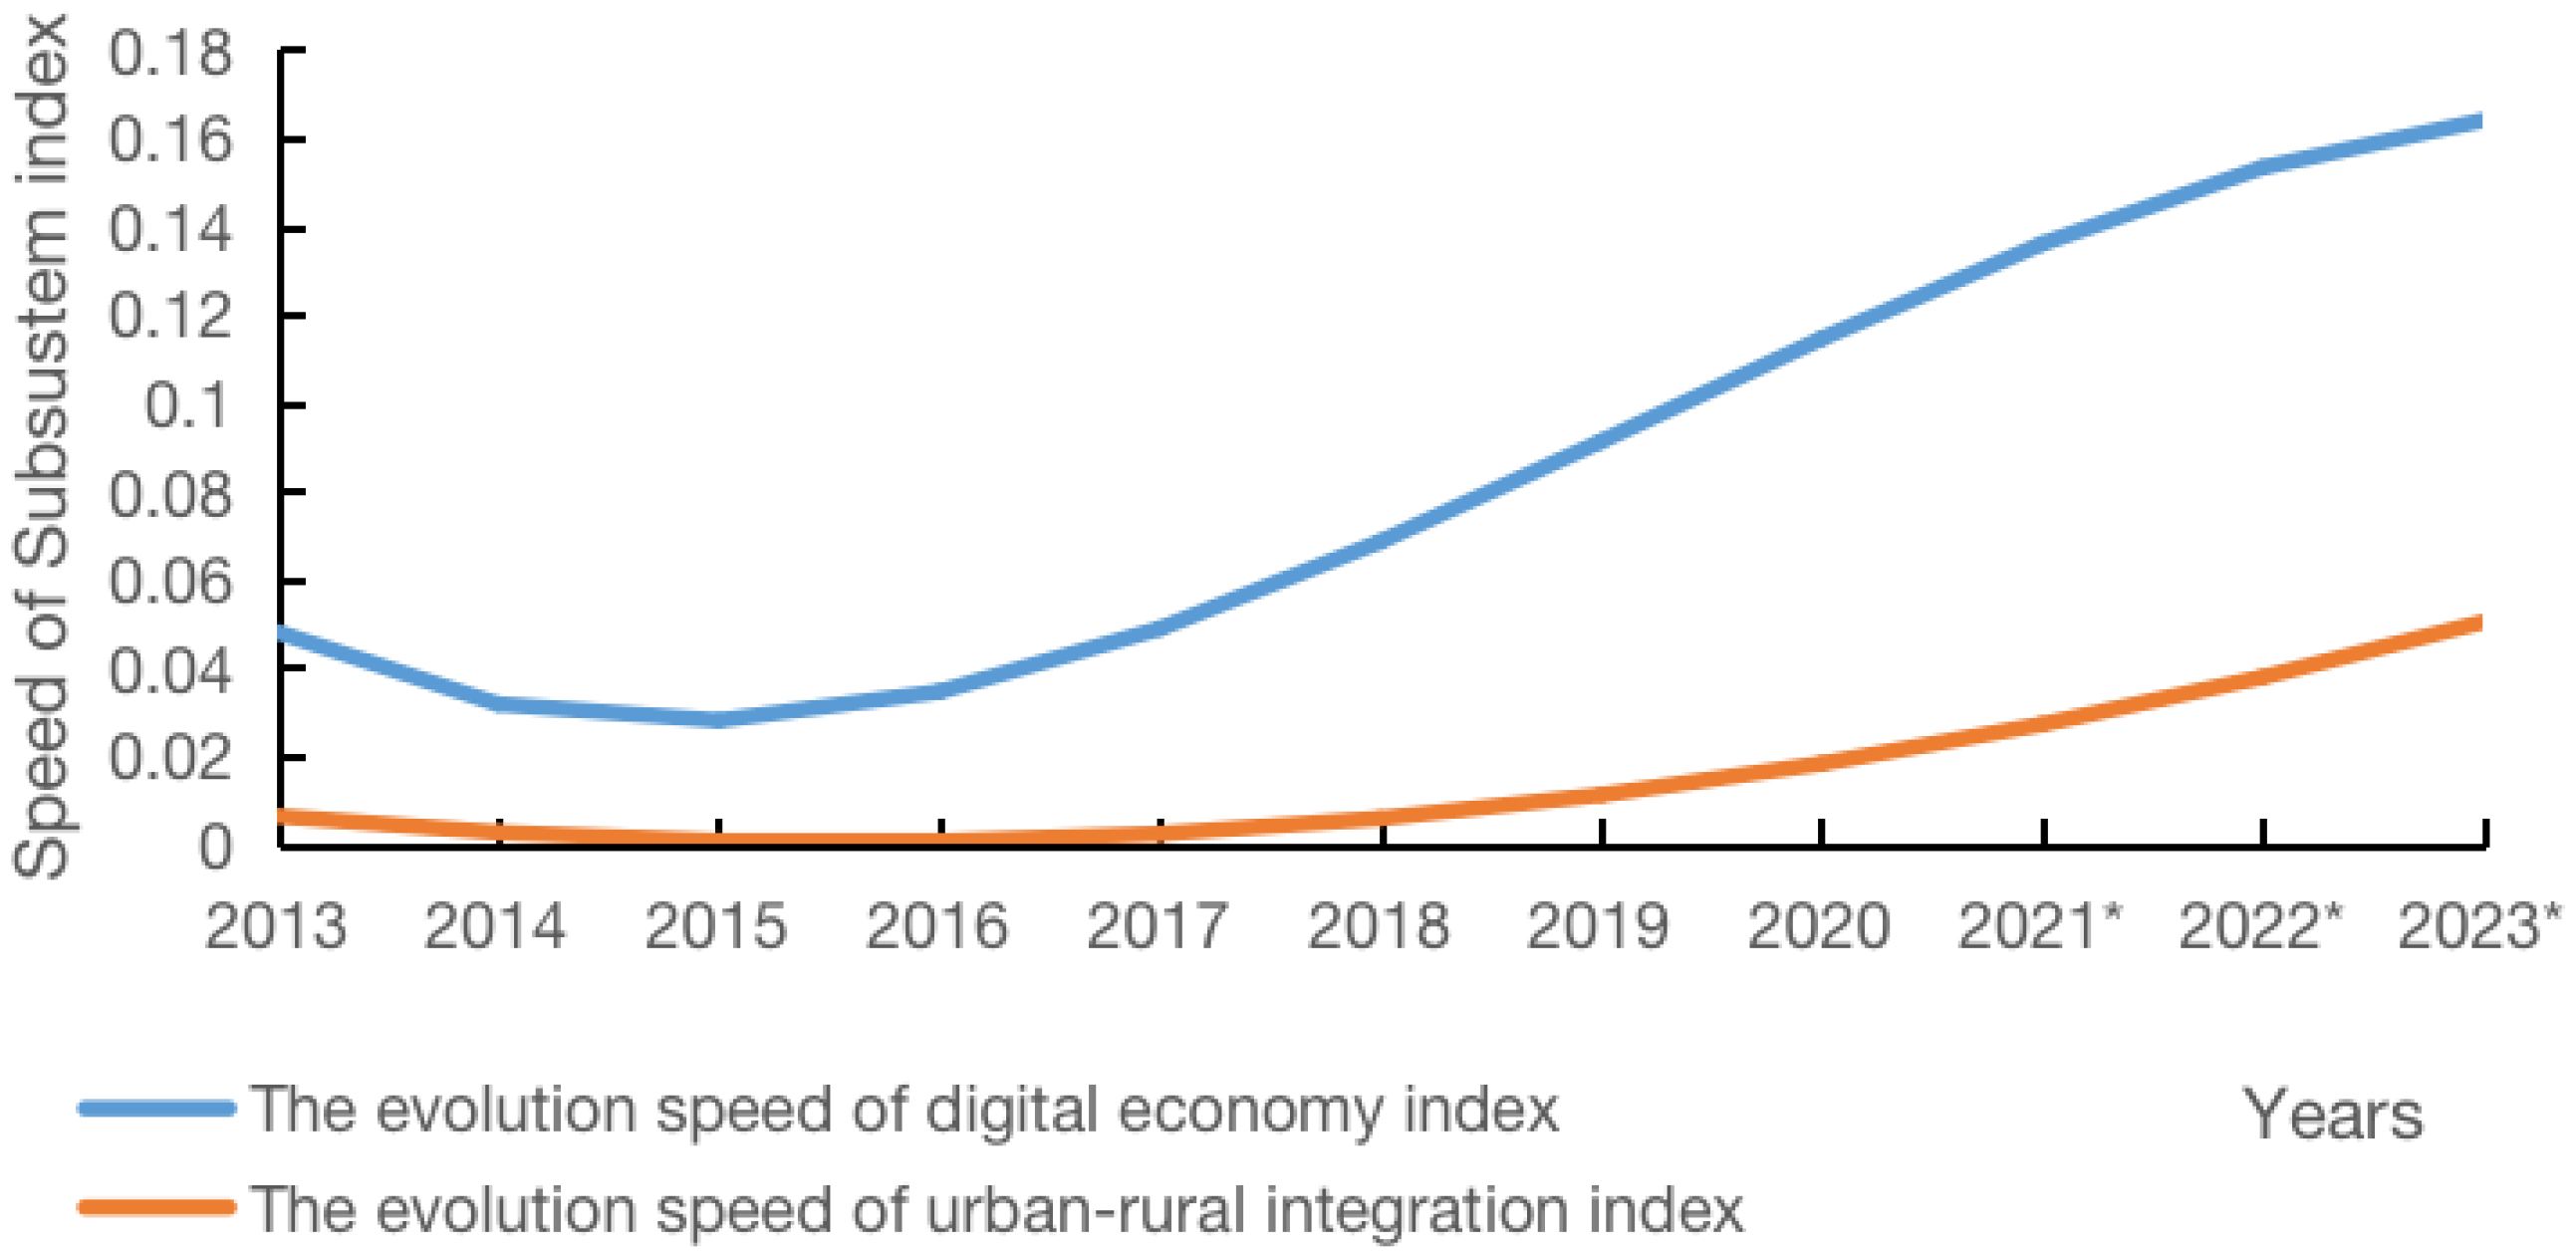
4.3. Equations for Chronological Evolution

Fitting the subsystem evolution trend equation can help clarify the movement and change the trend of the subsystems. Chronological evolution trends of subsystems of the digital economy and urban–rural integration respectively. The comparison of fitting results needs to take into account both the fitting and predictive ability as the purpose. After comparing the fitting results cross these functions, it is found that the goodness of fit of the fourth-order power function of digital economy subsystems is 0.9982. And the goodness of fit of the third-order power function of the urban–rural integration subsystem is 0.9336. At this time, the function has the better fitting and predictive ability. Therefore, the chronological evolution equations of the digital economy subsystems and urban–rural integration subsystems are respectively as follows:
F x , t = 0.0001 t 4 + 0.0029 t 3 0.0198 t 2 + 0.0793 t + 0.0645 R 2 = 0.9982
G y , t = 0.0003 t 3 0.0032 t 2 0.0118 t + 0.1711 R 2 = 0.9336
In Equations (12) and (13), F(x, t) and G (y, t) represent, respectively, the path of the evolution and development of digital economy and urban–rural integration over time. Take the derivative of the chronological evolution fitting equation and obtain the fitting function of the chronological evolution speed of each subsystem.
f x , t = 0.0004 t 3 + 0.0087 t 2 0.0396 t + 0.0793
g y , t = 0.0009 t 23 0.0064 t 0.0118
Equations (14) and (15) represent the development and evolution speed of the digital economy subsystem and urban–rural integration subsystem, respectively. Based on Equations (12)–(15), Figure 3 and Figure 4 show, respectively, the chronological evolution trend and the evolution speed change law of the subsystems from 2013 to 2020 and use the fit line to predict the relevant data from 2021 to 2023. In Figure 3, the fit line coincides highly with the actual curve height, which means that the fit curve perfectly concludes the actual evolution trend of the subsystems. In terms of development trends, the digital economy development index from 2013 to 2015 exceeded that of urban–rural integration at a faster rate and kept increasing continuously ever after. After an early slight downward fluctuation, the urban–rural integration index started to increase in 2016. This verified the conclusion drawn earlier in this paper that the coupling-coordination relation of China’s digital economy and urban–rural integration develops from the antagonism stage on the verge of imbalance to the high-level coupling stage with primary coordination. The predictive data shows that after 2020, the curves of the digital economy subsystems and the urban–rural integration subsystems tended to be parallel to each other. It means that the evolution trends of these two not only share the same direction but also follow the trend that a gradual widening gap is suppressed step by step. This can help to form a benign interaction of high-level coupling coordination.
In Figure 4, the development and evolution speed curves of the digital economy subsystem and the urban–rural integration subsystem are similar. However, the development and evolution speed of the digital economy subsystem is always higher than that of the urban–rural integration subsystem, and the coupling-coordination relation between these two has not reached the optimal state. It states that, as two major measures to facilitate the achievement of common prosperity, though there are already many policies and measures supporting the development of the digital economy and urban–rural integration, it is still difficult to achieve the high-level coordinated development of these two in the current coupling environment. This conclusion shows that there is still space to improve the interactive relation by enhancing the top-level design and improving the infrastructure construction and then achieving high-level coordination development. The predictive value tells us that, after increasing rapidly for a period, the development and evolution speed of the digital economy subsystem tends to flatten out after 2022. Meanwhile, the development and evolution speed of urban–rural integration subsystems keeps growing rapidly. Therefore, after a longer period, these two may enter a high-speed and high-level stage of coupling-integration development.

4.4. Driving-Force Analysis of the Coupling-Coordination Degree

The further geographically-driven analysis is useful to identify the key factors affecting the coupled and coordinated development of the digital economy and urban–rural integration, thus providing evidence for policy formulation. In this paper, a geographically weighted regression of factors influencing the coupled coordination of the digital economy and urban–rural integration is conducted using Stata software. The dependent variable of this regression is the degree of coupled coordination between the digital economy and urban–rural integration. The independent variable is the factor-level indicator of the digital economy and urban–rural integration. It is particularly important to explain that the avoidance of endogeneity among indicators under the same factor is the reason for choosing the factor rather than indicator as the dependent variable. One of the independent variables related to urban–rural integration in the raw data is the coefficient of variation between urban and rural areas. A larger coefficient of variation represents a larger urban–rural difference, that is, a lower level of urban–rural integration. We used one; this coefficient of variation in the previous section to measure the level of development of the urban–rural integration subsystem. Here we use the original values so that negative coefficients of rational distribution, balanced growth, and equalization of public services indicate a positive effect on the improvement of coupling coordination. Due to the potential spatial variation characteristics of the digital economy and urban–rural integration, the regression-using traditional fixed-effects model may ignore the influence of spatial differences on the regression results, so the panel GWR model with fixed effects is used.
Table 6 shows the regression results. The regression results show that, except for internet penetration, the improvement of all other factors plays a significant positive role in the improvement of the coupling coordination between the digital economy and urban–rural integration (as mentioned earlier, urban–rural integration uses the coefficient of variation of the urban–rural gap, and the smaller the coefficient the better the level of urban–rural integration). Among them, information technology construction plays the biggest role, and the improvement of the unit of information-technology construction level will drive the change of coupling-coordination degree twice. This is followed by rational distribution, balanced growth, equalization of public services, and digital-industry development in that order. This reveals that further informatization should be carried out in cities and villages. At the same time, digital technology should be used to solve problems in the areas of rational distribution, balanced growth, and equalization of public services, and to continuously expand the market of digital technology and digital economy applications. The popularity of the internet has played a significant negative role in the improvement of the coupling and coordination between the digital economy and urban–rural integration. This implies the need to regulate and guide the development of the internet and promote the realization of internet dividends to be shared by all citizens.

5. Conclusions and Discussion

5.1. Conclusions

The work done in this paper has three main parts. First, the evaluation-index system of the digital economy and urban–rural integration is established and the development index of both is measured using the data of Chinese provincial administrative regions from 2013 to 2020. Second, this paper uses the coupling-coordination degree model to calculate the coupling-coordination degree of the digital economy and urban–rural integration for the sample provinces in China from 2013 to 2020. Third, this paper proposes the interaction mechanism between the digital economy and urban–rural integration and uses it as a framework to explore the characteristics of the coupling and coordination degree of the two.
Based on the above research, this paper mainly obtains the following conclusions.
First, the development level of the digital economy and urban–rural integration in China has been greatly improved. The development levels of the two subsystems are characterized by the same trend of change but different rates of change in both the national average and each province.
Second, the coupled coordination of China’s digital economy and urban–rural integration has been significantly improved, though there are differences in the magnitude of improvement. The national average develops from the antagonistic stage on the verge of dissonance to the high-level coupling stage of primary coordination. The improvement in the level of coupling coordination shows a pattern of spreading around the six relatively high-value provinces of Shandong, Jiangsu, Zhejiang, Fujian, Guangdong, and Sichuan.
Third, in terms of time trends, the coupling-coordination degree of the digital economy and urban–rural integration still has sufficient room for upward movement and continuous improvement. After a longer period of development, the coupling-coordination degree may enter a higher level of the coupling-coordination development stage.
Fourth, information construction, rational distribution, balanced growth, equalization of public services, and digital industry development are the main driving forces for the improvement of the coupling-coordination degree in turn. The popularity of the internet brings a significant negative effect on the coupling-coordination degree.
Therefore, this paper suggests the formulation of policies to promote the construction of information technology, rational distribution, balanced growth, equalization of public services, and digital industry development. To strengthen the guidance and regulation of internet universality and promote the sharing of internet dividends.

5.2. Discussion

The development of China’s digital economy and the coordination of urban–rural relations are at a critical stage. Both “Digital China” and “urban-rural integration” have become national strategies. In the foreseeable future, they will together constitute the new fulcrum of China’s economic development. In view of this, this paper analyzes the comprehensive level of the development of the digital economy and urban–rural integration in China from 2013 to 2020 and the characteristics of the changes in the coupling and coordination degree of the two and analyzes the driving forces affecting the changes in the coupling and coordination degree of the digital economy and urban–rural integration using a spatial regression model. This can provide a scientific basis for the implementation of the digital economy and urban–rural integration strategies, and further enrich the theoretical connotation of the research on the relationship between the two. On a broader level, the coordinated development of the digital economy and urban–rural integration will facilitate the sharing of the fruits of economic development between cities and villages and enhance the sustainability of economic development and people’s wellbeing. However, limited by the availability of data, this paper cannot statistically investigate the provincial spatial distribution characteristics of their coupling-coordination degree (spatial autocorrelation requires more than 30 individuals). In the future, comparative studies at different spatial scales can be conducted on related topics to reveal more deeply the regional differences, spatiotemporal evolution trends, and driving mechanisms of their coupled coordination relationship. Meanwhile, this paper attempts to construct the mechanism of the role of the digital economy and urban–rural integration is still in the exploration stage and not perfect. In the future, a scientific and systematic mechanism should be further constructed to maximize the rationality and credibility of the research results.

Author Contributions

Conceptualization, J.M.; methodology, J.M. and Y.S.; software, J.M.; validation, J.M., J.L. and B.C.; formal analysis, J.M.; resources, J.M.; data curation, J.M. and Y.S.; writing—original draft preparation, J.M.; writing—review and editing, J.M., S.S. and B.C.; visualization, J.M.; supervision, J.L.; project administration, J.L. All authors have read and agreed to the published version of the manuscript.

Funding

This research received no external funding.

Institutional Review Board Statement

Not applicable.

Informed Consent Statement

Not applicable.

Data Availability Statement

The data presented in this study are available upon request from the corresponding author.

Acknowledgments

This work has been assisted by the China–ASEAN High-Quality Develop-ment Research Center at Shandong University of Finance and Economics and the “Theoretical Economics Research Innovation Team” of the Youth Innovation Talent Introduction and Educa-tion Plan of Colleges and Universities in Shandong Province for financial support, as well as the Faculty of Economics and the Centre of Excellence in Econometrics at Chiang Mai University.

Conflicts of Interest

The authors declare no conflict of interest.

References

  1. Zou, J.; Deng, X. To inhibit or to promote: How does the digital economy affect urban migrant integration in China? Technol. Forecast. Soc. 2022, 179, 121647. [Google Scholar] [CrossRef]
  2. Wan, G.H.; Lu, M.; Chen, Z. Globalization and Regional Income Inequality: Empirical Evidence from within China. Rev. Income Wealth 2007, 53, 35–59. [Google Scholar] [CrossRef]
  3. Lu, H.; Zhao, P.; Hu, H.; Zeng, L.; Wu, K.S.; Lv, D. Transport infrastructure and urban-rural income disparity: A municipal-level analysis in China. J. Transp. Geogr. 2022, 99, 103292. [Google Scholar] [CrossRef]
  4. PRC NDRC. Fourteenth Five Year Plan for Digital Economy Development. 2022. Available online: https://www.ndrc.gov.cn/fggz/fzzlgh/gjjzxgh/202203/t20220325_1320207_ext.html (accessed on 20 March 2023).
  5. Tapscott, D. The digital economy: Promise and peril in the age of networked intelligence. Educom Rev. 1996, 31, 52–54. [Google Scholar]
  6. Lane, N. Advancing the Digital Economy into the 21st Century. Inf. Syst. Front. 1999, 1, 317–320. [Google Scholar] [CrossRef]
  7. Teo, T.S.H. Understanding the Digital Economy: Data, Tools, and Research. Asia Pac. J. Manag. 2001, 18, 553–555. [Google Scholar] [CrossRef]
  8. Cheon, B.Y.; Kim, H.W. Digital Economy and Job Creation; Korea Labor Institute: Sejong-si, Republic of Korea, 2003; Volume 4, pp. 1–222. [Google Scholar]
  9. G20 Research Group. G20 Digital Economy Development and Cooperation Initiative. G20 Research Group at the University of Toronto. 2016. Available online: http://www.cac.gov.cn/2016-09/29/c_1119648520.htm (accessed on 20 March 2023).
  10. OECD. OECD Digital Economy Outlook 2017, 1st ed.; OECD Publishing: Paris, France, 2017; pp. 10–26. [Google Scholar]
  11. Eurostat. Digital Economy & Society in the EU—A Browse through Our Online World in Figures; Eurostat: Luxembourg, 2017; pp. 8–15. [Google Scholar]
  12. Hanna, N. Assessing the digital economy: Aims, frameworks, pilots, results, and lessons. J. Innov. Entrep. 2020, 9, 16. [Google Scholar] [CrossRef] [PubMed]
  13. Zonneveld, W.; Stead, D. European territorial cooperation and the concept of urban–rural relationships. Plan. Pract. Res. 2007, 22, 439–453. [Google Scholar] [CrossRef]
  14. Smith, A. An inquiry into the nature and causes of the wealth of nations. J. Early Repub. 1976, 35, 1–23. [Google Scholar]
  15. Mylott, E. Urban Rural Connections: A Review of the Literature. 2009. Available online: https://www.academia.edu/27817208/Urban_rural_connections_a_review_of_the_literature (accessed on 11 September 2022).
  16. Syrquin, M.; Chenery, H.B. Patterns of Development, 1950 to 1983; Discussion Papers; World Bank: Washington, DC, USA, 1989; Volume 4, p. e867. [Google Scholar]
  17. Lewis, W.A. Economic development with unlimited supplies of labour. Manch. Sch. Econ. Soc. Stud. 1954, 22, 39–191. [Google Scholar] [CrossRef]
  18. Ranis, G.; Fei, J.C. A theory of economic development. Am. Econ. Rev. 1961, 51, 533–565. [Google Scholar]
  19. Douglass, M. A regional network strategy for reciprocal rural-urban linkages: An agenda for policy research with reference to Indonesia. In The Earthscan Reader in Rural–Urban Linkages; Routledge: London, UK, 1998; Volume 20, pp. 1–34. [Google Scholar]
  20. McGee, T.G. The Emergence of Desakota Regions in Asia: Expanding a Hypothesis; University of Hawaii Press: Honolulu, HI, USA, 1991. [Google Scholar]
  21. Lynch, K. Rural-Urban Interaction in the Developing World; Routledge: London, UK, 2005. [Google Scholar]
  22. Du, B.; Wang, Y.; He, J.; Li, W.; Chen, X. Spatio-temporal characteristics and obstacle factors of the urban-rural integration of China’s shrinking cities in the context of sustainable development. Sustainability 2021, 13, 4203. [Google Scholar] [CrossRef]
  23. Krugman, P. Increasing returns and economic geography. J. Political Econ. 1991, 99, 483–499. [Google Scholar] [CrossRef]
  24. Fujita, M.; Krugman, P.; Venables, A. The Spatial Economy: Cities, Regions and International Trade, 1st ed.; MIT Press: Cambridge, UK, 1999; pp. 5–15. [Google Scholar]
  25. Glaeser, E. Cities, Agglomeration and Spatial Equilibrium, 1st ed.; Oxford University Press: Oxford, UK, 2008; pp. 7–10. [Google Scholar]
  26. Fang, C. On integrated urban and rural development. J. Geogr. Sci. 2022, 32, 1411–1426. [Google Scholar] [CrossRef]
  27. Liu, Y. Research on the urban-rural integration and rural revitalization in the new era in China. Acta Geogr. Sin. 2018, 73, 637–650. [Google Scholar]
  28. Yang, Y.; Bao, W.; Wang, Y.; Liu, Y. Measurement of urban-rural integration level and its spatial differentiation in China in the new century. Habitat. Int. 2021, 117, 102420. [Google Scholar] [CrossRef]
  29. Ma, L.; Liu, S.; Fang, F.; Che, X.; Chen, M. Evaluation of urban-rural difference and integration based on quality of life. Sustain. Cities Soc. 2020, 54, 101877. [Google Scholar] [CrossRef]
  30. He, Y.; Zhou, G.; Tang, C.; Fan, S.; Guo, X. The spatial organization pattern of urban-rural integration in urban agglomerations in China: An agglomeration-diffusion analysis of the population and firms. Habitat. Int. 2019, 87, 54–65. [Google Scholar] [CrossRef]
  31. Li, Z.; Liu, C.; Chen, X. Power of Digital Economy to Drive Urban-Rural Integration: Intrinsic Mechanism and Spatial Effect, from Perspective of Multidimensional Integration. Int. J. Environ. Res. Public Health 2022, 19, 15459. [Google Scholar] [CrossRef]
  32. Liu, Y.; Zang, Y.; Yang, Y. China’s rural revitalization and development: Theory, technology and management. J. Geogr. Sci. 2020, 30, 1923–1942. [Google Scholar] [CrossRef]
  33. Lechman, E.; Marszk, A. ICT and socio-economic development dynamics. In ICT-Driven Economic and Financial Development; Academic Press: Cambridge, MA, USA, 2019. [Google Scholar]
  34. Stanley, T.D.; Doucouliagos, H.; Steel, P. Does ICT generate economic growth? A meta-regression analysis. J. Econ. Surv. 2018, 32, 705–726. [Google Scholar] [CrossRef]
  35. Haftu, G. Information communications technology and economic growth in Sub-Saharan Africa: A panel data approach. Telecommun. Pol. 2019, 43, 88–99. [Google Scholar] [CrossRef]
  36. Clark, C. The Conditions of Economic Progress; Macmillan & Co., Ltd.: London, UK, 1940. [Google Scholar]
  37. Zhang, B.S.; Yang, Z.S. Coupling relationship between urban-rural coordinated development and rural poverty governance. Resour. Sci. 2020, 42, 1384–1394. [Google Scholar] [CrossRef]
  38. Zhang, A.T.; Zhou, J.Y.; Zhang, L.; Wang, Q. Measurement, Restrictive Factors and Development Path of Urban-rural Integration Coordinated Development in Yellow River Basin. J. Stat. Inf. 2022, 37, 10. [Google Scholar]
  39. Zhang, L.L.; Liu, X.F.; Chen, Z. Strategic thinking on the development of China’s digital economy. Mod. Manag. Sci. 2018, 3, 88–90. [Google Scholar]
  40. Yan, R.S.; Qian, X.Y. Strategic Analysis on the Digital Transformation of Chinese Telecom Operators in the Era of Digital Economy. China Soft Sci. 2018, 2, 172–182. [Google Scholar]
  41. Pang, J.; Zhu, X.M. The Development Trend of Digital Economy Abroad and the Development Strategy of Digital Economy Countries. Sci. Technol. Prog. Policy 2013, 30, 124–128. [Google Scholar]
  42. Li, Z.M.; Zhou, W.Y.; Tian, Z.T. Digital Trade: Development Trend, Impact and Strategic Countermeasures. Int. Econ. Rev. 2014, 6, 131–144. [Google Scholar]
  43. Liu, J.; Yang, Y.Y.; Zhang, S.F. Research on the Measurement and Driving Factors of China’s Digital Economy. Shanghai J. Econ. 2020, 6, 81–96. [Google Scholar] [CrossRef]
  44. Han, Z.A.; Wu, H.Z.; Zhao, J.F. Coupling Coordination Measurement and Evaluation of Digital Economy and High-quality Development. J. Stat. Inf. 2022, 37, 22–34. [Google Scholar]
  45. Zhao, J.J.; Liu, Y.; Zhu, Y.K.; Qin, S.L.; Wang, Y.H.; Miao, C.H. Spatiotemporal differentiation and influencing factors of the coupling and coordinated development of new urbanization and ecological environment in the Yellow River Basin. Resour. Sci. 2020, 42, 159–171. [Google Scholar] [CrossRef]
  46. Li, C.Y.; Zhang, S.Q. Chinese provincial water-energy-food coupling coordination degree and influencing factors research. China Popul. Resour. Environ. 2020, 30, 120–128. [Google Scholar]
Figure 1. Internal mechanisms of the coupled and coordinated relationships between the digital economy and urban–rural integration.
Sustainability 15 07299 g001
Figure 2. Heat map of the results of the coupling-coordination degree between the digital economy and urban–rural integration.
Sustainability 15 07299 g002aSustainability 15 07299 g002b
Figure 3. The real and fitting value of the subsystem development index. (A year with * means that the curve represents the predicted value in that year).
Sustainability 15 07299 g003
Figure 4. The evolution speed of the subsystem development index. (A year with * means that the curve represents the predicted value in that year).
Sustainability 15 07299 g004
Table 1. Indicator system of urban–rural integration development index.
Target LayerElement LayerIndicator LayerUrban SubindicatorRural SubindicatorWeights
Urban–rural integration index XEquitable distributionCoordination of
Income X1
Disposable income of urban households pc 1  x 11 Disposable income of rural households pc x 12 0.1506
Coordination of Consumption X2Consumption expenditure of urban households pc x 21 Consumption expenditure of rural households pc x 22 0.1604
Balanced growthCoordination of Growth X3Nonagricultural output value pc x 31 Agricultural output value pc x 32 0.1116
Coordination of Investment X4Urban fixed capital investment pc x 41 Rural fixed capital investment pc x 42 0.1640
Coordination of Market X5Price index of urban consumer goods x 51 Price index of rural consumer goods x 52 0.1657
Equalization of public serviceCoordination of Employment X6Proportion of urban employed population x 61 Proportion of rural employed population x 62 0.0712
Coordination of Educational X7Average years of education 2 of urban population x 71 Average years of education of rural population x 72 0.0979
Coordination of Medical X8Number of beds in medical institutions per 10,000 urban residents x 81 Number of beds in medical institutions per 10,000 rural residents x 82 0.0786
1 pc means per capita. 2 Average years of education = ( P p r i m a r y   s c h o o l × 6 + P m i d d l e   s c h o o l × 9 + P h i g h   s c h o o l × 12 + P c o l l e g e   a n d   a b o v e l × 16)/( P p r i m a r y   s c h o o l + P m i d d l e   s c h o o l + P h i g h   s c h o o l + P c o l l e g e   a n d   a b o v e ), and P represents the educated population at each level.
Table 2. Indicator system of digital economy development index.
Target LayerElement LayerIndicator LayerSubindicator LayerWeights
Digital economy development index Y Informatization constructionInfrastructure of informatizationCable density y 1 0.0556
Density of mobile phone base stations y 2 0.0556
Proportion of informatization practitioners y 3 0.0556
Impacts of informatizationTotal Telecom Business y 4 0.0834
Software Business Revenue y 5 0.0834
Popularization of InternetInfrastructure of fixed terminalsDensity of internet access ports y 6 0.0834
Infrastructure of mobile terminalsPopularization rate of mobile phones y 7 0.0834
Impact of fixed terminalsProportion of broadband-internet users y 8 0.0834
Impact of mobile terminalsProportion of mobile-internet users y 9 0.0834
Development of digital industriesInfrastructure of digital industriesProportion of enterprise websites y 10 0.0556
Proportion of computers used by enterprises y 11 0.0556
Proportion of e-commerce y 12 0.0556
Impact of digital industriesE-commerce sales y 13 0.0834
Online retail sales y 14 0.0834
Table 3. Criteria for coupling-coordination degree grades division.
Range of Coupling-Coordination Degree DCoupling-Coordination StagesCoupling-Coordination Degree
(0.0~0.1)Low-level coupling stageExtremely imbalanced
[0.1~0.2)Severely imbalanced
[0.2~0.3)Moderately imbalanced
[0.3~0.4)Antagonism stageLightly imbalanced
[0.4~0.5)Almost imbalanced
[0.5~0.6)Run-in stageBarely balanced
[0.6~0.7)Low-level balanced
[0.7~0.8)High-level coupling stageModerately balanced
[0.8~0.9)Well balanced
[0.9~1.0)Superiorly balanced
Table 4. Digital economy and urban–rural integration subsystem development index.
RegionProvince20132014201520162017201820192020
NEHL0.081/0.1670.112/0.1580.134/0.1440.146/0.1340.183/0.1370.197/0.1360.236/0.1430.275/0.161
NEJL0.097/0.2070.115/0.1990.138/0.1760.148/0.1630.161/0.1630.205/0.160.215/0.1750.23/0.208
NELN0.135/0.1560.174/0.1590.215/0.1970.223/0.2080.252/0.2220.267/0.2190.307/0.2180.329/0.228
EFJ0.142/0.1710.172/0.170.209/0.1750.224/0.1560.246/0.1470.274/0.1310.302/0.1410.321/0.152
EGD0.295/0.1850.35/0.1830.434/0.1960.471/0.1740.553/0.1780.661/0.1950.78/0.1960.878/0.203
EHI0.167/0.1710.223/0.170.254/0.180.283/0.1770.282/0.1910.28/0.2050.293/0.1970.292/0.202
EHE0.091/0.2350.119/0.270.15/0.2830.162/0.2680.182/0.2610.222/0.2490.271/0.2420.303/0.244
EJS0.277/0.2540.304/0.2560.359/0.2710.38/0.2610.418/0.2620.477/0.2570.554/0.260.616/0.266
ESD0.143/0.2150.181/0.2150.221/0.2230.262/0.2150.292/0.2150.373/0.2320.419/0.2530.459/0.272
EZJ0.225/0.1830.256/0.1790.315/0.1920.352/0.1950.387/0.1980.442/0.210.529/0.2250.598/0.246
WGS0.088/0.0310.108/0.0670.136/0.0730.169/0.0640.168/0.0680.186/0.0840.211/0.0990.229/0.113
WGX0.092/0.170.101/0.1650.088/0.180.102/0.1760.115/0.1790.158/0.1860.205/0.2040.253/0.222
WGZ0.089/0.1830.111/0.1990.139/0.1930.175/0.1690.181/0.1640.2/0.1790.241/0.1930.271/0.208
WIM0.098/0.2210.122/0.2160.149/0.230.175/0.2240.201/0.2140.211/0.1920.241/0.1870.274/0.191
WNX0.101/0.1210.132/0.1060.165/0.1120.182/0.10.183/0.10.193/0.1320.197/0.150.219/0.164
WQH0.114/0.1660.142/0.170.181/0.1740.211/0.1640.212/0.1650.235/0.1450.256/0.1490.289/0.15
WSN0.133/0.1460.174/0.1560.209/0.1720.241/0.1770.265/0.1940.3/0.1760.353/0.1750.383/0.173
WSC0.151/0.190.191/0.20.241/0.2050.273/0.2060.292/0.2660.327/0.2590.389/0.2510.445/0.247
WYN0.109/0.1190.135/0.1210.169/0.1240.188/0.1170.202/0.1180.219/0.1140.272/0.1260.309/0.139
CAH0.118/0.1050.159/0.1080.198/0.1240.21/0.1170.232/0.1210.262/0.150.314/0.1460.331/0.15
CHA0.073/0.2540.096/0.2530.119/0.2550.129/0.2460.145/0.2410.193/0.250.234/0.2190.28/0.199
CHB0.114/0.2250.15/0.2190.19/0.2210.219/0.2360.24/0.2320.274/0.2510.327/0.2410.356/0.249
CHN0.099/0.2330.135/0.2310.159/0.2370.176/0.240.183/0.2340.219/0.2150.253/0.2250.296/0.244
CJX0.096/0.2250.123/0.2250.152/0.2140.136/0.1870.173/0.1780.195/0.1730.226/0.1710.261/0.181
CSX0.08/0.1790.108/0.1770.131/0.1770.152/0.1640.149/0.1710.168/0.1990.191/0.2270.206/0.271
N 1Avg. 20.128/0.180.16/0.1830.194/0.1890.216/0.1820.236/0.1850.27/0.1880.313/0.1930.348/0.203
1 N means national. 2 Avg. means average.
Table 5. Coupling and coordination about digital economy and urban–rural integration.
RegionProvince20132014201520162017201820192020Increase
NEHL0.3210.4130.4410.4490.4960.5090.5520.60387.85%
NEJL0.4060.4490.4760.480.4980.5440.5680.61250.74%
NELN0.4540.510.5880.6060.6440.6540.6830.70755.73%
EFJ0.4780.5180.5620.5570.5650.5650.5960.62230.13%
EGD0.6430.6760.7360.7270.7670.8280.8680.90540.75%
EHI0.5130.5710.6070.6260.6390.6510.6530.65728.07%
EHE0.40.4990.5660.5760.5990.6370.6760.70275.50%
EJS0.690.7130.7620.7680.7910.8170.8560.88728.55%
ESD0.5130.5660.6160.6460.6690.7380.7830.82160.04%
EZJ0.5850.6080.6630.690.7130.7550.8110.86147.18%
WGS0.130.2980.350.3640.3730.4230.470.506289.23%
WGX0.3670.3910.3590.4020.4350.5140.5840.64475.48%
WGZ0.3650.440.490.520.5230.5570.6090.64777.26%
WIM0.4170.4750.5320.5650.5880.580.6030.63351.80%
WNX0.3550.3960.4460.4460.4470.5010.5250.56158.03%
WQH0.4230.4770.5320.5530.5550.5540.5750.59941.61%
WSN0.4410.5070.560.5930.6290.6370.6690.68354.88%
WSC0.5070.5660.620.6470.7110.7310.7650.79256.21%
WYN0.3710.4190.4660.4770.4910.50.5560.59861.19%
CAH0.3730.4340.4950.4970.520.580.610.62667.83%
CHA0.3060.4270.4910.5070.5330.6060.6250.646111.11%
CHB0.4630.5270.5810.6240.6410.6850.7170.74360.48%
CHN0.4270.5090.5520.5780.5820.6080.6470.69763.23%
CJX0.4130.4820.5260.4810.5260.5460.5740.61448.67%
CSX0.3230.4180.4650.4860.4880.5370.5870.63596.59%
N 1Avg.20.4270.4920.5390.5550.5770.610.6460.6859.25%
1 N means national. 2 Avg. means average.
Table 6. The results of GWR regression.
VariablesCoupling Coordination
Informatization construction0.319 *
(0.179)
Popularization of Internet0.597 ***
(0.211)
Development of digital industries1.882 ***
(0.149)
Equitable distribution−2.155 ***
(0.180)
Balanced growth1.408 ***
(0.0548)
Equalization of public service−0.876 ***
(0.141)
Constant−18.73
(22.98)
Observations200
Standard errors in parentheses. *** p < 0.01, * p < 0.1.
Disclaimer/Publisher’s Note: The statements, opinions and data contained in all publications are solely those of the individual author(s) and contributor(s) and not of MDPI and/or the editor(s). MDPI and/or the editor(s) disclaim responsibility for any injury to people or property resulting from any ideas, methods, instructions or products referred to in the content.

